Article

Electrochemical and Surface Characterisation of Carbon Steel Exposed to Mixed Ce and Iodide Electrolytes

by
Mohammed A. El-Hashemy
1,2,
Christopher D. Easton
3,
Aaron Seeber
3,
Ivan S. Cole
4 and
Anthony E. Hughes
5,6,*
1
Chemistry Department, College of Science, Jouf University, Sakaka P.O. Box 2014, Saudi Arabi
2
Air Pollution Research Department, Environmental and Climate Change Research Institute, National Research Centre, Giza 12622, Egypt
3
CSIRO Manufacturing, Clayton 3168, Australia
4
School of Engineering, RMIT University, Carlton 3053, Australia
5
Institute for Frontier Materials, Deakin University, Waurn Ponds, Geelong 3216, Australia
6
CSIRO Mineral Resources, Cayton 3168, Australia
*
Author to whom correspondence should be addressed.
Metals 2023, 13(9), 1553; https://doi.org/10.3390/met13091553
Submission received: 19 July 2023 / Revised: 21 August 2023 / Accepted: 30 August 2023 / Published: 3 September 2023
(This article belongs to the Topic Green Corrosion Inhibitors for Metallic Materials)

Abstract

:
The protection of ferrous metals in acidic environments is important in many industries. Extending the pH range of organic inhibitors to low pH has been achieved with the addition of iodide ions, which facilitate adsorption. It was of interest to see whether similar outcomes could be achieved with inorganic inhibitors. To this end, this paper examines the influence of potassium iodide addition on the level of corrosion protection provided by Ce(NO3)3 in 3.5% NaCl electrolytes over a pH range of 2.5 to 8. Potentiodynamic polarization was used to assess percentage inhibitor efficiency (IE%), and scanning electron microscopy, energy dispersive X-ray spectrometry, and X-ray photoelectron spectroscopy were used to characterize the corrosion product. It was found that KI alone provided only poor corrosion inhibition except at pH 2.5, where nearly 85IE% was achieved. Its addition to the cerium electrolytes was generally in excess of 90% and over 97% for the optimum concentration. The addition of KI seemed to change the mechanism of formation of corrosion products from predominantly Fe2O3 to a mixture of FeOOH, Fe3O4, and Fe2O3, which were more adherent. Corrosion protection was extended to pH 4, but under the conditions explored here, no additional protection was evident at pH 2.5.

1. Introduction

In recent decades, there has been a strident interest in finding new inhibitors for corrosion prevention [1,2,3,4,5]. This search has been driven by a desire to find more environmentally friendly inhibitors to replace chemicals that represent environmental and health risks [6,7,8,9,10]. In this context, the authors recently reported on the combined effects of Ce and iodide ions for corrosion protection of aluminium alloy 2024-T3 and found a synergistic reaction between the two in acidic environments [11]. The choice of these two elements was based on the well-known protective properties of cerium compounds for aluminium alloys [12,13] and the enhancement effect of iodide ions on organic corrosion inhibitors for both Fe and Al alloys, particularly at low pH [14,15,16,17,18,19,20,21]. Protection at low pH involved a combination of two mechanisms: (i) the formation of insoluble Cu-iodides, particularly at inclusions (in this case Cu-containing intermetallic particles); and (ii) the adsorption of iodide ions onto the surface of hydrated oxide in competition with chloride ions. Thus, these results showed that the synergistic effects demonstrated by iodide ions on organic inhibitors could be extended to inorganic inhibitors.
In the current paper, the authors examine whether these inhibition qualities are observed in the case of iron. Clearly, the mechanism of protection will be different with a ferrous metal. First, the formation of insoluble Cu-iodides will not play a role since Cu is not a major alloying component of mild steel. However, the adsorption of iodide ions in competition with chloride ions can still play a significant role in mitigating corrosion. Second, the presence of adsorbed iodide ions may facilitate the adsorption of cerium ions, thereby improving corrosion resistance. For ferrous metals and inorganic ions, iodide is reported to facilitate the formation of γ-Fe2O3 in NaNO2 solutions [22]. It is widely reported that La ions provide better protection than cerium ions [4,23,24], which is attributed by Yasakau et al. as being due to differences in the protective properties of La and Ce hydroxides that form on the surface [24], although complexing may change this order [25]. Cerium nitrate has been investigated as an inhibitor of ferrous metal corrosion [26,27,28]. It was found that approximately 3 × 10⁻³ M of Ce(NO3)3 resulted in the maximum effect, producing a protective coating consisting of lepidocrocite and Ce(III) compounds consisting of mixed hydroxides and carbonates.
In our previous paper, it was proposed that cerium ions can adsorb onto “capping” iodide ions to form a 2D protective layer. The capping iodide ions are absorbed in preference to chloride ions, as reported in a number of studies [14,17,20,22,29,30]. To some extent, the further absorption of cerium ions onto the capping iodide ions will be independent of the substrate metal. To investigate this hypothesis further, potentiodynamic polarization studies supported by weight loss studies, X-ray diffraction (XRD), X-ray photoelectron spectroscopy (XPS), scanning electron microscopy (SEM)/energy dispersive X-ray spectrometry (EDS) were performed on mild steel samples exposed to 3.5 wt% NaCl electrolytes containing either potassium iodide, cerium nitrate, or a mixture of the two. It should be noted that the presence of nitrate ions in solution may play an active role in corrosion activation or protection since nitrate itself and its reduction products such as nitrite may also play a role [22,31,32]. Indeed, the reactions of nitrate with iron are widely researched [33] for the purposes of nitrate reduction in agricultural runoff [34]. In the corrosion field on carbon steels, much of the work with nitrates/nitrites is focused on concrete reinforcement in calciferous neutral-alkaline media where nitrite is considered a good inhibitor [31,35,36].

2. Materials and Methods

2.1. Materials and Chemicals

Mild steel with a nominal composition of 0.05 to 2.1% C, <1.65 Mn, <0.6% Si, 0.4 to 0.6% Cu, and up to 0.33% S was used in this study. All chemicals used were of analytical-grade quality. Cerium (III) nitrate hexahydrate (Ce(NO3)3·6H2O, (99%)), potassium iodide, KI, (99.5%), and sodium chloride, NaCl, (99%) were obtained from Sigma–Aldrich. Electrolytes used in this study were prepared with (≤10 Ω·cm) deionized (DI) water. Solutions were prepared with different pH values (2.5, 4, 7, and 8) by adjustment with hydrochloric acid and sodium hydroxide solutions.
As noted previously, adjustment at higher pH (pH 7 and 8) resulted in a small decrease in the level of Ce present at pH 7 and a larger decrease at pH 8. The decrease in dispersed cerium was accompanied by precipitate formation, which was identified as cerium carbonates and hydroxides based on Raman spectra [11]. Because nitrate was not observed in the precipitate but Ce was, the cerium/ NO3 ratio changed with pH adjustment. The effect is small at pH 7, but at pH 8 and at the highest nominal concentration of cerium, the NO3 to cerium ratio in solution is almost double the make-up ratio.
For SEM and XPS, samples were ground on SiC papers from 240, 600, 800, and 1200, then polished using diamond abrasives from 6 to 3 to 1 µm to produce a mirror finish. The samples were then exposed to various electrolytes for a period of 24 h, this time being similar to the experimental time for the potentiodynamic polarization experiments. Upon removal, they were rinsed with distilled water and dried under ambient conditions. Sample surfaces had a mixture of appearances ranging from dull metallic (compared to the polished condition) where corrosion product was removed to regions where the corrosion product was retained, where samples showed some level of ochre to red-brown corrosion product. These were in patches for the higher pHs, but there was complete coverage for samples exposed to the lowest pH solutions. For the samples exposed to electrolytes containing only Ce ions, there was evidence of pitting at pH 7 and pH 8.

2.2. Immersion Experiments

The carbon steel sheet was cut into coupons of 2 cm × 2 cm. The emery paper used to polish these coupons ranged in grade from 600 to 1000. These MS coupons were cleaned in an ultrasonic water bath before being acetone-degreased. MS coupons were initially weighed using an analytical balance with four decimal digits.
Then, at various times, these coupons were fully immersed in a 100 mL beaker containing 3.5% NaCl solutions without and with the addition of Ce(NO3)3 and KI. They were dried and weighed once again. To validate the correctness of the findings, experiments were repeated, and the average amount of weight reduction was noted.
The surface coverage and inhibition efficiency (IE%) were calculated using the following equations:
θ = W t b W t i n h W t b
I E % = W t b W t i n h W t b × 100
where Wtinh and W t b are weight loss in the presence of additives and in their absence, respectively.

2.3. Electrochemical Polarization Measurements

Electrochemical measurements were performed using a conventional three-electrode cylindrical perspex cell containing 200 mL of electrolyte. Titanium mesh was used as a counter electrode and a saturated calomel electrode (SCE) as the reference electrode. All experiments were performed at room temperature. The cleaned specimens were fixed in the electrochemical cell with an exposed area of 3.14 cm2. Polarization studies were performed under computer control using a Solartron model 1280B potentiostat at a scan rate of 0.25 mV/s. Corrview software was used for analyzing the experimental data. Before recording the polarization curves, the working electrode was maintained at its corrosion potential for 30 min until a steady state was obtained.
The inhibition efficiency (IE%) was calculated using the following equation:
I E % = I 2 I 1 I 2 × 100
where I1 and I2 are the corrosion current densities of carbon steel in the presence and absence of inhibitors, respectively. The presence of any synergism between Ce(III) and iodide ions was determined using the synergism parameter, S, which was calculated using:
S = 1 θ 1 + 2 1 θ 1 + 2
where θ1+2 = (θ1 + θ2) − (θ1 × θ2); θ1 is the surface coverage of the iodide ions alone, θ2 is the surface coverage of Ce(III) ions alone, and θ 1 + 2   is the measured surface coverage for Ce(III) ions in combination with the iodide ions.

2.4. X-ray Diffraction (XRD)

A Bruker D8 Advance A25 X-ray Diffractometer (Bruker, MA, USA) operating under CuKα radiation (40 kV, 40 mA) equipped with a Lynx Eye XE-T detector was employed to obtain the X-ray diffractograms from these samples. The samples were scanned over the 2θ of range 5° to 130° with a step size of 0.02° and a count time of 1.6 s per step. They were spun at 15 RPM during data collection. Analysis was performed on the collected XRD data using the Bruker XRD search match program EVA™6 (Bruker, MA, USA). Crystalline phases were identified using the ICDD-JCPDS powder diffraction database.

2.5. X-ray Photoelectron Spectroscopy (XPS)

X-ray photoelectron spectroscopy (XPS) measurements were made using a Kratos AXIS Ultra-DLD spectrometer (Kratos, Manchester, UK) with a monochromated Al Kα source (1486.6 eV). Binding energies were referred to as C 1s, with a binding energy of 284.8 eV. The presence or absence of Ce(IV) in the samples was determined using the v”’ peak as described previously and depicted in Figure 1 [37]. Additionally, account was taken of the Fe Auger peaks, which occur between the 3d 5/2 and 3d 3/2 peaks (Figure 1a). The Fe 2p spectra were analyzed using curve fitting, taking into account Fe metal, oxides, and carbonate (Fe(CO3)3). In the case of the oxides, account was taken of all multiplets for Fe2O3, Fe3O4, and FeOOH as described by Biesinger et al. [38] as well as satellite peaks. Multiplet separation and relative intensities were fixed with respect to each other (Figure 1b). While the presence of all these multiplet peaks looks complicated, the analysis effectively only involves optimization of four peaks since the multiplets relative position and intensity are fixed against the first peak occurring in the series. The data presented later in the paper combines all multiplets, thus showing only a single peak for each iron oxide/hydroxide. Shirley backgrounds were used in all XPS analyses. In the case where significant levels of cerium were detected on the surface, a Ce-Auger component was fitted to the Fe 2p3/2 spectrum along with the other components at 716.5 to 717.5 eV. The half width of this peak was wide and encroached into the upper end of the multiplet structures of the Fe components.

2.6. Scanning Electron Microscopy

An FEI Quanta 400 (FEI, Hillboro, OR, USA) field emission environmental SEM was employed for the examination of the samples studied using XPS. Images, spectra, and maps were collected at a 15 kV accelerating voltage and a probe current of approximately 0.7 nA. Samples were mounted using either carbon bags or conducting carbon tape. No metal or carbon layers were deposited on the samples to reduce charging. This approach was adopted to facilitate the identification of carbonates in the surface layer. The carbonates were inferred where the C Kα signal increased significantly in intensity. Maps were typically collected for 17 h. Compositions were determined using standardless energy dispersive X-ray analysis using the ESPIRIT software (Bruker, MA, USA). For scatter plot analysis, hyperspectral map datafiles (Bruker “.bcf”) generated using ESPIRIT were exported to an “.epmx” format and analyzed using Chimage software (CSIRO, Canberra, Australia).

3. Results

The approach adopted here was first to optimize the cerium concentration and then to examine the influence of the addition of iodide ions.

3.1. Inhibition as a Function of Cerium Concentration

Figure 2 shows PDP curves for mild steel in 3.5% NaCl without and with various additions of Ce(NO3)3. The corresponding parameters from the Tafel fitting of the curves are presented in Table 1. From Figure 2, it can be seen that the addition of Ce(NO3)3 to solution results in a reduction of cathodic current densities and the movement of Ecorr to more negative values, resulting in a separation between Ecorr and the pitting potential (Epit). The changes in the cathodic arm may be due to a combination of reactions, including the reduction of oxygen, water, and the waters of hydration. Nitrate (or a reduction product such as nitrite) might be contributing to the changes in the cathodic arm. In nitrate solutions, Ecorr has been reported to move to lower potentials, but the opposite is observed for nitrite [40]. These results are similar to previously reported results for carbon steel exposed to cerium chloride-based nitrate solutions [27,28,32], although the opposite has also been observed [41]. There is movement in both the anodic and cathodic arms, with Ecorr generally decreasing. Dastgheib et al. [26] observed that Ecorr moved to more negative values as the levels of Ce(NO3)3 increased and that the kinetics of the cathodic arm went through a minimum.
Table 1 shows that icorr decreases with increasing Ce(NO3)3 concentration up to 7 × 10⁻³ moles, above which it again increases. This is reflected in the PDP curve for 7 × 10⁻³ moles of Ce(NO3)3 which displays the lowest current density around Ecorr of all the curves. The Ecorr values themselves displayed a range of potentials, but all of these were lower than in NaCl alone, indicating some level of corrosion inhibition, as demonstrated in the column for IE% and also presented in Figure 3.
The Ce(NO3)3 concentration of around 7 × 10⁻³ moles is nearly two orders of magnitude higher than the optimum reported for AA2024-T3, reflecting the differences between the two different metals [11]. The suppression of corrosion in aluminum alloys varies from one alloy to another but is generally marginally better than for steels above a minimum lathanide ion concentration [42]. This concentration is around twice that observed by [26]. The decrease in IE% at the highest Ce ion concentration has been attributed in the case of CeCl3 to the reduction of waters of hydration which has become an important reaction [43].

3.2. Inhibition of Ce, and Ce+I-Electrolytes as a Function of pH

In this section, the corrosion inhibition of the optimum Ce(NO3)3 concentration of 7 × 10⁻³ moles is investigated as a function of pH between 2.5 and 8.0 (Table 2). In addition, data for 1 × 10⁻³ M is included as a double check on whether the optimum Ce concentration found at neutral pH is still valid across the pH range. For the pH 4, 7, and 8 ranges, the PDP curves in Figure 4 show that the introduction of Ce(NO3)3 to 3.5% NaCl largely causes changes to the cathodic arms. The nature of the changes is different for the two different concentrations of Ce ions. Specifically, the addition of 7 × 10⁻³ M Ce(NO3)3 tends to activate the cathodic arm at lower potentials, whereas at 1 × 10⁻³ M Ce(NO3)3, there is also some activation at the lowest potentials but some suppression of activity at potentials immediately below the OCP. The changes in the cathodic arm are likely related to the reduction of a number of species and their relative concentrations, e.g., oxygen, nitrate, possibly nitrite (from reduction of nitrate), waters of hydration for the cerium aquo-ion [44], and even Ce(NO3)2+, which will become more common at higher concentrations [45].There is little difference between the cathodic arms of the PDP curves for the two concentrations at pH 2.5, but the IE% is considerably higher in the presence of 7 × 10⁻³ M Ce(NO3)3. However, it can be seen that the IE% is greatest where 7 × 10⁻³ M Ce(NO3)3 is present in solution at pH 4 and 7, and similar at pH 8. There is suppression on the anodic arm at all pHs for 7 × 10⁻³ M Ce(NO3)3, but a small level of activation at 1 × 10⁻³ M Ce(NO3)3. The suppression at higher concentrations may be due to the presence of nitrate ions in solution. At pH 8, there are two conditions in the solution that have changed, including the nitrate/cerium ratio, which has increased to near 6, and the fact that and the solution is more alkaline.
The addition of 0.1 M iodide and Ce ions to 3.5% NaCl is examined in Figure 5 as a function of pH, which summarizes the IE% for various Ce-electrolytes as a function of pH from analyses of the PDP curves. The IE% for the 0.1 M KI electrolyte, labeled as the I-electrolyte here, is also presented in Figure 5 as well as in Table 3 and Table 4 At pH 2.5, no inhibition is provided by the addition of 1.0 × 10⁻³ M Ce or any of the mixed electrolytes. Indeed, the mixed electrolytes display only antagonism compared to either 7.0 × 10⁻³ M Ce or the I-electrolyte alone. At pH 4 and above, however, all the mixed electrolytes show improved IE% compared to the I-electrolyte and, in some instances, better performance than the Ce-electrolytes alone. As can be seen in Table 4, there is a small degree of synergism displayed in the case where there is 7.0 × 10⁻³ M Ce and 0.1 M I. Interestingly, the I-electrolyte shows a quite good IE% at pH 2.5. This is the pH at which it is expected to act competitively with chloride ions from adsorption sites. However, the addition of 7 × 10⁻³ M increases the inhibition to just under 80%, which is higher than the inhibitor efficiency of up to 60% reported for cerium sulphate [46]. The synergy between I and Ce will be explored in more detail in the SEM section, where the distribution of both ions is examined in more detail. The co-location of these two ions will provide some insight into the co-operative mechanism between them.

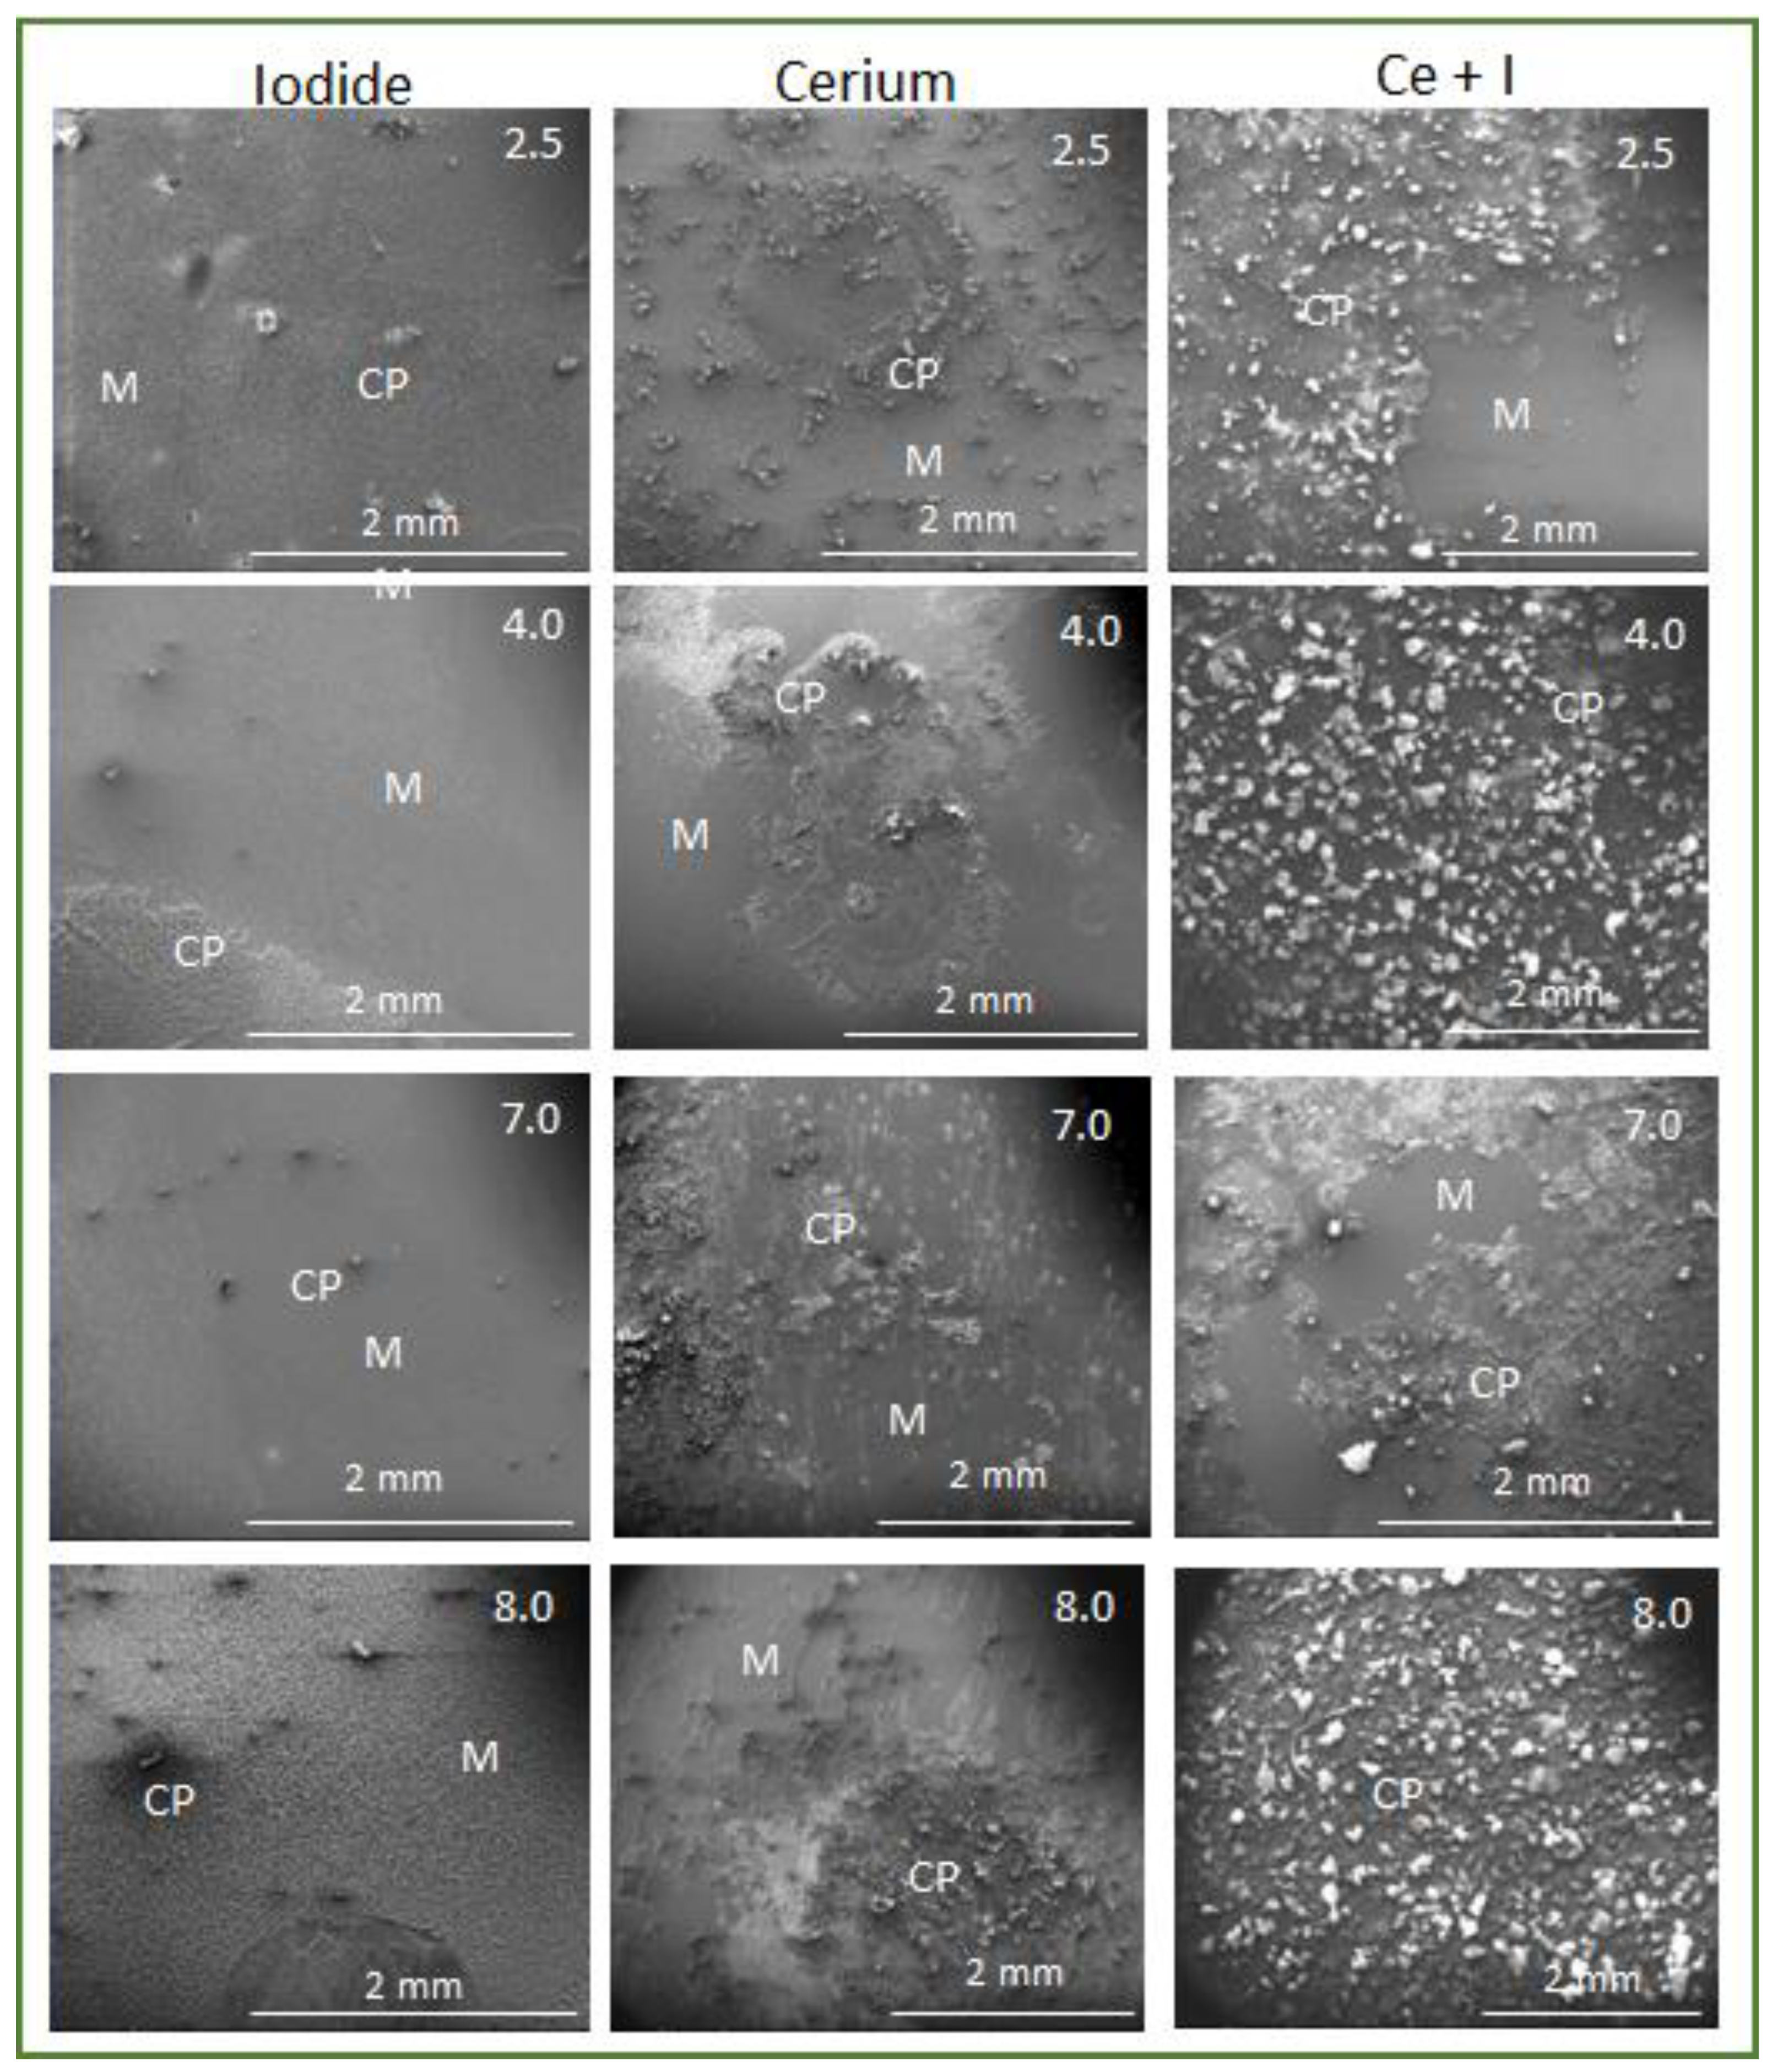
3.3. SEM Characterisation of Surfaces Exposed to Electrolytes as a Function of pH at 24 h

The focus of characterization in this section moves onto examining the optimum Ce+I electrolyte (7 × 10⁻³ M Ce(NO3)3 + 0.1 M KI) plus the individual Ce- (7 × 10⁻³ M Ce(NO3)3) and I-(0.1 M KI) electrolytes of the same compositions. The aim is to characterize the type and distribution of insoluble corrosion products on the surface of mild steel after 24 h exposure to the I, Ce, and Ce+I electrolytes. Here the term “insoluble” is a reference to the fact that soluble deposits on the surface have been removed because of rinsing with DI water.
Figure 6 shows low-magnification SEM images of the surfaces of mild steel after exposure to the various electrolytes at pHs ranging from 2.5 to 8.0. Generally, the corrosion product (CP) that developed on the surface was heterogeneous, with areas of heavy and light CP. The different compositions of electrolytes had their own unique features. After exposure to the I-electrolyte, the CP that developed was only loosely bound to the surface, so a significant fraction was removed during rinsing. The CP left after exposure to the I-electrolyte alone comprised mostly spherical particles with needle-like crystal growth, as seen in Figure 7a. In cases where there was a large amount of CP remaining on the surface, as seen in Figure 6, then it was composed of these types of particles. There were also areas with locally heavier deposits, reflecting local attacks.
The CP on the surfaces of samples exposed to the Ce-electrolyte was generally more adherent, but as with the I-electrolyte, there were areas of heavy and light deposits. Where CP remained on the surface, there were examples of particles embedded into a solidified gel on the surface as well as free particles (Figure 7b,c, respectively). In both cases, the presence of spherical particles suggests that they form around nuclei in solution, so the surface would not have an influence on their shape (i.e., make them non-spherical). With the embedded particles, it is proposed that they form within a gel layer on the surface but without influence from the surface, which would explain their spherical shape. It is assumed that as the gel dries, these particles become trapped in the resulting solidified material. The bond between the two does not appear to be strong, as disbondment can be observed between the two in many instances (e.g., Figure 7h). The spherical particles themselves seemed to form two classes, with one type being needle-like and the other having a flaky appearance. This appearance is consistent with the morphology of α-FeOOH and γ-FeOOH based on the needle-like and platelet structures, respectively [41,47]. There is a considerable difference in the sizes of the two features, with the solid particles formed in the gel typically being a few microns, whereas those formed in the solution are much finer. In addition, there was significant filiform corrosion at all pH values with exposure to the Ce-electrolyte. SEM examination of these features suggests that the filiform grew along the surface of the metal beneath a surface layer, which may well be the same gel in which the larger precipitates were formed. The structure within these filliforms showed domains of a regular lamellar structure, such as seen in Figure 7h, which form the filament tail. These lamellar are again typical of iron hydro-oxides and potentially green rusts since the environment within the filiform is likely to be anaerobic and the pH in the tail is likely to be alkaline [47,48,49]. Thus, there is a broad range of surface features with different appearances, presumably due to the local environment in which they are formed.
For the Ce+I electrolyte, the CP seemed heavier and more adherent than for either of the other two electrolytes. There were far fewer filiforms, which were replaced by more extensive coverage of the surface with other types of corrosion products. The number of different types of features was larger than for either the I or the Ce electrolytes and seemed to combine all the features of the individual solutions. Thus, there were a range of particles, including flaky particles emanating from the solidified gel (Figure 7d), solid particles embedded into a solidified gel (Figure 7e), free solid particles (Figure 7f), as well as small spherical particles with a polycrystalline needle-like structure (only observed at pH 2.5). A third type of growth, very similar to the structure observed in the filiforms (Figure 7i), was observed extensively across the surface and classified as surface growth (Figure 7i). Given that EDS analyses (see table in Appendix A.2) indicate a predominance of Fe and O with smaller amounts of other elements, it is suggested that this growth is a form of Fe-hydro-oxide. Since its appearance is similar to that in the filiforms, it is possible that it might be green rust, but its presence is unlikely because anaerobic conditions would be required for its formation and that it rapidly oxidized to either Fe2O3, α-FeOOH, or γ-FeOOH [47,48]. Examples of the typical compositions of these features are provided in Table A1.
As noted above, the distribution of corrosion product on the surface of the samples was very heterogeneous, but some common features were observed and highlighted in Figure 7. For example, the central part of Figure 8 shows an SEM image of corrosion product after exposure to Ce+I electrolyte at pH 4 for 24 h. Some of the types of features depicted and described in Figure 7 are highlighted in the side images in Figure 8. The regions in pink have low but significant levels of I and less Cl, whereas those in mauve have a greater mixture of both ions based on the color mix. Indeed, those in pink were most often observed where much of the corrosion product had broken away and the Fe content was much higher, indicating a thin oxide. This suggests that iodide ions are interacting more with the surface of the mild steel than chloride ions. (This was also observed using XPS; see Section 3.5). The pastel yellow color is where there are higher levels of cerium. These types of sites are a mixture of claypan structures with/without precipitates on them. Importantly, many of the features identified in Figure 7 and highlighted in Figure 8 show a similar mauve color. This suggests that they may have similar compositions, and it may not be possible to uniquely identify them on the basis of composition alone.
Scatter plots were used to further explore whether these features had unique compositions. The scatter plots were constructed using the intensity of one element plotted against the intensity of another element (e.g., Fe to O). In this way, all points on a map are examined, and those with a common ratio (e.g., Fe/O) form a cluster in the scatter plot. An example is shown in Figure 9. The spectra for the regions labeled 1 to 6 in the map in Figure 8 are presented in Figure 9a. C, O, Fe, Cl, I, and Ce were detected in this series of spectra, and the positions of the main lines for each elemental X-ray series are presented in the figure. (Note: there are sum peaks detected in all spectra at some level.) The corresponding Fe-O, Ce-O, and Fe-Ce scatter plots for all pixels in the map are presented in Figure 9b using a “magma” color scale to indicate the density of points (orange and yellow are high density, and purple is low density). To the right of these whole-map scatter plots are scatter plots in grayscale (representing all the sample) with an overlay of blue points representing only the pixels that contribute to each of spectra 1 → 6 (each point represents the elemental ratio in an individual pixel enclosed by the white dashed circles in Figure 8). Looking at the Fe-O scatter plot for each, it is immediately clear that all spectra share largely common positions. On the Ce-O scatter plot, spectra from areas 1, 2, and 6 have more points that are Ce-rich, but there are other points that also overlap with the other spectra that are Ce-poor. A similar situation exists for the Fe-Ce scatter plot, where all spectra occupy a similar space in the scatter plot, but the cerium-rich ones (1, 2, and 6) also extend along the Ce arm consistent with their higher cerium levels.
On the basis of these analyses, it can be concluded that it is not possible to definitively separate out, at a statistically significant level, these different features based on composition alone. This is not surprising given that the O/Fe ratios of Fe2O3, Fe3O4, FeOOH, and [Fe(II)1−xFe(III)x(OH)2]x (green rust anion) have O/Fe ratios of 1.5, 1.3, 2.0, and potentially >2.0 (if oxygen-containing cations are included), respectively. Given that there will also likely be waters of hydration, any differences in composition will be difficult to pick up using EDS.
On the other hand, for the purposes of interpreting the XPS data, it seems generally that cerium is associated more with larger particulates deposited on the surface of mud-crack structures or embedded into them; iodide is associated with some mud-crack structures as well as at the interface with the underlying metal; and there are “surface growths” that appear to be mainly iron-containing corrosion products such as Fe2O3, and Fe3O4, FeOOH.

3.4. X-ray Diffraction
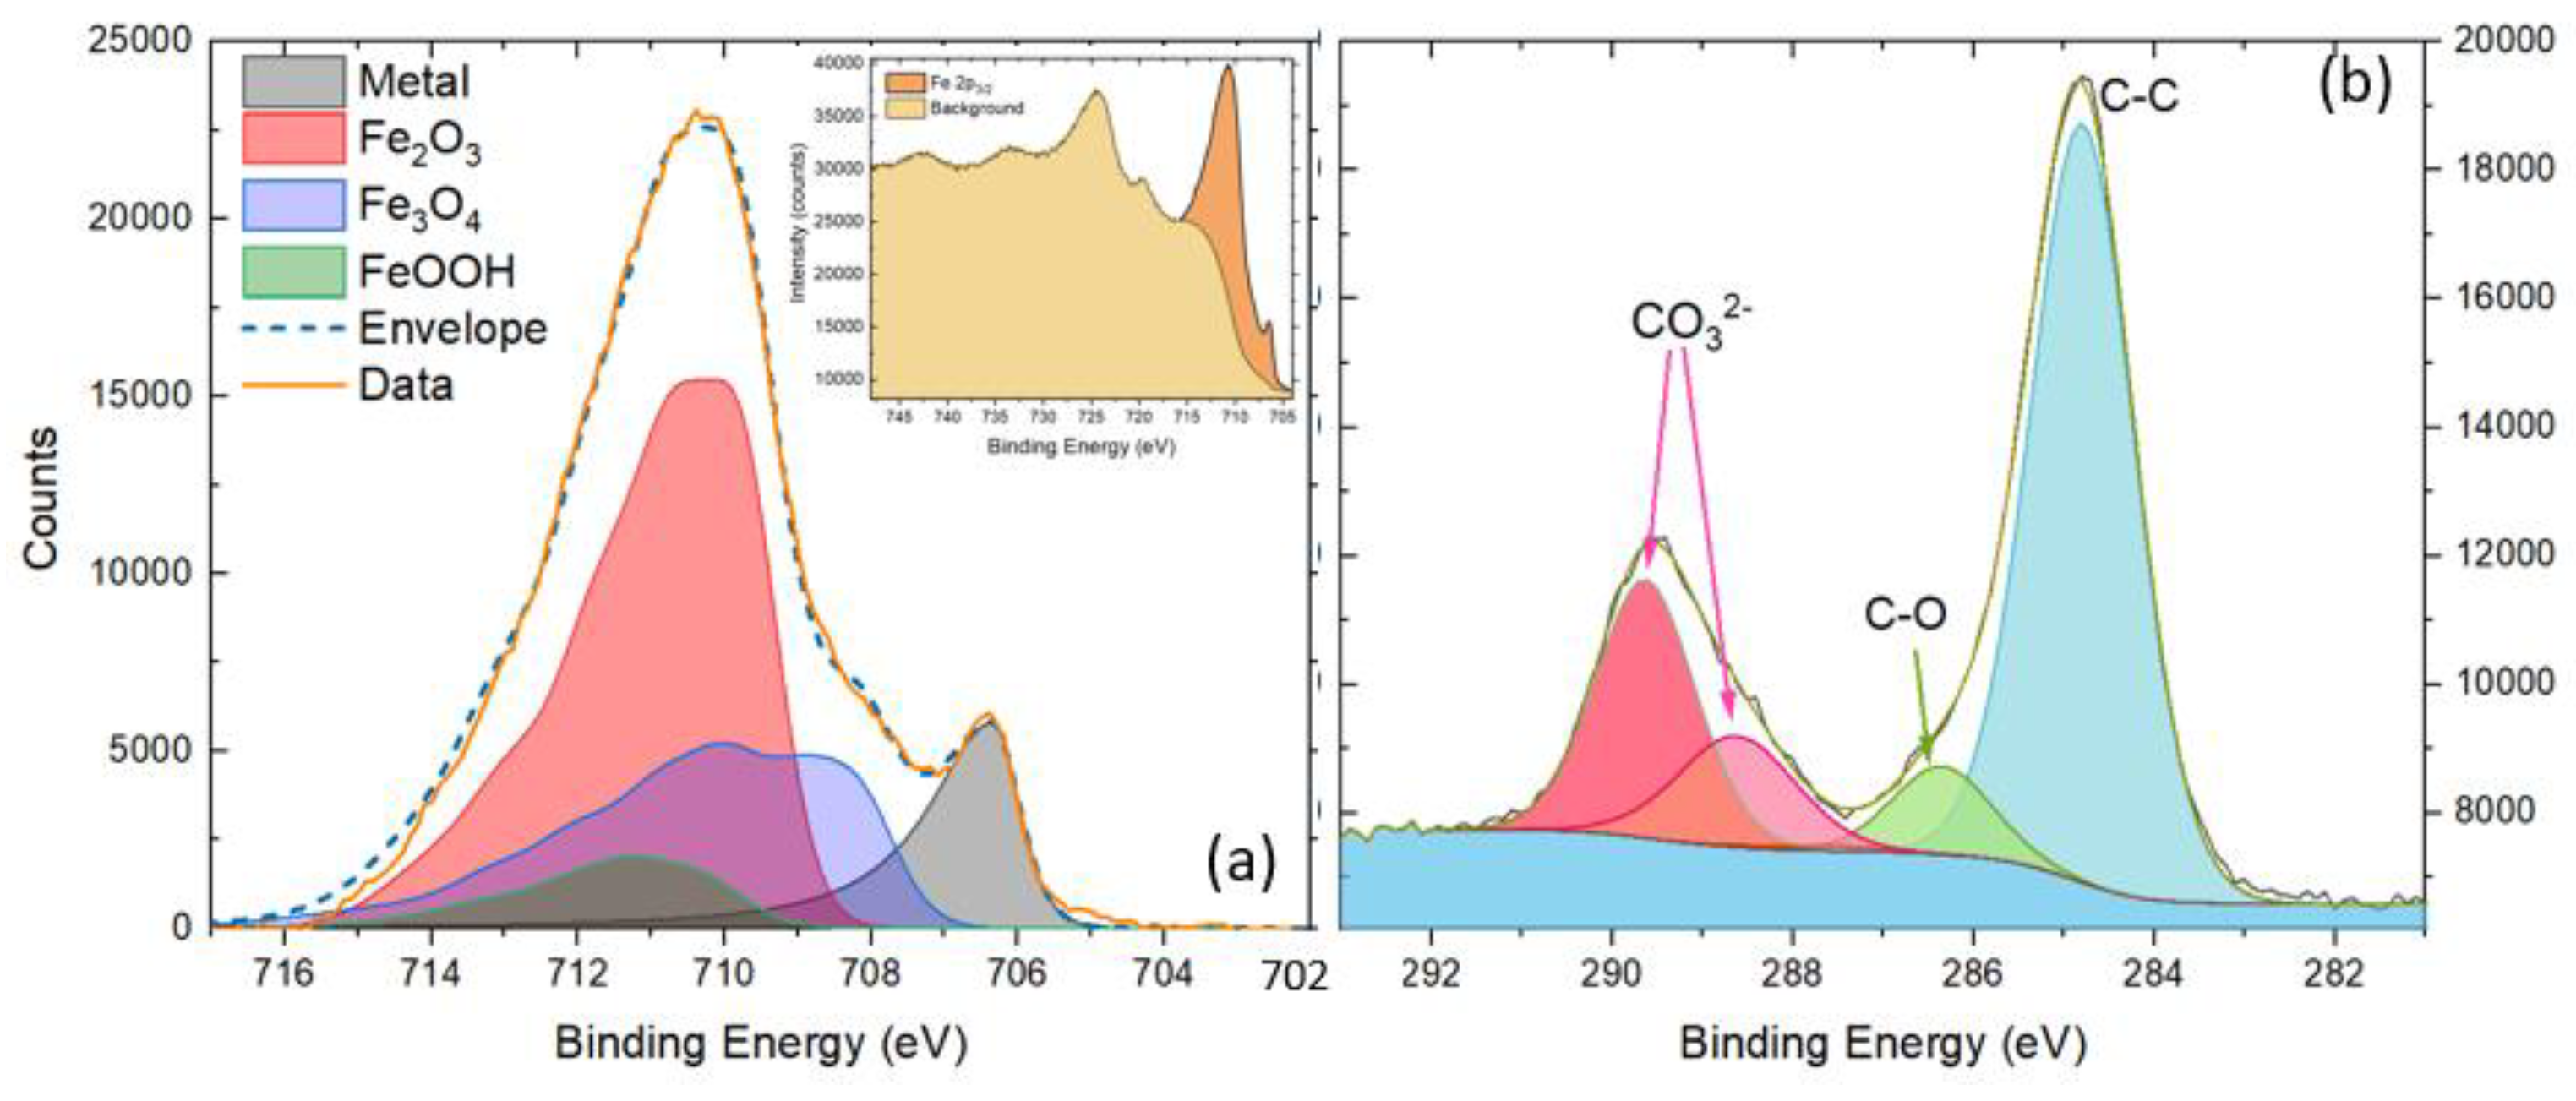
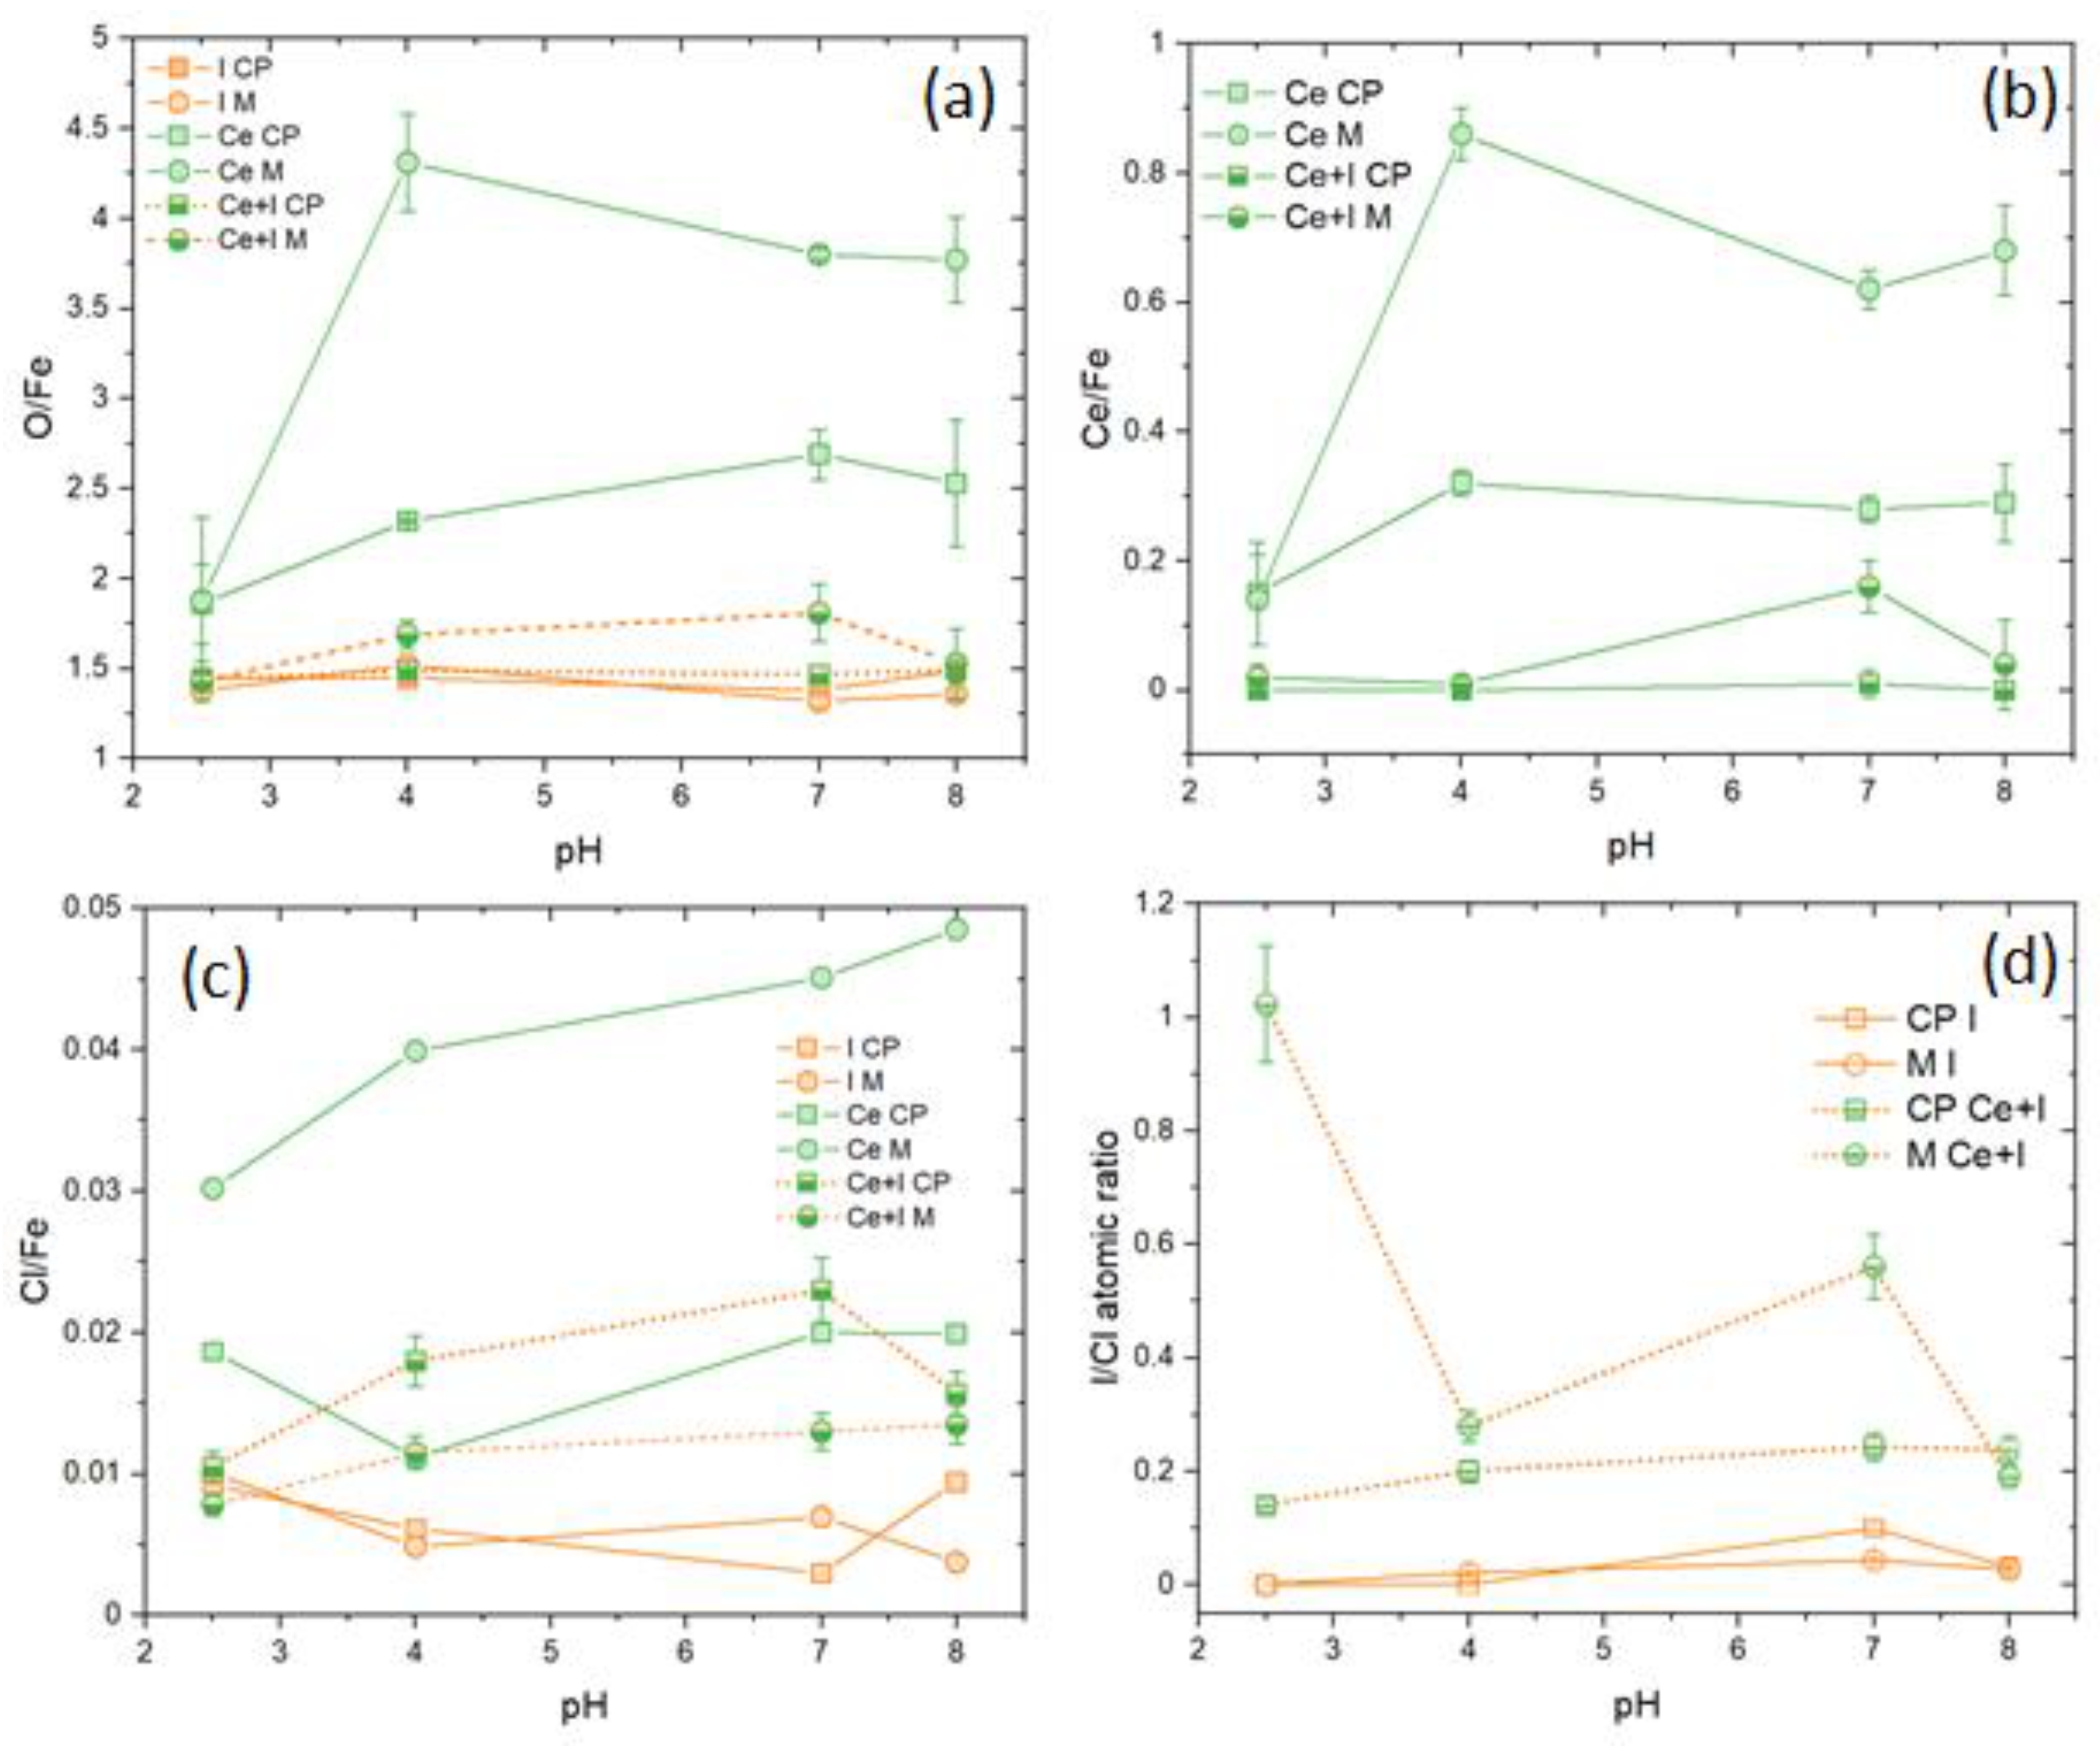
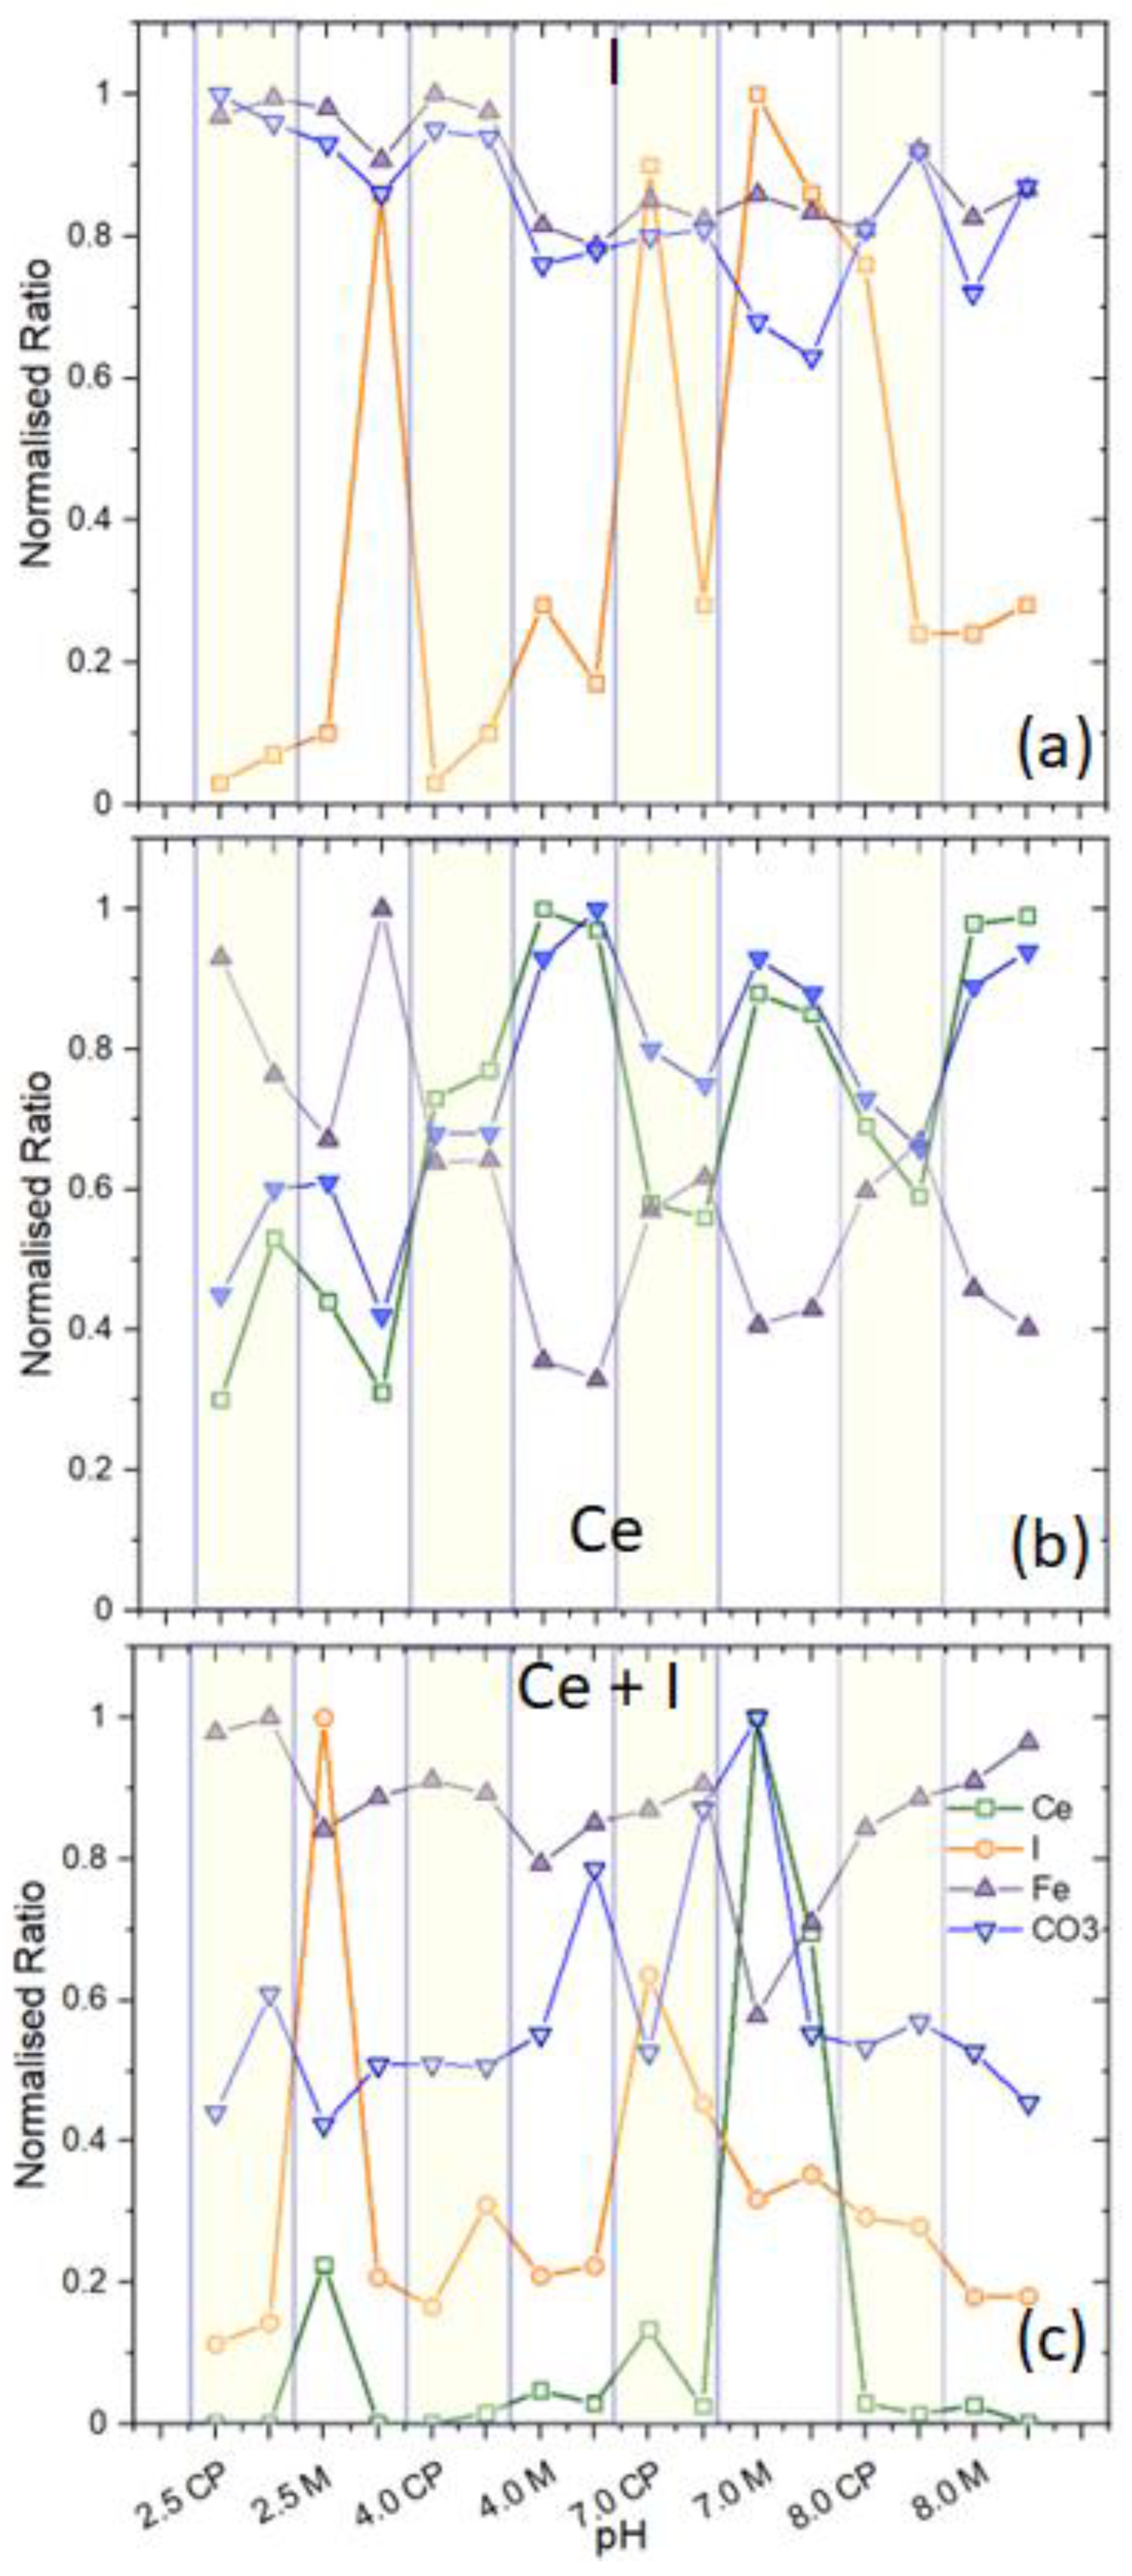
Clearly, the SEM results indicate a crystallite structure within the corrosion product. X-ray diffraction was used to further characterize any crystalline phases on the sample surfaces with diffractograms for the three different electrolytes at pH 4 presented in Figure 10. Table 5 presents a qualitative assessment of the level of contribution of different phases to the overall composition of the corrosion product.
Overall, the dominant phases present in the corrosion product were different polymorphs of FeOOH, namely lepidocrocite and akaganeite, with some minor amounts of goethite, the latter only observed on the surface exposed to the I-electrolyte. Akaganeite can contain chloride, but it is not clear how this extends to other halides such as iodide. While Ce was detected in the corrosion product using EDS, no crystalline phases containing Ce were identified, meaning that it must be present as either an amorphous phase or as very fine trace crystallites.
In the I-electrolyte and across the whole pH range, lepidocrocite was the major phase observed, with some minor amounts of goethite. Thus, the needle-like crystallites observed in SEM (Figure 7) on these surfaces can be identified with lepodocrocite. This morphology is consistent as other reports for lepodocrocite [50,51]. The chloride-containing akaganeite was not observed in the corrosion products developed in this electrolyte. In the Ce-electrolyte, lepidocrocite was, again, the major phase, with some traces of akaganeite and Fe2O3 formed at pH 4. Clearly, the conglomerate phase (observed using SEM and containing embedded particles) is poorly crystalline or amorphous since no characteristic reflections for any Ce-compounds were found. There were no minor traces of goethite observed. For the mixed Ce+I electrolyte, the mix of polymorphs of FeOOH was significantly different, with akaganeite being the major polymorph at pH 4.0, 7.0, and 8.0 and lepidocrocite being a major component at pH 2.5 and 4.0. Poorly formed hematite was observed at all pHs in this mixed electrolyte. Since lepidocrocite can only be formed through green rust, but akageneite can be formed by direct hydrolysis of ferric ions, the presence of this latter phase suggests a change in the pathway by which corrosion products are formed in the mixed electrolyte.

3.5. XPS Analyses

Having seen some general trends of elemental distribution based on the EDS mapping and identified the crystalline phases using XRD, it is easier to classify the observations made using XPS and try to understand some of the local chemistry of these sites.
Generally, Fe, O, C, and Cl were detected on all samples, and, in addition, either I, Ce, or both were detected on samples exposed to electrolytes containing these ions. As mentioned in the experimental section, XPS analyses of the Fe 2p3/2 peak were appropriately fitted using the multiplet structures of three different types of oxides/hydroxides: Fe2O3, Fe3O4, and FeOOH, with an example where the three different compounds are identified presented in Figure 11a. It is not possible to separate α-FeOOH (goethite) either β-FeOOH (16kageneite) or γ-FeOOH (lepidocrocite) in XPS. As a note, in the literature, it is common for single symmetric peaks to be used to fit these different oxide components, but clearly the shape for each type of oxide is not symmetric due to the multiplet structure (Figure 11a), thus stressing the importance of including the multiplet structure in fitting.
Overall, a mixture of Fe-oxides/hydroxides was observed using XPS (Figure 12) on the surface, bearing a partial similarity to the observations reported for EDS and XRD. In addition, carbonate was detected on all samples, but because no crystalline carbonate phases were detected in XRD, the carbonate is assumed to be an adsorbed species. This species is not siderite (FeCO3) based on the XPS curvefitting and is not incorporated into Figure 12. Thus, for the I-electrolyte, Fe2O3 and FeOOH (lepridocrocite from XRD) were the main components, with the amount of FeOOH reaching a minimum at mid pH and Fe2O3 reaching a corresponding maximum at mid pH (Figure 12a). The Fe2O3 must be amorphous or present as a thin layer because it was not detected in XRD. For the Ce-electrolyte, the overall trend was similar, but a larger percentage of Fe2O3 was generated at pH 4 (Figure 12b). The XRD indicated that the FeOOH was lepridocrocite but also that no Fe2O3 was observed, suggesting, as with the I-electrolyte, that it is amorphous or present as fine crystallites. In the Ce+I electrolyte, there are some subtle differences from the other two electrolytes (Figure 12c). First, there is significantly less FeOOH generated at low pH, but it is still mostly lepodrocite with a small amount of akageneite. The amount increases with pH, whereby a significant fraction of FeOOH is generated at neutral pH in the form of akageneite. There is a slight increase in Fe3O4 at lower pH. Significantly, there is a large increase in the amount of Fe2O3 generated at lower pHs, which XRD suggests could be luogifengenite (ε-Fe2O3).
For the C 1s spectrum (Figure 11b), typical adventitious carbon peaks (C-C and C-O) arising from carbon contamination were observed [52]. However, there were two peaks of interest at higher binding energies. For the series of samples where only I was present in solution, a peak occurred at ~288.7 eV consistent with the presence of carbonate ions but not consistent with FeCO3, which has a peak around 290.1 eV [38]. Moreover, the fitting of the corresponding Fe 2p3/2 spectra with FeCO3 (incorporating full multiplet breakdown) resulted in a poorer fit to the data than with Fe3O4, suggesting that siderite was not present, leading to the conclusion that the carbonate ions might be adsorbed onto the surface of the oxides and/or FeOOH particles present in the corrosion product [47,48]. Bicarbonate is another possibility, with both the C 1 s and the HBE O 1 s having similar positions to Na and K bicarbonates [53]. This, however, cannot be considered a unique assignment. It should be noted that the presence of carbonate can be considered a contaminant since it is not a component of the electrolyte, but it is also a significant contribution to the XPS and therefore needs to be considered in the overall scheme. Indeed, Dastgheib et al. [26] and Forsyth et al. [4] attribute this species to a cerium (III) carbonate based on FTIR, with the likely source being HCO3 from dissolved CO2 in the electrolyte. In the case of the Ce and Ce+I electrolytes, an additional component was observed at ~289.7 eV, which is consistent with Ce2(CO3)3 or CeOCO3 [54]. The O 1s also showed a range of components that can be broadly divided into (i) oxide (~529.5 eV), (ii) carbonates and hydroxides (~532 eV), and C-O and adsorbed water (>~533eV). Some of the detailed changes in these photoelectron spectra are discussed below.
With respect to composition, the O/Fe, Ce/Fe, Cl/Fe, and I/Fe results are presented in Figure 13 and full analyses expressed in elemental at.% are presented in Table 6. No nitrogen species were observed using XPS. As seen in the SEM section, samples generally had a loose corrosion product layer (labeled CP) on top of the carbon steel (labeled M for metal), so analyses were performed on both these regions where possible. The layer on the M-surface is likely to be most relevant for corrosion protection.
For the CP after exposure to I-electrolytes, there was a distinct difference in composition (Table 6) between the lower pH (2.5 and 4), where more Fe and O were detected, and pH 7 and 8. The O/Fe ratio (Figure 13a) was consistently around 1.5, implying that Fe2O3 was the main oxide present on the surface. The XPS fitting of the Fe 2p3/2 matched this analysis, as seen in Figure 12a. The Cl/Fe levels were similar for both sites across all pHs (Figure 13c) and were the lowest of all three electrolytes. The I/Cl ratio (Figure 13d) showed the same trend for both sites (CP and M), with higher ratios at pH 7 compared to lower pH.
Different trends were observed in the case of exposure to 7 × 10⁻³ M Ce ions, mainly because there were significant levels of Ce detected in both the CP as well as on the metal (Figure 13c). At low pH, around 3 at.% of Ce(III) was detected, but this increased at pH 4 and above to around 4 to 5 at.% in the CP and between 6.3 and 7.3 at.% in the metal. The presence of Ce(III) is largely consistent with the speciation analysis of cerium ions in solution, although some Ce(IV) might be expected at pH 2.5 [55]. Since the SEM/EDS results indicate that the highest levels of Ce were observed in the regions containing embedded particles, it can be assumed that much of the Ce detected in XPS is from these regions. Oxygen levels were consistently in the 38 to 40 at.% range for all the samples, but the O/Fe ratios were generally higher for the CP (3.7 → 4.3) than the M (2.0 → 2.5) (Figure 13a). This is largely due to the incorporation of Ce into both the CP as well as on the metal surface, thus reducing the Fe at. % (Figure 13c), but there is also a contribution from the higher level of FeOOH observed from the XPS curvefitting. Most notably, the C concentrations in the CP and on the metal surface were twice as high as after exposure to the I-electrolyte, with the highest levels recorded at pH 7 and 8 (Table 6). The C 1s spectra for these samples showed that there were significant levels of carbonate formed at both types of sites. The strong correlation of the Ce and CO32− can be seen in Figure 14b, where the normalized values are plotted against pH for the CP and M. The correlation between the two is obvious at pH 4 and above, and along with the C 1s binding energy of the carbonate component, it suggests the formation of either Ce2(CO3)3 or Ce(OH)CO3 since Ce(III) is the major component of the Ce3d spectra [26,54,56]. The strong correlation of the Ce and CO32− contrasts with the I-electrolyte, where the CO32− tends to reflect the Fe signal. It is interesting to note that although carbonate is not part of the electrolyte, it is present, particularly in the oxide layer described as M, and the levels follow a consistent trend.
The results for the Ce+I electrolyte were quite different from those of either of the other two electrolytes. The SEM indicates that there was a wider variety of different morphologies for the corrosion product in these mixed electrolytes (Figure 7), and the XRD shows the appearance of akageneite instead of lepidocrocite. For the CP, the Ce/Fe ratios were much smaller than when Ce was the only inhibitor in the electrolyte. The highest Ce levels observed using EDS in the SEM were from the surface particulates and the embedded particles. The O/Fe and Cl/Fe ratios for Ce+I electrolytes were between those of I and Ce electrolytes. The Cl/Fe in the case of Ce+I-electrolyte falls between the other two electrolytes, suggesting that iodide impairs the incorporation of chloride into both the mud crack structure and the precipitates. In fact, the I/Cl ratio is close to 1 for the CP at pH 2.5 but between 0.2 and 0.5 for all other conditions. This figure is well above the value for the I-electrolyte, indicating an influence of the Ce ion on adsorption. On the M areas, high levels of Ce were detected in the Ce-electrolyte but lower levels for the Ce+I electrolyte. Again, this is similar to the EDS results on the matrix, where both Ce and I ions were detected, but the level of Ce was much lower in the presence of iodide ions. So both the EDS and the XPS results indicate that both iodide and cerium ions may be playing a combined role in protecting the surface of the matrix. Carbonate was detected on these surfaces, but the strong correlation between C and Ce seen in the Ce-electrolyte (Figure 14b) was not evident in the Ce+I electrolyte except at pH 7, but at other pHs the Fe, I, and CO32− trends related more to the I-electrolyte, thus suggesting a mixing of mechanisms with lower pHs looking more like the I-electrolyte and higher pHs displaying behavior more like the Ce-electrolyte (Figure 14c).

4. Discussion

Proposed pathways for the Fe-based protective layer (PL) and corrosion products (CP) are presented in Figure 15 and follow Suzuki [50] for major pathways for precipitation from Fe2+ and Fe3+ aquo species. Minor amounts of product may form via linkages excluded in Figure 15 and new linkages may also become apparent in other electrolytes [57]. These major pathways are the routes for the eventual formation of species such as FeOOH and Fe2O3, which are considered the basic components of the PL. It should also be kept in mind that for the electrolytes containing Ce ions, the characterization techniques presented above indicate that there are parallel precipitation processes for these species, as discussed below.
The formation of any protective layer and corrosion products on mild steel is a complex process that starts with the oxidation of the underlying metal to form Fe2+. From here, there can be further oxidation (Path I in Figure 15 and the formation of Fe(III) solution species. In parallel, there can be the formation of mixed Fe(II) and Fe(III) aquo-species (Path II in Figure 15). Along Path II, there is a further division based on pH: acidic pH 2.5 and 4, and neutral to alkaline pH 7, 8. These two regions represent a division in formation mechanism where, at the acidic pH, CP formation is probably via hydrolysis and deprotonation reactions of iron-aquo species, eventually resulting in the precipitation of magnetite (Fe3O4), but in alkaline solutions, corrosion product formation is via a green rust intermediate and the formation of lepidocrocite (γ-FeOOH) [48]. This is because green rust can only form above pH 6.0 because the FeO6 octahedra (a basic constituent of GR and the hydro-oxide) dissolve at pH < 6 [47,48]. Obviously, the background pH is not as relevant as the local pH since lepidocrocite, which is formed only through green rust, was detected at all pHs in the I- and Ce-electrolytes, suggesting a locally higher pH than the background electrolyte in the case of the acid electrolyte. It is worth noting that in this study, the green rust precursors are likely to be type I green rusts such as hydrochloro green rust (GR1(Cl)) and/or hydroxycarbonate green rust GR1(CO32−). The carbonate-based green rust has been included because of the detection of carbonates, presumably resulting from the atmospheric contamination from absorbed CO2. These precursors are transient species, with reports in the literature suggesting that GR1(CO32−) completely dissolves 2 to 3 h after exposure to an oxidizing atmosphere [47]. Given that the exposures in this study are for 24 h, any GR should be fully converted to the end products. In the following, we look at how the presence of iodide and cerium ions might influence protective layer and corrosion product formation. While nitrate ions are present in two of the three electrolytes, there was no evidence of them (or nitrites or amines) in XPS, meaning that no conclusion on the role of nitrates or their reduction products can be drawn. It can be noted, however, that potentiodynamic polarization curves for electrolytes containing Ce(NO3)3 are different from simple nitrate (or nitrite) salt solutions, and the amount of lepidocrocite formed in the presence of Ce(NO3)3 no greater than in the iodide case (nitrate reduction would facilitate lepidocrocite formation). This is largely due to the widespread deposition of cerium-based compounds.
For the I-electrolyte, there is a weak correspondence between the iodide levels determined using XPS and the IE%. At low pH, there is good corrosion inhibition and higher iodide levels on the metal, and XPS showed that FeOOH was the dominant surface product, which XRD indicates is mainly lepidocrocite. As can be seen from the weight loss (Appendix A), the presence of iodide ions reduces weight loss at pH 2.5, indicating that iodide adsorption replacing adsorbed Cl, which, from XPS, has the highest I/Cl ratio at this pH of all data reported in this work, inhibits iron dissolution. This mechanism is similar to that reported for AA2024-T3 [11] and reduces the overall production of ferrous and ferric ions. The FeOOH (lepidocrocite) eventually converts to γ-Fe2O3 through dehydration. The percentage of FeOOH is lower at pH 4, resulting in a lower IE%. The reason for this change is not entirely clear. There is a reduction in the I/Cl ratio, reflecting less adsorption of iodide ions, but the data suggests that the path via magnetite may be more favored. There is also the possibility of the formation of FeIxOy observed in I2 corrosion in nuclear reactors [58], which may reduce the amount of FeO6 that is generated. At pH 7 and 8, the IE% increased (Figure 5) however, higher carbonate levels were also observed. This may indicate CP formation via GR1(CO32−), where the carbonate has ended up adsorbed onto the surface of amorphous γ-Fe2O3 particles, noting that lepodocrocite and γ-Fe2O3 can only form through the green rust pathway [50]. These pathways are indicated by yellow arrows and labeled “I” in Figure 15. The generation of α-Fe2O3 requires thermal activation (indicated by the red circle in Figure 15), such as forced hydrolysis at 100 °C [59]. It is not observed as an end product in this study.
In the Ce-electrolyte, there was a weak correspondence between Ce levels and the corrosion inhibition, suggesting that the presence of Ce in the gel on the surface, which, from XPS, may be a mixture of Ce-hydroxides and Ce2(CO3)3 or Ce(OH)CO3 (or CeOCO3 if Ce(IV) is present), played some role in increasing the IE%. In this instance, it seems that the gel inhibits the formation of a widespread, iron-based protective layer, with CP confining these to much smaller regions on the surface (presumably the anodes). Moreover, for the regions where they are present, the XRD suggests a shift in the type of corrosion product that is generated at anodic sites, with amorphous Fe2O3 being generated. The development of two types of sites could be viewed as a separation of anodic (iron-based) and cathodic (Ce precipitation) sites on the surface, where at higher pH the surface oxides/hydroxides are more stable, and because of the higher pH there is more deposition of Ce compounds [55]. This is true for cerium systems as well as ferrous systems [60]. Clearly, where the gel is present on the surface, this seems to inhibit the formation of iron (hydro)oxide species, which would otherwise be the main species.
A major difference between the Ce-electrolyte and the Ce+I electrolyte is that the extensive areas covered by cerium-containing gel where filiform corrosion was observed in the former case were not observed in the latter case. The corrosion product in the tail of the filiform in the Ce-electrolyte case was similar in morphology to much of the general corrosion product that developed on the surface after immersion in the Ce+I electrolyte (classed as “surface growth” in Figure 7i).
One approach to interpreting this difference is that the presence of adsorbed iodide must interfere with the establishment of large-scale anodes and cathodes on the surface. The formation of Ce-rich regions in the Ce-electrolyte was proposed to occur largely over cathodic sites. The absence of this type of site in the Ce+I electrolyte suggests that the anode and cathodes are more localized when iodide is present and that anodic and cathodic activity is generally reduced (as reflected by the increase in IE%). The “surface growths” observed largely in the filiform corrosion on surfaces exposed to the Ce-electrolyte are widespread in the Ce+I electrolyte. Since it is not easily removed from the surface (not dissolved or washed off during rinsing), it is proposed that it provides greater protection to the surface than the CPs that develop after I- and Ce-electrolytes. From the XRD, the main difference between the Ce+I electrolyte and the others is the presence of Akageneite and the formation of either ε-Fe2O3, γ-Fe2O3 or both directly from Fe(II) and Fe(III) species through Fe3O4. (ε-Fe2O3 is likely to be formed in a path parallel to γ-Fe2O3 given that in both mineral [61] and biological systems [62] it seems associated with magnetite). The akageneite can only be formed through the Fe3 + route (path II, Figure 15), and according to Misawa et al. [63], chloride ions must be present. This suggests that for the Ce+I electrolyte the route via green rust formation is blocked. The “green rust” path (Path I) is likely to occur at cathodic sites where the pH can reach pH > 6. In the presence of cerium ions, these cathodes are likely to be deactivated by the precipitation of cerium products. Additionally, halides (Cl and I) are reported to stabilize the tetragonal lattice of β-FeOOH. Thus, the combination of these two aspects favors the much greater stabilization of β-FeOOH over lepidocrocite obtained via the FeO6 route. It is also feasible that retention on the surface may be due to the lower solubility of iron-based compounds containing iodide compared to those containing chloride [64]. The data indicates that the protective layer formed through β-FeOOH leads to an improvement in adhesion and corrosion protection at pH 4. The small synergy observed between I and Ce and pH 4, 7, and 8 appears to be a result of the combination of cerium precipitates closing down cathodic sites, iodide adsorption suppressing iron dissolution, and perhaps iodide ions stabilizing β-FeOOH. Clearly, there is room for much more work to be performed on understanding the details of the switch to akageneite formation and the exact role of iodide and cerium ions in closing down the GR pathway.

5. Conclusions

The level of corrosion protection provided in 3.5% NaCl electrolytes by the addition of KI, Ce(NO3)3, and mixtures of the two was investigated over a range of pHs from 2.5 to 8.
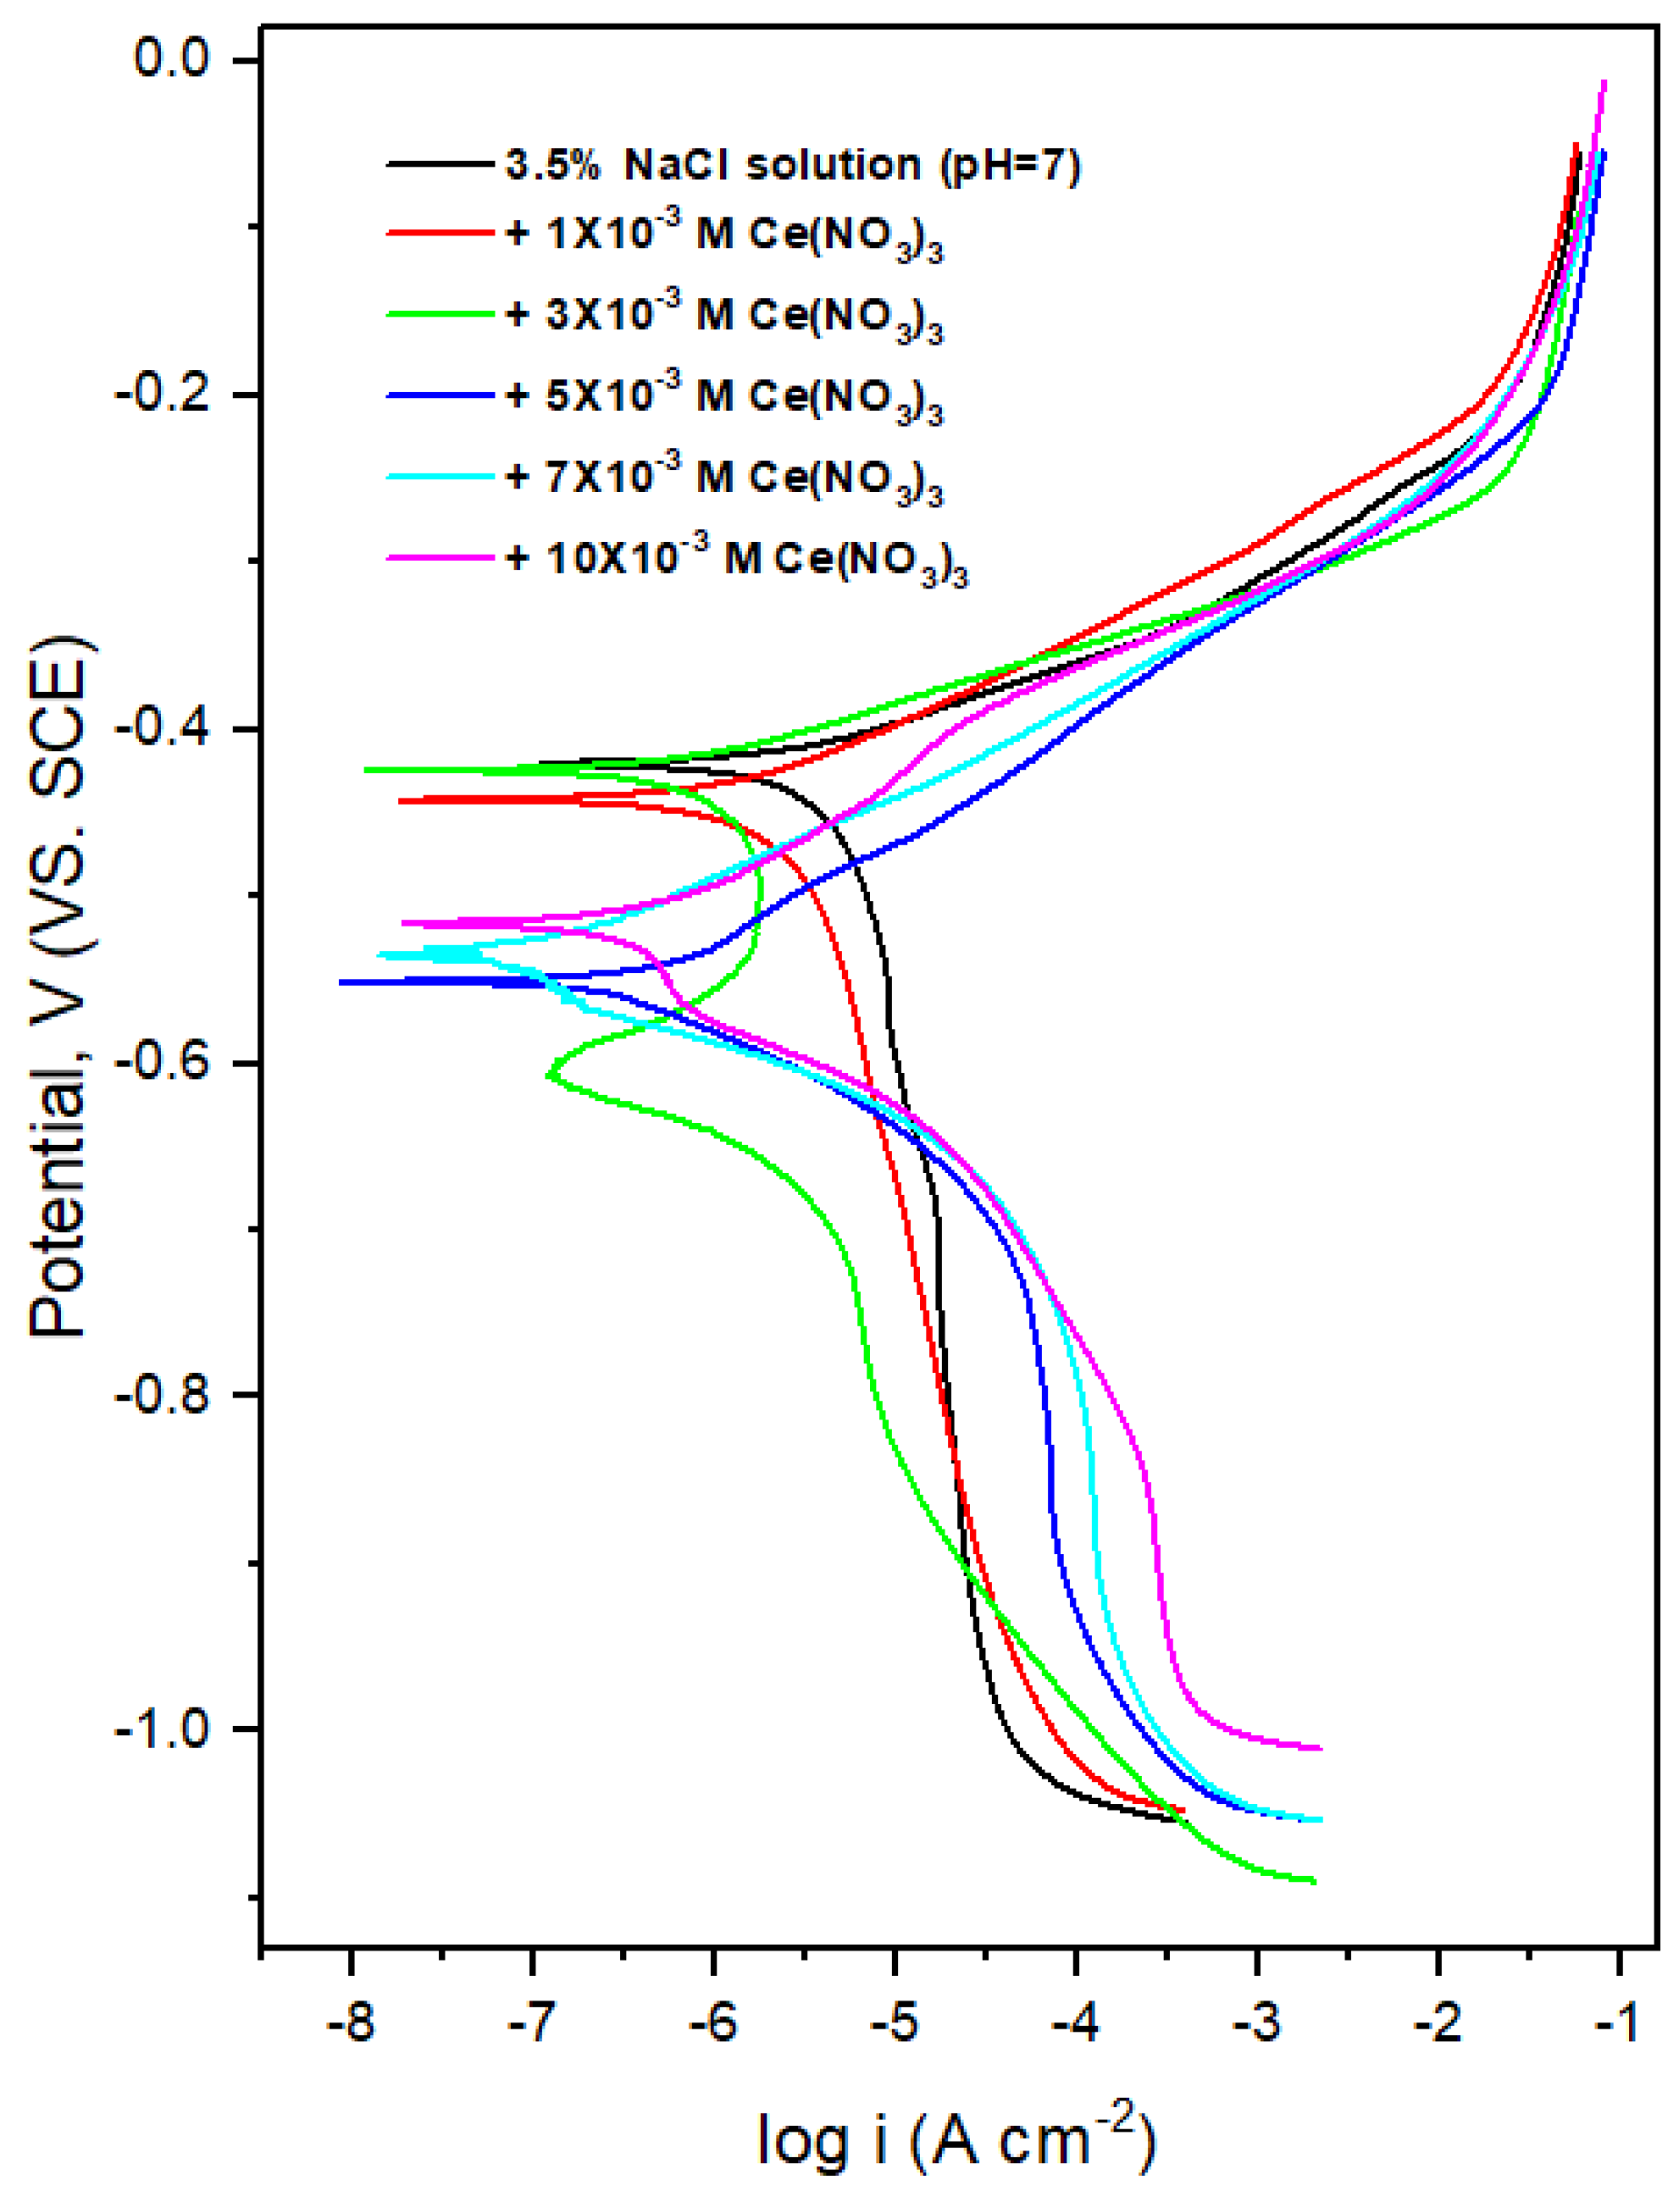
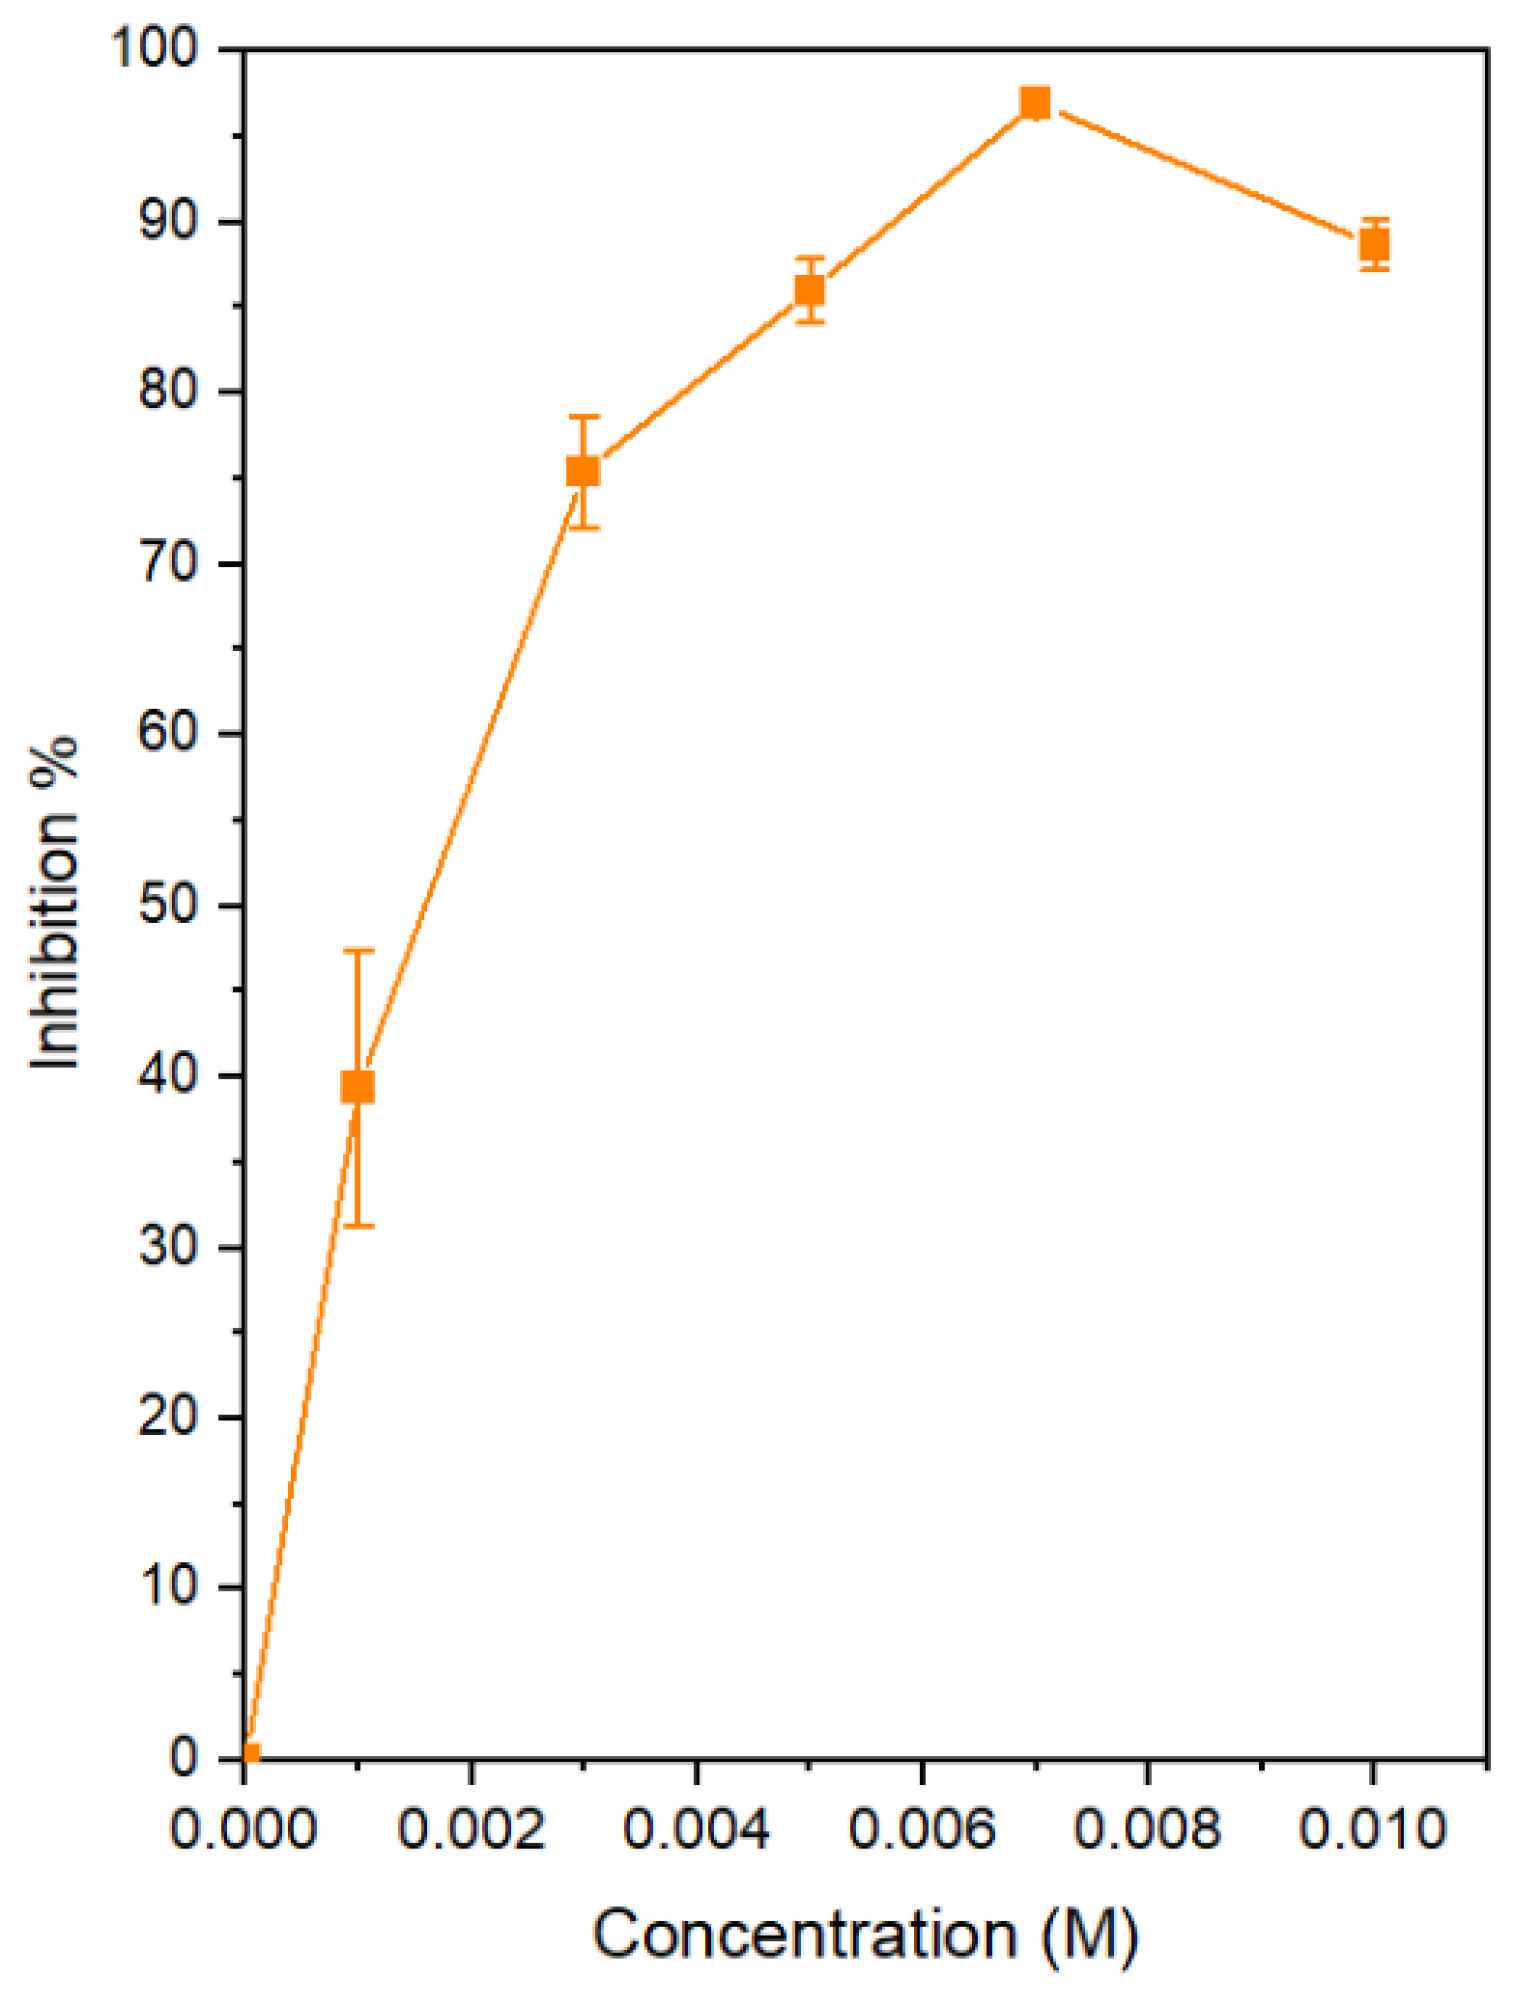
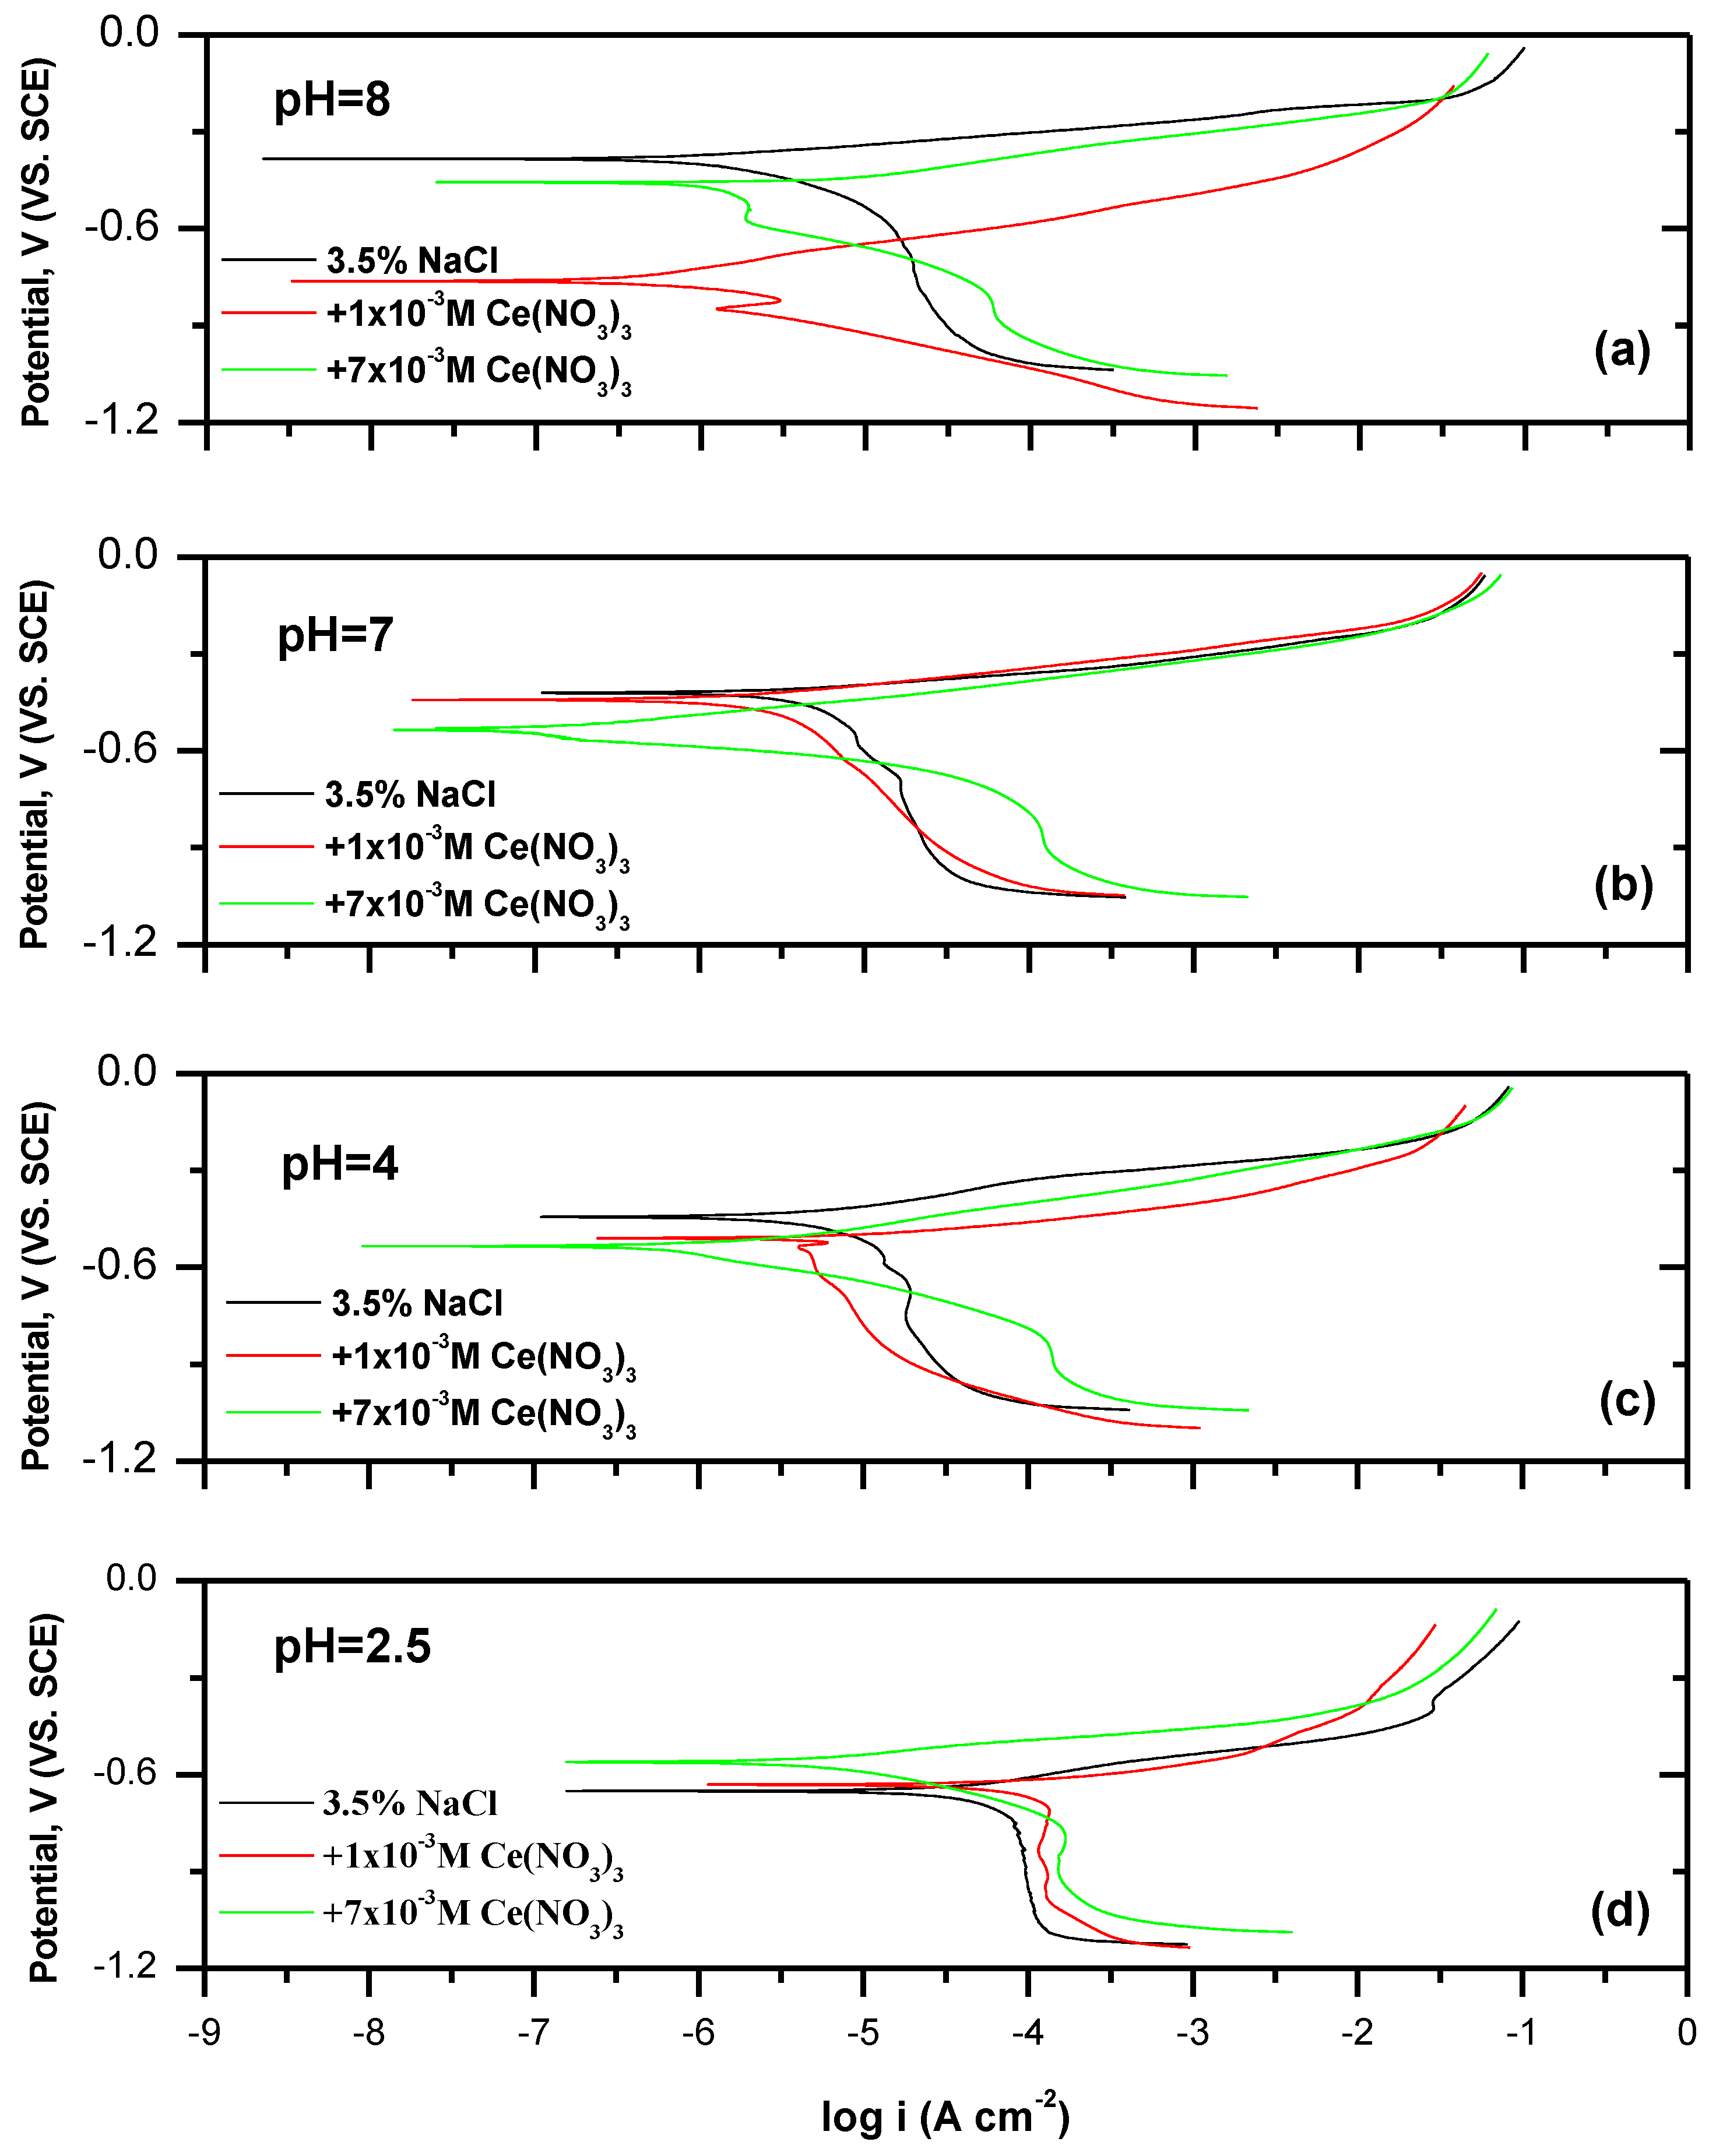
  • First, the optimum Ce concentration of 7 × 10⁻³ M at pH 7 was obtained by determining the inhibitor efficiency (IE%) from potentiodynamic polarization by examining a range of concentrations from 1 × 10⁻⁴ M to 10 × 10−3 M. An optimum of 97% was obtained for 7 × 10⁻³ M at pH 7.
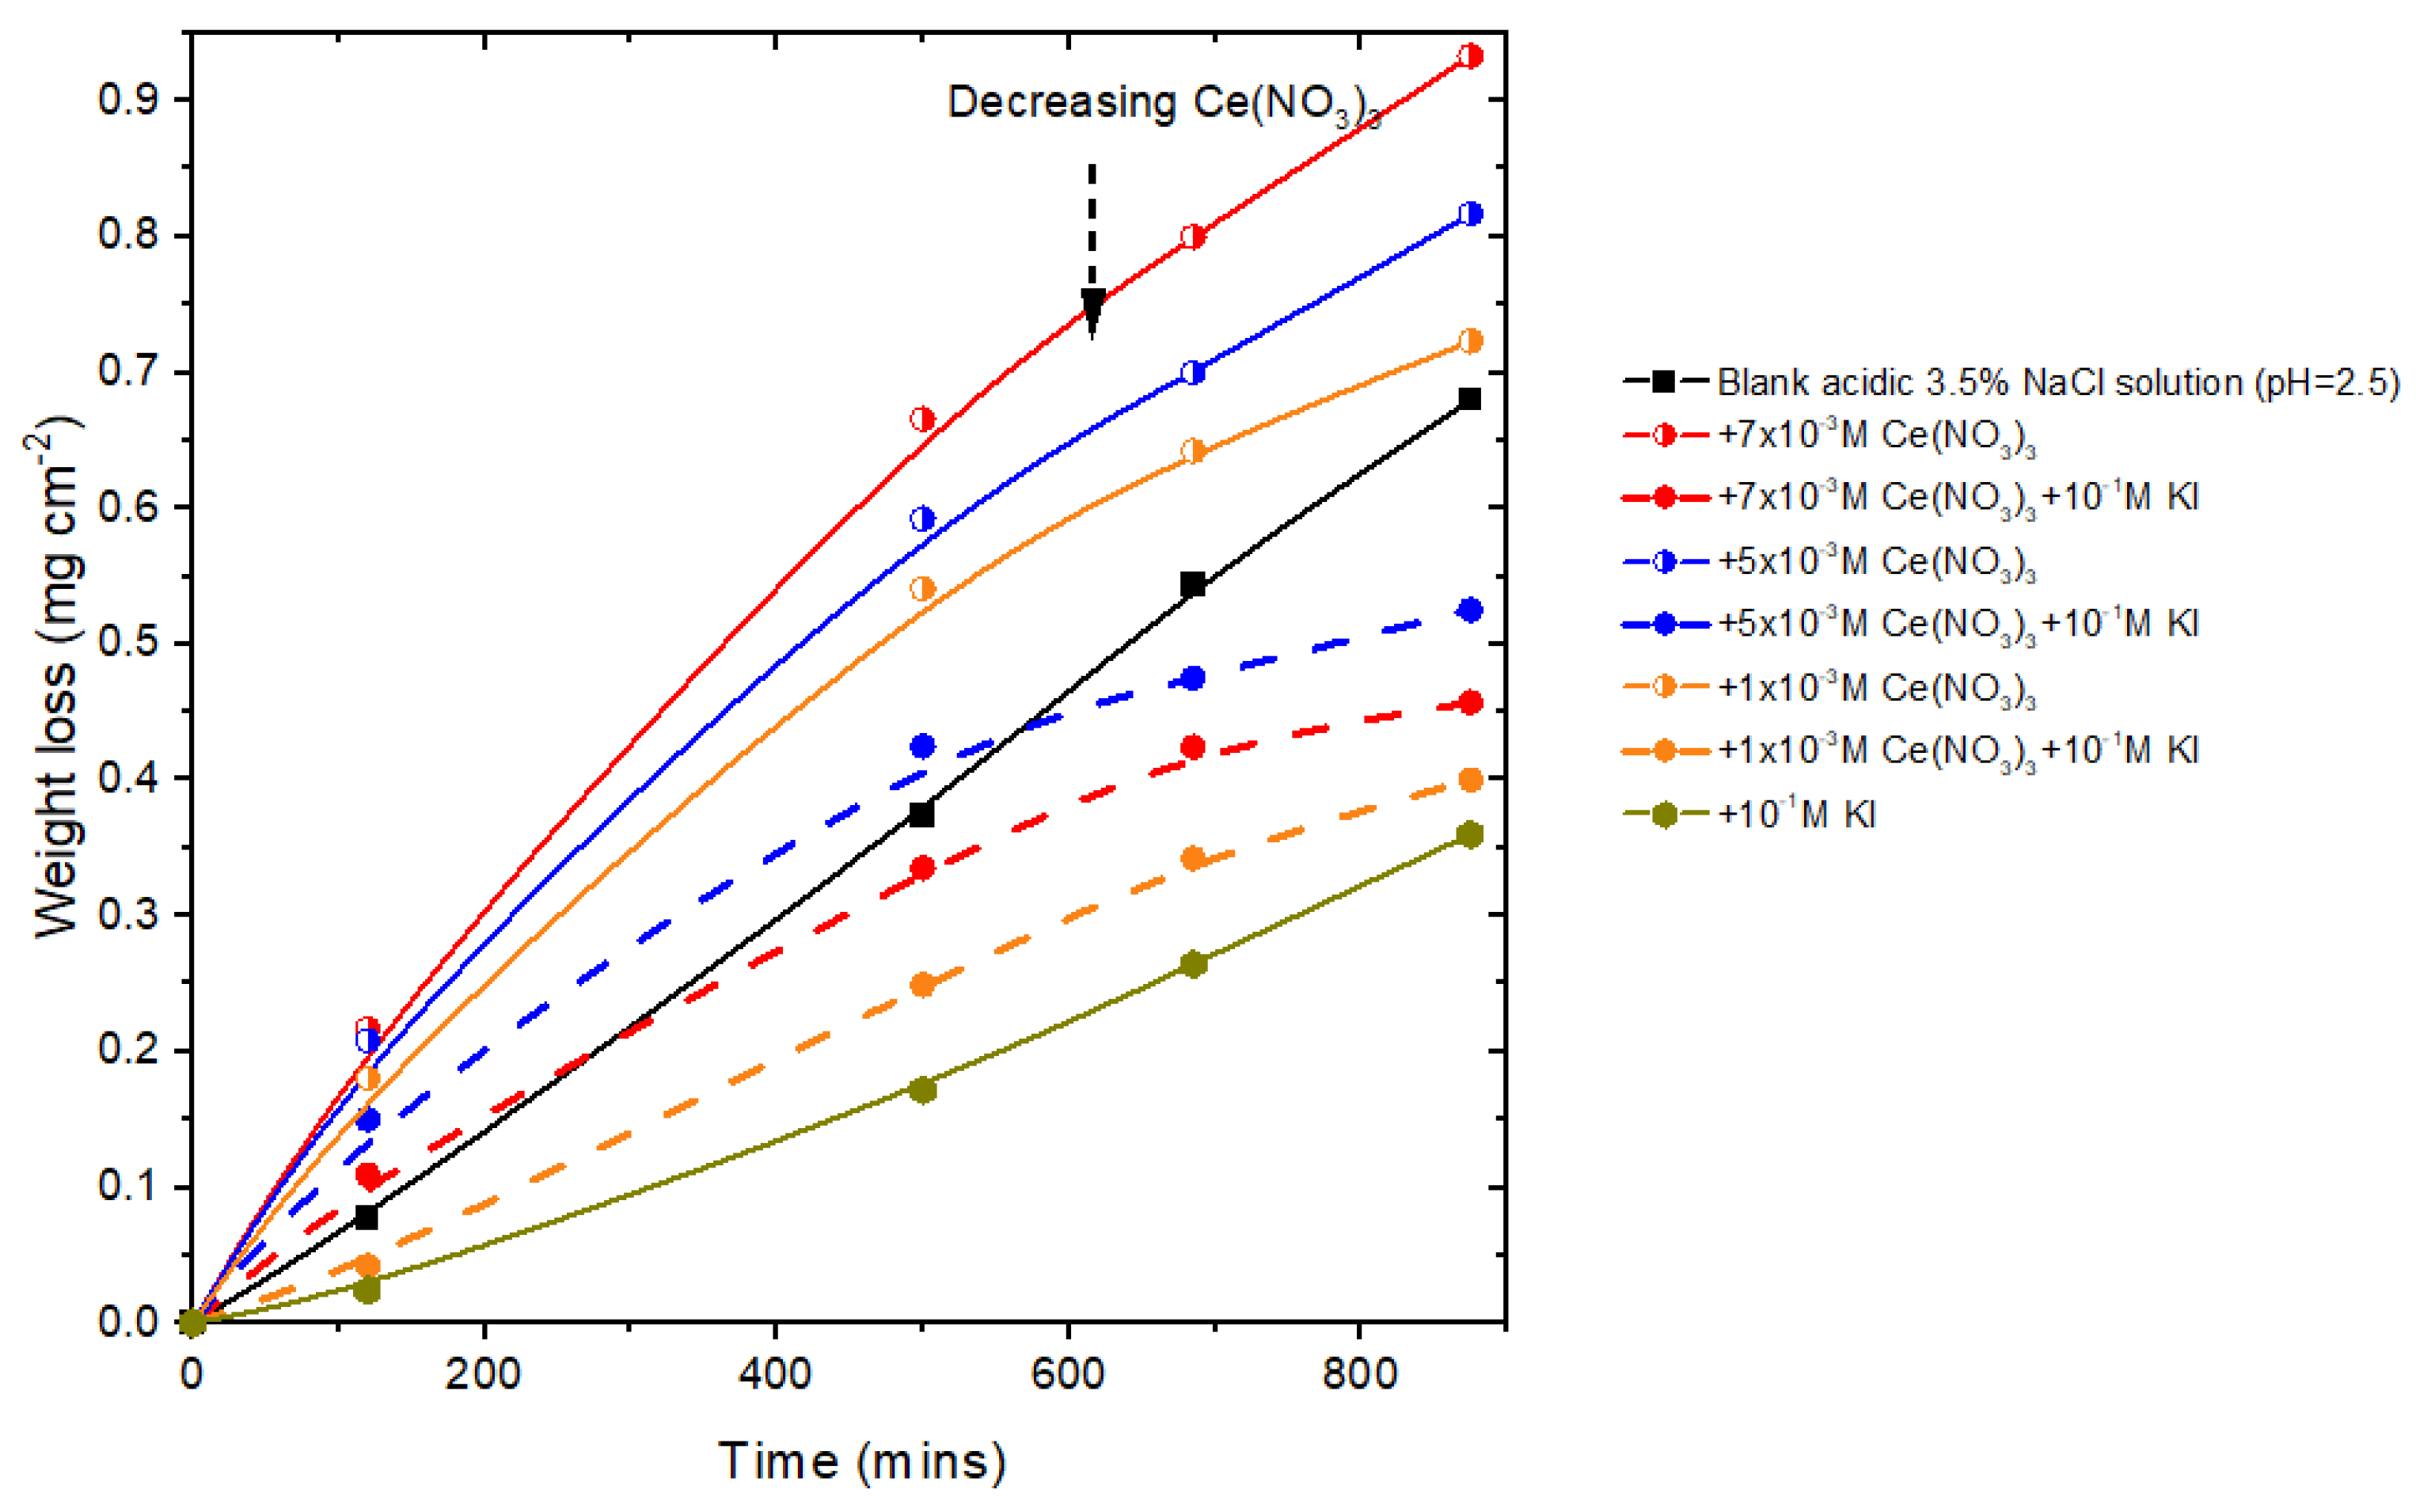
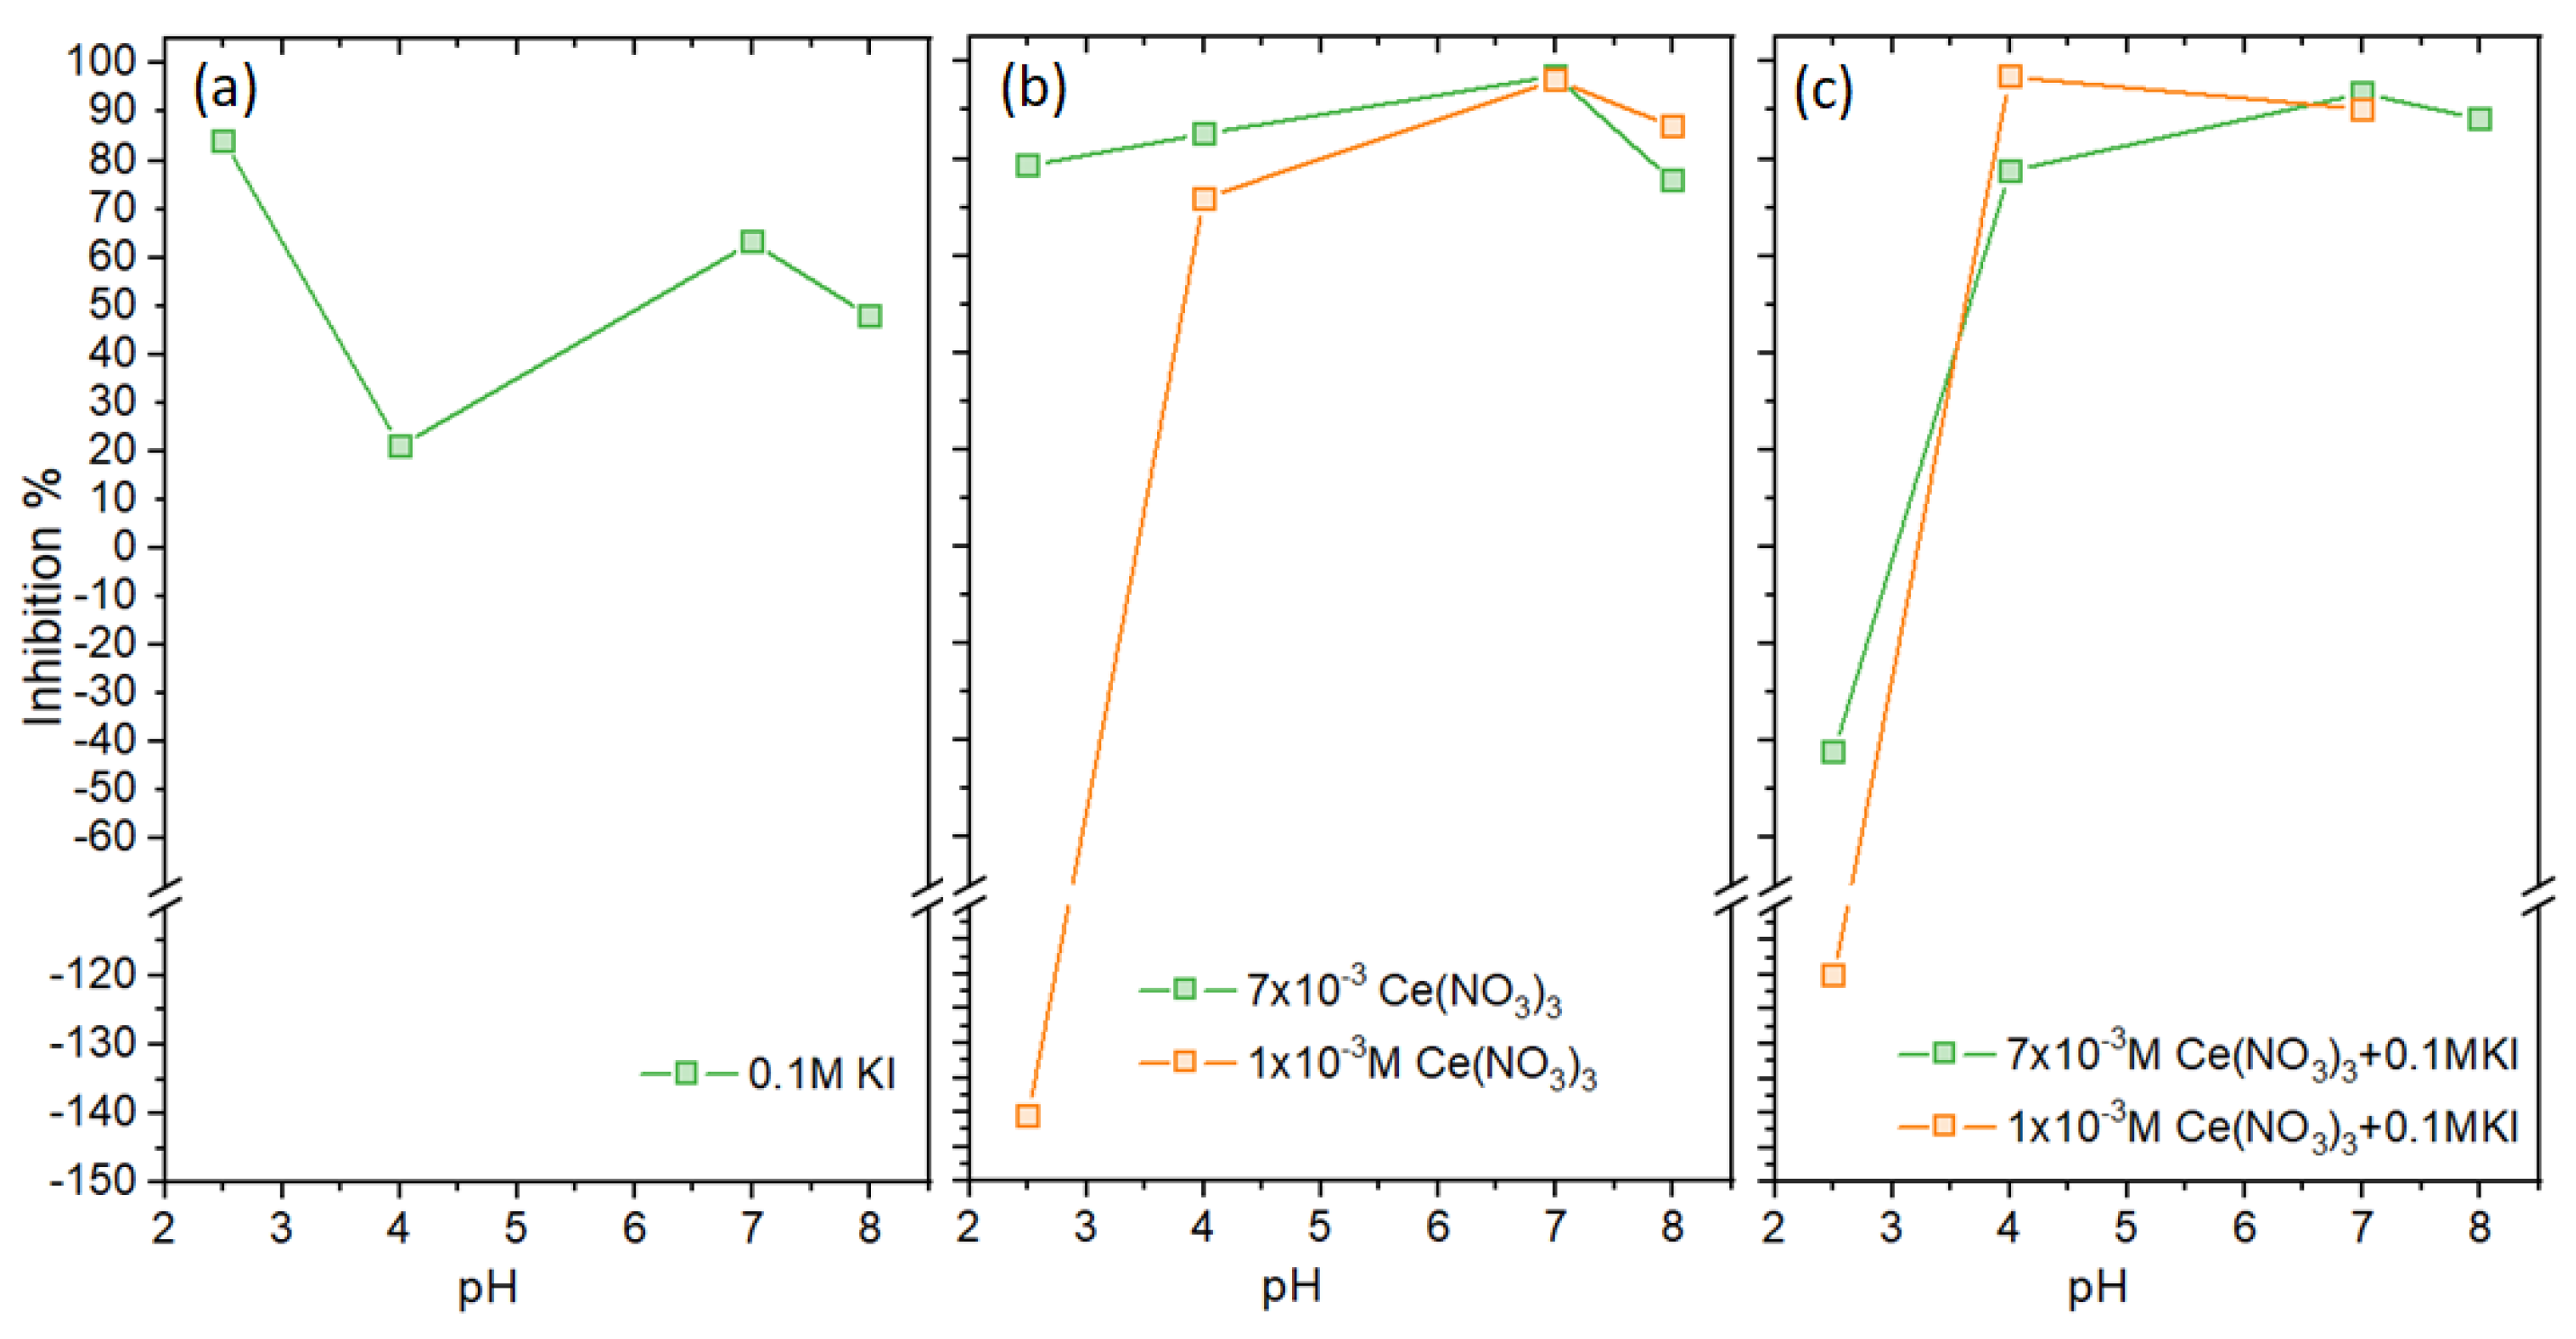
  • Next, the IE% at different pHs was determined for two Ce concentrations of 1 × 10⁻³ M to 7 × 10⁻³ M, confirming that 7 × 10⁻³ M Ce had the highest overall inhibitor efficiency across the pH range. The IE% of 0.1 M KI in 3.5% NaCl electrolyte was examined. It varied between 21% and 84%, with the latter observed at pH 2.
  • The IE% of mixed was generally above 90%. The exception was at pH 2.5, where IE% was negative, i.e., there was promotion of corrosion. This was also reflected in weight loss experiments (see Appendix A). At higher pH values, IE% was similar to or better than the I- or Ce-electrolytes alone. Indeed, synergy was found between these two ions at pH 4, 7, and 8. Importantly, the mixture improved IE% at pH 4.
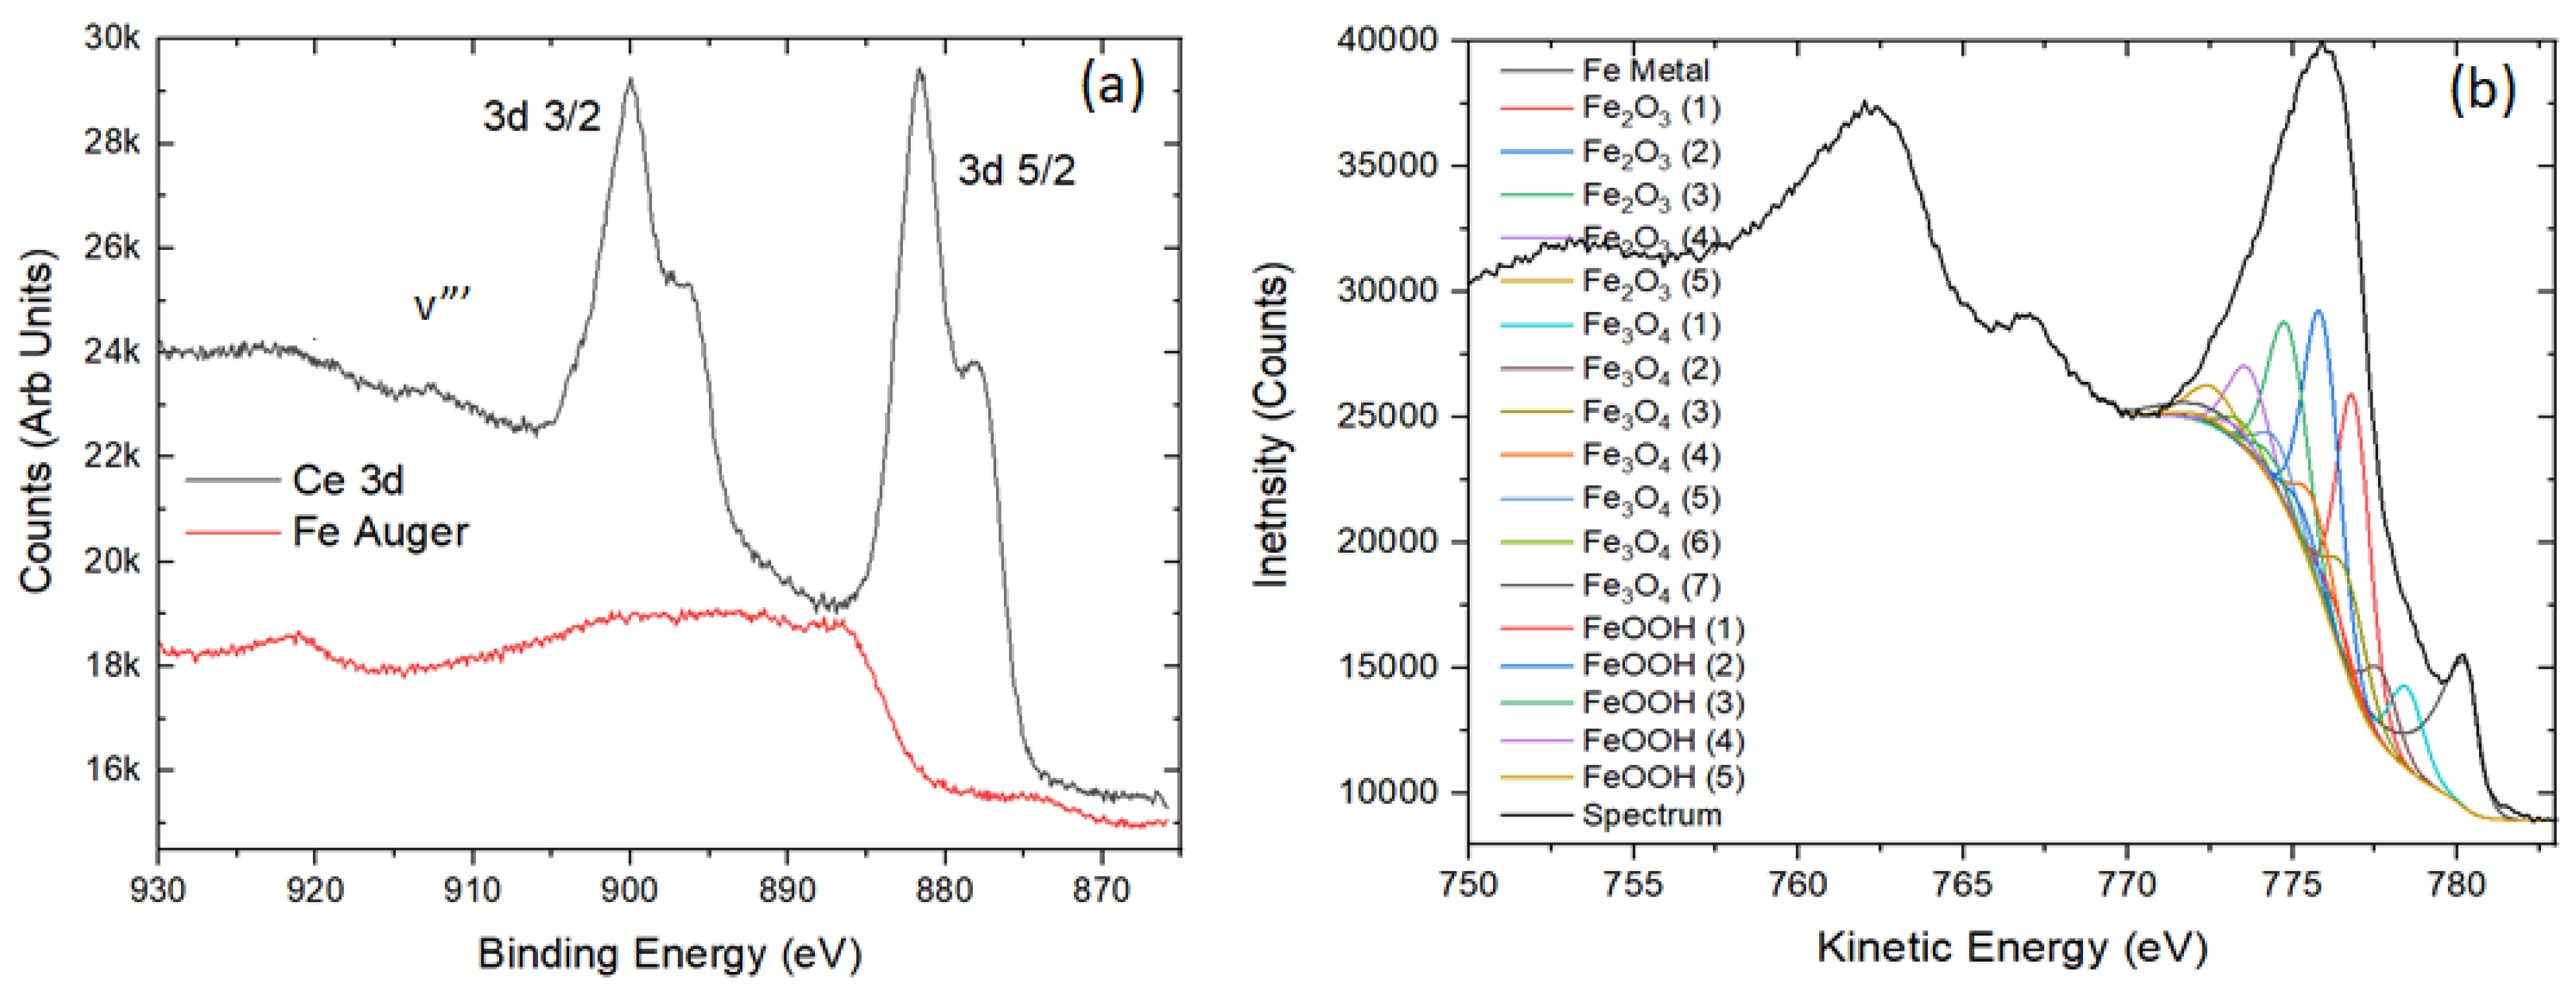
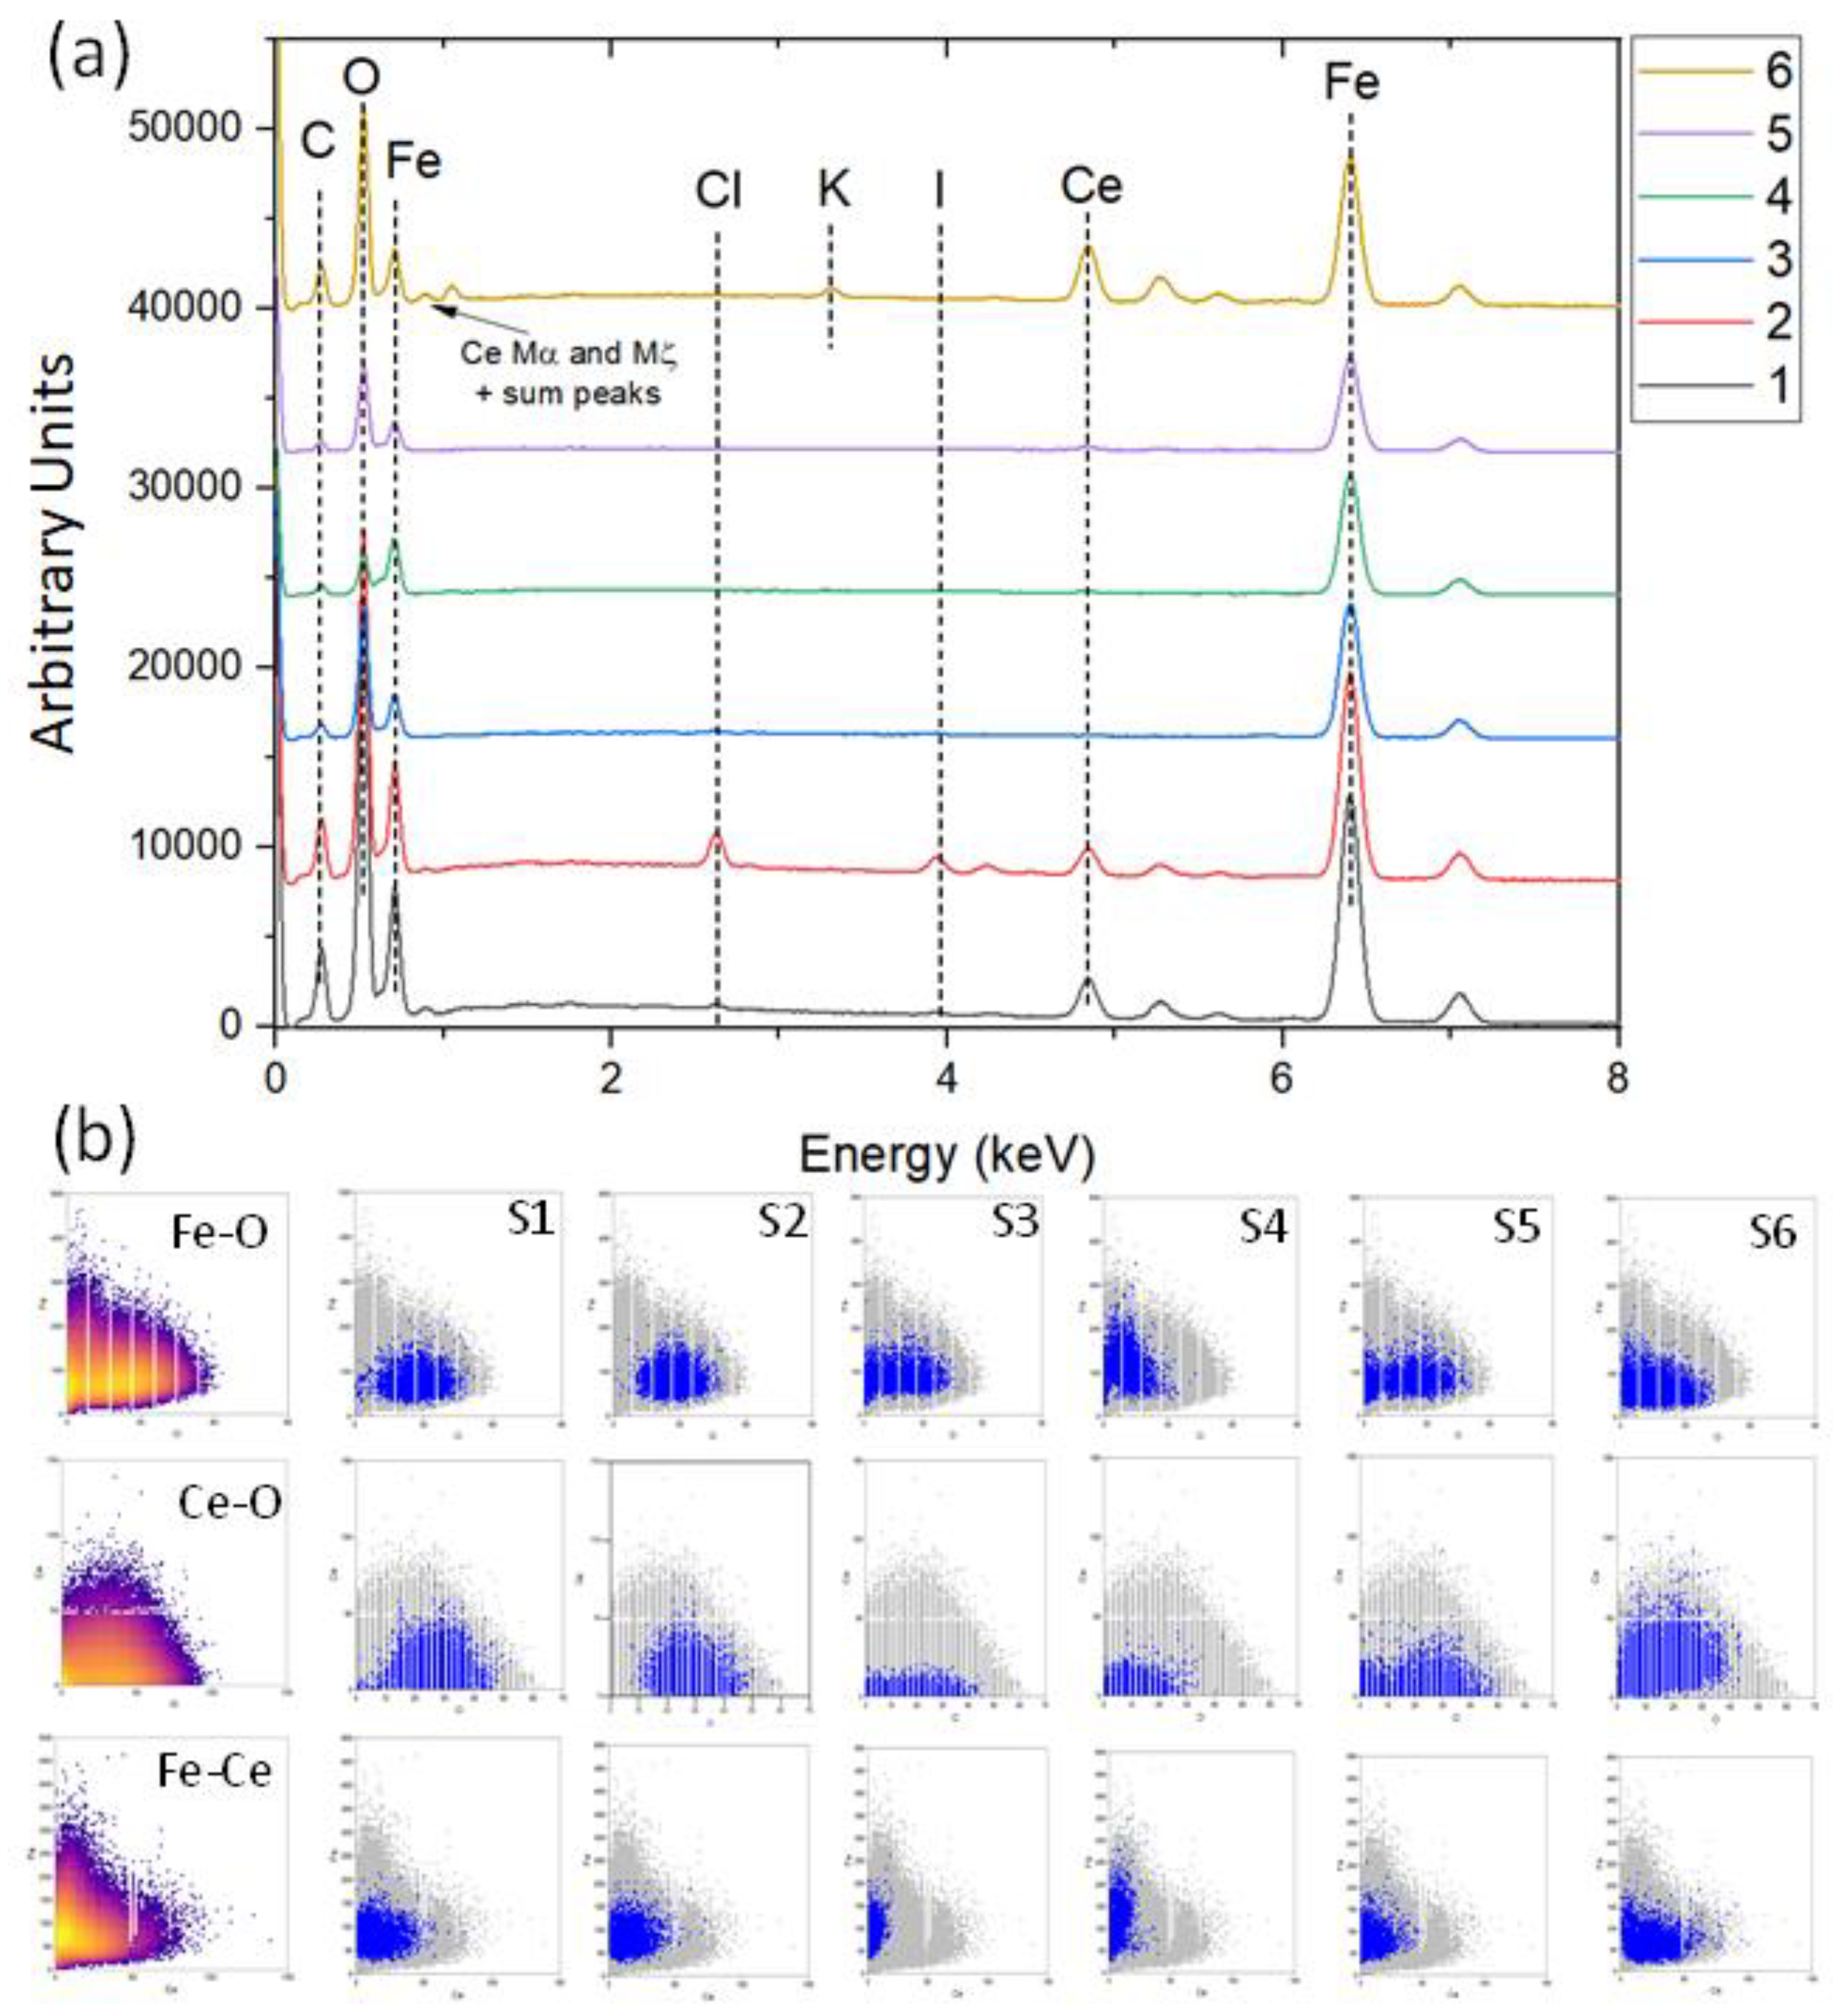
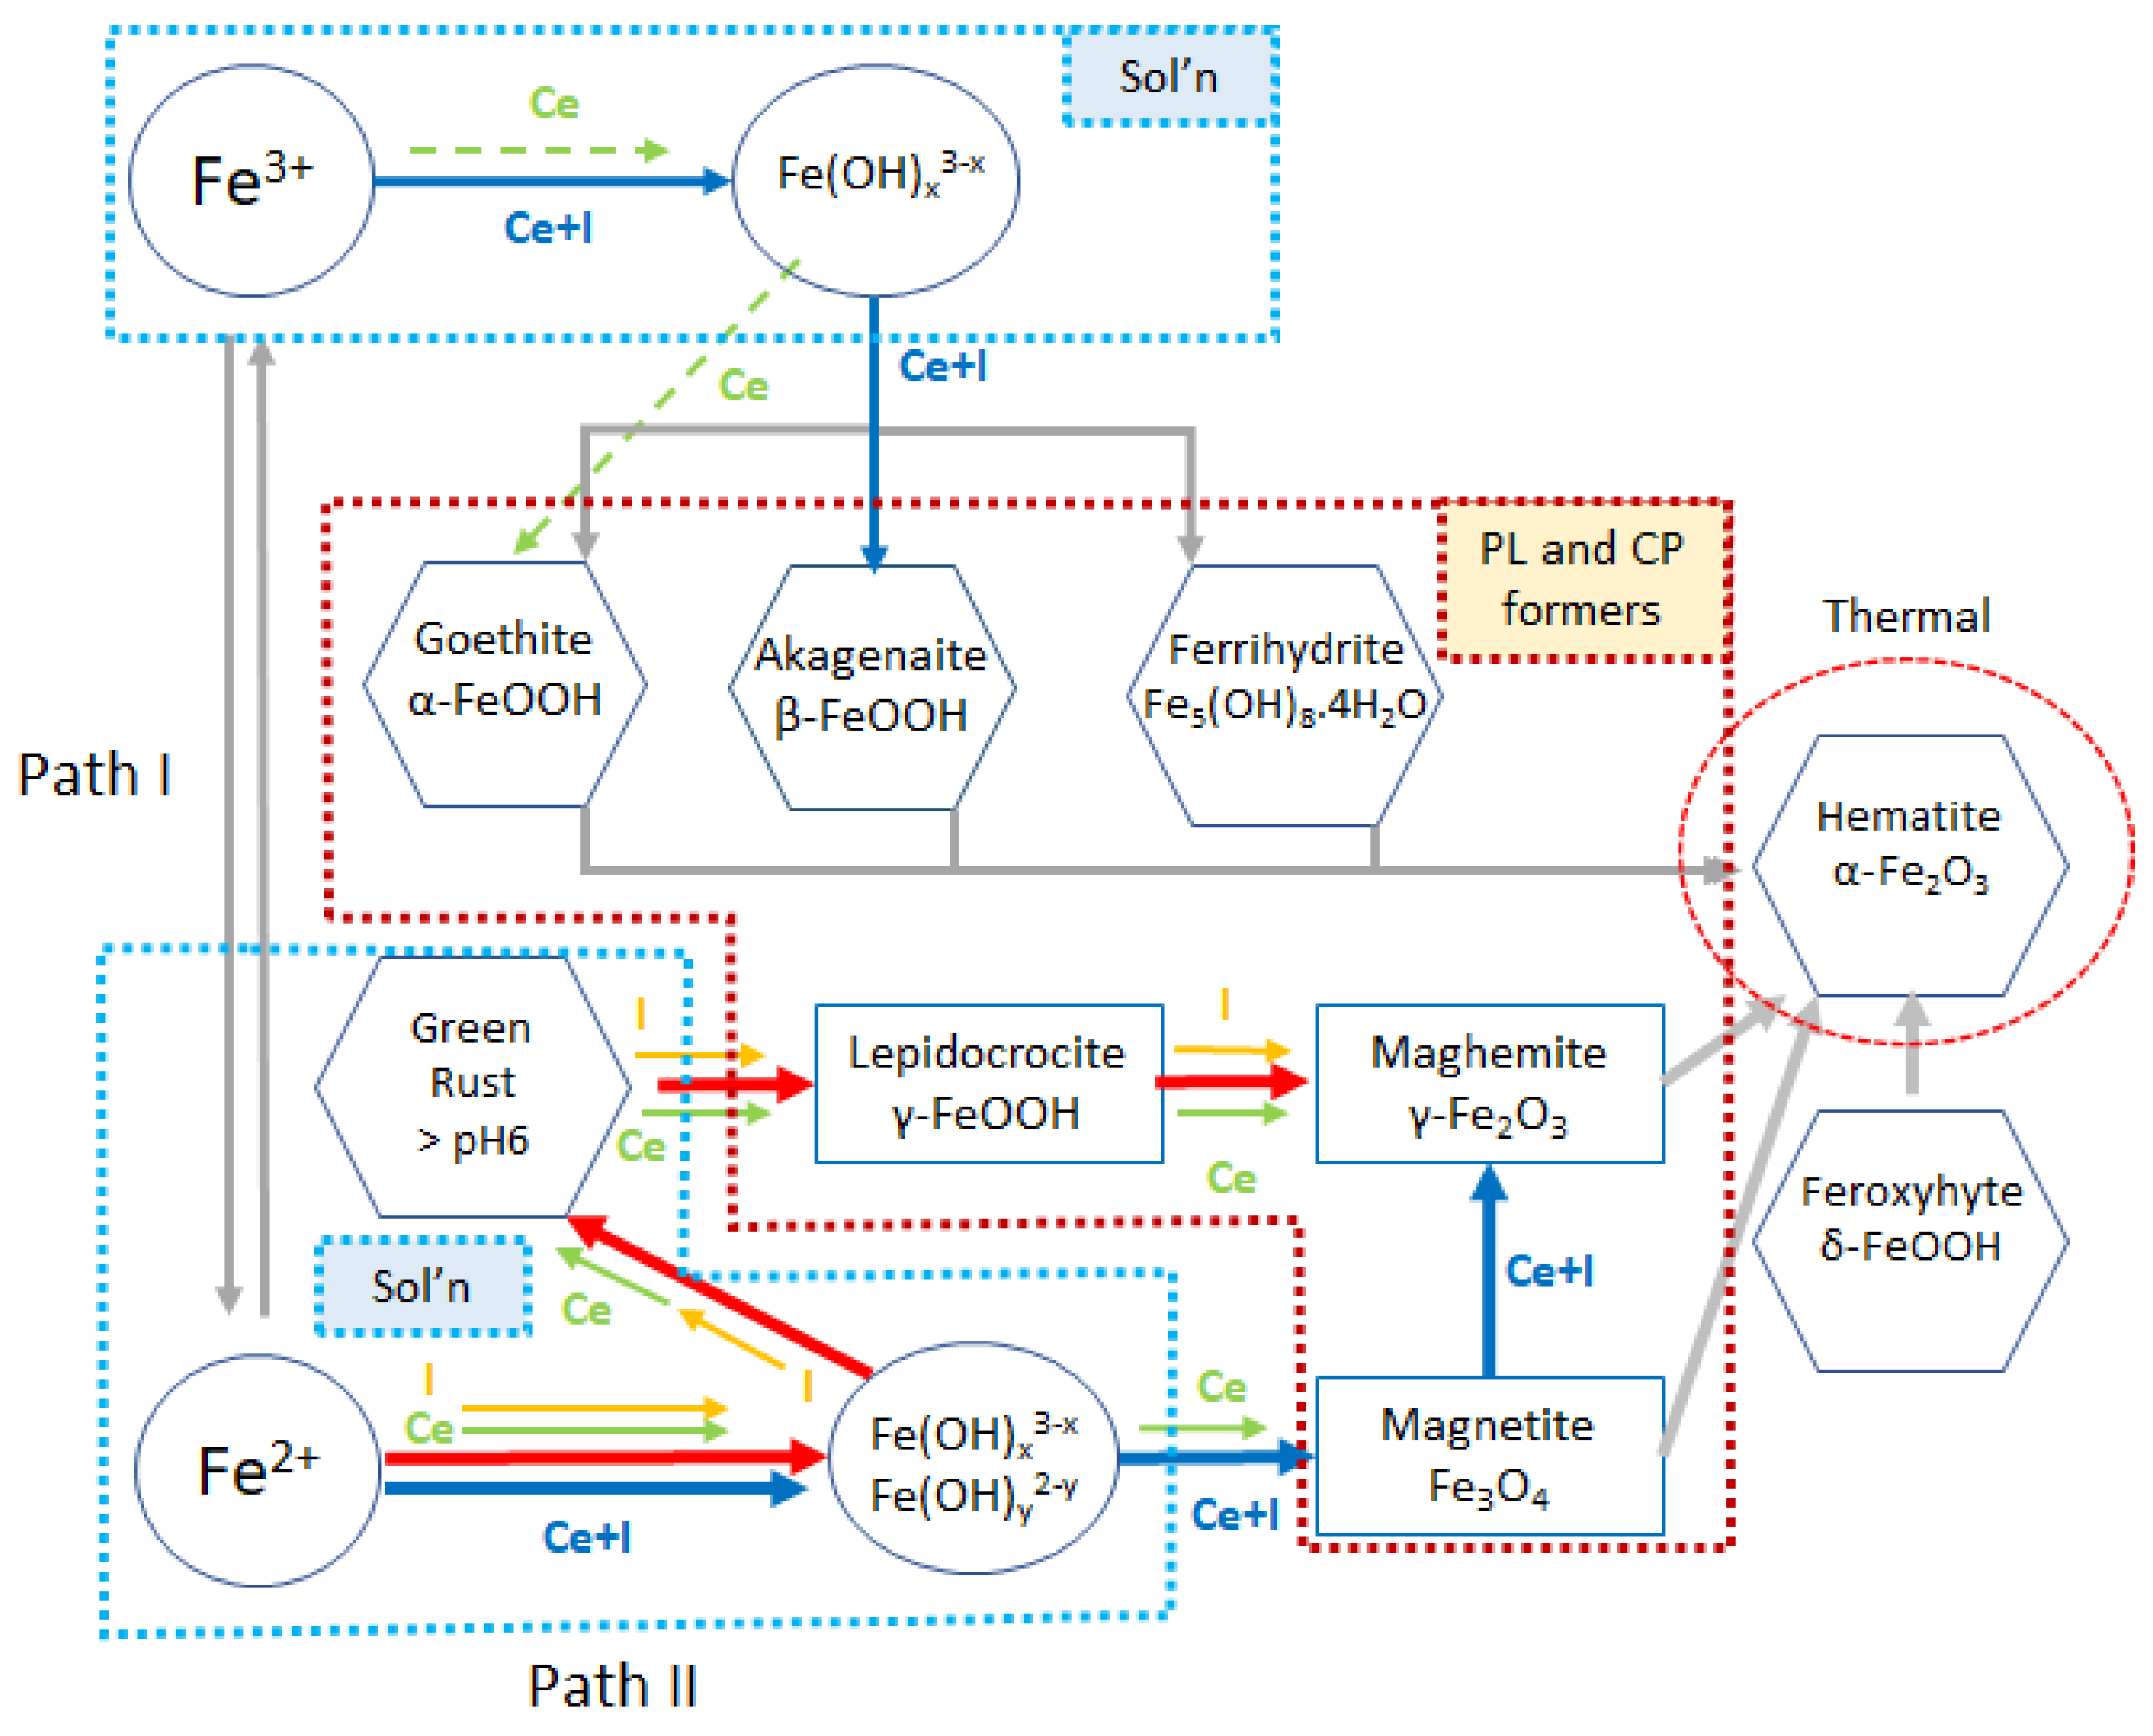
  • At pH 4 and above, the formation of akageneite (β-FeOOH) was the dominant species as opposed to lepidocrocite observed in I-electrolytes and Ce electrolytes. γ-Fe2O3 was observed in both cases. This appears to form a very compact protective layer. Additionally, the widespread heterogeneous precipitation of cerium (III) compounds is probably mainly hydroxides since only Ce(III) was observed. As at pH 4, this was largely Ce(OH)3. At pH 7 and 8, greater amounts of carbonate were observed, also indicating the presence of hydroxycarbonates. Iron carbonates were not observed in XRD or XPS. It should be noted that carbonate is not part of the electrolyte, and its presence was proposed to be due to the absorption of CO2 from the atmosphere. Because it is a significant component of the surface oxides, it is reported here.

Author Contributions

M.A.E.-H. conceived the idea of using mixed iodide and cerium inhibitors to extend the range of protection of cerium solutions to a lower pH range and contributed to the writing of the paper. A.E.H. oversaw the XPS and SEM sample preparation and analyses and contributed to the writing of the paper. I.S.C. contributed to the design of the research program and the writing of the paper. C.D.E. performed the XPS analyses and contributed to the data interpretation. A.S. performed the XRD analyses. All authors have read and agreed to the published version of the manuscript.

Funding

This research received no external funding.

Data Availability Statement

Data may be available on request. It should be noted that specialist or equipment processing software may be necessary to read the datafiles.

Acknowledgments

The authors would like to thank Steve Peacock for formulating the inhibitor electrolytes for the preparation of samples used in XPS and SEM analyses. We thank Mark Biesinger for the reference Fe XP spectra used to derive the series of fit components applied herein.

Conflicts of Interest

The authors declare no conflict of interest.

Appendix A

Appendix A.1. Weight Loss Measurements at pH 2.5

The reduction in corrosion activation through the presence of I in the Ce+I electrolyte at pH 2.5 raised the question of whether there might be a Ce(NO3)3 concentration where inhibition was observed. To investigate this further, weight loss measurements were performed as a function of time in 3.5% NaCl with and without 0.1 M KI plus various additions of Ce(NO3)3 ranging from 1.0 to 7.0 × 10⁻³ M. These results are presented in Figure A1.
Figure A1. Weight loss-time curves for the corrosion of C-Steel in 3.5% NaCl solution either in the presence or absence of different concentrations of Ce(NO3)3 and KI at room temperature at pH of 2.5.
Metals 13 01553 g0a1
The data in black in Figure A1 represents the baseline performance for weight loss in 3.5% NaCl at pH 2.5. It can be seen that for all Ce(NO3)3 concentrations at all immersion times, the weight loss is greater than that measured for the NaCl solution alone. Moreover, the level of weight loss increases with increasing Ce(NO3)3 concentration.
The addition of KI improves the situation. The baseline for performance for the comparison of mixtures of KI and Ce(NO3)3 in Figure A1 is KI alone (olive green) in a 3.5% NaCl solution, which shows the lowest weight loss. By comparison, it can be seen that for pH 2.5 at all Ce(NO3)3 concentrations and at all immersion times, the weight loss is greater than the baseline performance. Moreover, decreasing the Ce(NO3)3 concentration moves the performance towards that of KI alone, which provides the lowest weight loss in this time range, indicating that the addition of Ce(NO3)3 cannot improve the short-term weight loss. On the other hand, for times over 500 min, the weight loss of the combination is lower than in NaCl alone, indicating an improvement in inhibitor performance but not as good as KI alone. At longer times, the combined KI with Ce(NO3)3 solutions appear to converge, suggesting that at longer times, mixed inhibitor combinations may be better than KI alone, as seen in the PDP data, where synergy is observed at 24 h.

Appendix A.2. EDS Area Measurements of Individual Sites by Classification

In this appendix, individual EDS analyses for different features are presented. These analyses are based on spectra collected from each feature and are not point analyses. Thus, they represent some level of averaging compared to point analyses.
Table A1. Examples Compositional Analyses of the different types of surace features in Atomic percent.
Feature TypeFeOCICeClS
Matrix92.60 (S2)1.512.19--0.02-
83.5 (S3)3.012.7----
83.3 (S4)3.212.7----
61.3 (S6)17.119.2-1.90.090.05
55.4 (S7)18.822.7-2.6--
69.7 (S8)9.719.1-0.92--
76.0 (S9)4.518.00.010.16-0.05
73.8 (S10)12.413.20.020.030.08-
76.9 (S11)13.48.40.050.220.2-
54.7 (S12)3.412.5----
Surface Particulates 78.6 (S2)20.242.70 0.06-
67.1 (S4)11.4520.3--0.06-
32.8 (S7)40.018.7-8.00.210.15
25.6 (S7)43.019.7-10.80.540.20
37.9 (S9)39.721.40.010.870.08-
42.8 (S11)35.46.50.549.94.080.12
Flaky31.2 (S6)54.512.4-1.50.110.04
35.9 (S7)49.912.6-1.20.21-
32.7 (S10)47.013.4-5.40.14-
41.9 (S11)49.55.00.230.193.0-
39.9 (S12)50.69.1--0.40-
38.0 (S12)50.59.5--0-
34.7 (S12)49.211.6-4.30.2-
Mud Crack32.6 (S6)50.53144.9-1.7-0.03
24.8 (S7)50.4620.40.03.80.210.02
39.9 (S8)50.5311.4----
76.0 (S9)4.4818.10.010.16--
34.3 (S10)52.965.10.050.59--
53.7 (S11)39.3312.20.10.120.63-
Surface Growths34.6 (6)46.2116.2-2.20.410.03
36.3 (6fi) *45.515.6-0.951.30.02
37.6 (S7)50.9810.8-0.28--
34.3 (S8)50.014.3-0.660.47-
37.8 (S9)39.521.30.010.870.08-
53.2 (S10)34.6511.50.120.371.9-
53.2 (S11)40.255.10.020.460.19-
38.0 (S12)50.539.5--0.385-
Particles Embedded18.4 (S6)53.5918.10.019.60.210.1
29.4 (S8)44.921.5-3.70.210.0
26.5 (S10)51.8418.70.541.40.9-
34.7 (S12)49.2211.6-4.30.20-
S7-dtmap
* fi-filiform.

References

  1. Montemor, M.F.; Ferreira, M.G.S. A Review on the Use of Nanostructures and Functional Organosilane Coatings Modified with Corrosion Inhibitors as Environmentally Friendly Pre-Treatments for Metallic Substrates. In Self-Healing Properties of New Surface Treatments (EFC 58); European Federation of Corrosion Series; The Institute of Materials, Minerals and Mining: London, UK, 2011; Volume 58. [Google Scholar]
  2. Montemor, M.F. Fostering green inhibitors for corrosion prevention. In Springer Series in Materials Science; Springer: Dordrecht, The Netherlands, 2016; Volume 233, pp. 107–137. [Google Scholar] [CrossRef]
  3. Forsyth, M.; Seter, M.; Hinton, B.; Deacon, G.; Junk, P. New ‘Green’ Corrosion Inhibitors Based on Rare Earth Compounds. Aust. J. Chem. 2011, 64, 812–819. [Google Scholar] [CrossRef]
  4. Forsyth, M.; Wilson, K.; Behrsing, T.; Forsyth, C.; Deacon, G.B.; Phanasgoankar, A. Effectiveness of rare-earth metal compounds as corrosion inhibitors for steel. Corrosion 2002, 58, 953–960. [Google Scholar] [CrossRef]
  5. Seumo Tchekwagep, P.M.; Aksaray, G.; Farsak, M.; Kardaş, G. Surface modification of mild steel using 4-carboxyphenyl diazonium in sulfuric and hydrochloric acids. A corrosion study. RSC Adv. 2023, 13, 16789–16796. [Google Scholar] [CrossRef] [PubMed]
  6. El-Hashemy, M.A.; Sallam, A. The inhibitive action of Calendula officinalis flower heads extract for mild steel corrosion in 1 M HCl solution. J. Mater. Res. Technol. 2020, 9, 13509–13523. [Google Scholar] [CrossRef]
  7. Fouda, A.S.; Mostafa, H.A.; Elewady, G.Y.; El-Hashemy, M.A. Low molecular weight straight-chain diamines as corrosion inhibitors for SS type 304 in HCl solution. Chem. Eng. Commun. 2008, 195, 934–947. [Google Scholar] [CrossRef]
  8. Sax, N.I. Dangerous Properties of Industrial Materials, 5th ed.; Van Nostrand Reinhold Company: New York, NY, USA, 1979. [Google Scholar]
  9. Buchheit, R.G.; Hughes, A.E. Chromate and Chromate-Free Coatings. In Corrosion: Fundamentals, Testing and Protection; Moosbrugger, C., Cramer, D., Covino, B.S.J., Eds.; ASM Handbook; ASM International: Materials Park, OH, USA, 2003; Volume 13A, pp. 720–735. [Google Scholar]
  10. Gad, S.M.; Emad, S.; Zhou, X.; Lyon, S.B.; Jin, Z.; Dagwa, I.M. Effectiveness of strontium zinc phosphosilicate on the corrosion protection of AA2198-T851 aluminium alloy in sodium chloride solution. Corros. Sci. 2022, 209, 110725. [Google Scholar] [CrossRef]
  11. El-Hashemy, M.A.; Hughes, A.E.; Gengenbach, T.; Glenn, A.M.; Cole, I.S. Combined influence of Ce(III) and iodide ions for corrosion protection of AA 2024-T3 in acidic to neutral chloride-rich environments: Electrochemical and surface characterization studies. J. Rare Earths 2023, 41, 309–320. [Google Scholar] [CrossRef]
  12. Mishra, A.K.; Balasubramaniam, R. Corrosion inhibition of aluminium by rare earth chlorides. Mater. Chem. Phys. 2007, 103, 385–393. [Google Scholar] [CrossRef]
  13. Aballe, A.; Bethencourt, M.; Botana, F.J.; Marcos, M. CeCl3 and LaCl3 binary solutions as environment-friendly corrosion inhibitors of AA5083 Al-Mg alloy in NaCl solutions. J. Alloys Compd. 2001, 323, 855–858. [Google Scholar] [CrossRef]
  14. Arab, S.T.; Al-Turkustani, A.M.; Al-Dhahiri, R.H. Synergistic effect of Azadirachta Indica extract and iodide ions on the corrosion inhibition of aluminium in acid media. J. Korean Chem. Soc. 2008, 52, 281–294. [Google Scholar] [CrossRef]
  15. Bouklah, M.; Hammouti, B.; Aouniti, A.; Benkaddour, M.; Bouyanzer, A. Synergistic effect of iodide ions on the corrosion inhibition of steel in 0.5 M H2SO4 by new chalcone derivatives. Appl. Surf. Sci. 2006, 252, 6236–6242. [Google Scholar] [CrossRef]
  16. Jeyaprabha, C.; Sathiyanarayanan, S.; Venkatachari, G. Influence of halide ions on the adsorption of diphenylamine on iron in 0.5 M H2SO4 solutions. Electrochim. Acta 2006, 51, 4080–4088. [Google Scholar] [CrossRef]
  17. Larabi, L.; Harek, Y.; Traisnel, M.; Mansri, A. Synergistic influence of poly(4-vinylpyridine) and potassium iodide on inhibition of corrosion of mild steel in 1M HCl. J. Appl. Electrochem. 2004, 34, 833–839. [Google Scholar] [CrossRef]
  18. Obot, I.B.; Obi-Egbedi, N.O.; Umoren, S.A. The synergistic inhibitive effect and some quantum chemical parameters of 2,3-diaminonaphthalene and iodide ions on the hydrochloric acid corrosion of aluminium. Corros. Sci. 2009, 51, 275–282. [Google Scholar] [CrossRef]
  19. Okafor, P.C.; Zheng, Y. Synergistic inhibition behaviour of methylbenzyl quaternary imidazoline derivative and iodide ions on mild steel in H2SO4 solutions. Corros. Sci. 2009, 51, 850–859. [Google Scholar] [CrossRef]
  20. Rehim, S.S.A.; Hazzazi, O.A.; Amin, M.A.; Khaled, K.F. On the corrosion inhibition of low carbon steel in concentrated sulphuric acid solutions. Part I: Chemical and electrochemical (AC and DC) studies. Corros. Sci. 2008, 50, 2258–2271. [Google Scholar] [CrossRef]
  21. Momoh-Yahaya, H.; Eddy, N.O.; Oguzie, E.E. Inhibitive, adsorptive and thermodynamic study of hypoxanthine against the corrosion of aluminium and mild steel in sulphuric acid. J. Mater. Environ. Sci. 2014, 5, 237–244. [Google Scholar]
  22. Eyu, G.D.; Will, G.; Dekkers, W.; MacLeod, J. The Synergistic Effect of Iodide and Sodium Nitrite on the Corrosion Inhibition of Mild Steel in Bicarbonate-Chloride Solution. Materials 2016, 9, 868. [Google Scholar] [CrossRef]
  23. Bernal, S.; Botana, F.J.; Calvino, J.J.; Marcos, M.; Pérez-Omil, J.A.; Vidal, H. Lanthanide salts as alternative corrosion inhibitors. J. Alloys Compd. 1995, 225, 638–641. [Google Scholar] [CrossRef]
  24. Yasakau, K.A.; Zheludkevich, M.L.; Ferreira, M.G.S. Lanthanide salts as corrosion inhibitors for AA5083. Mechanism and efficiency of corrosion inhibition. J. Electrochem. Soc. 2008, 155, C169–C177. [Google Scholar] [CrossRef]
  25. Somers, A.E.; Hinton, B.R.W.; de Bruin-Dickason, C.; Deacon, G.B.; Junk, P.C.; Forsyth, M. New, environmentally friendly, rare earth carboxylate corrosion inhibitors for mild steel. Corros. Sci. 2018, 139, 430–437. [Google Scholar] [CrossRef]
  26. Dastgheib, A.; Mohammadzadeh Attar, M.; Zarebidaki, A. Evaluation of Corrosion Inhibition of Mild Steel in 3.5 wt% NaCl Solution by Cerium Nitrate. Met. Mater. Int. 2020, 26, 1634–1642. [Google Scholar] [CrossRef]
  27. Boudellioua, H.; Hamlaoui, Y.; Tifouti, L.; Pedraza, F. Effect of the temperature of cerium nitrate–NaCl solution on corrosion inhibition of mild steel. Mater. Corros. 2020, 71, 1300–1309. [Google Scholar] [CrossRef]
  28. Tian, F.; Han, B.; Liu, Y.; Yin, X.S.; Tang, Y.M.; Yang, W.Z. Corrosion inhibition of carbon steel by cerium citrate compound in NaCl medium. Corros. Prot. 2009, 30, 279–282. [Google Scholar]
  29. Al-Turkustani, A.M.; Arab, S.T.; Al-Dahiri, R.H. Effect of temperature on the performance of aloe extract and azadirachta indica extract in absence and presence of iodide ions on aluminum corrosion in hydrochloric acid. J. Mater. Environ. Sci. 2012, 3, 1163–1176. [Google Scholar]
  30. Ebenso, E.E.; Alemu, H.; Umoren, S.A.; Obot, I.B. Inhibition of mild steel corrosion in sulphuric acid using alizarin yellow GG dye and synergistic iodide additive. Int. J. Electrochem. Sci. 2008, 3, 1325–1339. [Google Scholar] [CrossRef]
  31. Murmu, M.; Saha, S.K.; Murmu, N.C.; Banerjee, P. Chapter 14—Nitrate as corrosion inhibitor. In Inorganic Anticorrosive Materials; Verma, C., Aslam, J., Hussain, C.M., Eds.; Elsevier: Amsterdam, The Netherlands, 2022; pp. 269–296. [Google Scholar]
  32. Feng, X.; Tang, Y.; Zhao, X.; Zuo, Y. The influence of Ce(NO3)3·6H2O on the inhibitive effect of Ca(NO2)2 in simulated concrete pore solution. J. Wuhan Univ. Technol.-Mater. Sci. Ed. 2012, 27, 994–998. [Google Scholar] [CrossRef]
  33. Hughes, A.E.; Haque, N.; Northey, S.A.; Giddey, S. Platinum group metals: A review of resources, production, and usage with a focus on catalysts. Resources 2021, 10, 93. [Google Scholar] [CrossRef]
  34. Margalef-Marti, R.; Carrey, R.; Benito, J.A.; Marti, V.; Soler, A.; Otero, N. Nitrate and nitrite reduction by ferrous iron minerals in polluted groundwater: Isotopic characterization of batch experiments. Chem. Geol. 2020, 548, 119691. [Google Scholar] [CrossRef]
  35. Wen, C.; Tian, Y.W.; Yang, D.Y.; Wang, G.; Deng, P.C.; Dong, C.F. Controlled release mechanism and inhibition performance of smart inhibitor LDH-NO2 in the reinforced concrete structures. Gongcheng Kexue Xuebao/Chin. J. Eng. 2022, 44, 1368–1378. [Google Scholar] [CrossRef]
  36. Ryu, H.-S.; Singh, J.K.; Lee, H.-S.; Ismail, M.A.; Park, W.-J. Effect of LiNO2 inhibitor on corrosion characteristics of steel rebar in saturated Ca(OH)2 solution containing NaCl: An electrochemical study. Constr. Build. Mater. 2017, 133, 387–396. [Google Scholar] [CrossRef]
  37. Shyu, J.Z.; Otto, K.; Watkins, W.L.H.; Graham, G.W.; Belitz, R.K.; Gandhi, H.S. Characterization of Pd/γ-alumina catalysts containing ceria. J. Catal. 1988, 114, 23–33. [Google Scholar] [CrossRef]
  38. Grosvenor, A.P.; Kobe, B.A.; Biesinger, M.C.; McIntyre, N.S. Investigation of multiplet splitting of Fe 2p XPS spectra and bonding in iron compounds. Surf. Interface Anal. 2004, 36, 1564–1574. [Google Scholar] [CrossRef]
  39. Biesinger, M.C.; Brown, C.; Mycroft, J.R.; Davidson, R.D.; McIntyre, N.S. X-ray photoelectron spectroscopy studies of chromium compounds. Surf. Interface Anal. 2004, 36, 1550–1563. [Google Scholar] [CrossRef]
  40. Gouda, V.K.; Sayed, S.M. Corrosion behaviour of steel in stagnant salt solutions. Br. Corros. J. 1973, 8, 71–75. [Google Scholar] [CrossRef]
  41. Moghaddam, P.N.; Amini, R.; Kardar, P.; Ramezanzadeh, B. Synergistic corrosion inhibition effects of the non-hazardous cerium nitrate and tannic acid polyphenolic molecules on the surface of mild-steel in chloride-containing solution: Detailed surface and electrochemical explorations. J. Mol. Liq. 2021, 322, 114510. [Google Scholar] [CrossRef]
  42. Hinton, B.R.W. Corrosion Inhibition with Rare-Earth-Metal Salts. J. Alloys Compd. 1992, 180, 15–25. [Google Scholar] [CrossRef]
  43. Ivušić, F.; Lahodny-Šarc, O.; Ćurković, H.O.; Alar, V. Synergistic inhibition of carbon steel corrosion in seawater by cerium chloride and sodium gluconate. Corros. Sci. 2015, 98, 88–97. [Google Scholar] [CrossRef]
  44. Tran, M.; Dubot, P.; Sutter, E.M.M. Activation of water reduction in the presence of REM salts in aqueous solution. Int. J. Hydrogen Energy 2008, 33, 937–944. [Google Scholar] [CrossRef]
  45. Lin, P.; Yang, X.; Werner, J.M.; Honaker, R.Q. Application of Eh-pH Diagrams on Acid Leaching Systems for the Recovery of REEs from Bastnaesite, Monazite and Xenotime. Metals 2021, 11, 734. [Google Scholar] [CrossRef]
  46. Khaled, K.F.; Ebenso, E. Cerium salt as green corrosion inhibitor for steel in acid medium. Res. Chem. Intermed. 2015, 41, 49–62. [Google Scholar] [CrossRef]
  47. Wang, X.; Liu, F.; Tan, W.; Feng, X.; Koopal, L.K. Transformation of hydroxycarbonate green rust into crystalline iron (hydr)oxides: Influences of reaction conditions and underlying mechanisms. Chem. Geol. 2013, 351, 57–65. [Google Scholar] [CrossRef]
  48. Inoue, K.; Kwon, S.K.; Kimijima, K.; Kanie, K.; Muramatsu, A.; Shinoda, K.; Suzuki, S.; Waseda, Y. Analysis of iron oxyhydroxides and oxides converted from green rust in aqueous solution. ISIJ Int. 2007, 47, 453–457. [Google Scholar] [CrossRef]
  49. Inoue, K.; Shinoda, K.; Saito, M.; Suzuki, S.; Waseda, Y. Atomic-scale structure and morphology of γ-FeOOH particles formed during corrosion of Fe-based alloys in aqueous solution. E-J. Surf. Sci. Nanotechnol. 2008, 49–53. [Google Scholar]
  50. Suzuki, S. Characterization of Formation of Ferrous and Ferric Oxides in Aqueous Solution from a Multidisciplinary Viewpoint. ISIJ Int. 2022, 62, 800–810. [Google Scholar] [CrossRef]
  51. Glotch, T.D.; Kraft, M.D. Thermal transformations of akaganéite and lepidocrocite to hematite: Assessment of possible precursors to Martian crystalline hematite. Phys. Chem. Miner. 2008, 35, 569–581. [Google Scholar] [CrossRef]
  52. Easton, C.D.; Kinnear, C.; McArthur, S.L.; Gengenbach, T.R. Practical guides for X-ray photoelectron spectroscopy: Analysis of polymers. J. Vac. Sci. Technol. A Vac. Surf. Film. 2020, 38, 023207. [Google Scholar] [CrossRef]
  53. Shchukarev, A.V.; Korolkov, D.V. XPS study of group IA carbonates. Cent. Eur. J. Chem. 2004, 2, 347–362. [Google Scholar] [CrossRef]
  54. Bruce, L.A.; Hoang, M.; Hughes, A.E.; Turner, T.W. Surface area control during the synthesis and reduction of high area ceria catalyst supports. Appl. Catal. A-Gen. 1996, 134, 351–362. [Google Scholar] [CrossRef]
  55. Bouchaud, B.; Balmain, J.; Bonnet, G.; Pedraza, F. PH-distribution of cerium species in aqueous systems. J. Rare Earths 2012, 30, 559–562. [Google Scholar] [CrossRef]
  56. Forsyth, M.; Forsyth, C.M.; Wilson, K.; Behrsing, T.; Deacon, G.B. ATR characterisation of synergistic corrosion inhibition of mild steel surfaces by cerium salicylate. Corros. Sci. 2002, 44, 2651–2656. [Google Scholar] [CrossRef]
  57. Karimian, N.; Burton, E.D.; Johnston, S.G.; Hockmann, K.; Choppala, G. Humic acid impacts antimony partitioning and speciation during iron(II)-induced ferrihydrite transformation. Sci. Total Environ. 2019, 683, 399–410. [Google Scholar] [CrossRef] [PubMed]
  58. Wren, J.C.; Glowa, G.A.; Merritt, J. Corrosion of stainless steel by gaseous I2. J. Nucl. Mater. 1999, 265, 161–177. [Google Scholar] [CrossRef]
  59. Wang, W.; Howe, J.Y.; Gu, B. Structure and Morphology Evolution of Hematite (α-Fe2O3) Nanoparticles in Forced Hydrolysis of Ferric Chloride. J. Phys. Chem. C 2008, 112, 9203–9208. [Google Scholar] [CrossRef]
  60. Pourbaix, M. Atlas of Electrochemical Equilibria in Aqueous Solutions; NACE and Cebelcor: Houston, TX, USA, 1974. [Google Scholar]
  61. Xu, H.; Lee, S.; Xu, H. Luogufengite: A new nano-mineral of Fe2O3 polymorph with giant coercive field. Am. Mineral. 2017, 102, 711–719. [Google Scholar] [CrossRef]
  62. McClean, R.G.; Schofield, M.A.; Kean, W.F.; Sommer, C.V.; Robertson, D.P.; Toth, D.; Gajdardziska-Josifovska, M. Botanical iron minerals: Correlation between nanocrystal structure and modes of biological self-assembly. Eur. J. Mineral. 2001, 13, 1235–1242. [Google Scholar] [CrossRef]
  63. Misawa, T.; Hashimoto, K.; Shimodaira, S. The mechanism of formation of iron oxide and oxyhydroxides in aqueous solutions at room temperature. Corros. Sci. 1974, 14, 131–149. [Google Scholar] [CrossRef]
  64. Lide, D.R. (Ed.) CRC Handbook of Chemistry and Physics, 71st ed.; CRC Press: Boston, MA, USA, 1990. [Google Scholar]
Figure 1. (a) Ce 3d spectral region (green) and Fe Auger lines (red). The v”’ peak indactes the presence of Ce(IV). (b) Example of fitting of the Fe 2p3/2 peak with multiplets for Fe2O3, Fe3O4 and FeOOH after Beisinger et al. [39].
Metals 13 01553 g001
Figure 2. Polarization curves for the dissolution of carbon steel in 3.5% NaCl solution adjusted to pH = 7, in the absence and presence of different concentrations of Ce(NO3)3 at room temperature.
Metals 13 01553 g002
Figure 3. Effect of concentration of Ce(NO3)3 on the inhibition percentage (%) for corrosion of C-steel in neutral 3.5% NaCl solution (pH = 7).
Metals 13 01553 g003
Figure 4. Polarization curves showing the effect of pH on the dissolution of C-steel in 3.5% NaCl solution in presence of 1 × 10⁻³ M and 7 × 10⁻³ M Ce(NO3)3. (a) pH 8, (b) pH 7, (c) pH 4, and (d) pH 2.5.
Metals 13 01553 g004
Figure 5. Effect of pH on the inhibition efficiency percentage (IE%) of (a) 0.1 M KI, (b) 1 × 10⁻³ M and 7 × 10⁻³ M Ce(NO3)3 and (c) 1 × 10⁻³ M and 7 × 10⁻³ M Ce(NO3)3 both with 0.1 M KI for corrosion of C-Steel in 3.5% NaCl solution at room temperature.
Metals 13 01553 g005
Figure 6. Low-magnification secondary electron emission micrographs of typical features developed on the surfaces of specimens after 24 h exposure to the various electrolytes containing the specified inhibitors. Each Row is a different pH, which is indicated by the number. To provide some insight into typical features, the matrix and corrosion products are labeled “M” and “CP”, respectively.
Metals 13 01553 g006
Figure 7. Images of different kinds of surface features that have been classified into embedded (color coded orange) and free precipitate (color coded green)—see text. (a) spherical polycrystalline features were observed in KI at all pH values. In 7 × 10⁻³ M Ce, there were (b) particles embedded into a solidified gel on the surface and (c) free particles. For 0.1 M KI + 7 × 10⁻³ M Ce, there were a range of particles, including (d) flaky particles emanating from, (e) solid particles embedded into a solidified gel on the surface, and (f) solid free particles, as well as (g) small spherical polycrystalline particles (at pH 2.5). (h) example of disbondment between embedded particles and solidified gel. (i) A third type of growth observed where cerium ions were present at some level was an adherent parallel plate-like structure.
Metals 13 01553 g007
Figure 8. SEM and EDS analyses of corrosion products on the surface of mild steel after exposure to Ce+I -electrolyte (0.1 M KI + 7 × 10⁻³ M Ce(NO3)3) at pH 4 for 24 h. Central image is a composite of an SE image with superimposed O, Cl, Ce, and I elemental maps, with the color code highlighted in the image. There are four images of areas of interest, with positions indicated by the white dashed rectangles. The numbered dashed circles indicate where spectra have been collected and are presented below.
Metals 13 01553 g008
Figure 9. (a) EDS spectra and (b) scatter plot analysis of the map collected from mild steel after exposure to 0.1 M KI + 7 × 10⁻³ M Ce(NO3)3 at pH 4 for 24 h, as depicted in Figure 8a. The numbers associated with each spectrum are depicted in Figure 8 and only the highest intensity line for each element in each series is labeled. (b) Fe-O, Ce-O, and Fe-Ce scatter plots using a magma color scheme to highlight where the greatest number of points fall and the corresponding points in blue for each spectrum.
Metals 13 01553 g009
Figure 10. X-ray diffractograms collected from the surfaces of samples exposed to various electrolytes at pH 4. These patterns show the major lines of species observed for all samples, although the ratio of species varied with the pH of the electrolytes. Species included Fe metal (*), Lepidocrocite (∆) and Akaganeite (ꚛ). All peaks between 0 and 70° apart from the metal reflections are combinations of the two iron oxy-hydroxides.
Metals 13 01553 g010
Figure 11. XPS spectra for (a) Background subtracted Fe 2p3/2 spectrum with fitted components including Fe2O3—green, Fe3O4—blue, and FeOOH—pink. Multiplet structure for each oxide has been added together to produce one peak). The Shirley background has been removed to isolate the peak shape. The inset shows the original spectrum. (b) C 1 s with fitted components as labeled.
Metals 13 01553 g011
Figure 12. Percentage of FeOOH, Fe3O4, and Fe2O3 for the electrolytes: (a) iodide-electrolyte, (b) cerium-electrolyte, and (c) iodide and cerium electrolyte. Data is presented in pairs of colored bars, representing duplicates. The different colors codes indicate the different pH (2.5, 4, 7, 8). Color codes are the same across (ac).
Metals 13 01553 g012
Figure 13. XPS analyses (at. %) for samples exposed to either 0.1 M I-electrolyte, 7 × 10⁻³ M Ce-electrolyte, or Ce+I electrolyte for 24 h. (a) O/Fe, (b) Ce/Fe, (c) Cl/Fe, and (d) I/Fe.
Metals 13 01553 g013
Figure 14. Normalized atomic percent for Fe, Ce, I, and CO32− as a function of pH for the electrolytes containing (a) I, (b), Ce, and (c) Ce plus I. Vertical yellow regions indicate CP, whereas the white ones are for metal.
Metals 13 01553 g014
Figure 15. Pathways for generation of protective layers and corrosion products for iron-containing species. Yellow arrows and “I” label indicate iodide-only electrolytes; green arrows and “Ce” label indicate Ce-only electrolytes; and blue arrows and “Ce+I” label are for electrolytes containing both Ce and I ions. Red-brown hatched outlines indicate precipitated products that can form either the protective layer, the corrosion product, or both, and the blue hatched outlines represent the solution species. This figure pertains to sites on the surface where Fe ions are generated, which are expected to be the anodes. At cathodic sites, there will be precipitation of Ce(III) compounds, which are largely expected to be Ce(OH)3.
Metals 13 01553 g015
Table 1. The effect of concentration of Ce(III) cation on the corrosion current density (icorr), the free corrosion potential (Ecorr), cathodic and anodic Tafel slopes (βa, βc) and inhibition percentage (IE%) of mild steel in neutral 3.5% NaCl solution at 25 °C.
Ce(NO3)3
Moles
icorr
μA
Ecorr
mV
βaβcΘIE%
02.30−420.3038.78−142.710.000.00
1 × 10−31.40−441.7352.18−142.240.3939.35
3 × 10−30.57−427.0634.11−80.810.7575.42
5 × 10−30.32−548.5239.87−59.610.8686.00
7 × 10−30.07−527.4624.12−87.120.9796.97
10 × 10−30.26−509.2124.77−126.080.8988.69
Table 2. Effect of pH on the corrosion current density (icorr), the free corrosion potential (Ecorr), Tafel slopes (βa, βc), inhibition percentage (IE%) for mild steel in 3.5% NaCl solution with and without addition of either 1 × 10⁻³ M or 7 × 10⁻³ M Ce(NO3)3 at 25 °C.
pHConcentrations
Ce(NO3)3 M
icorr
μA/cm2
Ecorr
mV
βa
mV/dec−1
βc
mV/dec−1
IE%
2.5010.44−669.3647.84−92.550.00
1 × 10−341.03−629.9629.08−93.98−292.79
403.62−446.9075.11−147.340.00
1 × 10−33.82−512.0030.93−37.57−5.31
702.30−420.3038.78−142.710.00
1 × 10−31.40−441.7352.18−142.2439.35
801.49−522.5137.58−99.860.00
1 × 10−30.53−750.9489.08−88.1064.29
2.5010.44−669.3647.84−92.550.00
7 × 10−36.94−552.5969.92−126.5133.56
403.62−446.9075.11−147.340.00
7 × 10−30.00−537.8139.73−85.8285.24
702.30−420.3038.78−142.710.00
7 × 10−30.07−527.4624.12−87.1296.97
801.49−522.5137.58−99.860.00
7 × 10−30.78−458.3613.25−104.0047.57
Table 3. Effect of addition of KI on the inhibition efficiency (%) of C-Steel in 3.5% NaCl solution at pH 2.5 and at various concentrations of Ce(NO3)3 at room temperature.
Solution CompositionsIE%
1 × 10⁻³ M Ce(NO3)3−292.79
1 × 10⁻³ M Ce(NO3)3 + 1 × 10⁻¹ M KI−37.67
5 × 10⁻³ M Ce(NO3)325.22
5 × 10⁻³ M Ce(NO3)3 + 1 × 10⁻¹ M KI59.24
7 × 10⁻³ M Ce(NO3)333.56
7 × 10⁻³ M Ce(NO3)3 + 1 × 10⁻¹ M KI84.60
1 × 10⁻¹ M KI73.68
Table 4. Effect of the presence of I in the Ce+I electrolyte on the free corrosion potential (Ecorr), corrosion current density (icorr), corrosion inhibition as a function of pH. Blank = 3.5% NaCl.
pHElectrolytesicorr
μA cm−2
Ecorr
mV
IE%S
2.5Blank (3.5% NaCl)10.440.00
7 × 10⁻³ M Ce(NO3)3 + 0.1 M KI1.61−487.7884.601.14
0.1 M KI2.75−559.6173.68
4Blank (3.5% NaCl)3.62−446.900.00
7 × 10⁻³ M Ce(NO3)3 + 0.1 M KI0.51−579.1985.840.74
0.1 M KI2.58−422.5128.67
7Blank (3.5% NaCl)2.30−420.300.00
7 × 10⁻³ M Ce(NO3)3 + 0.1 M KI0.19−524.8791.610.09
0.1 M KI0.58−389.9974.91
8Blank (3.5% NaCl)1.49−522.510.00
7 × 10⁻³ M Ce(NO3)3 + 0.1 M KI0.20−582.9486.605.10
0.1 M KI1.95−396.42−30.35
Table 5. Summary of X-ray Diffraction Data for various samples, including I (0.1 M KI), Ce (7 × 10⁻³ M Ce(NO3)3) and Ce+I (mixture of compounds).
SampleLepidocrocite
γ-FeOOH
Red-Reddish Brown
Akaganeite
β-FeOOH
Metallic-Brown
Goethite
α-FeOOH
Brownish Yellow to Orange-Yellow
Luogufengite
Fe2O3Rust-Red
MorphologyScales aggregated into rossettesRod like
KI
2.5Major Minor
4.0Major Minor
7.0Trace -
8.0Major Minor
Ce
2.5
4.0MajorTrace-Amorphous
7.0
8.0Major
Ce+I
2.5MajorMinor-Poorly Crystalline
4.0MajorMajor-Poorly Crystalline
7.0MinorMajor-Poorly Crystalline
8.0MinorMajor-Poorly Crystalline
Table 6. XPS elemental analyses in atomic percent for carbon steel exposed to 0.01 M NaCl containing various inhibitors including 0.1 M I, 7 × 10⁻³ M Ce and a mixture of both. CP = corrosion product and M = metal.
ElementpH 2.5pH 4pH 7pH 8
CPMCPMCPMCPM
I-Electrolyte
Fe35.8 ± 0.534.4 ± 1.336.0 ± 0.429.2 ± 0.530.5 ± 0.530.8 ± 0.531.5 ± 1.030.8 ± 0.7
I (×102)1.51 ± 0.414.0 ± 0.72.0 ± 1.06.5 ± 1.517.0 ± 0.927.0 ± 9.014.5 ± 7.57.5 ± 0.5
O51.8 ± 0.147.3 ± 1.952.3 ± 0.344.3 ± 0.342.0 ± 0.240.5 ± 0.146.9 ± 3.041.9 ± 0.1
C11.7 ± 0.617.5 ± 2.111.0 ± 0.123.4 ± 1.024.6 ± 0.326.6 ± 0.520.7 ± 4.526.2 ± 0.9
Cl0.33 ± 0.010.35 ± 0.100.22 ± 0.010.15 ± 0.150.09 ± 0.090.22 ± 0.040.26 ± 0.080.12 ± 0.05
Ce-electrolyte
Fe21.6 ± 2.521.8 ± 4.716.6 ± 0.28.5 ± 0.414.8 ± 0.610.1 ± 0.116.1 ± 1.010.7 ± 0.6
Ce3.0 ± 0.82.9 ± 0.45.4 ± 0.37.3 ± 0.14.1 ± 0.16.3 ± 0.14.6 ± 0.47.2 ± 0.2
O39.9 ± 1.139.7 ± 1.838.4 ± 0.236.7 ± 0.339.7 ± 0.138.4 ± 0.340.4 ± 1.340.4 ± 0.5
C34.8 ± 2.634.6 ± 6.039.1 ± 0.546.7 ± 0.140.6 ± 0.544.5 ± 0.338.5 ± 0.740.6 ± 0.7
Cl0.39 ± 0.040.62 ± 0.060.19 ± 0.020.34 ± 0.010.30 ± 0.010.46 ± 0.010.33 ± 0.100.61 ± 0.06
Ce+I electrolyte
Fe34.9 ± 1.231.0 ± 2.132.2 ± 0.928.8 ± 0.832.1 ± 1.422.3 ± 2.331.6 ± 1.831.3 ± 3.3
Ce-0.5 ± 0.6-0.4 ± 0.30.5 ± 0.5-0.04 ± 0.031.0 ± 1.9
I0.05 ± 0.010.25 ± 0.210.12 ± 0.030.16 ± 0.050.18 ± 0.100.16 ± 0.010.12 ± 0.020.08 ± 0.01
O50.4 ± 0.8644.4 ± 6.048.1 ± 1.348.6 ± 1.947.2 ± 2.040.2 ± 1.347.0 ± 0.847.3 ± 0.9
C13.9 ± 1.719.4 ± 4.418.6 ± 2.019.8 ± 2.618.8 ± 2.532.5 ± 2.720.0 ± 2.919.0 ± 1.5
Cl0.37 ± 0.170.27 ± 0.100.58 ± 0.140.33 ± 0.120.74 ± 0.340.29 ± 0.190.50 ± 0.080.42 ± 0.08
Disclaimer/Publisher’s Note: The statements, opinions and data contained in all publications are solely those of the individual author(s) and contributor(s) and not of MDPI and/or the editor(s). MDPI and/or the editor(s) disclaim responsibility for any injury to people or property resulting from any ideas, methods, instructions or products referred to in the content.

