
Nonnegligible Temperature Drop Induced by Thermocouple on Samples in Gleeble Tests


Abstract
:1. Introduction
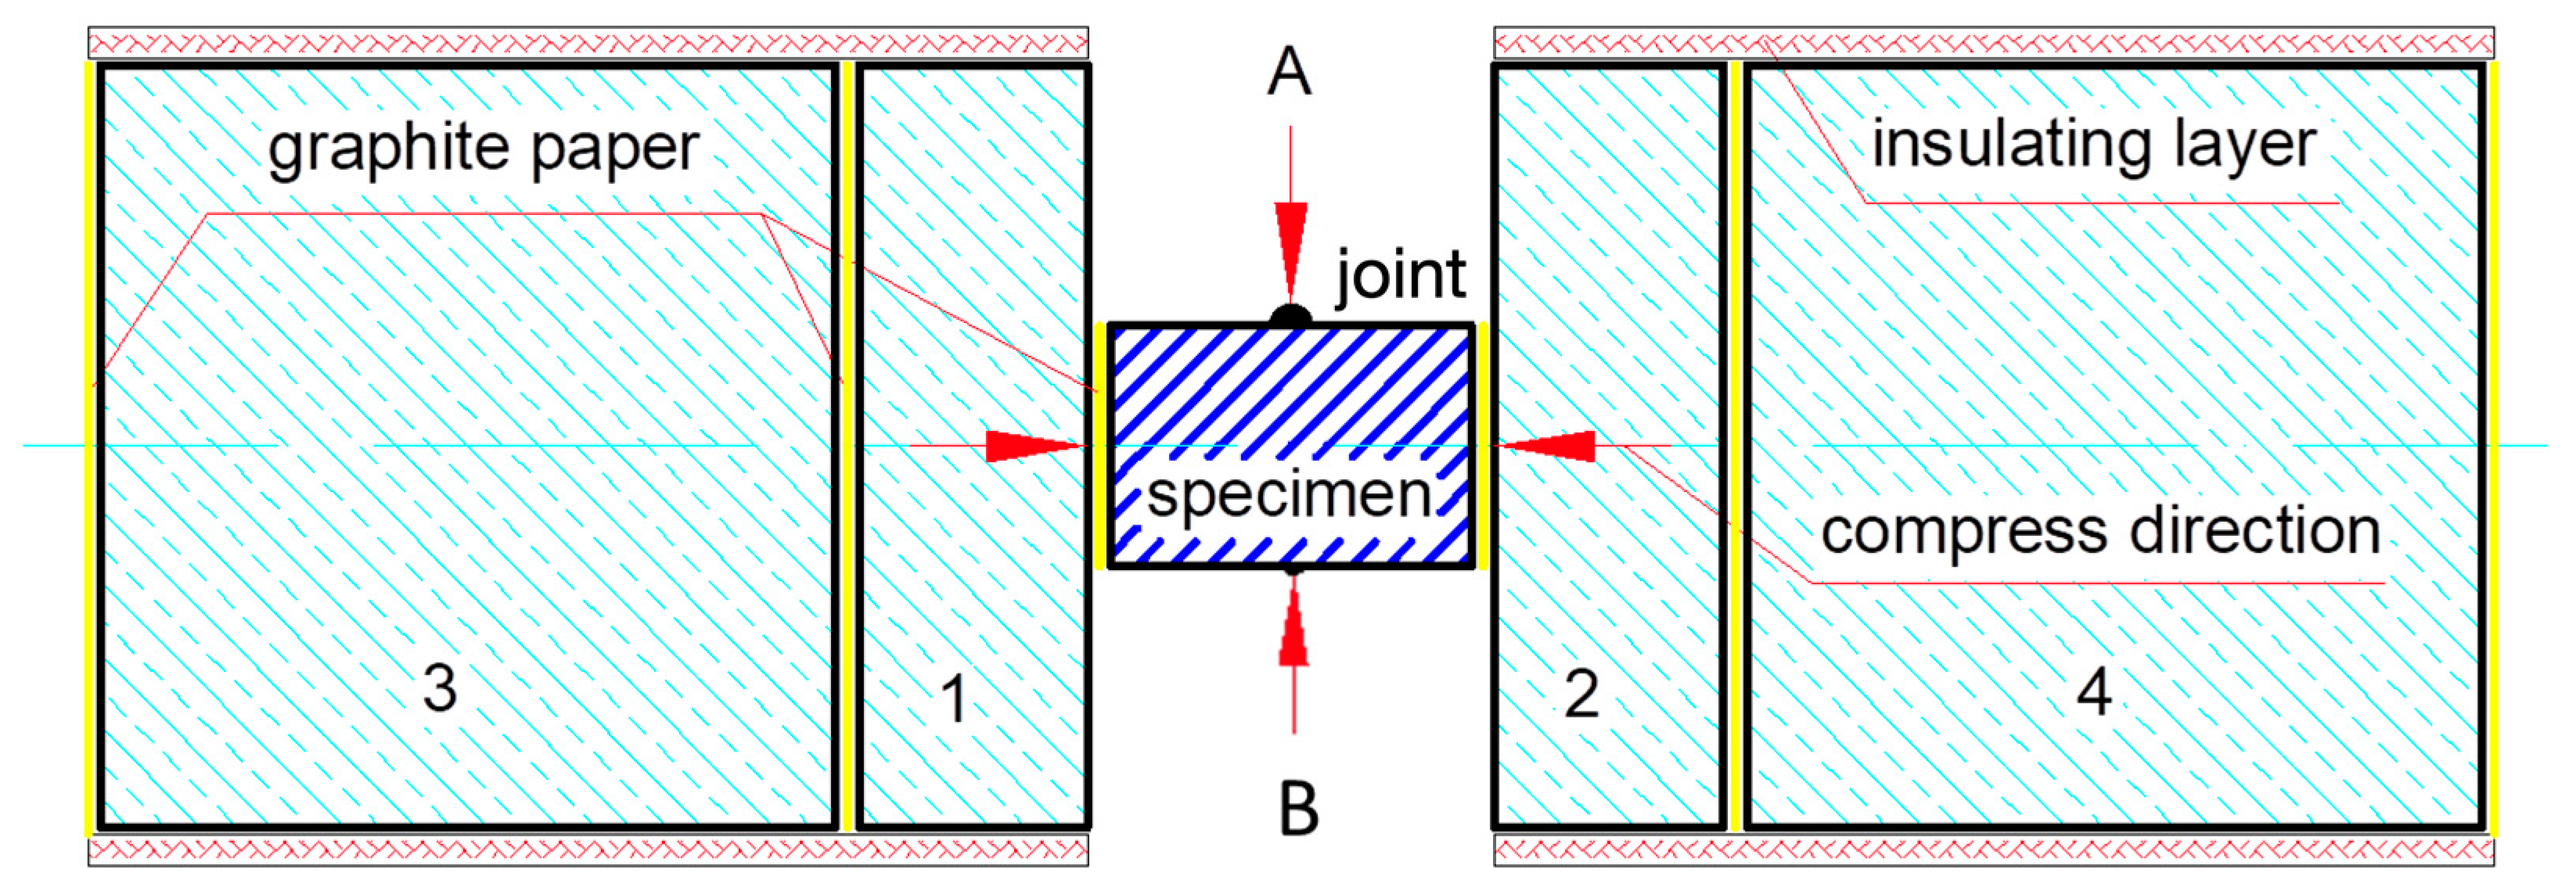
2. Method
3. Results and Discussion
3.1. Effect of Thermocouples on the Temperature Field of a Sample
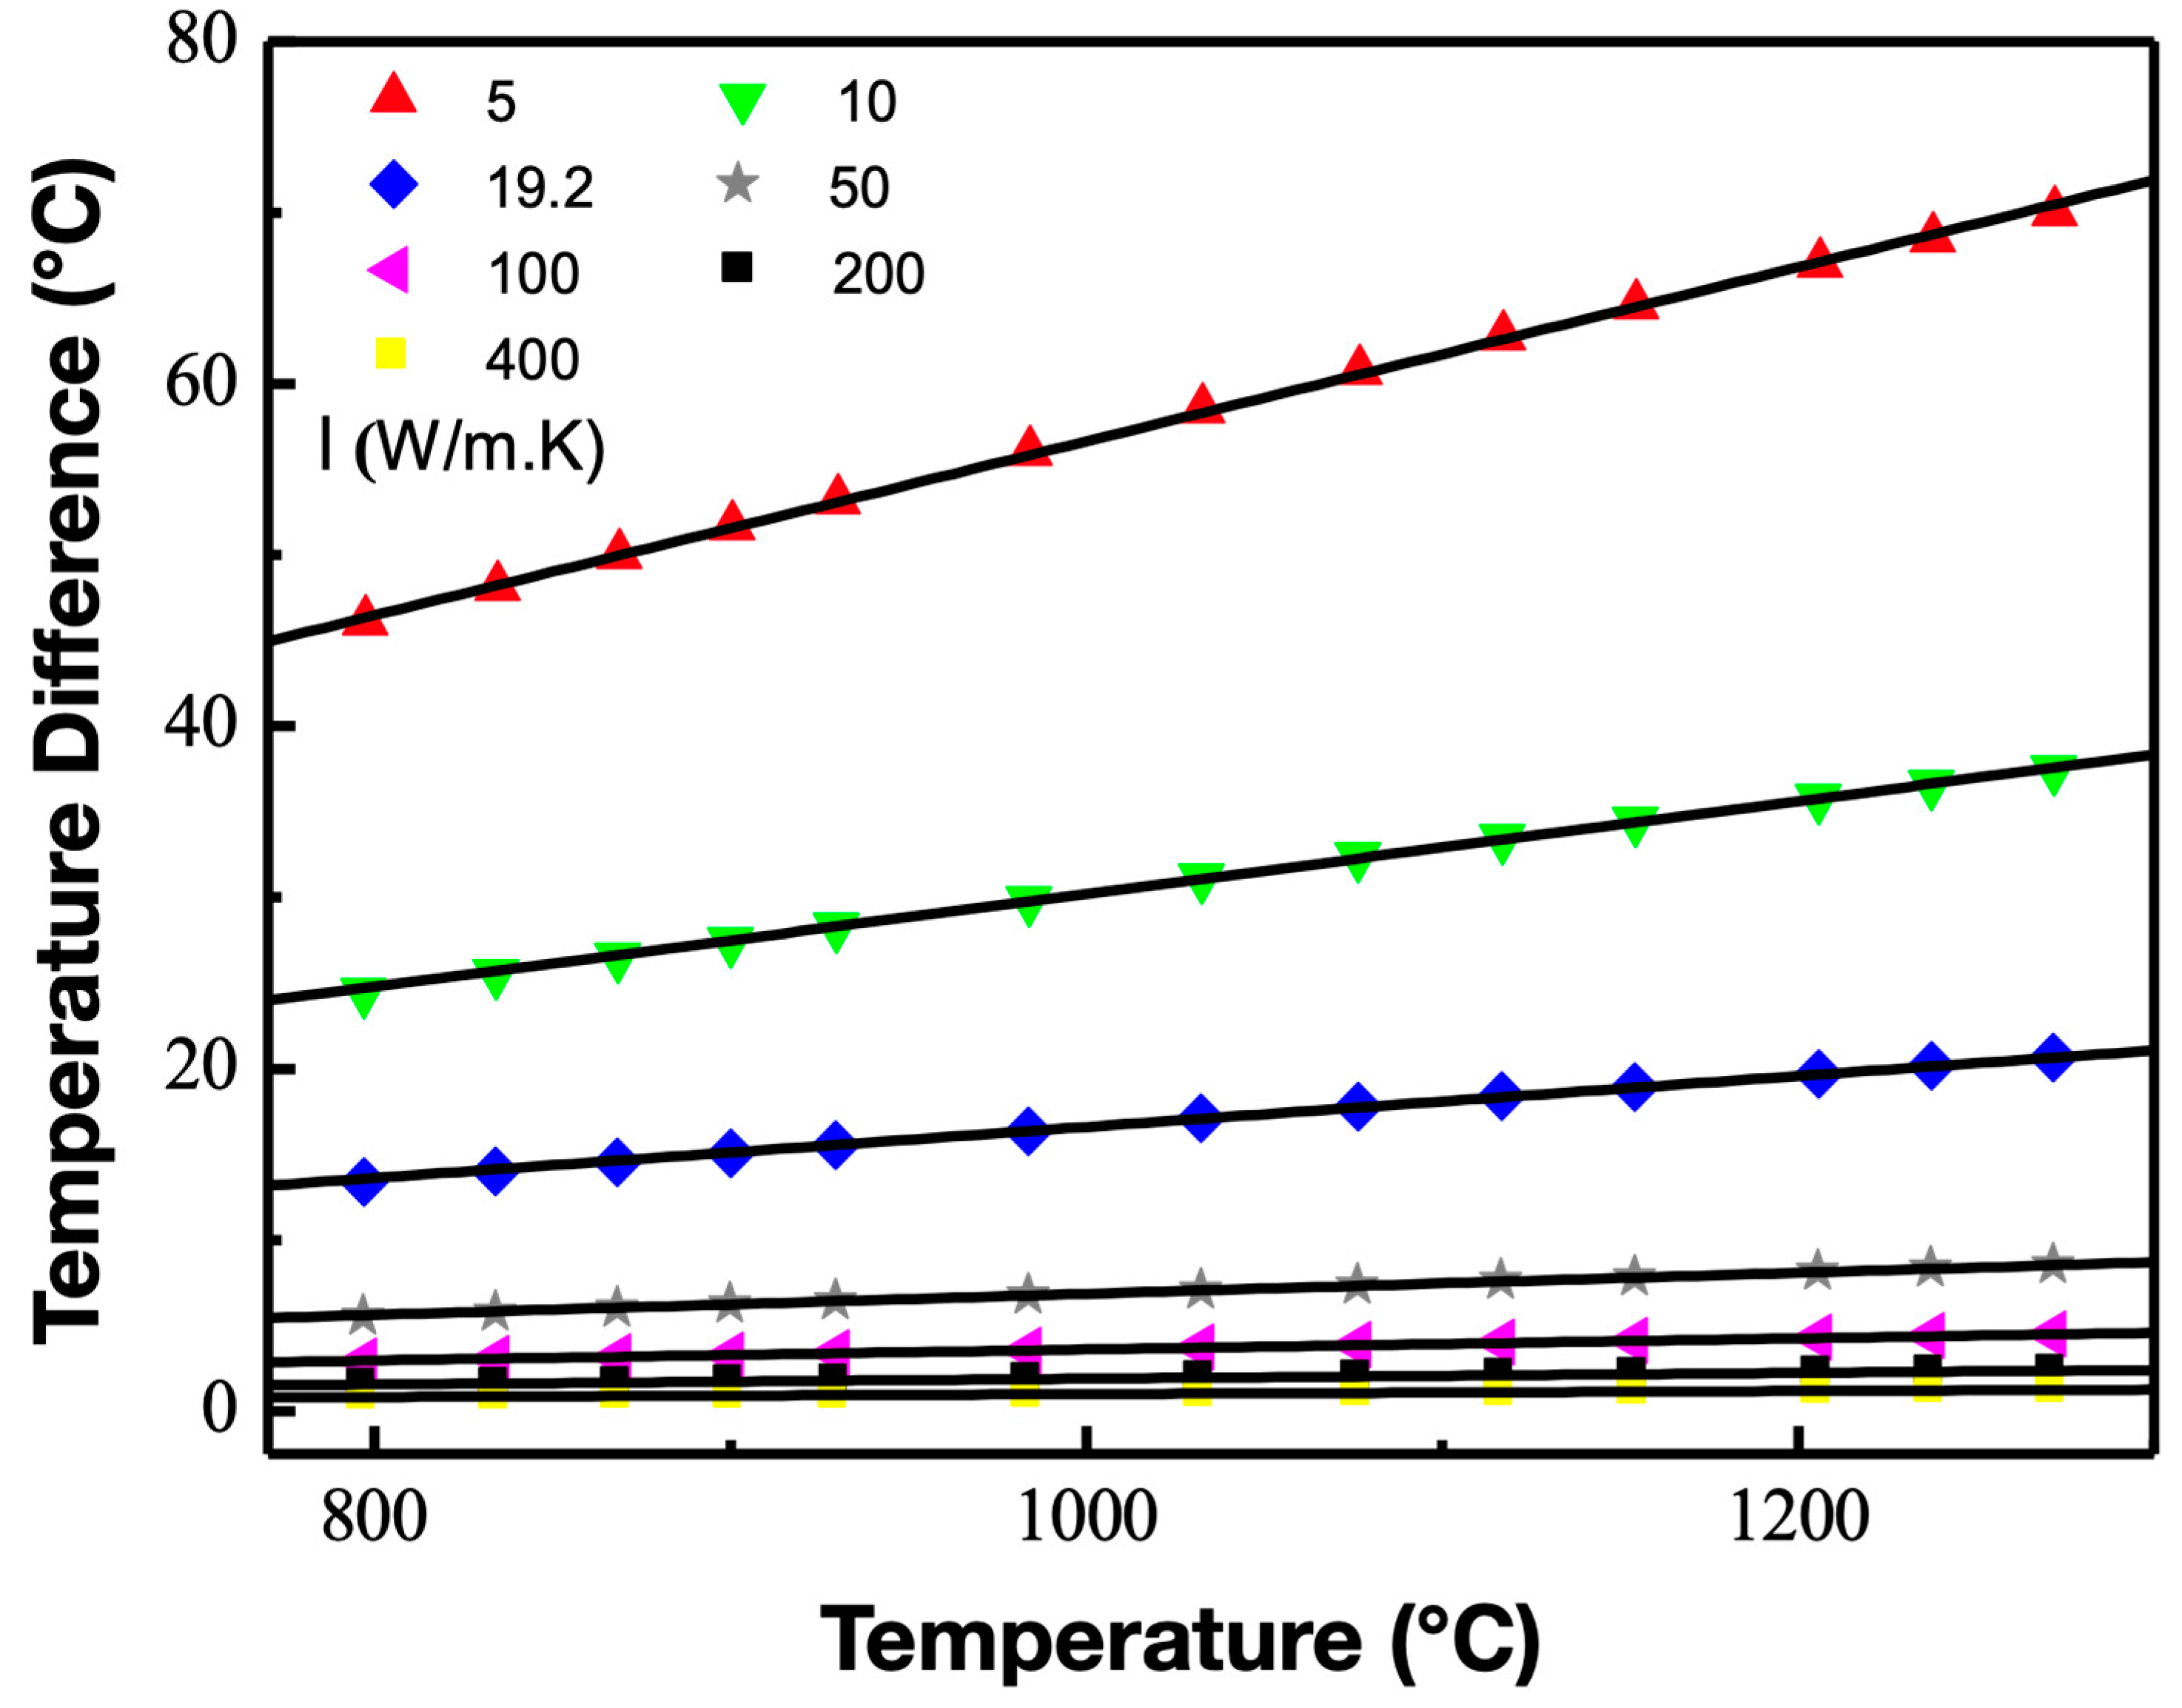
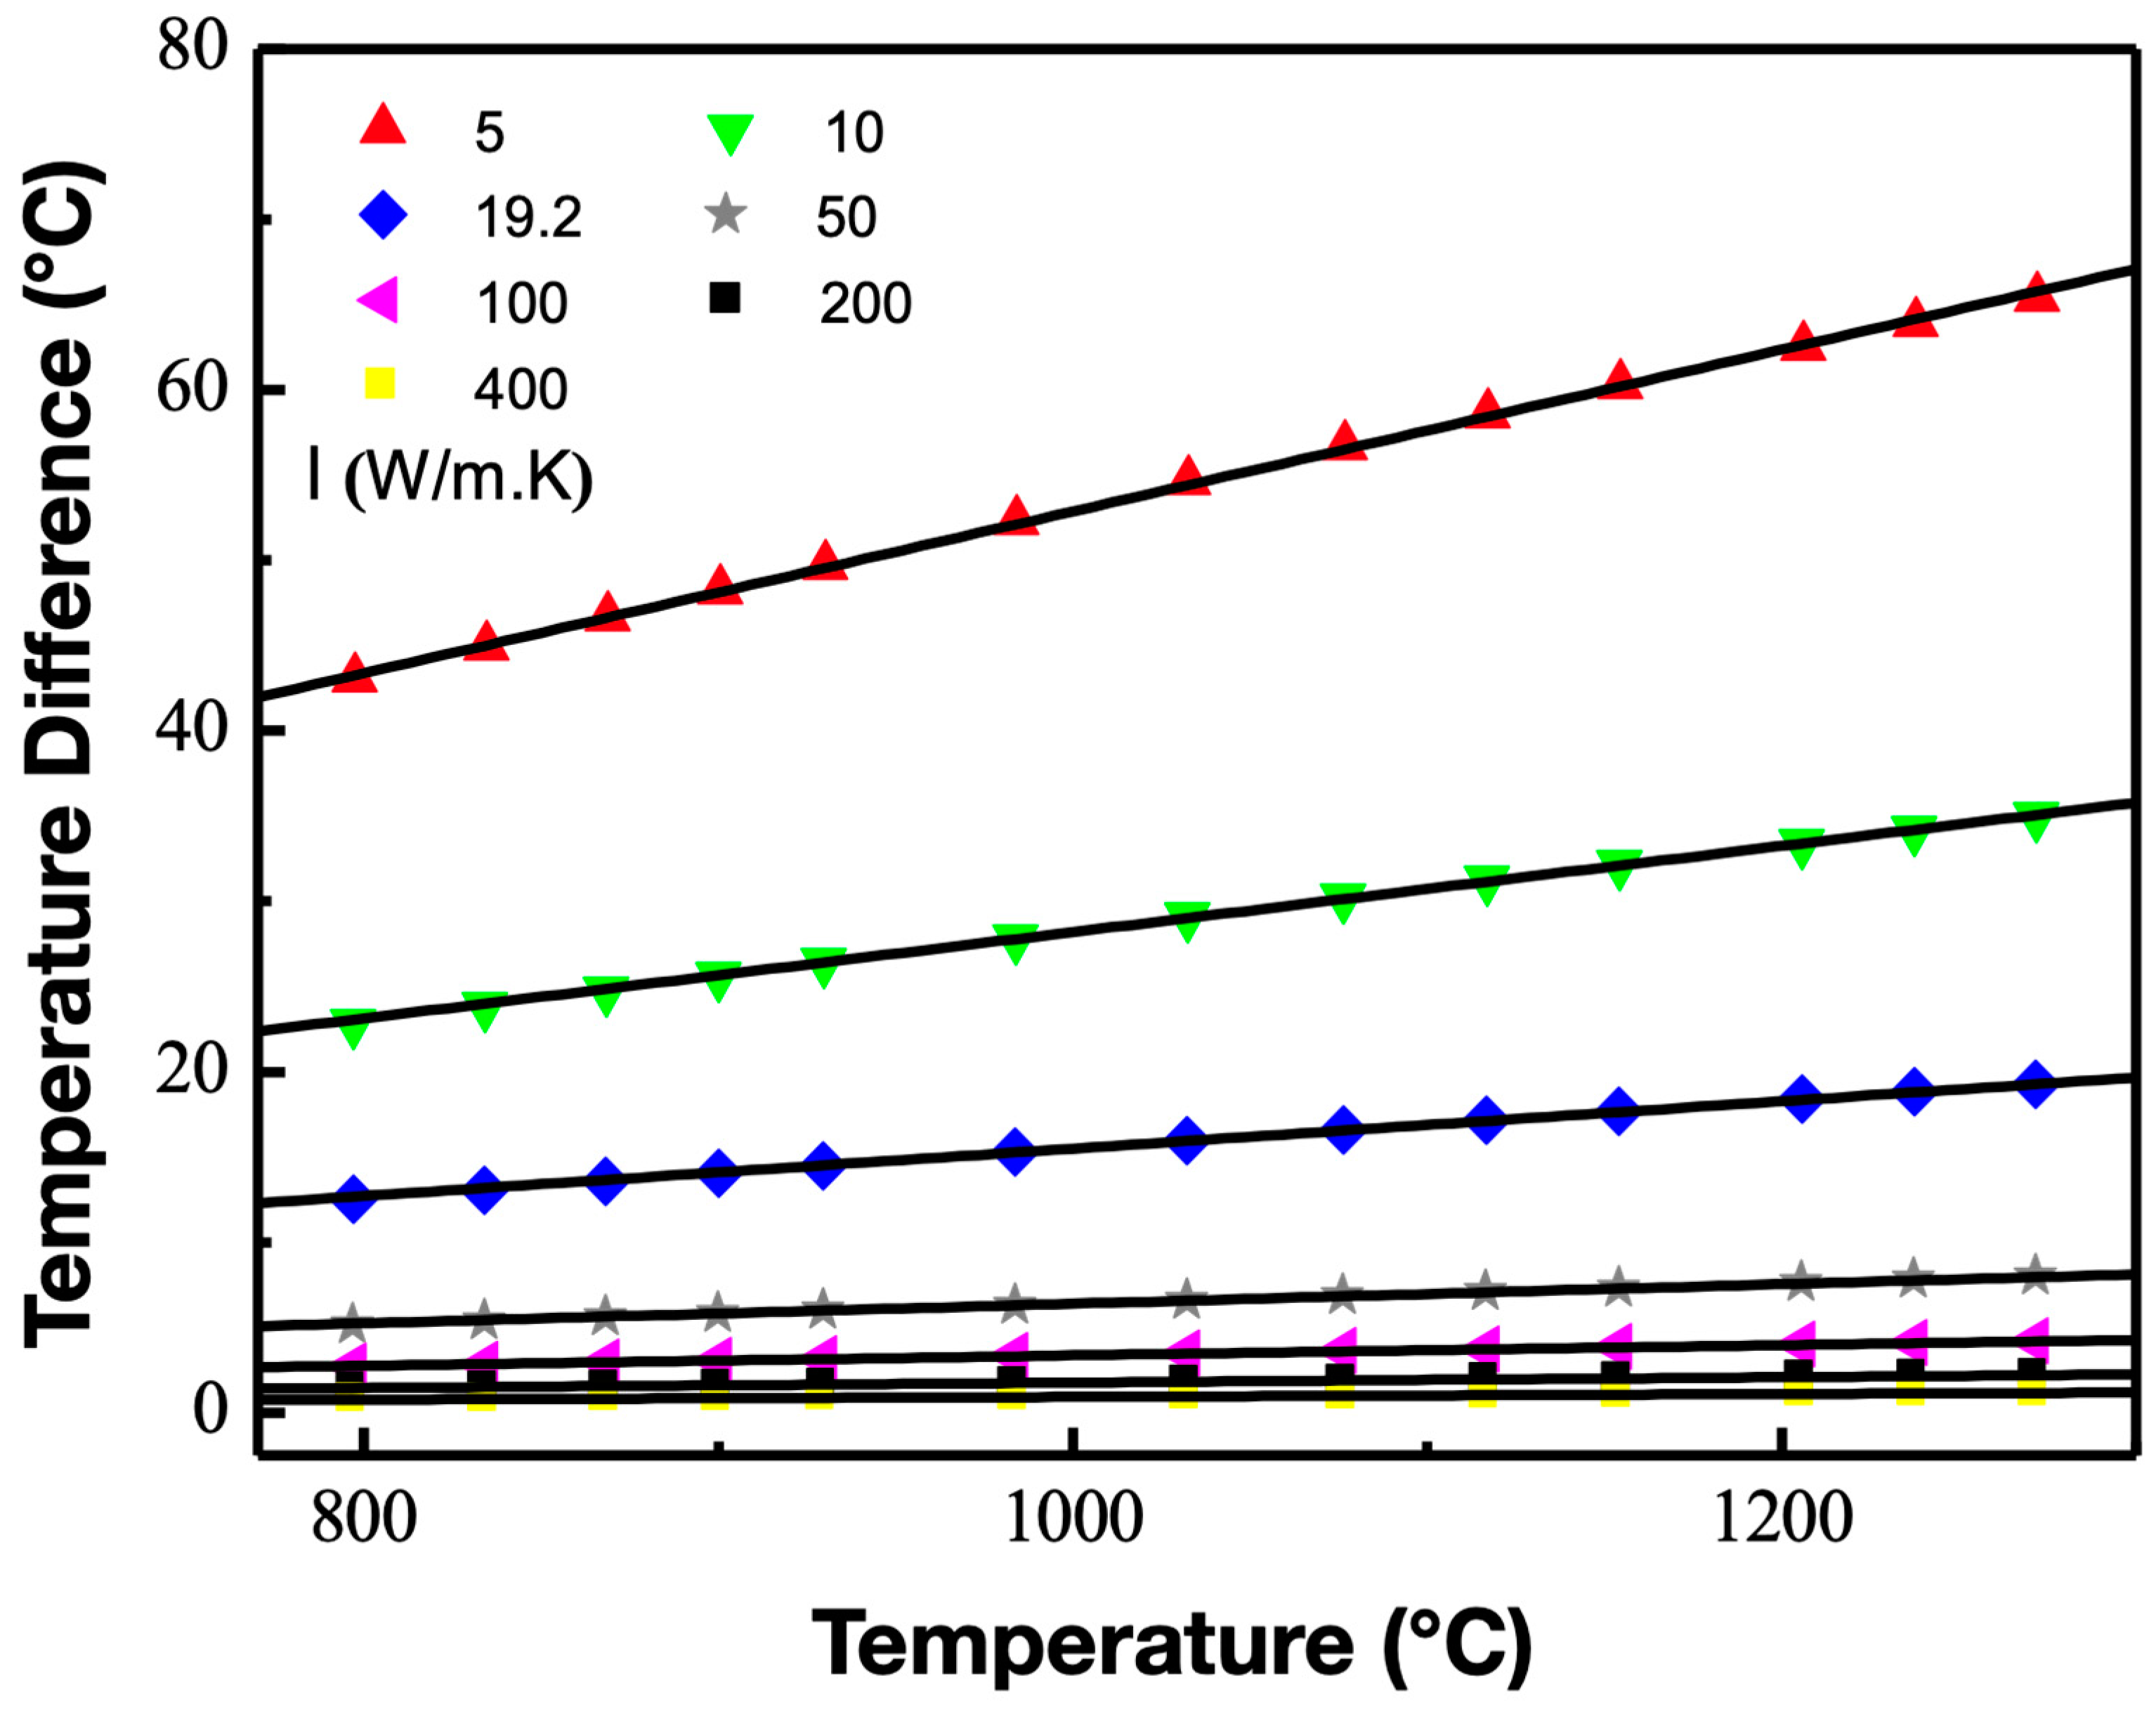
3.2. Combined Effect of Sample Material Properties, Thermocouple Material, and Target Temperature on the Sample Temperature Field near the Thermocouple and Correction
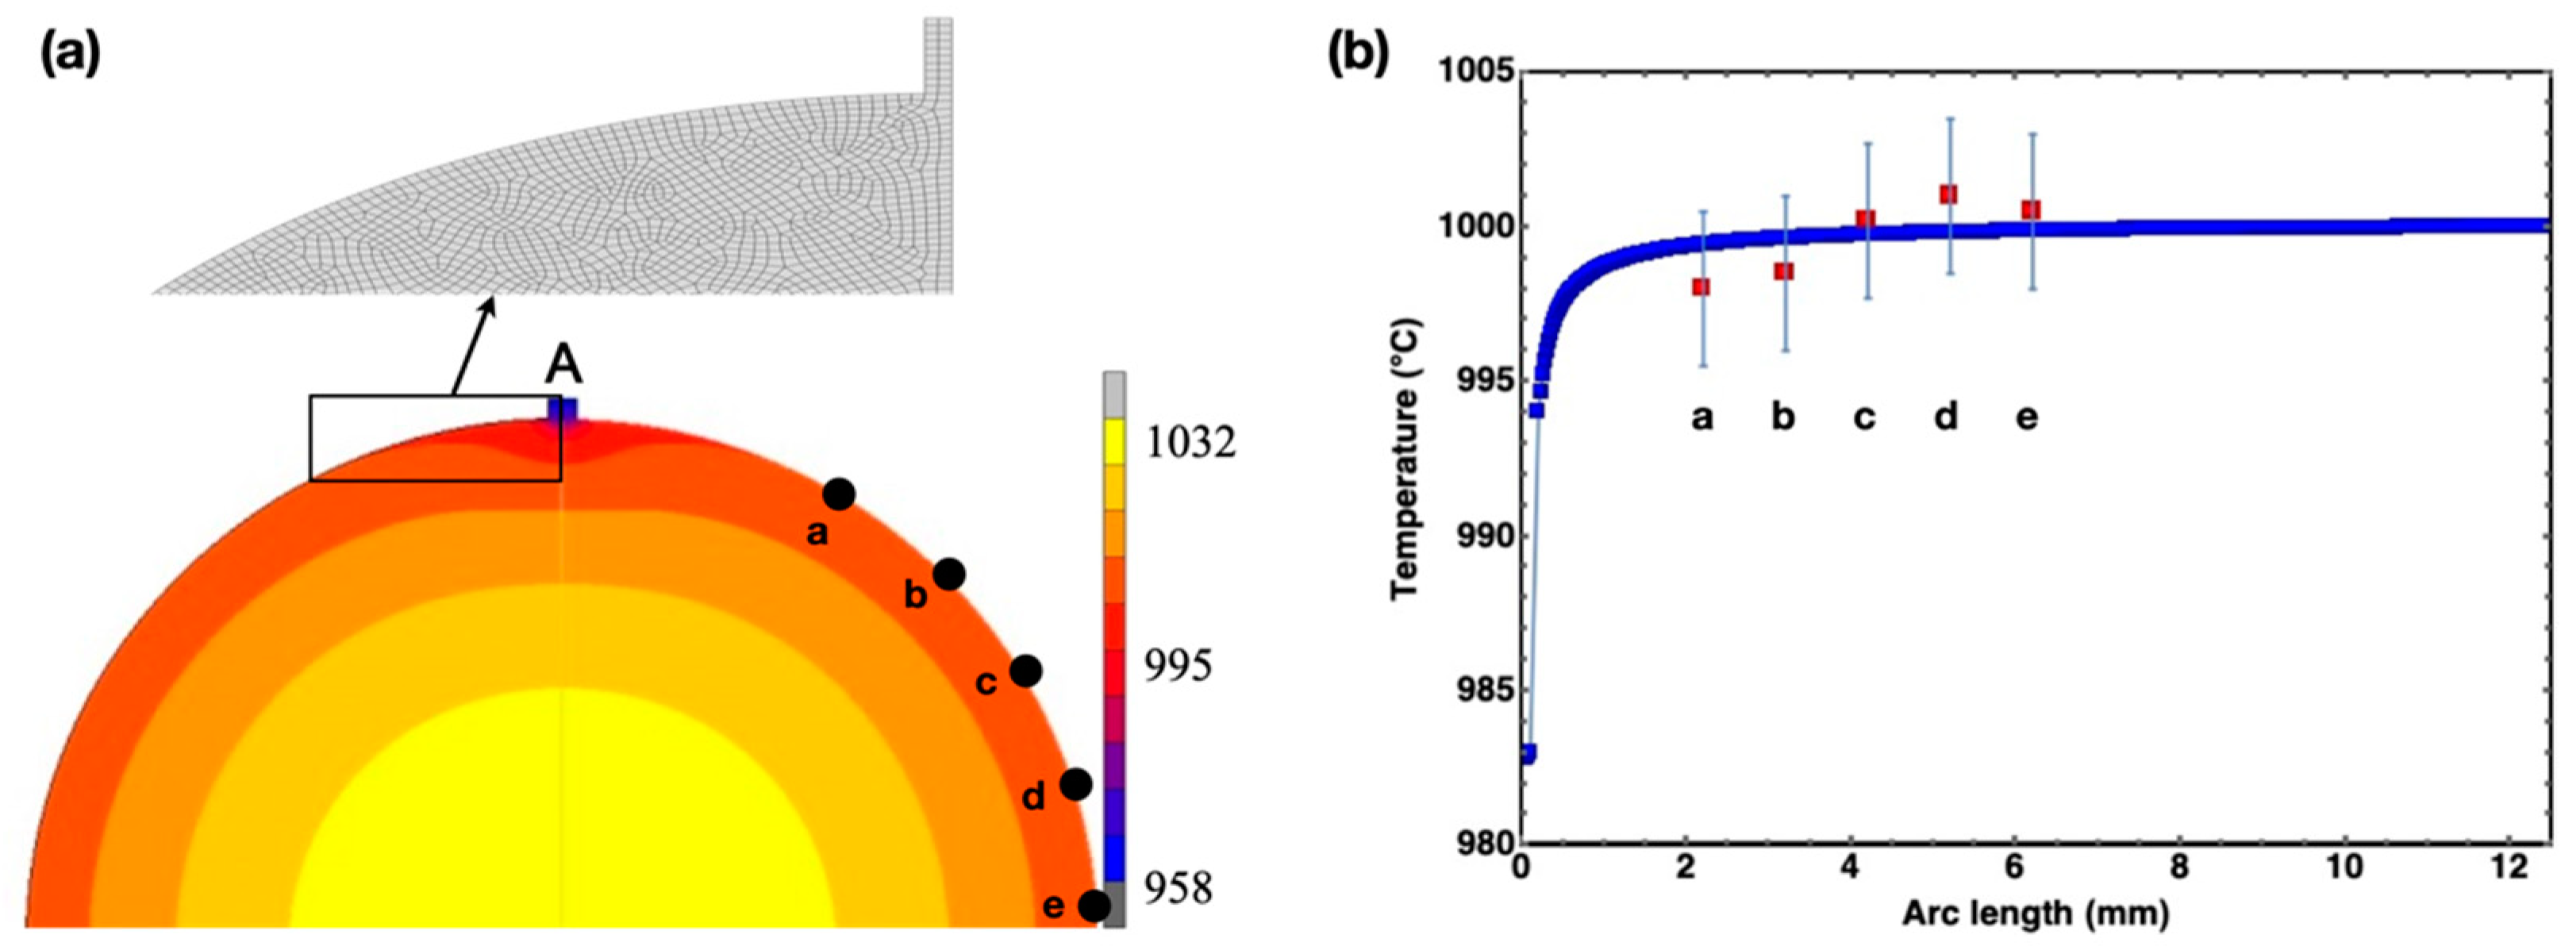
3.3. Verification of the Sample Temperature Field in the Vicinity of the Thermocouple
3.4. Discussion
4. Conclusions
- The introduction of the thermocouple caused distortion in the temperature field near the weld point of the sample, which changed the temperature of the measuring point and led to significant systematic temperature measurement errors under certain conditions.
- The magnitude of the error was related to the target temperature, thermal conductivity of the measured sample, and the material and wire diameter of the thermocouple. The greater the thermal conductivity and thermal radiation coefficient of the thermocouple material are, and the larger the wire diameter of the thermocouple wire is, the greater the error it caused. The higher the target temperature and the lower the thermal conductivity of the sample are, the greater the error was. The temperature measurement error of low thermal conductivity samples such as titanium alloys cannot be ignored.
- The temperature measurement error caused by the introduction of the thermocouple can be corrected by a suitable correction formula. Based on the simulation, two commonly used high-temperature thermocouples were proposed, as well as the corresponding error correction methods and formulas for different wire diameters, target temperatures, and materials with different thermal conductivities.
Author Contributions
Funding
Data Availability Statement
Conflicts of Interest
References
- Banerjee, D.; Williams, J.C. Perspectives on Titanium Science and Technology. Acta Mater. 2013, 61, 844–879. [Google Scholar] [CrossRef]
- Xu, D.S.; Wang, H.; Zhang, J.H.; Bai, C.G.; Yang, R. Titanium Alloys: From Properties Prediction to Performance Optimization. In Handbook of Materials Modeling: Applications: Current and Emerging Materials; Andreoni, W., Yip, S., Eds.; Springer International Publishing: Cham, Switzerland, 2020; pp. 113–151. [Google Scholar]
- Yuan, J.W.; Li, Z.; Tang, H.B. Effect of heat treatment on corrosion resistance and room temperature compression creep of LAM ed TC4 alloy. Acta Aeronaut. Astronaut. Sin. 2021, 42, 478–485. [Google Scholar]
- Chen, L.G.; Wang, W.S.; Zhu, Z.S.; Zhao, Y.; Huang, J.Y.; Zhang, H.; Peng, F. Development and application of large-scale damage tolerance titanium alloy TC4-DT. Acta Aeronaut. Astronaut. Sin. 2020, 41, 523454. [Google Scholar]
- Zhu, S.; Yang, H.; Guo, L.G.; Di, W.J.; Fan, Y. Simulation of Microstructure Evolution During the Whole Process of dial-axial Rolling of TA15 Titanium Alloy Ring. Acta Aeronaut. Astronaut. Sin. 2014, 35, 3145–3155. [Google Scholar]
- Guo, L.G.; Chen, J.H.; He, Y.; Gu, R.J. Response Rules of Strain and Temperature Fields to Roll Sizes During Hot Rolling Process of TC4 Titanium Alloy Conical Ring. Acta Aeronaut. Astronaut. Sin. 2013, 34, 381–389. [Google Scholar]
- Ng, K.L.; Lu, S.Q.; Dong, X.J.; Li, X.; Ouyang, D.L. Behavior of adiabatic Shear and Flow Localization of Alloy Ti-6.5Al-5Mo-1.5Zr-0.3Si. Acta Aeronaut. Astronaut. Sin. 2009, 30, 1967–1972. [Google Scholar]
- Wang, G.C.; Cao, C.X.; Dong, H.B.; Li, Z.C.; Yang, G.; Zhao, X.B. Super Plastic Deformation Mechanism of Titanium Alloy TC11 at Maximum m Value. Acta Aeronaut. Astronaut. Sin. 2009, 10, 357–361. [Google Scholar]
- Zhu, J.-N.; Zhou, Y.-M.; Wang, Y.-P.; Zhang, X.-P. A compensative method of high gas temperature measurement with double eating twin thermal-couple. Acta Aeronaut. Astronaut. Sin. 1993, 14, 303–305. [Google Scholar]
- Pan, Z.; Xu, F.; Mathaudhu, S.; Kecskes, L.; Yin, W.; Zhang, X.; Hartwig, K.; Wei, Q. Microstructural evolution and mechanical properties of niobium processed by equal channel angular extrusion up to 24 passes. Acta Mater. 2012, 60, 2310–2323. [Google Scholar] [CrossRef]
- Warwick, J.; Jones, N.; Rahman, K.; Dye, D. Lattice strain evolution during tensile and compressive loading of CP Ti. Acta Mater. 2012, 60, 6720–6731. [Google Scholar] [CrossRef]
- Yapici, G.; Tomé, C.; Beyerlein, I.; Karaman, I.; Vogel, S.; Liu, C. Plastic flow anisotropy of pure zirconium after severe plastic deformation at room temperature. Acta Mater. 2009, 57, 4855–4865. [Google Scholar] [CrossRef]
- Ding, W.F.; Xi, X.X.; Zhan, J.H.; Xu, J.H.; Fu, Y.C.; Su, H.H. Research status and future development of grinding technology of titanium materials for aero-engines. Acta Aeronaut. Astronaut. Sin. 2019, 40, 22763. [Google Scholar]
- Zhao, B.; Li, P.T.; Zhang, C.Y.; Wang, X.B. Effect of ultrasonic vibration direction on milling characteristics of TC4 titanium alloy. Acta Aeronaut. Astronaut. Sin. 2020, 41, 623301. [Google Scholar]
- Chapuis, A.; Driver, J.H. Temperature dependency of slip and twinning in plane strain compressed magnesium single crystals. Acta Mater. 2011, 59, 1986–1994. [Google Scholar] [CrossRef]
- He, Q.S.; Fu, Y.C.; Xu, H.J.; Ma, K.; Chen, C. Development of Annular Heat Pipe Grinding Wheel for High Efficiency Machining of TC4 Titanium Alloy. Acta Aeronaut. Astronaut. Sin. 2013, 34, 1740–1747. [Google Scholar]
- Maass, R.; Van Petegem, S.; Ma, D.; Zimmermann, J.; Grolimund, D.; Roters, F.; Van Swygenhoven, H.; Raabe, D. Smaller is stronger: The effect of strain hardening. Acta Mater. 2009, 57, 5996–6005. [Google Scholar] [CrossRef]
- Zhang, Y.; Sun, G.B.; Zhang, A.Z. Effect of Abrasive Particle Ultrasonic Vibration on Surface Quality of Titanium Alloy TC4 in EDM. Acta Aeronaut. Astronaut. Sin. 2010, 31, 204–209. [Google Scholar]
- Yu, D.J.; Xu, D.S.; Wang, H.; Zhao, Z.B.; Wei, G.Z.; Yang, R. Refining constitutive relation by integration of finite element simulations and Gleeble experiments. J. Mater. Sci. Technol. 2019, 35, 1039–1043. [Google Scholar] [CrossRef]
- Yang, R.; Yu, D.; Xu, D. Influence of thermocouple welding on GLEEBLE temperature measurement error and a scheme for its correction. Sci. Sin. Technol. 2020, 50, 185–194. [Google Scholar] [CrossRef]
- Li, H.; He, L.; Zhang, C.; Cui, H. Research on the effect of boundary pressure on the boundary heat transfer coefficients between hot stamping die and boron steel. Intern. J. Heat Mass Transfer. 2015, 91, 401–415. [Google Scholar] [CrossRef]
- Xu, M.; Ling, R.; Zhang, Z.; Xie, J. Study on interfacial heat transfer behavior of TA15 titanium alloy and die materials. Intern. J. Heat Mass Transf. 2017, 108, 1573–1578. [Google Scholar] [CrossRef]
- Bai, Q.; Lin, J.; Zhan, L.; Dean, T.; Balint, D.; Zhang, Z. An efficient closed-form method for determining interfacial heat transfer coefficient in metal forming. Int. J. Mach. Tools Manuf. 2012, 56, 102–110. [Google Scholar] [CrossRef]
- Lu, B.S.; Wang, L.G.; Huang, Y. Effect of deformation rate on interfacial heat transfer coefficient in the superalloy GH4169 hot forging process. Appl. Therm. Eng. 2016, 108, 516–524. [Google Scholar] [CrossRef]
- Du, S.G.; Lu, C.; Ren, J.X.; Yang, Z.C. Study on Surface Morphology and Microstructure of Titanium Alloy TC4 Under High-speed Milling. Acta Aeronaut. Astronaut. Sin. 2008, 30, 1710–1715. [Google Scholar]


| Parameter | Value |
|---|---|
| Ambient temperature | 25 °C |
| Ambient heat transfer coefficient | 0.02 kw/(m2·K) |
| Contact heat exchange coefficient | 3 kw/(m2·K) |
| Surface radiation coefficient of the sample | 0.7 |
| PtRh thermocouple surface radiation coefficient | 0.75 |
| NiCr thermocouple surface radiation coefficient | 0.7 |
Disclaimer/Publisher’s Note: The statements, opinions and data contained in all publications are solely those of the individual author(s) and contributor(s) and not of MDPI and/or the editor(s). MDPI and/or the editor(s) disclaim responsibility for any injury to people or property resulting from any ideas, methods, instructions or products referred to in the content. |
© 2023 by the authors. Licensee MDPI, Basel, Switzerland. This article is an open access article distributed under the terms and conditions of the Creative Commons Attribution (CC BY) license (https://creativecommons.org/licenses/by/4.0/).
Share and Cite
Zhao, X.; Ma, Y.; Gao, S.; Li, X.; Yu, D.; Wang, H. Nonnegligible Temperature Drop Induced by Thermocouple on Samples in Gleeble Tests. Metals 2023, 13, 1573. https://doi.org/10.3390/met13091573
Zhao X, Ma Y, Gao S, Li X, Yu D, Wang H. Nonnegligible Temperature Drop Induced by Thermocouple on Samples in Gleeble Tests. Metals. 2023; 13(9):1573. https://doi.org/10.3390/met13091573
Chicago/Turabian StyleZhao, Xiuhong, Yuting Ma, Shuailong Gao, Xuexiong Li, Dejun Yu, and Hao Wang. 2023. "Nonnegligible Temperature Drop Induced by Thermocouple on Samples in Gleeble Tests" Metals 13, no. 9: 1573. https://doi.org/10.3390/met13091573