Article

A Molecular Dynamics Simulation to Shed Light on the Mechanical Alloying of an Al-Zr Alloy Induced by Severe Plastic Deformation

by
Alina Y. Morkina
1,2,†,
Rita I. Babicheva
3,†,
Elena A. Korznikova
4,†,
Nariman A. Enikeev
1,5,†,
Kaveh Edalati
6,7,† and
Sergey V. Dmitriev
2,8,*,†
1
Laboratory for Metals and Alloys under Extreme Impacts, Ufa University of Science and Technology, 450076 Ufa, Russia
2
Institute for Metals Superplasticity Problems of Russian Academy of Sciences, 450001 Ufa, Russia
3
School of Mechanical and Aerospace Engineering, Nanyang Technological University, Singapore 639798, Singapore
4
Technological Machines and Equipment Department, Ufa State Petroleum Technological University, 450064 Ufa, Russia
5
Laboratory for Dynamics and Extreme Characteristics of Promising Nanostructured Materials, Saint Petersburg University, 198504 Saint Petersburg, Russia
6
WPI, International Institute for Carbon-Neutral Energy Research (WPI-I2CNER), Kyushu University, Fukuoka 819-0395, Japan
7
Mitsui Chemicals, Inc.—Carbon Neutral Research Center (MCI-CNRC), Kyushu University, Fukuoka 819-0395, Japan
8
Institute of Molecule and Crystal Physics, Ufa Federal Research Center of Russian Academy of Sciences, 450075 Ufa, Russia
*
Author to whom correspondence should be addressed.
These authors contributed equally to this work.
Metals 2023, 13(9), 1595; https://doi.org/10.3390/met13091595
Submission received: 3 July 2023 / Revised: 21 August 2023 / Accepted: 25 August 2023 / Published: 14 September 2023
(This article belongs to the Special Issue Feature Papers in Metal Failure Analysis)

Abstract

:
In a recent experimental work, as a result of severe plastic deformation, a non-equilibrium solid solution was obtained despite the very limited solubility of zirconium (Zr) in aluminum (Al). This opens up a new path in the development of heat-treatable alloys with improved electrical and mechanical properties, where mechanically dissolved elements can form intermetallic particles that contribute to precipitation strengthening. In the present study, molecular dynamics simulations were performed to better understand the process of mechanical dissolution of Zr within an Al model, with Zr atoms segregated along its grain boundaries. Stress–strain curves, radial distribution functions, and mechanisms of plastic deformation and dissolution of Zr in Al were analyzed. It is revealed that orientation of the grain boundary with segregation normal to the shear direction promotes more efficient mixing of alloy components compared to its parallel arrangement. This happens because in the second case, grain boundary sliding is the main deformation mechanism, and Zr tends to remain within the interfaces. In contrast, the involvement of dislocations in the case of normal orientation of grain boundaries with Zr segregation significantly contributes to deformation and facilitates better dissolution of Zr in the Al matrix. The findings obtained can provide new insights considering the role of texture during mechanical alloying of strongly dissimilar metals.

1. Introduction

Development of high strength lightweight conductor alloys is a vital task for modern transport and energetic engineering. These alloys should be based on several Al systems alloyed with elements capable of providing additional strengthening, since low mechanical strength is one of the disadvantages of commercially pure aluminum. Such popular Al-based systems as Al-Mg-Si (6xxx series alloys) have been developed to gain additional strengthening due to precipitation of fine second phase particles [1]. Application of additional deformation and thermal treatments of Al alloys to this and other systems makes it possible to achieve an affordable trade-off between density, strength and electrical conductivity, and such alloys have found important applications as a substitution for more expensive, less widespread, and higher density Cu-based alloys [2]. Moreover, the modern approaches for microstructural design by tuning fine-scale features, especially for complex structures [3,4,5], have provided an extra-space to further enhance both the mechanical and electrical properties of Al alloys [6]. One of these techniques utilizes the capabilities of severe plastic deformations (SPDs) [7] to refine grains and induce nanostructural features into Al alloys with the aim of producing advanced high-performance Al-based conductors [8].
Another critical issue related to Al alloys is the low thermal stability of their mechanical and functional properties. Thermal stability in materials science is defined as the ability of a material to maintain its structure and properties at elevated temperatures. As pointed out in [9], almost all Al alloys are thermally unstable, and are affected by temperature, especially during long-term service. Extending the temperature range for their reliable functioning is an important engineering task. Several Al-based compositions have been proposed so far to solve this important problem. One of these solutions relates to the development of the Al-Zr system, for which the thermal stability of the achieved states proved to be substantially improved [10]. Doping Al-based alloys with Zr also improves fatigue corrosion cracking and natural aging resistance [11]. Zr atoms have very limited solubility in Al and do not notably affect the electrical conductivity as solutes. The binary Al–Zr phase diagram shows the maximum solubility of Zr in Al is about 0.234 wt% at the peritectic temperature of 660 °C [12]. During solidification and equilibrium, a tetragonal DO 23 Al-3at.%Zr phase is formed with a wide range of cooling rates [13]. Interestingly, SPDs with huge strain or ultrasevere plastic deformation [14] made it possible to overcome these physical limitations and form unusual metastable super-saturated solid solutions, even in immiscible systems [15]. Application of huge shear straining to an Al-5at.%Zr alloy demonstrated that up to 1 at.% of Zr can be dissolved in an Al matrix at room temperature [16]. This process was shown to be accompanied by lattice expansion and formations of metastable particles. Moreover, it was shown that a number of unique features could be observed in SPD Al-Zr, such as metastable phase transformations and formation of Zr segregations on the interfaces of ultrafine grains [16]. These findings can help to transform the Al-Zr system to an agehardenable one and to obtain the additional pathways for controlling fine precipitation and microstructure refinement in these alloys, opening a way to developing novel conductors with outstanding properties. Figure 1 displays experimental evidence of SPD-driven precipitation and segregation in the Al–5Zr alloy, which was first demonstrated in [16]. The scanning transmission electron microscopy (STEM) images of the ultra–SPD processed Al–5Zr alloy presented in Figure 1 were collected in bright field mode (Figure 1a), as well as using high-angle annular dark-field (HAADF) imaging (Figure 1b,c). Ultra-SPD made it possible to refine the microstructure of the Al–Zr alloy down to the nanocrystalline state (Figure 1a). The HAADF technique is capable of revealing contrasts between areas occupied by different types of atoms, and it has unambiguously shown unusual precipitation of metastable second-phase particles (Figure 1b) and segregation of Zr atoms in the grain boundary area (Figure 1c) in the nanostructured Al–Zr alloy. Note that Figure 1 is not shown to validate the results of the simulations presented below, but to justify that the simulated features can really be formed in the considered system.
However, there are still many unexplored problems in this field. It is not clear how large straining provides formation of supersaturated solid solution, how the metastable phases precipitate, how grain boundary segregations develop, how precipitation kinetics of these states takes place, and how these features evolve under SPD/thermal treatments, as well as what their effect on the material’s properties is. These problems can hardly be solved without a fundamental understanding of the micro-mechanisms for structural transformations, which are defined at very low scale level. Atomistic simulations can provide necessary clues to reveal the critical regularities underneath. This study is aimed at making first steps in clarification of how the atomic-scale features (as grain boundary segregations) evolve with applied strain and their effect on the deformation behavior of Al-Zr alloys carried out by using molecular dynamic simulation.
Molecular dynamics is a powerful tool for obtaining new information about the formation of nonequilibrium structures, one of which is mechanically alloyed metals. For instance, Li et al. conducted research on the unsteady mechanical behavior of Fe14.6Ni (at %) nanocrystalline elastocaloric refrigeration alloy, revealing that the alloy exhibited stable mechanical behavior in an open thermodynamic system but showed transient behavior with temperature fluctuations in an adiabatic system during uniaxial tensile processes [17]. Another study by Al Muscati et al. explored the effect of carbon nanotubes (CNTs) on the mechanical properties of aluminum/copper (Al/Cu) alloy nanocomposites. The results demonstrated that increasing the volume fraction of CNTs enhanced the elastic modulus and ultimate tensile strength of the nanocomposite [18]. Additionally, Rogachev et al. [19] investigated the synthesis of the medium-entropy alloy CoFeNi, observing a two-stage process involving crystallite refinement, accumulation of structural defects, and subsequent recrystallization leading to the formation of a multicomponent phase. Furthermore, Vasconcelos and Figueiredo [20] studied the mechanical alloying process in an fcc Fe 45at.% Cu nanocrystalline solid solution. Their findings highlighted the role of kinetic energy, impact frequency, and powder mass in driving reactions, as well as the influence of capillary pressure and energy from shocks on the final product. These studies collectively contribute to the understanding of the mechanical behavior and alloy synthesis mechanisms, providing valuable insights for future material design and applications.
In refs. [21,22,23,24], the mechanisms of the ballistic diffusion phenomenon known as crowdion motion able to contribute to the strain induced formation of non equilibrium solid solution is reported. However, detailed molecular dynamics studies of the atomistic mechanisms of formation of nonequilibrium solid solutions were not earlier addressed according to our literature analysis.
The features of the dissolution of Zr atoms located in the grain boundary segregations in the Al lattice during shear deformation are aimed to be addressed in the current study. The goal is to estimate the saturation solubility level, understand the dynamics of Zr atom distribution as a function of strain rate and value, and explore the accompanying processes occurring in the material during intensive deformation. Molecular dynamics is considered a powerful tool for these purposes due to its unlimited possibilities in estimating various aspects of the crystal structure transformation mentioned above, which are not available for existing experimental methods. In this case, the focus is placed on the influence of the segregation orientation and shear rate on the dissolution dynamics in order to provide qualitative dependencies for future targeted experimental study of the strain-induced formation of supersaturated solutions of Zr in Al.

2. Simulation Details

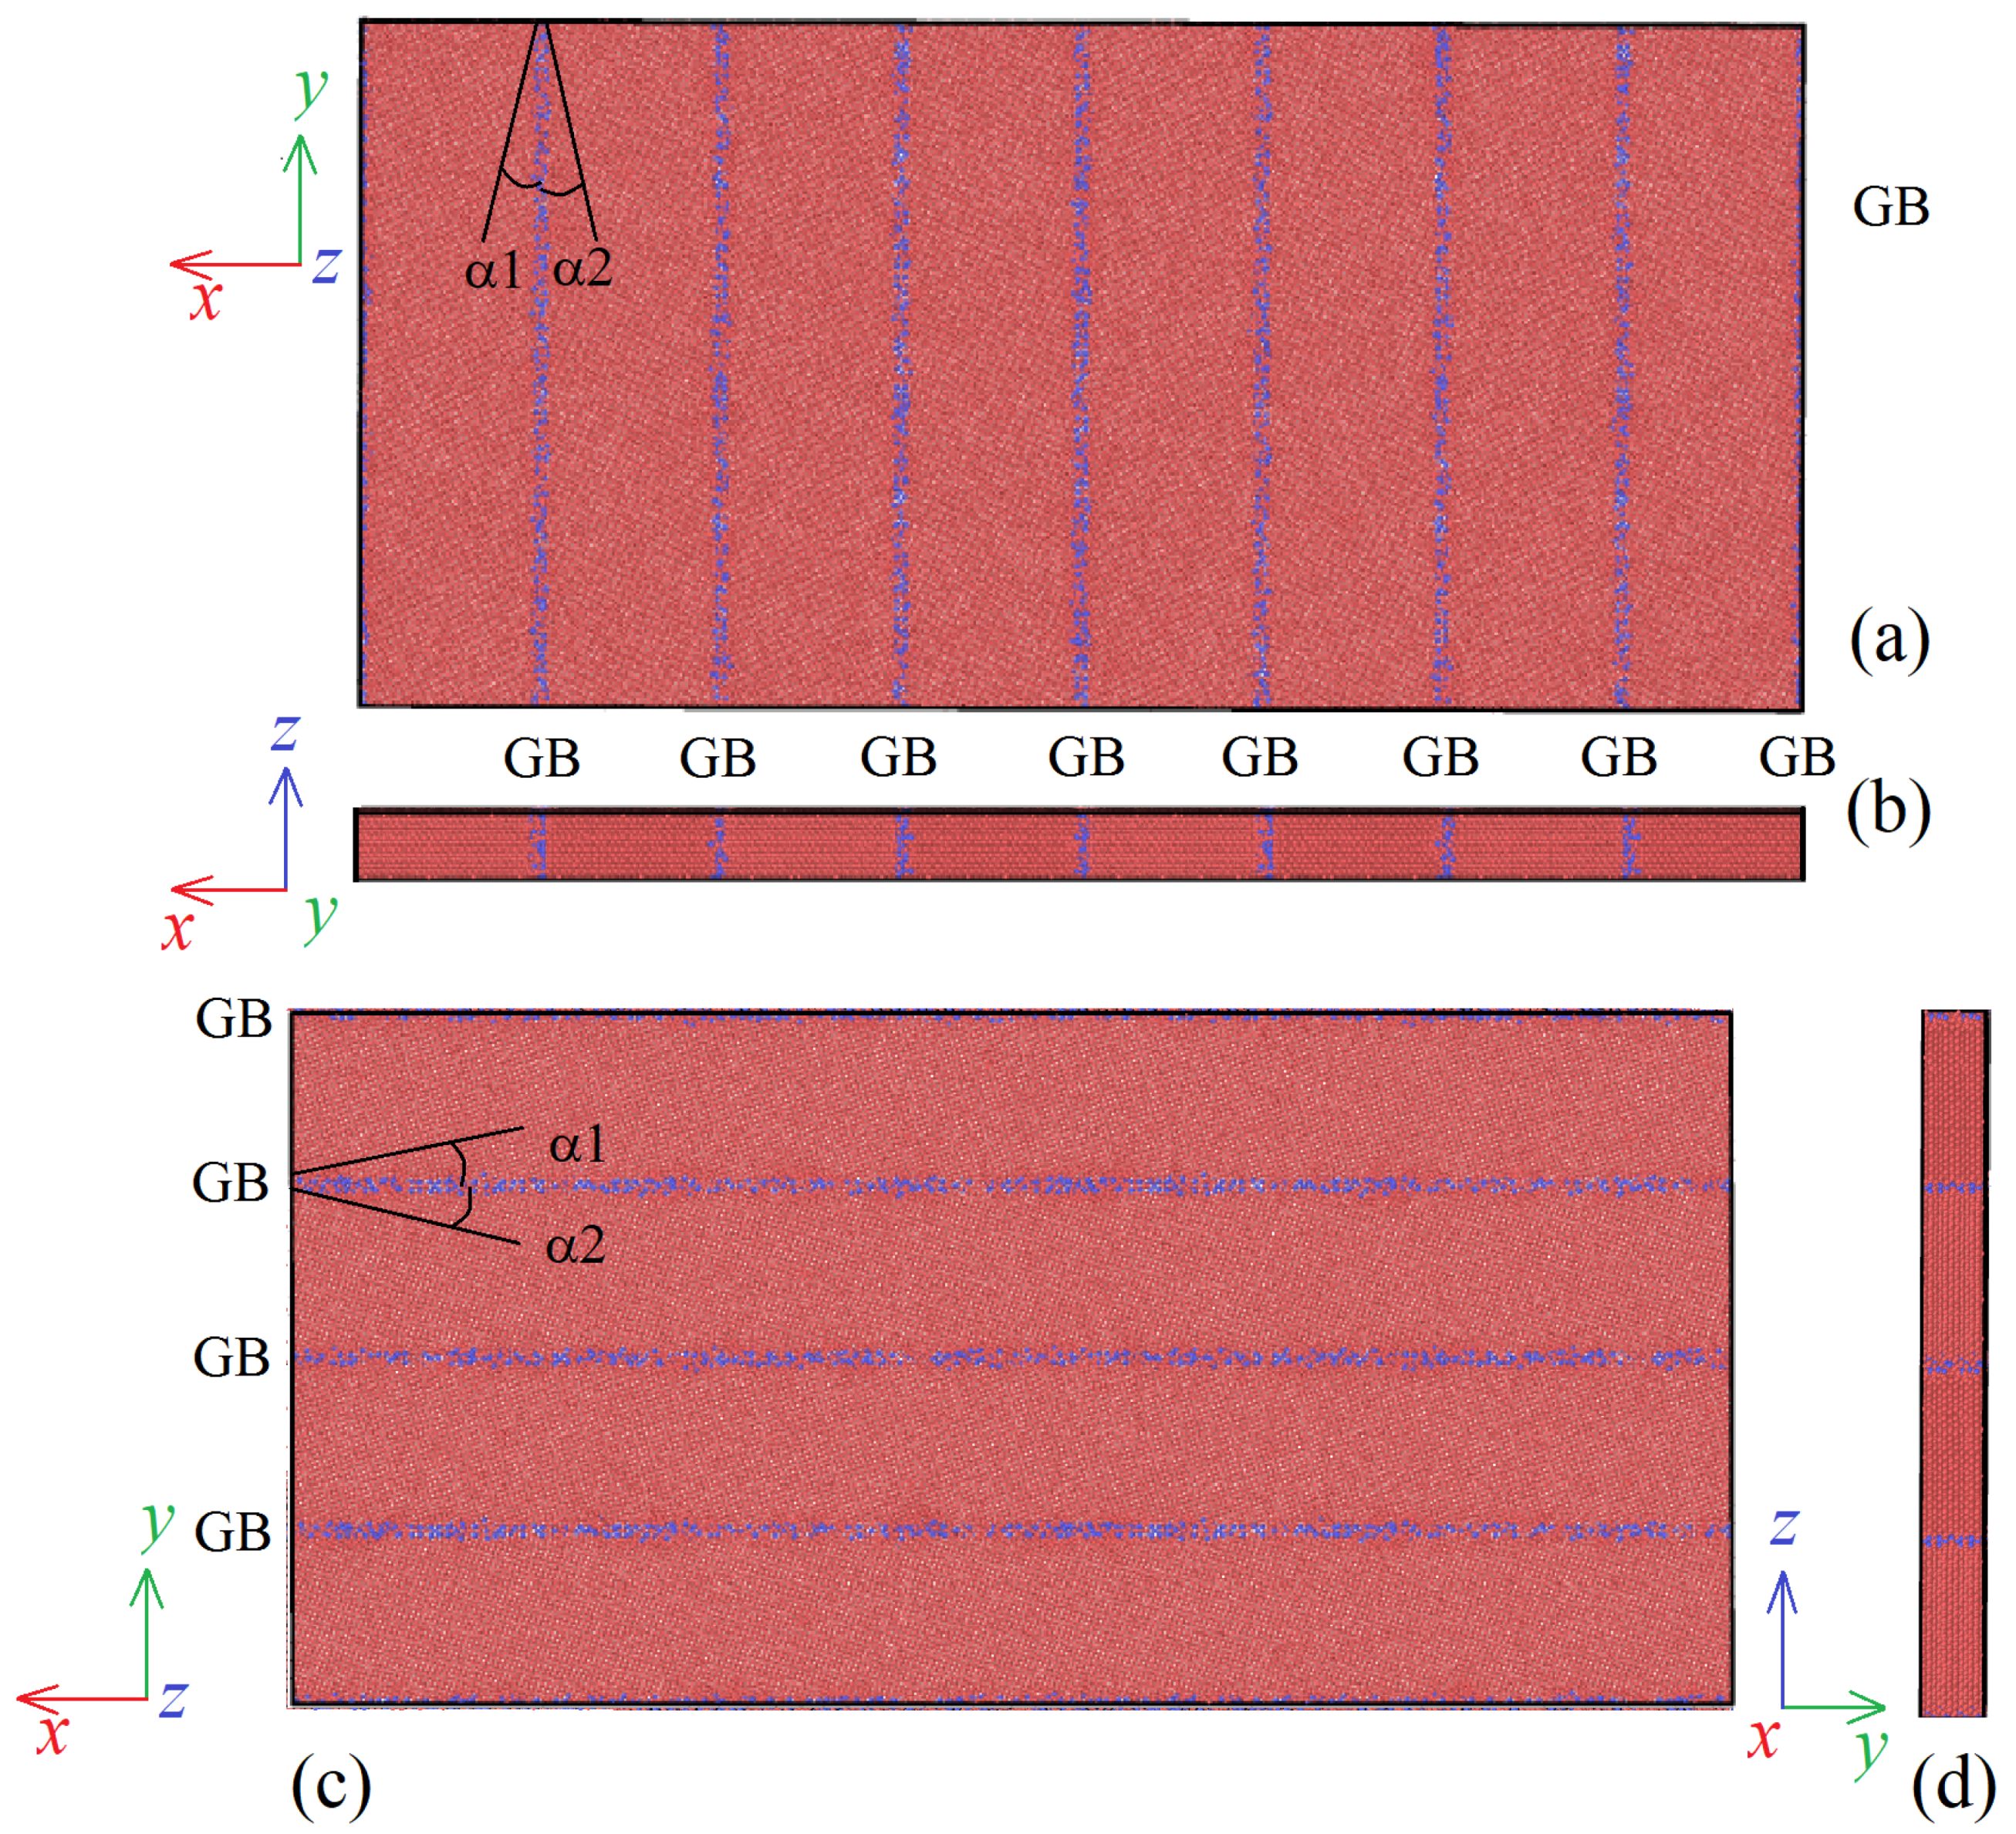
Pure Al and Al-3at.%Zr alloy are chosen as materials of study. Two different computational models of rectangular parallelepiped shape with the same dimensions 550 × 265 × 25 Å 3 are constructed. Initially, both models consist of ~211,000 Al atoms forming face-centered cubic crystal structure. The samples differ by the orientation of tilt GBs separating parallel strips of grains (see Figure 2). The GBs are actually randomly oriented with respect to the shear direction. In our simulation, we consider two models with angles 0 and 90 between the GB plane and the shear direction. In the first case, under simple shear, grain boundary sliding is expected to be the dominant deformation mechanism, while in the second case GB slip is hindered and dislocations are expected to be the dominant contributor to plastic deformation. In one of the models, the vertical GBs are parallel to the y z -plane (VGBs for short), while in the second one, the horizontal GBs are parallel to the x z -plane (HGBs for short). We are interested in high-angle GBs (with a misorientation angle well above 15 ) because of their valuable contribution to the deformation of nanocrystalline metals [25]. GBs are introduced through the rotation of parts of initial crystal (x = [100], y = [010], z = [001]) by α 1 = + 33 and α 2 = 33 with respect to the GB plane, forming high-angle GBs. The grain size in nanocrystalline metals is typically of the order of 100 nm, and in molecular dynamics simulations, due to computational resource limitations, it is usually of the order of 10 nm [26,27]. In our simulations, the distance between two neighboring GBs is the same and is equal to 6.5 nm. To study the sample size effect, smaller computational cells consisting of ~26,000 atoms and having dimensions of 275 × 130 × 13 Å 3 are considered for comparison. Note that the misorientation angle and distance between grains are kept the same as for the small and big samples.
To form Al-3at.%Zr alloy with Zr atoms located at GBs of Al, 3 at.% of all Al atoms (~ 6300 atoms for the big sample and ~ 790 atoms for the small one) are randomly replaced by Zr atoms within strips of 4 Å thickness at each GB [28,29,30,31]. In Figure 2, the Al (Zr) atoms are shown by red (blue) dots.
The simulations are performed using the Large-scale Atomic/Molecular Massively Parallel Simulator (LAMMPS) package [32], and the results are visualized with the Open Visualization Tool (OVITO) [33]. The embedded-atom method (EAM) potential describing the atomic interaction in the Al-Zr system was generated by Sheng [34], and can be downloaded from the EAM potential repository [35]. It was developed by fitting the potential energy surface by ab initio calculations [36,37]. The potential was validated by comparing molecular dynamics results with ab initio and experimental data [34]. Its reliability was also proved by comparing the average interatomic distances of the nearest atomic pairs with experimental measurements in [38]. The above supports that the potential used in the current study can describe the local structures of the Al-Zr alloy relatively well.
Prior to the deformation, the studied materials are relaxed by energy minimization with the conjugate gradient algorithm, followed by their equilibration within 30 ps at 300 K in the NPT ensemble. To mimic the shear deformation process during SPD through high-pressure torsion (HPT), a hydrostatic pressure of 6 GPa is applied to the materials. Similar to the equilibration process, the simulation of deformation is carried out at a constant temperature T = 300 K and in the NPT ensemble. The normal and shear stress components, except σ x y , are kept zero during deformation. Strain-control loading is modeled at three different strain rate values, namely, 10 7 , 10 8 or 10 9 s 1 . Periodic boundary conditions are applied along the x, y and z orthogonal directions. The samples are deformed up to ε x y = 1.0. The timestep is set as 1 fs.
We consider that the HPT process can be schematically characterized with simple shear as the dominant deformation mode. This consideration agrees well with the general view accepted in the SPD community (see, e.g., a contribution by Pippan [39]). It follows from this and other similar work that, from a mechanical point of view, HPT can be modeled by a simple shear in the idealized conditions of HPT. Under realistic conditions, some deviations from this mode may occur depending on the material properties and HPT die features, as shown by more rigorous analyses; see, for example, the recent report in [40]. However, the main mode realized in the HPT process is still the simple shear, and we believe that such an approximation can be correct, given the objective of our study.
Similar modeling parameters have been used in other work modeling plastic deformation using molecular dynamics. The SPD of single-crystal aluminum was analyzed by molecular dynamics to reveal the mechanisms of polycrystal formation at 300 K for three different initial crystallographic orientations; the grain fragmentation processes in the deformation zone were investigated [26]. The dynamics of atoms in GBs of nanocrystalline aluminum has been studied by molecular dynamics simulation [41], and it was found that the GB atoms exhibit glassy dynamics. The effect of strain rate on the deformation of nanomultilayer aluminum alloys was investigated by the molecular dynamics method [42], and it was found that with an increase in strain rate, the yield strength and tensile strength increase. The effect of free surfaces on plastic deformation and fracture of nanocrystalline nickel, aluminum and copper has been investigated, and it has been shown that nanocracks are generated at triple junctions near free surfaces [43]. In a molecular dynamics study [44], grain growth kinetics and grain rotations in nanocrystalline Al were described.

3. Results and Discussion

3.1. The Effect of GB Segregation of Zr on Shear Deformation Behavior

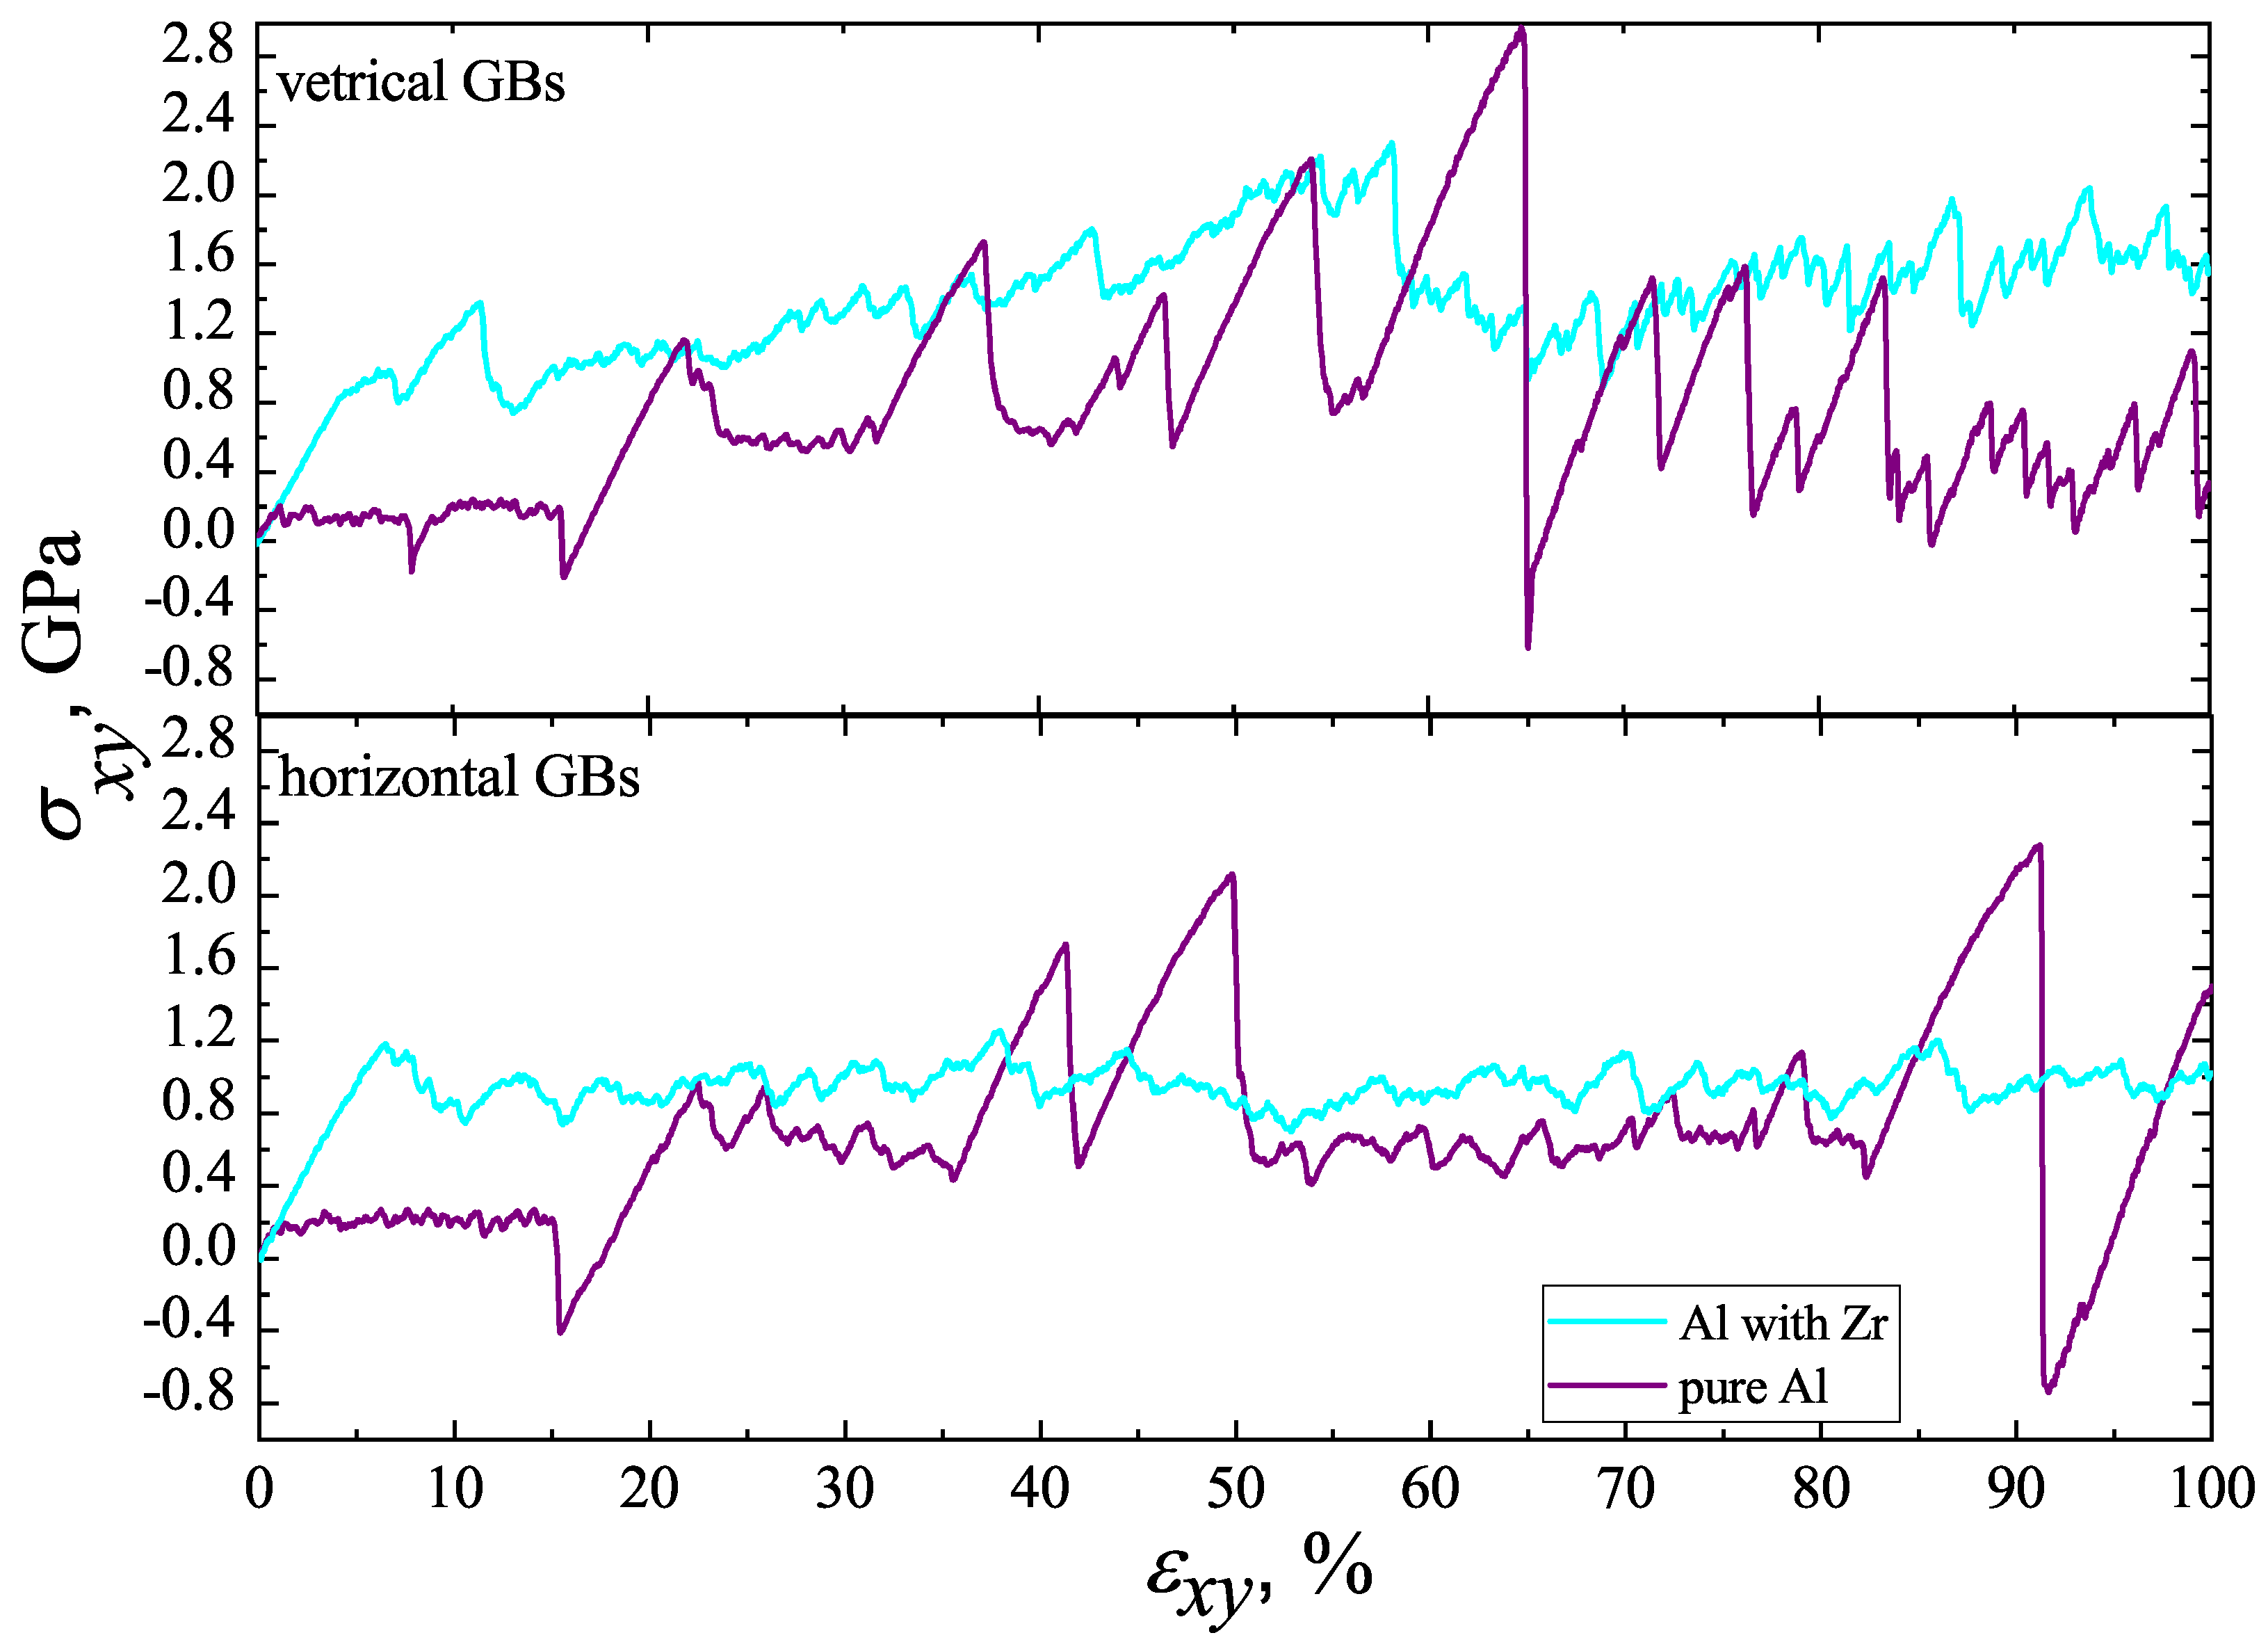
The stress–strain behavior of materials without and with GB segregation of Zr is examined for the small computational cells. Figure 3 shows the shear deformation stress–strain curves obtained for pure Al (purple curve) and for an Al alloy with the addition of Zr (cyan curve) at the strain rate ε ˙ x y = 10 8 s 1 . Upper and lower panels of the figure represent the results for different GB orientations with respect to the shear loading direction. In the upper panel, the GBs planes are parallel to the y z plane (VGBs), while for the lower panel, the GBs planes lie in the x z plane (HGBs).
The addition of Zr significantly alters the stress–strain behavior of Al. Regardless of the GB orientations, the presence of Zr atoms at GBs improves yield strength (YS). For the case of VGBs, YS increases from 0.2 GPa to 0.83 GPa with corresponding yield strains of 1.2% and 5%, respectively. In the second case (HGBs), YS for the Al alloy reaches 1.2 GPa at 7% shear strain over 0.17 GPa at about 1% shear strain for pure Al.
During further deformation of pure Al up to ε x y = 0.15, the stress–strain curves demonstrate relatively stable plastic flow; however, areas with an abrupt decrease followed by an increase in stress, or vice versa, are observed. The latter is especially pronounced for the VGBs case. The observed maximum peak value here is 2.95 GPa at ε x y 65 %, over 2.25 GPa for the sample with HGBs at ε x y 91 %. The plastic flow of the alloy is more stable, especially for the HGB case, and does not show the abrupt changes in stresses that was observed for pure Al. It should be noted that for the sample having VGBs, the stresses grows gradually up to 2.2 GPa at 58% and further stabilizes at 1.6 GPa, while the flow stress value remains almost constant for the second case (~1 GPa). The stress–strain response is dictated by the structure evolution during deformation. Therefore, in Section 3.4, structural analysis will be considered in detail.
In Figure 3 and other figures showing the stress–strain curves, negative shear stresses can be observed just after critical events, leading to sudden structural reconstructions in pure Al samples, as described in more detail below in Section 3.4. For example, in Figure 3 above, stress drops below zero can be seen at ε x y 8 %, 15% and 65%. The first two drops correspond to the annihilation of GB pairs, while the third corresponds to the formation of stacking faults and crystal fragmentation. The appearance of negative stress values is a purely dynamic effect. The elastic strain energy accumulated by the computational cell is suddenly released in a critical event, resulting in a drop in shear stress, which can even become negative for a short time. The stress–strain curves for the samples with GB segregations do not show negative shear stress values because segregations allow a less catastrophic release of the elastic strain energy. Note that negative stress values after critical events associated with sudden structure rearrangement have been observed in many other molecular dynamics simulations [45,46,47].
The results for pure Al shown in Figure 3 can be compared with the results of previous molecular dynamics studies. Single-crystal Al shows an ultimate strength from 6 to 8 GPa [46,47,48], depending on the loading scheme and simulation conditions, while polycrystalline samples show much lower strength of about 1 GPa [47,49,50]. In our simulations, parallel GBs are considered, and the ultimate shear stress is about 0.2 GPa. Such a low shear strength of a polycrystal in our simulations is explained by the ease of grain boundary sliding in a sample with parallel GBs.
As a test, the stress–strain curves under uniaxial tensile loading at T = 300 K, with a strain rate of 10 8 s 1 , were calculated and compared with the results presented in [46,47,49]. The ultimate stress between 7.5 and 8 GPa and the critical strain of about 15% were obtained. No negative values of stress after a critical stress drop were observed in the simulated tensile tests. We conclude that the results of our simulations are in agreement with the previous works.

3.2. The Effect of Strain Rate

Figure 4 shows stress–strain curves for small computational cells of pure Al containing VGBs and HGBs obtained during shear deformation at various strain rates, namely at ε ˙ x y = 10 7 s 1 (black curve), ε ˙ x y = 10 8 s 1 (red curve), and ε ˙ x y = 10 9 s 1 (blue curve). The corresponding results for the Al alloy with GB segregation of Zr are provided in Figure 5.
In the case of pure Al, at ε ˙ x y = 10 7 s 1 and ε ˙ x y = 10 8 s 1 , the stress–strain curves resemble each other, and, as described earlier associated with areas with the relatively stable plastic flow and strong oscillation of stresses. However, at ε ˙ x y = 10 9 s 1 , it can be noticed that the oscillation is reduced and the flow stress value is slightly higher compared to that observed for samples deformed at the lower speed. Stable plastic deformation up to ε x y = 0.15 without the oscillation is common for all considered samples and strain rates.
Unlike the pure Al, the curves obtained for the alloy for all strain rates are very close to each other and demonstrate similar stress–strain responses as described earlier for ε ˙ x y = 10 8 s 1 . A slight difference can be seen in YS value; it increases roughly by 200 MPa during the high-rate deformation at ε ˙ x y = 10 9 s 1 .

3.3. The Effect of Computational Cell Size

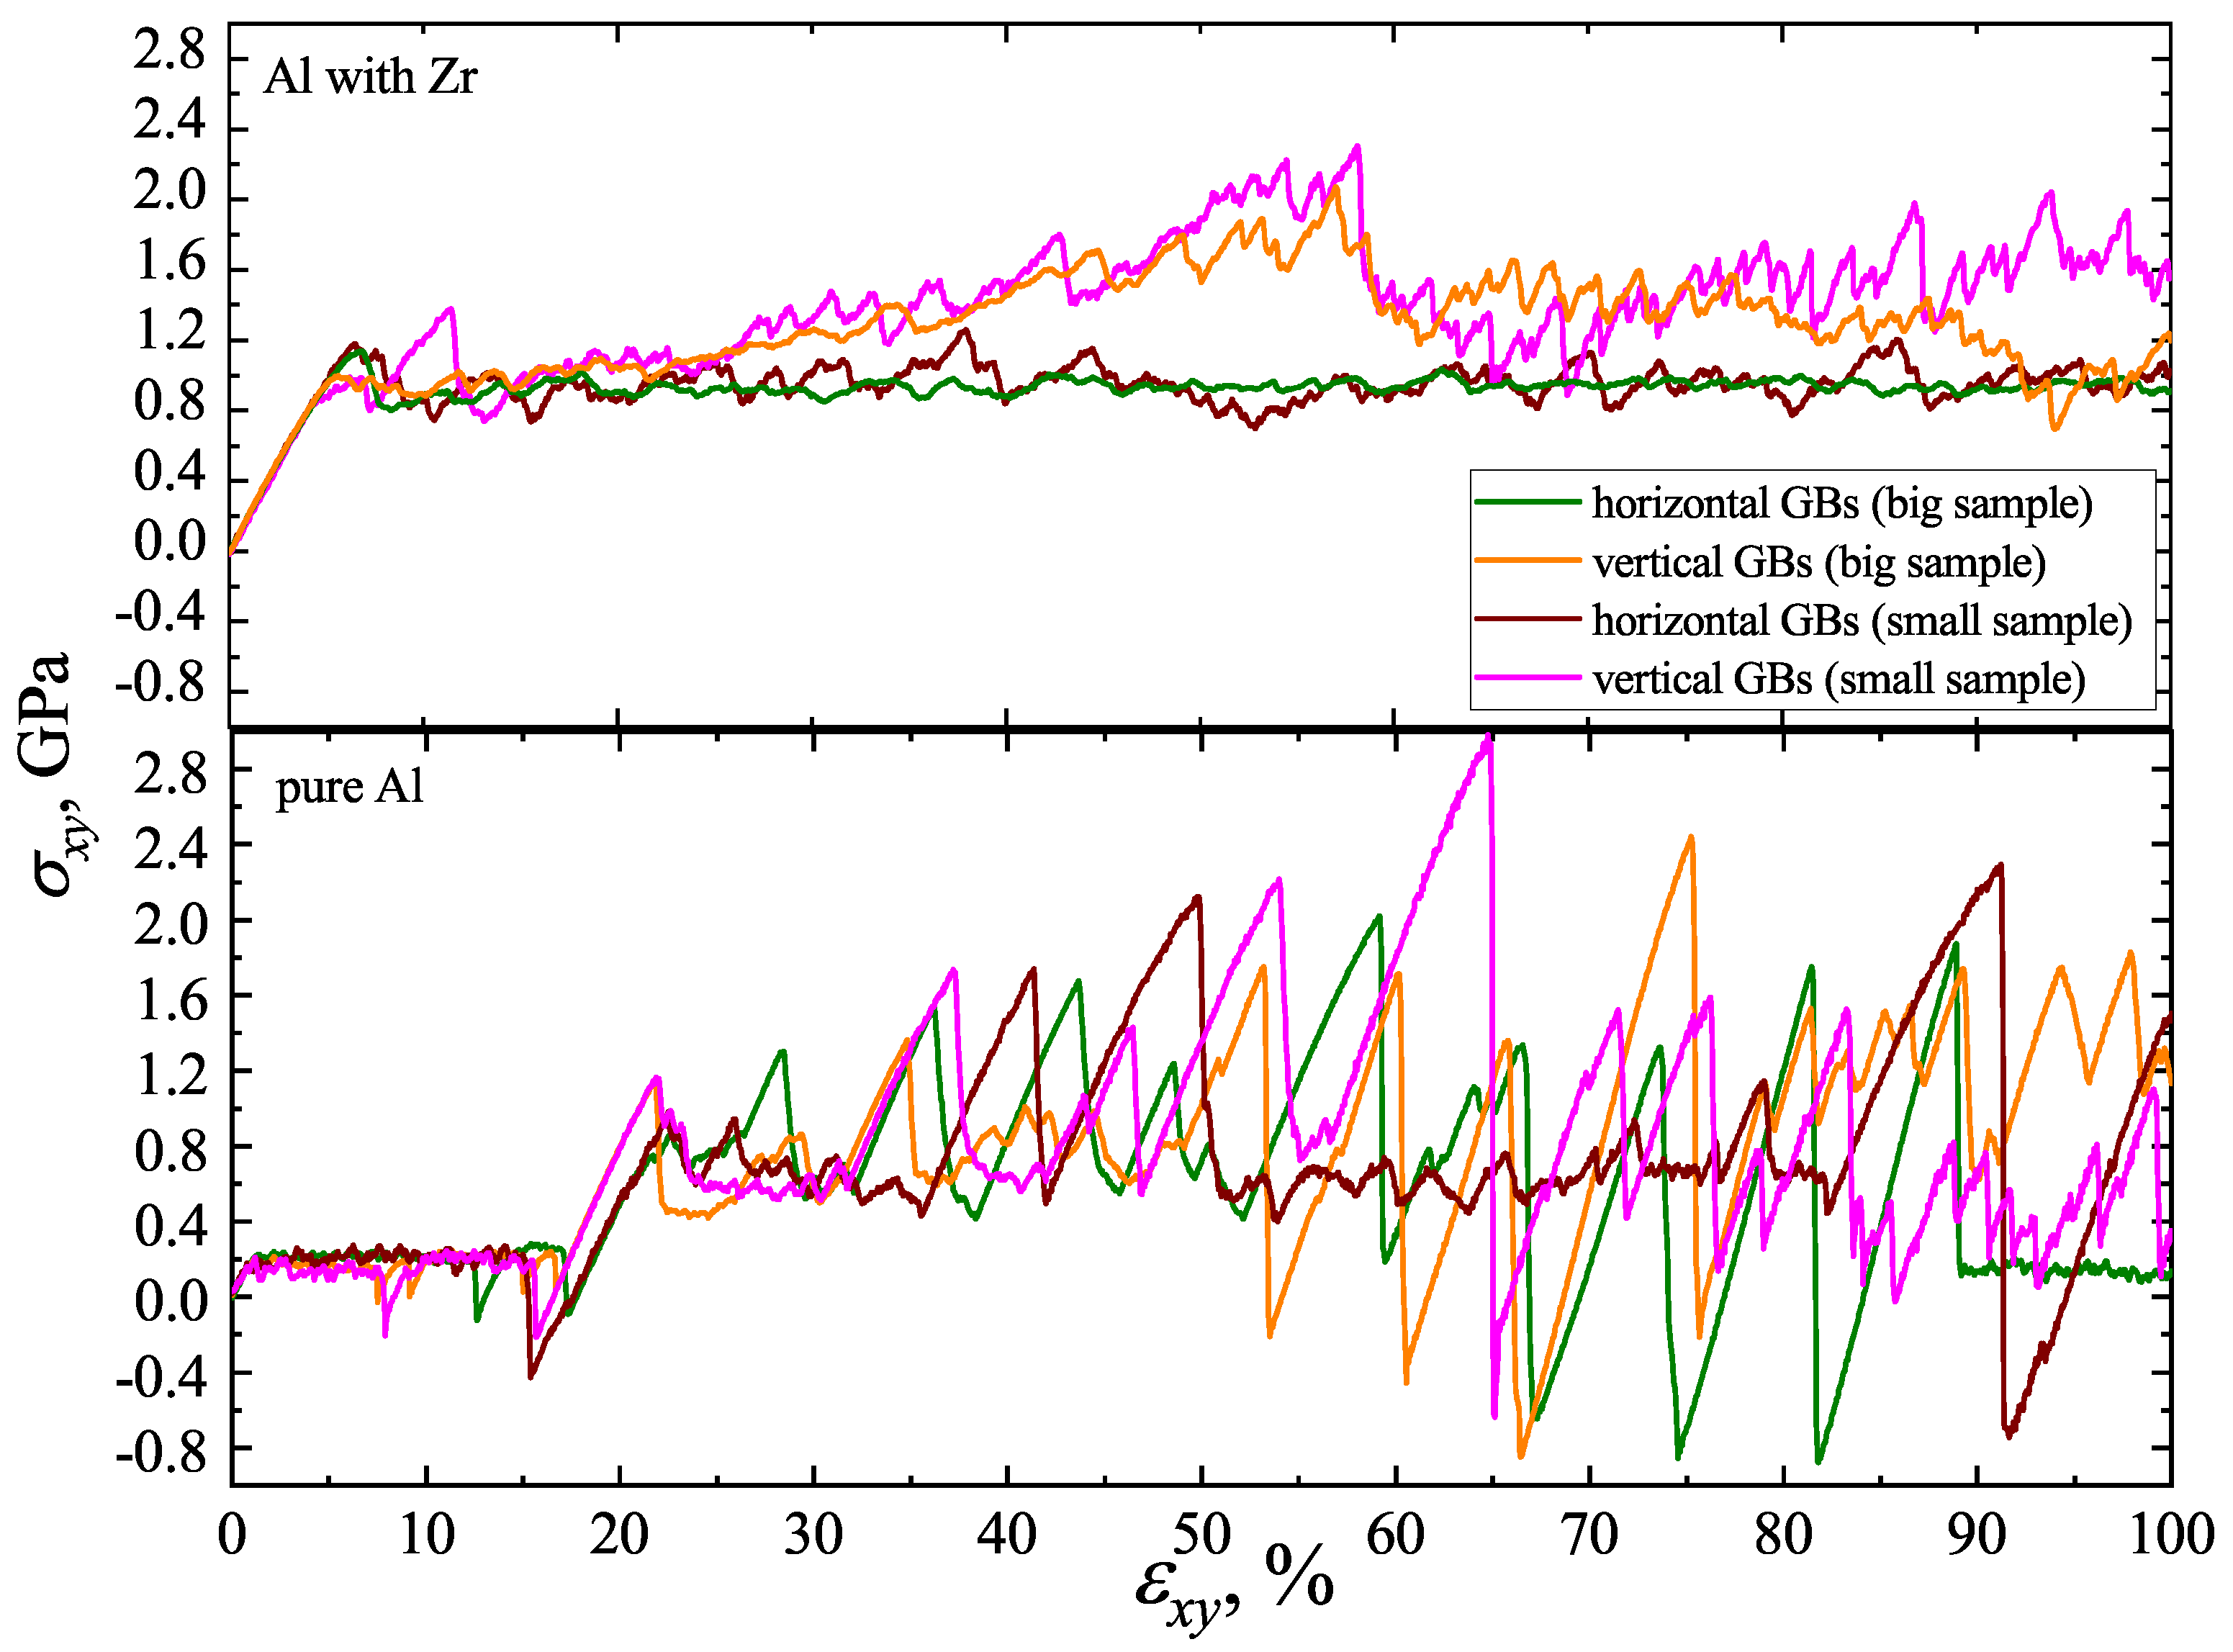
The computational cell size effect is considered for both pure Al and Al alloy at a shear strain rate of ε ˙ x y = 10 8 s 1 . In Figure 6, the shear stress–strain curves for the computational cells of different sizes with VGBs and HGBs are presented for comparison. Overall, for the same material and orientation of GBs, the stress–strain responses look similar, implying that the structure evolution is associated with the same deformation mechanisms. However, it can be seen that the stress–strain curves for big samples are smoother compared to those for the small samples, which is especially evident for the alloy. As for pure Al, one can notice that for the big samples, the strong oscillation of stress values after the stable flow area starts with some delay compared to small computational cells ( ε x y = 0.17 vs. ε x y = 0.15).
We conclude that increasing the volume of the computational cell did not result in a qualitatively different behavior of the considered system.

3.4. Structure Evolution Analysis

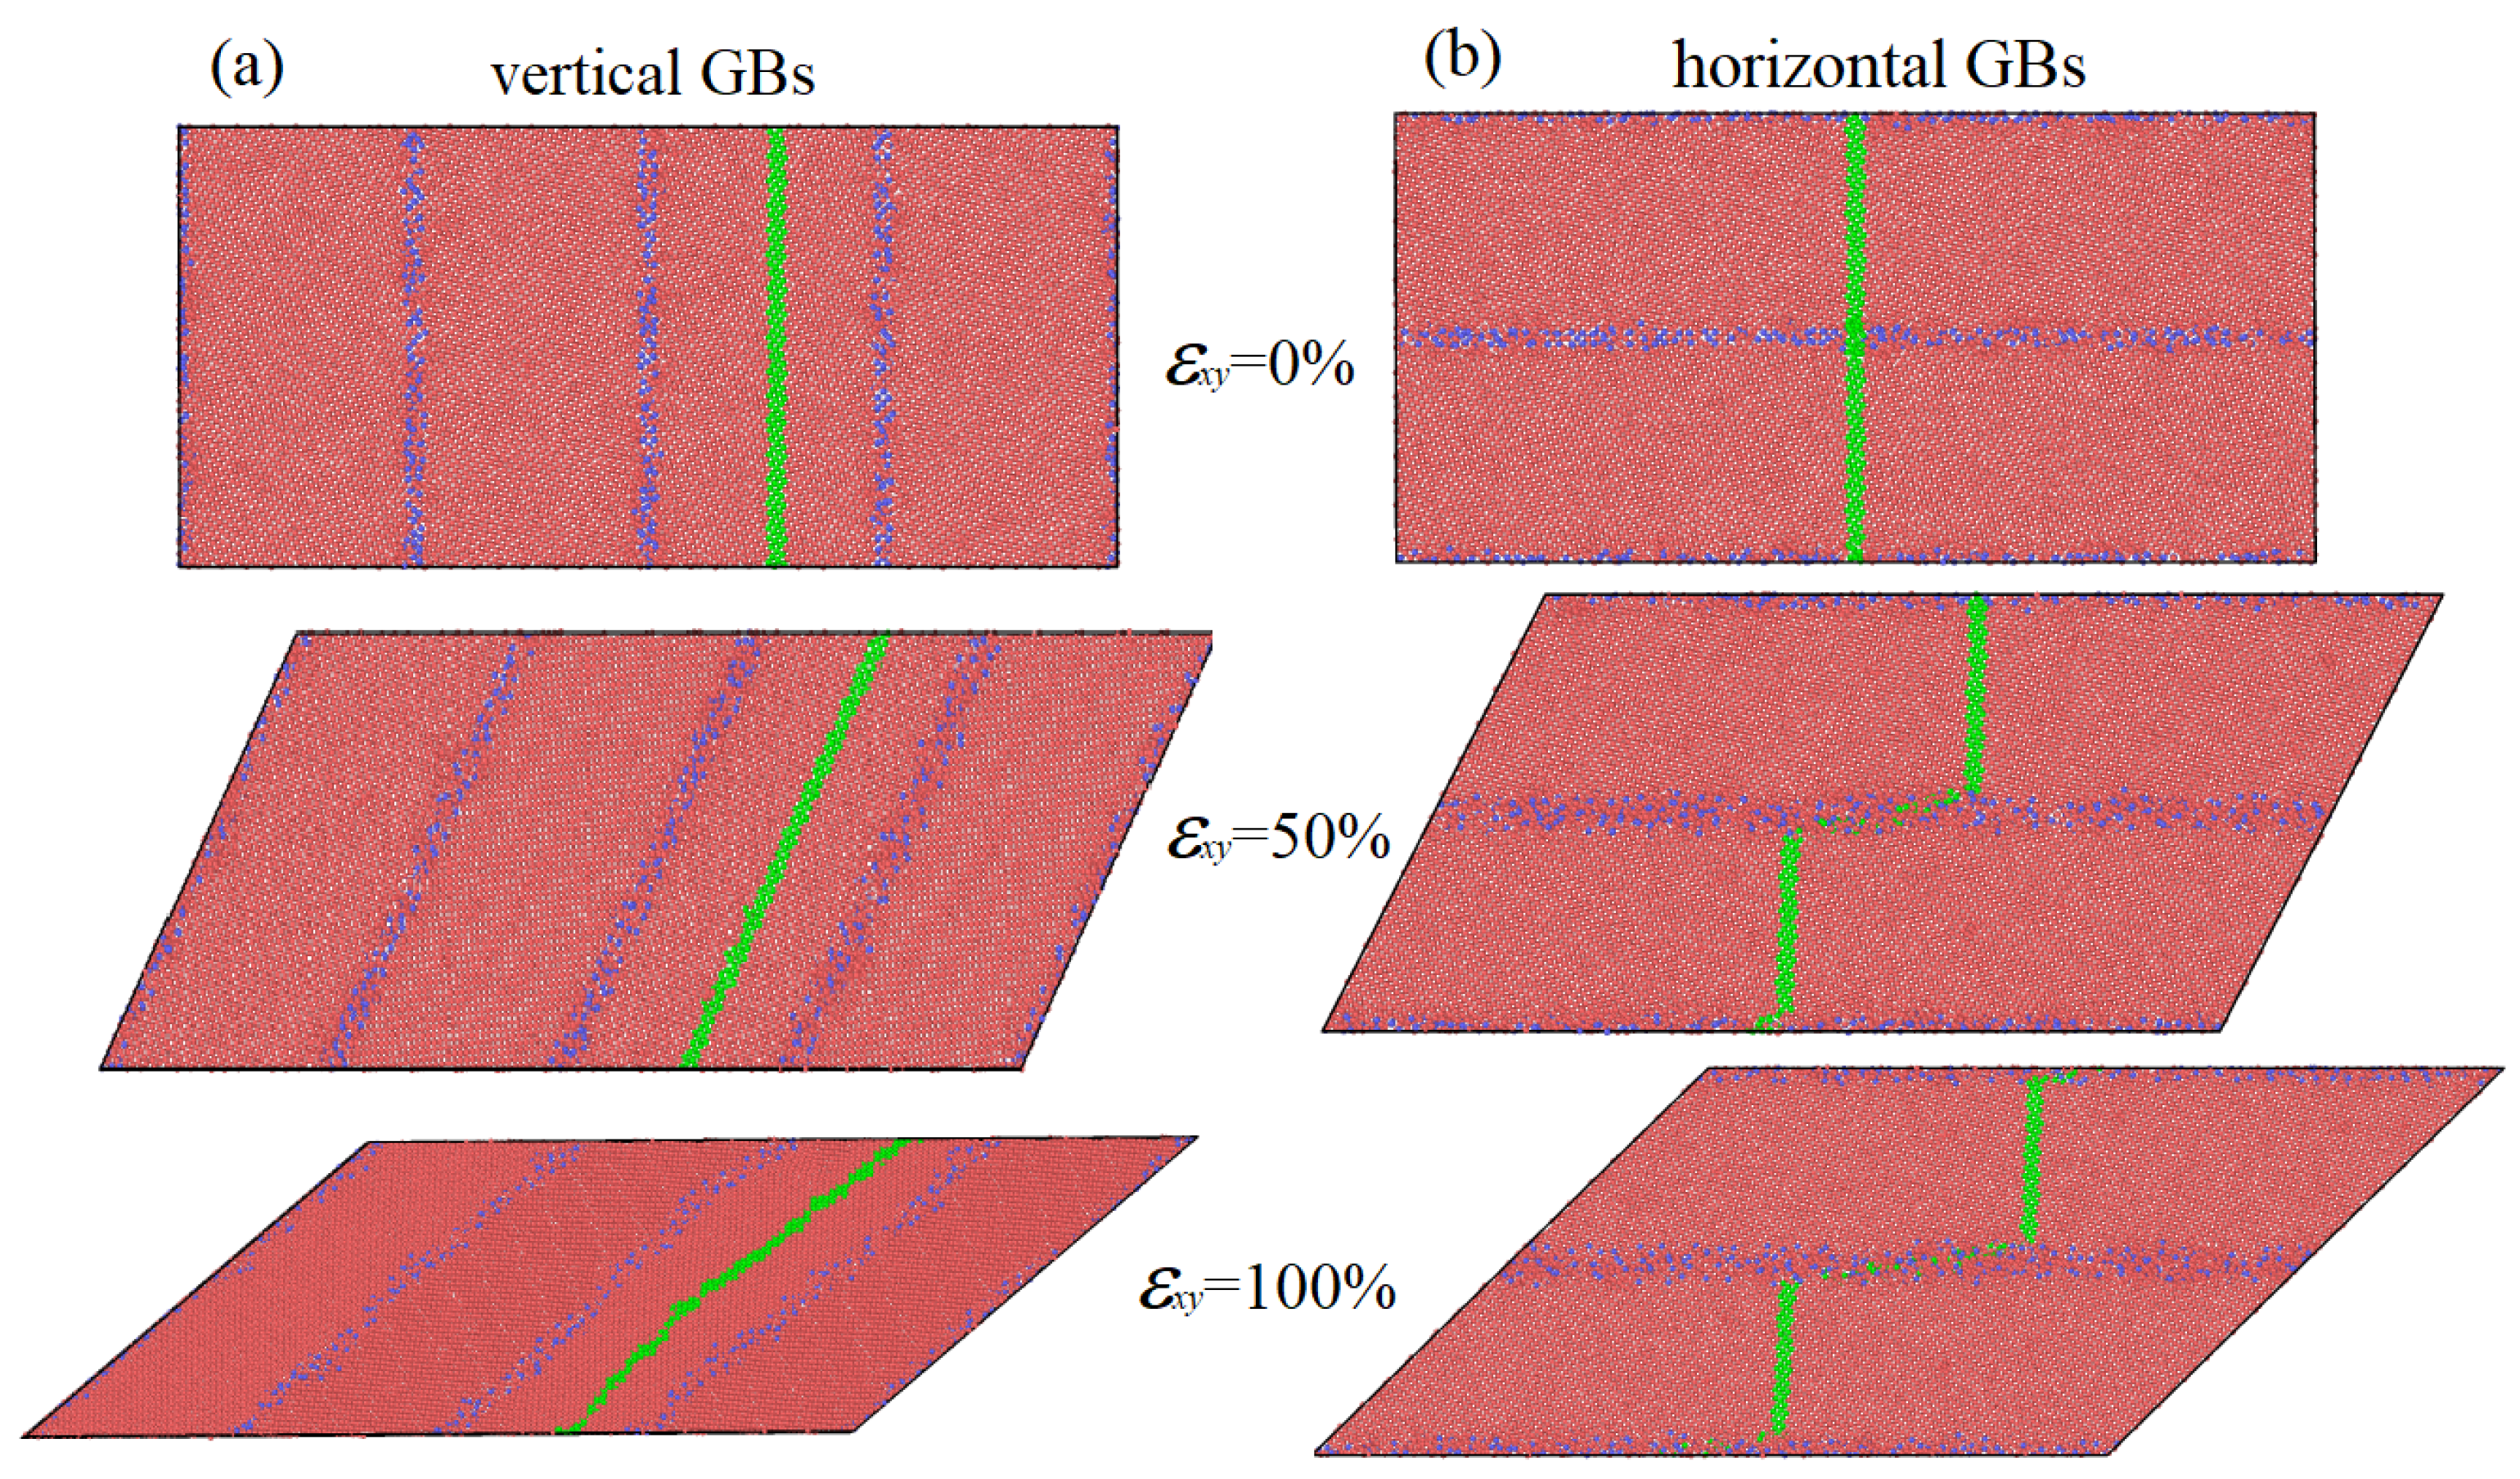
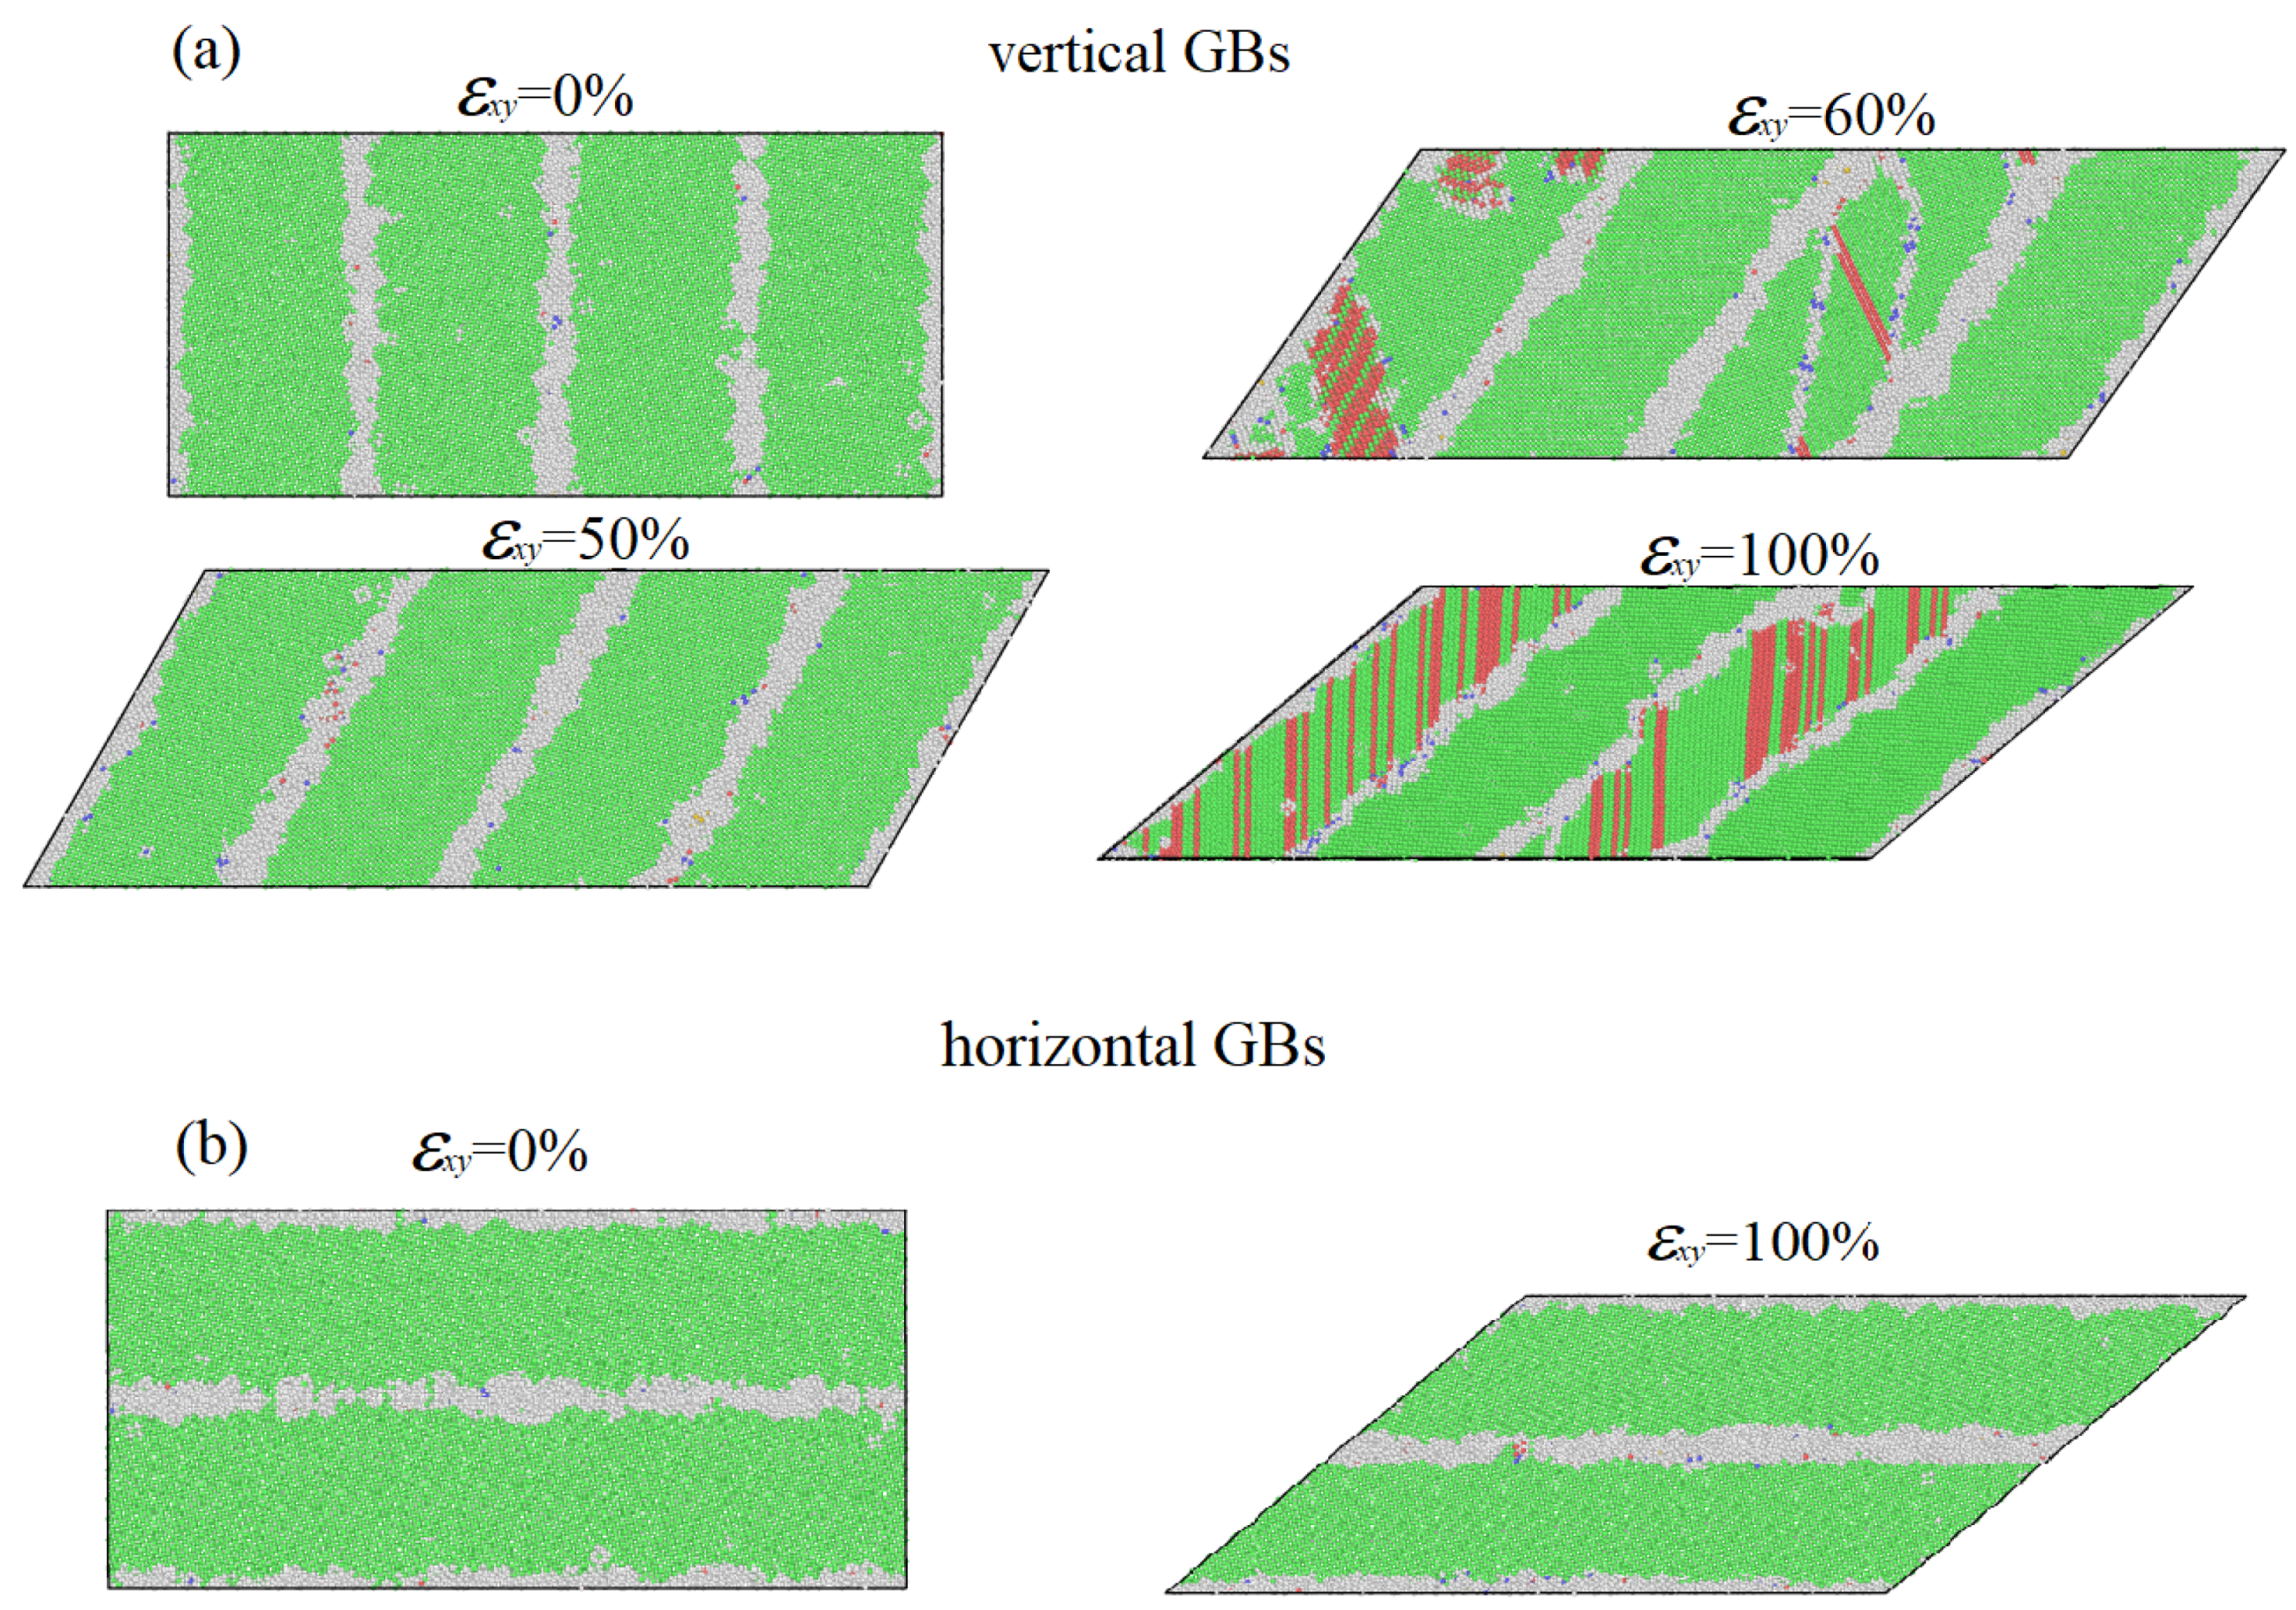
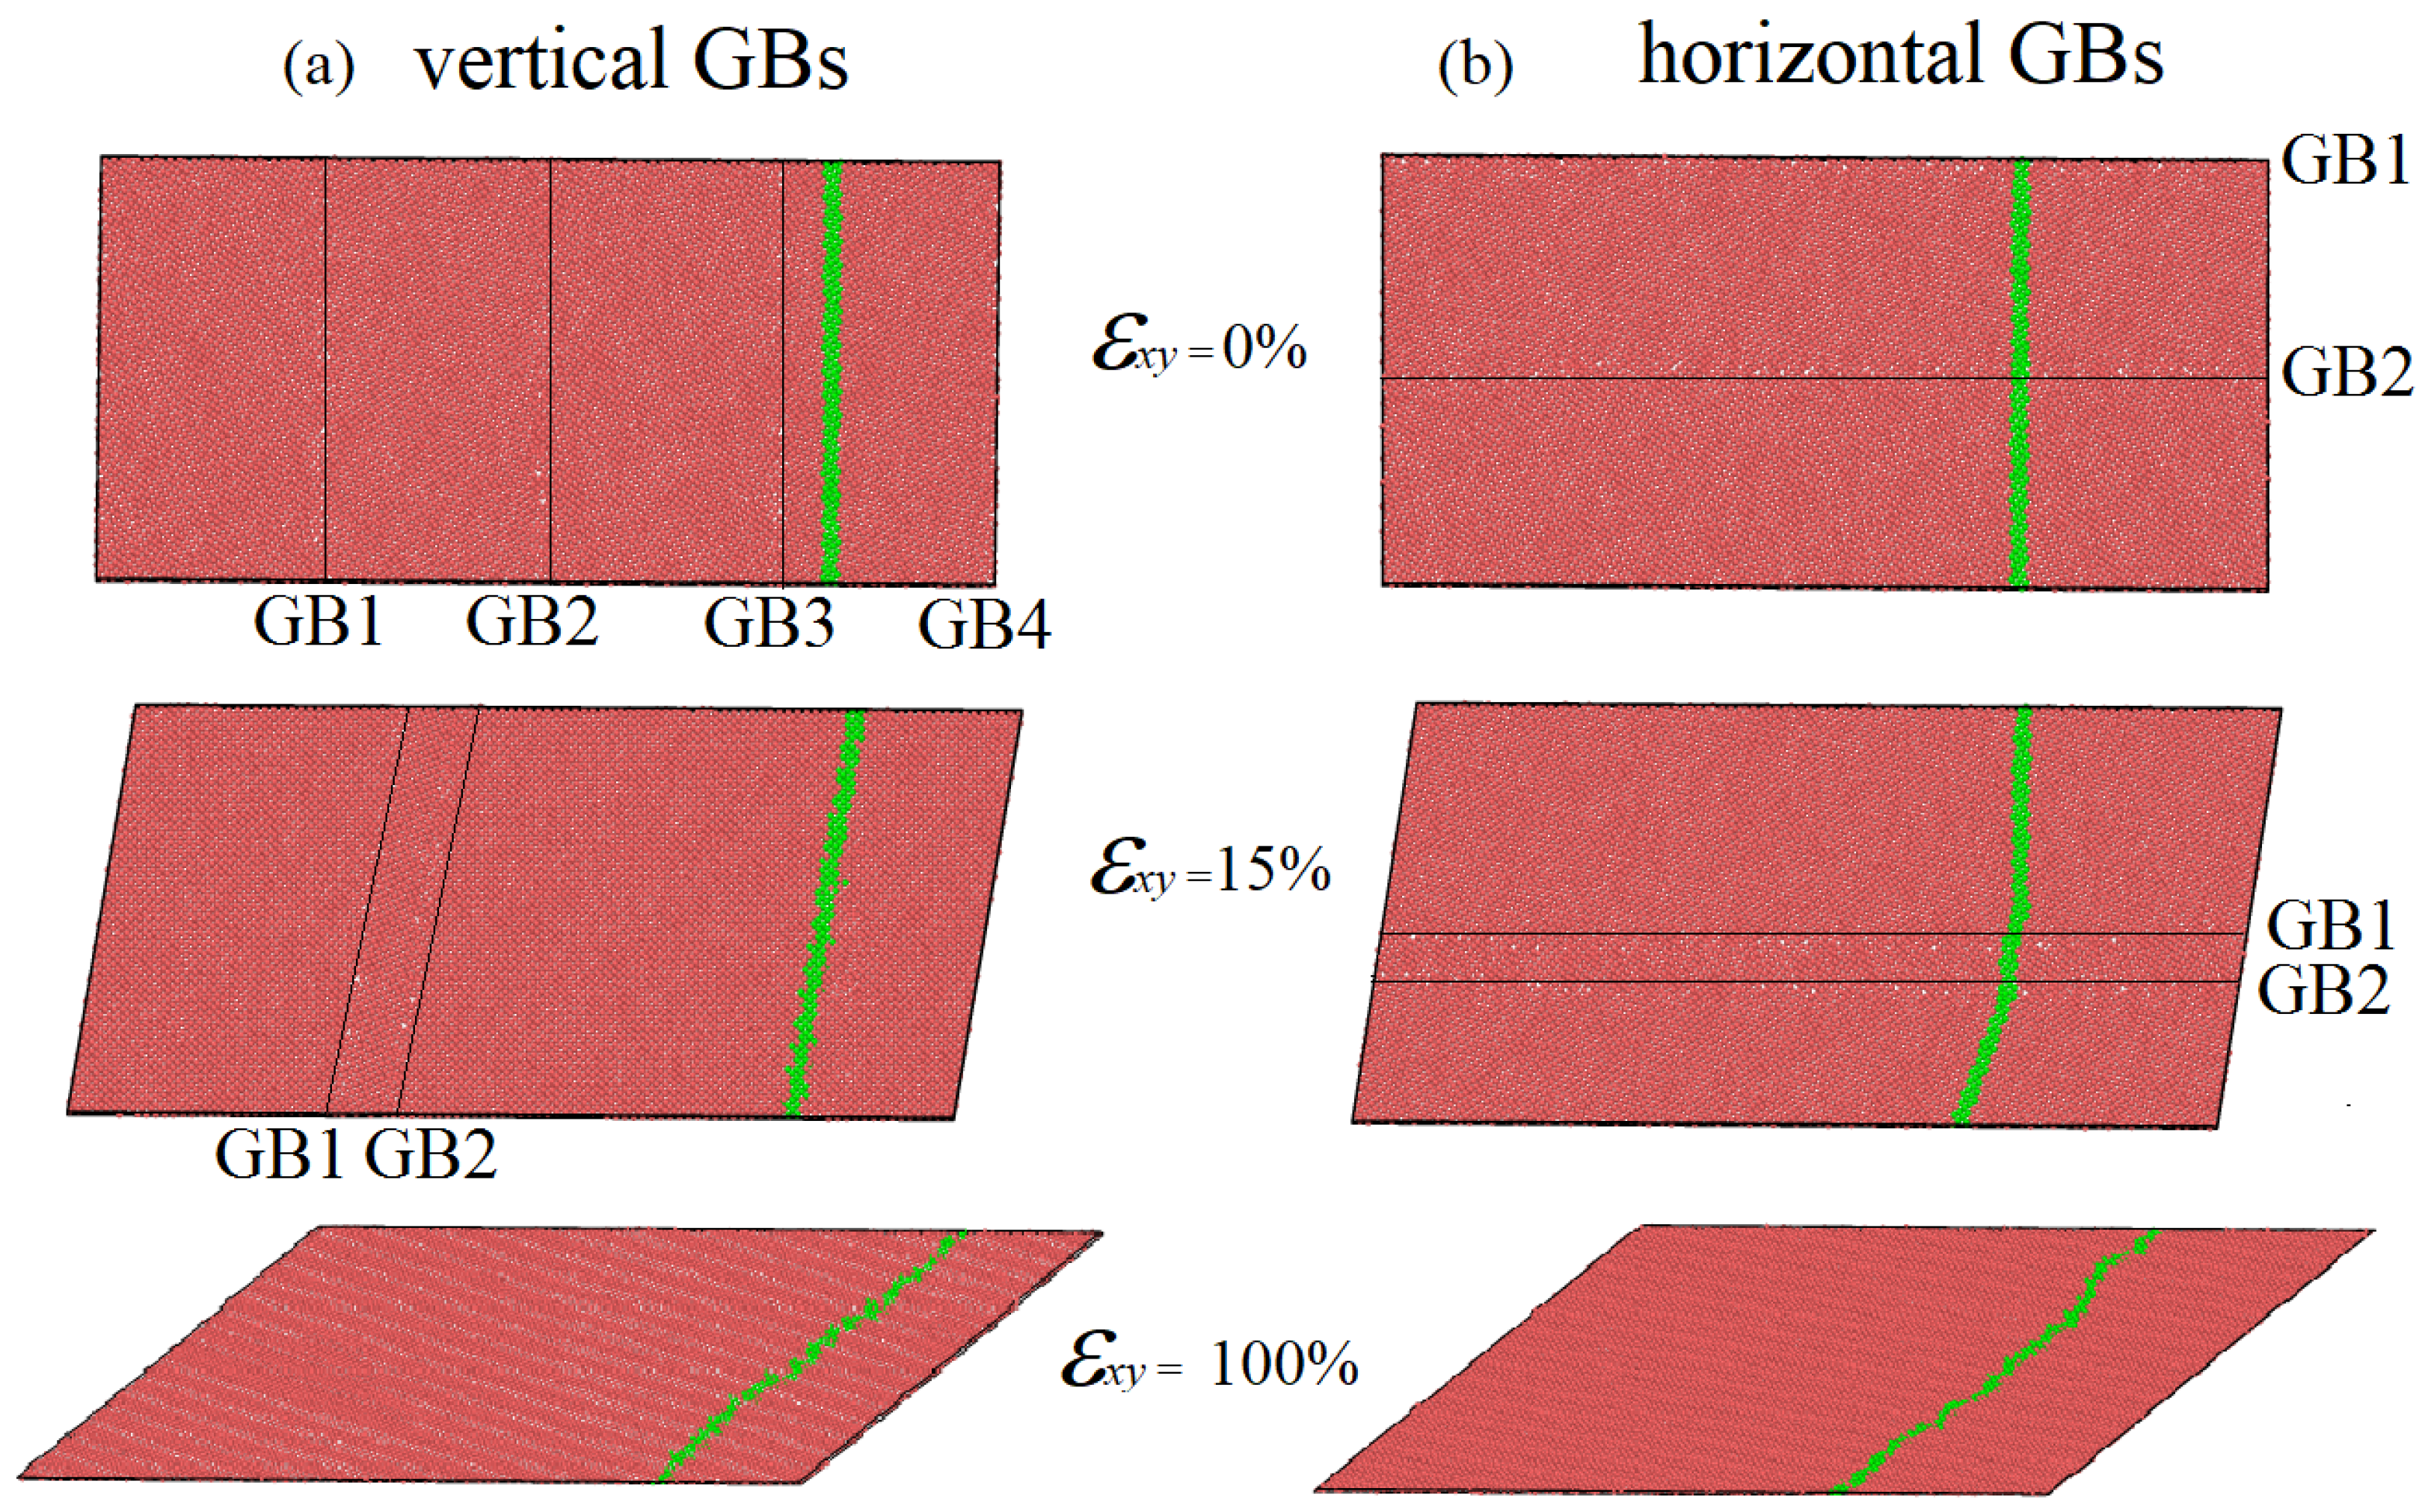
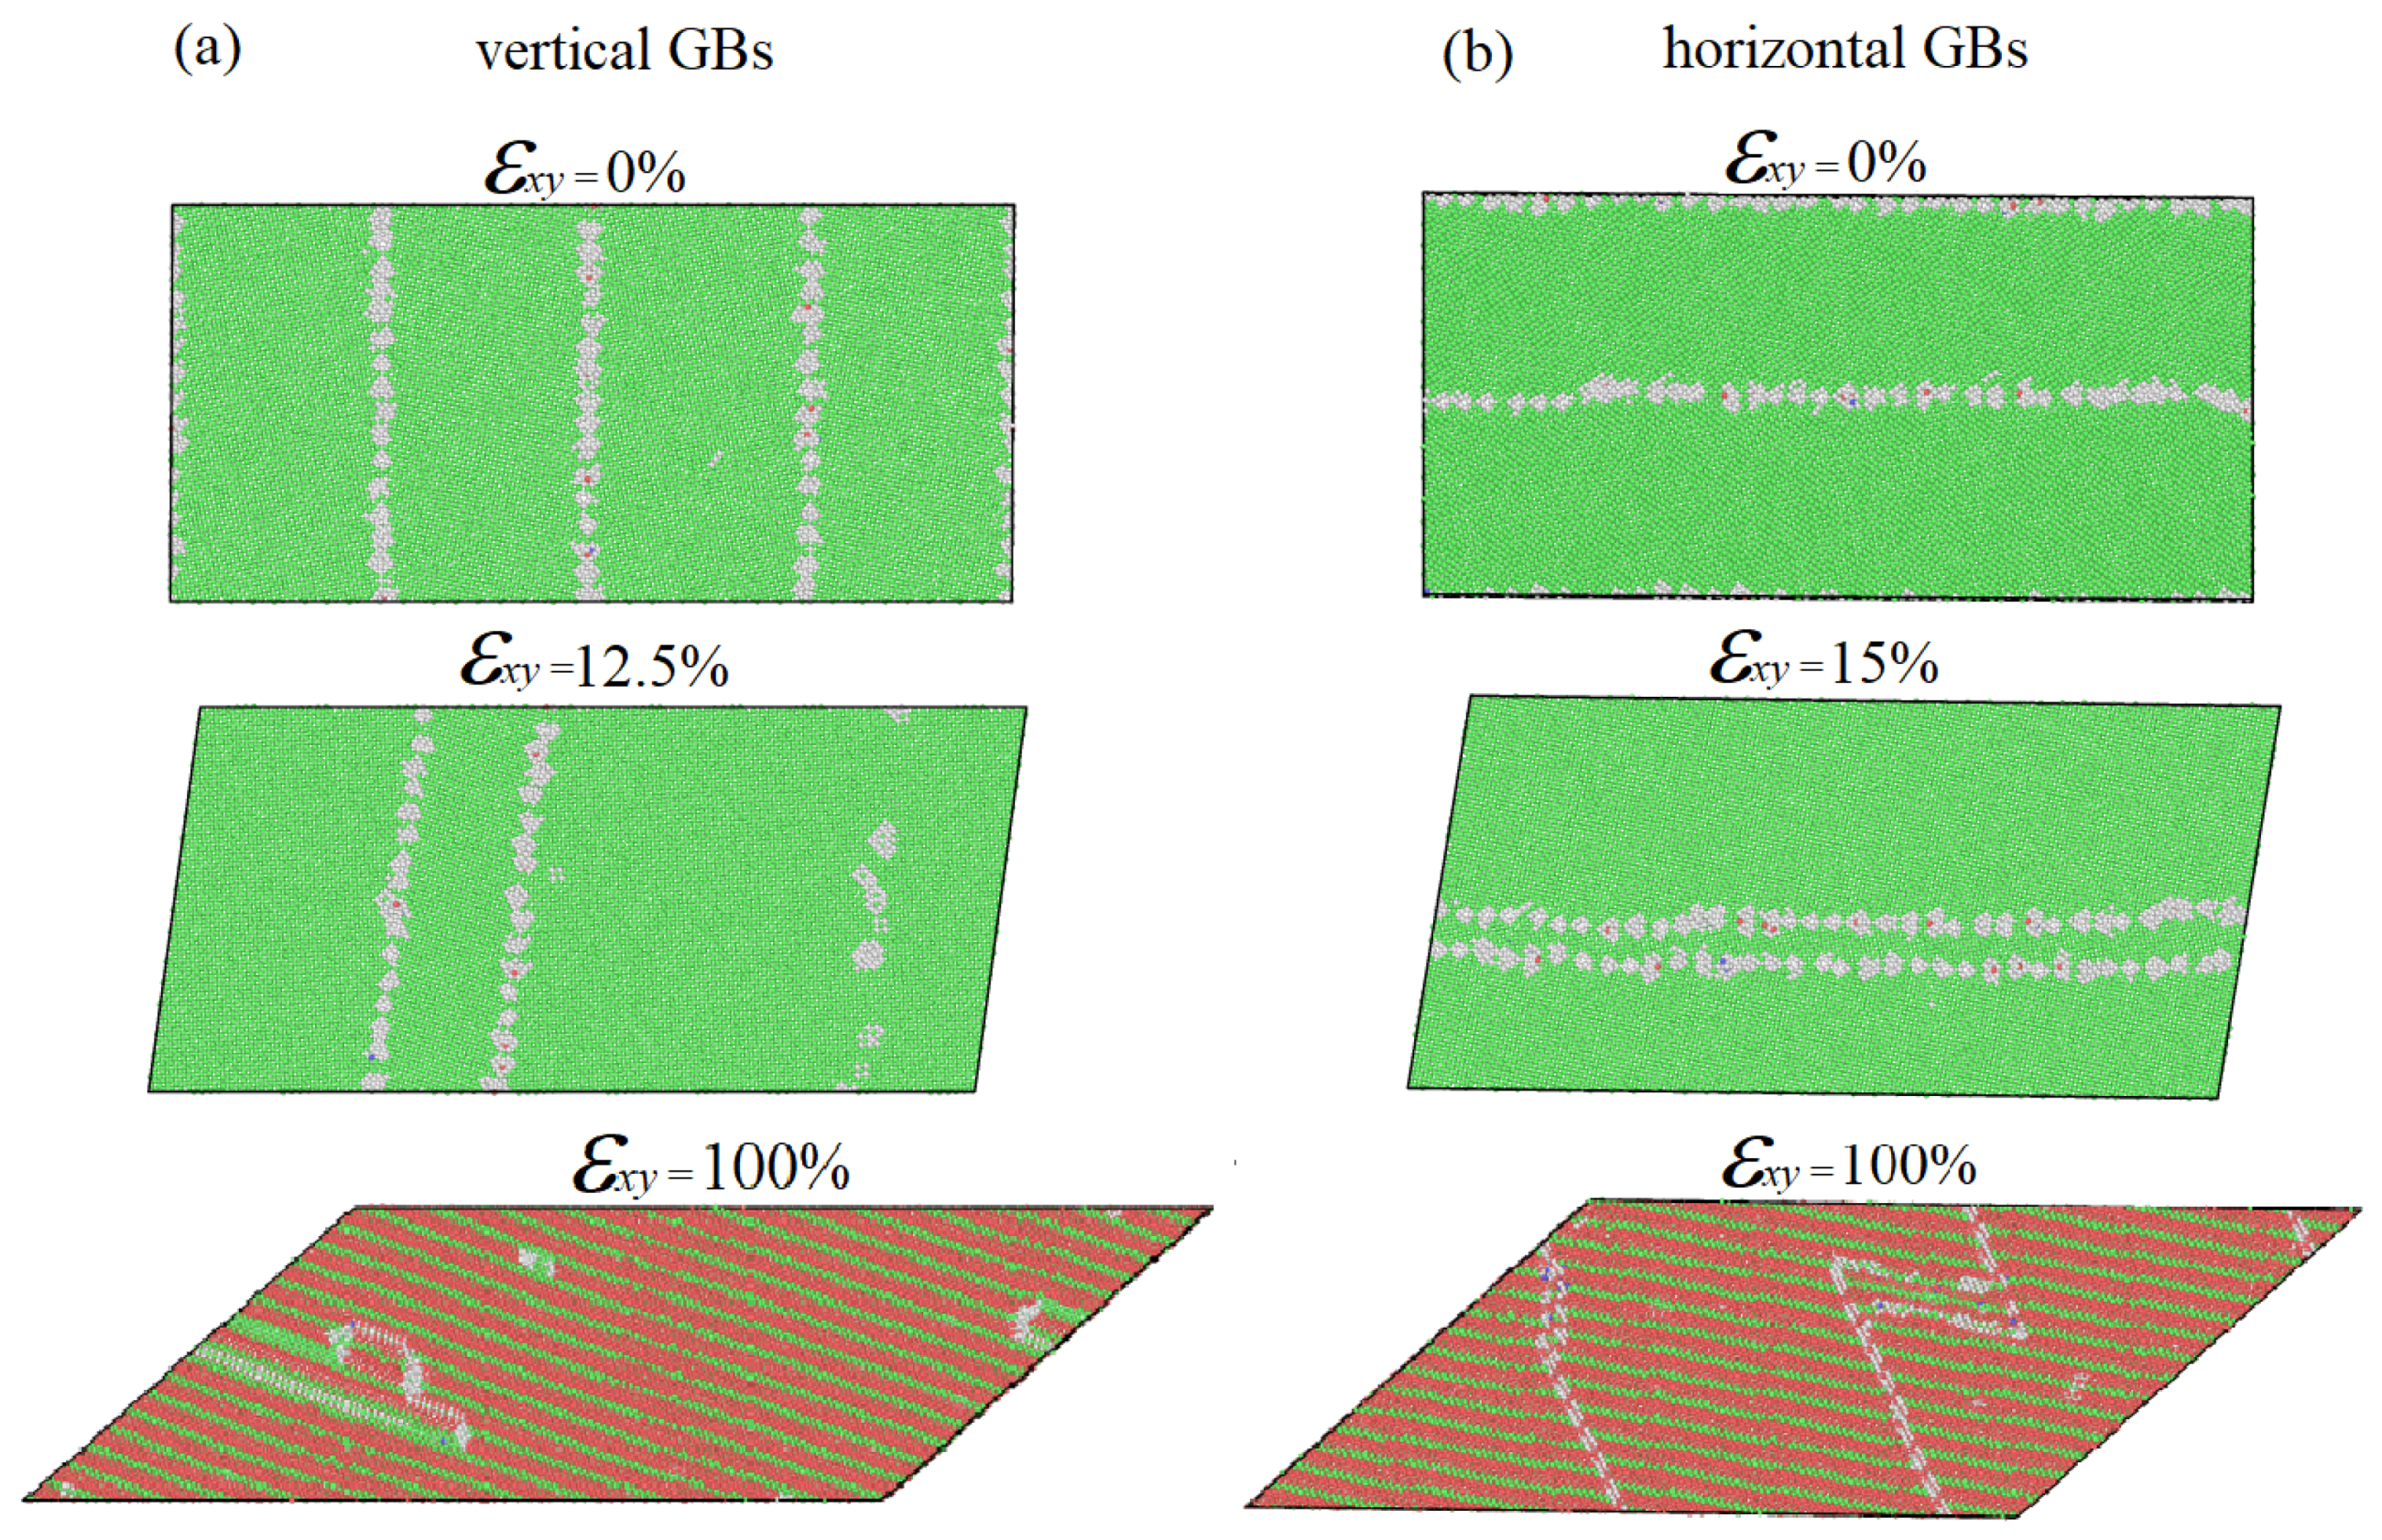
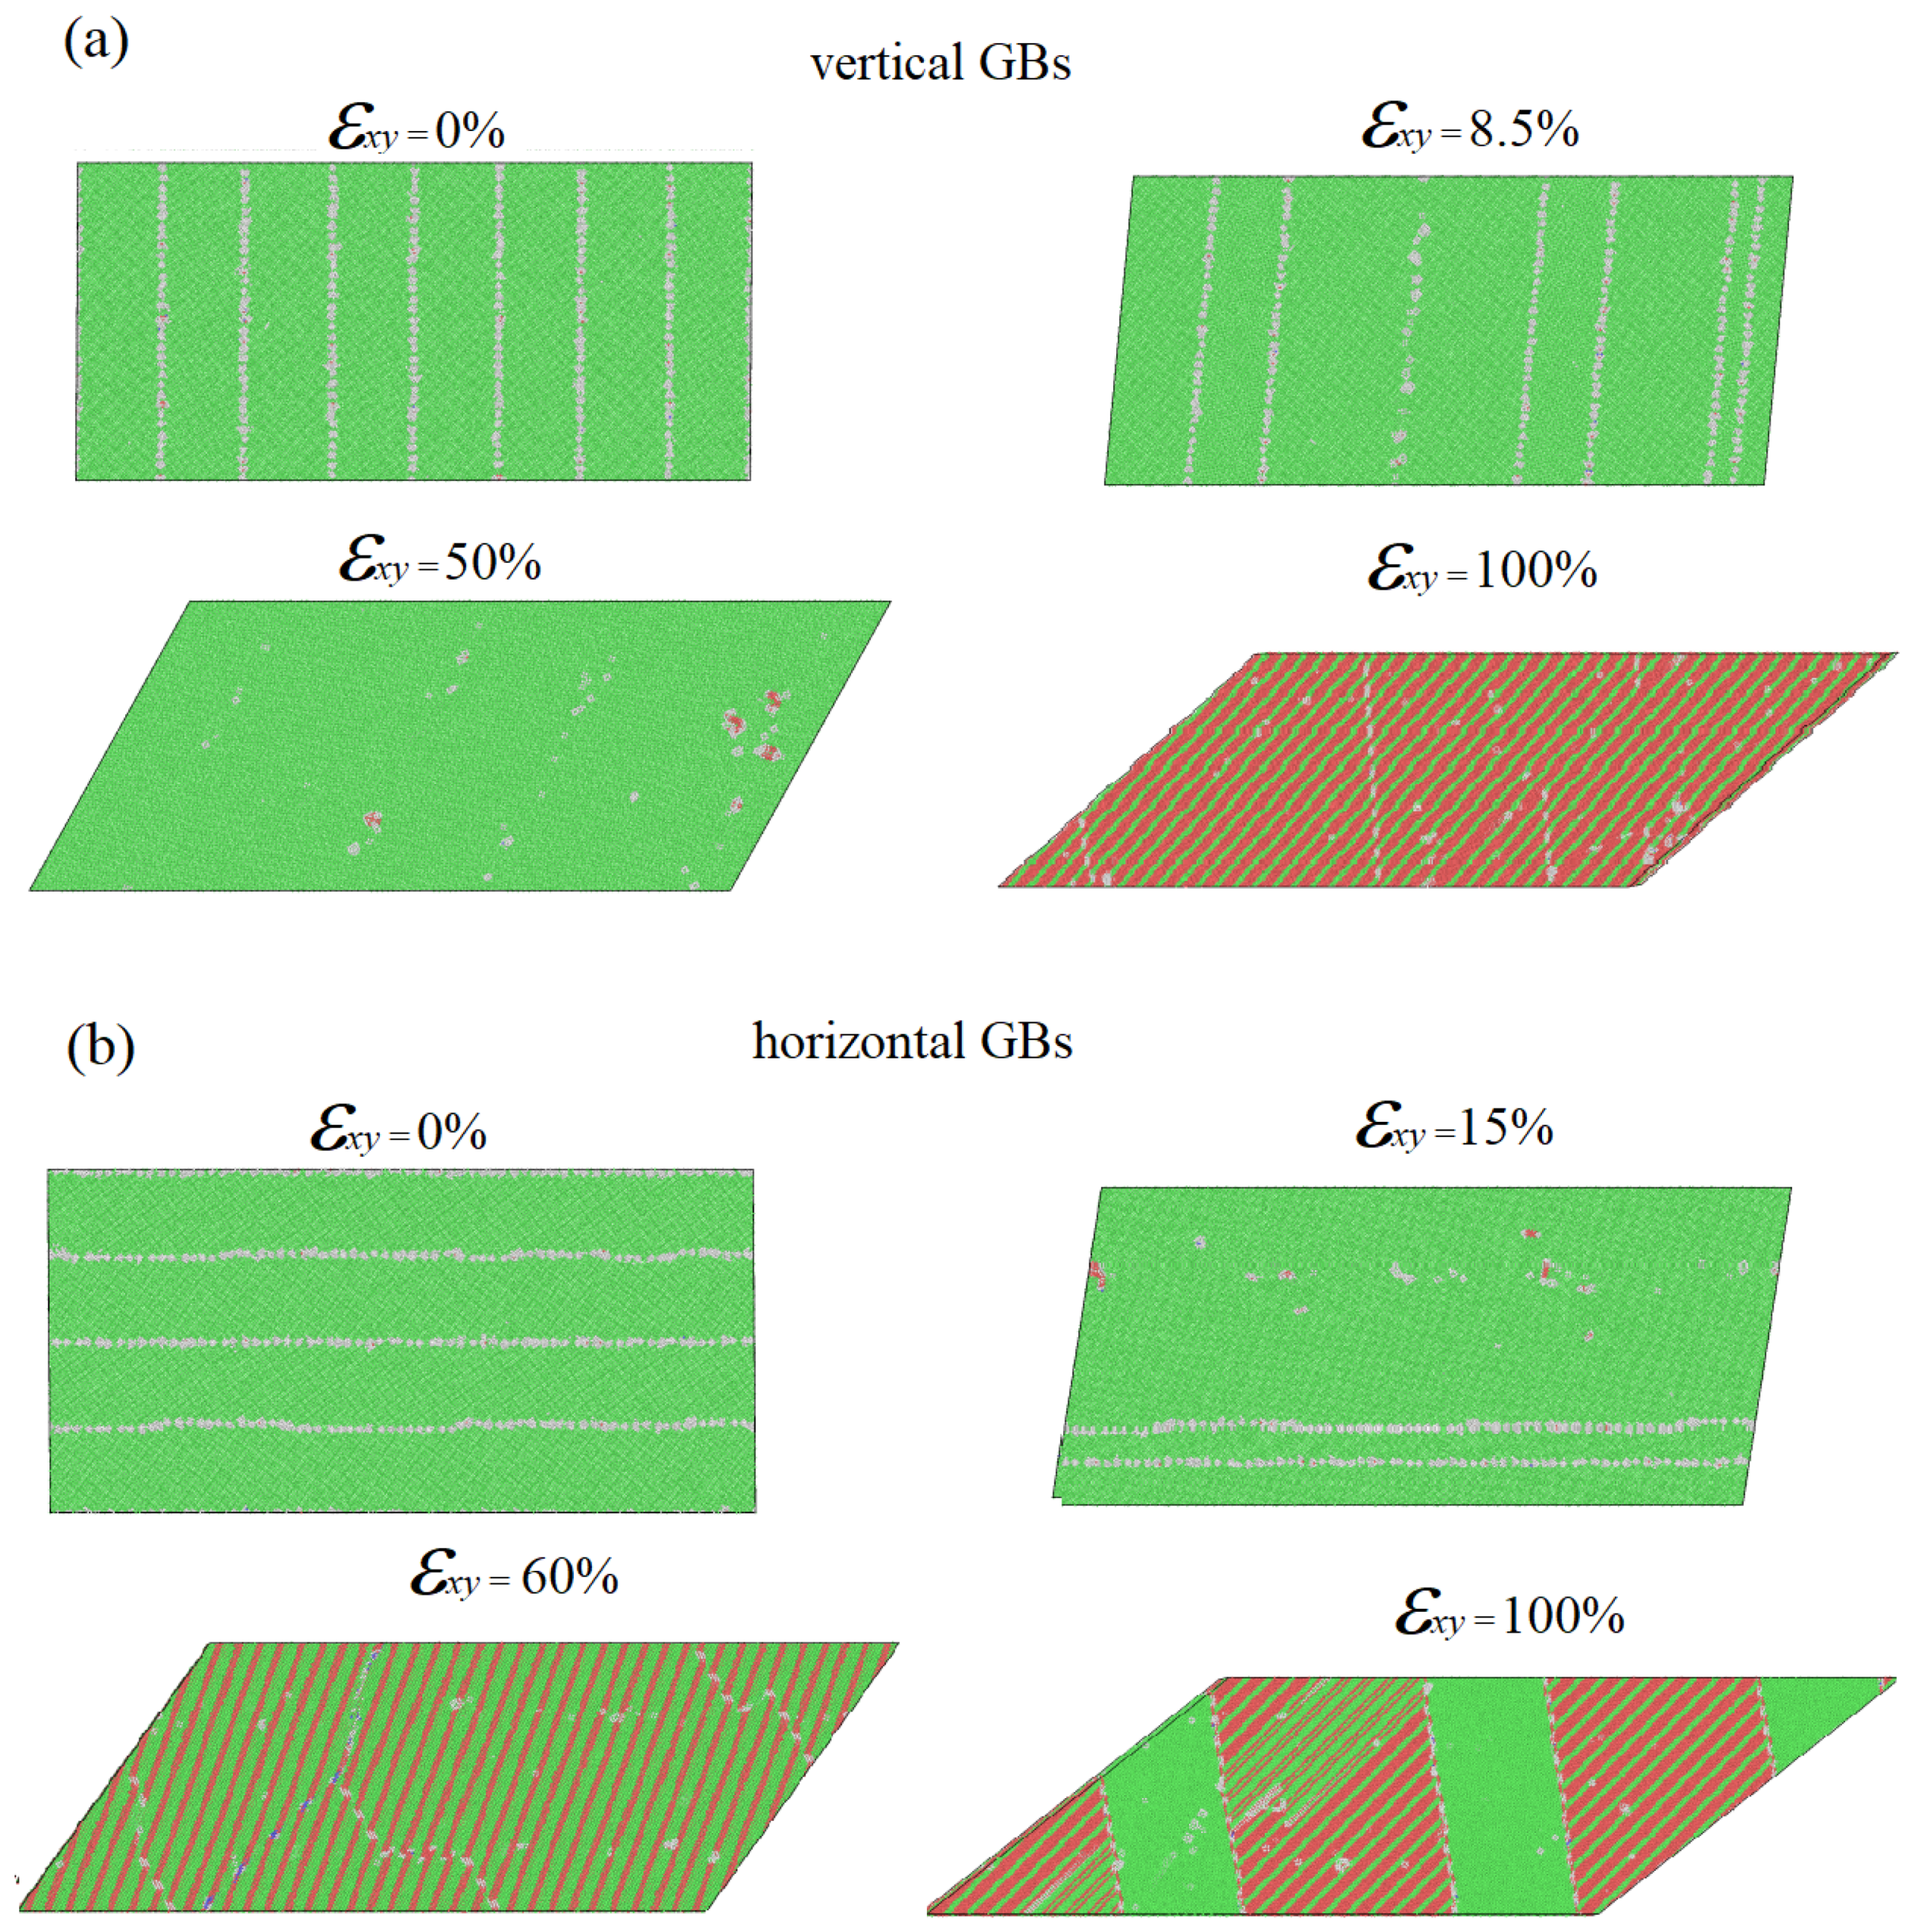
Figure 7 demonstrates the atomic structure evolution in the small computational cells of the Al alloy with Zr atoms at VGBs and HGBs. The shear loading is applied with the strain rate of ε ˙ x y = 10 8 s 1 . Here, red and blue are used for the Al and Zr atoms, respectively. Note that the vertical strips of tagged atoms colored in green are introduced to track the atomic motion during the deformation process. The corresponding common neighbor analysis (CNA) snapshots are presented in Figure 8. Here, green, red and white are used for atoms belonging to fcc, hcp and undefined crystal structures, respectively. Atoms with undefined crystal structure are located around the defects such as GBs, dislocation cores and vacancies.
The splitting the strip of tagged atoms off at GBs during deformation in the case of HGBs indicates the deformation by the GB sliding mechanism, while its inclination with loading for a sample with VGBs can be associated with dislocation movement inside grains. One can see that in the case of VGBs (Figure 8), after 50% deformation, which also corresponds to the peak stress value on the stress–strain curve (see Figure 3), further deformation and material relaxation is associated with its fragmentation and accumulation of twins and stacking faults. The strips of the hcp structure appear as the result of partial dislocation gliding leading to the formation of stacking faults. Thus, at 60% the domain of a new grain can be observed which grows at the expense of the original one. With further deformation, multiple stacking faults fill the newly formed grain. Unlike sample with VGBs, for the sample having HGBs, the deformation process mainly occurs thanks to the GB sliding. No stacking faults can be found in the structure in this case up to 100% deformation.
Figure 9 and Figure 10 show the corresponding snapshots of structure evolution for pure Al samples. It is seen that the stable plastic flow region up to 15% shear deformation (see Figure 3) can be attributed by the GB migration mechanism, when one GB moves towards another GBs forming at ε x y 0.15 single crystal. This works for both sample types, with VGBs and HGBs. The annihilation of two GBs is associated with sudden decrease in stress. As for the cell with VGBs, there are four GBs, and for the sample with HGBs, there are only two GBs (see Figure 9 and Figure 3 for a comparison); one can see two and one such relaxation steps on the corresponding stress–strain curves, respectively. Further deformation is associated with strong fluctuations in stresses when material strengthening is followed by an abrupt decrease in stresses that occur through the formation of stacking faults and crystal fragmentation.
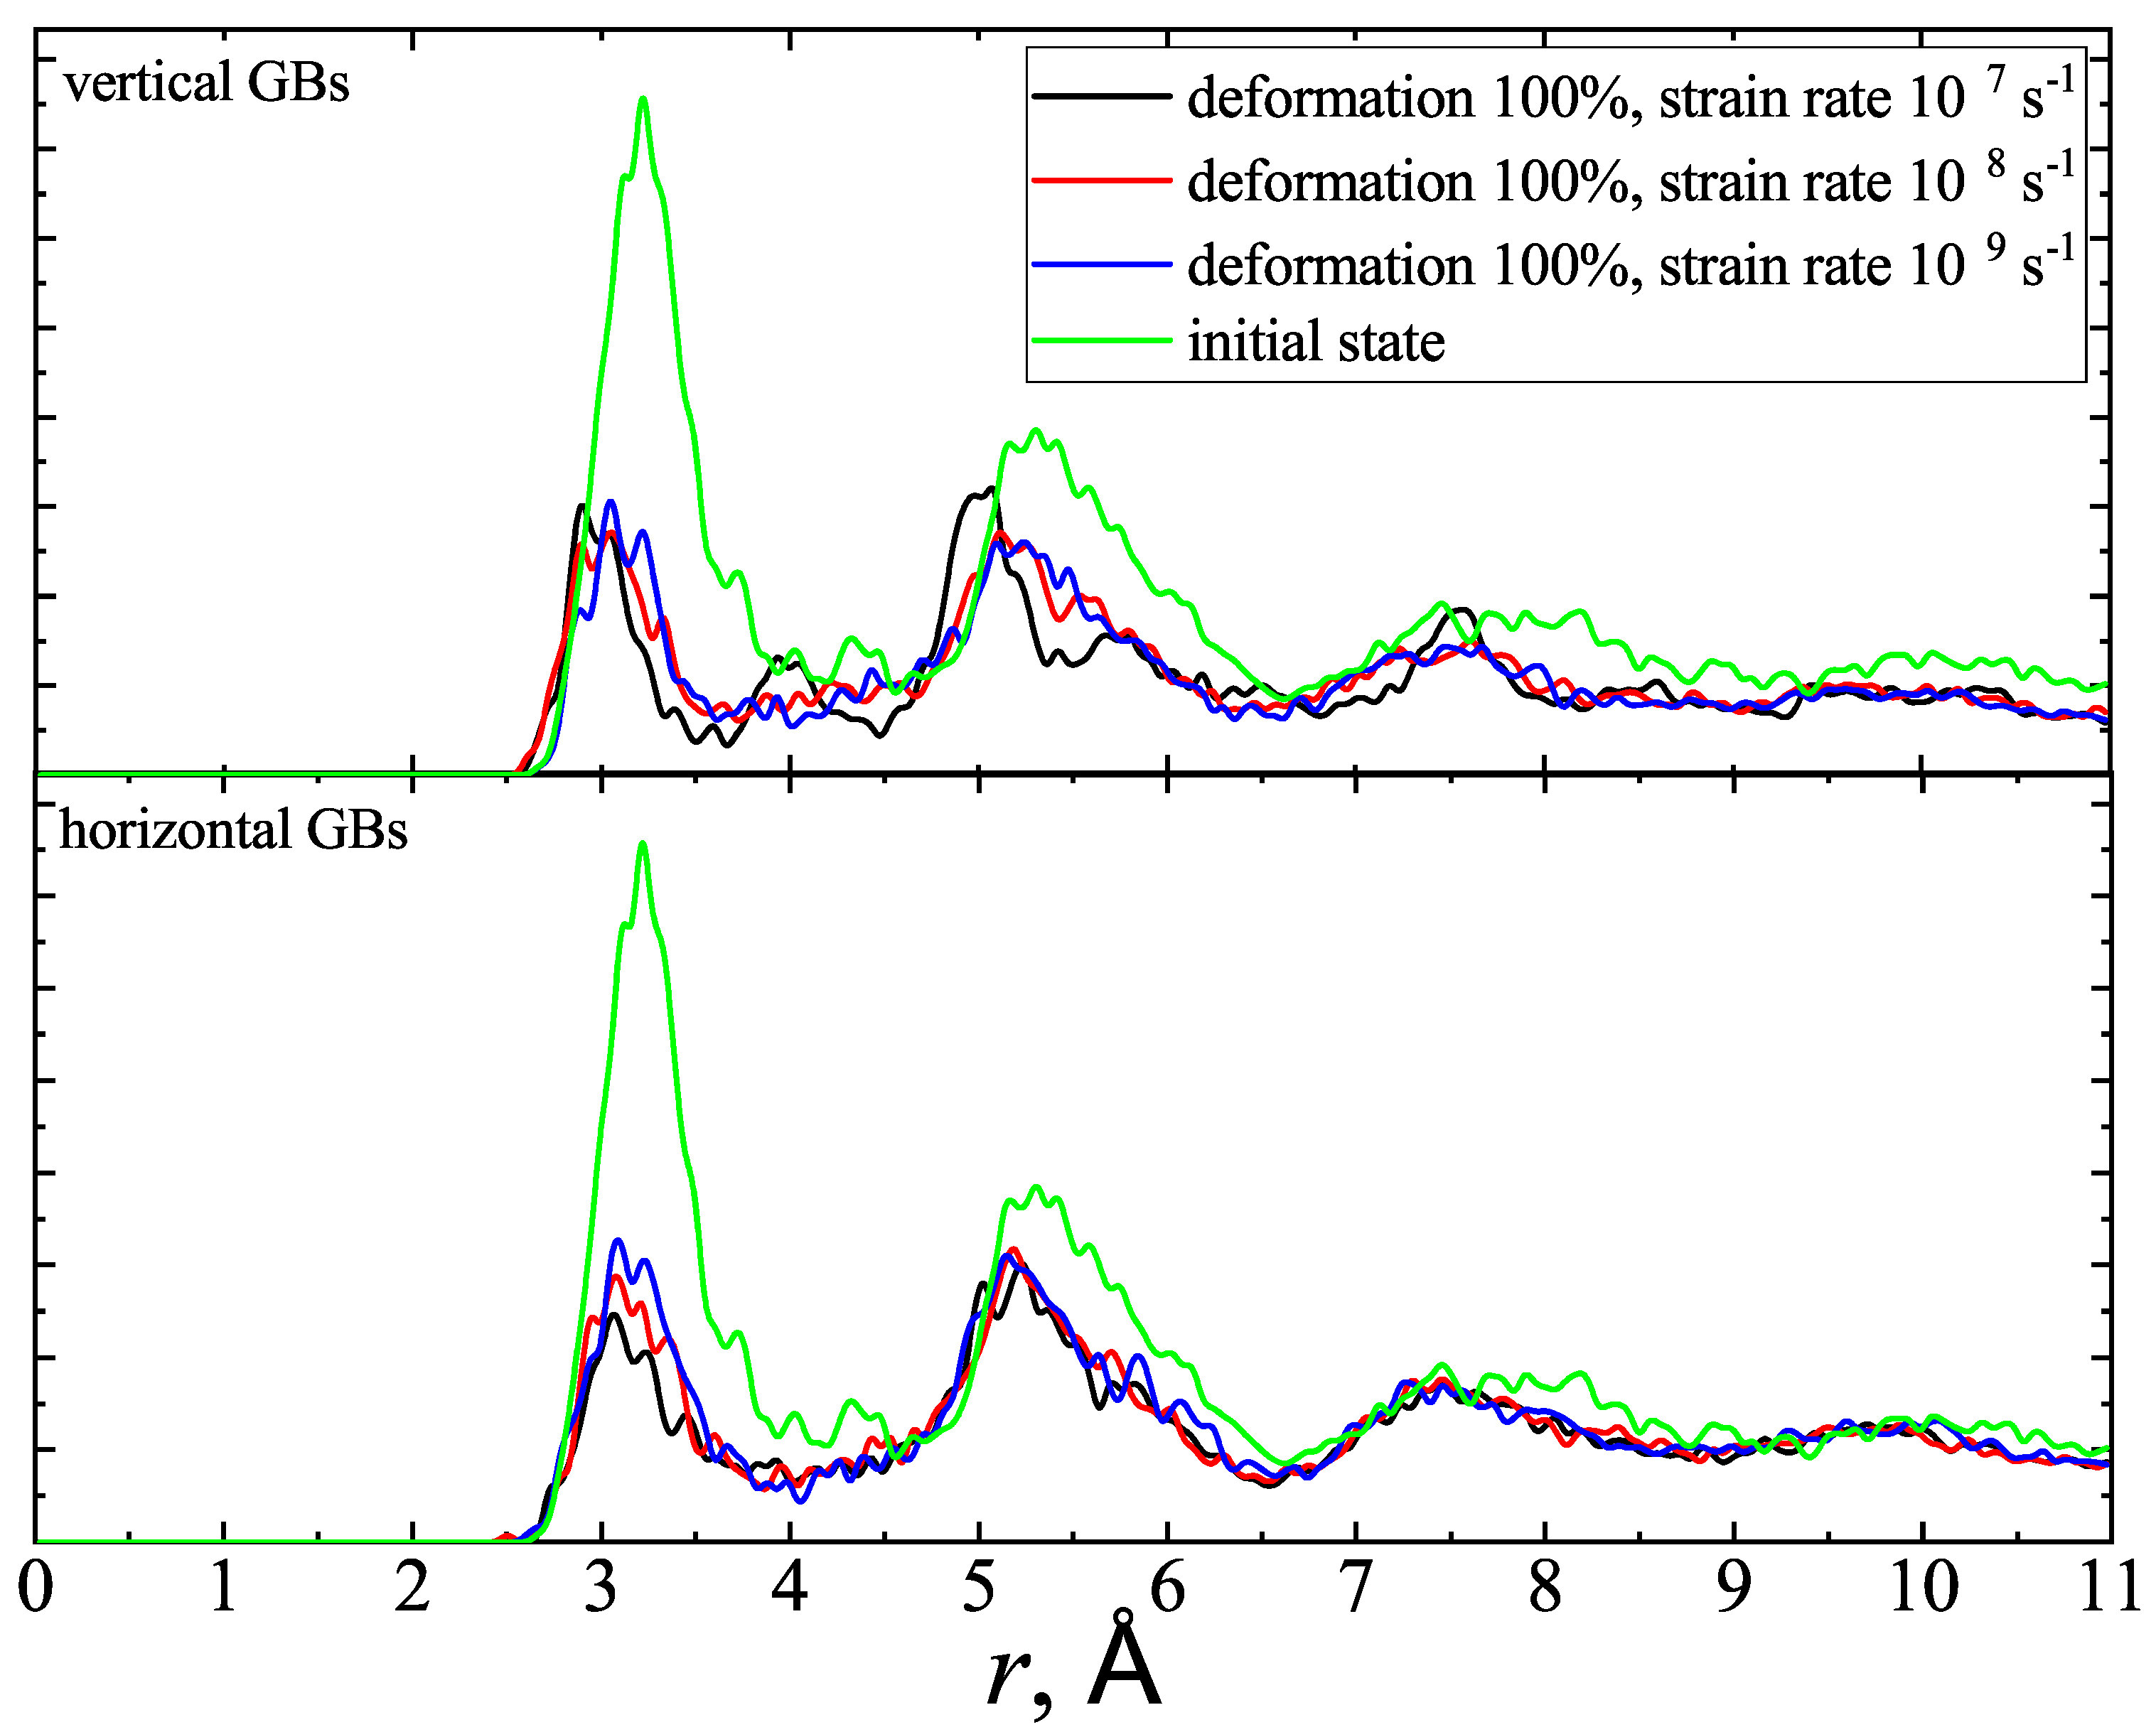
Important to note is that during the SPD of the Al alloy, the Zr atoms in GBs move away from each other, which is also proved by the radial distribution function (RDF) curves plotted for the small samples (see Figure 11). Thus, the intensity of the peaks on the RDF curves plotted for Zr atoms decreases significantly, indicating the spread or dissolution of Zr atoms during deformation. Comparison with RDFs plotted for the other considered strain rates reveals that in the case of HGBs, the strain rate affects the Zr distribution. The lower the strain rate, the lower the first peak, which indicates a better dissolution of Zr atoms.
In Figure 12 and Figure 13, the results of the common neighbor analysis are presented for big sample of Al-3at.%Zr and pure Al, respectively, at different levels of shear strain specified for each panel. Comparison analyses of the deformation behaviors for small and big samples of the Al-Zr alloy does not reveal any significant differences in the deformation mechanisms, especially for the case of HGBs. Similarly to the small computational cell, the GB sliding is the main mechanism of plastic flow in this case. However, fragmentation and the generation of stacking faults in big sample occur more uniformly and, unlike the small sample, at the end deformation, they can be observed in each crystal. This explains that the stress–strain curves for the big sample are visibly smoother (Figure 6). As for pure Al (Figure 13), the structure evolution resembles the behavior of the corresponding small samples. After the formation of a single crystal, stacking faults fill whole the crystal, and the strong stress oscillation takes place. The main difference is in the number of relaxation steps at the beginning of the deformation associated with the GB annihilation. For the big samples with more GBs, the number of such steps is higher, as can also be seen in Figure 6.
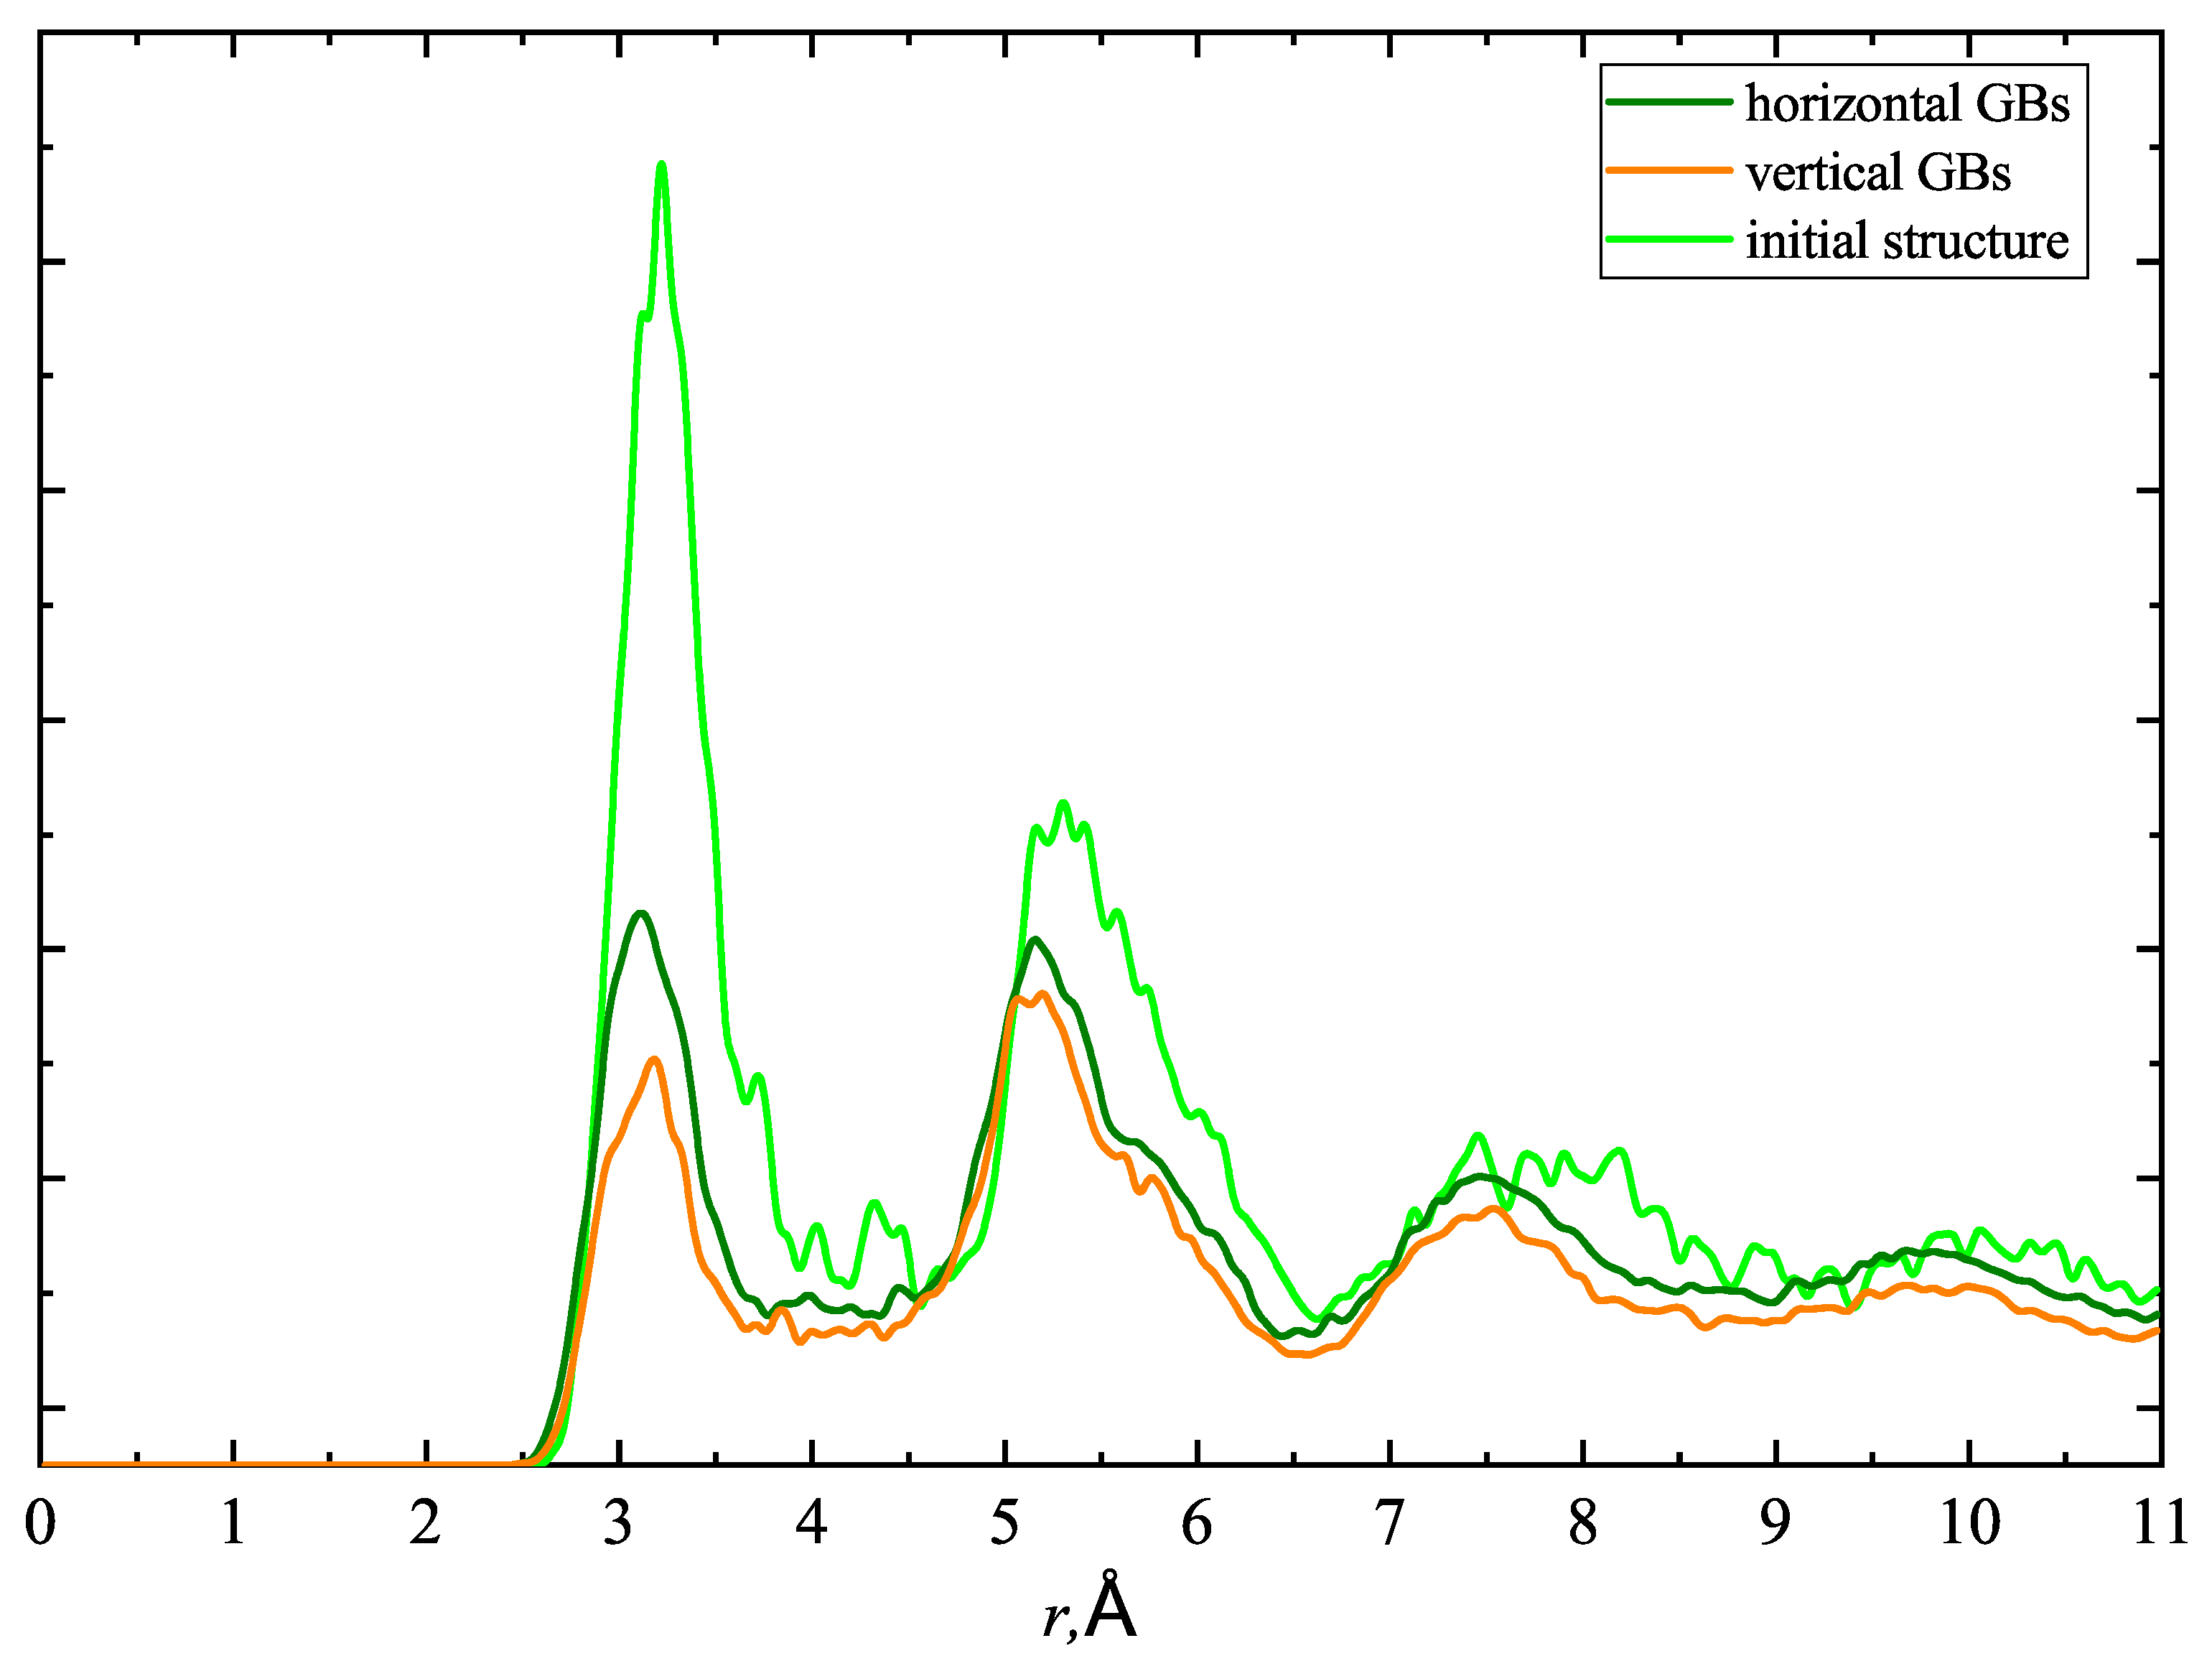
In Figure 14, the RDF curves for the Zr atoms in VGBs and HGBs before (light green line) and after deformation are given for the big computational cells. Similar to the small sample behavior (see. Figure 11), SPD leads to a rearrangement of Zr atoms that is accompanied by a significant decrease in the intensity of RDF peaks. It can also be seen that after deformation, the intensity of the first peak for the HGBs sample (dark green line) is higher compared to that for the VGBs cell (orange line), indicating that mechanical dissolution of Zr atoms during shear deformation for samples with vertical arrangement of GBs are stronger.
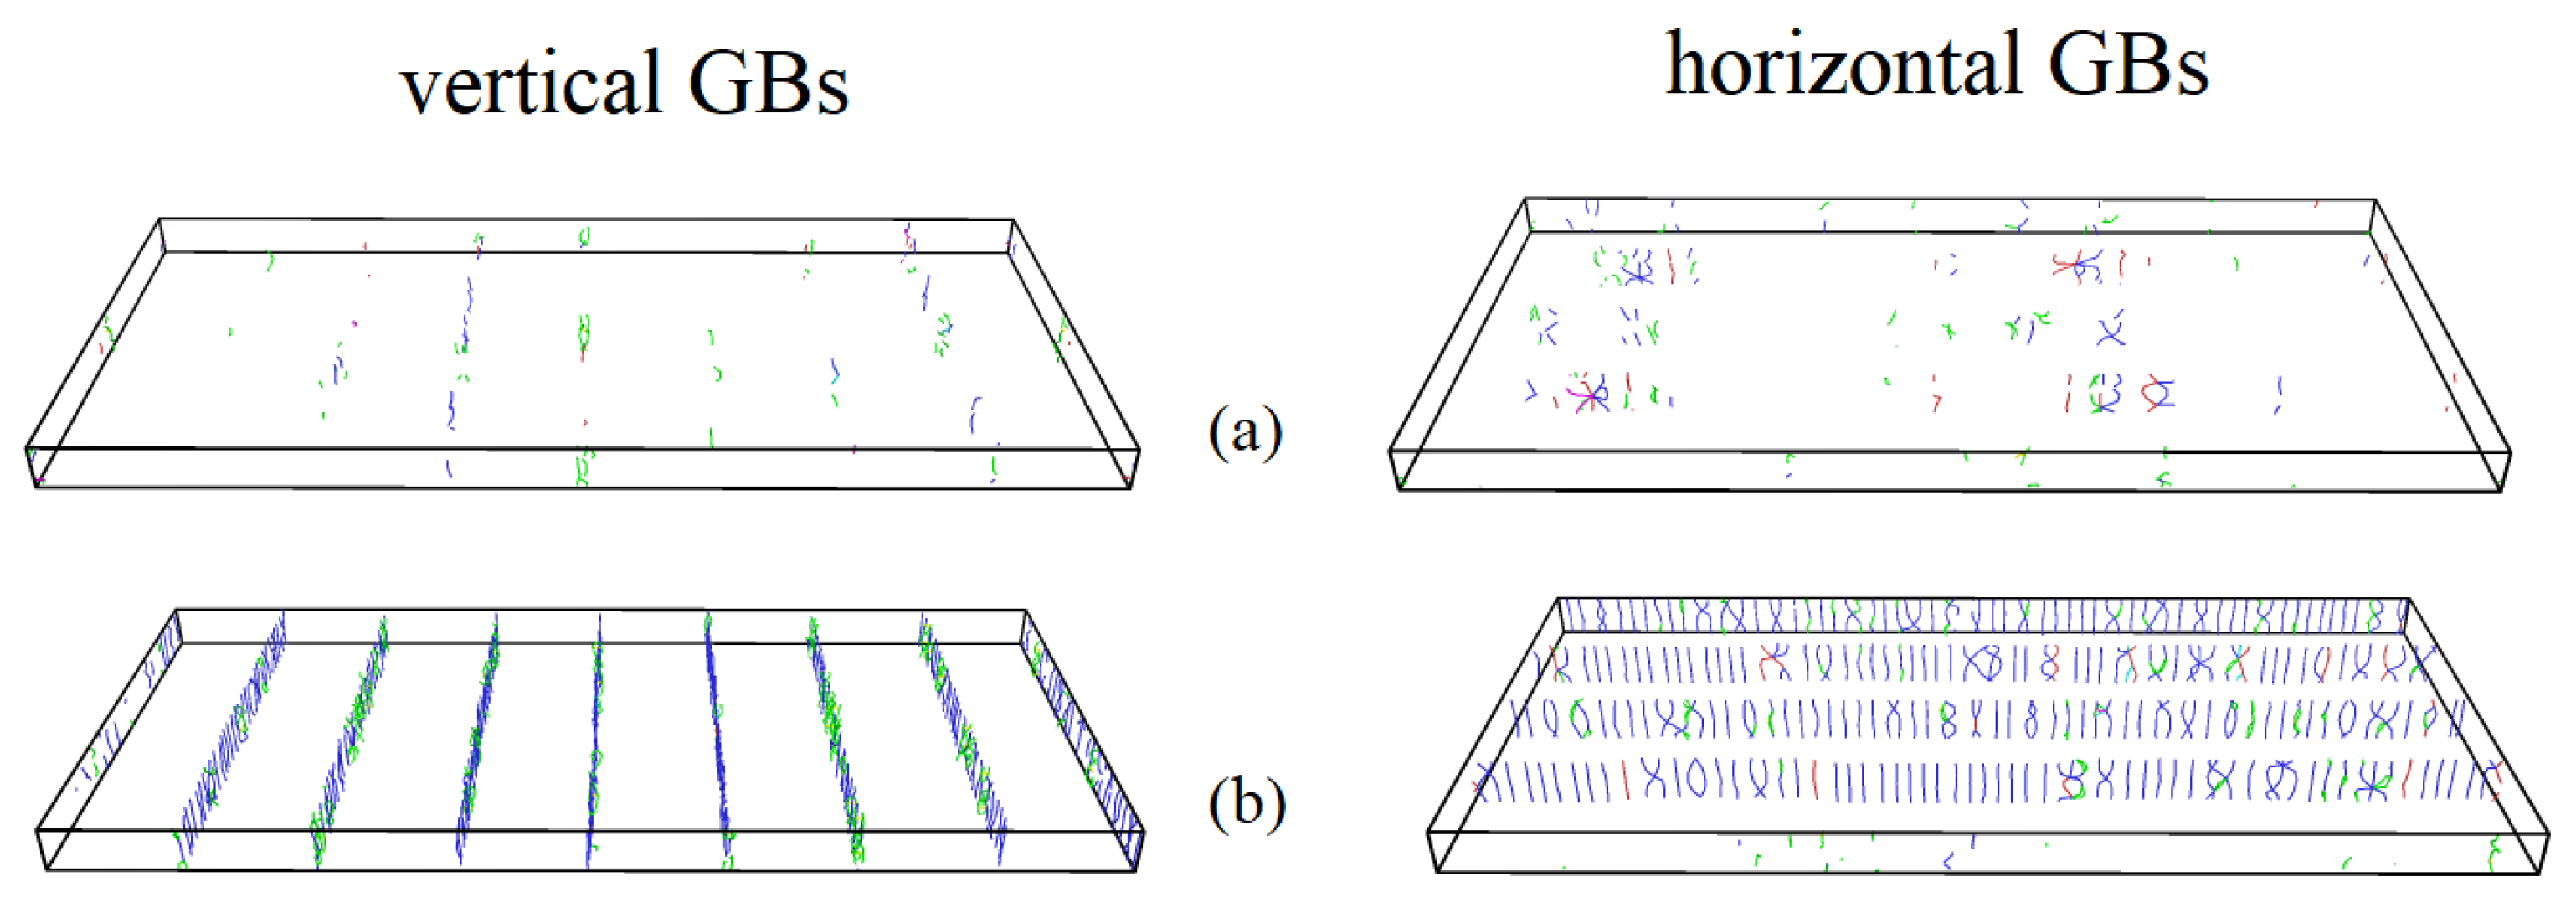
Figure 15 shows the evolution of the dislocation density during deformation in the considered big samples with and without Zr atoms at GBs. It can be seen that, in the initial state, in pure Al, the density associated with misfit dislocations at GBs is higher compared to the alloy (see Figure 16). It can be explained by the rearrangement of atoms in GB areas during the relaxation of the Al-3at.%Zr alloy. With the GB migration and their annihilation, the dislocation density reduces significantly. At ε x y = 0.5, all samples except Al with Zr in HGBs demonstrate an increase in density of dislocations. The latter is due to the dislocation assisted stacking faults formation and the generation of misfit dislocations at their boundaries. Note that in the case when Zr at HGBs and deformation is dictated purely by the GB sliding, the density is kept stable up to ε x y = 1.0.
An analysis of the obtained numerical results shows that the SPD of an alloy with Zr atoms at GBs leads to their mechanical dissolution in the Al matrix, as evidenced by the smearing of the peaks in the RDF curves plotted for Zr atoms.
It can also be concluded that with a vertical arrangement of the GBs, the mixing of the alloy components proceeds more intensively than with a horizontal one. This is due to the fact that with a horizontal orientation of GBs, the main mechanism of deformation is the GB sliding, while with VGBs, significant contribution to deformation from dislocation slip is observed.

4. Conclusions

In this work, to mimic SPD by the high pressure torsion, the effect of shear deformation at room temperature and hydrostatic pressure of 6 GPa is analyzed for pure Al and an Al alloy with a GB segregation of Zr by using an MD simulation. Two different arrangement of tilt GBs in the computational cells are considered; namely, when GB plane is perpendicular (VGBs) or horizontal (HGBs) to the direction of loading. The main findings can be summarized as follows.
The shear deformation of pure Al is associated with the shear coupled migration of GBs and their annihilation, leading to the formation of single crystal at ε x y = 0.15 regardless the GB orientation. Further deformation and material relaxation is accompanied by dislocation gliding and stacking fault formation.
The introduction of 3 at.%Zr into GBs of Al stabilizes GBs and activates the GB sliding mechanism. The GB migration cannot be observed in this case.
As a result of the performed MD simulation, it was found that the shear plastic deformation of Al with GB segregation of Zr leads to mechanical dissolution of Zr atoms from GBs into the Al matrix.
The calculations also showed that the mixing of the alloy components proceeds more intensively with the vertical arrangement of the GBs than with a horizontal one. This is explained by the fact that, in the case of horizontal orientation of GBs, the main mechanism of deformation is the GB sliding, when Zr atoms predominantly remain within the GBs. With VGBs, dislocations make a significant contribution to the deformation, leading to a better dissolution of Zr in the Al matrix.

Author Contributions

Conceptualization, N.A.E. and K.E.; methodology, R.I.B.; software, A.Y.M.; investigation, E.A.K. and A.Y.M.; writing—original draft preparation, S.V.D., E.A.K., K.E. and N.A.E. All authors have read and agreed to the published version of the manuscript.

Funding

K.E.A. acknowledges the financial support of the Russian Science Foundation, grant No. 21-12-00275. Work of A.Yu.M. was financed by the grant NSh-4320.2022.1.2. N.A.E. is grateful for the financial support to the Ministry of Science and Higher Education of the Russian Federation within the framework of the state task of the UUST (No. 075-03-2023-119) of the youth research laboratory “Metals and Alloys under Extreme Impacts”.

Data Availability Statement

The data of this study are available from the corresponding author upon reasonable request.

Conflicts of Interest

The authors declare no conflict of interest.

References

  1. Kiessling, F.; Nefzger, P.; Nolasco, J.F.; Kaintzyk, U. Overhead Power Lines: Planning, Design, Construction; Springer: Berlin/Heidelberg, Germany, 2003; p. 759. [Google Scholar] [CrossRef]
  2. Wang, Y.; Zhu, L.; Niu, G.; Mao, J. Conductive Al Alloys: The Contradiction between Strength and Electrical Conductivity. Adv. Eng. Mater. 2021, 23, 2001249. [Google Scholar] [CrossRef]
  3. He, J.H. A new proof of the dual optimization problem and its application to the optimal material distribution of SiC/graphene composite. Rep. Mech. Eng. 2020, 1, 187–191. [Google Scholar] [CrossRef]
  4. Confalonieri, C.; Casati, R.; Gariboldi, E. Effect of Process Parameters on Laser Powder Bed Fusion of Al-Sn Miscibility Gap Alloy. Quantum Beam Sci. 2022, 6, 17. [Google Scholar] [CrossRef]
  5. Onyibo, E.C.; Safaei, B. Application of finite element analysis to honeycomb sandwich structures: A review. Rep. Mech. Eng. 2022, 3, 192–209. [Google Scholar] [CrossRef]
  6. Valiev, R.Z.; Murashkin, M.Y.; Sabirov, I. A nanostructural design to produce high-strength Al alloys with enhanced electrical conductivity. Scr. Mater. 2014, 76, 13–16. [Google Scholar] [CrossRef]
  7. Edalati, K.; Bachmaier, A.; Beloshenko, V.A.; Beygelzimer, Y.; Blank, V.D.; Botta, W.J.; Bryła, K.; Čížek, J.; Divinski, S.; Enikeev, N.A.; et al. Nanomaterials by severe plastic deformation: Review of historical developments and recent advances. Mater. Res. Lett. 2022, 10, 163–256. [Google Scholar] [CrossRef]
  8. Murashkin, M.Y.; Enikeev, N.A.; Sauvage, X. Potency of severe plastic deformation processes for optimizing combinations of strength and electrical conductivity of lightweight Al-based conductor alloys. Mater. Trans. 2023, 64, 1833–1843. [Google Scholar] [CrossRef]
  9. Czerwinski, F. Thermal Stability of Aluminum Alloys. Materials 2020, 13, 3441. [Google Scholar] [CrossRef]
  10. International Electrotechnical Commission. Thermal-Resistant Aluminium Alloy Wire for Overhead Line Conductor IEC 62004; IEC: Geneva, Switzerland, 2007. [Google Scholar]
  11. Hamana, D.; Nebti, S.; Hamamda, S. Effect of the zirconium addition on the microstructure of Al+ 8 wt% Mg alloy. Scr. Metall. Mater. 1990, 24, 2059–2064. [Google Scholar] [CrossRef]
  12. Murray, J.L.; Peruzzi, A.; Abriata, J.P. The Al-Zr (aluminum-zirconium) system. J. Phase Equilib. 1992, 13, 277–291. [Google Scholar] [CrossRef]
  13. Wang, F.; Eskin, D.G.; Khvan, A.V.; Starodub, K.F.; Lim, J.J.H.; Burke, M.G.; Connolley, T.; Mi, J. On the occurrence of a eutectic-type structure in solidification of Al-Zr alloys. Scr. Mater. 2017, 133, 75–78. [Google Scholar] [CrossRef]
  14. Edalati, K. Superfunctional Materials by Ultra-Severe Plastic Deformation. Materials 2023, 16, 587. [Google Scholar] [CrossRef]
  15. Edalati, K. Metallurgical Alchemy by Ultra-Severe Plastic Deformation via High-Pressure Torsion Process. Mater. Trans. 2019, 60, 1221–1229. [Google Scholar] [CrossRef]
  16. Mohammadi, A.; Enikeev, N.A.; Murashkin, M.Y.; Arita, M.; Edalati, K. Developing age-hardenable Al-Zr alloy by ultra-severe plastic deformation: Significance of supersaturation, segregation and precipitation on hardening and electrical conductivity. Acta Mater. 2021, 203, 116503. [Google Scholar] [CrossRef]
  17. Li, X.; Shi, Y.; An, J.; Chen, J.; Chen, T. The research on the essence of unsteady mechanical behavior of Fe14.6Ni (at%) nanocrystalline elastocaloric refrigeration alloy through molecular dynamics simulation. J. Mater. Res. Technol. 2022, 20, 3103–3113. [Google Scholar] [CrossRef]
  18. Muscati, I.A.; Jahwari, F.A.; Pervez, T. Effect of CNT’s volume fraction on the mechanical properties of CNT reinforced Al/Cu alloy nanocomposite using molecular dynamics simulation. Mater. Today Proc. 2023, in press. [Google Scholar] [CrossRef]
  19. Rogachev, A.S.; Fourmont, A.; Kovalev, D.Y.; Vadchenko, S.G.; Kochetov, N.A.; Shkodich, N.F.; Baras, F.; Politano, O. Mechanical alloying in the Co-Fe-Ni powder mixture: Experimental study and molecular dynamics simulation. Powder Technol. 2022, 399, 117187. [Google Scholar] [CrossRef]
  20. Vasconcelos, I.F.; Figueiredo, R.S. Driving mechanisms on mechanical alloying: Experimental and molecular dynamics discussions. Nanostructured Mater. 1999, 11, 935–946. [Google Scholar] [CrossRef]
  21. Babicheva, R.I.; Evazzade, I.; Korznikova, E.A.; Shepelev, I.A.; Zhou, K.; Dmitriev, S.V. Low-energy channel for mass transfer in Pt crystal initiated by molecule impact. Comp. Mater. Sci. 2019, 163, 248–255. [Google Scholar] [CrossRef]
  22. Shepelev, I.A.; Dmitriev, S.V.; Kudreyko, A.A.; Velarde, M.G.; Korznikova, E.A. Supersonic voidions in 2D Morse lattice. Chaos Solitons Fractals 2020, 140, 110217. [Google Scholar] [CrossRef]
  23. Shepelev, I.A.; Bachurin, D.V.; Korznikova, E.A.; Dmitriev, S.V. Highly efficient energy and mass transfer in bcc metals by supersonic 2-crowdions. J. Nucl. Mater. 2022, 568, 153841. [Google Scholar] [CrossRef]
  24. Bayazitov, A.M.; Korznikova, E.A.; Bachurin, D.V.; Zinovev, A.V.; Dmitriev, S.V. Dynamics of supersonic N-crowdions in fcc metals. Rep. Mech. Eng. 2020, 1, 54–60. [Google Scholar] [CrossRef]
  25. Sitdikov, O.; Avtokratova, E.; Latypova, O.; Markushev, M. Structure, strength and superplasticity of ultrafine-grained 1570C aluminum alloy subjected to different thermomechanical processing routes based on severe plastic deformation. Trans. Nonferrous Met. Soc. China 2021, 31, 887–900. [Google Scholar] [CrossRef]
  26. Junaidi, S.; Amro, A.; Intan, F.M. Equal channel angular pressing of single crystal aluminum: A molecular dynamics simulation. J. Mater. Res. Technol. 2022, 17, 888–897. [Google Scholar] [CrossRef]
  27. Babicheva, R.I.; Dmitriev, S.V.; Zhang, Y.; Kok, S.W.; Srikanth, N.; Liu, B.; Zhou, K. Effect of grain boundary segregations of Fe, Co, Cu, Ti, Mg and Pb on small plastic deformation of nanocrystalline Al. Comp. Mater. Sci. 2015, 98, 410–416. [Google Scholar] [CrossRef]
  28. Babicheva, R.I.; Dmitriev, S.V.; Bai, L.; Zhang, Y.; Kok, S.W.; Kang, G.; Zhou, K. Effect of grain boundary segregation on the deformation mechanisms and mechanical properties of nanocrystalline binary aluminum alloys. Comp. Mater. Sci. 2016, 117, 445–454. [Google Scholar] [CrossRef]
  29. Babicheva, R.I.; Dmitriev, S.V.; Bachurin, D.V.; Srikanth, N.; Zhang, Y.; Kok, S.W.; Zhou, K. Effect of grain boundary segregation of Co or Ti on cyclic deformation of aluminium bi-crystals. Int. J. Fatigue 2017, 102, 270–281. [Google Scholar] [CrossRef]
  30. Babicheva, R.I.; Jarlöv, A.; Zheng, H.; Dmitriev, S.V.; Korznikova, E.A.; Ling Sharon Nai, M.; Ramamurty, U.; Zhou, K. Effect of short-range ordering and grain boundary segregation on shear deformation of CoCrFeNi high-entropy alloys with Al addition. Comp. Mater. Sci. 2022, 215, 111762. [Google Scholar] [CrossRef]
  31. Khalikov, A.R.; Korznikova, E.A.; Kudreyko, A.A.; Bebikhov, Y.V.; Dmitriev, S.V. Planar superstructure defects in ordered alloys with L10 structure. Met. Mater. Int. 2023, 29, 1712–1722. [Google Scholar] [CrossRef]
  32. Plimpton, S. Fast parallel algorithms for short-range molecular dynamics. J. Comput. Phys. 1995, 117, 1–19. [Google Scholar] [CrossRef]
  33. Stukowski, A. Visualization and analysis of atomistic simulation data with OVITO–the Open Visualization Tool. Model. Simul. Mater. Sc. 2009, 18, 015012. [Google Scholar] [CrossRef]
  34. Cheng, Y.Q.; Ma, E.; Sheng, H.W. Atomic level structure in multicomponent bulk metallic glass. Phys. Rev. Lett. 2009, 102, 245501. [Google Scholar] [CrossRef] [PubMed]
  35. EAM Potential Database. 2023. Available online: https://www.sites.google.com/site/eampotentials (accessed on 21 August 2023).
  36. Stillinger, F.H. A topographic view of supercooled liquids and glass formation. Science 1995, 267, 1935. [Google Scholar] [CrossRef] [PubMed]
  37. Sheng, H.W.; Kramer, M.J.; Cadien, A.; Fujita, T.; Chen, M.W. Highly optimized embedded-atom-method potentials for fourteen fcc metals. Phys. Rev. B 2011, 83, 134118. [Google Scholar] [CrossRef]
  38. Lee, M.; Lee, C.M.; Lee, K.R.; Ma, E.; Lee, J.C. Networked interpenetrating connections of icosahedra: Effects on shear transformations in metallic glass. Acta Mater. 2011, 59, 159–170. [Google Scholar] [CrossRef]
  39. Pippan, R. High-pressure torsion—Features and applications. In Bulk Nanostructured Materials; John Wiley Sons: Hoboken, NJ, USA, 2009; pp. 217–233. [Google Scholar] [CrossRef]
  40. Beygelzimer, Y.; Estrin, Y.; Davydenko, O.; Kulagin, R. Gripping prospective of non-shear flows under high-pressure torsion. Materials 2023, 16, 823. [Google Scholar] [CrossRef]
  41. Hou, Z.Y.; Tian, Z.A.; Mo, Y.F.; Liu, R.S.; Wang, J.G.; Shuai, X.M.; Dong, K.J. Atomic dynamics of grain boundaries in bulk nanocrystalline aluminium: A molecular dynamics simulation study. Comp. Mater. Sci. 2015, 108, 177–182. [Google Scholar] [CrossRef]
  42. Dang Thi, H.; Van-Khanh, T.; Van-Lam, N.; Le, V.; Van-Hai, D.; Trong-Giang, N. High strain-rate effect on microstructure evolution and plasticity of aluminum 5052 alloy nano-multilayer: A molecular dynamics study. Vacuum 2022, 201, 111104. [Google Scholar] [CrossRef]
  43. Xiaotao, L.; Wentao, M. Molecular dynamics simulation and theoretical modeling of free surface effect on nanocrack initiation induced by grain boundary sliding in nanocrystalline materials. Mater. Lett. 2021, 304, 130647. [Google Scholar] [CrossRef]
  44. Hoffrogge, P.W.; Barrales-Mora, L.A. Grain-resolved kinetics and rotation during grain growth of nanocrystalline aluminium by molecular dynamics. Comp. Mater. Sci. 2017, 128, 207–222. [Google Scholar] [CrossRef]
  45. Liu, J.; Zhang, Y.; Zhang, Y.; Kitipornchai, S.; Yang, J. Machine learning assisted prediction of mechanical properties of graphene/aluminium nanocomposite based on molecular dynamics simulation. Mater. Des. 2022, 213, 110334. [Google Scholar] [CrossRef]
  46. Li, Z.; Gao, Y.; Zhan, S.; Fang, H.; Zhang, Z. Molecular dynamics study on temperature and strain rate dependences of mechanical properties of single crystal Al under uniaxial loading. AIP Adv. 2020, 10, 075321. [Google Scholar] [CrossRef]
  47. Zeng, Q.; Wang, L.; Jiang, W. Molecular dynamics simulations of the tensile mechanical responses of selective laser-melted aluminum with different crystalline forms. Crystals 2021, 11, 1388. [Google Scholar] [CrossRef]
  48. Komanduri, R.; Chandrasekaran, N.; Raff, L. Molecular dynamics (MD) simulation of uniaxial tension of some single-crystal cubic metals at nanolevel. Int. J. Mech. Sci. 2001, 43, 2237–2260. [Google Scholar] [CrossRef]
  49. Xu, W.; Dávila, L.P. Size dependence of elastic mechanical properties of nanocrystalline aluminum. Mater. Sci. Eng. A 2017, 692, 90–94. [Google Scholar] [CrossRef]
  50. Xu, W.; Dávila, L.P. Tensile nanomechanics and the Hall-Petch effect in nanocrystalline aluminium. Mater. Sci. Eng. A 2018, 710, 413–418. [Google Scholar] [CrossRef]
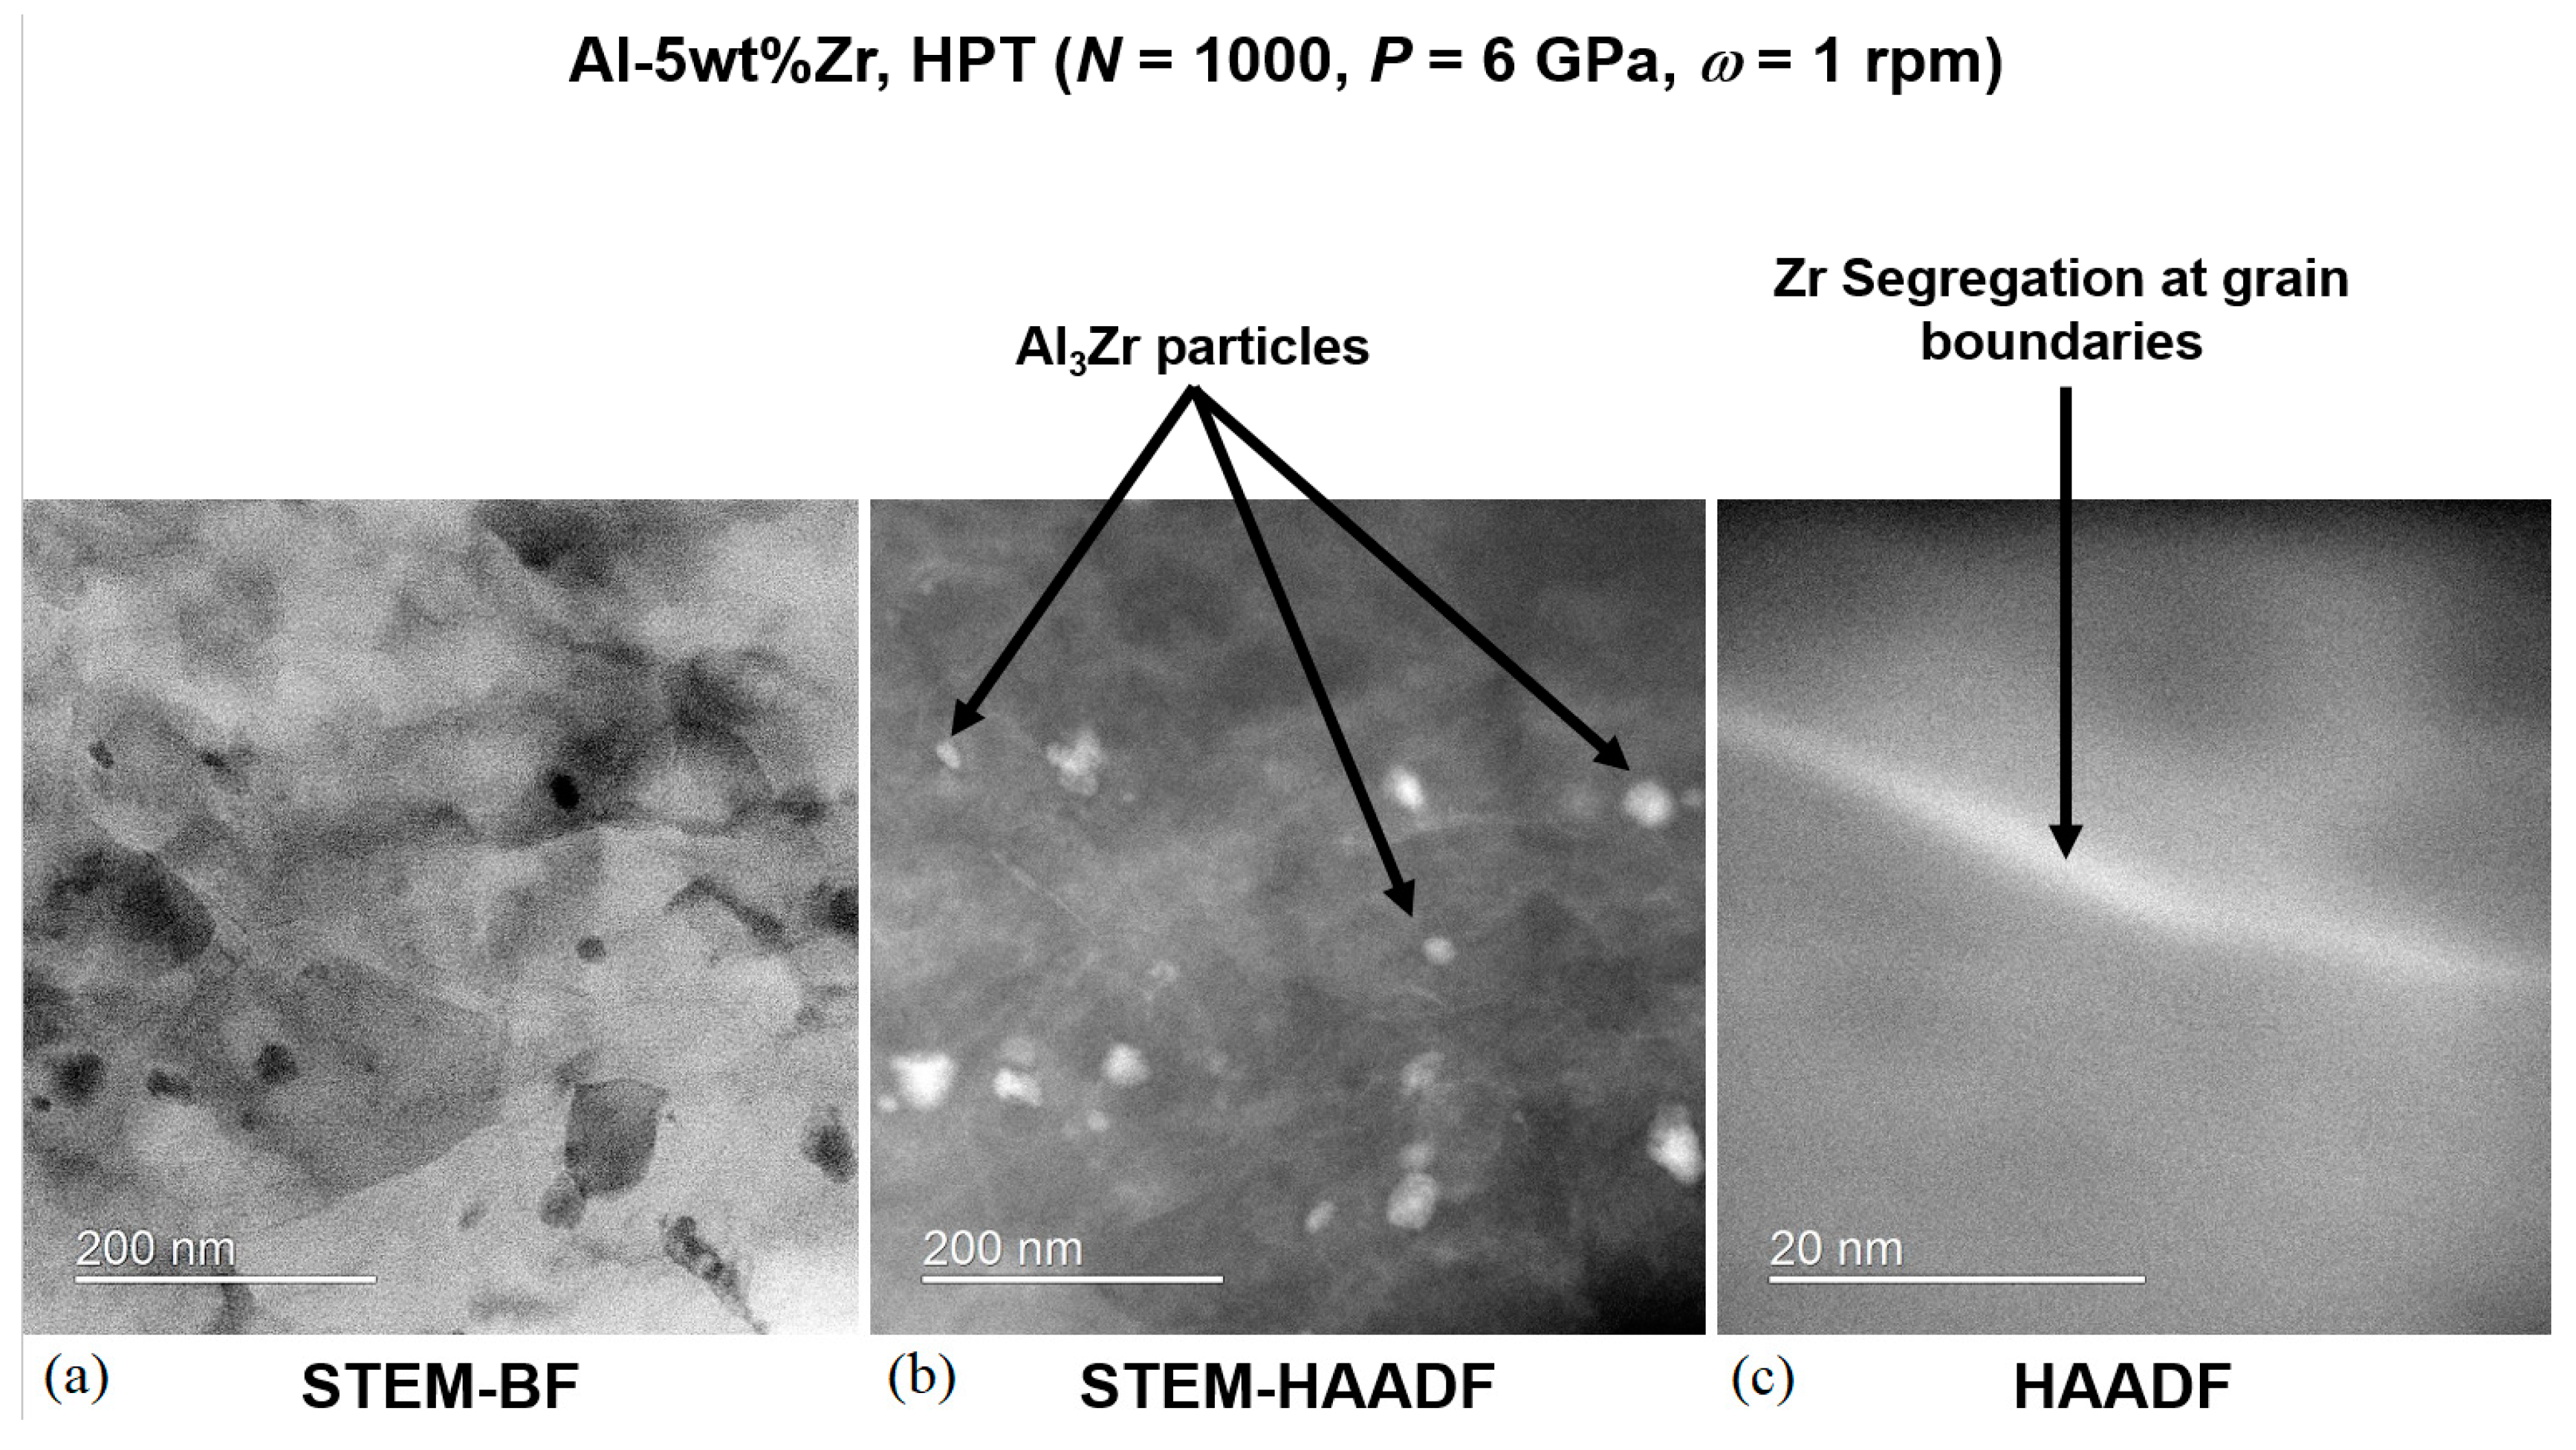
Figure 1. STEM images of the Al–5at.%Zr alloy subjected to high pressure torsion to 1000 revolutions under an imposed pressure of 6 GPa at room temperature: (a) a bright field image showing grain structure refined to nanoscale; HAADF images indicating precipitation of (b) metastable Al 3 Zr particles and (c) grain boundary segregations. The details of experimental procedures can be found in [16].
Metals 13 01595 g001
Figure 2. Computational cells of big size: (a,b) with Zr atoms introduced into VGBs; (c,d) with Zr atoms in HGBs. Red (blue) dots show Al (Zr) atoms.
Metals 13 01595 g002
Figure 3. Shear stress–strain curves for pure Al (purple curve) and Al-3at.%Zr (cyan curve). The upper panel is for the sample with VGBs, while the lower panel is for the HGBs case.
Metals 13 01595 g003
Figure 4. Stress–strain curves for the pure Al samples with VGBs (upper panel) and HGBs (lower panel) obtained at different strain rates: ε ˙ x y = 10 7 s 1 (black curve), ε ˙ x y = 10 8 s 1 (red curve), and ε ˙ x y = 10 9 s 1 (blue curve).
Metals 13 01595 g004
Figure 5. Stress–strain curves for the Al-3at.%Zr alloy with VGBs (upper panel) and HGBs (lower panel) obtained at different strain rates: ε ˙ x y = 10 7 s 1 (black curve), ε ˙ x y = 10 8 s 1 (red curve), and ε ˙ x y = 10 9 s 1 (blue curve).
Metals 13 01595 g005
Figure 6. Shear stress–strain curves for the pure Al and Al alloy obtained for computational cells of different sizes at strain rate ε ˙ x y = 10 8 s 1 .
Metals 13 01595 g006
Figure 7. Structure evolution of the Al-3at.%Zr alloy with VGBs (a) and HGBs (b) during shear deformation at ε ˙ x y = 10 8 s 1 . The snapshots are given for the small computational cells.
Metals 13 01595 g007
Figure 8. Common neighbor analysis of structure evolution in the Al-3at.%Zr alloy with VGBs (a) and HGBs (b). The snapshots are given for the small computational cells.
Metals 13 01595 g008
Figure 9. Evolution of atomic structure in the pure Al sample with VGBs (a) and HGBs (b). The snapshots are given for the small computational cells.
Metals 13 01595 g009
Figure 10. (Common neighbor analysis of structure evolution in the pure Al with VGBs (a) and HGBs (b). The snapshots are given for the small computational cells.
Metals 13 01595 g010
Figure 11. RDFs for Zr in the VGBs and HGBs of the Al alloy at the start and end of shear deformation at different strain rates: ε ˙ x y = 10 7 s 1 (black curve), ε ˙ x y = 10 8 s 1 (red curve), and ε ˙ x y = 10 9 s 1 (blue curve).
Metals 13 01595 g011
Figure 12. Common neighbor analysis of structure evolution in the Al-3at.%Zr alloy with VGBs (a) and HGBs (b) ( ε ˙ x y = 10 8 s 1 ). The snapshots are given for the big computational cells.
Metals 13 01595 g012
Figure 13. Common neighbor analysis of structure evolution in the pure Al samples with VGBs (a) and HGBs (b) ( ε ˙ x y = 10 8 s 1 ). The snapshots are given for the big computational cells.
Metals 13 01595 g013
Figure 14. RDFs for Zr atoms in VGBs and HGBs of the Al alloy at the start and end of shear deformation ( ε ˙ x y = 10 8 s 1 ). RDFs are given for the big computational cells.
Metals 13 01595 g014
Figure 15. Dislocation density evolution in pure Al and Al alloy with VGBs and HGBs at strain rate ε ˙ x y = 10 8 s 1 .
Metals 13 01595 g015
Figure 16. Dislocation structure in the Al alloy (a) and pure Al (b) with VGBs and HGBs: perfect 1/2 <110> (blue), Stair-rod 1/6 <110> (magenta), Shockley 1/6 <112> (green), Hirth 1/3 <100> (yellow), Frank 1/3 <111> (cyan), other dislocation type (red).
Metals 13 01595 g016
Disclaimer/Publisher’s Note: The statements, opinions and data contained in all publications are solely those of the individual author(s) and contributor(s) and not of MDPI and/or the editor(s). MDPI and/or the editor(s) disclaim responsibility for any injury to people or property resulting from any ideas, methods, instructions or products referred to in the content.