Article

An Electrochemical Approach to the Recovery of Metals Typical of Battery Waste

by
Claudia Kutzer-Schulze
1,
Hannes Schmidt
1,
Mathias Weiser
1,
Tilo Büttner
2,
Michael Schneider
1,* and
Alexander Michaelis
1,3
1
Fraunhofer Institut für Keramische Technologien und Systeme (IKTS) Dresden, Winterbergstraße 28, 01277 Dresden, Germany
2
Fraunhofer Institut für Fertigungstechnik und Angewandte Materialforschung (IFAM) Dresden, Winterbergstraße 28, 01277 Dresden, Germany
3
Institut Für Werkstoffwissenschaft (IfWW), Technische Universität Dresden, Helmholtzstraße 7, 01062 Dresden, Germany
*
Author to whom correspondence should be addressed.
Metals 2024, 14(1), 109; https://doi.org/10.3390/met14010109
Submission received: 17 October 2023 / Revised: 9 December 2023 / Accepted: 19 December 2023 / Published: 16 January 2024

Abstract

:
This paper deals with the separate electrochemical recovery of transition metals from battery black liquor. In a first approach, the authors investigated a model waste electrolyte mainly consisting of Cu, Co, Ni, and Mn in an acidic solvent, using citric acid as a complexing agent. An open porous Inconel® foam had been included as an electrode to benefit from the increased active surface area. Under the selected operation conditions, Cu was completely recovered, presenting almost 100% purity, while, in the case of Co, the purity was 96%, and a remanent concentration of about 1.2 g L−1 could still be determined.

1. Introduction

The anthropogenic emissions of carbon dioxide (CO2) and nitric oxides (NOx), among others, have accelerated climate change [1]. A main part of these originates from traffic involving cars with diesel or petrol engines. To reduce the emissions from traffic, combustion engines are being substituted with electric vehicles, meaning that the number of new registered electric cars has increased in recent years and is still rising [2,3]. In electric vehicles, lithium-ion batteries (LIBs) are included [4]. So, the volume of this kind of battery in electric vehicles registered in 2007 was only about 500,000 m3, with more than 250,000 t [5]. At the end of life of these batteries, this waste must be recycled, not only because of the high volume of waste but also because of the rare and expensive metals/elements which are included in them, e.g., lithium, nickel, cobalt, aluminum, copper, and manganese [5].
Nowadays, there are a lot of different recycling processes trying to extract metals out of end-of-life batteries (ELBs). These processes include mechanical, pyrometallurgy, and hydrometallurgy recycling [6]. The recycling of ELBs can take place in different process chains, including several steps in different combinations and to different extents. These process chains reach recovery rates between 90 and 95% [7]. One main problem for all recycling chains is the diversity in the structure and composition of the LIBs used, which influences the recycling rates.
The mechanical treatment of ELBs separates the “large” residues of a battery by removing the current collector foils (Al and Cu) from the so-called black mass. The black mass is a black powder from shredded batteries, containing graphite, nickel, cobalt, lithium, manganese, copper, etc. This black mass is fed into pyrometallurgy or hydrometallurgy treatments. The literature reports that the composition of black mass is contingent on its pretreatment, particularly its mechanical processing and separation into different grades according to particle sizes [8]. The black mass suitable for hydrometallurgy (sample from Duesenfeld, Germany) contains approximately 24% cathodic transition metals (0.58 Ni, 0.21 Co, 0.21 Mn) [9]. Furthermore, 5.1 wt.% Al, 7.6 wt.% Cu, 2.1 wt.% Li, and 0.77 wt.% P have also been detected in these samples. The thermally treated black mass consists of nickel and cobalt (in total, approximately 23 wt.%) and about 9 wt.% manganese [10]. This composition varies systematically as ELBs with several cathode active materials, etc., are fed into the process chain.
The pyrometallurgical treatment of black mass leads to the formation of alloys (Co, Ni, Cu) and a slag containing Al, Mn, and Li [11,12,13]. This slag could be used for several construction applications [12]. However, this would make both lithium and aluminum unavailable for supplementary recycling procedures. The Ni-, Co-, and Cu-containing alloy is processed in further processing steps, usually hydrometallurgical methods, to return the valuable materials to the production chain [7]. Moreover, it is worth noting that pyrometallurgical recycling methods can release over 11 kg of CO2 per kilogram of battery waste. In contrast, hydrometallurgical processes release up to 9 kg for the same cell design. From an ecological perspective, hydrometallurgical processes are thus considered less harmful to the environment due to their lower greenhouse gas emissions [14].
The thermal pre-treatment of black metal is also required in most cases for hydrometallurgical processes [15]. This step is essential for eliminating electrolytes from the black mass. After this, valuable substances are extracted via leaching. Hydrometallurgy again uses several acid combinations [16] for leaching-out the transition metals as well as the Cu and Li. Depending on the leaching reagents, temperature, time, and solid–liquid ratio, up to 99% of the transition metals contained in black mass can be extracted [15,17,18]. These metals, except for Li, can be recovered from such leaching solutions using electrochemical deposition. Furthermore, electrochemistry presents an advantage over other hydrometallurgical techniques such as precipitation since it allows for the recovery of metals. This process renders recycled materials available for a wider range of applications. However, in contrast to plating electrolytes of Cu, Ni, and Co, for example, the leaching solutions consist of variable concentrations of metal ions, different pH values, and variable levels of contamination.
Due to the complexity of leaching solutions, the authors of this paper have chosen to investigate the selective recovery of (transition) metals using a model electrolyte, based on the composition of real black mass leaching solutions, that can be adjusted specifically.
If the concentration of the deposited ions is low, the electrolyte could be rapidly depleted, and the efficiency of the electrowinning would decrease. To avoid this phenomenon, the use of a metal foam as a cathode has been proposed, allowing for a high reactive surface per volume and good flowability. This implies a high capture cross-section and limits the depletion of the electrolyte in front of the electrode hydrodynamically.

2. Materials and Methods

2.1. Electrolytes and Materials
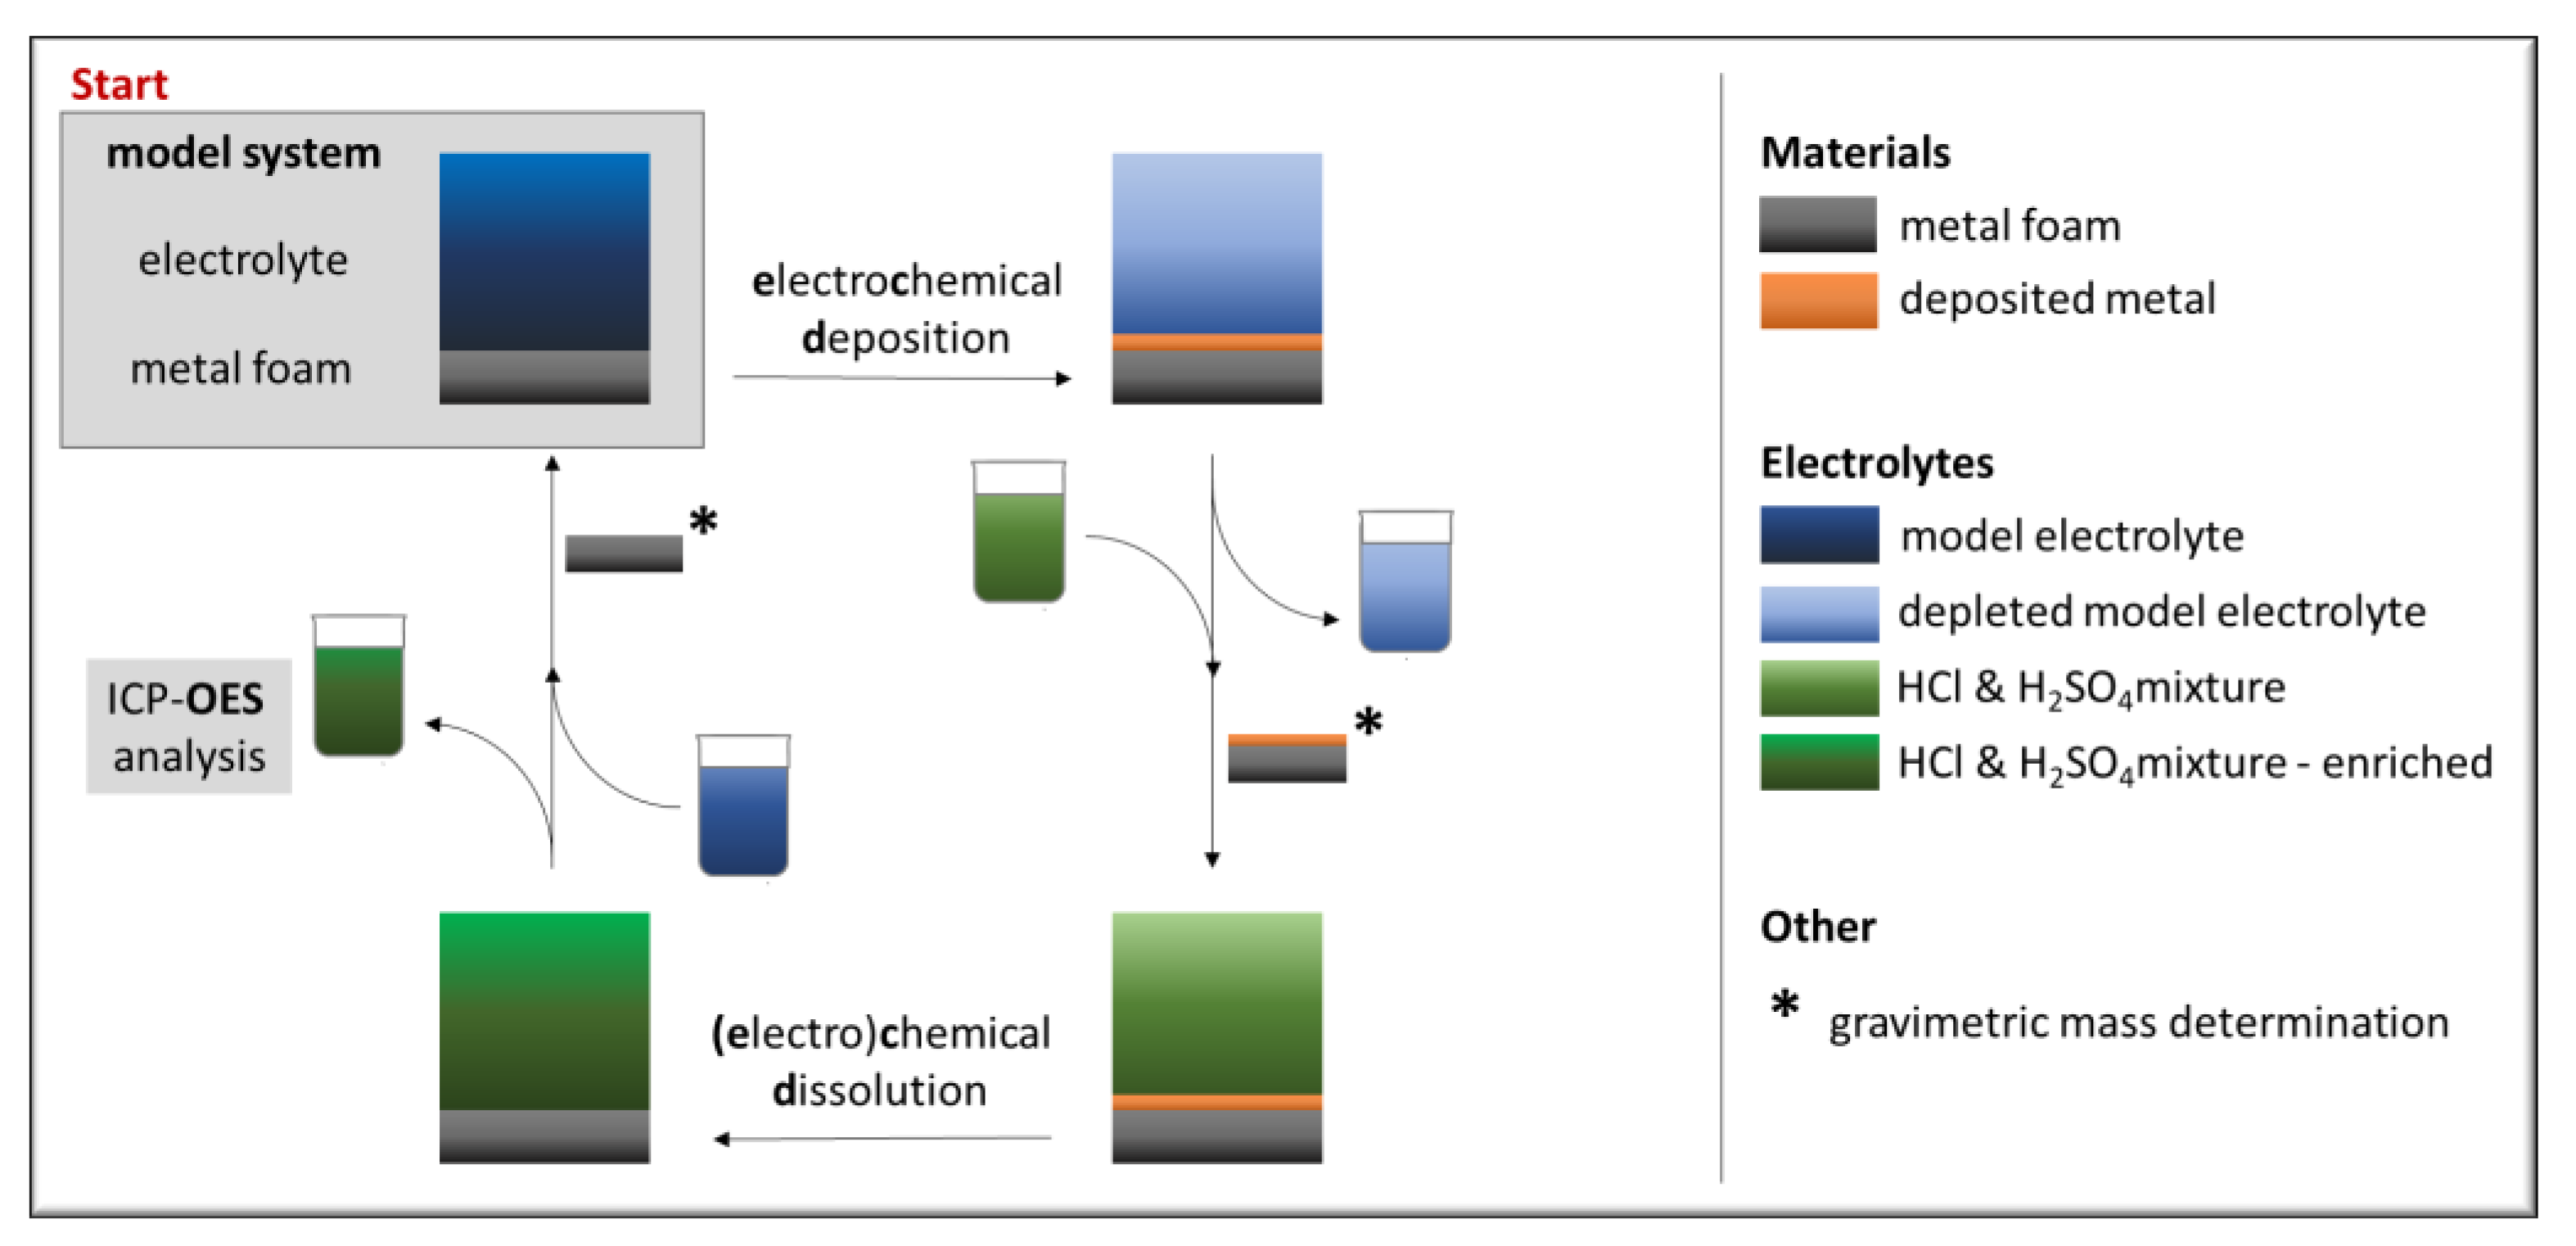
The electrode material used as the cathode (further labeled as the working electrode—WE) was a nickel–chrome metal foam (Inconel® 625) produced by the Fraunhofer Institute for Manufacturing Technology and Advanced Materials, IFAM [19]. The chemical composition of the materials was around Ni 55.9, Cr 22.5, Mo 10.8, Fe 4.8, Nb 3.8, Si 1.7, and Co 0.2 wt.% [20]. The real surface was determined using BET (Brunauer–Emmett–Teller) measurements and amounted to 0.04 m2g−1. Black mass leaching solutions are very complex. Therefore, a model electrolyte was selected to demonstrate the metal deposition process, containing transition metals as well as other components which are transferred to the electrolyte during the leaching process. Initial tests were conducted to ensure that the model system was as realistic as possible. According to previous research in the literature [15,17,18], 100 g of black mass (Duesenfeld GmbH, Wendeburg, Germany) was added to 1 L of leaching agent (3 M HCl) and heated at 75 °C for 2 h under reflux. A subsequent ICP-OES analysis indicated 0.2 g L−1 Al, 1.3 g L−1 P, 12.2 g L−1 Ni, 6.2 g L−1 Co, 1.7 g L−1 Fe, 5.2 g L−1 Mn, 1.3 g L−1 Cu, and 3.3 g L−1 Li. These analysis results were used as the basis for the model electrolyte. Iron was not added, as it can be easily removed from the system in a further step between leaching and electrochemical deposition. Furthermore, at a subsequent stage, a more detailed analysis of the impact of iron on electrochemical deposition can be conducted. Table 1 presents the detailed composition of the model electrolyte. The mass concentrations (ρ) of the contained elements and their corresponding salts are specified. The resulting molar concentration (c) of the substances is also specified.
Citric acid, a common additive in the electroplating industry, acts as a buffer system as well as a complexing agent. An alkaline solution of 8 M KOH was added to adjust the pH value of the solution to 4.2. The cathodic deposit was then subjected to anodic dissolution using a mixture of 15 wt.% HCl and 4 wt.% H2SO4.

2.2. Methods

The samples (Inconel® 625) were degreased in 20 g L−1 NaOH, adding 1 g L−1 sodium dodecyl sulfate (SDS) at 60 °C for approximately 5 min. The samples were then pickled in 7.5 wt.% H2SO4 (2 min), rinsed with de-ionized water, and dried on air. A platinized titanium expanded metal (50 g m−2 (Pt), 2.5 µm Pt, Metakem GmbH, Lüdenscheid, Germany) was used as the counter electrode (CE). The geometric sample area was between 5 and 7 square centimeters; therefore, all results were normalized. The experiments were carried out at an electrolyte temperature of 25 °C. All potentials were measured vs. Ag/AgCl (sat.) (Xylem Analytics Germany Sales GmbH & Co. KG, Sensortechnik Meinsberg, Meinsberg, Germany), and in the following discussed vs. the standard hydrogen electrode (SHE). For the electrochemical measurement, a computer-controlled potentiostat, PGU 20V-2A-E (IPS Elektroniklabor GmbH & Co. KG, Münster, Germany), was used. Figure 1 illustrates the scheme of the experimental approach.
At the beginning, the model electrolyte was prepared using the compounds and the corresponding concentrations as described in Table 1. Then, the metals of interest were deposited stepwise onto the cathode. The deposit was further dissolved in the acidic mixture to refresh the Inconel® foam. This solution was analyzed using ICP-OES to determine the values of the deposited metals. The analyses of the chemical composition of the deposited layers as well as the solution were carried out with an ICP-OES (iCap Pro XP DUO, Thermo Fisher Scientific Inc., Düsseldorf, Germany) coupled with an automatic sampler, CETAC ASX-280 (Teledyne CETAC Technologies, Omaha, United States of America). The samples were analyzed for about 30 s. The plasma was operated at 1150 W and the Ar carrier flow rate was 0.45 L min−1. Two emission lines were selected for each element to be determined: 228.616 and 238.892 for Co, 224.70 and 324.754 for Cu, 239.562 and 259.940 for Fe, 394.401 and 396.152 for Al, 670.776 and 670.784 for Li, 260.569 and 293.930 for Mn, 216.556 and 231.604 for Ni, and 283.563 and 359.349 for Cr.
The selected samples were analyzed using scanning electron microscopy (NVision40, Zeiss Ltd., Oberkochen, Germany). Cross-sectional preparation of the samples was carried out using broad ion beam preparation (TIC020, Leica Ltd., Wetzlar, Germany).

3. Results

Figure 2 shows the cyclic voltammogram of the model electrolyte with (green) and without (black) metal salts. The measured currents were normalized to the geometric electrode surface of the metal foam.
The cyclic voltammogram of the basic electrolyte shows that it is dominated by hydrogen evolution, which is limited by the electrolyte resistance. The increase in the current density (j > |−1 mAcm−2|) can be observed from −0.57 V. Thermodynamically, the hydrogen evolution starts at −0.25 V [21]. For the high-nickel-containing metal foam, the overvoltage for hydrogen evolution is estimated to be −320 mV. This is plausible in comparison to solid nickel with 320 mV [22]. Similar behavior is seen in the anodic range. The current density rises above 1 mAcm−2 from about 1 V onwards due to the anodic oxygen evolution.
The metal salts were added to the electrolyte, leading to higher current densities. In the cathodic sweep, the metal deposition started at ≈0 V. Thermodynamically, the deposition of copper is possible at potentials <0.07 V, for cobalt <−0.48 V, and for nickel <−0.5 V [21]. During the cathodic sweep, the deposited metal at the surface of the electrode, e.g., copper, can lead to a shift in the hydrogen evolution due to other overvoltages [23]. In the presence of metallic species, a cathodic limiting current is evidenced, located between −0.6 V and −1 V, assigned to the reduction of the metallic ions. At greater cathodic values of the applied potential, the hydrogen evolution reaction dominates. In the anodic back sweep, the dissolution of the previously deposited metals starts at about 0.1 V. Correspondingly, on the anodic branch, at a potential of about 1.4–1.5 V, an anodic peak is noticed which could be ascribed to the dissolution of the deposited alloy. Therefore, the individual cathodic potentials specific to each metallic ion cannot be identified from this CV. Even if the thermodynamic information from Pourbaix diagrams is true, the real potentials must be experimentally determined as they vary according to the experimental conditions. This will be discussed in more detail in Section 3.1.
After the experiment, a decrease in the electrode mass can be observed. The loss of electrode material can be explained by the transpassive dissolution of the electrode at high anodic current densities. With cathodic electrochemical deposition, however, this dissolution is excluded. The deposition of transition metals in this set-up offers a wide potential range with low hydrogen co-deposition. The foam structure of the working electrode also increases the surface area compared to planar electrode materials. A distinction must be made between the geometric area (Ageo), the real area (ABET), and the electrochemically active surface area (AEC).

3.1. Stationary Electrochemical Deposition

The electrode in the model electrolyte was polarized stepwise at potentials between 0.2 and −1.7 V. Each polarization step lasted 300 s. Figure 3a, in fact, represents the recorded chronoamperograms for various potentiostatic current transients. The applied cathodic potentials are in the range of −0.1 to −1.5 V. Due to the experimental parameters, the amount of charge (shown in red) is directly proportional to the stationary current density (jstat).
In combination with the change in the mass of the electrode, this allows conclusions to be drawn about the efficiency and the secondary reactions taking place. The amount of charge (black) as well as the coulometrically determined mass (blue) are shown as normalized to the dependence of the applied potential in Figure 3b.
Figure 3b shows the typical areas of activation (0.1 up to 0 V), mixing (0 up to −0.3 V), as well as diffusion control (−0.4 up to −0.9 V) for metal deposition, whereby the limiting current density for diffusion control is about −75 mAcm−2. According to the concentration of the transition metals, a limiting current density was expected of the same magnitude. In the following, the charge increases due to hydrogen evolution. According to the electrode coloring and the calculated deposition potential, copper is deposited at about 0 V. Thermodynamically, copper as well as nickel and cobalt can be deposited at cathodic potentials of more than −0.5 V [21]. Nevertheless, the deposited mass increases slightly from −1.0 V and is significantly more cathodic than −1.3 V due to the deposition of the other transition metals: nickel and cobalt.
After each step, the deposited mass was (anodically) dissolved in an acid electrolyte at 0.25 V. This allowed the deposition potentials of the other transition metals (except copper) to be determined. The concentrations of the transition metals resulting from the dissolution of the previously deposited layers (Figure 3) are shown in Figure 4. Manganese is not shown because no significant manganese concentration was detected.
According to the experimental procedure, Figure 4 should also be considered, starting from the anodic potentials. Due to the repeating deposition–dissolution cycle, the metal concentration successively increased in the hydrochloric–sulphuric acid.
The first traces of deposited copper can be measured at about 0.0 V, but a significant amount can only be measured at −0.2 V. At potentials more cathodic than −1.3 V, cobalt can be extracted from the model solution. The first quantities of cobalt can be measured from −1.1 V. Considering the calculated deposition potential of about −0.5 V, an overpotential of −600 mV is observed. The less cathodic polarization steps are already due to a significant nickel concentration in the acid dissolution electrolyte. From the thermodynamic point of view, it is not possible to deposit nickel below −0.5 V. The same applies to the elements of chrome and iron, which were not part of the model electrolyte.
To determine the input of the metals at the corresponding separation potentials, the concentration differences must be considered. Consequently, from the change in concentration between the previous (ρφ−1 (Men+)) and the current deposition (ρφ (Men+)) steps, the transition metal deposition potential can be estimated.
Δρ(Men+) = ρφ(Men+) − ρφ−1(Men+)
The concentration changes of the individual elements Cu and Co (Δρ(Men+)) are shown in Figure 5.
It should be noted that most of the nickel comes from the deposited layer, but it can also come from the corrosion of the foam, which is used as the substrate. The chromium concentration is exclusively caused by corrosion of the foam (Figure 6).
Analogous to the ICP-OES results already shown, it is also evident that copper is electrochemically deposited from a potential of 0 V. The amount of deposited copper increases up to a potential of approx. −0.5 V and afterwards remains constant. This is consistent with the results of the electrochemical studies (compare with Figure 3), where diffusion-controlled copper deposition has already been discussed in detail. For cobalt, no limiting current deposition can be identified. Figure 5 shows variations in the input concentration of copper. These can be attributed to the electrode properties and associated fluctuations in the electrochemically active surface.
For nickel, it has not yet been possible to define an electrochemical deposition window in the model system. As mentioned above, both nickel and chromium are components of the substrate, with a ratio of 2.5 [Ni:Cr]. The nickel–chromium as a function of the deposition potential according to the OES analysis is shown in Figure 6.
It could be shown that the ratio is between 2.5 and 2.9 when there is no thermodynamic nickel deposition (between −0.5 and 0 V). At cathodic potentials higher than −1.4 V, this ratio increases significantly. Therefore, it can be assumed that nickel can be electrochemically depleted from the model electrolyte above this potential. Compared to the thermodynamically calculated deposition potential, this results in an overvoltage of −0.9 V.

3.2. Metal Recovery and Electrolyte Depletion

To achieve corresponding layer purities, the copper contained in the electrolyte is first depleted by means of a potentiostatic experiment. A constant potential of −0.3 V was applied for a period of eight hours. The resulting current density over time is shown in Figure 7a. To monitor the copper concentration, the samples were taken at selected time points (blue marked points) and analyzed using ICP-OES (Figure 7).
The experiment begins with an initial current density of about −12.5 mAcm−2. Within the first few minutes of the measurement, the current densities are in the range of up to −25 mAcm−2 before they steadily decrease until a stationary current density of −0.75 mAcm−2 is reached after about 2 h (Figure 7a). The decreasing current density can be attributed to the lower copper content in the model electrolyte over time. The experiment starts with a copper concentration of about 2 g L−1, which should be depleted to 0 g L−1. This can be seen in Figure 7b.
It can be assumed that the residual current density is caused by oxygen reduction because the polarization potential is more anodic in comparison with the thermodynamically determined hydrogen reduction potential (−0.57 V).
O2 + 4H+ + 4e → 2H2O
Since oxygen reduction is also determined by diffusion, the diffusion-limiting current density jO2,D of the oxygen reduction can be calculated with the following equation:
j O 2 , D = n · F · D O 2 · c O 2 0 δ
Therefore, the number of electrons n is set as 4 and F is the Faraday constant with 96,480 Cmol−1 [24]. According to the literature [25], the oxygen diffusion coefficient DO2 in water at 30.2 °C is about 2.26 × 10⁻⁵ cm2s−1. The oxygen concentration of a solution saturated in air depends on the salt content. Values in the literature indicate about 1.9 × 10⁻⁷ molL−1 for highly saline waters at 30 °C [26]. Roughly estimating a diffusion layer thickness of 5 × 10⁻³ cm [27], this results in a limiting current density of −0.33 mAcm−2. However, the measured limiting current density is −0.75 mAcm−2. The ratio of the theoretical to the measured limiting current density results in a factor of 2.3 for the electrochemically active electrode surface (AEC). Thus, the electrochemically active surface must be much smaller than the real surface (ABET). The cross-section of the foam shows that not the entire real surface of the foam is used for electrochemical deposition (Figure 8). An inhomogeneous layer thickness can be seen at the covered sample areas.
To be able to use the high geometric surface almost completely for electrochemical deposition, a flow through the electrode can be useful, which also increases the efficiency of the process. The additional convection allows the inner area of the electrode to be reached and thus made usable.
After copper has been depleted from the electrolyte, cobalt can then be separately extracted with high purity. Here, a potential of −1.3 V was applied for 8 h. This potential was chosen to avoid nickel deposition (compare with Figure 6). Analogous to the previous depletion, a sample was also taken every hour for ICP-OES. The resulting current density and concentration of cobalt and manganese are shown in Figure 9 as a function of time. The concentration of nickel is unaltered.
The current density starts at −45 mAcm−2. After approx. 3 h, a steady-state current density of −60 mAcm−2 is reached. The authors assume that the residual current density is caused by the hydrogen evolution. This result is comparable to the current densities measured in the cyclic voltammogram (compare with Figure 2).
The decrease in manganese concentration in the electrolyte is due to manganese dioxide deposition on the counter electrode. This could be verified optically and by means of ICP-OES. Only a small amount of fine brown precipitate was formed in the electrolyte.
Mn2+ + 2H2O → MnO2 + 4H+ + 2e
Based on ICP measurements, the cobalt concentration drops sharply before a limit of 1.2 g L−1 is reached. The purity of the deposited cobalt amounts to 96 %; the purity of manganese amounts to 4 %. The content of manganese is caused by the fine brown precipitates already mentioned, which were precipitated and incorporated during the deposition.
The residual amount of cobalt in the electrolyte can be explained by the citric acid contained in the model system. The citric acid affects all transition metal ions in the model system and forms so-called chelate complexes. Depending on the pH value of the solution, the citrate species present vary and thus are also applied to the complex formed. The higher the pH value, the more the citric acid is deprotonated [28].
At the present pH of 4.2, about 70% of the nickel complexes formed are NiCit and about 30% are NiHCit. The complex stabilities are 6.9 and 4, respectively [29]. According to the Irving–Williams series, it can be assumed that both cobalt and manganese complexes are less stable [30] in comparison with nickel and copper complexes.
Mn2+ < Co2+ < Ni2+ < Cu2+
The higher stability of the nickel complexes results in a significantly higher overvoltage of the nickel deposition in comparison to the cobalt deposition. Consequently, the complexation of transition metals in chelate complexes can be used to separate nickel and cobalt for electrochemical deposition.
Considering the Irving–Williams series and the consequences discussed, the copper should show the most negative potential shift in the overvoltage. However, the literature indicates that copper forms complexes with several central ions in the present pH range [28]. It is well known from the literature that copper and nickel can form hetero-bi-nuclear complexes, which have low stability constants [31]. Surprisingly, the experiments show that only a few millivolts of overvoltage are sufficient for copper deposition. This fact suggests that copper is hardly complexed.

4. Conclusions

In this work, the authors investigate the electrochemical recovery and separation of battery-relevant metals dissolved in a model electrolyte. The metals are deposited at the following potentials:
  • Copper starts at 0 V (vs. SHE).
  • Cobalt starts at −1.1 V (vs. SHE).
  • Nickel starts at −1.4 V (vs. SHE).
Manganese is not electrochemically deposited. Instead, fine brown manganese dioxide particles precipitate, which are incorporated into the cobalt deposit in small quantities.
It is clearly shown that citric acid acts as complexing agent. As a result, the deposition potentials of cobalt and nickel differ significantly and offer the possibility of separating both by type.
The use of a metal foam enhances the deposition process due to the increase in the active surface by about 2.3 times. Unfortunately, Inconel® is slightly instable under the chosen conditions of redissolution of the deposited material into the hydrochloric–sulphuric acid electrolyte. This results in an overestimation of the deposited nickel and limits the lifetime of the foam as a working electrode.
The results obtained are currently being transferred to real leaching solutions. This work is in progress and will be further submitted.

Author Contributions

Conceptualization, C.K.-S. and M.W.; methodology, C.K.-S. and M.W.; validation, M.S. and M.W.; formal analysis, C.K.-S.; investigation, C.K.-S., M.W. and H.S.; resources, T.B. and A.M.; data curation, C.K.-S.; writing—original draft preparation, C.K.-S., M.W. and M.S.; review and editing, T.B., A.M. and M.S.; visualization, C.K.-S.; supervision, A.M.; project administration, M.S.; funding acquisition, A.M. All authors have read and agreed to the published version of the manuscript.

Funding

The authors gratefully thank the German Federal Ministry of Education and Research (BMBF) for the financial support for the project under grant number 03XP0332D via the Project Management Jülich, Forschungszentrum Jülich GmbH (PtJ), by a decision of the German Bundestag.

Data Availability Statement

The data presented in this study are available on request from the corresponding author.

Acknowledgments

The authors would like to thank the colleagues from the Fraunhofer Institute for Manufacturing Technology and Advanced Materials IFAM for providing the metal foam.

Conflicts of Interest

The authors declare no conflicts of interest. The funders had no role in the following: the design of the study; the collection, analyses, or interpretation of the data; the writing of the manuscript; or the decision to publish the results.

References

  1. Matthes, S.; Grewe, V.; Sausen, R.; Roelofs, G.-J. Global impact of road traffic emissions on tropospheric ozone. Atmos. Chem. Phys. 2007, 7, 1707–1718. [Google Scholar] [CrossRef]
  2. Matthes, S. Globale Auswirkung des Straßenverkehrs auf die Chemische Zusammensetzung der Atmosphäre. Ph.D. Thesis, Ludwig-Maximilians-Universität, München, Germany, 2023. [Google Scholar]
  3. McDuffie, E.E.; Smith, S.J.; O’Rourke, P.; Tibrewal, K.; Venkataraman, C.; Marais, E.A.; Zheng, B.; Crippa, M.; Brauer, M.; Martin, R.V. A global anthropogenic emission inventory of atmospheric pollutants from sector- and fuel-specific sources (1970–2017): An application of the Community Emissions Data System (CEDS). Earth Syst. Sci. Data 2020, 12, 3413–3442. [Google Scholar] [CrossRef]
  4. Situ, L. Electric Vehicle Development: The Past, Present & Future. In Proceedings of the 3rd International Conference on Power Electronics Systems and Applications (PESA), Hong Kong, China, 20 May 2009; Available online: https://www.researchgate.net/publication/224585932_Electric_Vehicle_development_The_past_present_future (accessed on 3 September 2023).
  5. Harper, G.; Sommerville, R.; Kendrick, E.; Driscoll, L.; Slater, P.; Stolkin, R.; Walton, A.; Christensen, P.; Heidrich, O.; Lambert, S.; et al. Recycling lithium-ion batteries from electric vehicles. Nature 2019, 575, 75–86. [Google Scholar] [CrossRef] [PubMed]
  6. Islam, M.T.; Iyer-Raniga, U. Lithium-Ion Battery Recycling in the Circular Economy: A Review. Recycling 2022, 7, 33. [Google Scholar] [CrossRef]
  7. Doose, S.; Mayer, J.K.; Michalowski, P.; Kwade, A. Challenges in Ecofriendly Battery Recycling and Closed Material Cycles: A Perspective on Future Lithium Battery Generations. Metals 2021, 11, 291. [Google Scholar] [CrossRef]
  8. Mousa, E.; Hu, X.; Ånnhagen, L.; Ye, G.; Cornelio, A.; Fahimi, A.; Bontempi, E.; Frontera, P.; Badenhorst, C.; Santos, A.C.; et al. Characterization and Thermal Treatment of the Black Mass from Spent Lithium-Ion Batteries. Sustainability 2023, 15, 15. [Google Scholar] [CrossRef]
  9. Peschel, C.; van Wickeren, S.; Preibisch, Y.; Naber, V.; Werner, D.; Frankenstein, L.; Horsthemke, F.; Peuker, U.; Winter, M.; Nowak, S. Comprehensive Characterization of Shredded Lithium-Ion Battery Recycling Material. Chem. Eur. J. 2022, 28, e202200485. [Google Scholar] [CrossRef] [PubMed]
  10. Schwich, L.; Schubert, T.; Friedrich, B. Early-Stage Recovery of Lithium from Tailored Thermal Conditioned Black Mass Part I: Mobilizing Lithium via Supercritical CO2-Carbonation. Metals 2021, 11, 177. [Google Scholar] [CrossRef]
  11. Brückner, L.; Frank, J.; Elwert, T. Industrial Recycling of Lithium-Ion Batteries—A Critical Review of Metallurgical Process Routes. Metals 2020, 10, 1107. [Google Scholar] [CrossRef]
  12. Mohr, M.; Weil, M.; Peters, J.; Wang, Z. Recycling of Lithium-Ion Batteries. In Encyclopedia of Electrochemistry; Bard, A.J., Ed.; John Wiley & Sons, Inc.: Hoboken, NJ, USA, 2020. [Google Scholar] [CrossRef]
  13. Makuza, B.; Tian, Q.; Guo, X.; Chattopadhyay, K.; Yu, D. Pyrometallurgical options for re-cycling spent lithium-ion batteries: A comprehensive review. J. Power Sources 2021, 491, 229622. [Google Scholar] [CrossRef]
  14. Ciez, R.E.; Whitacre, J.F. Examining different recycling processes for lithium-ion batteries. Nat. Sustain. 2019, 2, 148–156. [Google Scholar] [CrossRef]
  15. Asadi Dalini, E.; Karimi, G.; Zandevakili, S.; Goodarzi, M. A Review on Environ-mental, Economic and Hydrometallurgical Processes of Recycling Spent Lithium-ion Batteries. Miner. Process. Extr. Met. Rev. 2020, 42, 451–472. [Google Scholar] [CrossRef]
  16. Arshad, F.; Li, L.; Amin, K.; Fan, E.; Manurkar, N.; Ahmad, A.; Yang, J.; Wu, F.; Chen, R. A Comprehensive Review of the Advancement in Recycling the Anode and Electrolyte from Spent Lithium Ion Batteries. ACS Sustain. Chem. Eng. 2020, 8, 13527–13554. [Google Scholar] [CrossRef]
  17. Fan, X.; Song, C.; Lu, X.; Shi, Y.; Yang, S.; Zheng, F.; Huang, Y.; Liu, K.; Wang, H.; Li, Q. Separation and recovery of valuable metals from spent lithium-ion batteries via concen-trated sulfuric acid leaching and regeneration of LiNi1/3Co1/3Mn1/3O2. J. Alloys Compd. 2021, 863, 158775. [Google Scholar] [CrossRef]
  18. Vieceli, N.; Casasola, R.; Lombardo, G.; Ebin, B.; Petranikova, M. Hydrometallurgical recycling of EV lithium-ion batteries: Effects of incineration on the leaching efficiency of metals using sulfuric acid. Waste Manag. 2021, 125, 192–203. [Google Scholar] [CrossRef]
  19. Walther, G.; Klöden, B.; Büttner, T.; Weißgärber, T.; Kieback, B.; Böhm, A.; Naumann, D.; Saberi, S.; Timberg, L. A New Class of High Temperature and Corrosion Resistant Nickel-Based Open-Cell Foams. Adv. Eng. Mater. 2008, 10, 803–811. [Google Scholar] [CrossRef]
  20. Harald Pihl, Inconel 625. Available online: https://www.haraldpihl.com/de/products/Nickellegierungen/inconel-625 (accessed on 5 September 2023).
  21. Pourbaix, M. Atlas of Electrochemical Equilibria in Aqueous Solutions; Pergamon Press: New York, NY, USA, 1966; ISBN -13. [Google Scholar]
  22. Bockris, J.O.M. Electrolytic polarisation—I. The overpotential of hydrogen on some less common metals at high current densities. Influence of current density and time. Trans. Faraday Soc. 1947, 43, 417–429. [Google Scholar] [CrossRef]
  23. Heard, D.M.; Lennox, A.J.J. Electrode Materials in Modern Organic Electrochemistry. Angew. Chem. Int. Ed. 2020, 59, 18866–18884. [Google Scholar] [CrossRef]
  24. Haynes, W.M. Crc Handbook of Chemistry and Physics, 97th ed.; CRC Press LLC Taylor & Francis Group: Boca Raton, FL, USA, 2017; ISBN -13: 978-1-4987-5429-3. [Google Scholar]
  25. Han, P.; Bartels, D.M. Temperature Dependence of Oxygen Diffusion in H2O and D2O. J. Phys. Chem. 1996, 100, 5597–5602. [Google Scholar] [CrossRef]
  26. The Engineering ToolBox. Oxygen–Solubility in Fresh and Sea Water vs. Temperature. Available online: https://www.engineeringtoolbox.com/oxygen-solubility-water-d_841.html (accessed on 6 September 2023).
  27. Schneider, M.; Langklotz, U.; Labus, M.; Arnold, B.; Michaelis, A. Investigation of corrosion products formed on C35–AlMgSi0·5 friction welds during natural weathering in marine climate. Corros. Eng. Sci. Technol. 2012, 47, 312–319. [Google Scholar] [CrossRef]
  28. Rode, S.; Henninot, C.; Vallières, C.; Matlosz, M. Complexation Chemistry in Copper Plating from Citrate Baths. J. Electrochem. Soc. 2004, 151, C405–C411. [Google Scholar] [CrossRef]
  29. Zelenin, O.Y. Interaction of the Ni2+ ion with citric acid in an aqueous solution. Russ. J. Coord. Chem. 2007, 33, 346–350. [Google Scholar] [CrossRef]
  30. Irving, H.; Williams, R.J.P. Order of Stability of Metal Complexes. Nature 1948, 162, 746–747. [Google Scholar] [CrossRef]
  31. Daniele, P.G.; Ostacoli, G.; Zerbinati, O.; Sammartano, S.; De Robertis, A. Mixed metal complexes in solution. Thermodynamic and spectrophotometric study of copper(II)-citrate heterobinuclear complexes with nickel(II), zinc(II) or cadmium(II) in aqueous solution. Transit. Met. Chem. 1988, 13, 87–91. [Google Scholar] [CrossRef]
Figure 1. Experimental scheme of the experimental approach used in the present work.
Metals 14 00109 g001
Figure 2. Comparative cyclic voltammograms carried out on the model electrolyte as well as the basic electrolyte using a Ni-Cr foam as working electrode (dφ/dt = 5 mV s−1). The polarization direction is indicated by arrows originating from the starting potential (0.2 V vs. SHE).
Metals 14 00109 g002
Figure 3. Electrochemical deposition of model electrolyte (containing metal salt): (a) current density over time plots for exemplary deposition potentials; (b) amount of charge and deposited mass at each potentiostatic deposition step.
Metals 14 00109 g003
Figure 4. Transition metal concentration at each deposition potential from OES analysis of dissolution solutions.
Metals 14 00109 g004
Figure 5. Calculated mass change in copper and cobalt at each deposition potential from OES analysis of dissolution solutions.
Metals 14 00109 g005
Figure 6. Calculated nickel–chrome ratio at each deposition potential from OES analysis of dissolution solutions. The foam’s nickel–chromium ratio is indicated in red. The experimentally determined nickel–chromium ratio is defined as constant in the grey area.
Metals 14 00109 g006
Figure 7. Electrochemical Cu deposition from the model electrolyte: (a) the dependence of the current density vs. process duration at a constant potential of −0.3 V vs. SHE (sampling time marked in blue); (b) the evolution of the current density (black) and Cu content (blue) vs. process duration.
Metals 14 00109 g007
Figure 8. Cross-sectional FESEM image of an electrochemically coated metal foam; substrate and deposition are marked.
Metals 14 00109 g008
Figure 9. Electrochemical Co deposition model electrolyte (containing metal salt) at −1.3 V (vs. SHE) for 8 h. Current density (grey) and ICP-OES analysis of depleted model electrolyte (colored) and enriched acid solution in terms of dependence on duration.
Metals 14 00109 g009
Table 1. Composition of the model electrolyte (pH 4.2, electrical conductivity 69.8 mS cm−1).
Type of Elementρ (Element) g L−1(Metallic) Salt Usedρ (Salt)
g L−1
c
mol L−1
Co10CoSO4 7H2O47.70.17
Ni9NiSO4 6H2O40.30.15
Mn8MnSO4 H2O24.610.15
Cu2CuSO4 5H2O7.860.03
P2H3PO4 (85 wt.%)4.41 cm3 L−10.07
Al0.3Al2(SO4)3 16H2O3.50.01
Li0.1LiCl0.610.01
H2SO4 (96 wt.%)5.6 cm3 L−10.1
citric acid500.26
Disclaimer/Publisher’s Note: The statements, opinions and data contained in all publications are solely those of the individual author(s) and contributor(s) and not of MDPI and/or the editor(s). MDPI and/or the editor(s) disclaim responsibility for any injury to people or property resulting from any ideas, methods, instructions or products referred to in the content.

