Abstract
Mechanical components often experience fatigue loading from various waveform conditions during their operational lifespan. However, the underlying mechanisms through which variations in loading waveform affect the fatigue life of components remain unclear. Thus, this study conducted tension–compression fatigue experiments on 34CrNi3MoVA steel specimens under the same stress amplitude with different waveforms (cosine, triangular, sawtooth, and reverse sawtooth) to investigate the effects of loading waveform variations on the cyclic strain hardening behaviors, the fatigue fracture failure, and the fatigue life. The results indicated that specimens under different waveforms all exhibited cyclic strain hardening. The fatigue cyclic hardening level progressively increased in the order of cosine, triangular, and sawtooth waveforms, resulting in a continuous increase in cyclic saturation strain amplitude. The analysis of fatigue fractures demonstrated a consistent increase in both the initiation and propagation zone areas in the order of cosine, triangular, and sawtooth waveforms, and the boundary between the propagation and final fracture zones gradually shifted from a straight to a curved shape. The influence mechanisms of cyclic loading waveforms on the fatigue life of specimens were analyzed based on the energy dissipation, leading to the development of a universal fatigue life prediction model applicable to different waveform conditions, the model was then verified with the reverse sawtooth wave specimens and resulted in a prediction error less than 15%. The study is expected to serve as a significant guide for predicting and evaluating the fatigue life of mechanical components under various fatigue loading conditions.
1. Introduction
Many mechanical components experience cyclic alternating fatigue loading during their service process, resulting in fatigue fracture becoming a primary mode of failure. To assess the fatigue performance of mechanical components, fatigue performance testing is generally conducted by using laboratory fatigue testing machines. However, conventional fatigue limit test and fatigue life assessments are typically conducted under standard the cosine loading conditions. Further, the fatigue life of service mechanical components is evaluated based on the established fatigue life testing standards. However, mechanical components are often subjected to a wide variety of waveforms during operation, including cosine, triangular, sawtooth, and other waveforms, and, at times, even irregular combinations of waveforms. Thus, evaluating the fatigue performance of mechanical components under various waveforms by using simple cosine wave fatigue tests lacks a scientific theoretical basis. Consequently, studying the influence and mechanisms of changes in fatigue loading waveforms on material fatigue performance is of significant importance.
Numerous scholars have conducted research on the fatigue performance of components under different fatigue loading waveform conditions. Barat et al. [1] investigated the influence of fatigue loading waveforms on the low-cycle fatigue performance of IN718 alloy specimens, and observed a decrease in cyclic softening with increasing fatigue life. Liu et al. [2] conducted low-cycle fatigue experiments on Inconel 625 alloy under triangular and two sawtooth waveform conditions at 650 °C. They found that the alloy exhibited cyclic strain hardening behavior within the range of 0.3–0.7% strain amplitude. Moreover, their findings unveiled that specimens under all three waveforms displayed transgranular fracture patterns in fatigue crack initiation and propagation behaviors. Prasad et al. [3] studied the impact of two fatigue loading strain waveforms (high loading rate–low unloading rate, and low loading rate–high unloading rate) on the low-cycle fatigue failure behavior of 834 titanium alloy. They discovered that the fatigue life of specimens subjected to the low loading rate–high unloading rate waveform was significantly lower than that of specimens under the high loading rate–low loading rate waveform. This was attributed to the strong dynamic strain aging effect caused by the interaction between dislocations and solute atoms at low tensile loading rates. In addition to variations in the loading and unloading rates, actual service components were exposed to short-term loading force holding phenomena known as load-hold periods. The introduction of load-hold periods, often referred to as dwell time, tended to exert an adverse impact on the fatigue performance and consequently shortened the material fatigue life [4,5,6]. Wang et al. [4] analyzed the influence of microstructure and fatigue loading waveforms on the creep-fatigue behavior of a nickel-based superalloy. They observed that the introduction of fatigue load-hold time resulted in a transition from transgranular crack initiation and propagation to intergranular crack initiation and propagation. Further, inclusion-induced and slip band-induced cracking were identified as factors that contributed to crack initiation during load-hold fatigue loading. By controlling the heat treatment dwell time, Zeng et al. [6] compared the fatigue damage mechanisms of pure and load-hold fatigue in dual-phase Ti-6Al-4V alloys. They reported that the introduction of load-hold time promoted the occurrence of fatigue damage in the softer phase of microstructure, significantly reducing the fatigue life. From the aforementioned research, it is evident that studies on the influence of fatigue loading waveforms on the fatigue performance of materials mainly focused on the low-cycle fatigue service conditions. These studies demonstrated the influence mechanisms of waveforms on the fatigue performance of materials from the perspective of microstructural damage. However, the relationship between the fatigue life and the loading waveform under the high-cycle fatigue loading still remains unclear.
34CrNi3MoVA steel is a kind of alloy steel with versatility and broad application prospects in the manufacturing of crankshafts, engine rotors, and turbine impellers [7,8], which are often subjected to fatigue loads with various types of waveforms. So, this study intended to perform fatigue loading on the 34CrNi3MoVA steel by using loading waveforms of cosine wave (CW), triangular wave (TW), sawtooth wave (SW), and reverse sawtooth wave (RSW). The objective was to analyze the cyclic strain hardening behavior of 34CrNi3MoVA steel specimens under different loading waveforms and reveal the fatigue fracture and failure mechanisms of the specimens under different waveforms. Considering the multiple influencing factors, a universal fatigue life prediction model suitable for different loading waveforms was established.
2. Materials and Methods
The materials used in this study are quenched and tempered 34CrNi3MoVA steel rods with a diameter of 15 mm, which were acquired by cutting from rolled metals, and the main chemical composition of this material is shown in Table 1. A section of the steel bar was cut, polished, and then etched by using the Nital 4% solution. Thereafter, the etched microstructure was observed via the metallographic microscopy (Olympus Corporation, Tokyo, Japan).

Table 1.
Chemical composition of 34CrNi3MoVA alloy steel (wt. %).
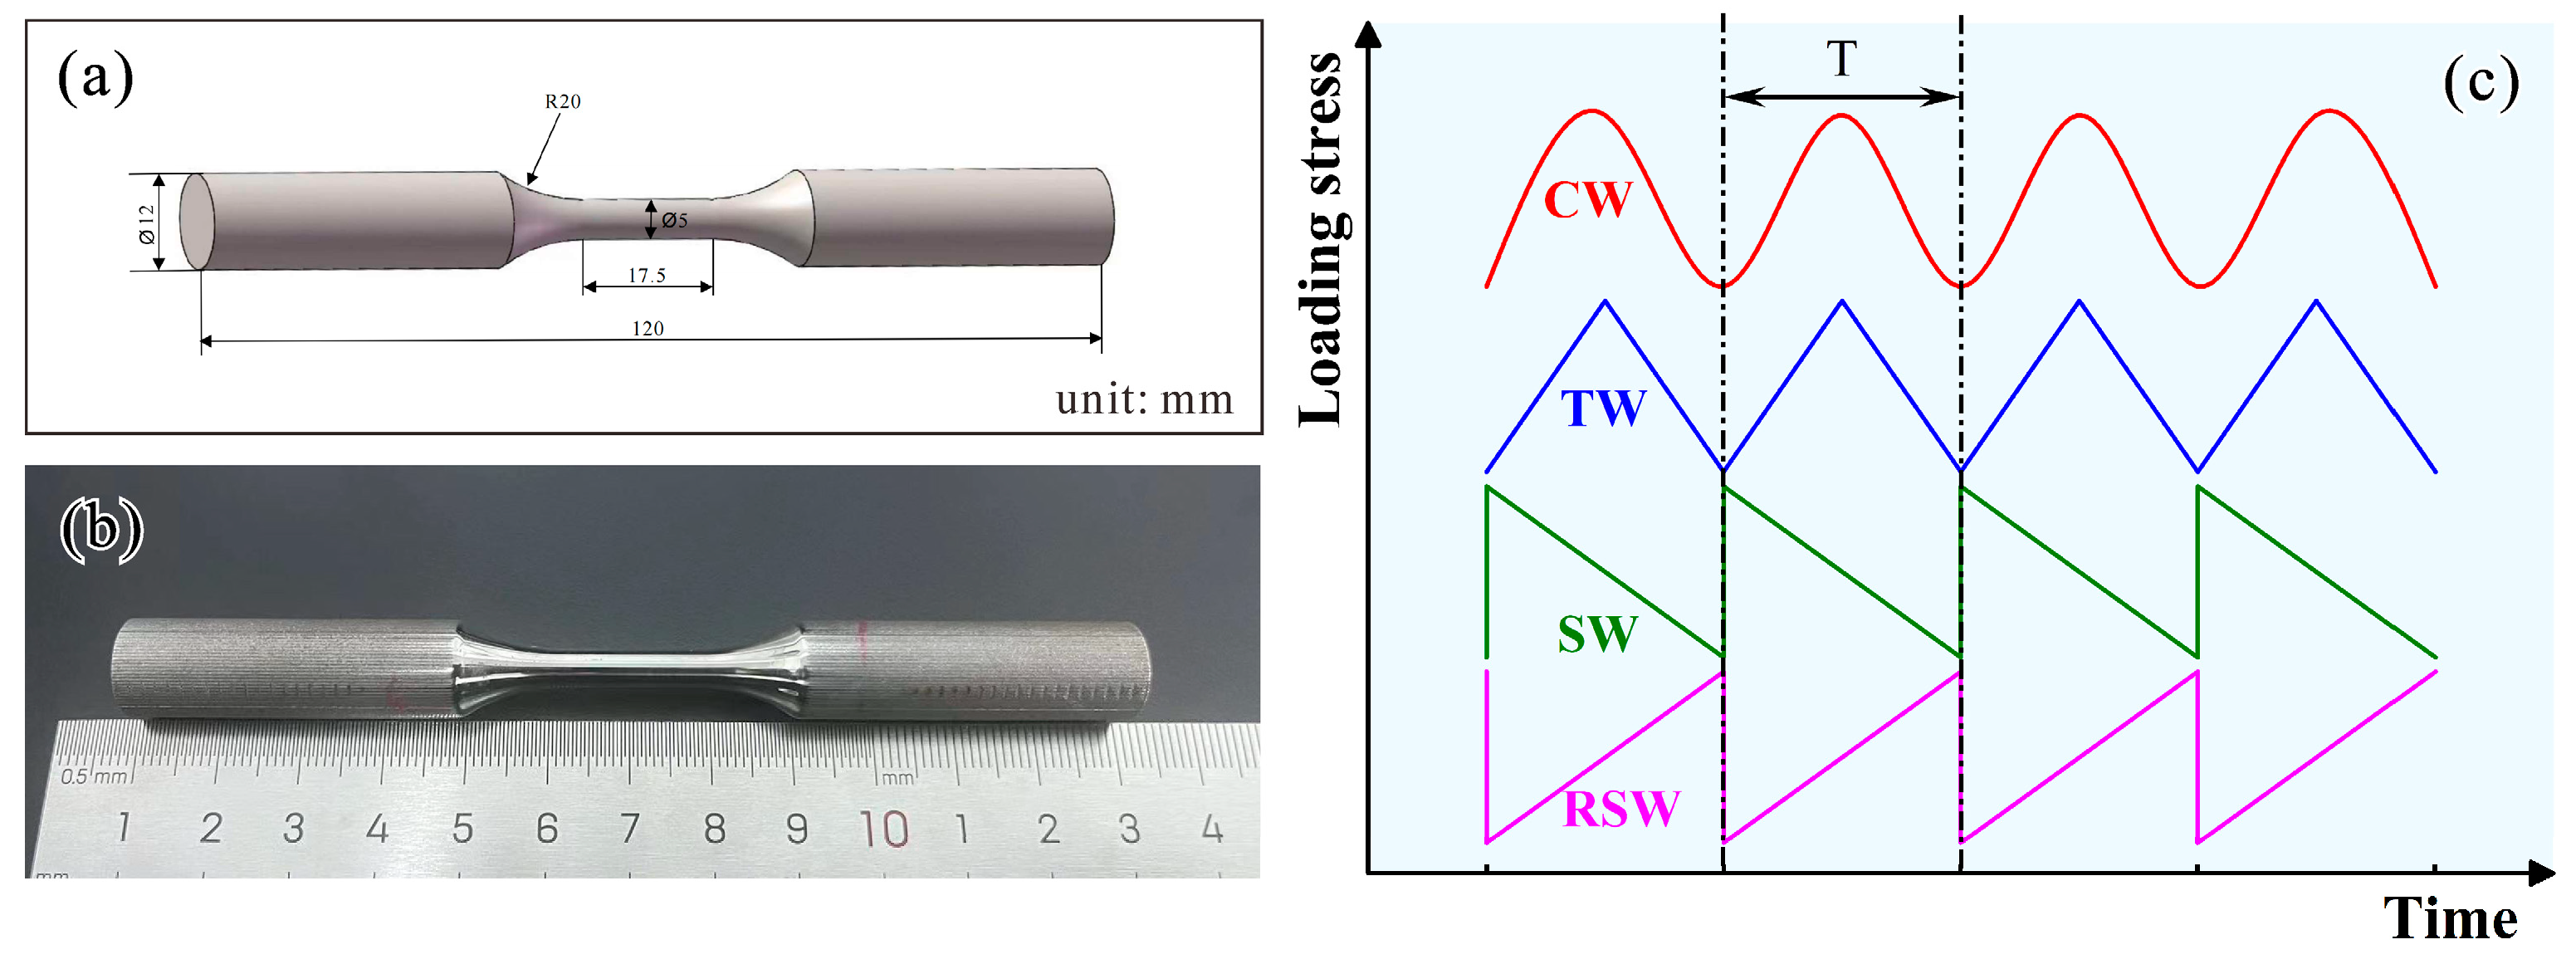
According to the ISO 1099-2006 standard [9], the fatigue specimens were machined on a circular rod with a diameter of 15 mm, the dimension and photo of the fatigue specimens are shown in Figure 1a,b. Before the fatigue tests, three uniaxial tensile tests were conducted by using the INSTRON E10000 fatigue testing machine, the dimension of the tensile specimens is the same as that of the fatigue specimens. The experimental conditions for the tensile test were as follows: the strain rate was 3.3 × 10⁻³ s−1, and the test temperature was room temperature (RT). After the tensile tests, the optical microscope was employed to observe and analyze the fracture surfaces and the morphologies of the dimples. For the high-cycle tension–compression fatigue test, the fatigue loading stress amplitude was 560 MPa, the stress ratio was R = −1, and the loading frequency was 3 Hz. Four types of waveforms were used: CW, TW, SW, and RSW; the schematic of the loading waveforms is shown in Figure 1c, and at least three repetitions for each kind of waveform were prepared. The fatigue specimens were defined as cosine wave specimens (CWS), triangular wave specimens (TWS), sawtooth wave specimens (SWS), and reverse sawtooth wave specimens (RWS). The fatigue tests of CWS, TWS, and SWS were used for the establishment of fatigue life model, while the RWS were used for demonstrating the reliability of the model. After the fatigue fracture of specimens, the fatigue fracture was observed and analyzed by using the optical microscope, and the areas of different regions on the fatigue fracture were analyzed.
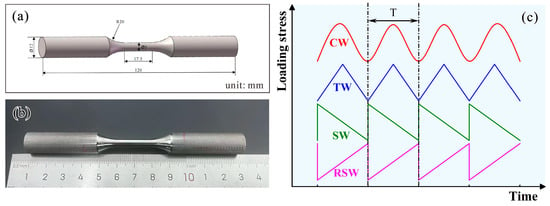
Figure 1.
(a) Schematic and (b) photo of fatigue specimen and tensile specimen; (c) schematic of fatigue loading waveforms.
3. Experimental Results and Analysis
3.1. Metallographic Structure and Properties
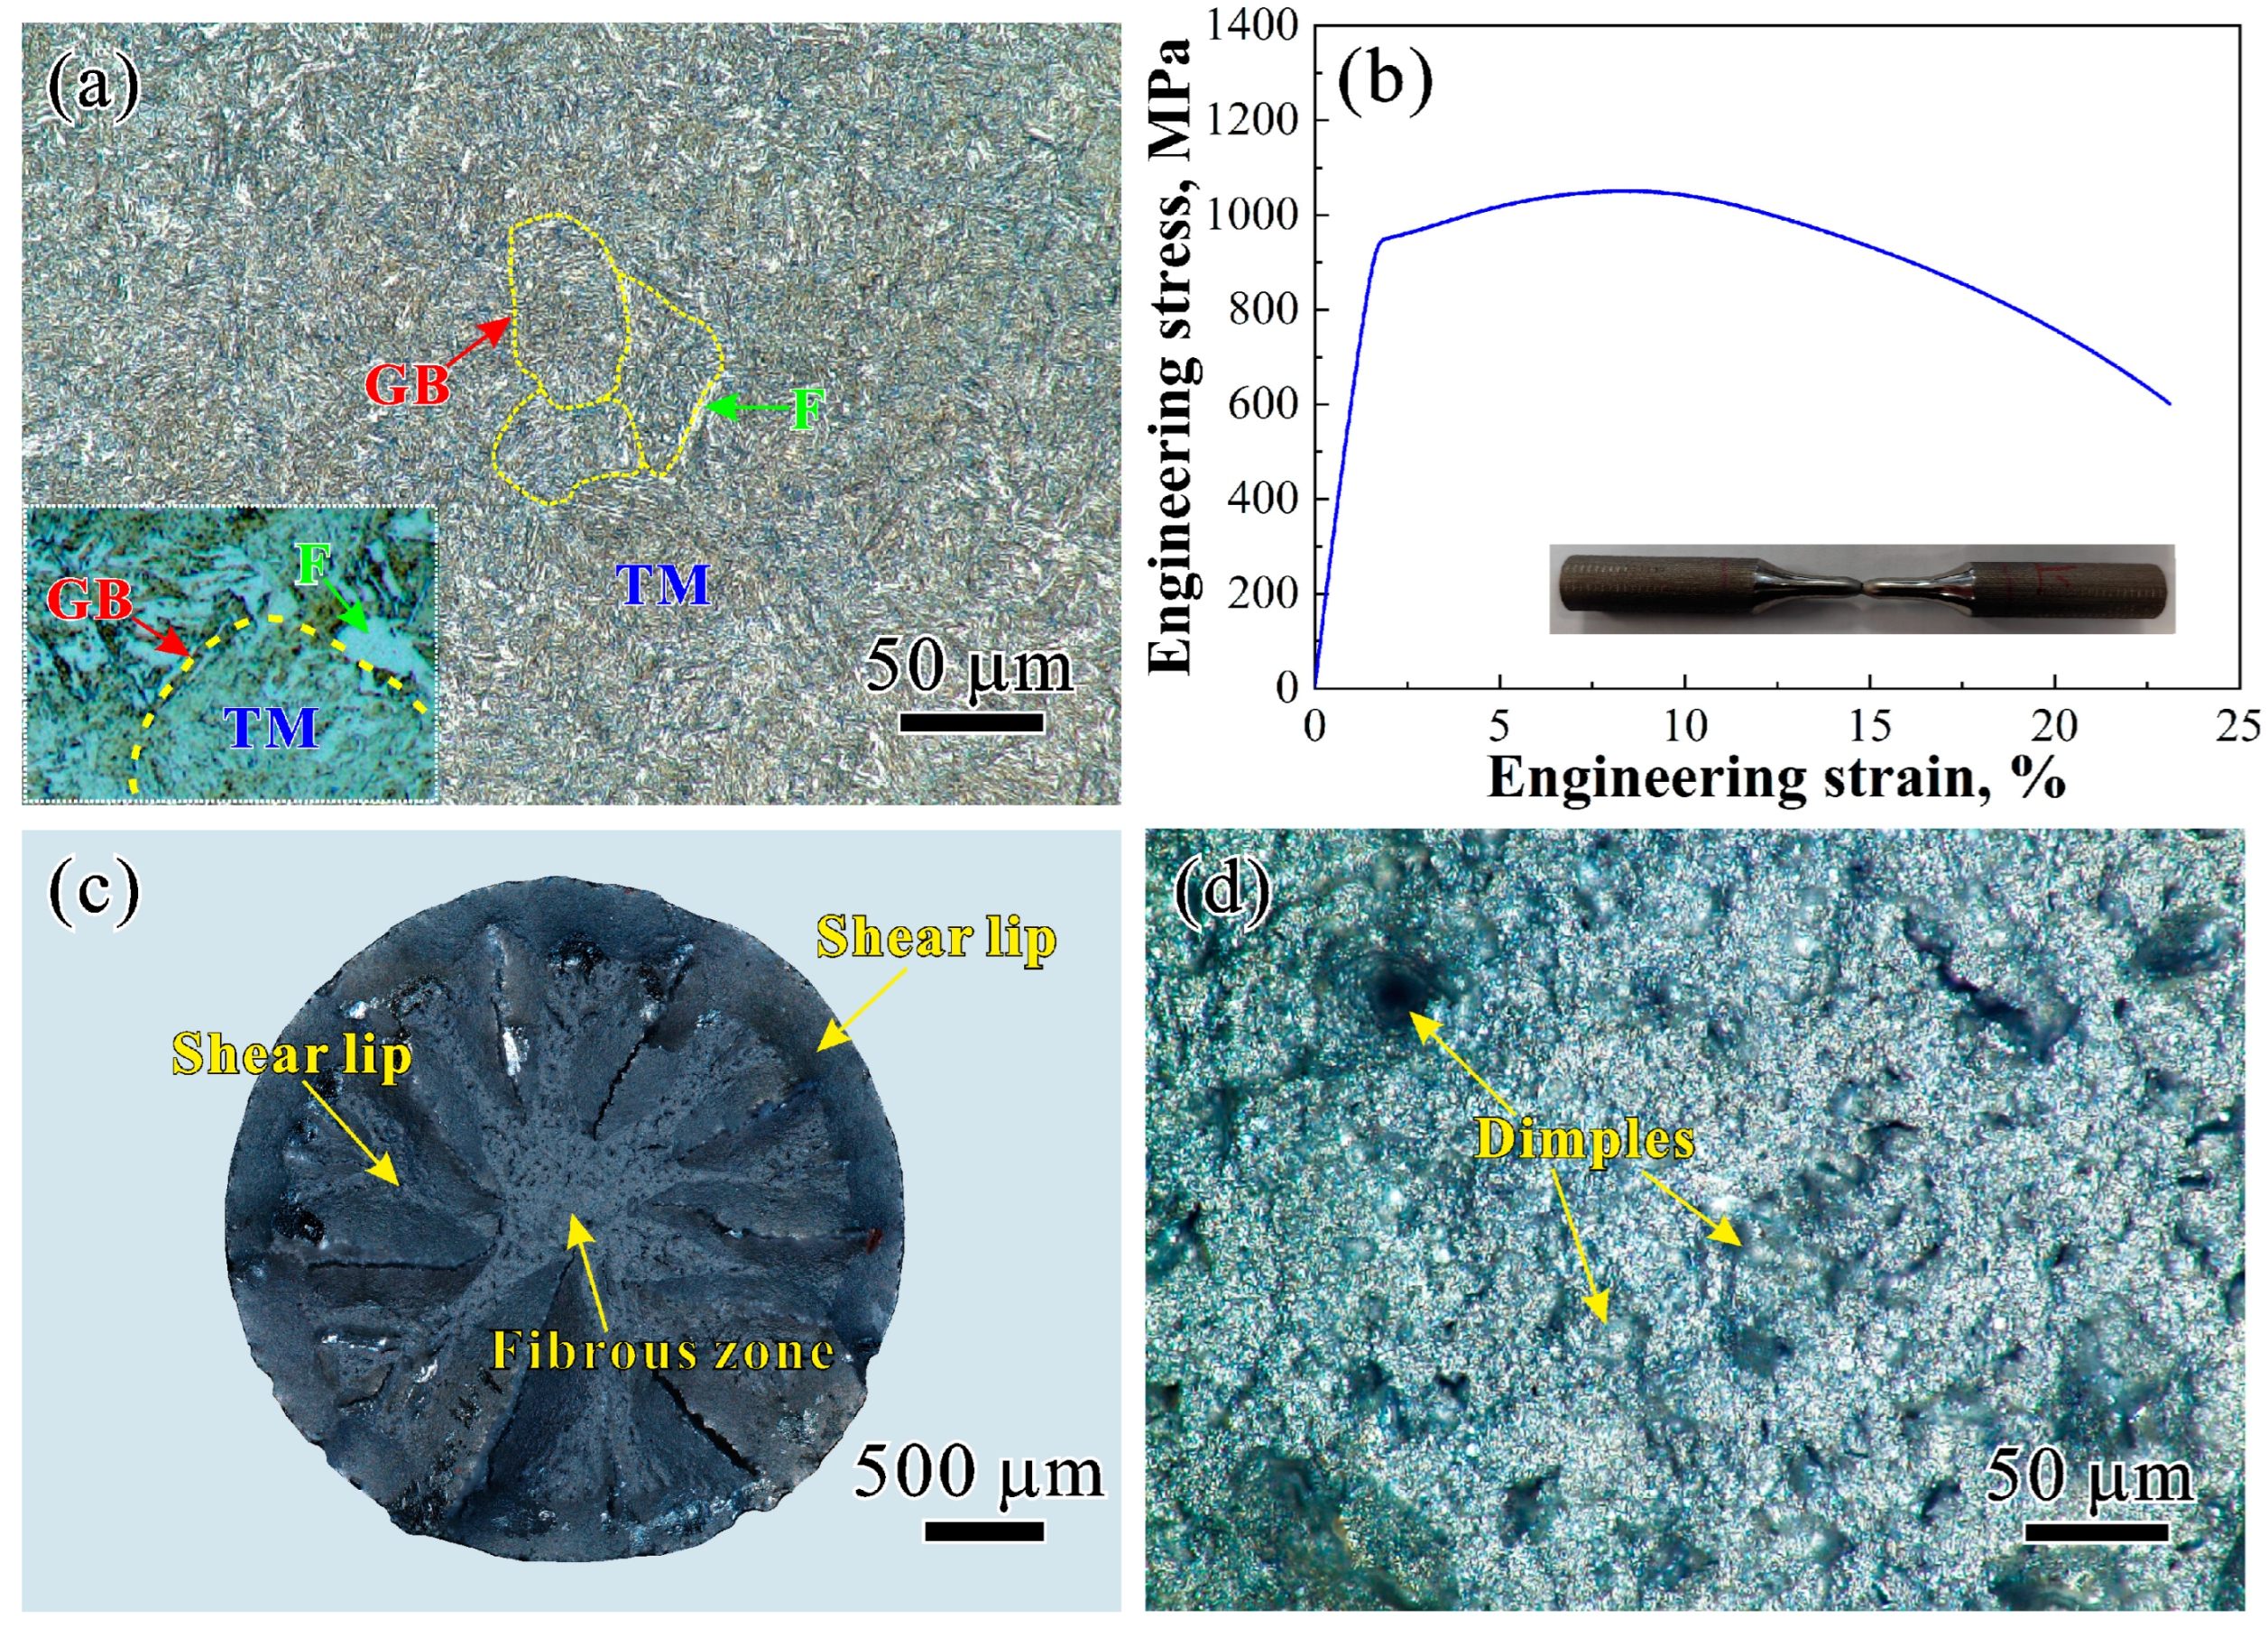
Figure 2a shows a metallographic photograph of the microstructure of the 34CrNi3MoVA steel. As evident, the microstructure of the specimen was primarily composed of tempered martensite (TM), the grain size of the microstructure was approximately 45 μm, as indicated by the dotted yellow line in Figure 2a. In addition, approximately 8.64% ferrite (F) was observed at the grain boundaries (GB), as indicated by the green arrow in the inset of Figure 2a. The typical tensile engineering stress–strain curve of the specimen during the tensile testing is shown in Figure 2b. As evident, the ultimate tensile strength of the specimen was approximately 1055 MPa, the yield strength was approximately 949 MPa, the uniform elongation was 6.69%, and the fracture elongation was approximately 22%. Subsequently, the morphology of the tensile fracture was characterized and analyzed by using an Olympus DSX1000 optical microscope. The overall photograph of the tensile fracture surface is shown in Figure 2c, which shows fibrous, radiative, and shear lip regions, as indicated by the yellow arrows. Furthermore, a magnified observation of the dimple morphology in the fibrous region of the tensile fracture revealed the presence of numerous dimples, with an average size of approximately 15.57 μm. Thus, it can be concluded that the fracture surface of the tensile specimen exhibited the typical ductile fracture characteristics of micropore aggregation [10], thereby indicating the excellent toughness of the material.
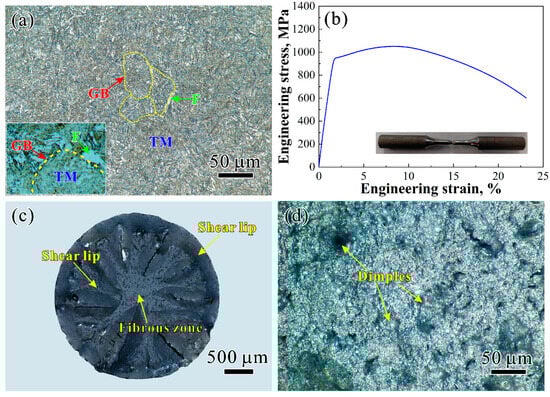
Figure 2.
(a) Typical optical micrograph, (b) tensile engineering stress–strain curve, (c) tensile fracture, and (d) dimple morphology of the 34CrNi3MoVA steel specimens.
3.2. Fatigue Life
Furthermore, the high-cycle tension–compression fatigue tests under the stress amplitude of 560 MPa were conducted on the 34CrNi3MoVA steel specimens by using a fatigue testing machine, and the fatigue life of the specimens under different waveform conditions was obtained, as shown in Figure 3. The fatigue life of different specimens exhibited a continuous increasing trend in the order of CWS, TWS, and SWS.
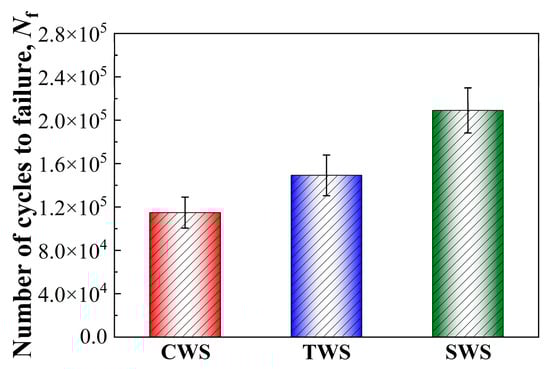
Figure 3.
Fatigue life of 34CrNi3MoVA steel specimens under different waveforms.
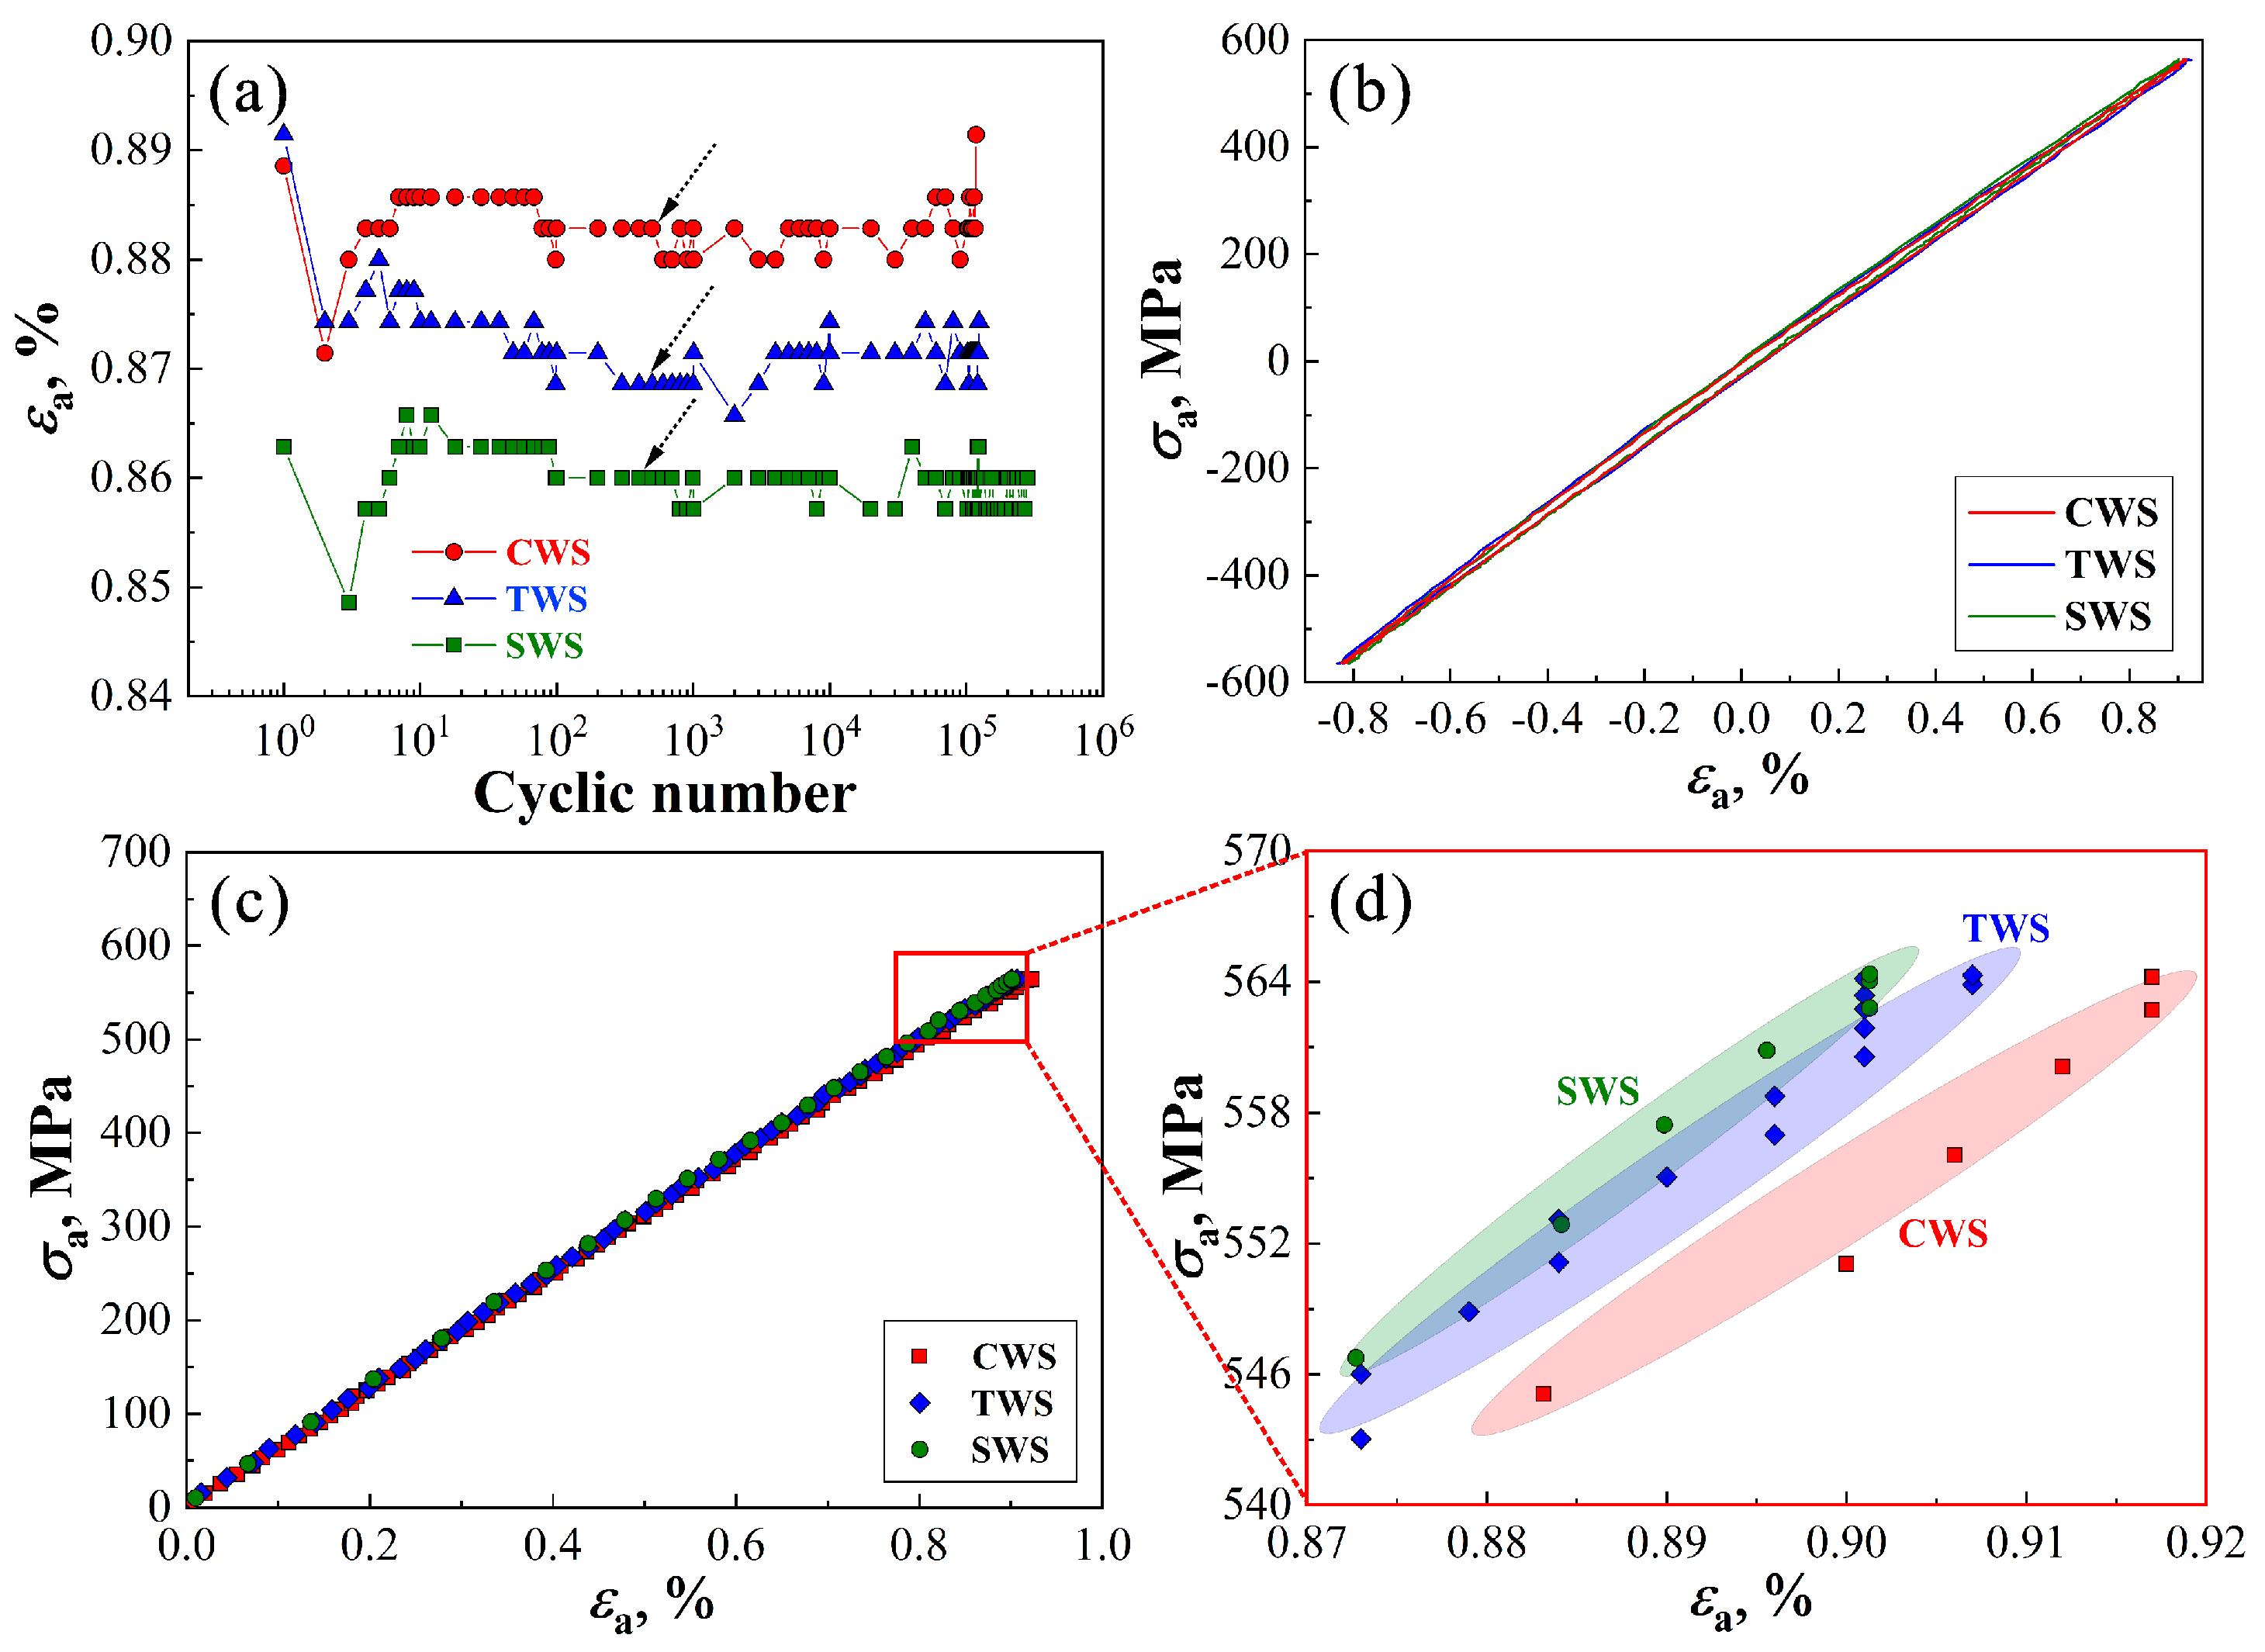
In addition, the cyclic strain–cyclic number data of the specimens under different waveforms under the same amplitude of 560 MPa were obtained, as shown in Figure 4a. As evident, the cyclic strain amplitudes of the specimens under all waveform loadings initially decreased and then remained constant (saturation stage) with increasing the cycles, demonstrating the typical cyclic strain hardening behavior [11]. In general, the cyclic strain hardening or softening behavior of a material is related to dislocation motion and the development of dislocation substructures. The results mentioned above indicate that under the three waveform loadings, the dislocations in the microstructure of the alloy steel proliferate and entangle, resulting in the cyclic hardening behavior [12]. Even with the same stress amplitude, there was a significant difference in the cyclic saturation strain amplitudes of the specimens under different waveforms, and the cyclic saturation strain amplitude exhibited a decreasing trend in the order of CWS, TWS, and SWS, as indicated by the black dotted arrows in Figure 4a. In general, a larger strain amplitude at the saturation plateau corresponds to a higher cyclic strain endured by the specimen, which facilitates faster dislocation motion, promotes the continuous development of dislocation substructures, and accelerates the accumulation of fatigue damage [13,14,15]. Thus, the fatigue life of the specimens exhibited an increasing trend in the order of CWS, TWS, and SWS, as show in Figure 3. Furthermore, we obtained the cyclic hysteresis loops of the specimens at the saturation plateau for the three waveform cases, as shown in Figure 4b. By truncating and displaying the loading curves of cyclic hysteresis loops for different waveform specimens in Figure 4b, the relationship between cyclic loading stress and strain was then exhibited in Figure 4c. The red box in Figure 4c was then enlarged and shown in Figure 4d to focus on the local areas of cyclic stress–strain curves of different specimens. From Figure 4d, one can find that the cyclic stress decreased in the order of CWS, TWS, and SWS under the same cyclic strain, as indicated by the red, blue, and green elliptical shadows in Figure 4d. The results in Figure 4d indicated that the 34CrNi3MoVA steel specimens under different loading modes exhibited different levels of cyclic hardening, with SWS exhibiting a significantly higher cyclic hardening level than TWS, and TWS exhibiting a significantly higher cyclic hardening level than CWS. The higher cyclic hardening level of the SWS resulted in its lower cyclic saturation strain amplitudes, which is beneficial to inhibiting the accumulation of fatigue damage [13,14,15]. So, the fatigue life of the SWS is higher when compared with the TWS and the CWS, and the fatigue life of the specimens exhibit an increasing trend in the order of CWS, TWS, and SWS, as shown in Figure 3.
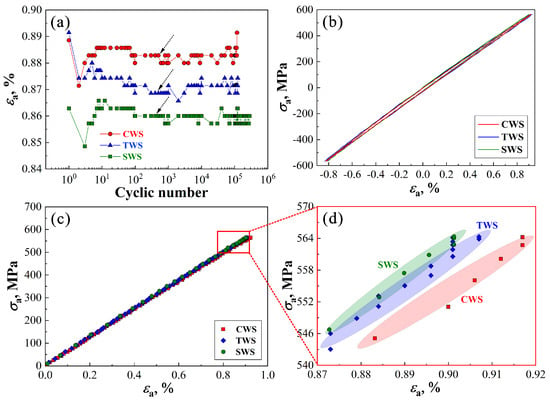
Figure 4.
Three typical waveform specimens: (a) cyclic strain hardening curves, (b) hysteresis loop, (c) cyclic loading stress–strain curve, (d) enlarged local area of cyclic loading stress–strain curves.
Based on the research analysis in Figure 4, it is evident that the cyclic stress of the specimens exhibited different trends with increasing the cyclic strain for different specimens, which is related to the varying levels of cyclic hardening under different loading waveforms. In general, the relationship between cyclic stress and strain during the fatigue loading can be expressed by Equation (1):
where the K′ is the cyclic strengthening coefficient of the material, which is typically approximated as the ratio of the fatigue limit to the static yield strength. Further, the n′ denotes the cyclic strain hardening exponent of the material, which characterizes the material’s ability to strain hardening during the cyclic loading. By the nonlinear fitting of Equation (1) to the relationship between σa and εa in Figure 4c, the values of K′ and n′ for different waveform specimens under the fatigue loading stress of 560 MPa can be obtained. The specific values of these two parameters are presented in Table 2. As evident, in the order of CWS, TWS, and SWS, the value of n′ increased continuously for all specimens. The parameter n′ reflected the level of cyclic hardening during the fatigue loading, and the SWS exhibited the strongest cyclic hardening capability, surpassing the TWS and the CWS. In addition, the values of K′ for the specimens under different loading waveforms also showed a continuous increasing trend. The reason for this can be analyzed as follows: the yield strength under the tensile test was a constant value for different specimens, whereas the fatigue life of the specimens under the same fatigue loading stress amplitude increased in the order of CWS, TWS, and SWS. Consequently, it is reasonable to assume that the fatigue limit of the specimens increased in the order of CWS, TWS, and SWS, and K′ was directly proportional to the fatigue limit. Therefore, the K′ also exhibited a continuous increasing trend in the aforementioned order.
Table 2.
Cyclic stress–strain parameters of specimens with different waveforms.
3.3. Fatigue Fracture Behavior
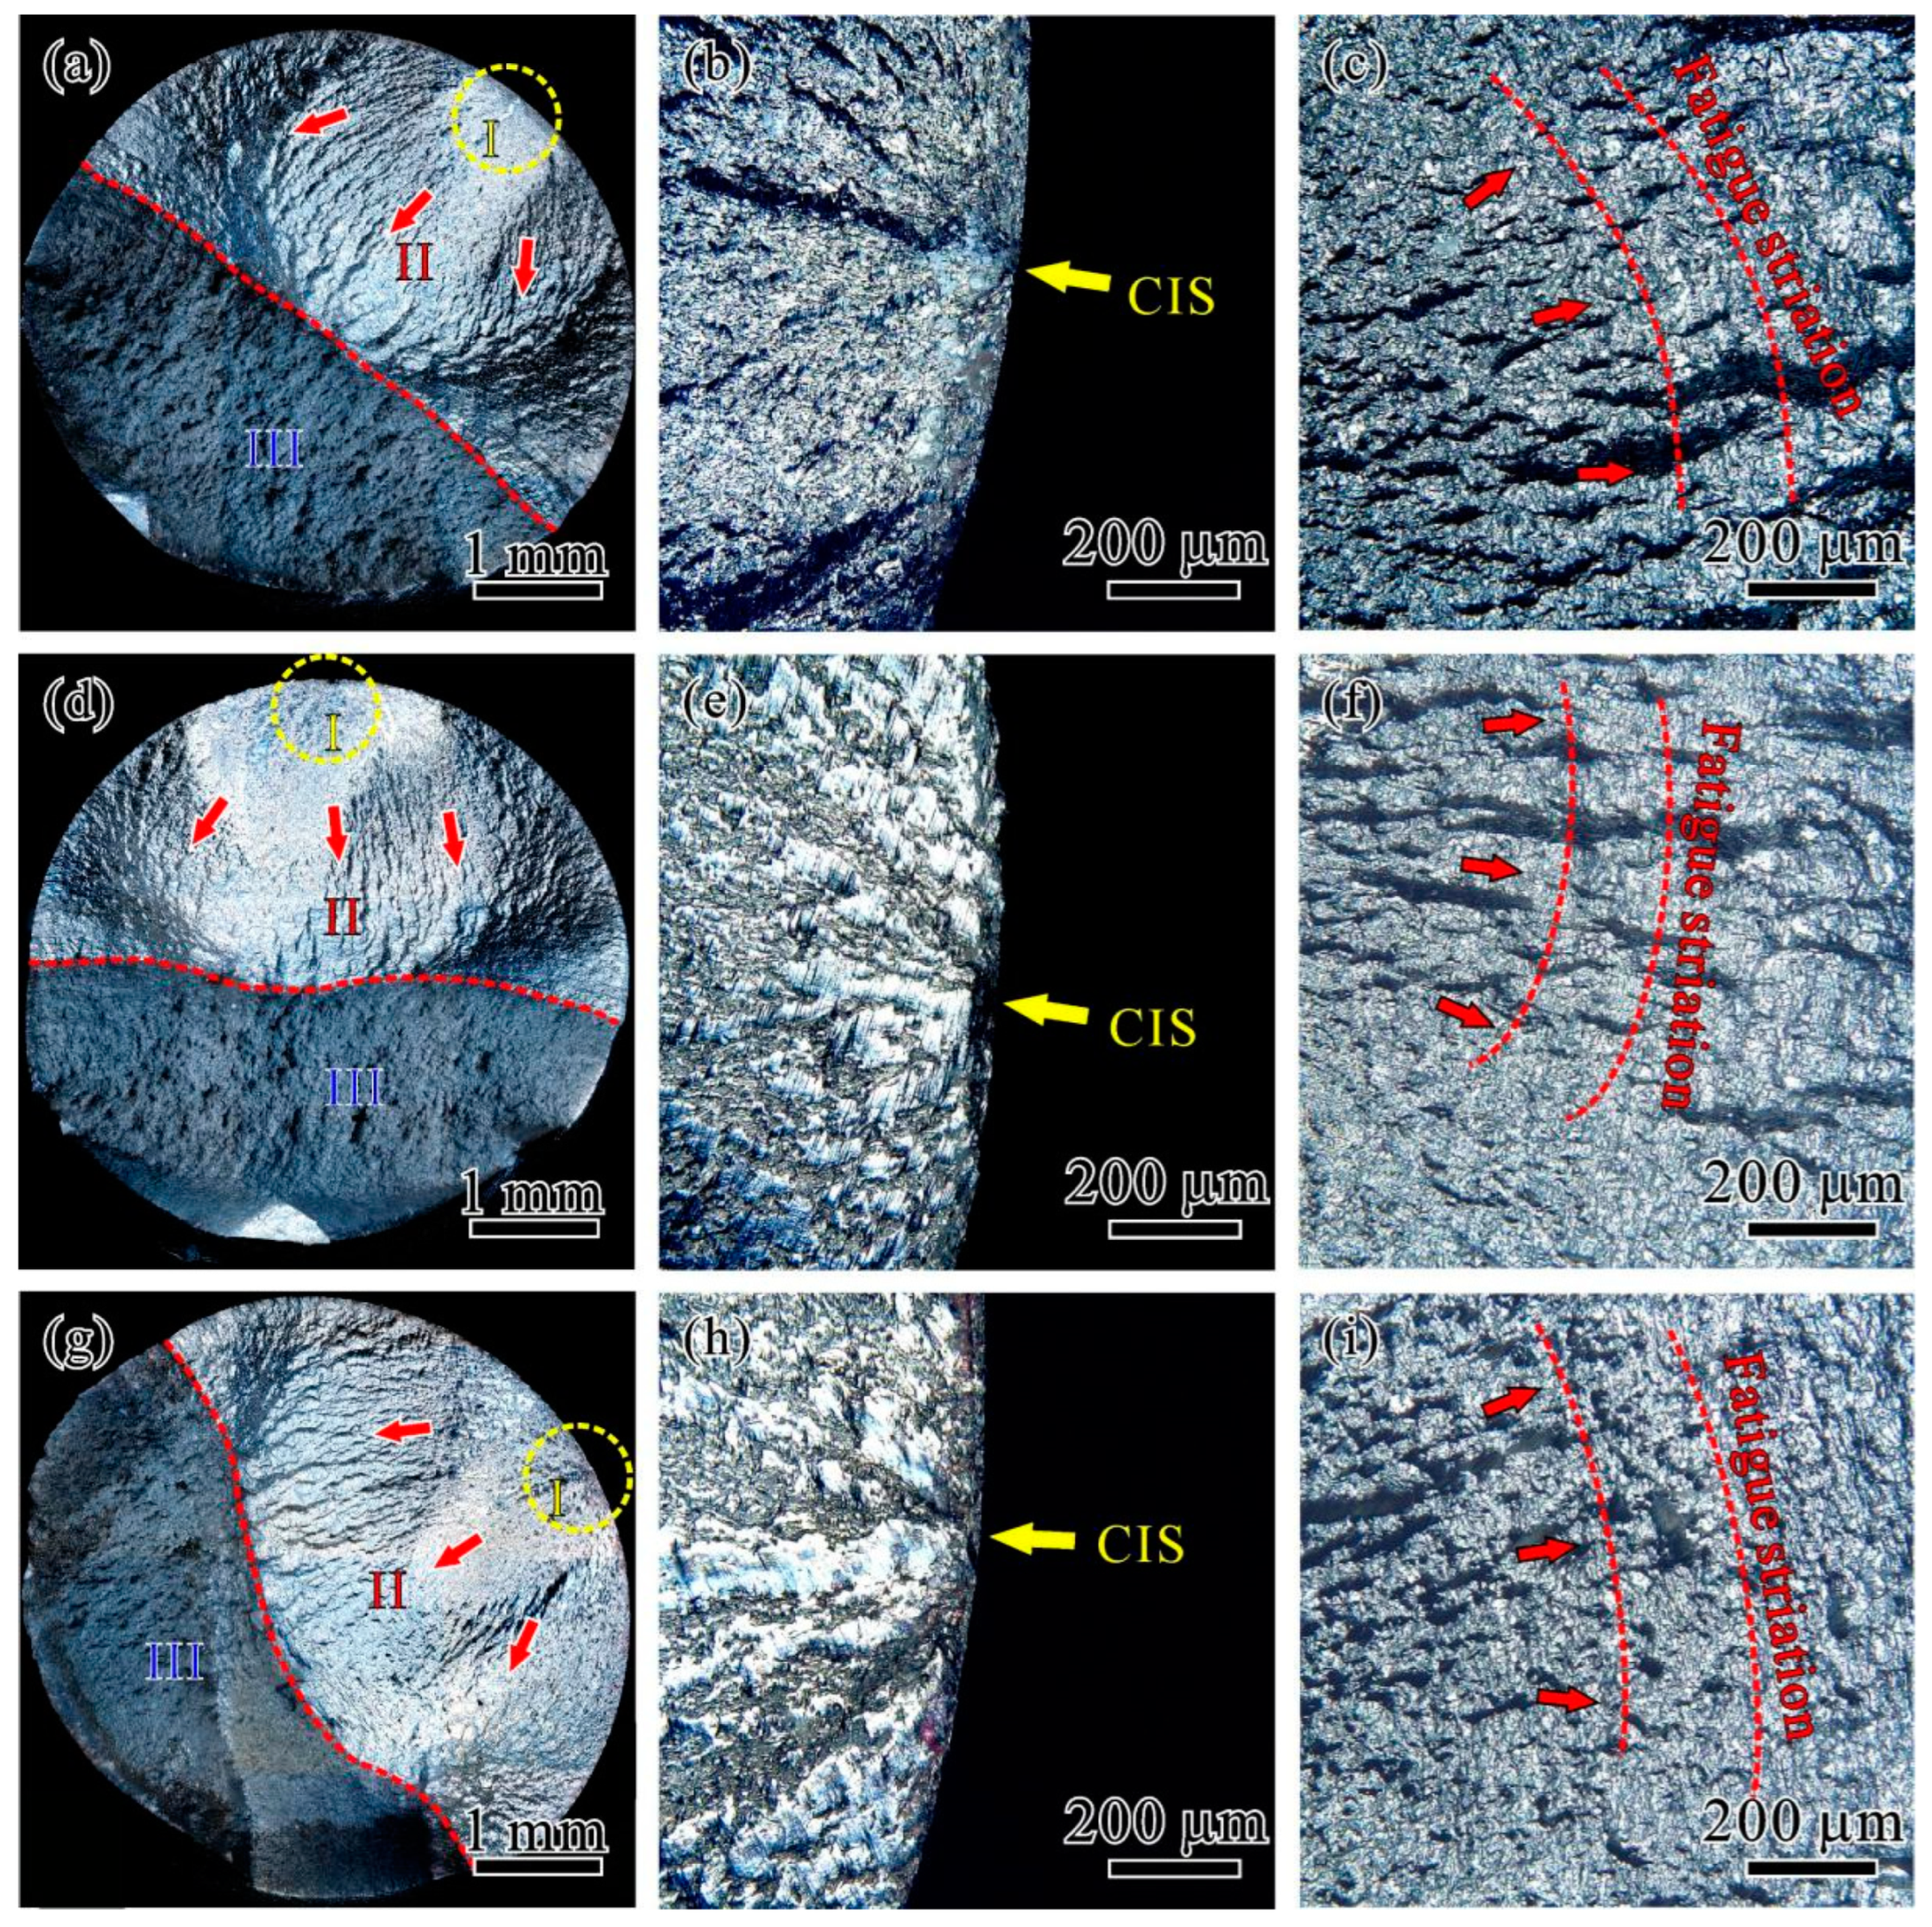
The fatigue fracture surfaces of the specimens under different cyclic fatigue waveforms were observed and analyzed by using laser confocal microscopy, as shown in Figure 5. As evident, the fatigue fracture surfaces of all waveforms could be divided into crack initiation zones (Zone I), propagation zones (Zone II), and final fracture zones (Zone III). Amplified photos of the crack initiation zones are shown in Figure 5b,e,h, which revealed that the crack initiation sites (CIS) were all located on the surface of the specimens, as indicated by the yellow arrows. Under the fatigue loading, the cracks propagated from the surface towards the interior of the specimens. Zone II of the specimens under all waveform conditions was observed and analyzed, as shown in Figure 5c,f,i. In these zones, the presence of fatigue striations was observed, as indicated by the red dashed lines. The direction of fatigue crack propagation was perpendicular to that of the fatigue striations, as indicated by the red arrows. When the stress intensity factor at the crack tip reached a critical value, the fatigue crack entered the final fracture zone of Zone III. The morphology of Zone III resembled the fibrous region of the tensile fracture surface shown in Figure 2d. A comparison of the fatigue fracture surfaces of the specimens under different waveforms, as shown in Figure 5a,d,g, revealed that the boundary line between Zone II and Zone III gradually changed from a straight line to a curved line in the order of CWS, TWS, and SWS. The straight boundary line implied lower crack propagation resistance and shorter propagation life of the specimens. The whole areas of Zone I and Zone II for the CWS, TWS, and SWS were 10.51, 10.90, and 11.51 mm2, respectively, accounting for 0.54, 0.56, and 0.59 of the fracture surface. Further, in the order of CWS, TWS, and SWS, the ratio of the whole areas of Zone I and Zone II exhibits a continuous increasing trend. In general, the crack initiation and propagation life account for the majority of the fatigue life [11], and larger areas of Zone I and Zone II imply a higher fatigue life of the specimens [16,17]. The areas of Zone I and Zone II exhibited a continuous increasing trend in the order of CWS, TWS, and SWS, indicating an increasing fatigue life, which was consistent with the fatigue life results presented in Figure 3.
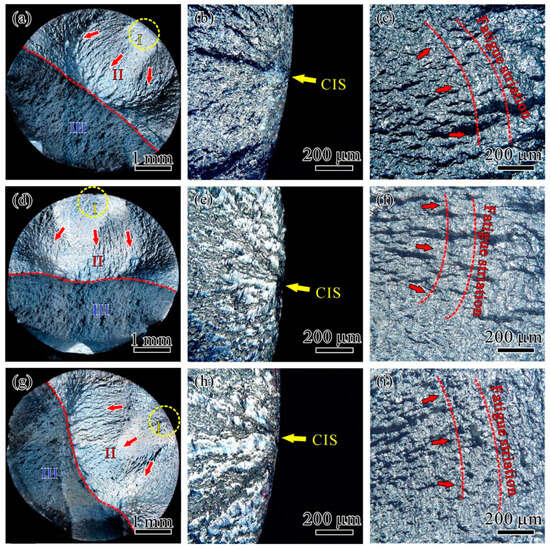
Figure 5.
Laser confocal microscopy photos of fatigue fractures of specimens with different waveforms: (a–c) CWS, (d–f) TWS, and (g–i) SWS.
3.4. Fatigue Life Prediction Model
Under the same stress amplitude, specimens under different loading waveforms exhibited different levels of cyclic hardening, resulting in different magnitudes of saturated cyclic strain amplitudes. A higher level of cyclic hardening corresponded to a smaller value of the saturated cyclic strain amplitude over time, and a lower cyclic strain amplitude implied a lower rate of cyclic damage accumulation, which is beneficial to increasing the fatigue life of the specimens [18,19]. In addition, the variation in cyclic loading waveforms resulted in changes in the proportion of Zone I and Zone II, a larger area of Zone I and Zone II indicated longer crack initiation and propagation life. Considering these factors, in the order of CWS, TWS, and SWS, the fatigue life of the specimens exhibited a continuous increasing trend. During the fatigue loading process, even under the same applied stress amplitude, specimens under different cyclic waveforms can experience different amounts of cyclic work from the fatigue testing machine. This is an important factor leading to the differences in cyclic strain hardening behavior and fatigue fracture characteristics of the specimens. Therefore, the differences in fatigue life under different waveform loadings can also be interpreted from the energy perspective. Under the action of fatigue loading stress amplitude, the accumulation of cyclic plastic work is an important reason for the irreversible damage and fatigue fracture failure of materials. The relationship between unit cyclic plastic strain work and fatigue life can be expressed as [20,21,22]:
where Wc is the unit cyclic plastic strain work, and A and r are parameters related to the material itself. For most Masing-type materials, the unit cyclic plastic strain work of a specimen can be expressed as [23]:
where σa is the cyclic fatigue stress amplitude (560 MPa for the specimens in this study), and εa is the plastic strain amplitude of the specimen during the cyclic loading. The saturation phase accounted for the majority of the fatigue loading process, and the plastic strain amplitude was defined as the strain value corresponding to the cyclic saturation plateau. Further, the n′ is the cyclic strain hardening exponent of the material, which can be calculated by using Equation (1). The specific values of the three parameters for different loading waveforms are presented in Table 2. Furthermore, according to Equation (3) and the values in Table 2, the Wc values for specimens under different waveforms can be calculated, as shown in Table 2. The relationship between Wc and Nf is then shown in Figure 6. Fitting the relationship between Wc and Nf by using Equation (2), as shown by the red dashed line in Figure 6, the specific equation relating Wc and Nf can be acquired as follows:
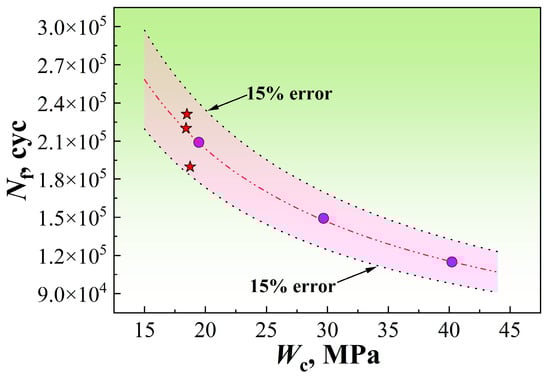
Figure 6.
Relationship between Nf and Wc of specimens.
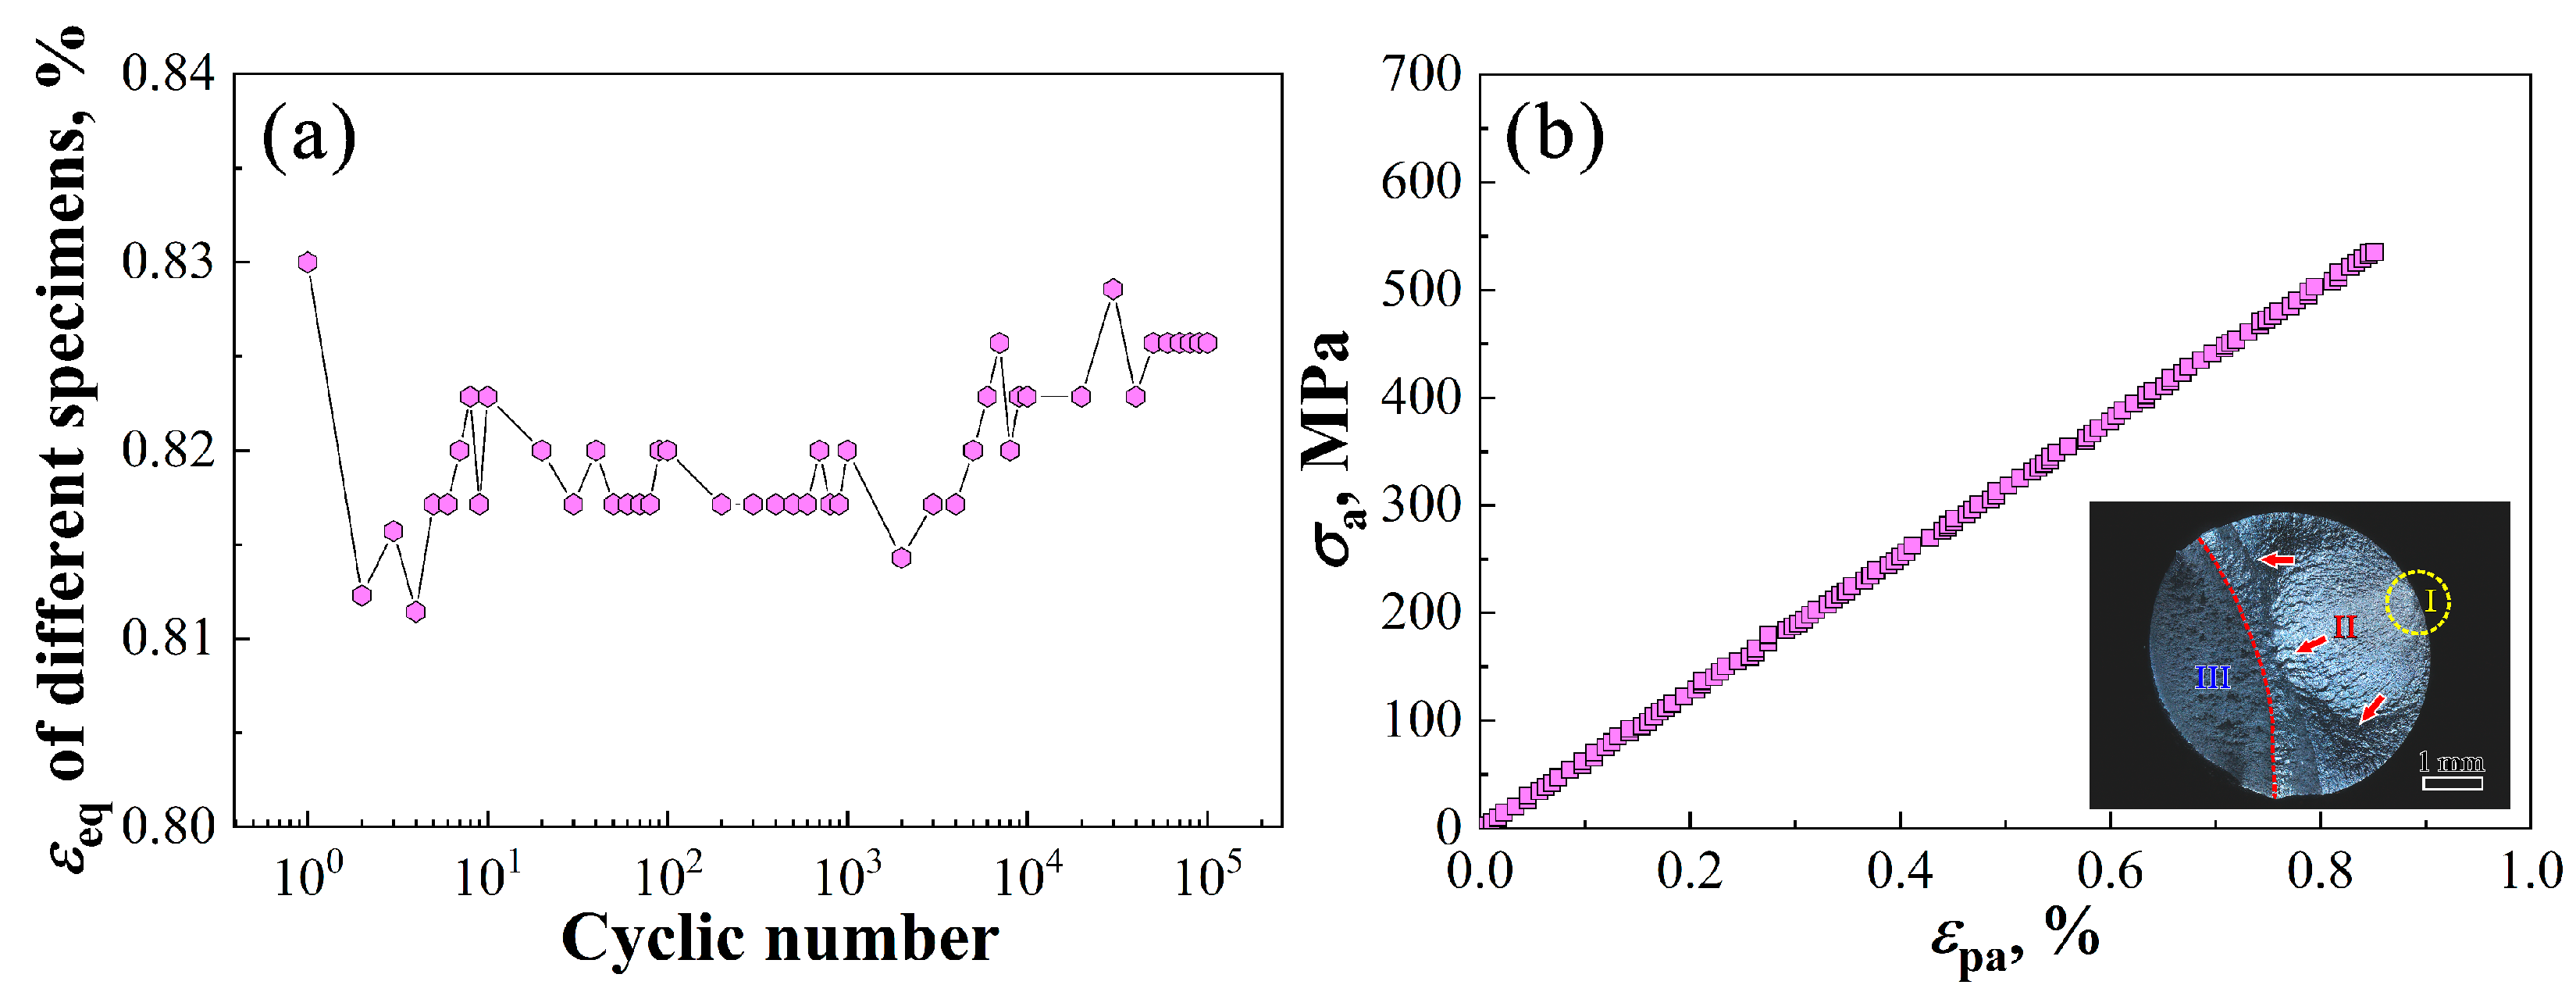
To verify the accuracy of the fatigue life prediction model, fatigue performance tests were conducted on three specimens of 34CrNi3MoVA steel by using an RSW, as shown in Figure 1c. The fatigue test conditions were the same as those for the CWS, TWS, and SWS. The cyclic strain hardening curve and the relationship between cyclic loading stress and cyclic loading strain for the typical RSWs are shown in Figure 7a and Figure 7b, respectively. The specimen also exhibited cyclic strain hardening behavior, with a cyclic saturation strain plateau of 0.82, which was lower than that of the CWS, TWS, and SWS. This implies a higher cyclic hardening level of the RSWs. Similarly, the fatigue fracture surfaces of the RSWs were observed, as shown by the inset of Figure 7b. As evident, the fatigue fracture surface was also divided into Zone I, Zone II, and Zone III. The fatigue crack originates from the surface of the specimen, and the whole area of Zone I and Zone II was 12.32 mm2. This accounted for 0.63 of the total fatigue fracture surface, which was larger than that of the previous three types of waveform-loaded specimens. The data of Nf and Wc for the three RSWs are plotted in Figure 6 as red pentacles. The data points for the RSWs were mostly within the 15% error band of the fitted curve, indicating a relatively high accuracy of the fatigue life prediction model.
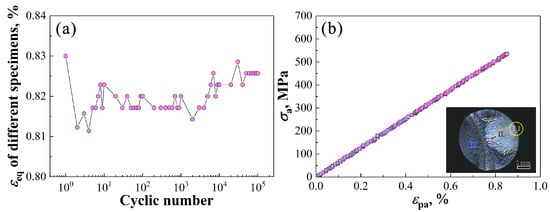
Figure 7.
(a) Cyclic strain hardening curve and (b) relationship between cyclic loading stress and cyclic loading strain of typical RSWs.
In this study, fatigue loading was performed on 34CrNi3MoVA steel specimens by using CW, TW, SW, and RSW. The influence of the waveform variation on the fatigue life of the specimens was analyzed from the perspectives of cyclic strain hardening behavior and fatigue fracture failure. The study revealed that the cyclic hardening level of the specimens exhibited an increasing trend as the waveform changed from CW to RSW, resulting in a decreasing trend in the cyclic strain amplitude at saturation. A smaller cyclic saturation strain amplitude indicated a lower rate of fatigue damage accumulation, resulting in a higher fatigue life of the specimens. Furthermore, when comparing the fatigue fractures of four waveform specimens, it was evident that the interface between Zone II and Zone III transitioned from a straight line to a curved line gradually. In addition, the whole area of Zone I and Zone II exhibited an increasing trend, indicating a higher fatigue crack initiation and propagation life. Moreover, the influence mechanism of cyclic loading waveforms on the fatigue performance of the specimens was explained from an energy perspective. A fatigue life prediction model considering waveform variation was established, and it was validated by using the RSWs, with the validation results yielding a prediction error of less than 15%. However, there are still certain issues in this study that must be addressed. For example, the waveforms in this study were of a single type, whereas the actual loading conditions involving complex combinations of multiple waveforms are important factors should be considered for the predicting the fatigue life of components [24,25,26]. In addition, the loading stress amplitude in actual conditions was not constant, and the applicability of this model when the loading stress amplitude is subjected to irregular variations is another issue that must be explored [27,28]. Nevertheless, this work reveals the influence of waveform type on the fatigue life of specimens from the perspective of dissipative energy, establishing a universal fatigue life prediction model suitable for different waveform conditions, which has certain reference significance for predicting the fatigue life of actual workpieces under complex loading conditions.
4. Conclusions
(1) This study investigated the influence of fatigue loading waveforms, such as cosine, triangular, sawtooth, and reverse sawtooth waves, on the cyclic strain hardening behavior of specimens. The research findings revealed that, in the order of cosine, triangular, sawtooth, and reverse sawtooth waves, the cyclic strain hardening level of specimens showed a continuous increasing trend, resulting in a decreasing trend of the cyclic saturation strain amplitude.
(2) The analysis of the influence of cyclic loading waveforms on fatigue fracture and damage behavior revealed that the fatigue crack initiation locations of the specimens under different waveforms were all on the surface of the specimens. With a decrease in the unit cyclic strain work, the combined area of the fatigue initiation and propagation zones demonstrated a continuous increasing trend in the order of cosine, triangular, sawtooth, and reverse sawtooth waveforms. The interface between the propagation zone and the final fracture zone gradually transitioned from a straight line to a curved line.
(3) In the order of cosine, triangular and sawtooth waveforms, the unit cyclic strain work of the specimens continuously decreased, resulting in an increasing trend in the fatigue life of the specimens. A fatigue life prediction model, based on the energy dissipation theory, was established and found to be applicable to specimens with different waveforms. The accuracy of the model was validated by using the specimens under reverse sawtooth waveform loading, with a simulation error within 15%. This model has certain reference significance for predicting the fatigue life of actual workpieces under complex loading conditions.
Author Contributions
Conceptualization, X.G. and J.C.; methodology, X.G.; software, J.T.; validation, X.G., J.C. and J.T.; formal analysis, X.G.; investigation, J.C.; resources, J.C.; data curation, X.G.; writing—original draft preparation, X.G. and J.T.; writing—review and editing, J.C.; visualization, J.T.; supervision, X.G. and J.C.; project administration, J.C.; funding acquisition, J.C. All authors have read and agreed to the published version of the manuscript.
Funding
This work was supported by the China Postdoctoral Science Foundation (No. 2023M730939) and the Starting Research Fund from the Jiangsu University of Science and Technology (No. 1022932102).
Data Availability Statement
The data presented in this study are available on request from the corresponding author. The data are not publicly available due to privacy.
Conflicts of Interest
The authors declare no conflict of interest.
References
- Barat, K.; Sivaprasad, S.; Kar, S.K.; Tarafder, S. Low-cycle fatigue of IN 718: Effect of waveform. Fatigue Fract. Eng. Mater. Struct. 2019, 42, 2823–2843. [Google Scholar] [CrossRef]
- Liu, X.Y.; Chen, L.J.; Zhou, G.; Wang, B.S. Effect of strain waveform on low-cycle fatigue properties of inconel 625 alloy. Rare Met. Mater. Eng. 2021, 50, 1263–1269. [Google Scholar]
- Prasad, K.; Sarkar, R.; Ghosal, P.; Kumar, V. Effects of strain waveform on low cycle fatigue behavior of near a timetal 834 titanium alloy. Mater. Des. 2011, 32, 1710–1715. [Google Scholar] [CrossRef]
- Wang, R.Z.; Bo, C.; Zhang, X.C.; Tu, S.T.; Wang, J.; Zhang, C.C. The effects of inhomogeneous microstructure and loading waveform on creep-fatigue behavior in a forged and precipitation hardened nickel-based superalloy. Int. J. Fatigue 2017, 97, 190–201. [Google Scholar] [CrossRef]
- Zeng, L.R.; Lei, L.M.; Luo, X.M.; Zhang, G.P. Toward an understanding of dwell fatigue damage mechanism of bimodal Ti-6Al-4V alloys. J. Mater. Sci. Technol. 2022, 108, 244–255. [Google Scholar] [CrossRef]
- Zeng, L.R.; Wang, L.Y.; Hua, P.T.; He, Z.P.; Zhang, G.P. In-situ investigation of dwell fatigue damage mechanism of pure Ti using digital image correlation technique. Mater. Charact. 2021, 181, 111466. [Google Scholar] [CrossRef]
- Hu, Y.; Zhang, D.; Xu, L.Z.; Sun, T.Y.; Zhang, P.; Lei, J.C. Effect of notch on fatigue performance of marine shaft made of 34CrNi3Mo alloy steel under torsional loading. Int. J. Fatigue 2023, 175, 107790. [Google Scholar] [CrossRef]
- Cai, Z.D. Improvement of Heat Treatment Quality Issues for 34CrNi3Mo Steam Turbine Rotors and Spindles. China Chem. Ind. Equip. 2005, 1, 28–32. [Google Scholar]
- ISO 1099–2006; Metallic Materials—Fatigue Testing—Axial Force–Controlled Method. International Organization for Standardization: Geneva, Switzerland, 2006.
- Meyers, M.A.; Chawla, K.K. Mechanical Behavior of Materials, 2nd ed.; Cambridge University Press: New York, NY, USA, 2009. [Google Scholar]
- Suresh, S. Fatigue of Materials, 1st ed.; Cambridge University Press: Cambridge, UK, 1998. [Google Scholar]
- Zhang, Y.J.; Han, D.; Li, X.W. Improving the stress-controlled fatigue life of low solid-solution hardening Ni-Cr alloys by enhancing short range ordering degree. Int. J. Fatigue 2021, 149, 106266. [Google Scholar] [CrossRef]
- Chen, J.Z.; Zhang, B.; Song, Z.M.; Zhang, G.P. Biaxial tension-torsion fatigue properties of A588 steel weld joint for high-speed train bogie. Mater. Sci. Eng. A 2023, 865, 144634. [Google Scholar] [CrossRef]
- Li, R.H.; Zhang, Z.J.; Zhang, P.; Zhang, Z.F. Improved fatigue properties of ultrafine grained copper under cyclic torsion loading. Acta Mater. 2013, 61, 5857–5868. [Google Scholar] [CrossRef]
- Wang, Q.; Sun, Q.; Xiao, L.; Sun, J. Torsion fatigue behavior of pure titanium with a gradient nanostructured surface layer. Mater. Sci. Eng. A 2016, 649, 359–368. [Google Scholar] [CrossRef]
- Wang, R.; Shang, D.; Shen, T.; Li, L.S.; Yan, C.L. Damage parameters of two-spot welds using variation of natural frequency. Chin. J. Mech. Eng. 2007, 43, 74–79. [Google Scholar] [CrossRef]
- Zhang, X.Q.; Wang, D.; Zhang, J.; Lou, L.H. Effect of strain rate on the low cycle fatigue properties of Re-free Nickel-base single crystal superalloy. Chin. J. Mater. Res. 2011, 25, 231–236. [Google Scholar]
- Li, H.F.; Wei, J.L.; Li, S.H.; Liu, Y.Q.; Gu, X.H.; Liu, Z.C.; Yang, S.P. Fatigue life prediction of high-speed train bearings based on the generalized linear cumulative damage theory. Fatigue Fract. Eng. Mater. Struct. 2023, 46, 2112–2120. [Google Scholar] [CrossRef]
- Zhou, Z.Q.; Liu, X.S.; He, G.Q.; Liao, Y.P.; Liu, Y.F.; Liu, Z.; Wang, Q.G. Fretting fatigue behavior and damage mechanism of cast Al-Si-Cu-T6 alloy under two surface roughness conditions. Int. J. Fatigue 2023, 175, 107765. [Google Scholar] [CrossRef]
- Ostergren, W.J. A damage foundation hold time and frequency effects in elevated temperature low cycle fatigue. J. Test. Eval. 1967, 4, 327–339. [Google Scholar]
- Fan, Y.N.; Shi, H.K.; Tokuda, K. A generalized hysteresis energy method for fatigue and creep-fatigue life prediction of 316L(N). Mater. Sci. Eng. A 2015, 625, 205–212. [Google Scholar] [CrossRef]
- Jahed, H.; Varvanifarahani, A. Upper and lower fatigue life limits model using energy-based fatigue properties. Int. J. Fatigue 2006, 28, 467–473. [Google Scholar] [CrossRef]
- Koh, S.K. Fatigue damage evaluation of a high pressure tube steel using cyclic strain energy density. Int. J. Pres. Ves. Pip. 2002, 79, 791–798. [Google Scholar] [CrossRef]
- Ruan, W.D.; Shi, J.C.; Sun, B.; Qi, K.F. Study on fatigue damage optimization mechanism of deepwater lazy wave risers based on multiple waveform serial arrangement. Ocean. Eng. 2021, 228, 108926. [Google Scholar] [CrossRef]
- Li, K.S.; Wang, R.Z.; Xu, L.; Zhang, C.C.; Xia, X.X.; Tang, M.J.; Zhang, G.D.; Zhang, X.C.; Tu, S.T. Life prediction and damage analysis of creep-fatigue combined with high-low cycle loading by using a crystal plasticity-based approach. Int. J. Fatigue 2022, 164, 107154. [Google Scholar] [CrossRef]
- Zhang, S.D.; Takahashi, Y. Creep-fatigue life and damage evaluation under various strain waveforms for Ni-based Alloy 740H. Int. J. Fatigue 2023, 76, 107833. [Google Scholar] [CrossRef]
- Kanda, Y.; Kariya, Y. Influence of asymmetrical waveform on low-cycle fatigue life of micro solder joint. J. Electron. Mater. 2010, 39, 238–245. [Google Scholar] [CrossRef]
- Kawai, M.; Ishizuka, Y. Fatigue life of woven fabric carbon/epoxy laminates under alternating ratio loading along non-proportional path in the σm–σa plane. Int. J. Fatigue 2018, 112, 36–51. [Google Scholar] [CrossRef]


Disclaimer/Publisher’s Note: The statements, opinions and data contained in all publications are solely those of the individual author(s) and contributor(s) and not of MDPI and/or the editor(s). MDPI and/or the editor(s) disclaim responsibility for any injury to people or property resulting from any ideas, methods, instructions or products referred to in the content. |
© 2024 by the authors. Licensee MDPI, Basel, Switzerland. This article is an open access article distributed under the terms and conditions of the Creative Commons Attribution (CC BY) license (https://creativecommons.org/licenses/by/4.0/).