Article

The Microstructure and Magnetic Properties of a Soft Magnetic Fe-12Al Alloy Additively Manufactured via Laser Powder Bed Fusion (L-PBF)

1
Materials Research Institute, Aalen University, 73430 Aalen, Germany
2
Vacuumschmelze GmbH & Co. KG, 63450 Hanau, Germany
*
Author to whom correspondence should be addressed.
Metals 2024, 14(1), 117; https://doi.org/10.3390/met14010117
Submission received: 7 December 2023 / Revised: 10 January 2024 / Accepted: 15 January 2024 / Published: 18 January 2024

Abstract

:
Soft magnetic Fe-Al alloys have been a subject of research in the past. However, they never saw the same reception in technical applications as the Fe-Si or Fe-Ni alloys, which is, to some extent, due to a low ductility level and difficulties in manufacturing. Additive manufacturing (AM) technology could be a way to avoid issues in conventional manufacturing and produce soft magnetic components from these alloys, as has already been shown with similarly brittle Fe-Si alloys. While AM has already been applied to certain Fe-Al alloys, no magnetic properties of AM Fe-Al alloys have been reported in the literature so far. Therefore, in this work, a Fe-12Al alloy was additively manufactured through laser powder bed fusion (L-PBF) and characterized regarding its microstructure and magnetic properties. A comparison was made with the materials produced by casting and rolling, prepared from melts with an identical chemical composition. In order to improve the magnetic properties, a heat treatment at a higher temperature (1300 °C) than typically applied for conventionally manufactured materials (850–1150 °C) is proposed for the AM material. The specially heat-treated AM material reached values (HC: 11.3 A/m; µmax: 13.1 × 10³) that were close to the heat-treated cast material (HC: 12.4 A/m; µmax: 20.3 × 10³). While the DC magnetic values of hot- and cold-rolled materials (HC: 3.2 to 4.1 A/m; µmax: 36.6 to 40.4 × 10³) were not met, the AM material actually showed fewer losses than the rolled material under AC conditions. One explanation for this effect can be domain refinement effects. This study shows that it is possible to additively manufacture Fe-Al alloys with good soft magnetic behavior. With optimized manufacturing and post-processing, further improvements of the magnetic properties of AM L-PBF Fe-12Al may still be possible.

1. Introduction

In times of climate change and energy crises, a more efficient usage of energy becomes increasingly important. To achieve higher efficiency in electric devices or machines, it is necessary to select suitable hard and soft magnetic materials. An alternative may be the iron–aluminum alloys consisting of mostly abundantly available, generally considered non-toxic elements and providing their own unique set of material properties.
In the past, the Fe-Al alloying system has already been subjected to intensive research regarding its soft magnetic properties. However, while being discovered at around the same time as the iron–silicon alloys, the iron–aluminum alloys never saw a similar reception in technical applications. This might have been due to the higher price of Al compared to Si in the early times after its discovery, a more difficult processing of the melt, or the affinity of Al to form oxides. While it was sometimes predicted that with more modern fabrication technology a production of these alloys might eventually become feasible [1,2], this has not been the case as of yet.
Ferromagnetic Fe-Al alloys are found at the iron-rich side up to about 17 wt% Al [3]. In this type of alloy, also known as iron aluminides, three phases can occur: 1. bcc α-Fe (A2) solid solution; 2. bcc B2-ordered phase FeAl; and 3. bcc D03-ordered phase Fe3Al [4]. Their magnetostriction is relatively large (λ100: 74–82; λ111: 7–25 [5]) at 12 wt% and approaches zero at around 16 wt% [5,6,7]. The resulting low magnetoelastic anisotropy in combination with a low K1 value leads to high initial and maximum permeability levels as well as low coercivity of the Fe-16Al alloy (e.g., Vacodur 16 (16 wt% Al): µi: 8 × 10³; µmax: 40 × 103; and HC: 4 A/m [3]). Also, regarding the Fe-12Al alloy, exceptionally soft magnetic properties (e.g., hypermal (12 wt% Al): µi: 4 × 10³; µmax: 30 × 103; and HC: 8 A/m [3]) have been reported. One key benefit of Fe-Al alloys is a high specific electrical resistivity (up to 167 µΩcm for 17 wt% Al [3]), which can make them beneficial for AC applications. The specific electrical resistivity, ρ, rises with increasing Al content and is affected by ordering reactions in the vicinity of the intermetallic Fe3Al phase (~13.9 wt% Al) [2]. For 12 wt%, ρ ranges from 100 to 115 µΩcm, with the higher values being reached after fast cooling or quenching [3]. This is more than twice as high as that of commercial Fe-Si electric sheet materials (~40 µΩcm [8]) and higher than Fe-6.5Si (82 µΩcm [2]). However, the high magnetostriction makes the 12 wt% alloy rather unsuitable for AC applications. Another downside is that the saturation magnetization, BS, also decreases with increasing Al content, which results in values of 0.9 T for Fe-16Al and 1.4 T for the 12 wt% alloy [3]. Also, similar to the Fe-Si alloys, the ductility of the Fe-Al alloys is affected negatively by an increasing Al content. However, Fe-Al alloys, in general, are more ductile than their Fe-Si counterparts [5]. The production of sheet materials through hot and cold rolling is, therefore, possible, but it is difficult and not very economical due to their possible crack formation. Since with additive manufacturing (AM), e.g., laser powder bed fusion (L-PBF), parts ideally can be created without deformation or machining, a production route via additive manufacturing seems to be promising to produce parts from these still rather brittle alloys.
There have already been several studies regarding the additive manufacturing of Fe-Al (and Fe-Al-Ti) alloys through laser powder-bed fusion (L-PBF) [9,10,11,12,13,14] and direct energy deposition (DED) processes like LENS [15,16] or 3D laser cladding [17]. However, these studies focused on applications such as (high temperature) structural materials, and no magnetic properties have been reported in these works. For an Fe-Al alloy with approx. 16 wt% prepared through L-PBF, crack formation has been reported, and the application of a build platform heating (BPH) temperature of >200 °C was found to be necessary [13]. Goll et al. [18,19] used an Fe-16Al alloy in combination with bulk Fe-6.7Si to produce multi-material L-PBF parts with reduced eddy current losses. However, no magnetic properties of bulk AM Fe-Al alloys were reported in these works.
The aim of this work was to synthesize Fe-Al alloys through L-PBF and measure their magnetic properties to determine their suitability for producing soft magnetic components from them. This was carried out on the example of an alloy with 12 wt% Al. The alloy with 12 wt% was chosen instead of the 16 wt% alloy because of its higher BS and better ductility, possibly allowing for its processing without a BPH system. Fe-12Al melts were prepared at Vacuumschmelze GmbH & Co. KG, Hanau, Germany, and served as the basis for all the materials examined here. Samples of the same alloy were also produced by casting and a combination of hot and cold rolling. These materials were heat treated and their microstructure was investigated, with a focus on the AM material. The magnetic properties of AM Fe-12Al were compared to those of the cast material and rolled specimens.

2. Materials and Methods

The samples in this study were produced by casting, rolling, and the L-PBF process. An overview of the processing steps for toroid sample production through each type of production method is shown in Figure 1.
The investigated toroid samples (C1, R1, R2, AM1, AM2, AM3, and AM4) for magnetic testing and their respective processing routes are listed in Table 1.
The production processes and methods for characterization are described in further detail in the following subsections.

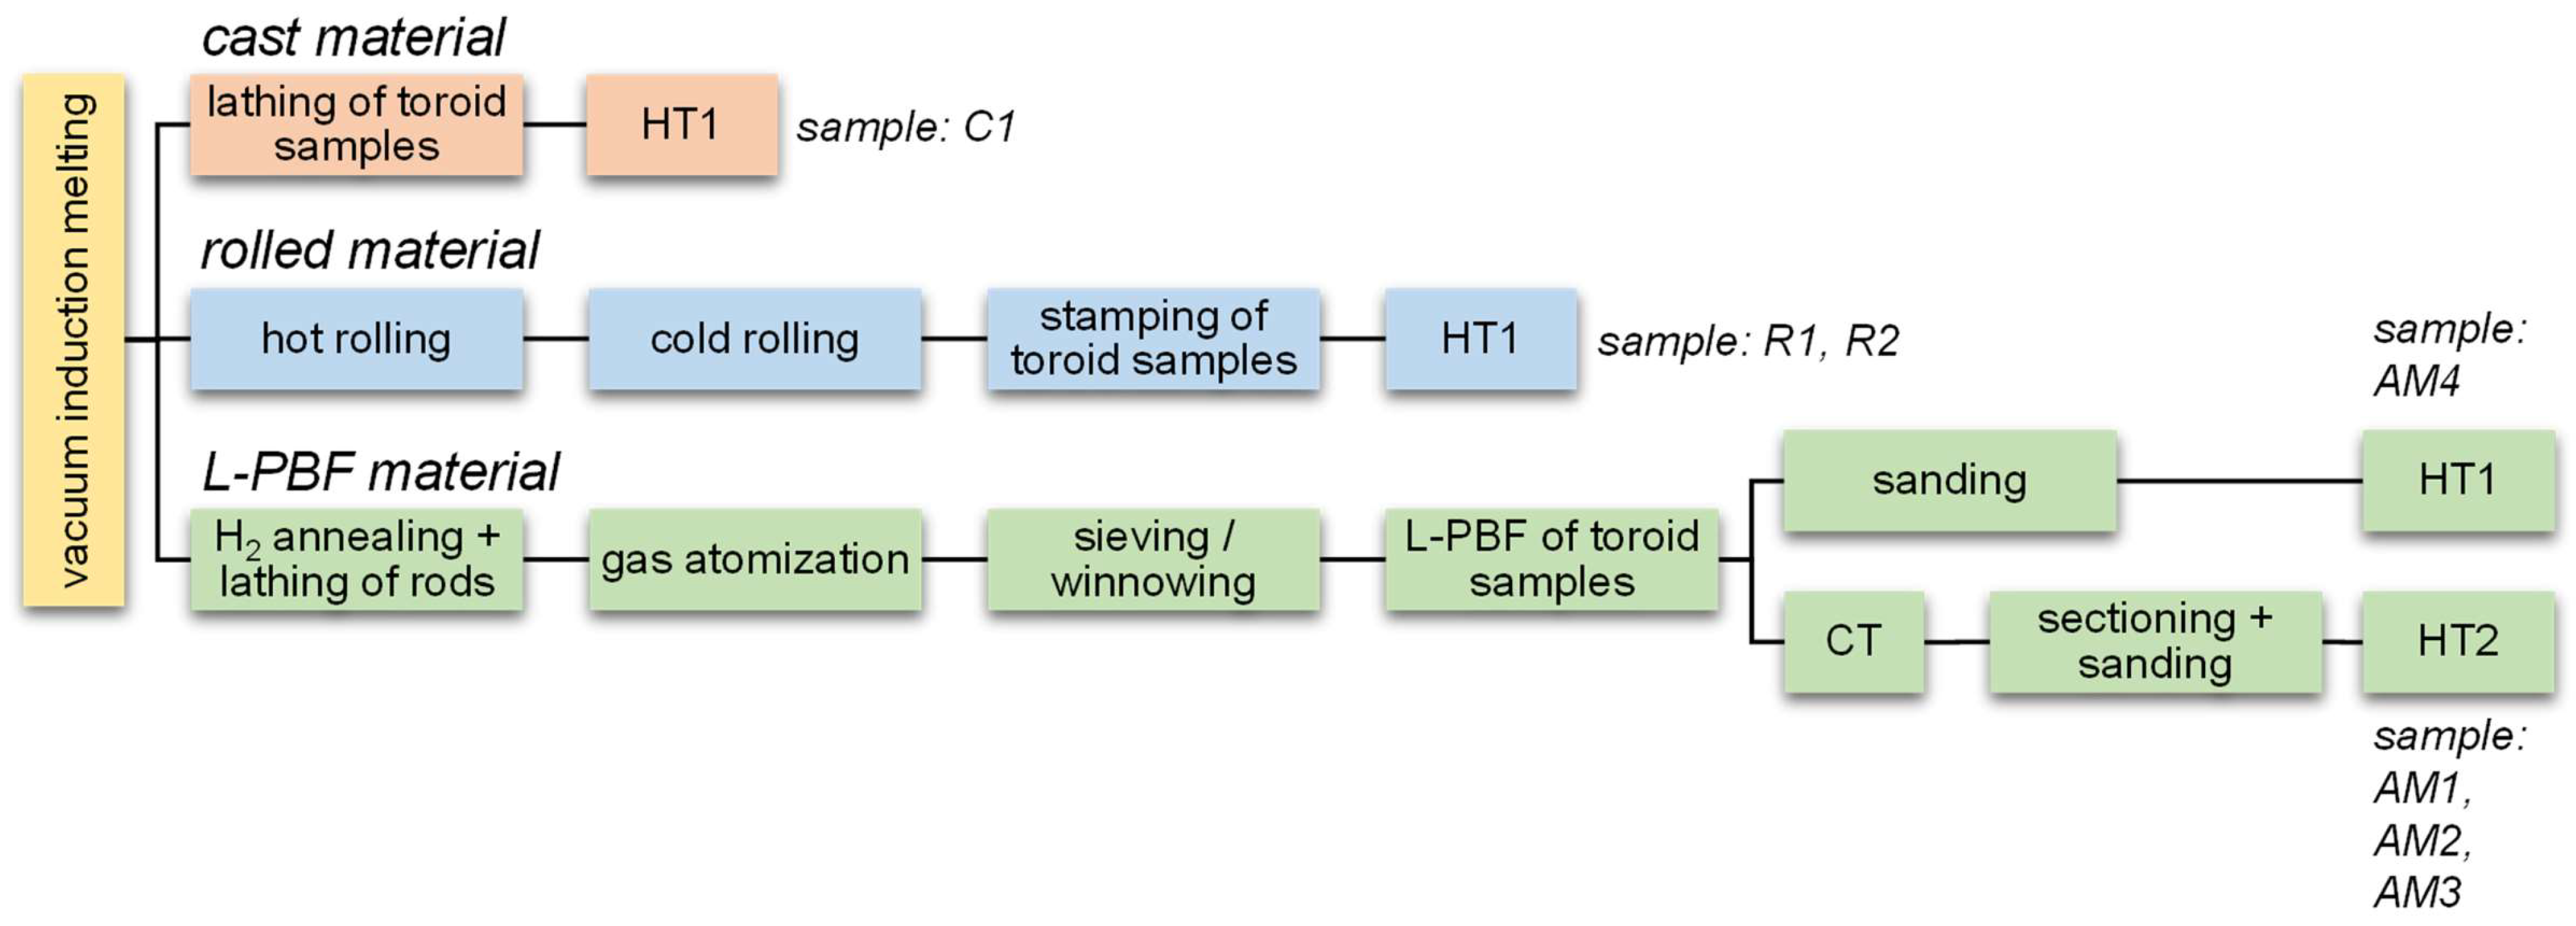
2.1. Melting and Reference Materials

The Fe-12Al alloy used in this study was cast by Vacuumschmelze GmbH & Co. KG through vacuum induction melting in experimental small-scale melts. The target composition of the Fe-12Al alloy was 12 wt% Al with additions of 0.2 wt% Mn and 0.1 wt% Nb. Toroidal samples with ø 28.5 × 20.0 mm were stamped from hot- and cold-rolled strips with a thickness of both t = 1 mm and t = 2 mm. Cast material rings were lathed with the same diameters from round ingots.

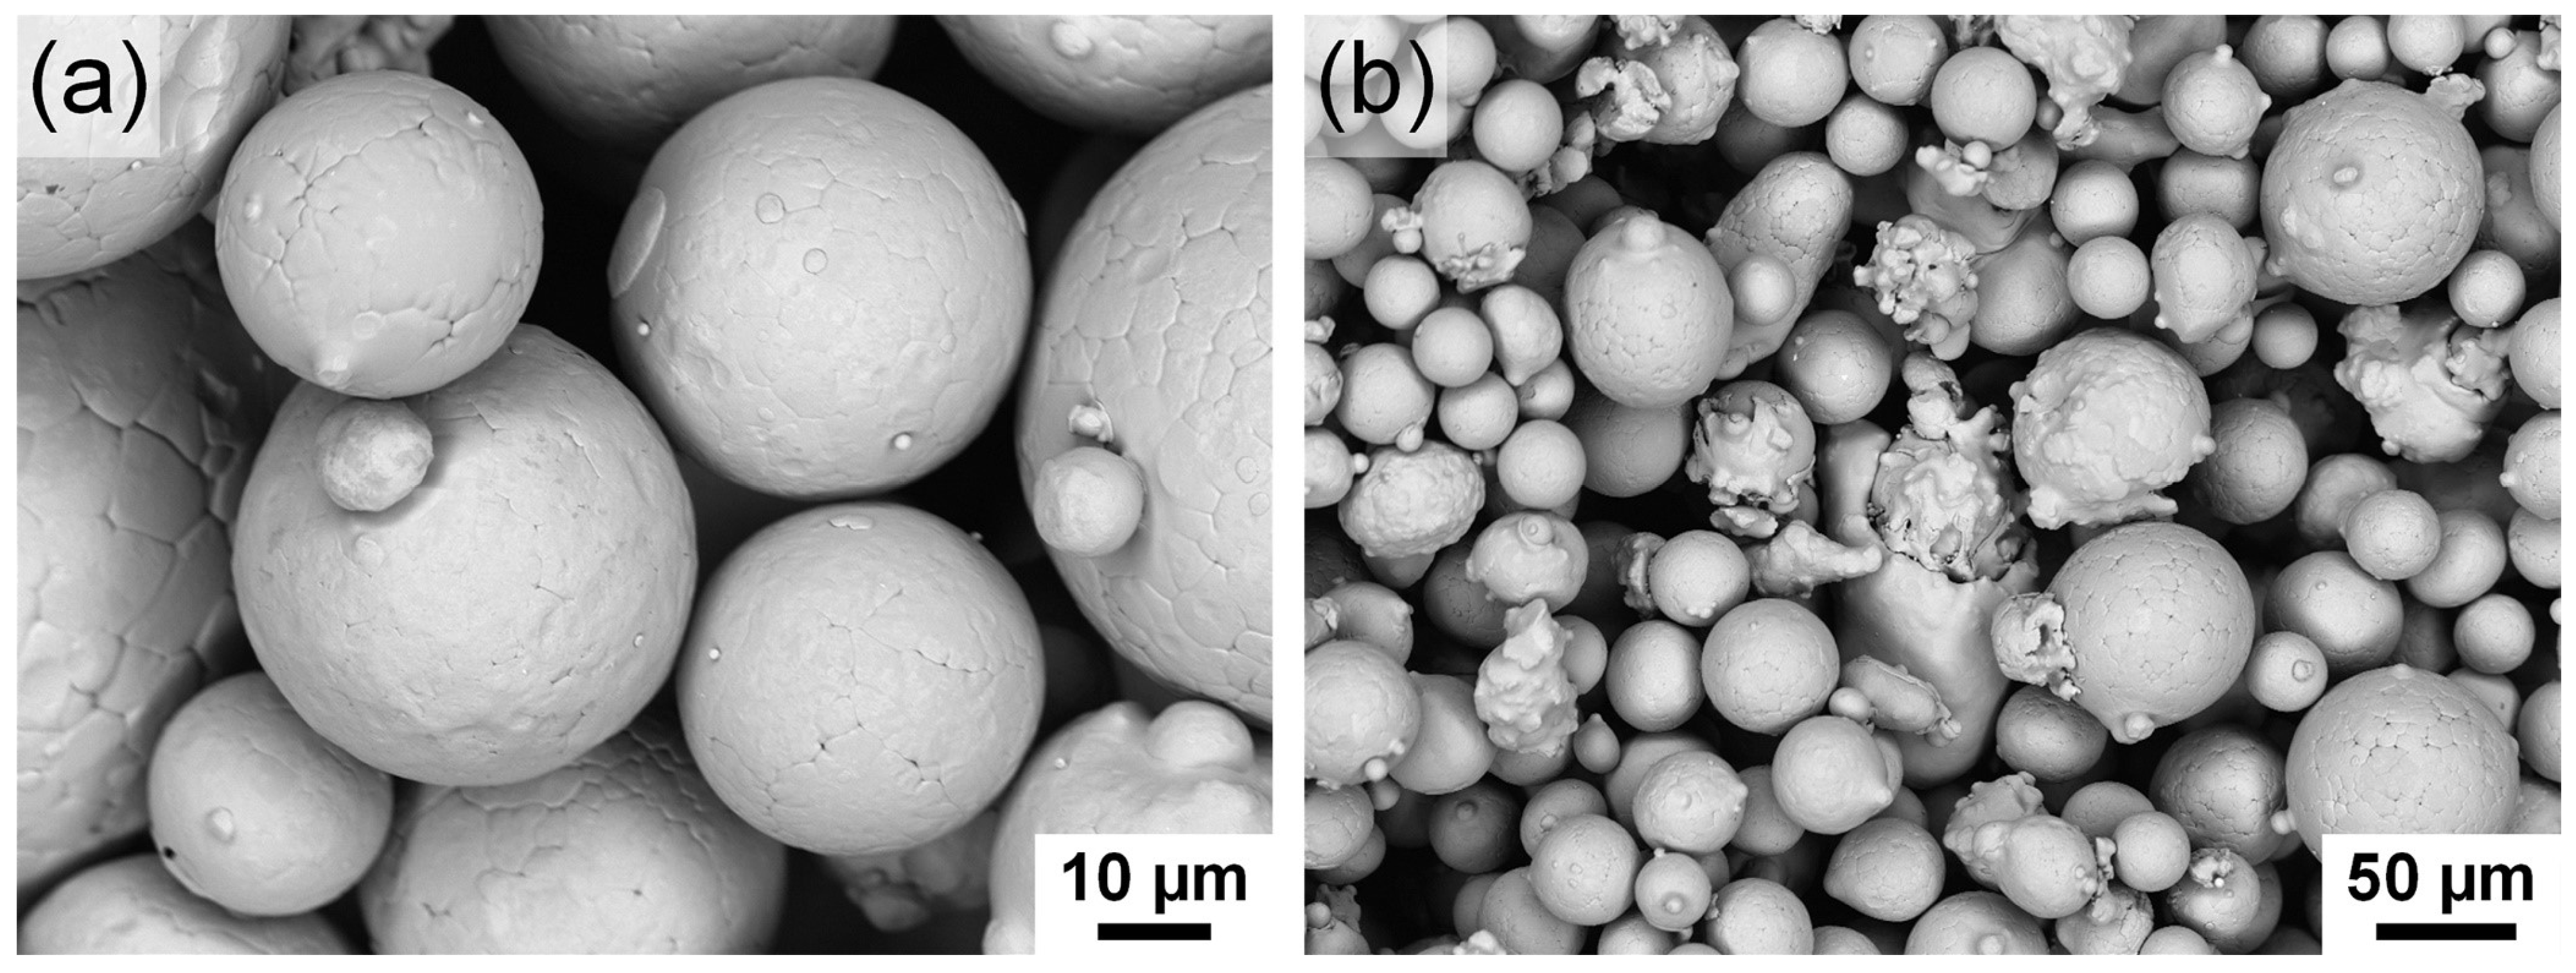
2.2. Powder Production

For powder production, three round ingots were first exposed to hydrogen annealing to reduce the oxygen and impurity contents. Subsequently, they were lathed into rods with a diameter of 50 mm, a length of 300 mm, and a point angle of 90°. The gas atomization procedure of the rods was carried out in a crucible-free process using argon as an atomizing media. The particle size range was specified as +25/−75 µm, which resulted in a flowable powder and a production yield of about 40%.

2.3. Additive Manufacturing
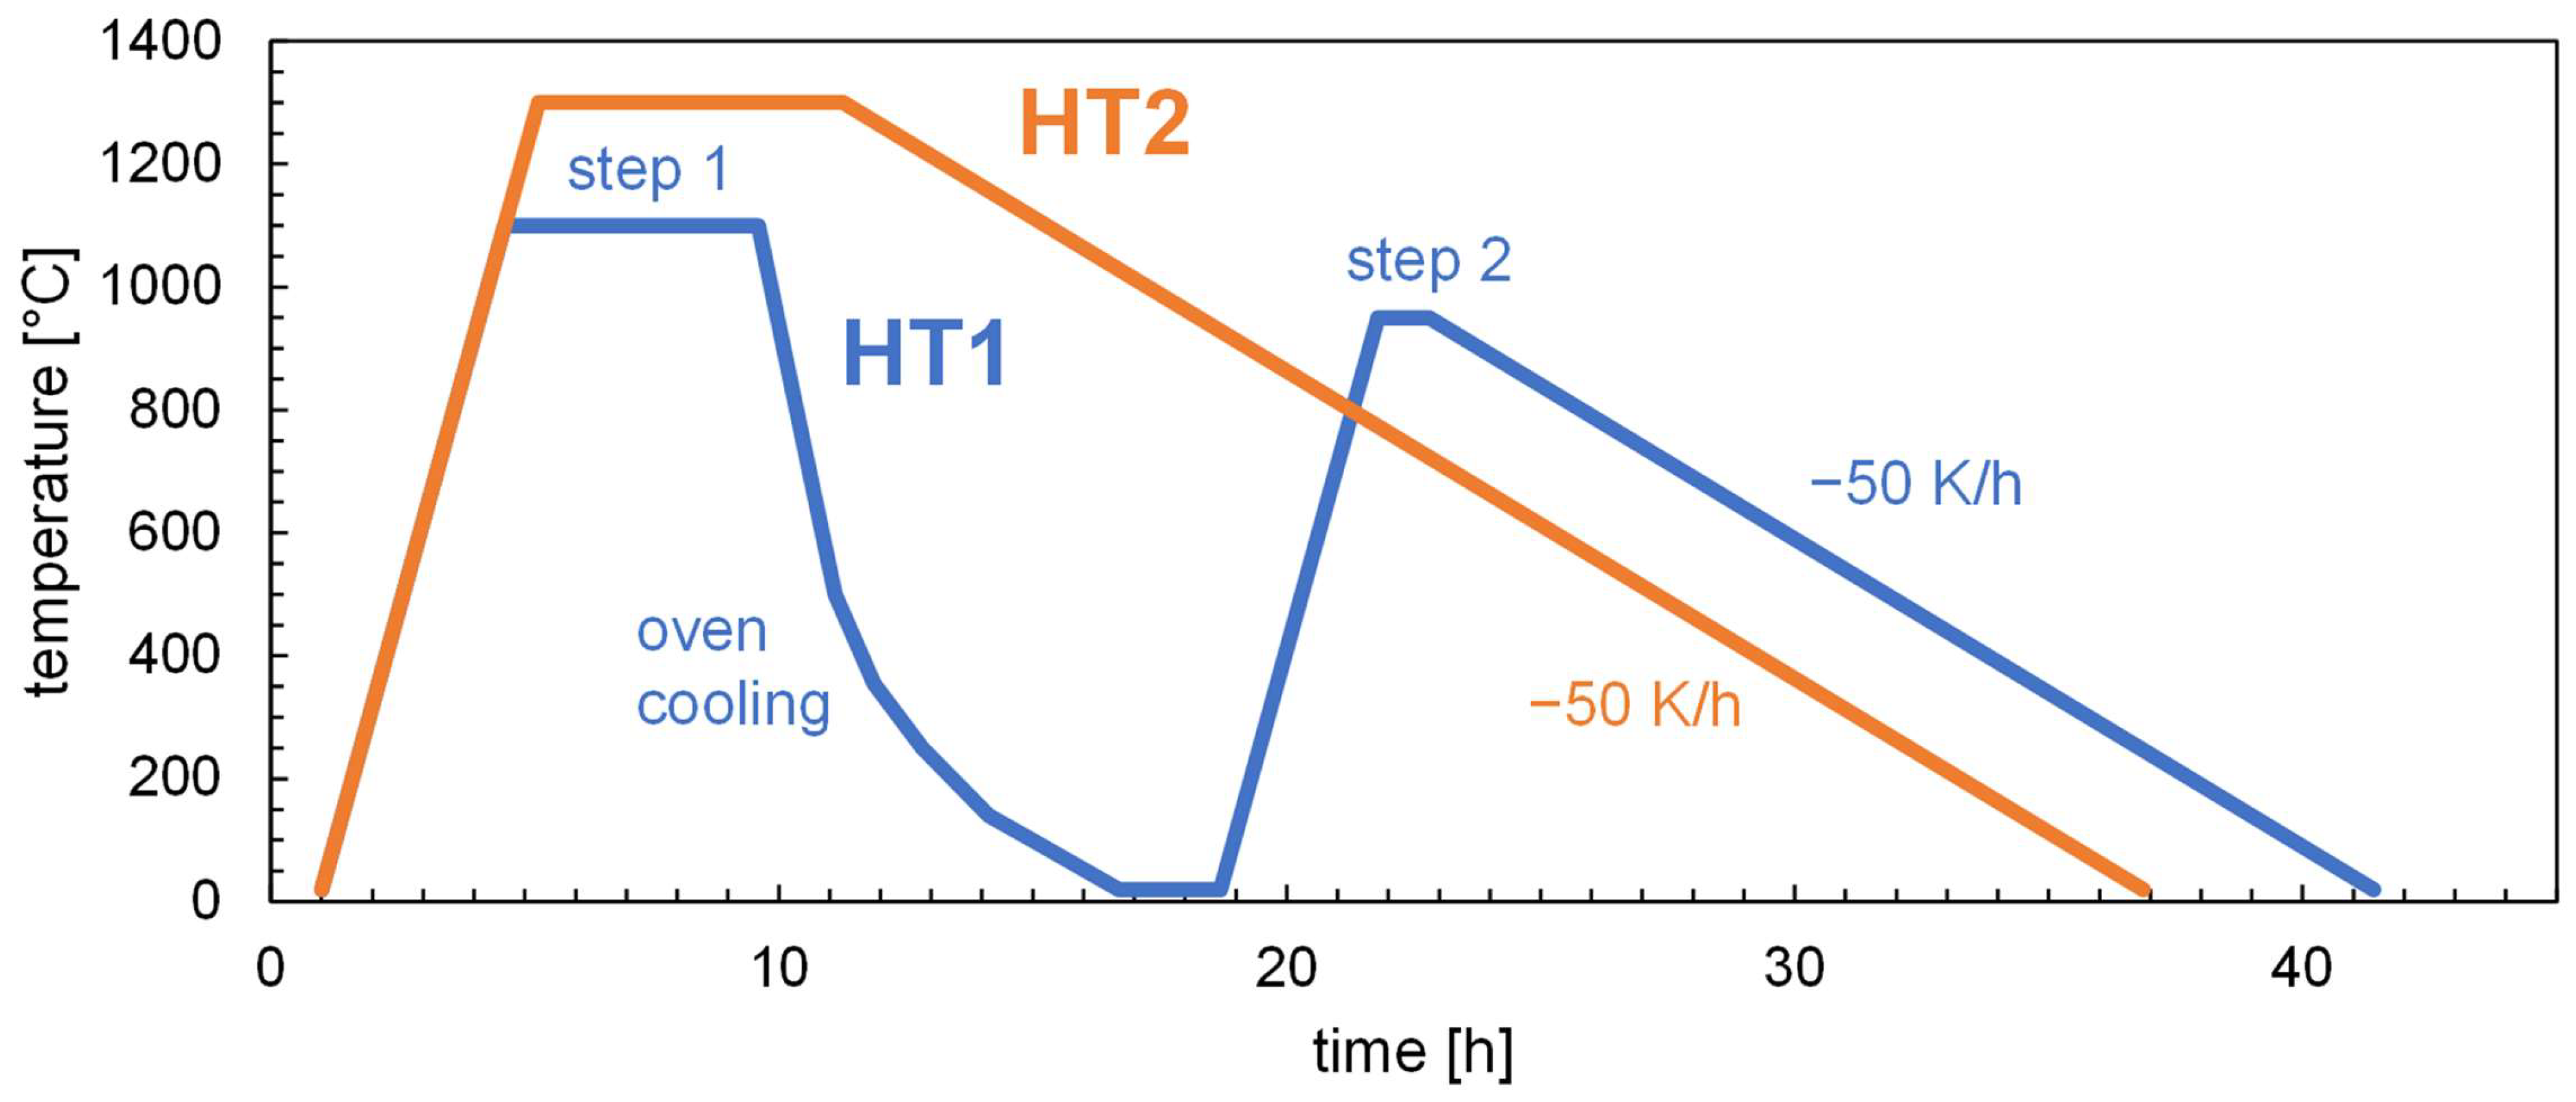
Additive manufacturing was carried out on a Trumpf TruPrint 1000 multi-laser L-PBF machine (Trumpf, Ditzingen, Germany) with twin 200 W fiber lasers (λ = 1.070 nm; max. 175 W usable laser power) using an Ar atmosphere. A chessboard scanning strategy based on the 316L steel recipe provided by Trumpf was used with a hatch distance h of 90 µm and a layer thickness d of 20 µm. The build process was carried out on an unheated build platform. Cuboid samples with dimensions of 10 × 10 × 5 mm3 were produced for the density and metallographic analyses. Toroidal ring samples with ø 28.5 × 20.0 × 5 mm3 were printed for magnetic characterization. To determine the suitable laser parameters, 25 cuboid samples were manufactured with varying laser parameters (laser powers, PL: 100, 120, 140, 160, and 175 W; scanning speeds, vS: 300, 400, 500, 600, and 700 mm/s) and analyzed regarding their density. The parameter set of PL = 160 W and vs = 500 mm/s was selected for the production of the AM ring samples in this study.

2.4. Heat Treatment

The heat treatment of the cast and rolled materials was carried out using a dry hydrogen atmosphere. The AM samples were heat-treated under argon with an addition of 5% hydrogen. Two different heat treatments (Figure 2) were applied to the samples: (1) a two-step heat treatment derived from the reference materials (HT1) consisting of 4 h at 1100 °C, with cooling in the oven and 1 h at 950 °C, with slow cooling in the oven at −50 K/h until reaching room temperature; (2) an adjusted heat treatment (HT2) for the AM samples consisting of 6 h at 1300 °C with slow cooling in the oven at −50 K/h until reaching room temperature.

2.5. Characterization

Scanning electron microscopy (SEM) was conducted on a Zeiss SIGMA 300 VP (Carl Zeiss, Oberkochen, Germany) using a backscattered electron detector at 5.00 kV for the investigations of powder morphology and 25 kV for the imaging of the embedded L-PBF specimens. For chemical analysis, energy-dispersive X-ray spectroscopy (EDS) measurements were carried out. An EDAX Octane Plus detector (EDAX, Mahwah, NJ, USA) with an accelerator voltage of 25 kV was used to determine the chemical composition. Additional EDS measurements to detect the light elements in the precipitates were carried out using a Zeiss Crossbeam 540 (Carl Zeiss, Oberkochen, Germany) equipped with an Oxford Instruments Ultim Extreme detector at 1.50 kV. Optical microscopy (OM) was carried out using a Zeiss Imager.Z2 Vario (Carl Zeiss, Oberkochen, Germany) in the brightfield (BF) mode. Overview images were acquired using tile imaging. Grain size analysis was conducted using Zeiss ZEN Core based on DIN ISO 643 using the intercept method with a combined pattern (circles and lines). For difference Kerr microscopy, a Zeiss Axio Imager Vario equipped with an electromagnet (flux density up to 1300 mT) and an illumination device from Evico magnetics GmbH was used [20]. The particle size distribution was determined using a Microtrac S3500 laser diffraction analyzer (Microtrac Inc., Montgomeryville, PA, USA). The powder flow rate and apparent density were determined using a flowmeter funnel with Carney geometry and an opening 5-mm diameter. The density of the AM samples was determined using the Archimedes method using a Shimadzu AUW220D precision scale and ethanol as the immersion media. Magnetic measurements were performed on the toroidal ring samples using a Brockhaus MPG 200 D measuring system. DC measurements were performed at a maximum field strength of 10 kA/m (AM material) and 16 kA/m (cast and rolled material). For AC measurements of the AM material, a range of frequencies from 30 to 200 Hz at polarizations from 0.1 to 1.0 T was applied. XRD measurements were carried out on the embedded and polished L-PBF specimens using a GE “Seifert Analytic XRD Sun” X-ray diffractometer equipped with a Co-tube (50 kV, 35 mA, and 1.78896 Å) in the range 2θ = [20°, 130°] at a step width of 0.013° and a step time of t = 500 s. A Phoenix v-tome-x s 240 D µ-CT system was used to reveal cracked, defective sections within the L-PBF ring samples. Crack-free ring sections were isolated using a Struers Secotom-10 precision cutting machine and sanded down with sanding paper (#500 SiC) to the desired thickness with a tolerance of about ±0.1 mm to serve for magnetic measurements. Specific electrical resistivities were determined using the 4-wire measuring method on cold-rolled strips of 0.55 mm thickness and bars with a rectangular cross-section (AM and cast materials).

3. Results

3.1. Atomized Powder

SEM images of the powder (+25/−75 µm) in Figure 3 show that the particles are mostly spherical in their morphology (Figure 3a). However, some particles with an irregular shape, having satellites and other attachments of material, can be found as well (Figure 3b). A flow rate of 3.9 s/50 g and an apparent density of 3.4 g/cm3 were measured through Carney flow testing.
The measured particle size distribution (PSD) in Figure 4 reveals a median diameter of d50 = 46.9 µm.

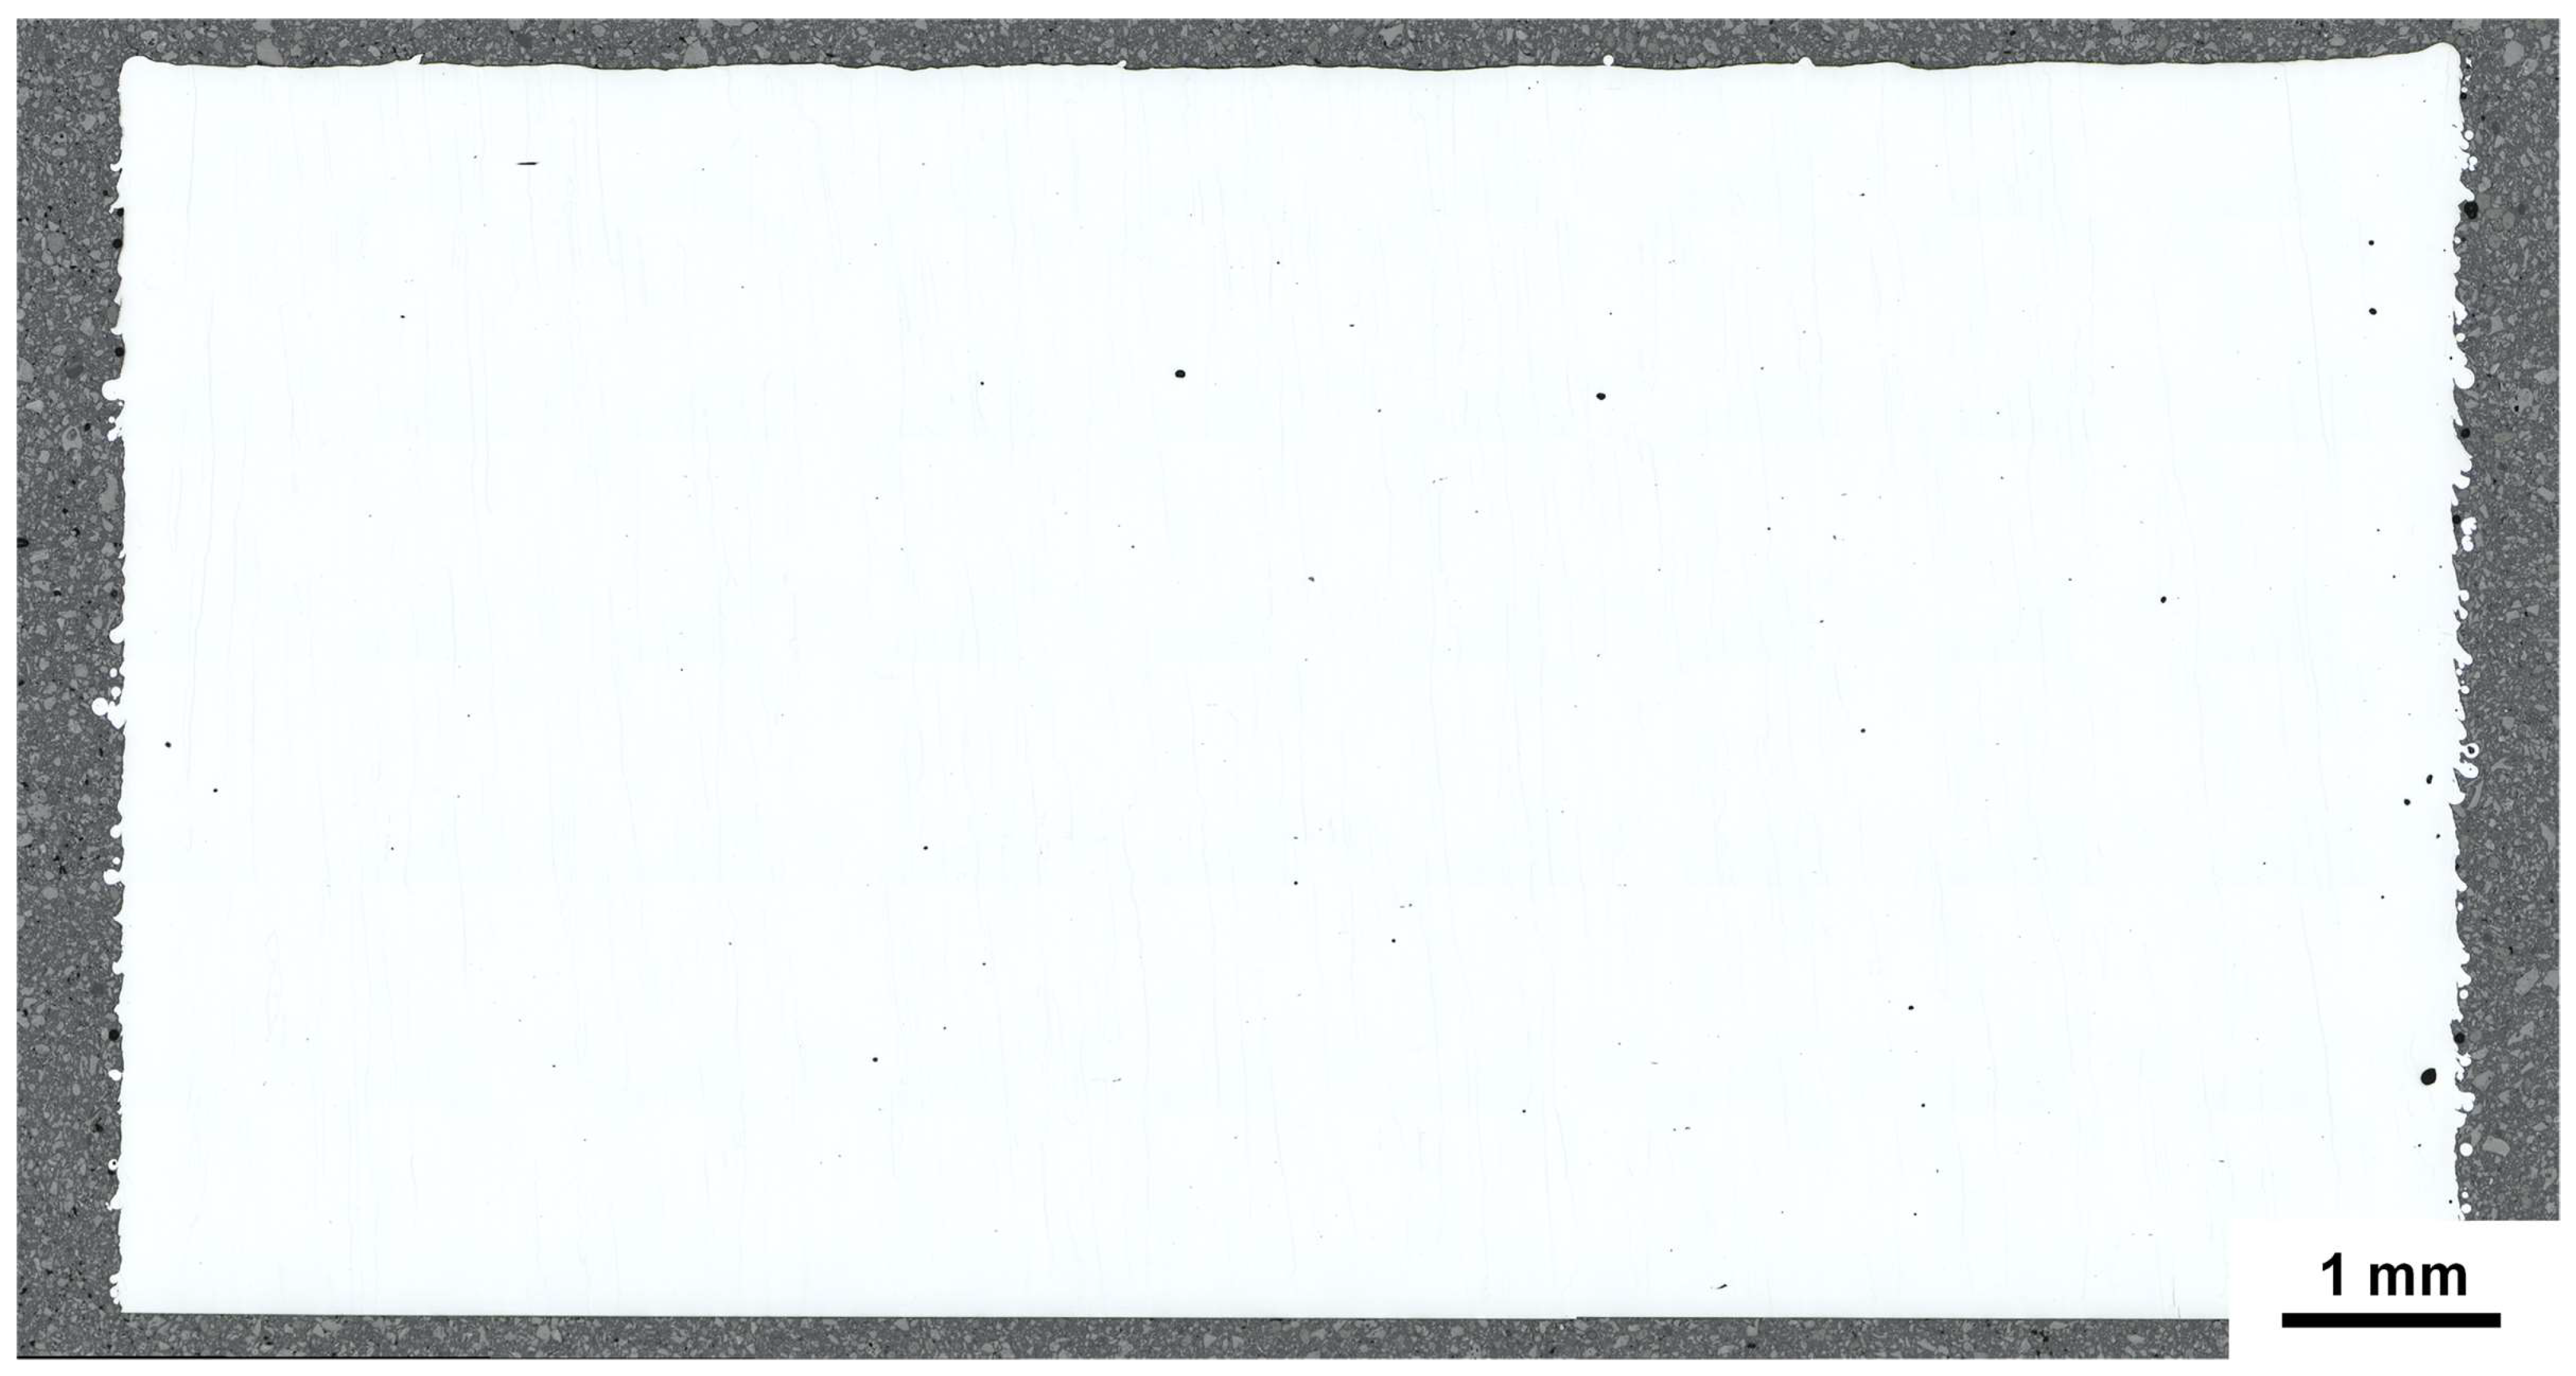
3.2. AM Laser Parameter Selection and Porosity

To avoid excessive porosity in the ring samples, a parameter study varying the laser power, PL and laser scanning speed, vs, was carried out with 10 × 10 × 5 mm3 cuboid samples. From the results of the Archimedes density measurements, a relative density based on the density of the rolled material (6.77 g/cm3) was calculated. The results of this study are displayed in Figure 5 as a function of laser power, PL, and scanning speed, vS.
It was found that a large processing window exists, in which the relative densities are above 99%. The highest density (6.73 g/cm3) was achieved with the parameter set with a PL of 175 W and a vs of 400 mm/s, which resulted in a 99.4% relative density. However, in order to achieve a higher build rate and to not run the AM machine at its maximum power, the parameter set of PL: 160 W and vS: 500 mm/s was selected for the ring samples, resulting in a 6.72 g/cm3 or 99.3% relative density.
A micrograph of the as-built state resulting from the above parameter combination in an unetched condition can be seen in Figure 6. The material did not show a significant level of porosity and was free of cracks.
The cast material in its final heat-treated state (6.77 g/cm3) showed a similar density as the rolled material. The AM ring samples in their as-built state reached (99.3 ± 0.1)% of the density of the rolled material. After the heat treatment, the relative density increased to about 99.6% with HT1 and, on average, (99.8 ± 0.1)% with HT2.

3.3. Crack Formation
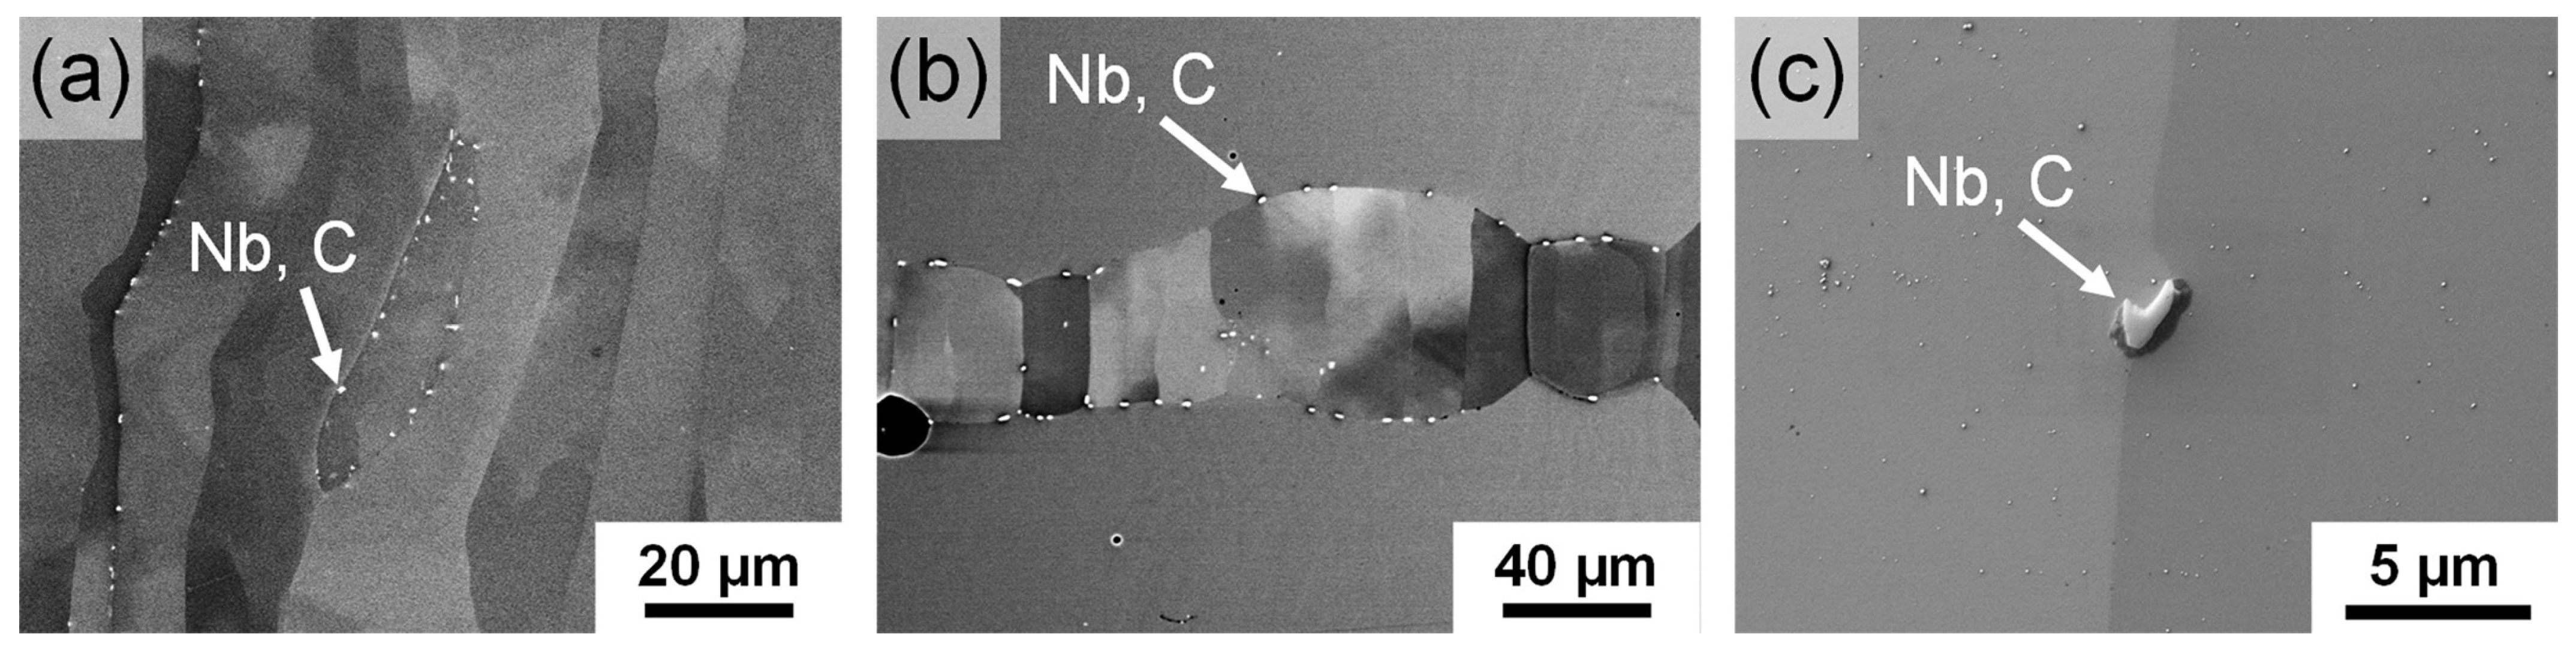
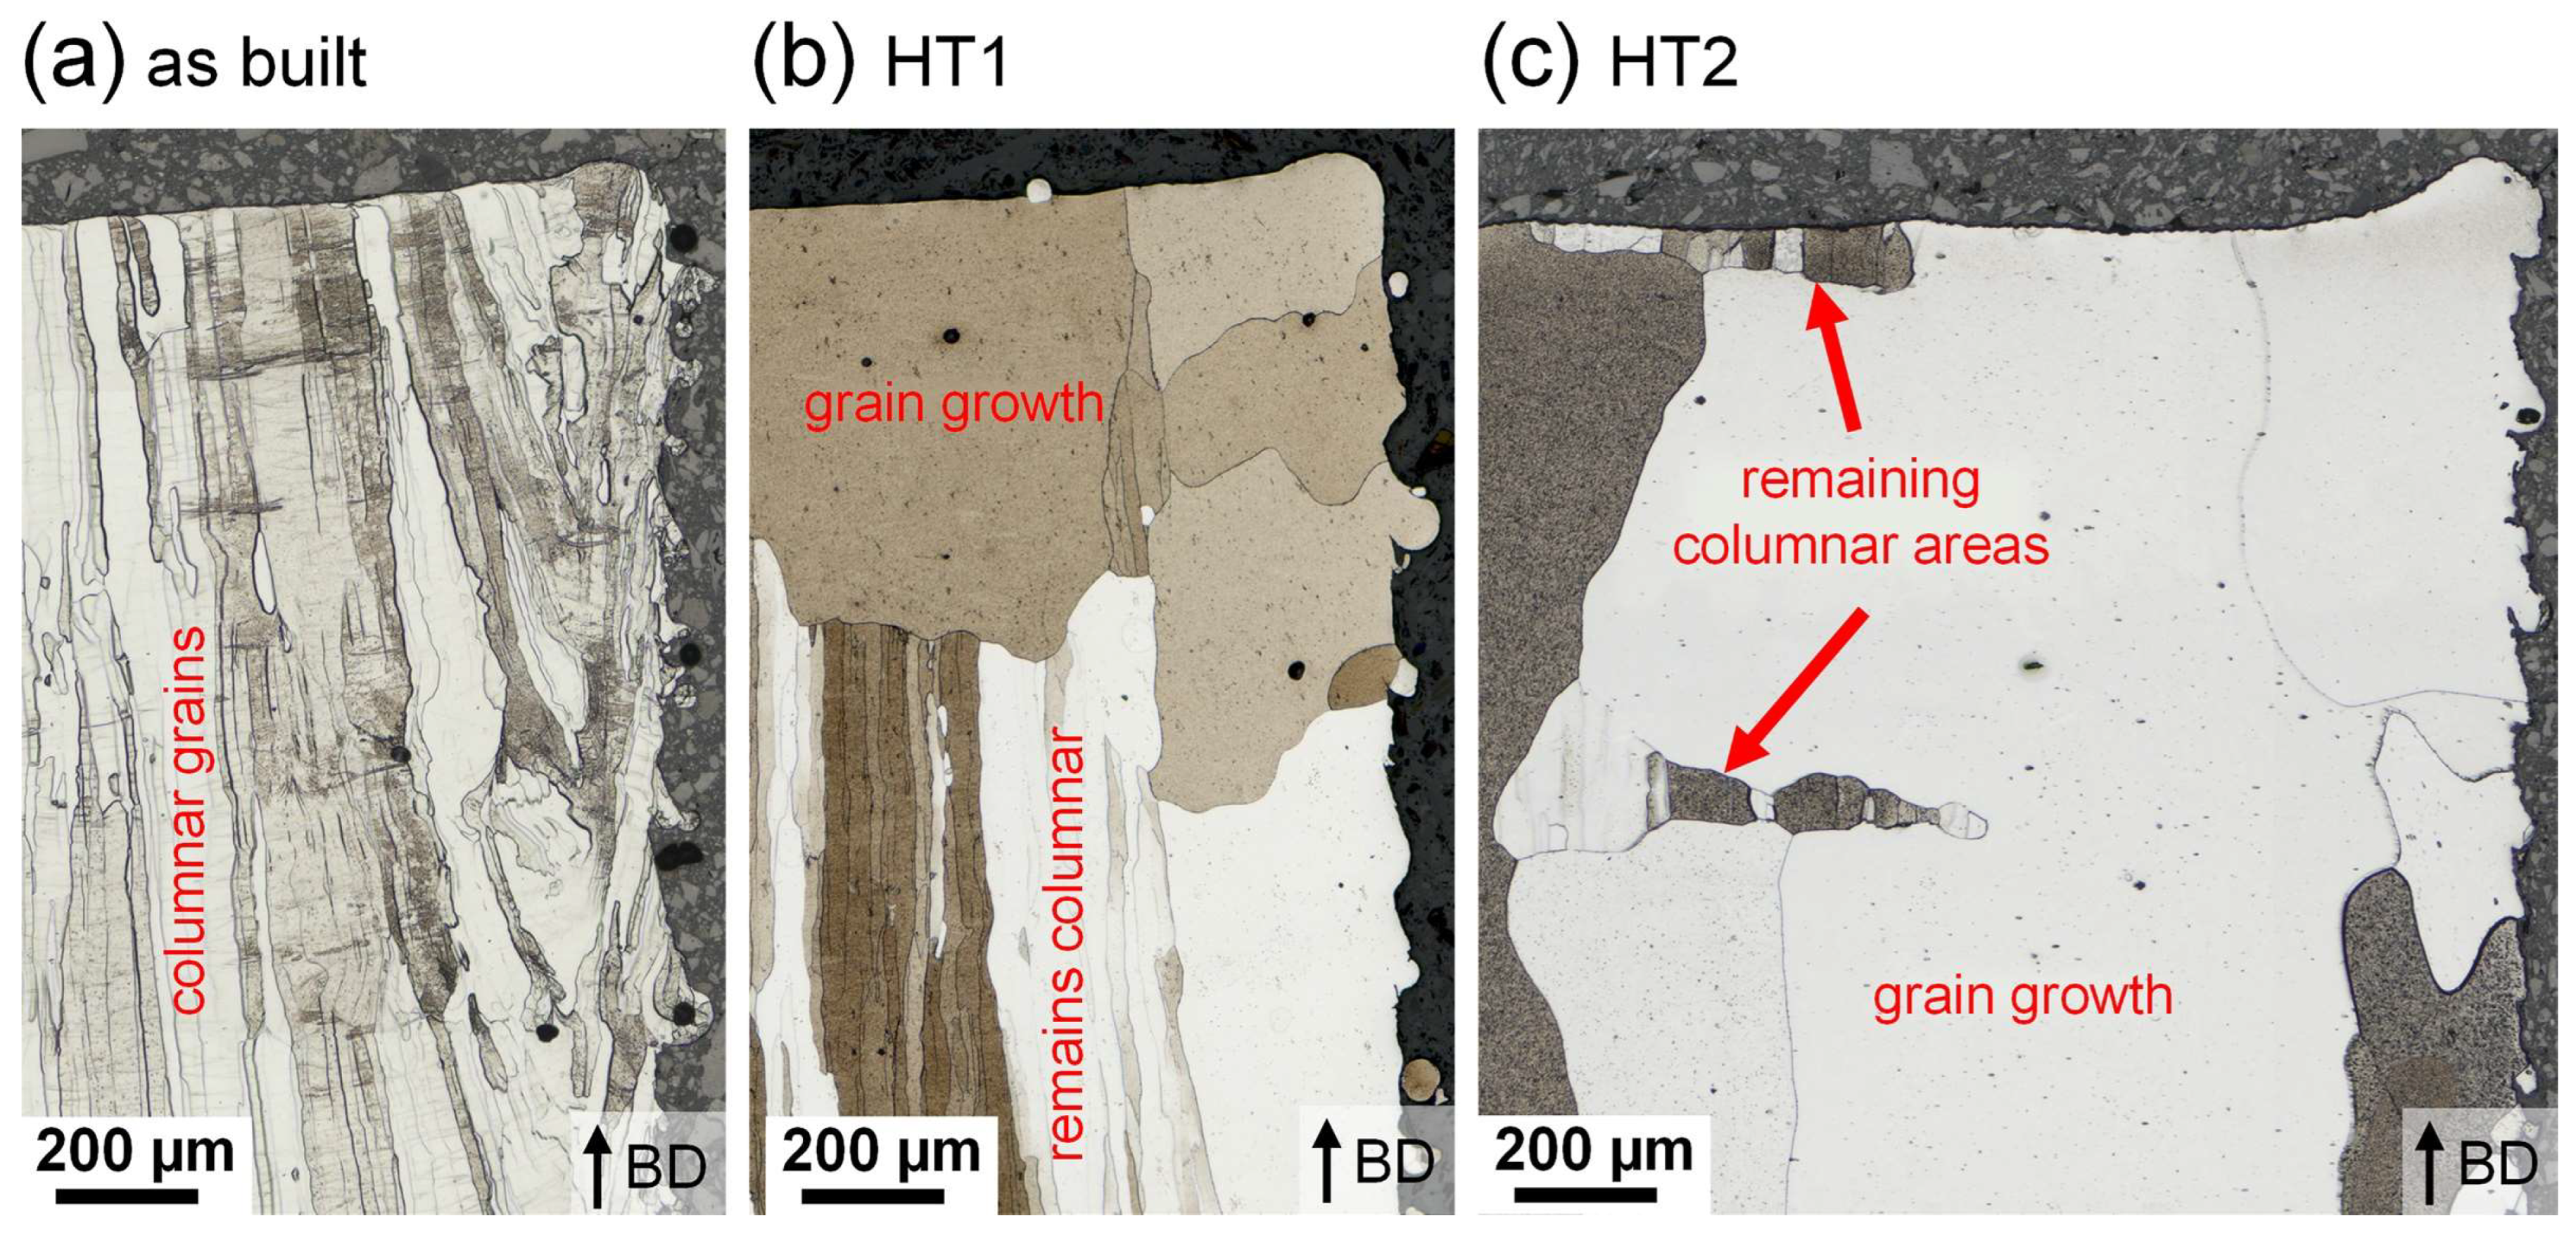
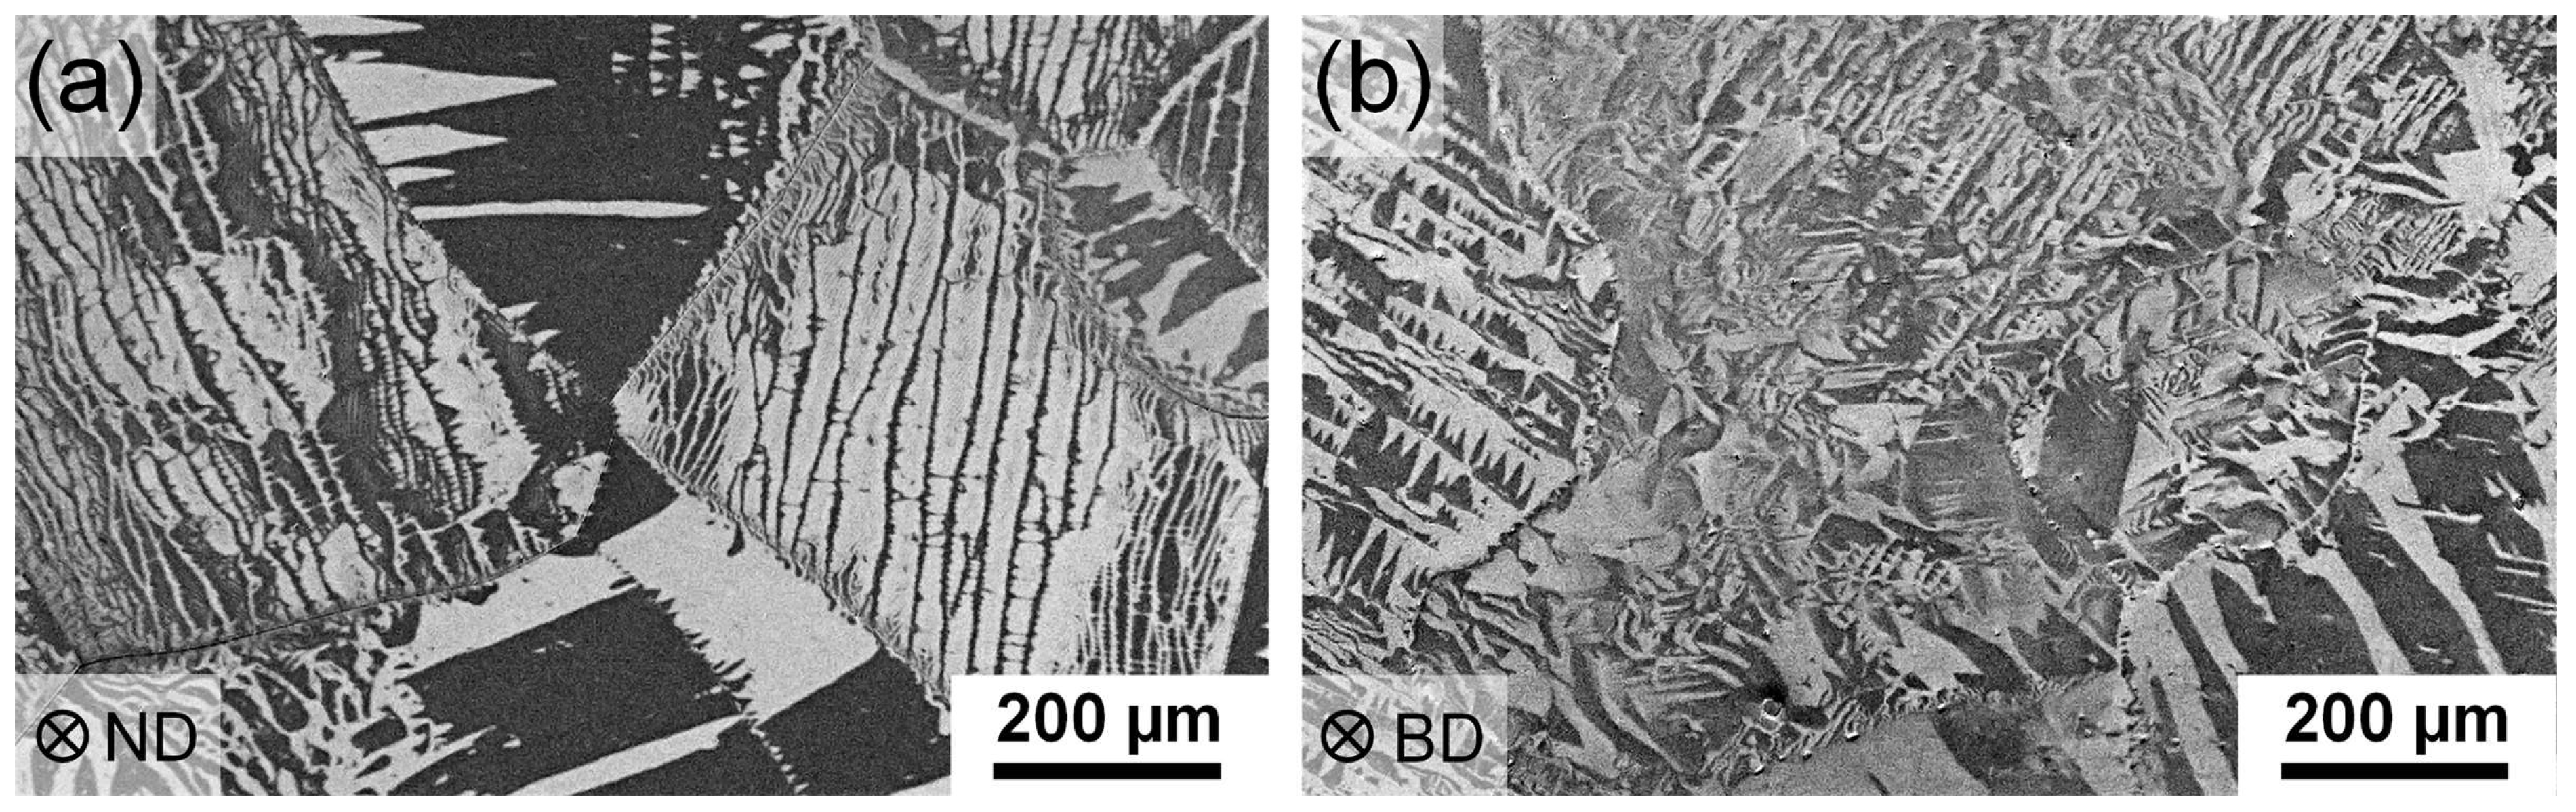
The Fe-12Al alloy exhibits some brittleness due to its high Al content. During subsequent cold rolling, transverse cracks were formed, and only a small amount of the strip was usable for magnetic characterization. A commercial application was therefore deemed not feasible, which also gave the initial idea to apply 3D-printing technology to this alloy. During the L-PBF building process, in this study, it was found that smaller parts, like the cuboid samples, were printable free of cracks without a BPH system. However, some crack formations were observed in the larger parts (e.g., toroidal samples). The observed cracks propagated in a transcrystalline manner and were typically oriented perpendicular to the build direction (BD) or, in some cases, parallel to it. A subsequent CT analysis of the first ring sample (AM4) used for HT1 revealed several cracks (Figure 7a). The ring sample material used for the adjusted heat treatment (HT2) was therefore checked via CT for cracks beforehand and was then sectioned, as described, in the experimental section to achieve crack-free ring sections (as shown in Figure 7b). This resulted in the samples AM1, AM2, and AM3.

3.4. Microstructure

The cast material ingot (Figure 8a), after hydrogen annealing prior to atomization, displays a very coarse microstructure (mean grain size: 1380 µm), with its grains elongated in the radial direction of the round ingot. The annealed rolled material displays an equiaxed grain structure with a relatively large mean grain size of 480 µm (Figure 8b).
The additively manufactured material in its as-built state (Figure 8c,d) displays a distinctive columnar grain structure with its grains elongated parallel to the BD and a mean grain size of 24 µm. However, individual columnar grains expand over several hundred µm along the BD.
After annealing the material with HT1 (see Section 2.4), some changes can be seen (Figure 8e–g). The grains in the region near the surface have grown and display a more equiaxed shape, similar to the rolled material. The region in the core of the sample retains its columnar structure, originating from the AM process, with a larger mean grain size of 33 µm (increase of 38%).
The application of a higher temperature as well as a longer holding time with HT2 resulted in grain growth over the whole cross-section of the sample (Figure 8h,i). The grown grains still have a square-like shape and are slightly elongated along the BD. The mean grain size is significantly increased (591 µm) compared to the as-built state. Some small areas, however, still have a similar grain structure as the as-built state and appear to not have experienced a significant level of grain growth. The extent of these areas is greater in the direction perpendicular to the BD than parallel to the BD. By excluding these areas, a mean grain size of 751 µm was measured.
The EDS analysis revealed, following the HT1 and HT2 treatments, that precipitates containing an increased Nb and C content were formed predominantly on the grain boundaries as well as, to some degree, within the grains (Figure 9a–c). The as-built state appeared to be free of these precipitates. Apart from the Nb carbide precipitations, no other secondary phases were observed. The EDS area scans showed that the chemical composition (comprising Fe, Al, and Mn) was not changed during both heat treatments compared to the as-built state (Table 2). Additional EDS measurements of a HT1 sample in the core and the region near the surface also showed no changes in the chemical composition. The differences between the Al and Mn contents to the target composition were deemed to be due to the nature of the measuring method.
The XRD patterns (Figure 10a) of L-PBF Fe-12Al indicate the formation of the ordered Fe3Al (D03) phase as the main phase under the as-built and heat-treated (HT1) conditions. Since the peaks of the ordered FeAl (B2) phase have a large overlap with Fe3Al (D03), the presence of a small amount of the B2 phase can neither be confirmed nor ruled out. The intensity distribution of the D03 peaks is different than expected due to a strong degree of texturing in the samples caused by the columnar grain structure formed parallel to the L-PBF build direction. This resulted in some peaks of Fe3Al (D03) only being visible either very faintly or not at all. A sharpening of the peaks can be seen with each step of the HT1 heat treatment (Figure 10b), which indicates lattice relaxation effects (e.g., healing of residual stresses or crystal defects). In the amplified view, peak splitting is visible due to the two K-alpha spectral lines (i.e., non-monochromatic radiation). The HT2 specimen was not able to be analyzed due to its very large grain size, resulting in insufficient statistics of its measurements.

3.5. Specific Electrical Resistivity

The specific electrical resistivity of the AM material in the as-built state was measured multiple times to be about 111 ± 1 µΩcm. After HT2, the resistivity decreased to 105 ± 1 µΩcm. A sample cut from the hydrogen-annealed cast material displayed a resistivity of 101 ± 1 µΩcm and did not change measurably following its subjection to HT2. The rolled material was measured on annealed strips (t = 0.55 mm, HT1) and exhibited a resistivity of 106 µΩcm.

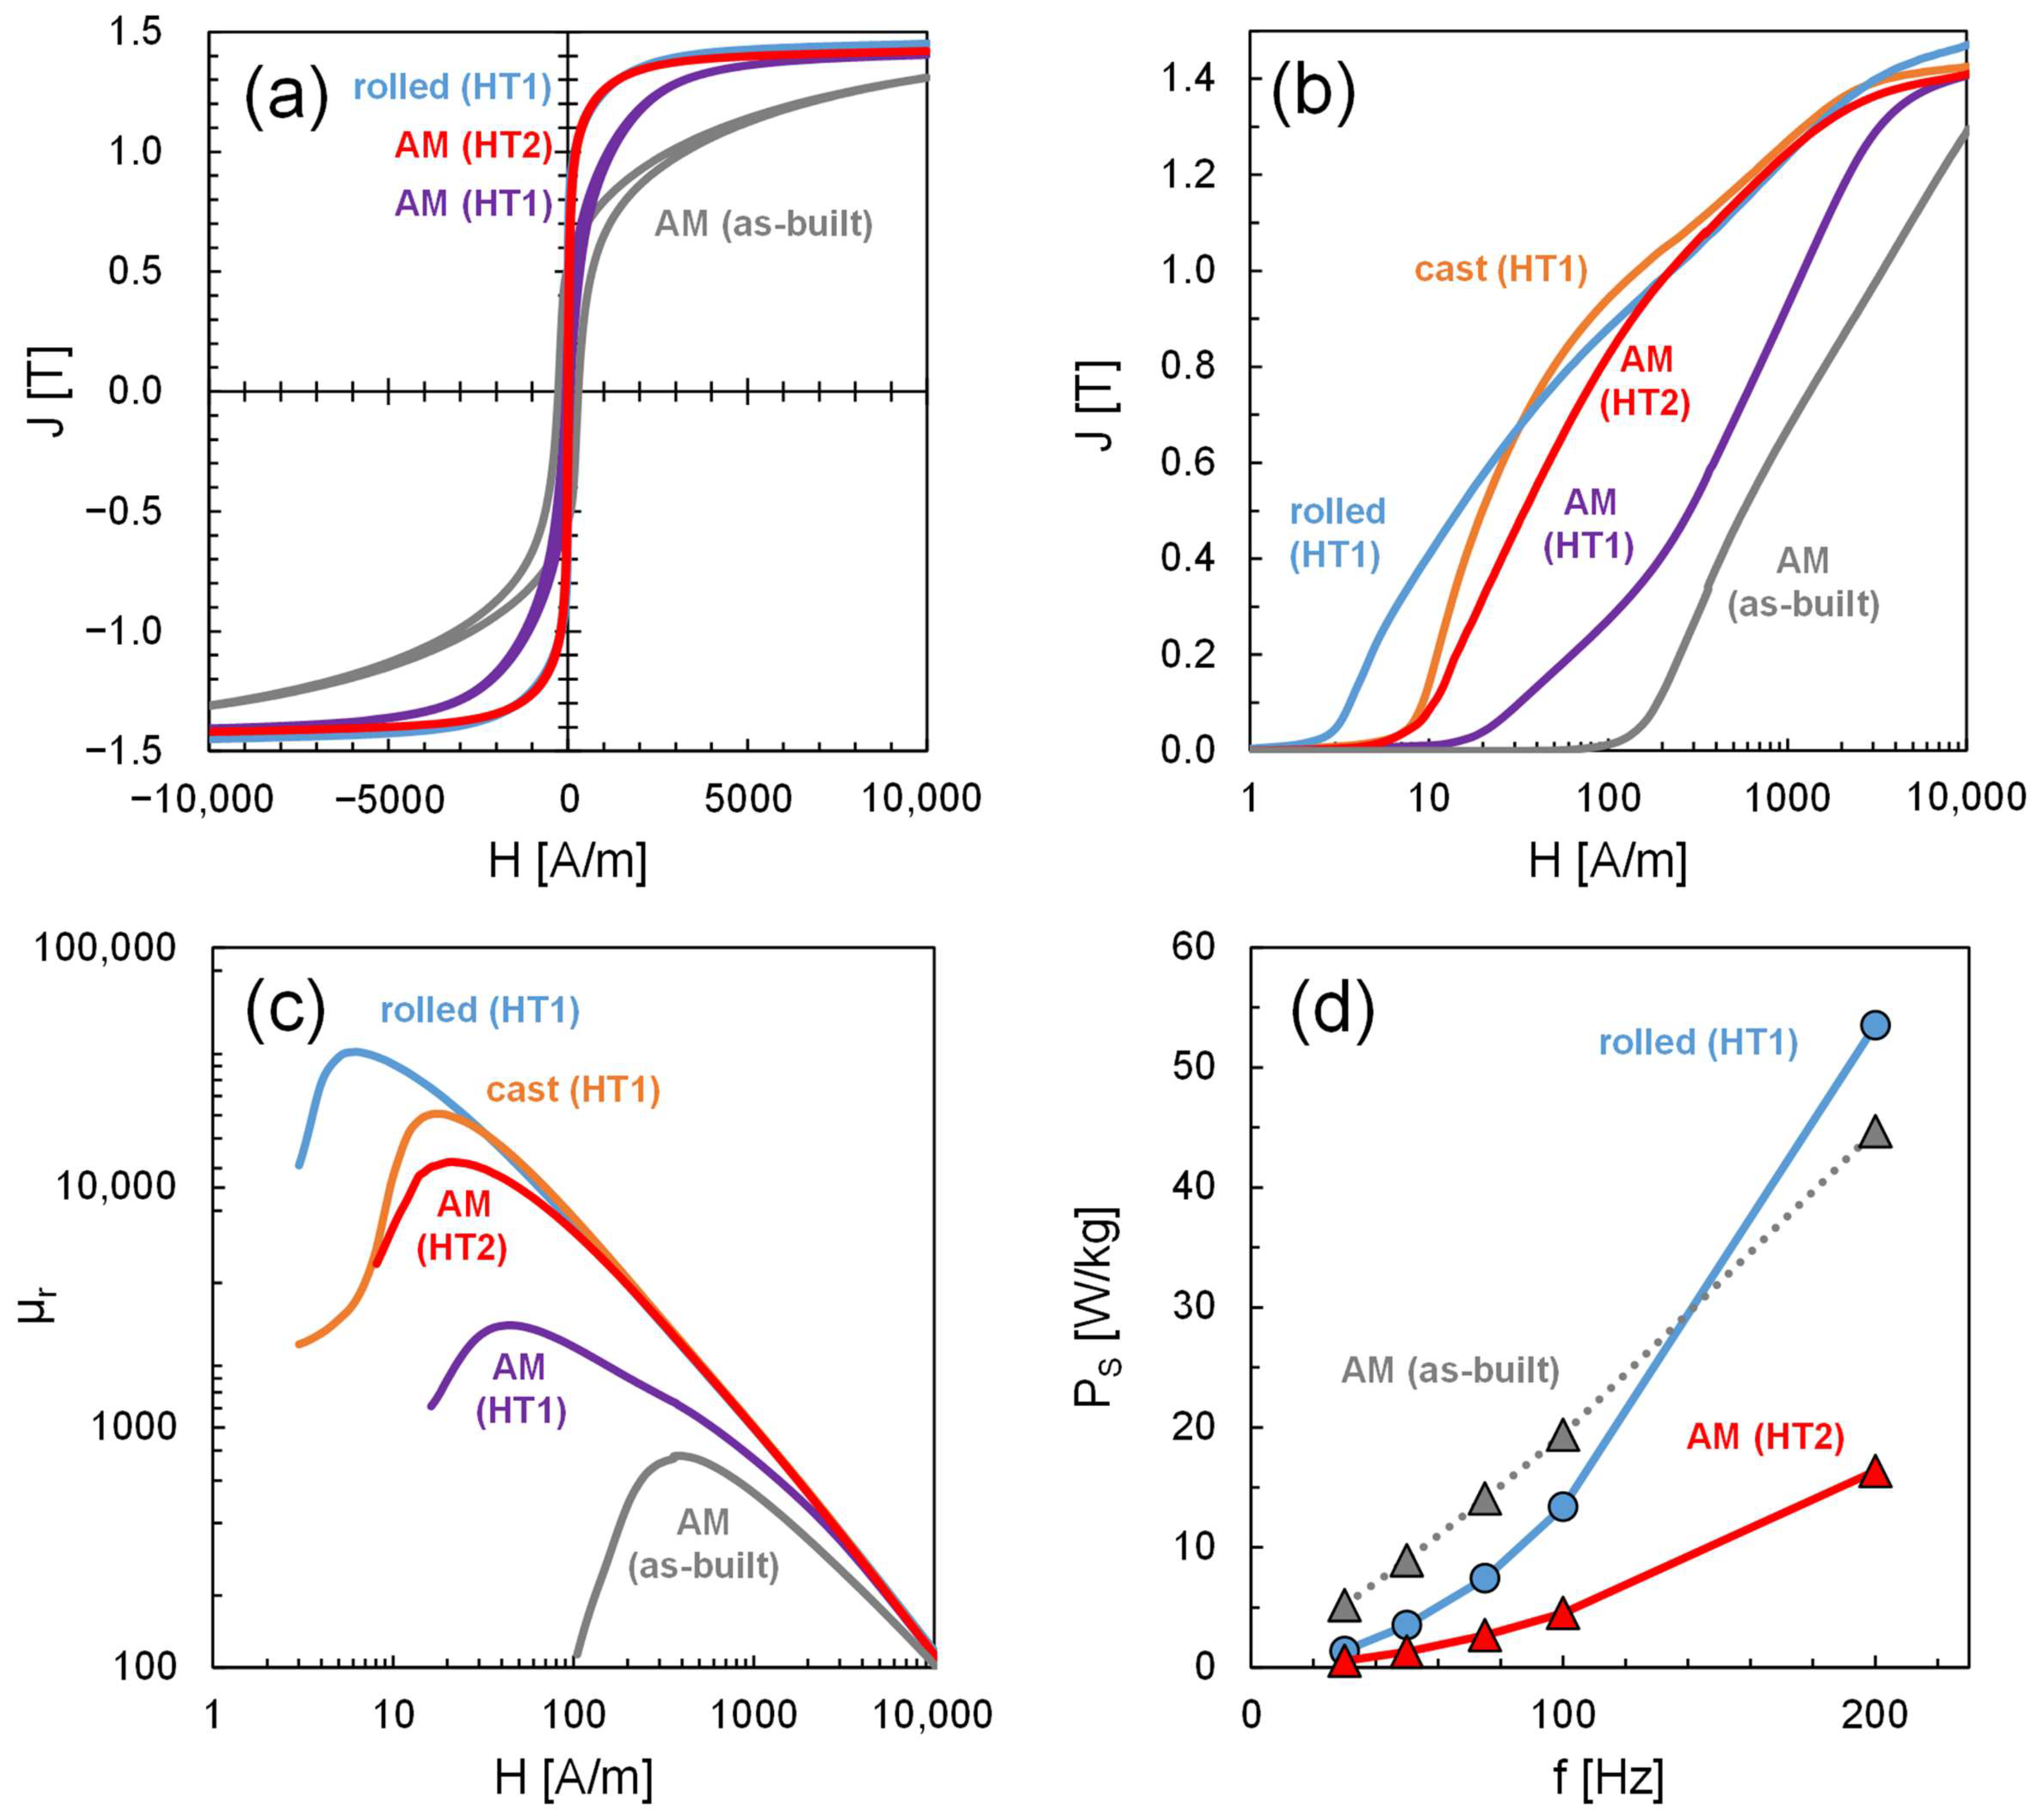
3.6. Magnetic Properties

The measured magnetic properties of the AM material samples and the reference samples produced by casting and rolling are displayed in Figure 11. The measured properties of all the toroidal samples investigated in this study and their sample designations (C1, R1–2, and AM1–4) are listed in Table 3.
The AM material in its as-built state (samples AM1–AM4) is characterized by a rather high coercivity HC (approx. 278 to 333 A/m), a low maximum permeability µmax (approx. 500 to 700), and low polarization J100 at 10 kA/m (ranging from 1.20 to 1.29 T). The annealed cast (sample C1) and rolled material (samples R1 and R2) both display a significantly softer magnetic behavior with lower HC, higher µmax, and higher J100 values (cast: HC: 12.4–15.9 A/m, µmax: 20.3–24.4 × 10³, and J100: 1.43 T; rolled: HC: 3.2–5.8 A/m, µmax: 26.6–40.4 × 10³, and J100: 1.45–1.47 T).
When the AM material is heat-treated in a similar way as the cast and rolled materials (HT1, sample AM4), an improvement in magnetic softness can be seen. The coercivity is lowered by almost an order of magnitude after the first step of HT1 to 36.7 A/m. It increases again slightly after the final step to about double the value (61.4 A/m) but is still significantly lower than the as-built state. The polarization values, J100, of the AM material (1.41 T) increase to a similar level of the reference material but are slightly lower. The maximum permeability is increased slightly by HT1 in both steps (2000 and 2700) but is about an order of magnitude lower than the cast material.
The AM ring samples annealed according to HT2 (AM1, AM2, and AM3) showed significantly larger improvements than the HT1 sample (AM4). This can be seen in a further reduction in HC and an increase in µmax.
The best values that were achieved with the AM material were HC: 11.3 A/m and µmax: 13.1 × 10³ (on different ring samples). The ring sample with the lowest HC in the as-built state (AM1) also achieved the lowest HC after annealing. The polarization, J100, was not increased significantly compared to HT1 (1.42 T). While the coercivities of the AM samples after HT2 were on a similar level as the cast material, µmax was still only about half of it.
A comparison between the AC properties of an AM HT2 sample (AM1) and a rolled sample (R1, HT1), both with t = 1 mm, is shown in Figure 11d. The rolled sample displayed lower losses than the as-built AM sample at frequencies below 100 Hz, but higher losses at 200 Hz. The AM1 sample annealed with HT2 showed the lowest losses during all the tested frequencies.

4. Discussion

4.1. AM Laser Parameter Selection and Porosity

With the parameter study, a large processing window was found where the relative densities are higher than 99%, which indicates that the Fe-12Al alloy has a good processability through L-PBF. The relative densities of 99.3% for the as-built and 99.8% after the heat treatment achieved with the selected parameter set (PL = 160 W; vs = 500 mm/s), are comparable to other works with this kind of L-PBF machine, where for pure iron, a 99.5% relative density was achieved [21].

4.2. Crack Formation

During L-PBF, thermally induced stresses may occur [22]. If the stresses during the build process locally exceed the fracture strength of the material, cracks can occur. The crack formation is favored by the rather low ductility of the Fe-12Al alloy. Several strategies to avoid crack formation in L-PBF have been investigated in the literature comprising variation in the laser parameters, laser scanning strategies, double laser exposure, or pre-heating solutions of the build platform or powder bed [22,23]. In the current investigation, no correlations between variations in the laser power or scanning speed and crack formation could be observed. The applied successive chessboard scanning strategy already leads to rather low residual stresses according to the literature [23]. To reduce the residual stresses even further and avoid crack formation, the application of a build platform heating system seems advisable. The application of BPH systems has already been investigated by Rolink et al. for L-PBF of a 28.3 at% Fe-Al alloy (approx. 16 wt% Al), and a temperature of 200 °C was found to be insufficient [13]. Investigations on brittle Fe-Si alloys indicate that a suitable temperature may be found at around 400–700 °C [18,24].

4.3. Microstructure in the as-Built and Heat-Treated Condition

The columnar microstructure of the AM material in the as-built condition (Figure 8c,d and Figure 12a) is the result of the epitaxial growth of crystallites through several build layers and melt pools. This behavior is known for many AM alloys and is affected by the chemical composition, phase transformations during cooling, or the choice of laser parameters and scanning strategy [25,26,27].
The mechanisms behind the development of the inhomogeneous grain structure consisting of columnar and equiaxed grains formed during HT1 (Figure 12b) cannot be explained fully at this point. It may be caused, to some degree, by the occurrence of non-metallic inclusions, inhibiting grain growth in the core of the sample. The present alloying (Al, Mn, and Nb) and impurity elements (O, N, C, and S) measured through wet chemical analysis, in theory, can form compounds (e.g., AlN, MnS, or Nb(C,N)) that are also used as grain growth inhibitors in electrical steel production [28,29,30,31]. The EDS analysis revealed the formation of precipitates with an increased Nb and C content, which indicates that Nb carbides are formed during the heat treatment. These precipitates were not found in the as-built state, which means that the Nb and C traces are in solution. If these precipitates form during heating and holding time, they could be effective at inhibiting grain growth. Regarding L-PBF parts, the effect of a small addition of 0.0033 wt% Nb to Fe-Co alloys was recently investigated by Riipinen et al., where grain growth was found to be effectively suppressed during annealing, and some precipitates were too small to be analyzed through EDS [32]. We therefore conclude that during HT1, grain growth is inhibited by finely dispersed Nb carbides and only becomes possible in the outer regions of the samples. We propose the following reasons for a different reaction in the outer regions: (1) a different grain structure or texture due to the contour/infill laser scanning strategy [27]; (2) differences in the magnitude of residual stresses; or (3) an influence of the oven atmosphere (Ar + 5% H2) on the grain growth-inhibiting phases. However, further investigations are still required to prove or disprove these proposed relationships.
After the adjusted heat treatment HT2 at 1300 °C, the grain growth is more uniform and also affects the core region of the sample (Figure 12c). The difference in microstructure compared to HT1 can be explained by the higher temperature, enabling faster grain growth and a more effective removal of impurities by diffusion. Further, the previously mentioned grain growth-inhibiting non-metallic inclusions are able to go into solution at temperatures ranging from 1250 to 1350 °C [29,30,31]. Therefore, their inhibiting influences on grain growth are circumvented with HT2. During slow cooling, Nb carbides are able to precipitate again and grow preferably on the grain boundaries and other nucleation sites. Precipitates of Nb carbides were also frequently observed near the remaining columnar areas (Figure 9b). However, further investigations are necessary to clarify the relationship between the Nb carbides and the grain growth-inhibiting effect in these remaining areas.

4.4. Specific Electrical Resistivity

The resistivity of the AM as-built state is increased due to the high cooling rates during the AM process and residual stresses in the material. In theory, the high cooling rates during the L-PBF process should favor the formation of a disordered state with a higher level of resistivity [3]; however, the XRD measurements indicate that an ordered state appears to already be prevalent under the as-built condition. The relaxation of stresses and healing of defects during annealing therefore appear to be the main factors lowering the level of resistivity.

4.5. DC Magnetic Properties in the as-Built and Heat-Treated Condition

The columnar microstructure parallel to the BD (Figure 8c,d) contributes to the rather unfavorable soft magnetic performance of the ring samples in the as-built condition. The ring samples were built oriented with their symmetry axis parallel to the BD, so the magnetic flux following the rings’ circumference will be subjected to many grain boundaries; therefore, HC and µmax will be increased. Another factor that can affect soft magnetic properties are residual stresses in the material. Given the fact that the stresses in the material during the build process, in some cases, were able to surpass the fracture strength of the material and form cracks, it seems plausible that the residual stresses in the as-built condition are still rather high. This will further impair HC and µmax.
The magnetic properties of the first AM sample (AM4) after HT1 have been improved in comparison to the as-built state. The HT1 samples’ magnetic properties, however, are still influenced by a multitude of factors. The beneficial factors in this case are the reduction in residual stresses due to annealing, the homogenization of alloying elements, and an increased grain size in the outer region of the sample. Negative influences still persisting after HT1 are cracks (Figure 7) and the remaining columnar structure in the core region of the sample (Figure 8e–g and Figure 12b). Cracks act as air gaps in the magnetic circuit, leading to the shearing of the hysteresis loop. This generally results in lower permeability values and a lower remanence [8]. The remaining columnar structure (Figure 8e–g) effectively still presents a large amount of grain boundaries in the magnetic flux direction, which lowers HC.
During the second step of HT1, an increase in HC was observed. This is different to the behaviors of the cast and rolled materials, which both benefit with regard to the HC of the slow cooling from 950 °C. During the last step of HT1, an additional precipitation of Nb carbides may have occurred, which act as pinning sites for domain wall movement. Differences in terms of cold deformation and impurity contents may make this precipitation occur in a different, less favorable form in the AM material than in the rolled or cast materials. Since no indications for a change in the phase structure regarding ordered phases was found through the EDS and XRD measurements in the annealed samples, it appears that the changes in the magnetic properties measured after annealing are not a result of the evolution of ordered phases in the samples.
To remove the remaining negative influences, the HT2 ring samples (AM1, AM2, and AM3) were assured to be crack free, and the heat treatment was adjusted to dissolve any present secondary phases, inhibiting the grain growth and inducing a higher level of grain growth. The resulting large grain size significantly contributes to the decrease in HC and increase in µmax. During the period of slow cooling, precipitations of Nb carbide are formed again, which may again lead to a slight pinning of domain wall movement and affect Hc and µmax. Apart from the differences in the crystallographic textures and grain sizes, this can be one reason for the difference in magnetic properties between AM and conventional manufacturing. Since the cooling rate during HT2 was the same as during HT1, and EDS did not indicate significant changes in chemical composition, an influence of phase ordering reactions on the changes in the magnetic properties appears unlikely in the case of HT2 as well.

4.6. Iron Losses and Magnetic Domain Structure

By annealing the samples, the hysteresis loss portion is mainly reduced through an increased magnetic softness of the material (e.g., lower HC). The eddy current loss portion will either remain similar or be slightly increased through the reduction in the electrical resistivity from stress relief or loss of Al. The comparison between rolled sample R1 and AM1 is more difficult to explain, and showed that the annealed AM material actually generated lower total losses.
In this case, based on the DC measurements, the coercivity of the AM1–HT2 sample was slightly higher than that of R1, which should result in higher hysteresis losses for AM1–HT2 and counteract the observed behavior. Therefore, other loss components must be responsible for this effect.
The specific electrical resistivity of the AM–HT2 material was also similar to the rolled material, which means that the influence of resistivity on eddy current losses should not be the deciding factor in this case. This effect must therefore originate from the differences in the macrostructure and microstructure or the magnetic domain wall structure. One further possibility could have been the presence of cracks, reducing the eddy currents by dividing the sample volume into smaller sections and increasing the effective resistivity [33]. However, no cracks were detected in the finished AM ring sample used for magnetic characterization. The grain size of the AM material also was larger than that of the rolled material, which, in turn, should lead to lower hysteresis and higher anomalous losses in the former. However, the AM material has a higher coercivity than the rolled material, which indicates higher hysteresis losses. The theory therefore proposed here is that the AM material must have a higher degree of other defects (e.g., porosity or precipitates), leading to a refinement of the magnetic domain size and domain wall spacing. To investigate this, the magnetic domain structures of both materials were investigated using difference Kerr microscopy, where changes in the magnetic domain structure caused by a varying external field are visualized in the form of difference images. These difference images are created with regard to a reference image of a magnetized state, where no more domain movement occurs. The sample is then subjected to a complete magnetic hysteresis cycle and imaged stepwise during this process. Based on this imaging method, it was shown that the AM material exhibits a finer, more irregular domain structure than the rolled material throughout the whole magnetization process. In Figure 13, representative domain structures of both materials are shown at a magnetic field strength of H = 0 A/m. Through such a domain wall refinement, the anomalous loss portion of the total losses can be reduced, resulting in lower overall losses [8]. However, the effect of anomalous losses is limited and generally only comes into play at higher frequencies. Furthermore, the influence of the microstructure on the domain wall movement and the magnetization behavior has not yet been completely explored. In order to better understand these relationships, further experiments are required.

5. Conclusions

Soft magnetic Fe-12Al samples have been successfully fabricated through additive manufacturing. Cuboid and ring samples with a relative density of 99.3% (as-built compared to rolled material) could be produced.
The best magnetic properties achieved so far with the AM of Fe-12Al under DC conditions (Hmax = 10 kA/m) are: HC: 11.3 A/m and µmax: 13.1 × 10³. The DC magnetic properties of AM Fe-12Al, so far, closely resemble those of the cast Fe-12Al material. In AC conditions, the AM material showed lower levels of losses than a rolled material sample. One explanation for this effect can be domain wall refinement effects. To achieve a similar level of DC magnetic properties as the rolled material, further improvements are needed. Of note, the maximum permeability of the AM material has to be increased while the coercivity needs to be further lowered. To achieve this goal, the microstructure (e.g., grain size and crystallographic texture) needs to be optimized and the number of defects (e.g., pores, residual stresses, cracks, and non-metallic inclusions) needs to be further decreased.

Author Contributions

Conceptualization, T.K. (Torsten Kunert), T.K. (Thomas Kresse), G.S. and D.G.; methodology, T.K. (Torsten Kunert), T.K. (Thomas Kresse), G.S. and D.G.; validation, T.K. (Torsten Kunert), T.K. (Thomas Kresse), G.S. and D.G.; formal analysis, T.K. (Torsten Kunert), F.F. and N.V.; investigation, T.K. (Torsten Kunert), F.F. and N.V.; resources, T.K. (Torsten Kunert), F.F., N.V., G.S. and D.G.; data curation, T.K. (Torsten Kunert), G.S. and D.G.; writing—original draft, T.K. (Torsten Kunert), T.K. (Thomas Kresse), G.S. and D.G.; writing—review and editing, T.K. (Torsten Kunert), T.K. (Thomas Kresse), F.F., N.V., G.S. and D.G.; visualization, T.K. (Torsten Kunert); supervision, G.S. and D.G.; project administration, D.G.; funding acquisition, G.S. and D.G. All authors have read and agreed to the published version of the manuscript.

Funding

The Publication was funded by Aalen University of Applied Sciences and Deutsche Forschungsgemeinschaft (DFG, German Research Foundation) – 512645013.

Data Availability Statement

Data are contained within the article.

Acknowledgments

The authors gratefully acknowledge Dominic Hohs and Simon Klett for Kerr microscopy imaging, Dominic Hohs and Kevin Fuchs for EDS analysis, and Emanuel Wengenmayr and Andreas Kopp for XRD analysis (all from the Materials Research Institute, Aalen University); Wassima El Mofid (Center for Electrochemical Surface Technology ZEO, Aalen University) for particle size analysis; and Johannes Neuer and Nathan Seiler (LaserApplicationCenter LAZ, Aalen University) for assistance during AM build jobs.

Conflicts of Interest

Authors Frederik Fohr and Niklas Volbers were employed by the company Vacuumschmelze GmbH & Co. KG. They have filed a patent application under the number US2020147688A1, which is related to additive manufacturing of soft magnetic materials. The company Vacuumschmelze is a commercial producer of magnetic materials. The remaining authors declare that the research was conducted in the absence of any commercial or financial relationships that could be construed as a potential conflict of interest. The funders had no role in the design of the study; in the collection, analyses, or interpretation of data; in the writing of the manuscript; or in the decision to publish the results.

References

  1. Pawlek, F. Magnetische Werkstoffe; Springer: Berlin/Heidelberg, Germany, 1952; ISBN 9783642532993. [Google Scholar]
  2. Bozorth, R.M. Ferromagnetism; IEEE Press: Piscataway, NJ, USA, 1978; ISBN 0-7803-1032-2. [Google Scholar]
  3. Heck, C. Magnetic Materials and Their Applications; Butterworths: London, UK, 1974; ISBN 978-0-408-70399-4. [Google Scholar]
  4. Palm, M.; Stein, F.; Dehm, G. Iron Aluminides. Annu. Rev. Mater. Res. 2019, 49, 297–326. [Google Scholar] [CrossRef]
  5. Tebble, R.S.; Craik, D.J. Magnetic Materials; Wiley-Interscience: Hoboken, NJ, USA, 1969; ISBN 9780608100289. [Google Scholar]
  6. Cahn, R.W.; Haasen, P. (Eds.) Physical Metallurgy, 4th ed.; North-Holland: Amsterdam, NY, USA, 1996; ISBN 978-0-444-89875-3. [Google Scholar]
  7. Masumoto, H.; Saito, H. On the Effect of Heat Treatment on the Magnetic Properties of Iron-Aluminium Alloys. III: The Changes of Electric Resistance and Magnetostriction Due to Water Quenching; Science Reports of the Research Institutes, Tohoku University. Ser. A, Physics, Chemistry and Metallurgy No. 42. 1952. Available online: http://hdl.handle.net/10097/26514 (accessed on 7 July 2023).
  8. Hilzinger, R.; Rodewald, W. Magnetic Materials: Fundamentals, Products, Properties, Applications; Publicis Publishing: Erlangen, Germany, 2013; ISBN 3895783528. [Google Scholar]
  9. Song, B.; Dong, S.; Coddet, P.; Liao, H.; Coddet, C. Fabrication and microstructure characterization of selective laser-melted FeAl intermetallic parts. Surf. Coat. Technol. 2012, 206, 4704–4709. [Google Scholar] [CrossRef]
  10. Song, B.; Dong, S.; Liao, H.; Coddet, C. Characterisations of TiC particle reinforced FeAl composite part fabricated by selective laser melting. Mater. Res. Innov. 2013, 18, 50–56. [Google Scholar] [CrossRef]
  11. Song, B.; Dong, S.; Liao, H.; Coddet, C. Manufacture of Fe–Al cube part with a sandwich structure by selective laser melting directly from mechanically mixed Fe and Al powders. Int. J. Adv. Manuf. Technol. 2013, 69, 1323–1330. [Google Scholar] [CrossRef]
  12. Song, B.; Dong, S.J.; Liao, H.L.; Coddet, C. Morphology evolution mechanism of single tracks of FeAl intermetallics in selective laser melting. Mater. Res. Innov. 2013, 16, 321–325. [Google Scholar] [CrossRef]
  13. Rolink, G.; Vogt, S.; Senčekova, L.; Weisheit, A.; Poprawe, R.; Palm, M. Laser metal deposition and selective laser melting of Fe–28 at.% Al. J. Mater. Res. 2014, 29, 2036–2043. [Google Scholar] [CrossRef]
  14. Michalcová, A.; Senčekova, L.; Rolink, G.; Weisheit, A.; Pešička, J.; Stobik, M.; Palm, M. Laser additive manufacturing of iron aluminides strengthened by ordering, borides or coherent Heusler phase. Mater. Des. 2017, 116, 481–494. [Google Scholar] [CrossRef]
  15. Karczewski, K.; Durejko, T.; Czujko, T. The Microstructure Evolution of a Fe3Al Alloy during the LENS Process. Materials 2018, 11, 390. [Google Scholar] [CrossRef]
  16. Karczewski, K.; Pęska, M.; Ziętala, M.; Polański, M. Fe-Al thin walls manufactured by Laser Engineered Net Shaping. J. Alloys Compd. 2017, 696, 1105–1112. [Google Scholar] [CrossRef]
  17. Shishkovsky, I.; Missemer, F.; Kakovkina, N.; Smurov, I. Intermetallics Synthesis in the Fe–Al System via Layer by Layer 3D Laser Cladding. Crystals 2013, 3, 517–529. [Google Scholar] [CrossRef]
  18. Goll, D.; Schuller, D.; Martinek, G.; Kunert, T.; Schurr, J.; Sinz, C.; Schubert, T.; Bernthaler, T.; Riegel, H.; Schneider, G. Additive manufacturing of soft magnetic materials and components. Addit. Manuf. 2019, 27, 428–439. [Google Scholar] [CrossRef]
  19. Goll, D.; Schurr, J.; Trauter, F.; Schanz, J.; Bernthaler, T.; Riegel, H.; Schneider, G. Additive manufacturing of soft and hard magnetic materials. Procedia CIRP 2020, 94, 248–253. [Google Scholar] [CrossRef]
  20. Hohs, D.; Klett, S.; Löffler, R.; Trier, F.; Goll, D.; Schneider, G. Visualization of magnetization reversal processes by dynamic Kerr microscopy. Pract. Metallogr. 2023, 60, 37–52. [Google Scholar] [CrossRef]
  21. Zanni, M.; Ceschini, L.; Fortunato, A.; Valli, G.; Del Bianco, L.; Spizzo, F. Relationship between microstructure, mechanical and magnetic properties of pure iron produced by laser powder bed fusion (L-PBF) in the as-built and stress relieved conditions. Prog. Addit. Manuf. 2022, 7, 1195–1212. [Google Scholar] [CrossRef]
  22. Mugwagwa, L.; Yadroitsev, I.; Matope, S. Effect of Process Parameters on Residual Stresses, Distortions, and Porosity in Selective Laser Melting of Maraging Steel 300. Metals 2019, 9, 1042. [Google Scholar] [CrossRef]
  23. Mugwagwa, L.; Dimitrov, D.; Matope, S.; Yadroitsev, I. Evaluation of the impact of scanning strategies on residual stresses in selective laser melting. Int. J. Adv. Manuf. Technol. 2019, 102, 2441–2450. [Google Scholar] [CrossRef]
  24. Andreiev, A.; Hoyer, K.-P.; Hengsbach, F.; Haase, M.; Tasche, L.; Duschik, K.; Schaper, M. Powder bed fusion of soft-magnetic iron-based alloys with high silicon content. J. Mater. Process. Technol. 2023, 317, 117991. [Google Scholar] [CrossRef]
  25. Brandt, M. (Ed.) Laser Additive Manufacturing: Materials, Design, Technologies, and Applications; Elsevier Science: Kent, UK, 2016; ISBN 9780081004333. [Google Scholar]
  26. Lejček, P.; Roudnická, M.; Čapek, J.; Dvorský, D.; Drahokoupil, J.; Šimek, D.; Čížek, J.; Svora, P.; Molnárová, O.; Vojtěch, D. Selective laser melting of pure iron: Multiscale characterization of hierarchical microstructure. Mater. Charact. 2019, 154, 222–232. [Google Scholar] [CrossRef]
  27. Herzog, D.; Seyda, V.; Wycisk, E.; Emmelmann, C. Additive manufacturing of metals. Acta Mater. 2016, 117, 371–392. [Google Scholar] [CrossRef]
  28. Hayakawa, Y. Mechanism of secondary recrystallization of Goss grains in grain-oriented electrical steel. Sci. Technol. Adv. Mater. 2017, 18, 480–497. [Google Scholar] [CrossRef]
  29. Taguchi, S.; Sakakura, A.; Matsumoto, F.; Takashima, K.; Kuroki, K. The development of grain-oriented silicon steel with high permeability. J. Magn. Magn. Mater. 1975, 2, 121–131. [Google Scholar] [CrossRef]
  30. Wilson, F.G.; Gladman, T. Aluminium nitride in steel. Int. Mater. Rev. 1988, 33, 221–286. [Google Scholar] [CrossRef]
  31. Feng, Y.; Guo, J.; Li, J.; Ning, J. Effect of Nb on solution and precipitation of inhibitors in grain-oriented silicon steel. J. Magn. Magn. Mater. 2017, 426, 89–94. [Google Scholar] [CrossRef]
  32. Riipinen, T.; Pippuri-Mäkeläinen, J.; Que, Z.; Metsä-Kortelainen, S.; Antikainen, A.; Lindroos, T. The effect of heat treatment on structure and magnetic properties of additively manufactured Fe-Co-V alloys. Mater. Today Commun. 2023, 36, 106437. [Google Scholar] [CrossRef]
  33. Goodall, A.D.; Chechik, L.; Mitchell, R.L.; Jewell, G.W.; Todd, I. Cracking of soft magnetic FeSi to reduce eddy current losses in stator cores. Addit. Manuf. 2023, 70, 103555. [Google Scholar] [CrossRef]
Figure 1. Processing steps for the toroid samples used for the magnetic characterization of the casting, rolling, and L-PBF production processes (HT1: 1100 °C, 4 h + 950 °C, 1 h, cooling rate −50 K/h; HT2: 1300 °C, 6 h, cooling rate −50 K/h).
Metals 14 00117 g001
Figure 2. Temperature profiles of the heat treatments HT1 and HT2 (HT1: 1100 °C, 4 h + 950 °C, 1 h, cooling rate −50 K/h; and HT2: 1300 °C, 6 h, cooling rate −50 K/h).
Metals 14 00117 g002
Figure 3. Gas-atomized Fe-12Al powder with a predominantly spherical morphology (a). Some non-spherical particles with satellites and melt splatter adhering to them can be found as well (b).
Metals 14 00117 g003
Figure 4. Volume-specific particle size distribution of gas-atomized Fe-12Al powder determined by laser diffraction. A median value d50 of 46.9 µm was measured.
Metals 14 00117 g004
Figure 5. Relative density of L-PBF cuboid samples produced under different combinations of processing parameters (laser power, PL: 100, 120, 140, 160, and 175 W; scanning speed, vS: 300, 400, 500, 600, and 700 mm/s).
Metals 14 00117 g005
Figure 6. An unetched overview image (OM, BF, 100×) of an Fe-12Al cuboid sample with a low level of porosity and no cracks in its as-built state (PL = 160 W, vs = 500 mm/s, h = 90 µm, and d = 20 µm).
Metals 14 00117 g006
Figure 7. Three-dimensional renders of CT data of the additively manufactured AM4 HT1 ring sample (PL = 160 W, vs = 500 mm/s, h = 90 µm, and d = 20 µm) with applied copper windings for magnetic testing showing several cracks in the core material. Cracks appeared both parallel and perpendicular to the horizontal cutting plane. (a) Three-dimensional render with a virtual cut in the middle of the ring sample revealing cracks. (b) Three-dimensional render with a virtual cut near the bottom of the ring sample revealing a crack-free section with a height of about t = 1 mm.
Metals 14 00117 g007
Figure 8. The microstructure (OM, BF, and v2a etchant) of the Fe-12Al alloy after the different manufacturing routes and heat treatment states (AM cuboid samples: PL = 160 W, vs = 500 mm/s, h = 90 µm, and d = 20 µm): (a) cross-section of the cast material ingot prior to heat treatment; 100×; overview image); (b) rolled material after heat treatment (HT1); ND—normal direction; 100×; detail; (c) the AM material in the as-built state; 100×; overview image; (d) the AM material in the as-built state; 100×; detail; (e) the AM material after the first step of heat treatment HT1 with an inhomogeneous grain size; 100×; overview image; (f) the AM material after the completion of HT1, showing no further changes in its grain size; 100×; overview image; (g) the AM material after heat treatment (first step of HT1): border between coarse grown grains and columnar grains; 100×; detail; (h) the AM material after heat treatment HT2; 100×; overview image; (i) the AM material after HT2: area with the remaining columnar grains; 100×; detail.
Metals 14 00117 g008
Figure 9. SEM images of the precipitates in the L-PBF Fe-12Al cuboid samples (a) after the HT1 heat treatment; 1000×; 25 kV; (b) after the HT2 heat treatment; 500×; 25 kV; and (c) an image of a Nb carbide precipitate on the grain boundary in L-PBF Fe-12Al after HT2; 5000×; 5 kV.
Metals 14 00117 g009
Figure 10. XRD patterns of the L-PBF Fe-12Al cuboid samples in its as-built condition after HT1 heat treatment step 1 (1100 °C, 4 h) and HT1 step 2 (step 1 + 950 °C, 1 h, cooling rate −50 K/h); the expected peak positions of the ordered Fe3Al (D03) phase are indicated with black symbols; (a) the complete spectrums show the best fit with Fe3Al (D03); due to texturing, the peak distribution is different than expected, and some peaks are visible only faintly or not at all; (b) the amplified region shows peak thinning caused by lattice relaxation during the course of the heat treatment and peak splitting due to the two K-alpha spectral lines.
Metals 14 00117 g010
Figure 11. Magnetic properties of representative Fe-12Al samples originating from different manufacturing routes (AM: PL = 160 W, vs = 500 mm/s, h = 90 µm, and d = 20 µm; HT1: sample AM4; HT2: sample AM1; casting sample C1; and rolled sample R1) and heat treatments (HT1: 1100 °C, 4 h + 950 °C, 1 h, cooling rate −50 K/h; HT2: 1300 °C, 6 h, cooling rate −50 K/h). (a) Hysteresis loops. (b) Polarization curves. (c) Permeability curves. (d) AC measurements (total losses) of samples with identical dimensions (t = 1 mm).
Metals 14 00117 g011
Figure 12. Grain structures near the edges of an AM Fe-12Al sample (PL = 160 W, vs = 500 mm/s, h = 90 µm, and d = 20 µm) under different material states (OM, BF, 100×). (a) As-built state; (b) after HT1 (1100 °C, 4 h + 950 °C, 1 h, cooling rate −50 K/h); and (c) after HT2 (1300 °C, 6 h, cooling rate −50 K/h).
Metals 14 00117 g012
Figure 13. Difference Kerr microscopy images taken at a field strength of H = 0 A/m during the magnetization process show a difference in magnetic domain structure between the rolled and the AM material, 100×. (a) Rolled material after HT1. (b) AM material after HT2 (1300 °C, 6 h, cooling rate −50 K/h).
Metals 14 00117 g013
Table 1. Production process, dimensions, density, and magnetic properties of the Fe-12Al toroid samples investigated in this study.
ProcessSampleTargeted
thickness
t (mm)
Heat
treatment
Atmosphere
CastC1massiveHT1dry H2
RolledR11.0HT1dry H2
R22.0HT1dry H2
L-PBFAM11.0HT2Ar + 5% H2
AM22.0HT2Ar + 5% H2
AM33.0HT2Ar + 5% H2
AM44.0HT1Ar + 5% H2
HT1: 1100 °C, 4 h + 950 °C, 1 h, cooling rate −50 K/h; HT2: 1300 °C, 6 h, cooling rate −50 K/h.
Table 2. Chemical composition measured using the EDS area scans before and after the heat treatment.
ElementAs-BuiltHT1
(Core Region)
HT1
(Surface Region)
HT2
Al (wt%)11.511.411.411.3
Mn (wt%)0.70.60.60.6
Fe (wt%)87.888.088.088.1
Table 3. Production process, dimensions, density, and magnetic properties of the Fe-12Al toroidal samples investigated in this study.
ProcessSampleHeat
Treatment
Thickness
t (mm)
Density (g/cm3)Relative Density (%)HC
(A/m)
J100
(T)
µmax
(×103)
PS
(W/kg)
CastC1HT1, step 1massive6.77100.015.91.4324.4-
HT1, step 2massive6.77100.012.41.4320.3-
RolledR1HT1, step 11.06.77100.04.51.4726.6-
HT1, step 21.06.77100.03.21.4736.63.5
R2HT1, step 12.16.77100.05.81.4526.7-
HT1, step 22.16.77100.04.11.4540.4-
L-PBFAM1As-built1.16.7199.22781.290.768.9
HT21.16.7699.811.31.4112.71.3
AM2As-built2.16.7399.43131.250.5310.6
HT22.16.7599.718.81.4213.13.2
AM3As-built3.06.7299.33331.230.4511.8
HT23.06.7699.814.11.4210.25.9
AM4As-built4.16.7199.23011.200.5012.7
HT1, step 14.16.7599.636.71.392.04.5
HT1, step 24.06.7499.661.41.412.75.3
J100: J at H = 10 kA/m; PS measured at J = 1 T and f = 50 Hz.
Disclaimer/Publisher’s Note: The statements, opinions and data contained in all publications are solely those of the individual author(s) and contributor(s) and not of MDPI and/or the editor(s). MDPI and/or the editor(s) disclaim responsibility for any injury to people or property resulting from any ideas, methods, instructions or products referred to in the content.

