Abstract
Ni-base superalloys are employed to produce parts of aeronautic engines, space vehicles and power plants. During the production process or lifetime of components, cracks may occur which affect their performance. Reliable repairs can be carried out through high-energy density welding techniques. This work investigated laser welding of the directionally solidified IN792 DS superalloy. The characteristics of the original material and their evolution in the base metal, heat-affected zone and melt zone after laser welding in different conditions and post-welding heat treatment were investigated through micro-hardness tests, light and scanning electron microscopy observations. The study allowed to optimize the process parameters and post-welding heat treatment, obtaining joints without macro-defects, such as cracks and pores, and with properties and microstructures of the melt zone like those of base metal.
1. Introduction
Nowadays, Ni-base superalloys are commonly used to manufacture different components in the aeronautic, aerospace, chemical, petrochemical and energy sectors [1,2], owing to their excellent mechanical properties and corrosion resistance at high temperature [3,4,5,6,7]. The microstructure consists of Ll2 ordered particles of Ni3(Al, Ti) γ′ phase embedded in a disordered γ phase matrix. The stability of the microstructure (γ + γ′) depends on the misfit of the lattice parameters of γ and γ′ phases, and on the reduced interface energy (20–30 mJ m−2) obtained through a strict control of the chemical composition and manufacturing process parameters [8,9,10,11,12]. Recently, simulations have been extensively employed to predict the microstructural features and mechanical properties of these materials after complex thermal cycles [13,14].
During their lifetime, mechanical components made of Ni-base superalloys operate at high temperature, under high stresses and in hostile environmental conditions; thus, creep and fatigue induce the formation of undesired phases, the coalescence of γ′ particles and the morphological evolution of carbides [15,16]. Furthermore, oxidation and corrosion processes cause additional damage, leading to the formation of surface defects and cracks which can be repaired by means of welding techniques [17]. Cracks may also form during the production process. The possibility to repair a component made of Ni-base superalloys involves several benefits such as energy saving, reduced use of critical raw materials and shortening of the out-of-service time of the component. In fact, repairing is an economic and sustainable practice; thus, there are relevant investments in different industrial sectors to support the research of new solutions.
The efficiency of welding operations involves the following: (i) minimal variation in the original microstructure, (ii) no significant residual stresses and cracks in the melt zone (MZ) and heat affected zone (HAZ), (iii) no massive surface segregation and (iv) low diffusion of the alloying elements [15].
A recent overview about joining and repairing techniques of nickel superalloy for industrial gas turbine applications [18] reports on several mechanisms of rupture and takes into consideration the adopted industrial repairing process that could be classified mainly as fusion welding, diffusion bonding and brazing. The high-energy density welding techniques, namely electron beam welding (EBW) and laser welding (LW), represent the best solutions for repairing the defects. In fact, they produce narrow joints with a high-penetration depth and low-thermal load reducing residual stresses in the MZ and HAZ [19,20,21,22,23,24]. However, even with EBW and LW, some problems related to the partitioning of alloying elements, γ′ amount and formation of undesired phases in the MZ arise; thus, some post-welding heat treatments (PWHTs) are necessary [25,26,27].
The results presented In this paper are part of a research project aimed to find the best operative conditions for welding Ni-base superalloys through high-energy density techniques. LW process parameters of the IN792 directionally solidified (DS) superalloy have been optimized to produce joints without macro-defects. IN792 is one of the 55 Ni-base superalloys recognized by the Nickel Institute. Owing to its excellent corrosion and creep resistance at high temperature, this alloy is widely used in the aeronautic industry for manufacturing aircraft turbines; however, hot cracking often occurs in the final stage of solidification [28] and the components need to be repaired. In general, welding of Ni-base superalloys with high amounts of γ′ phase is a hard task due to their great crack susceptibility, and among them, IN792 is one which presents the highest difficulty due to the large content of Ti and Al. The evolution of the γ′ phase in the base metal (BM), HAZ and MZ has been characterized by scanning electron microscopy (SEM) and micro-hardness tests. The results have been discussed by considering the thermal history of the samples.
2. Materials and Methods
The nominal chemical composition of the IN792 DS alloy is reported in Table 1.

Table 1.
Nominal chemical composition of IN792 DS superalloy (at.%).
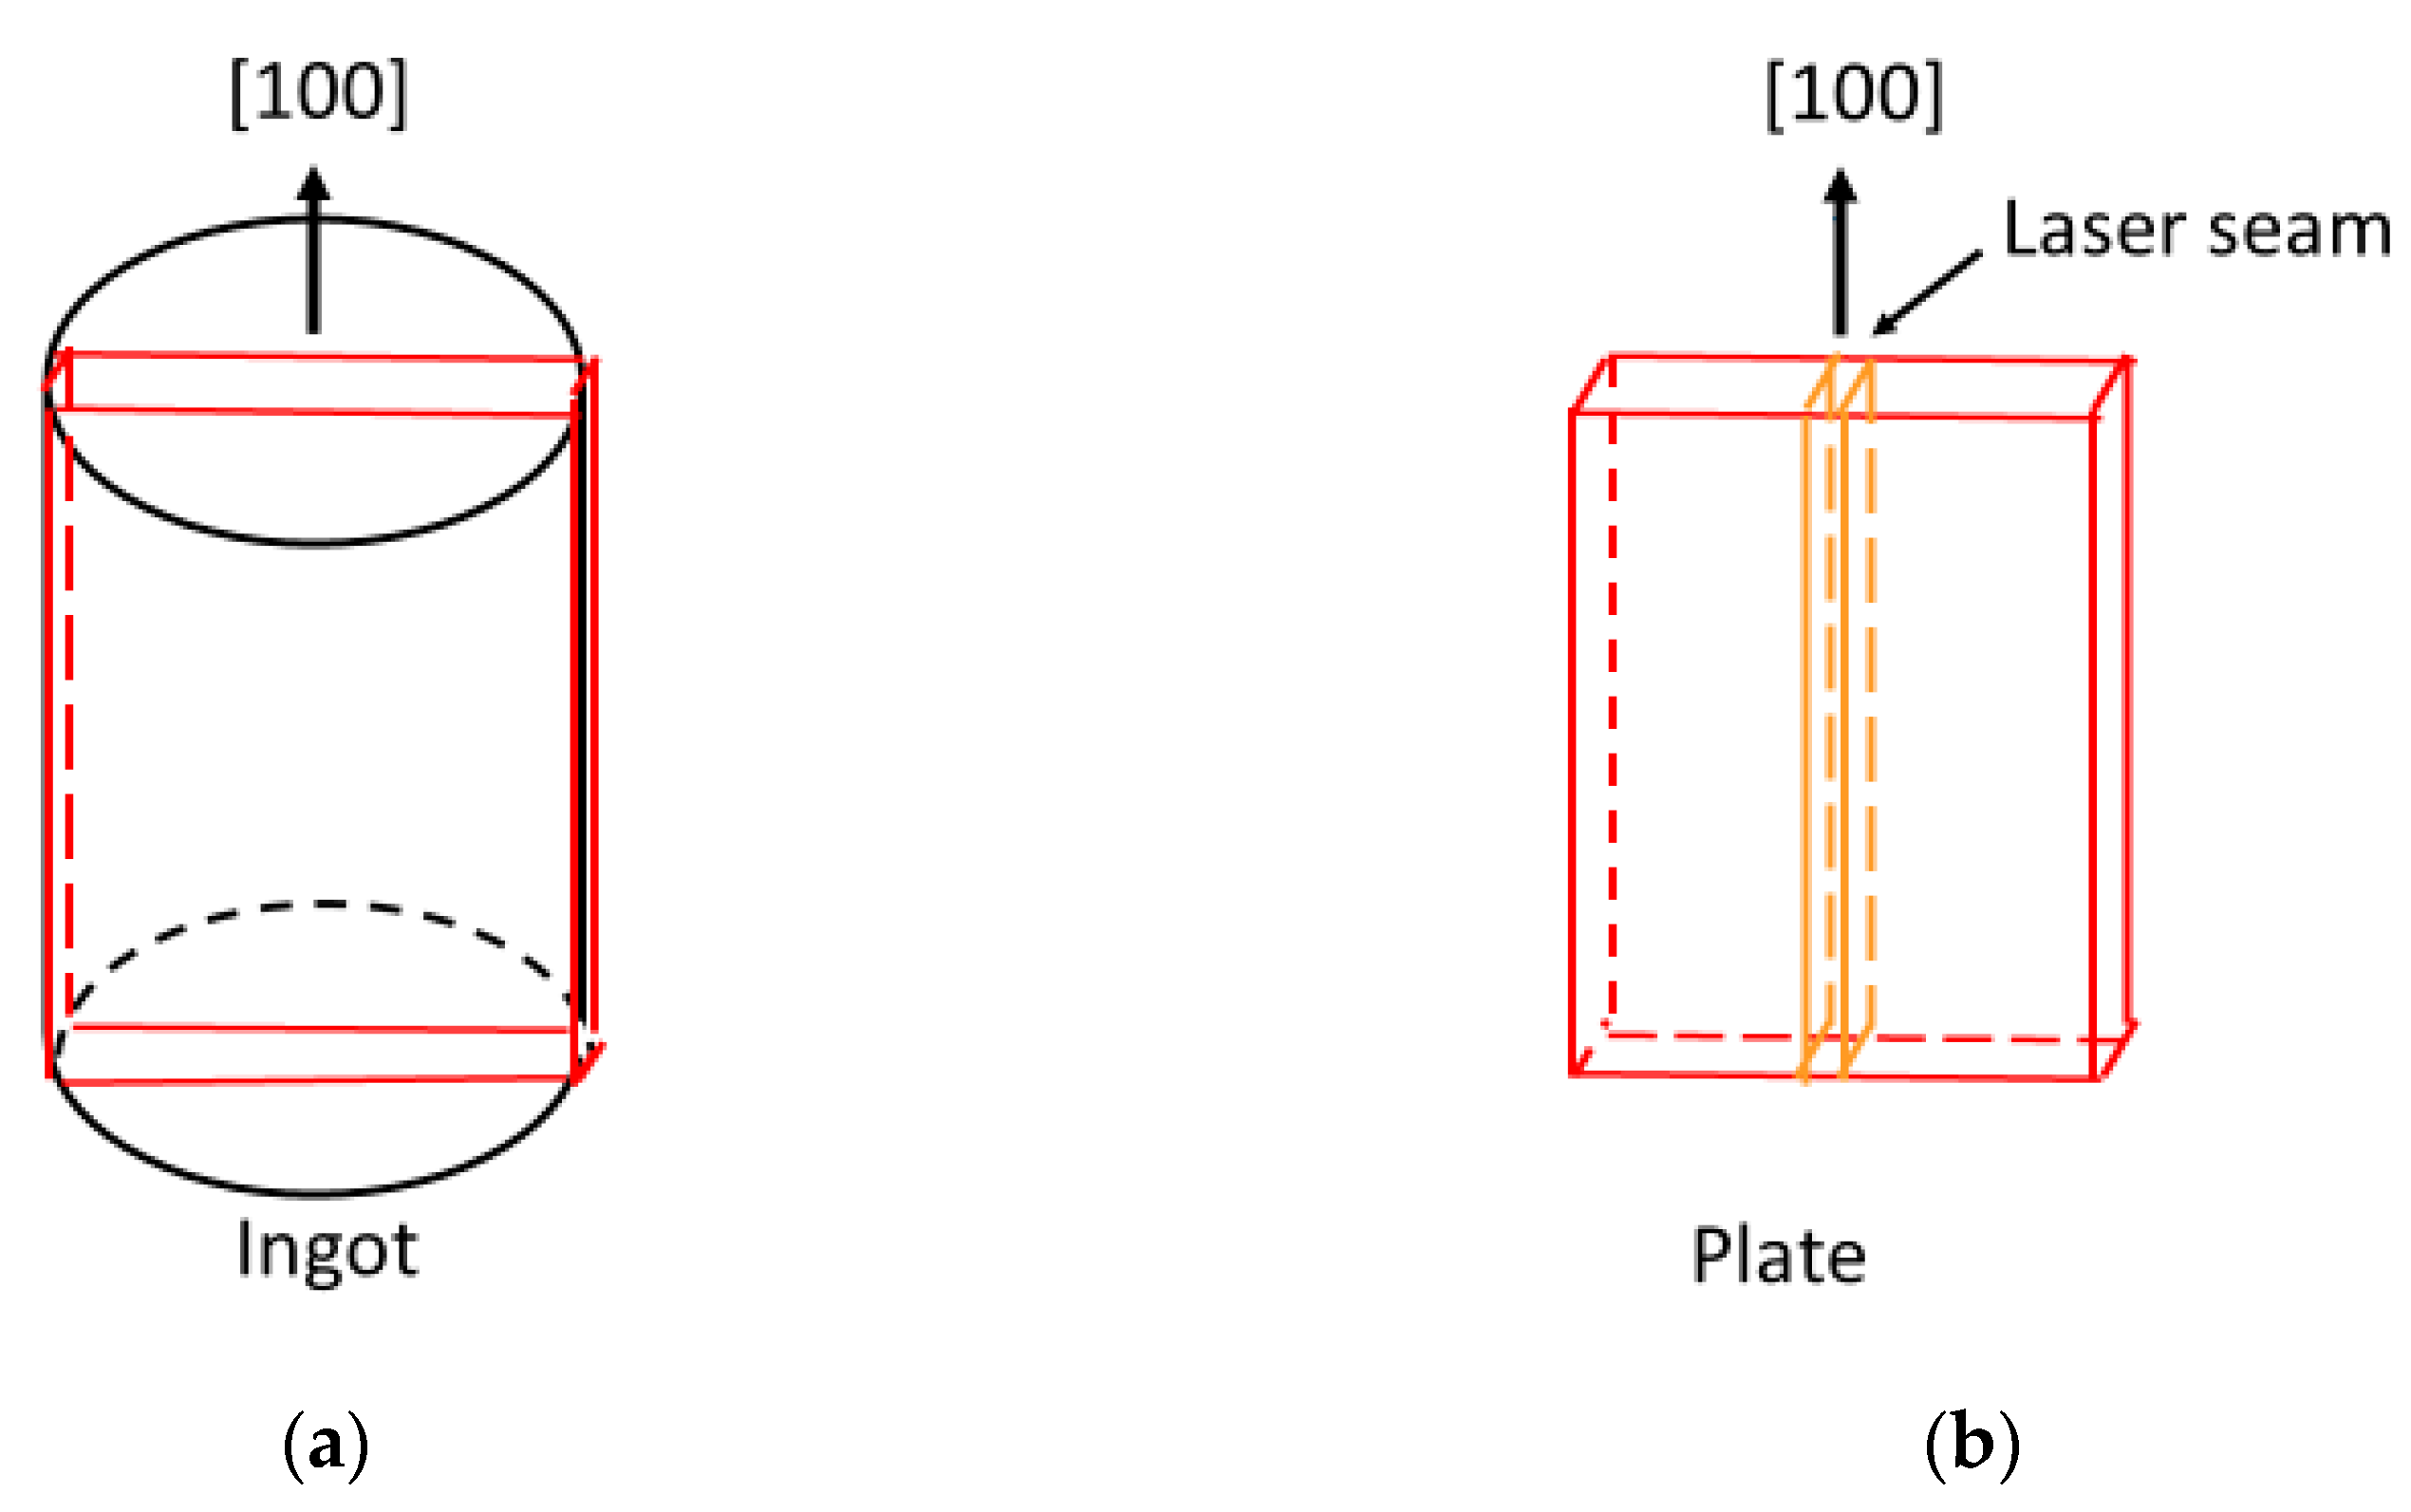
The as-cast material was submitted to solubilization in vacuum (1120 °C/2 h), aging (845 °C/12 h) and cooling in air to ambient temperature. The examined alloy was supplied in the form of cylindrical ingots (diameter 25 mm, height 60 mm) with the [100] direction of the oriented grains parallel to the ingot axis. As shown in Figure 1a, plates (length 22 mm, thickness 2 mm) were cut from the ingots by spark-erosion along their axis. The plates were then welded by LW (Figure 1b) with the joints parallel to the ingot axis.
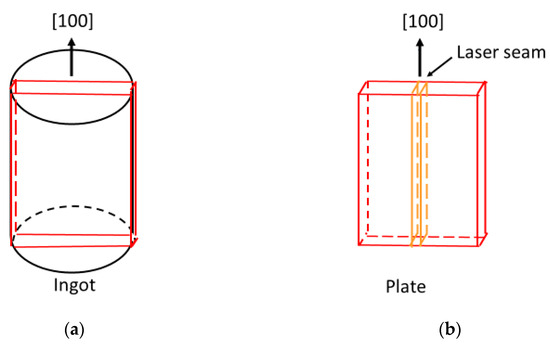
Figure 1.
Plates were obtained by cutting the cylindrical ingots (a). The weld joints are parallel to the [100] direction (b).
A solid state Yb fibre laser (IPG mod. YLS-4000 (IPG Laser GmbH, Burbach, Germany)) was used in the experiments. The 4 kW power laser source, that allows continuous wave and modulated emission, is coupled with a 100 μm delivery optical fibre. The focusing system consists of a 100 mm collimating lens and a 250 mm focusing lens. The focus spot in the experiments had a radius of ~125 μm and Rayleigh length of 4.8 mm. The welding set-up has been described in a previous paper [29]. In order to prevent the formation of hot cracks in the MZ and HAZ during cooling, a sample holder has been suitably designed and realized to heat the samples before and during the LW process. The aluminium clamping system takes in the right position of the samples to be welded; it consists of a base (174 × 174 × 16 mm) and two supports (168 × 30 × 10 mm) which allow to move the plates in the direction perpendicular to the laser beam and fix them in the desired position. Such clamping system is allocated on a hot-plate (Stuart UC125, Cole-Parmer, St. Neots, UK) that can reach a uniform temperature of ~450 °C on the surface. The temperature of the pre-heated plates, measured by three K-type thermocouples in direct contact with the plate, was kept constant within ±3 °C.
To find the conditions giving the best joint quality, welding experiments were carried out by using standard, wobbling and pulsed focused laser beams with different parameters. Five samples were prepared for each welding condition.
Table 2 reports pre-heating temperature (T), power (P), feed rate (V), beam type, the focused diameter of the beam (d), laser frequency (f), average (Pav) and maximum (Ppk) power. In all the tests, which were performed in Ar atmosphere, gas was blown both on the back and the top of the welding bead by a trailing shielding device. It consists of a plasma suppression gas nozzle (flow rate 24 L/min) directed to the weld pool and by a trailing gas shield (flow rate 20 L/min) distributing the gas on a wide area to protect the solidified, but still warm material, from oxidation. A further backing shielding gas (flow rate 10 L/min), which covers the entire length of the seam, was used at the back surface.

Table 2.
Laser welding (LW) parameters.
A series of preliminary bead-on-plate (BoP) tests were performed on L1, L2 and L3 samples to investigate the effects of laser parameters on the formation of porosity and cracks. To simulate the repair of a defect, samples L4 were prepared through the butt welding of two pieces with straight milled edges.
All the welded samples were examined by digital radiography (GE Sensing & Inspection Technologies, Ahrenburg, Germany) to detect the presence of porosity and cracks.
Temperature vs. time profiles at different distances from the welds were recorded by means of six K-type thermocouples placed at 0, 0.3, 0.75, 1.35, 1.45 and 1.65 mm from the seam. These data allowed to determine the maximum temperature reached and the cooling rate in MZ, HAZ and BM.
Welds were submitted to a PWHT chosen by considering our previous results and the literature data, consisting of the following steps:
- Homogenization at 1200 °C for 1 h, cooling at room temperature (TR);
- Solubilization at 1100 °C for 4 h, cooling at TR;
- Aging at 870 °C for 4 h, cooling at TR.
Light microscopy (LM, Union Optical Co., Ltd., Tokyo, Japan) and scanning electron microscopy (SEM, ZEISS Leo 1530, Jena, Germany) observations were carried out to examine the microstructure of the alloy. The samples were prepared through metallographic polishing by means of grinding papers with SiC abrasive particles of decreasing size (up to n. 4000) plus a final step by employing a cloth with a suspension of diamond particles (3 μm). Finally, they were etched by Marble’s reagent (10 g CuSO4, 50 mL HCl, 50 mL H2O) for 30 s. Since MZ and HAZ are too narrow to be examined by X-ray diffraction, the fraction and mean size of γ′ particles were determined from the analysis of 30 SEM images at high magnification (×100,000) by means of ImageJ software (version 1.54d, National Institutes of Health—NIH, Bethesda, MD, USA).
Vickers micro-hardness tests (Micro-hardness tester, Shimadzu Corporation, Kyoto, Japan) were carried out across the weld joints with steps of 200 µm and an applied load of 500 g for 10 s.
3. Results and Discussion
3.1. Quality of Welds
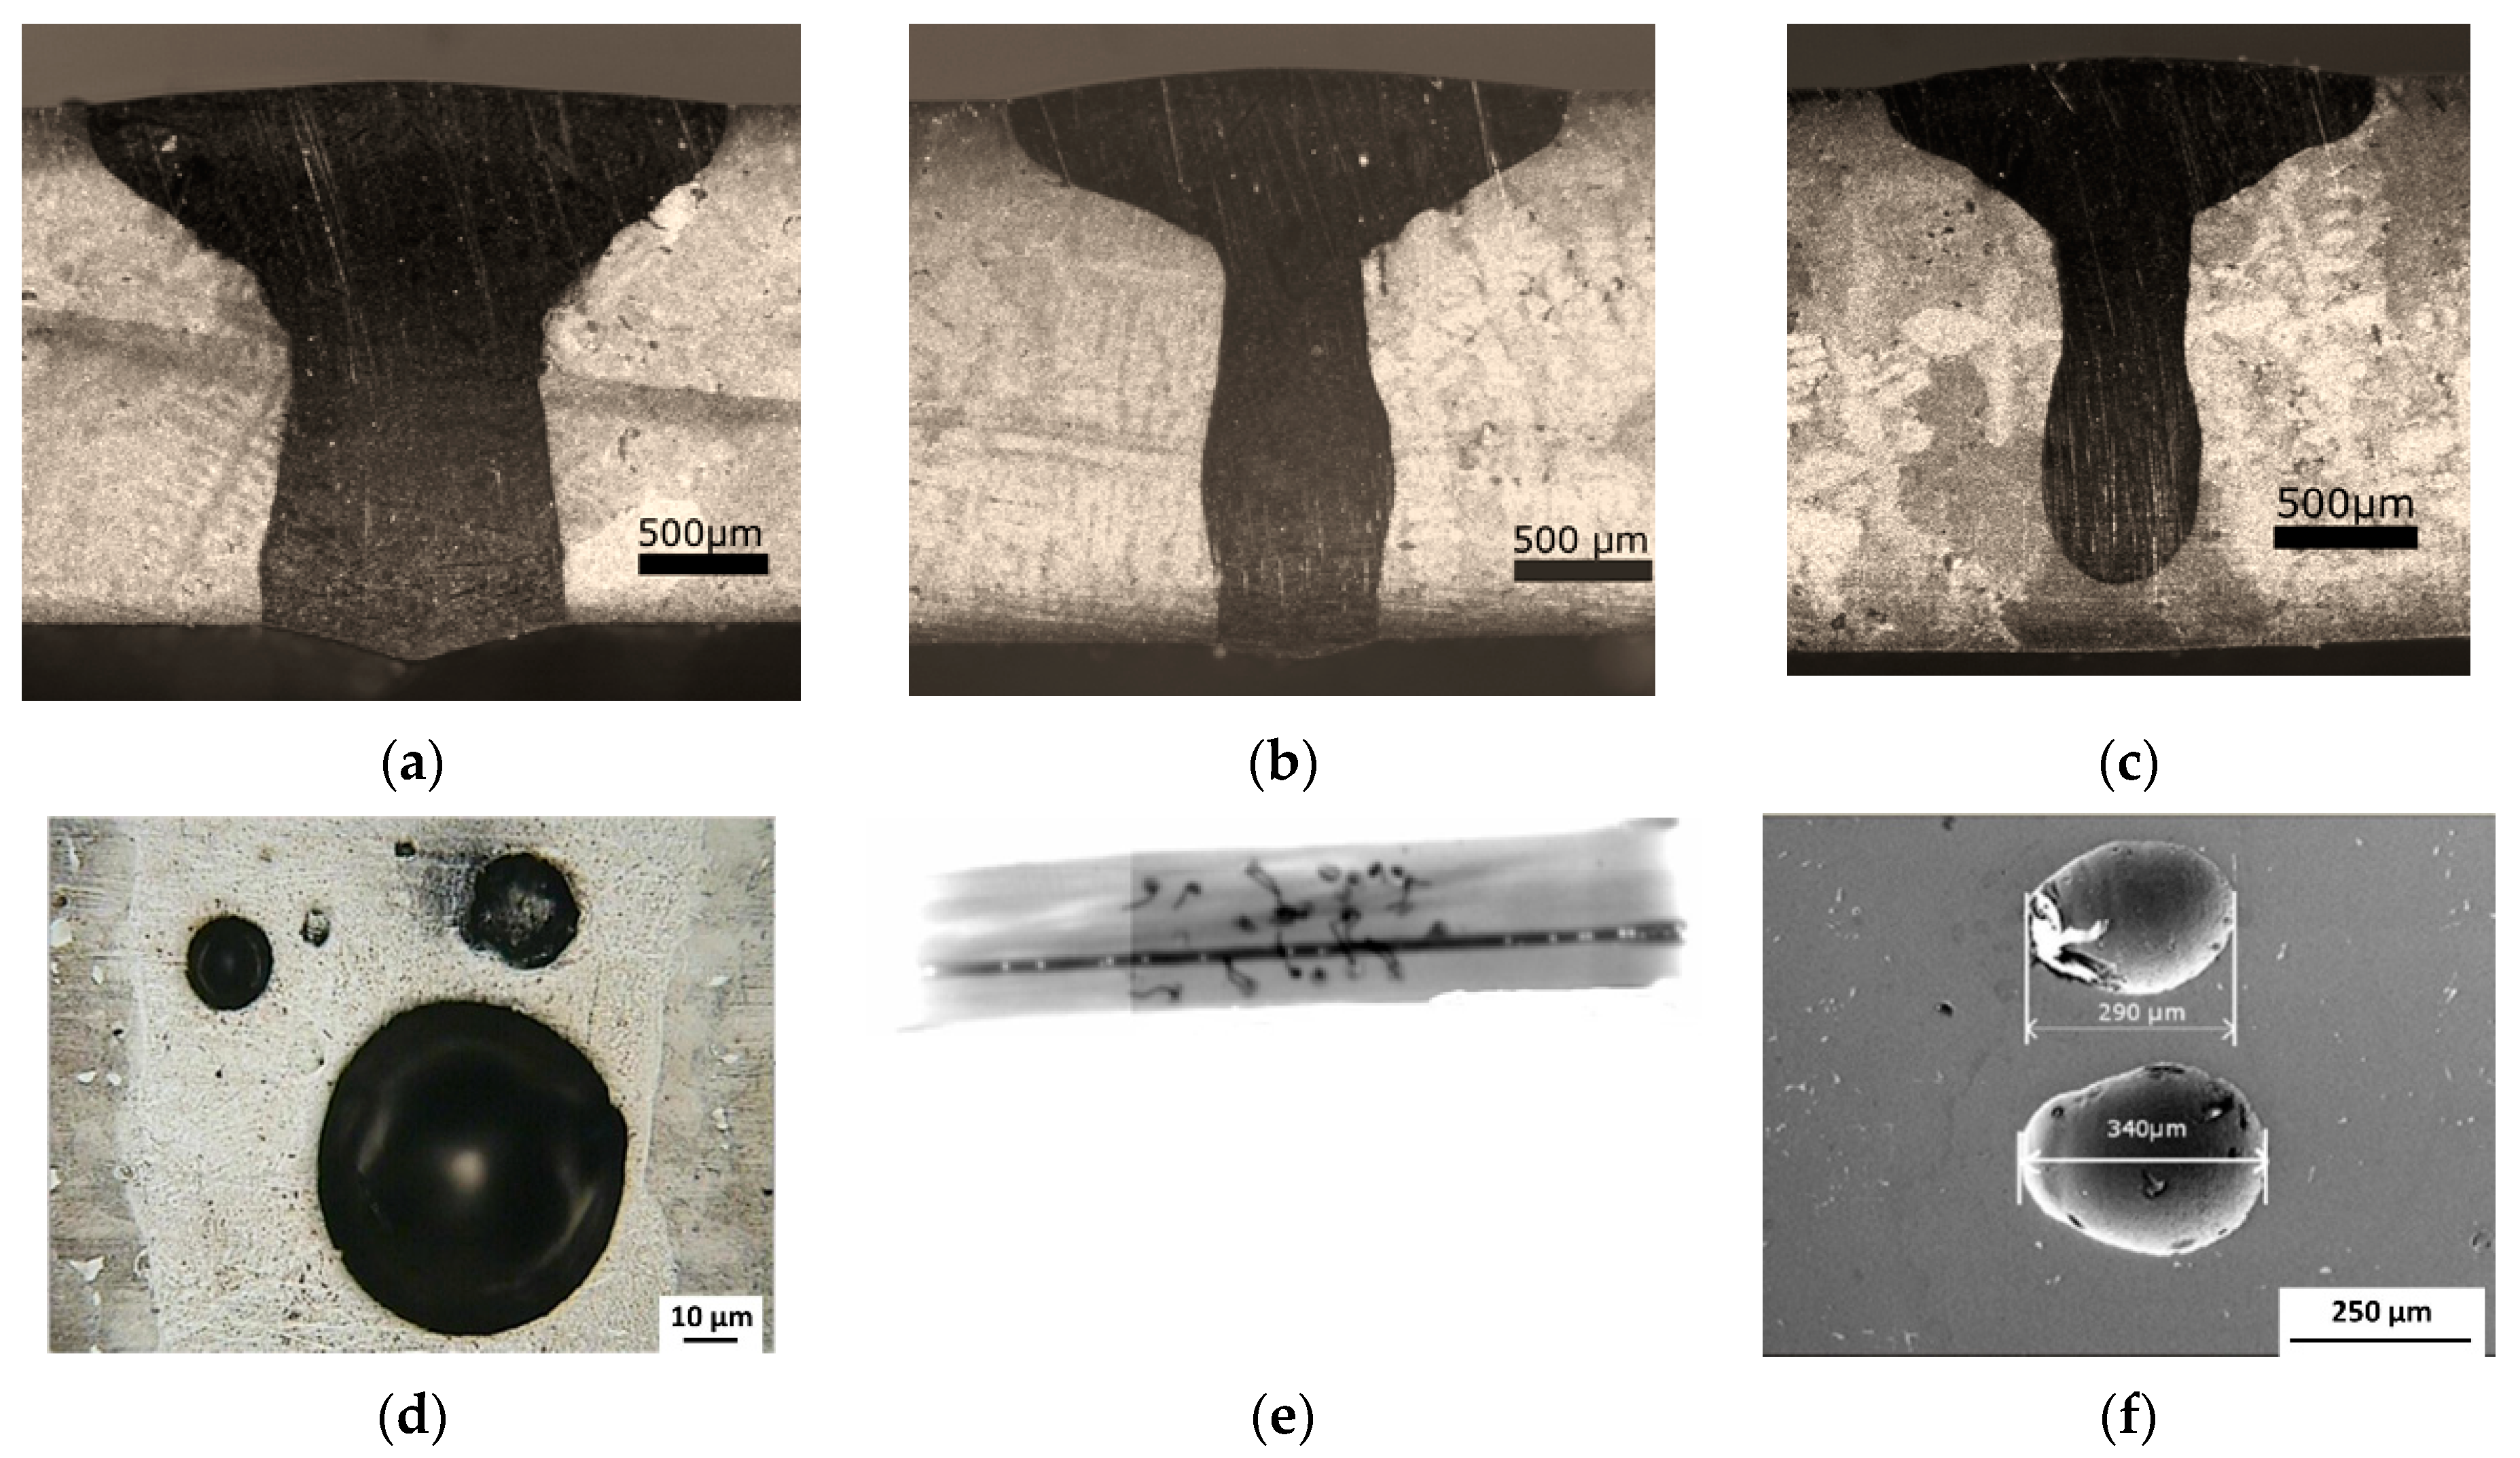
Cross-sections of the L1 welds made with different feed rates V (17, 25, 33 mm s−1) are displayed in Figure 2a–c. All the samples are free from solidification cracks. In the case of the lower feed rates (17 and 25 mm s−1), the seams (a and b) exhibit a complete penetration of the plate, whereas only a partial penetration is observed for V = 33 mm s−1 (c). The aspect ratio p/w (ratio between the penetration depth p and maximum width w) resulted in being 0.8 for L1-A, 1.0 for L1-B and 0.9 for L1-C, values quite low for keyhole seams. Some porosity (bright zones) along the seams has been evidenced by radiographic images, LM and SEM observations. Figure 2d–f shows pores of a large size in samples L1-A (d) and L1-B (e, f); the rounded shape suggests that they originate from gas present in the molten pool remaining trapped during metal solidification.
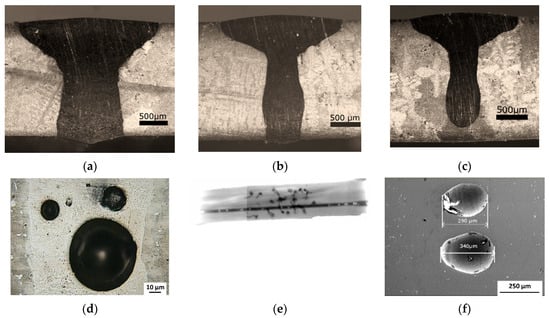
Figure 2.
Cross-sections of the L1 welds made with different feed rate V: 17 mm s−1 L1-A (a), 25 mm s−1 L1-B (b) and 33 mm s−1 L1-C (c). The seams exhibit a complete penetration of the plate with the lower feed rates (a,b) whereas it is only partial for V = 33 mm s−1 (c). Porosity observed in samples L1-A (d) and L1-B (e,f). Figure 2e is a radiographic image of sample L1-B.
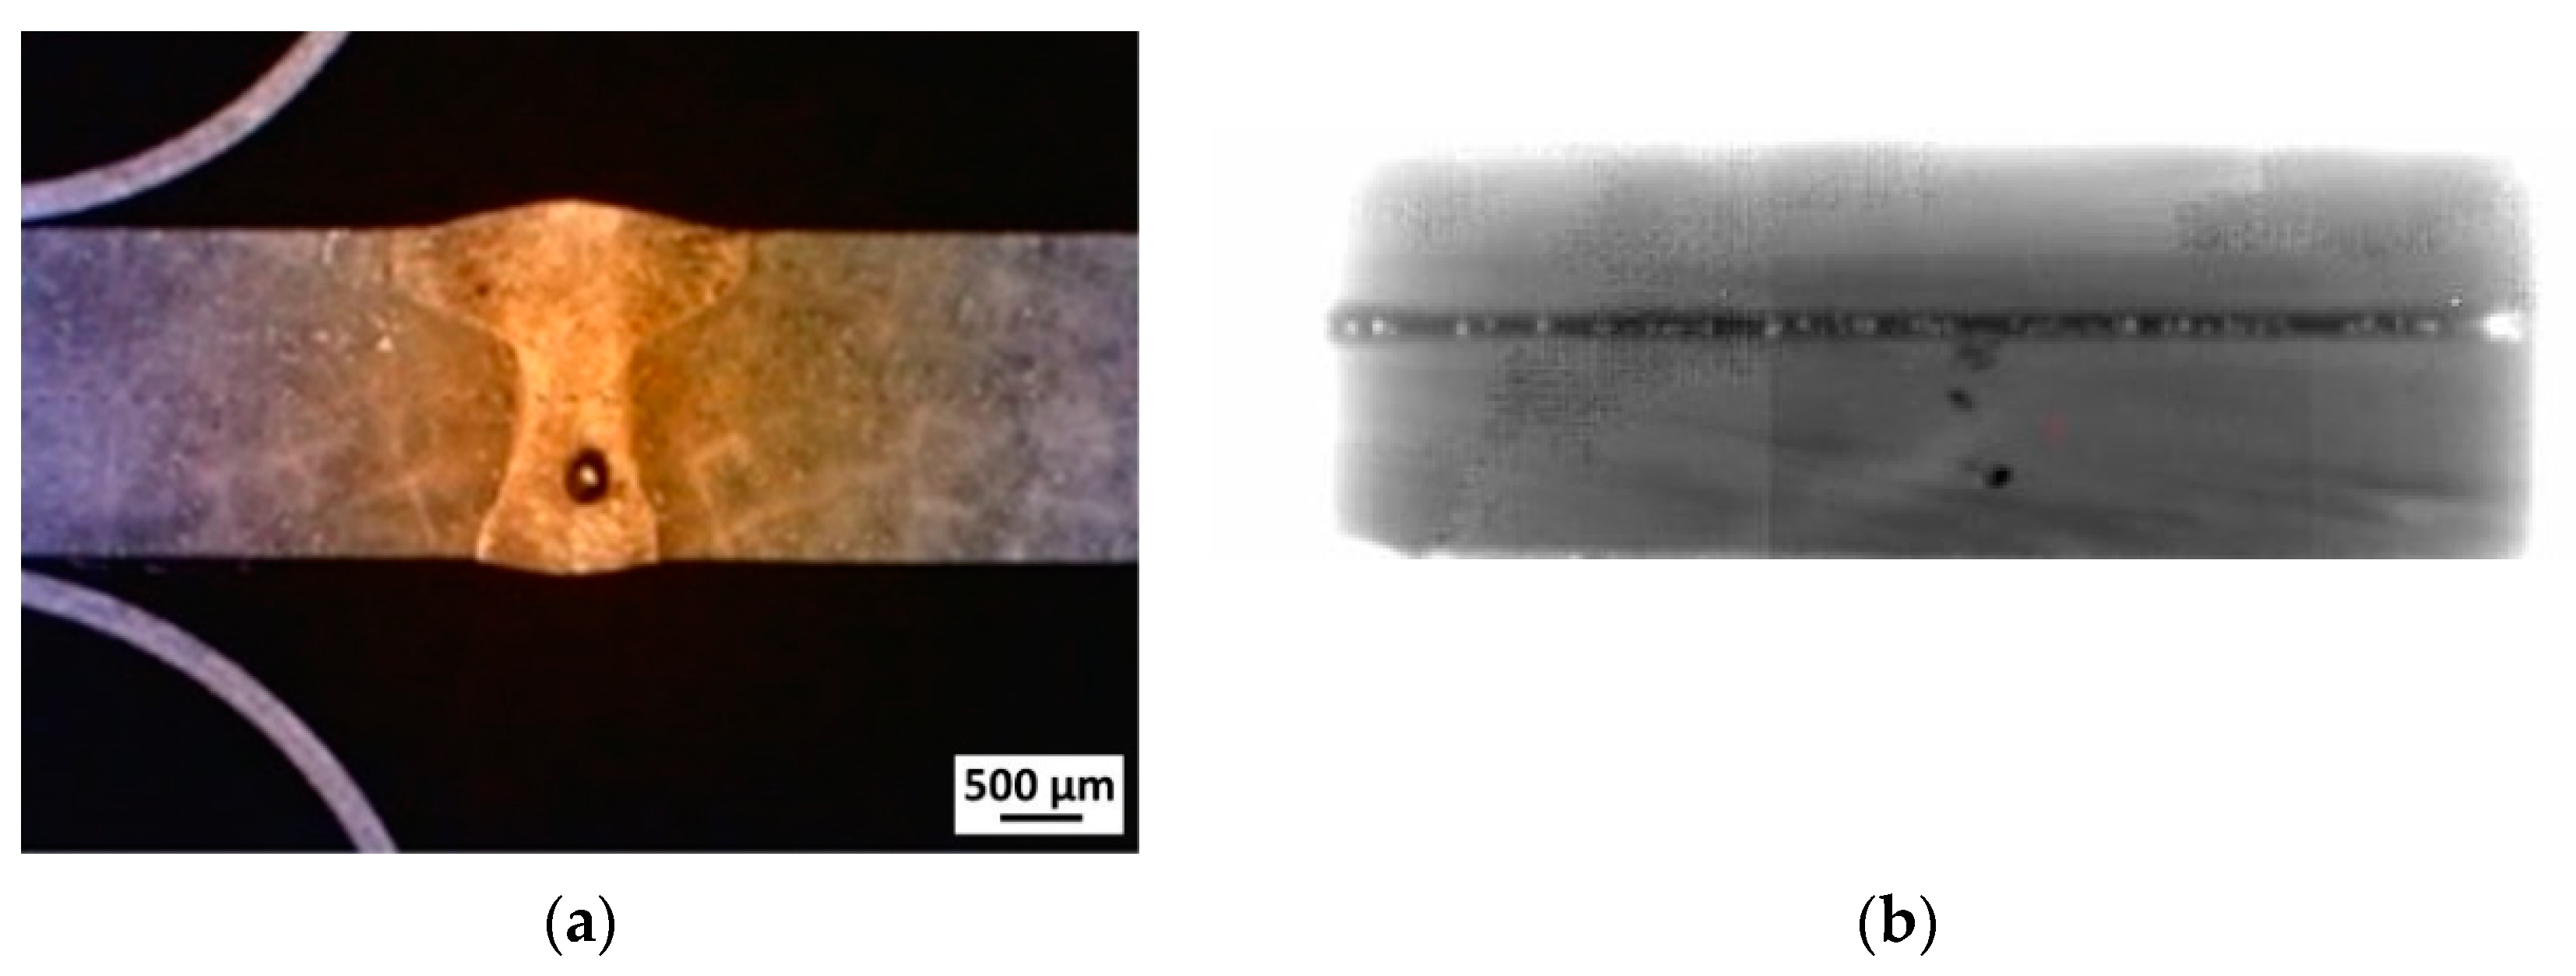
Welds made by using a wobbling laser beam (L2 samples) exhibit complete penetration of the plate and a 2 mm wide seam (Figure 3a). With respect to L1 samples, they show a better superficial aspect; however, also in this case, radiography in Figure 3b evidenced relevant porosity along the seam.
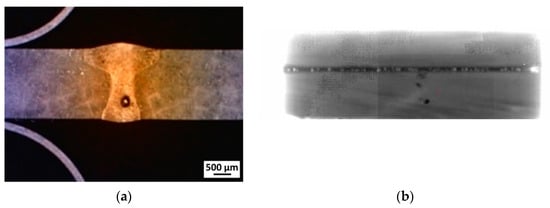
Figure 3.
Cross-section of a L2 weld made by using a wobbling laser beam (a). The weld penetration of the plate is complete. The radiographic image in (b) shows a number of pores along the seam (bright zones).
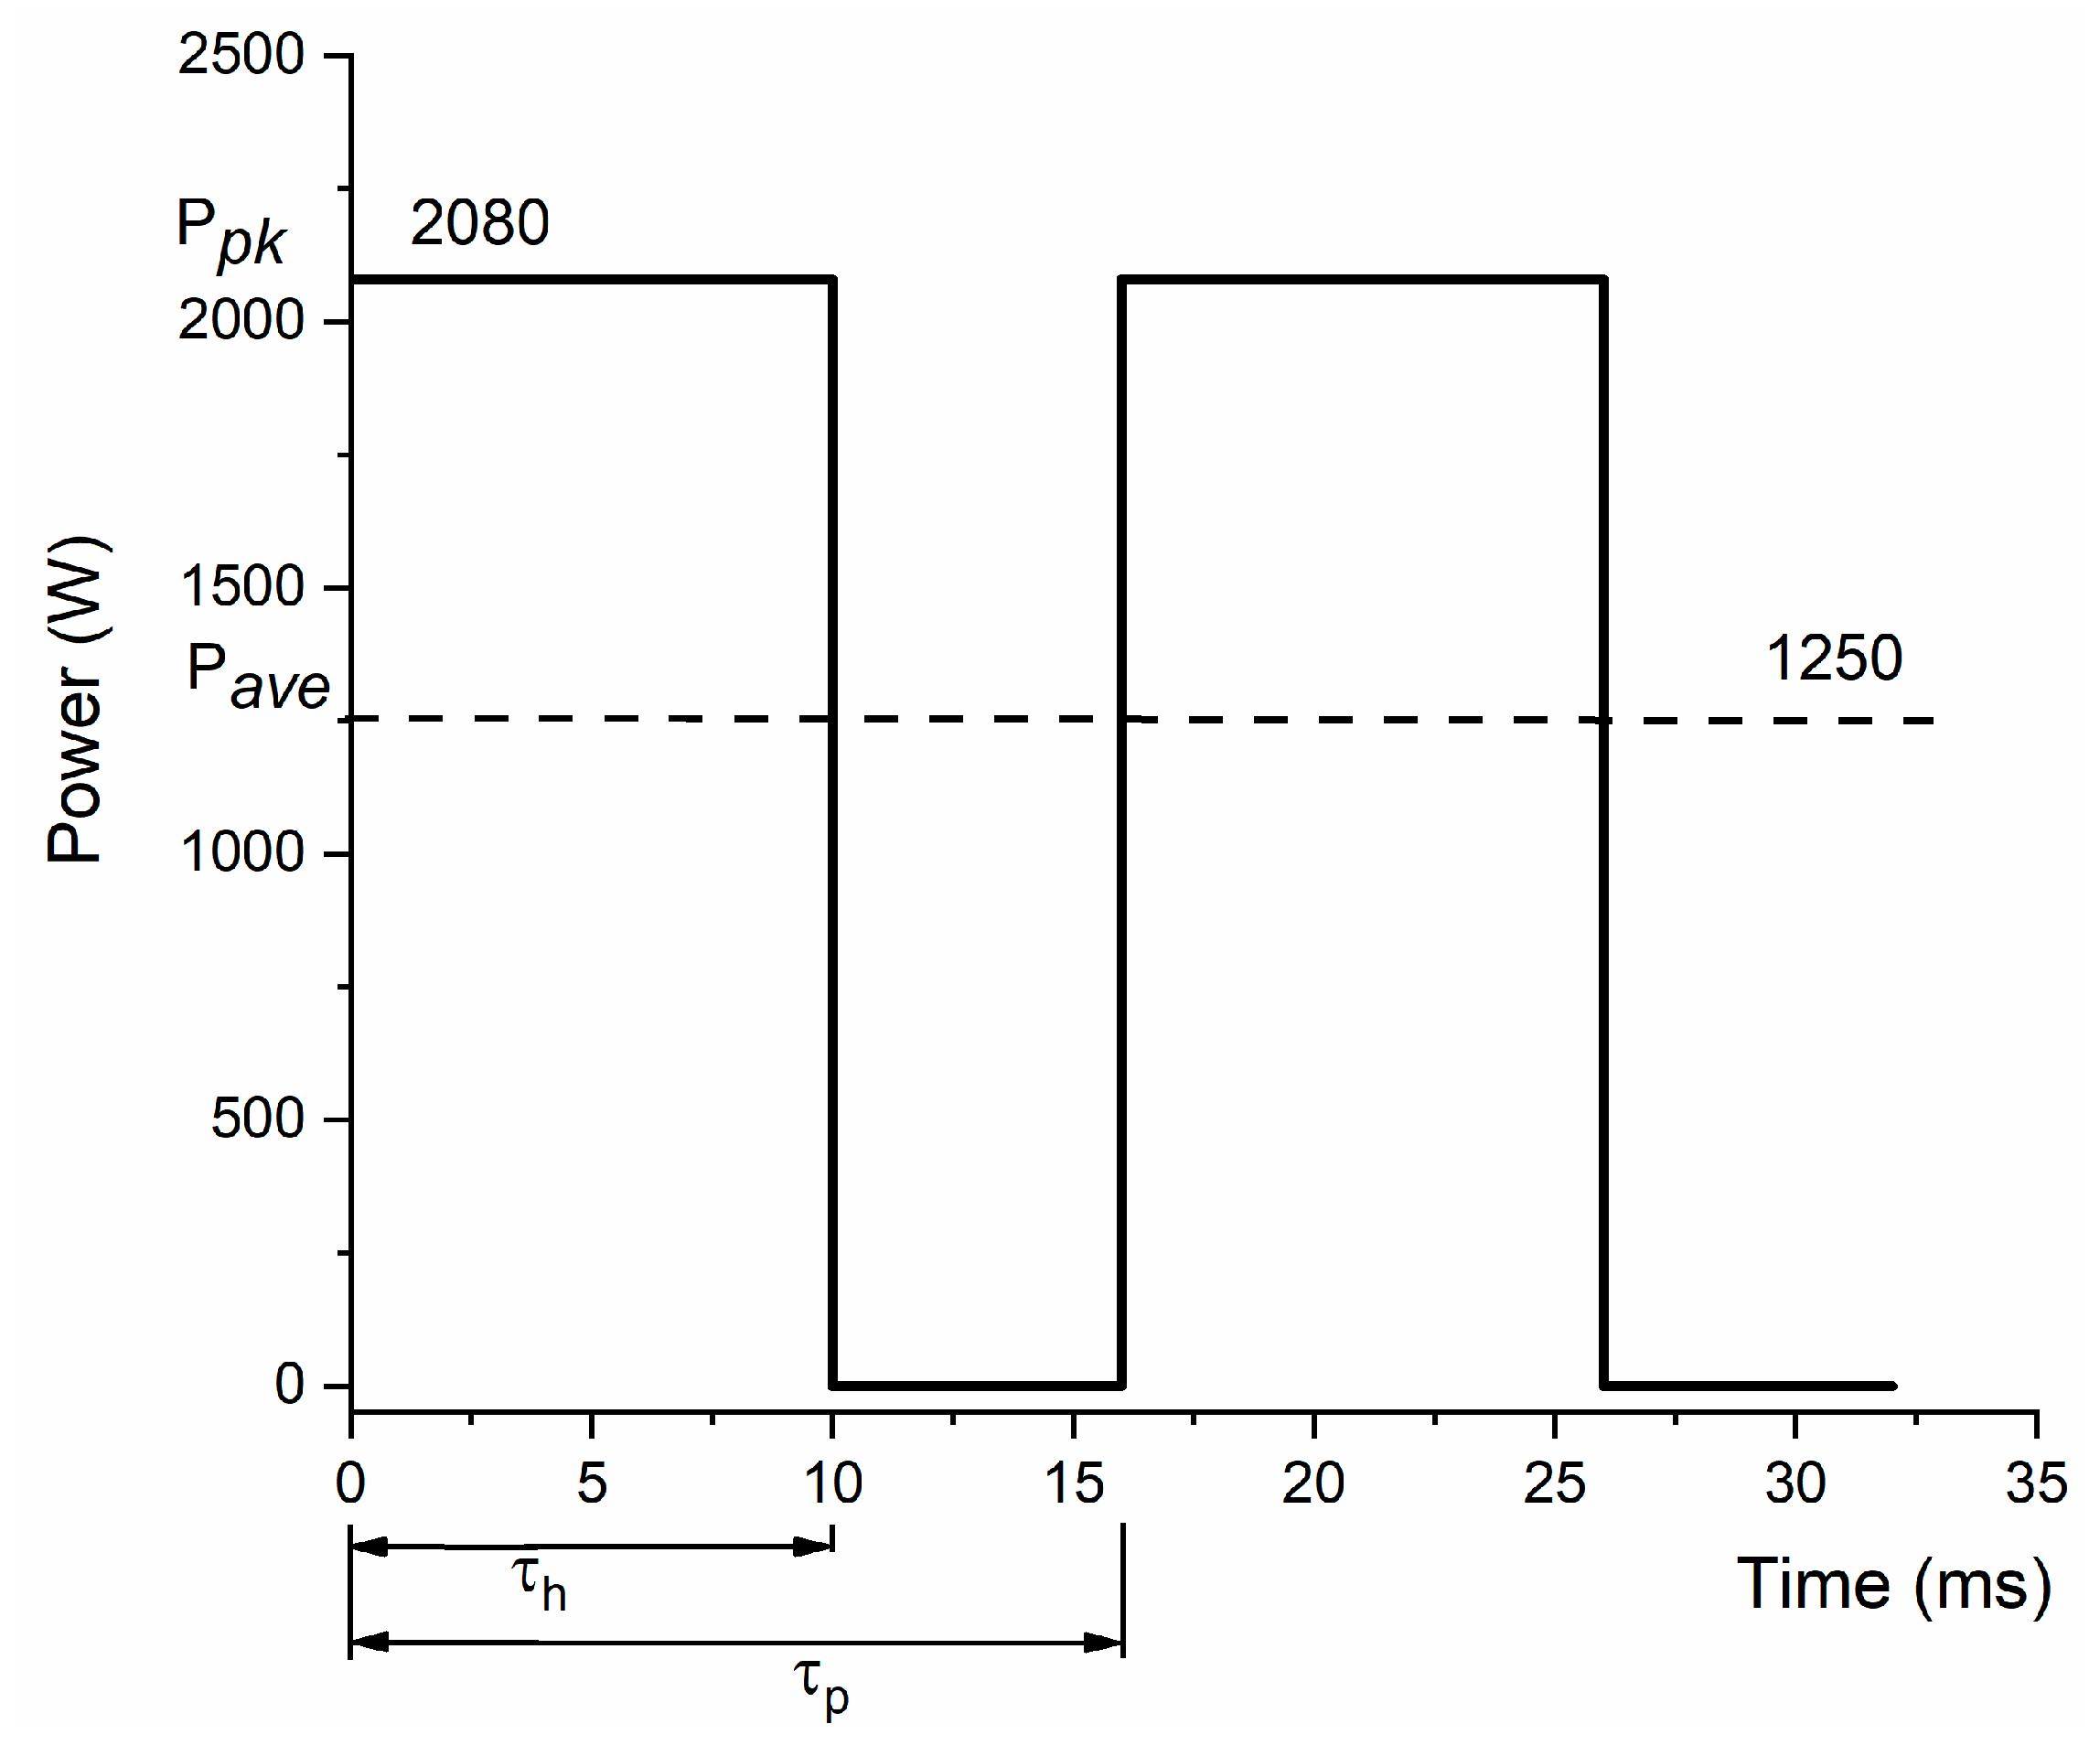
Owing to the significant porosity present in both L1 and L2 joints, these LW procedures give unsatisfactory results. Therefore, for L3 samples, a pulsed laser beam was used to reach a higher instantaneous intensity [30,31,32]. Laser pulses are schematically shown in Figure 4 and the process parameters are reported in Table 2. Ppk = 2080 W, Pave = 1250 W, τh = 10 ms and τp = 16 ms are the maximum and average power, the pulse duration and the time between two successive pulses, respectively. In the experiments, a frequency f = 60 Hz and a duty cycle (DC) of the rectangular beam of ~60% were adopted.
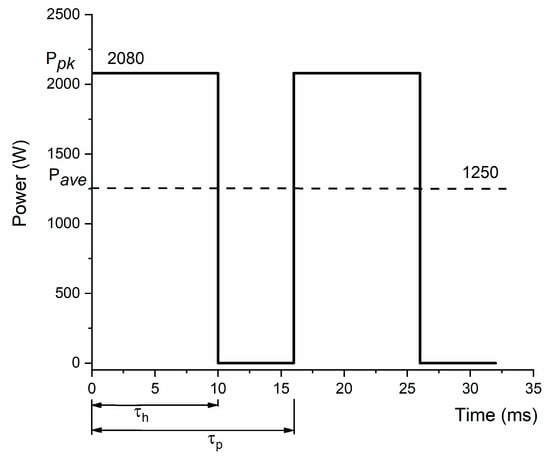
Figure 4.
Schematic view of power vs. time in pulsed laser welding.
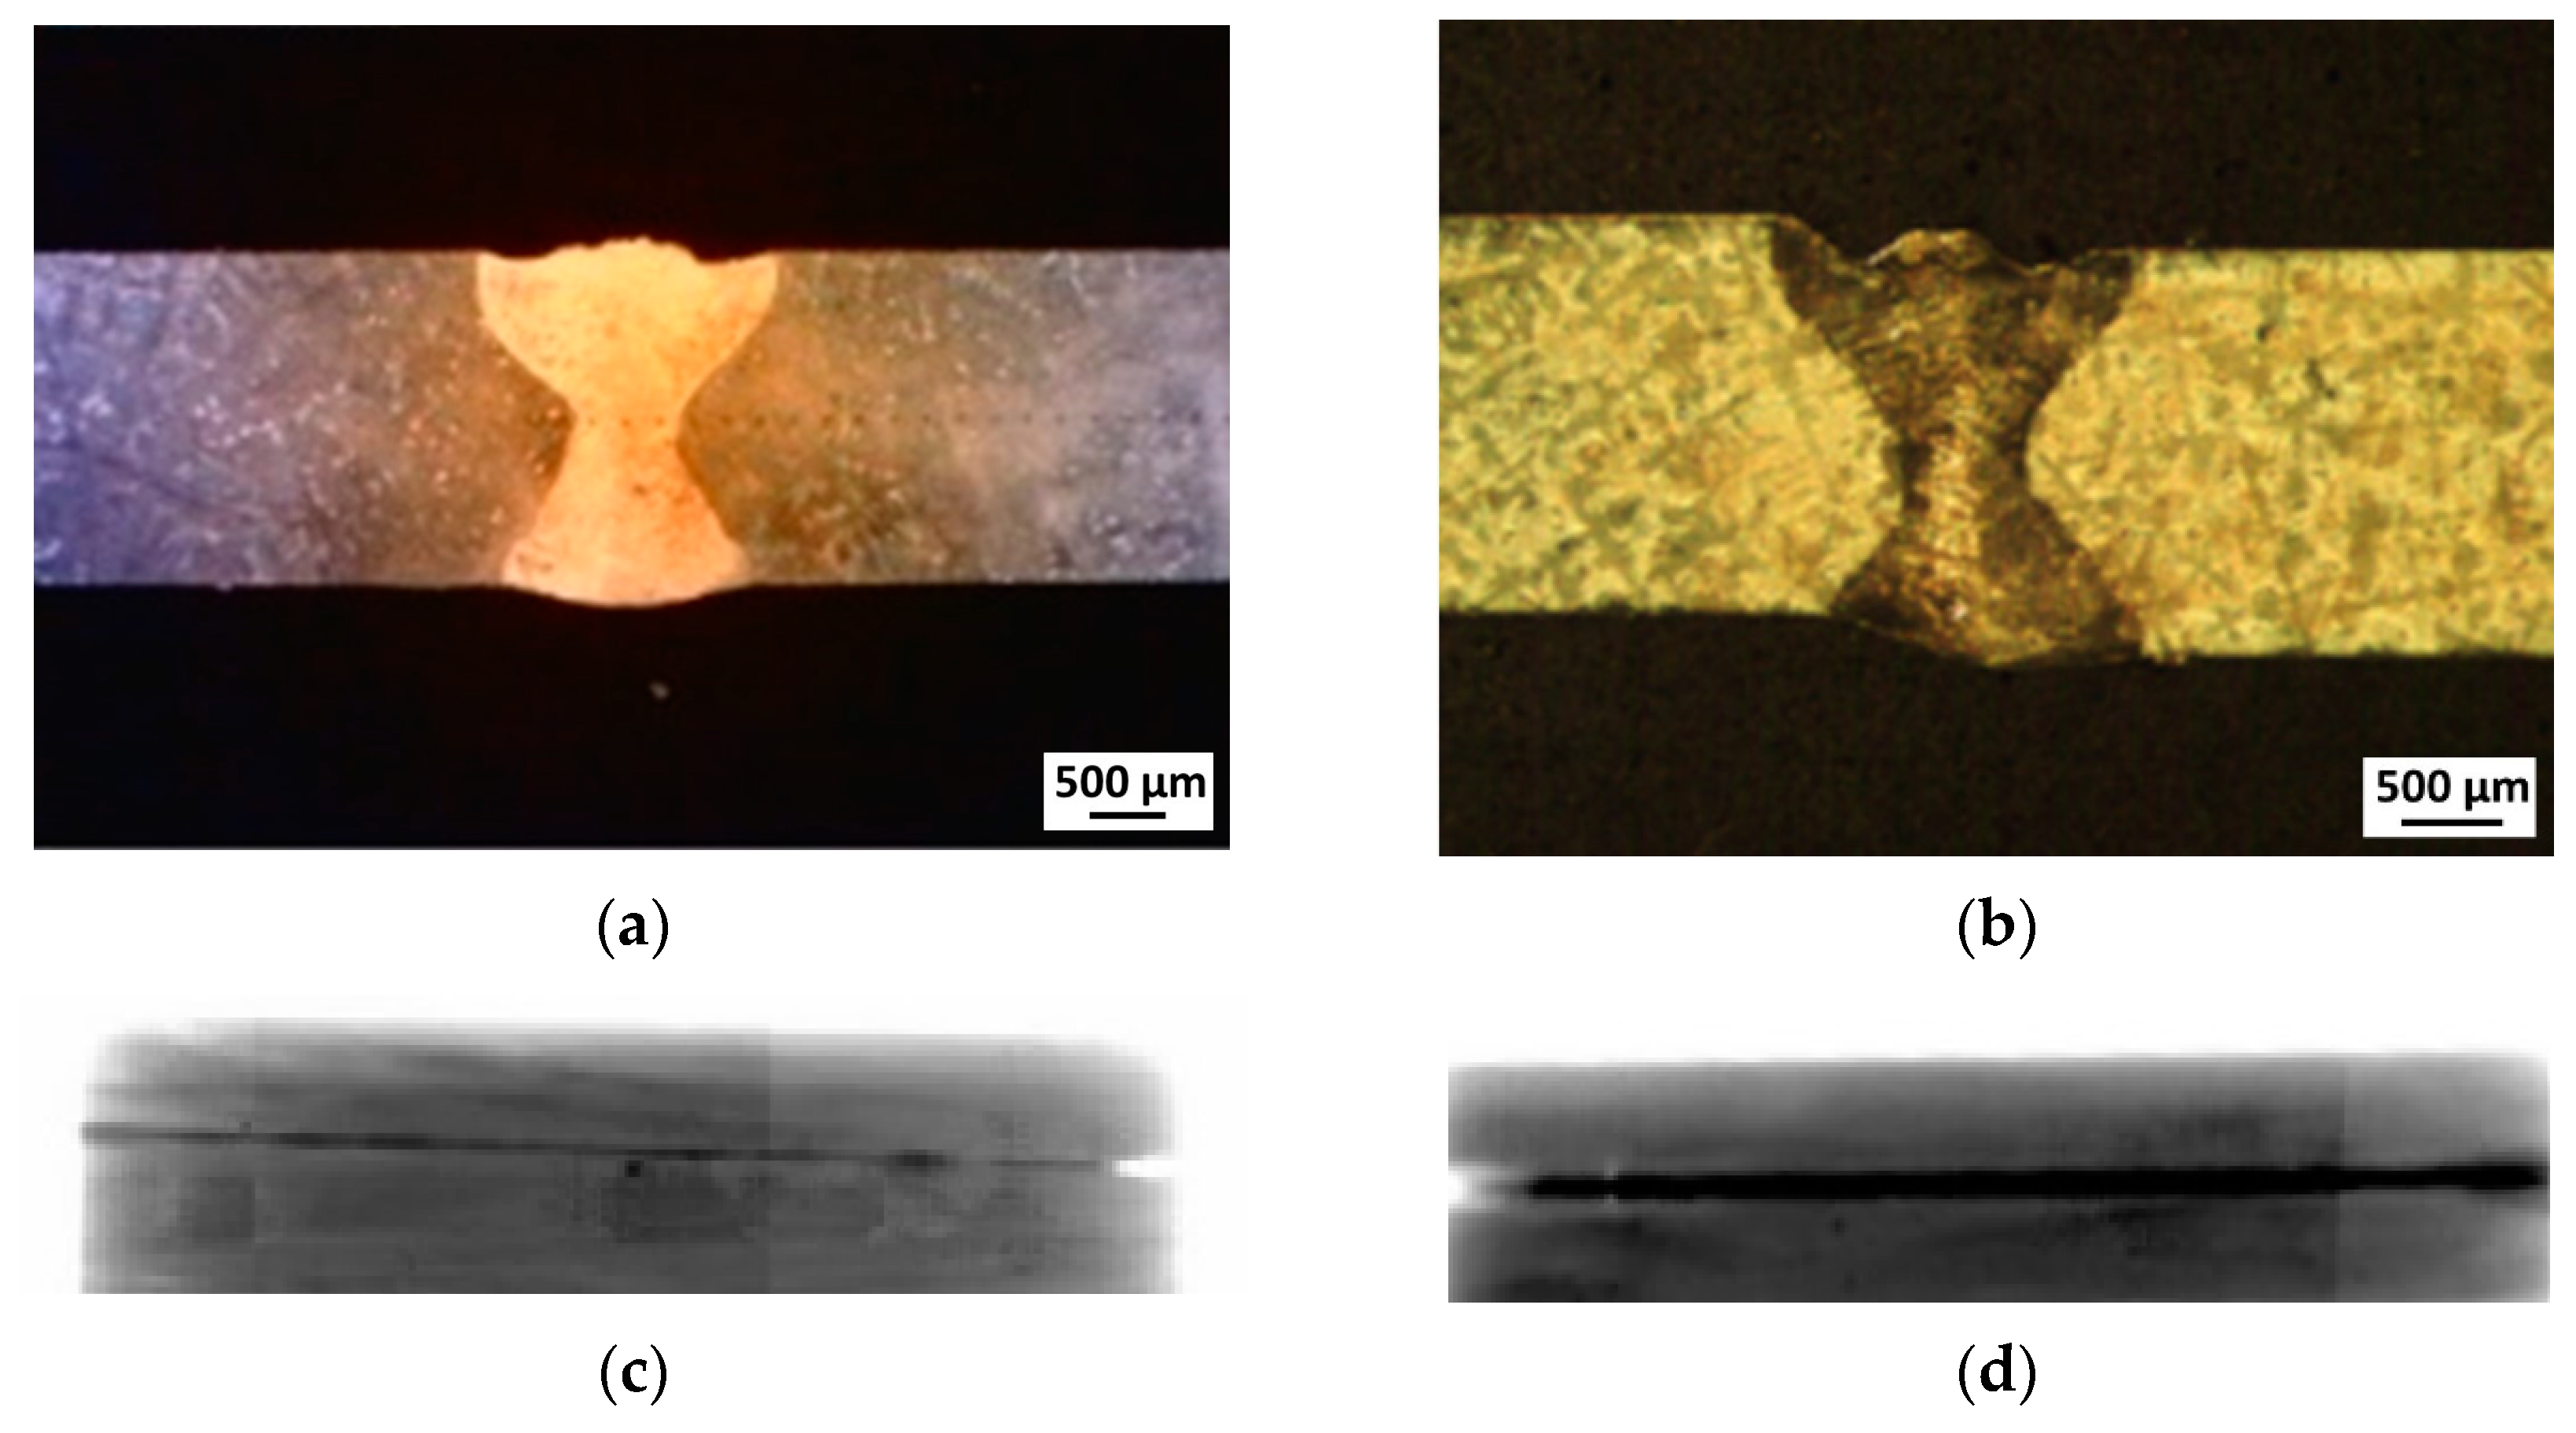
Moreover, in order to simulate a repair of a defect, a butt welding of two pieces with straight milled edges (L4 samples) has been performed by using the same parameters of L3 samples. Figure 5 shows the cross-sections of L3 and L4 welds and the respective digital XR examinations.
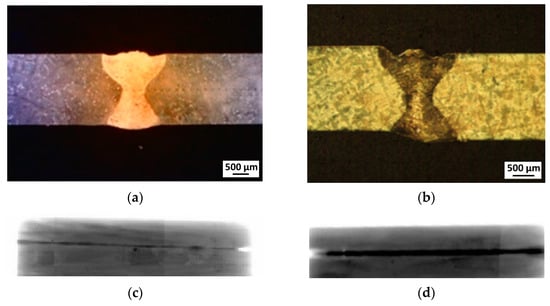
Figure 5.
L3 (a) and L4 (b) cross-sections and radiographies of the joints, (c,d) respectively. The weld penetration of the plate is complete and no pores can be observed along the seams.
In both L3 and L4 joints, the welding seam shows an hour-glass shape index of better heat distribution during the LW. The welding bead is ~1.5 mm wide and no cracks and macro-porosity were revealed by radiographic images. The aspect ratios p/w are also good: 1.2 and 1.1 for L3 and L4 welds, respectively.
The different results obtained by using a pulsed laser beam can be explained by considering that the presence of pores in the seam is a quite complex process involving both the formation of bubbles in the melt pool and their capability to be released before the complete solidification of the metal. There are many works in the literature, based on experiments [33] and computational fluid dynamics simulations [34,35], treating these aspects. Indeed, pulsed laser allows to obtain welds without porosity because it accelerates fluid flow within the melt pool and facilitates the escape of bubbles. In the case of pulsed laser, the porosity reduction depends on turbulent Marangoni flow, ultrasonic and shock waves into the melt pool [36]. These conditions are not obtained by continuous or wobbling laser beam.
Since L1 and L2 procedures cannot be accepted due to the relevant porosity in the seams, further analyses have been carried out only on the samples L3 and L4.
3.2. Microstructural and Mechanical Characterization of Welds
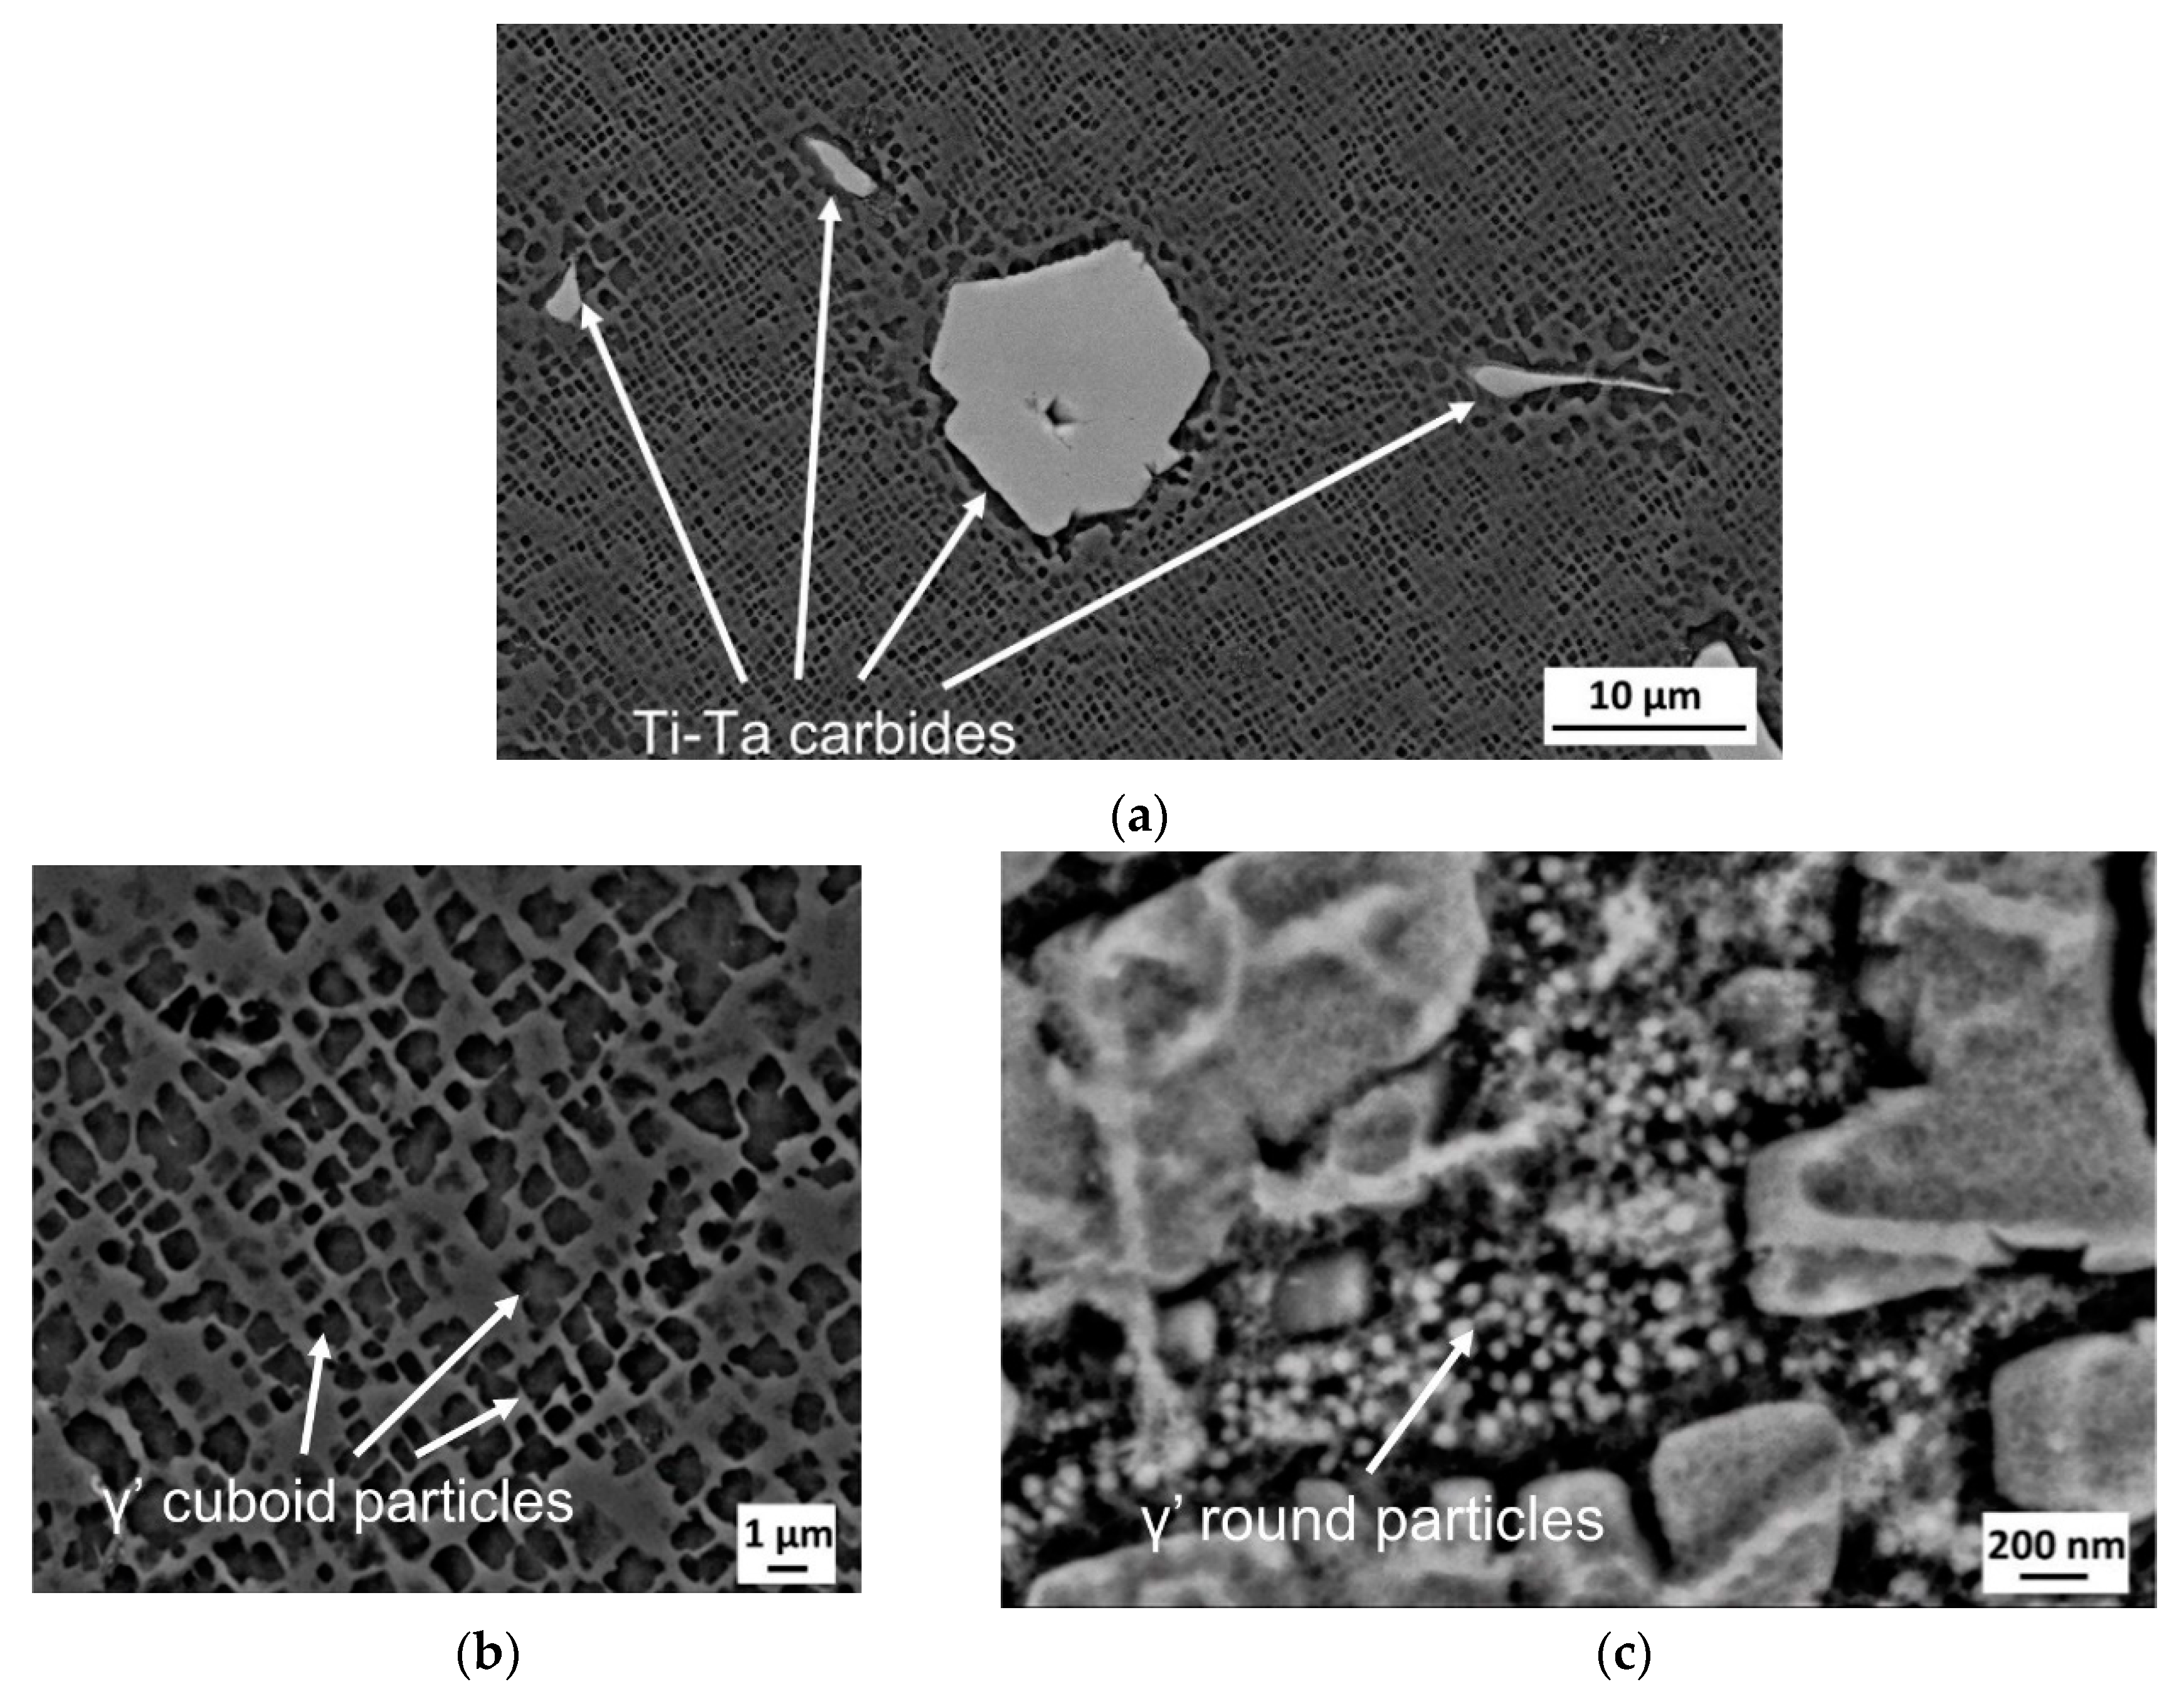
SEM images in Figure 6 show the BM structure in an L3 sample that mainly consists of ordered γ′ phase (dark zones) embedded in the γ matrix (bright zones). Some particles of other compounds with a large size and irregular shape are also observed (a). The total amount of Ti and Ta in these particles exceeds 85 at.%; thus, they have been identified as Ti-Ta carbides [28]. Their morphology depends on the initial solidification rate (~15 mm s−1). According to Sun et al. [37], who studied the carbide precipitation in IN792 DS, Chinese script carbides evolve into faceted carbides when the solidification rate decreases from 50 to 5 mm s−1. In the present case, carbide morphology represents an intermediate stage of this transformation.
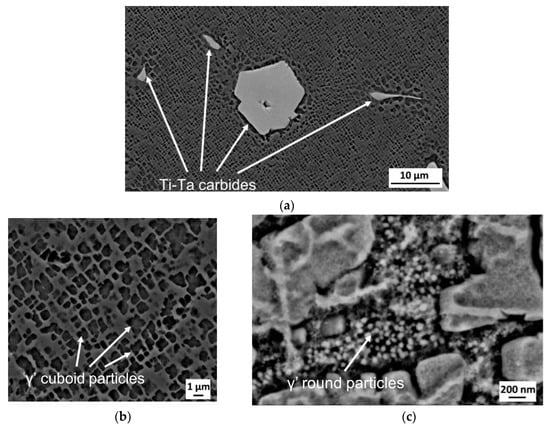
Figure 6.
SEM micrographs of base metal (BM) of a L3 sample (a). Ti-Ta carbides have a large size and irregular shape. γ′ phase consists of cuboid particles of ~400 nm embedded in the disordered γ matrix (b). γ′ particles, present in the channels, have a round shape and are much finer (10–30 nm) (c).
The particles of the γ′ phase formed during aging at 870 °C exhibit a cuboid shape with a mean size of ~400 nm (b). They are separated by channels of ~50–150 nm where much finer particles (10–30 nm) with a rounded shape are observed (c). This is the γ′ phase formed during cooling of the sample. From the image analysis, the total amount of γ′ phase is about 70%.
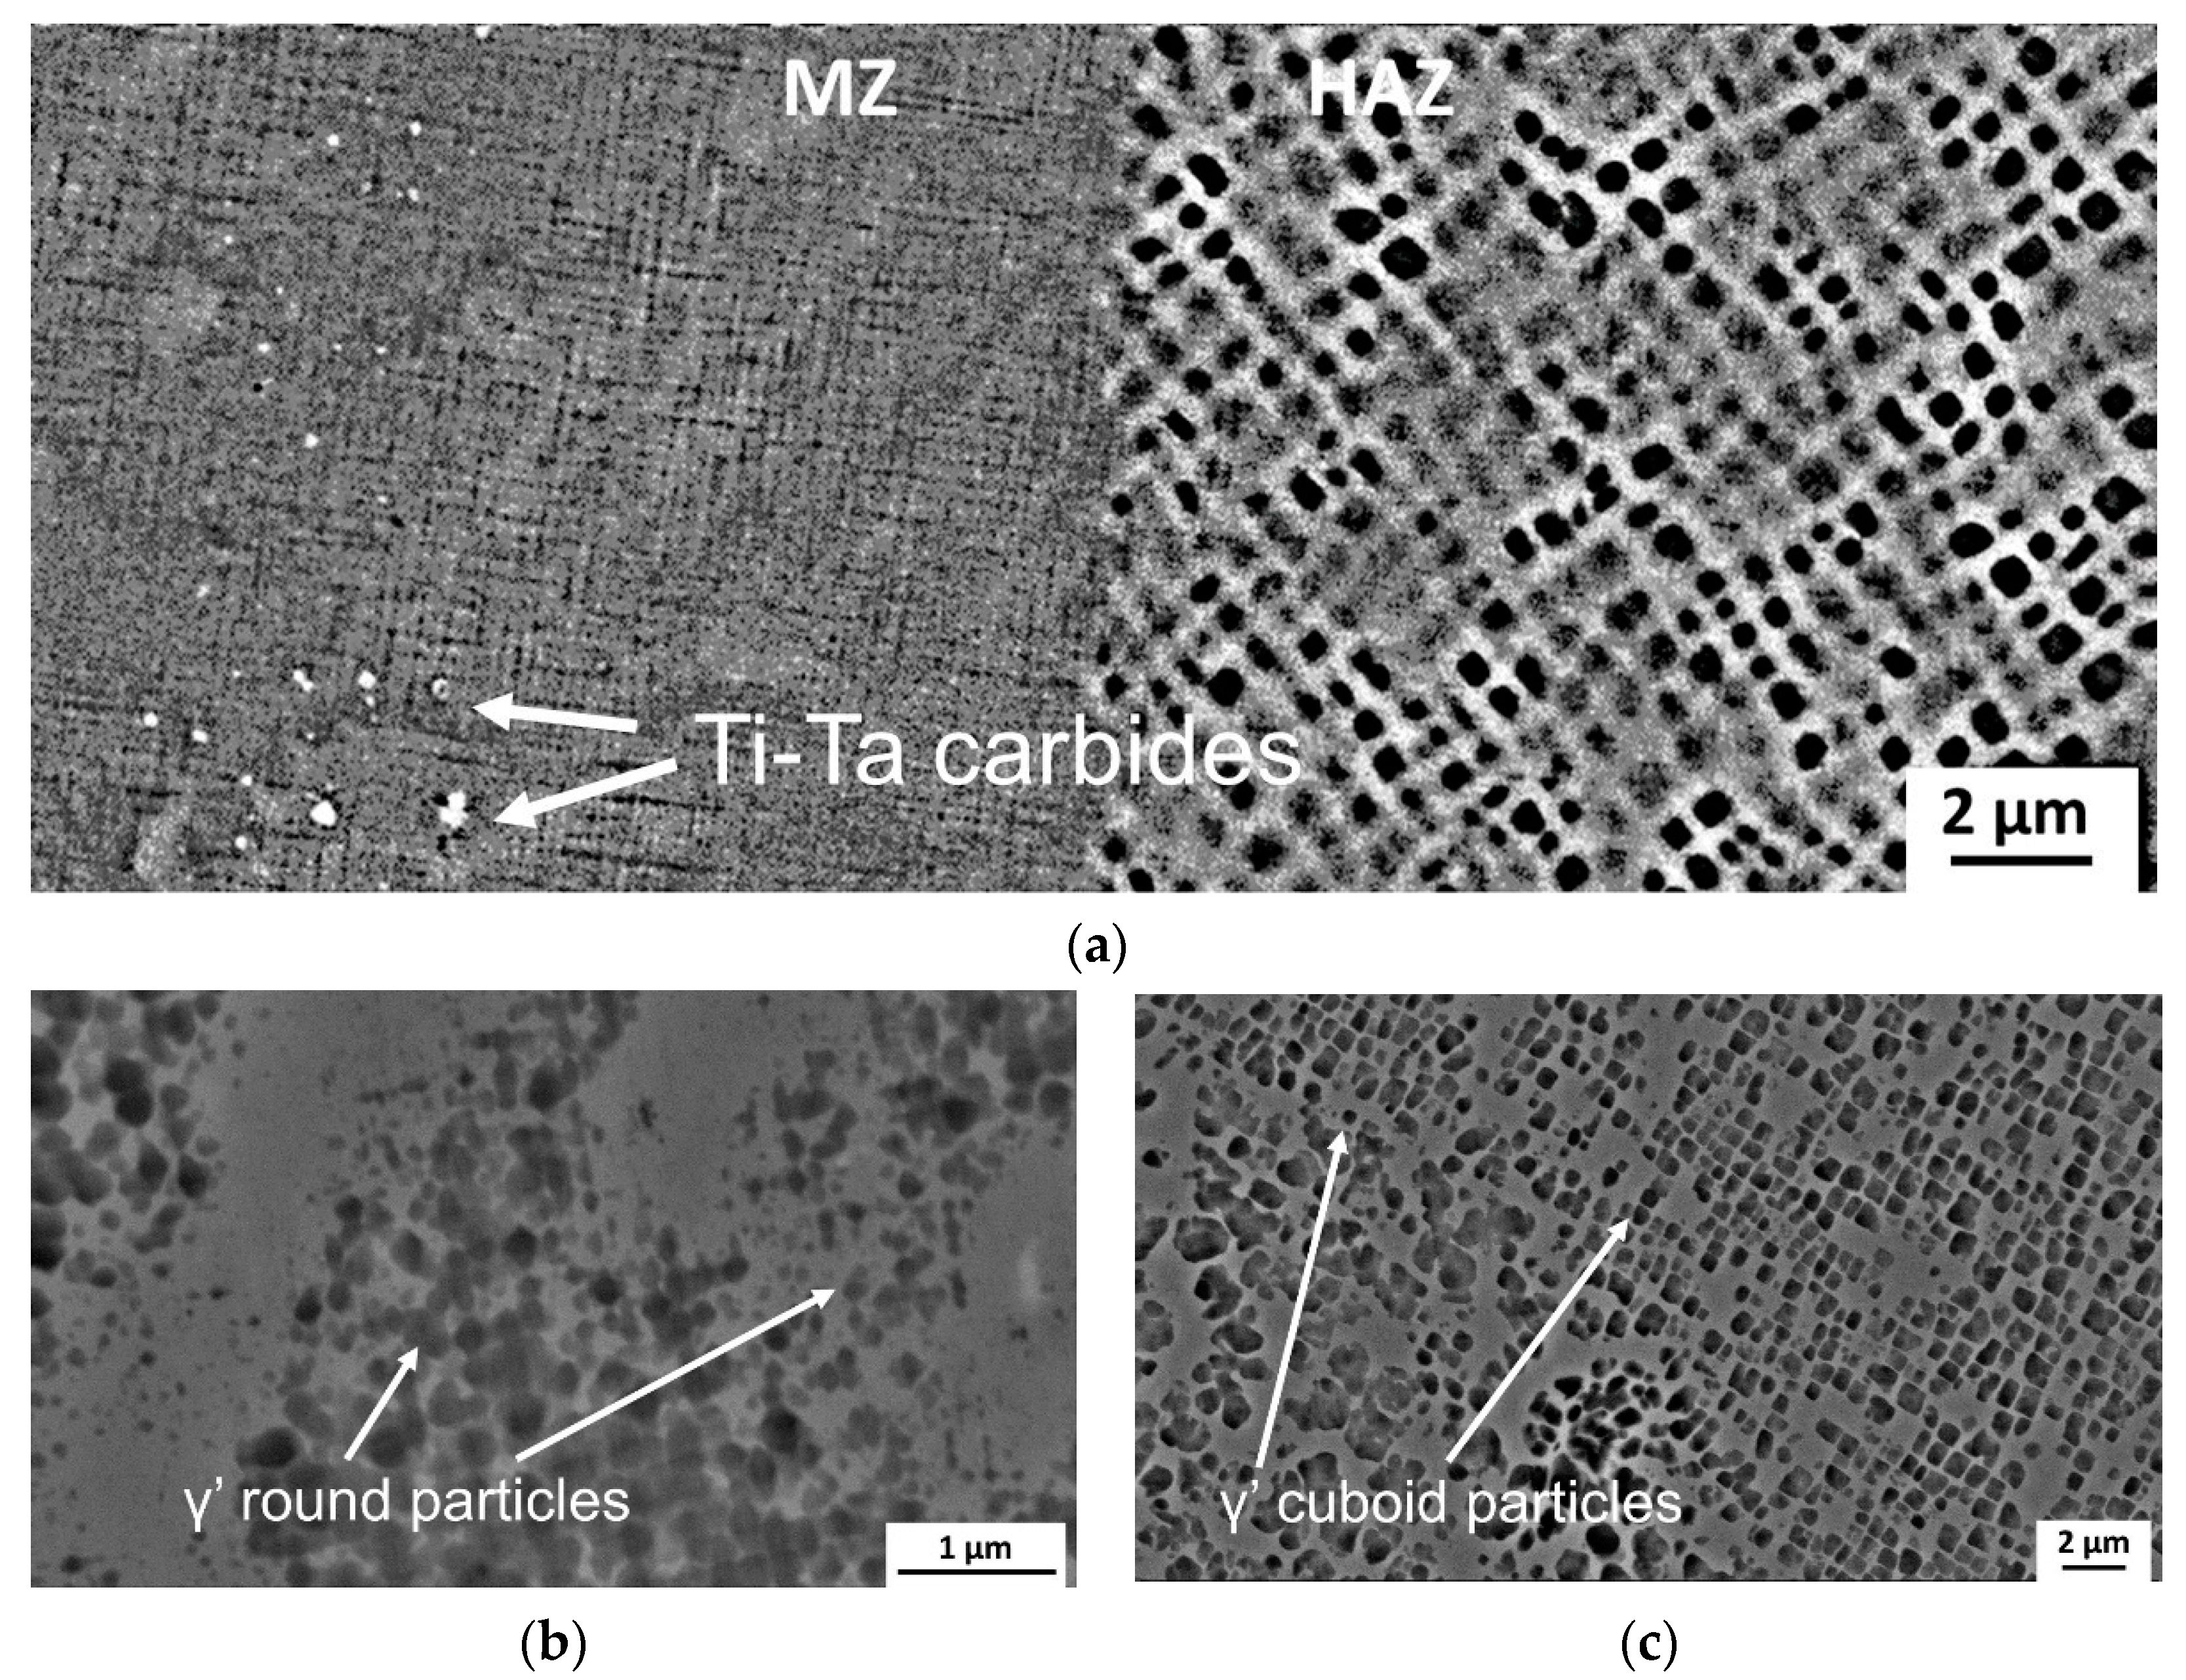
Figure 7a shows the boundary between MZ and HAZ in an L3 sample. The microstructure of MZ is very fine and consists of round particles of 10–30 nm (b). After solidification, the metal in MZ undergoes a rapid cooling and the γ′ particles, which nucleate below solvus (~1120 °C), have a short time to grow, thus their size remains quite small. Some coarsening of γ′ particles occurs in HAZ (c), but their average size does not differ remarkably from that in the BM. Similar microstructural features are observed in the BM, HAZ and MZ of L4 samples.
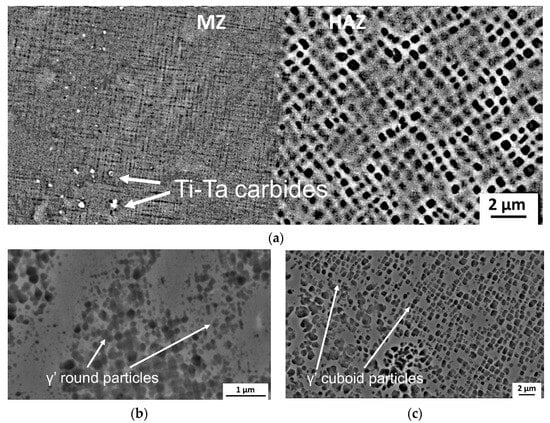
Figure 7.
Boundary between MZ and HAZ of a L3 sample (a). The γ′ particles in the MZ are very fine and of rounded shape, (b) while in HAZ, they have a similar size and shape of those in BM (c).
The rapid cooling of the MZ also affects the size of Ti-Ta carbides, which result in being smaller than those in the BM shown in Figure 6a.
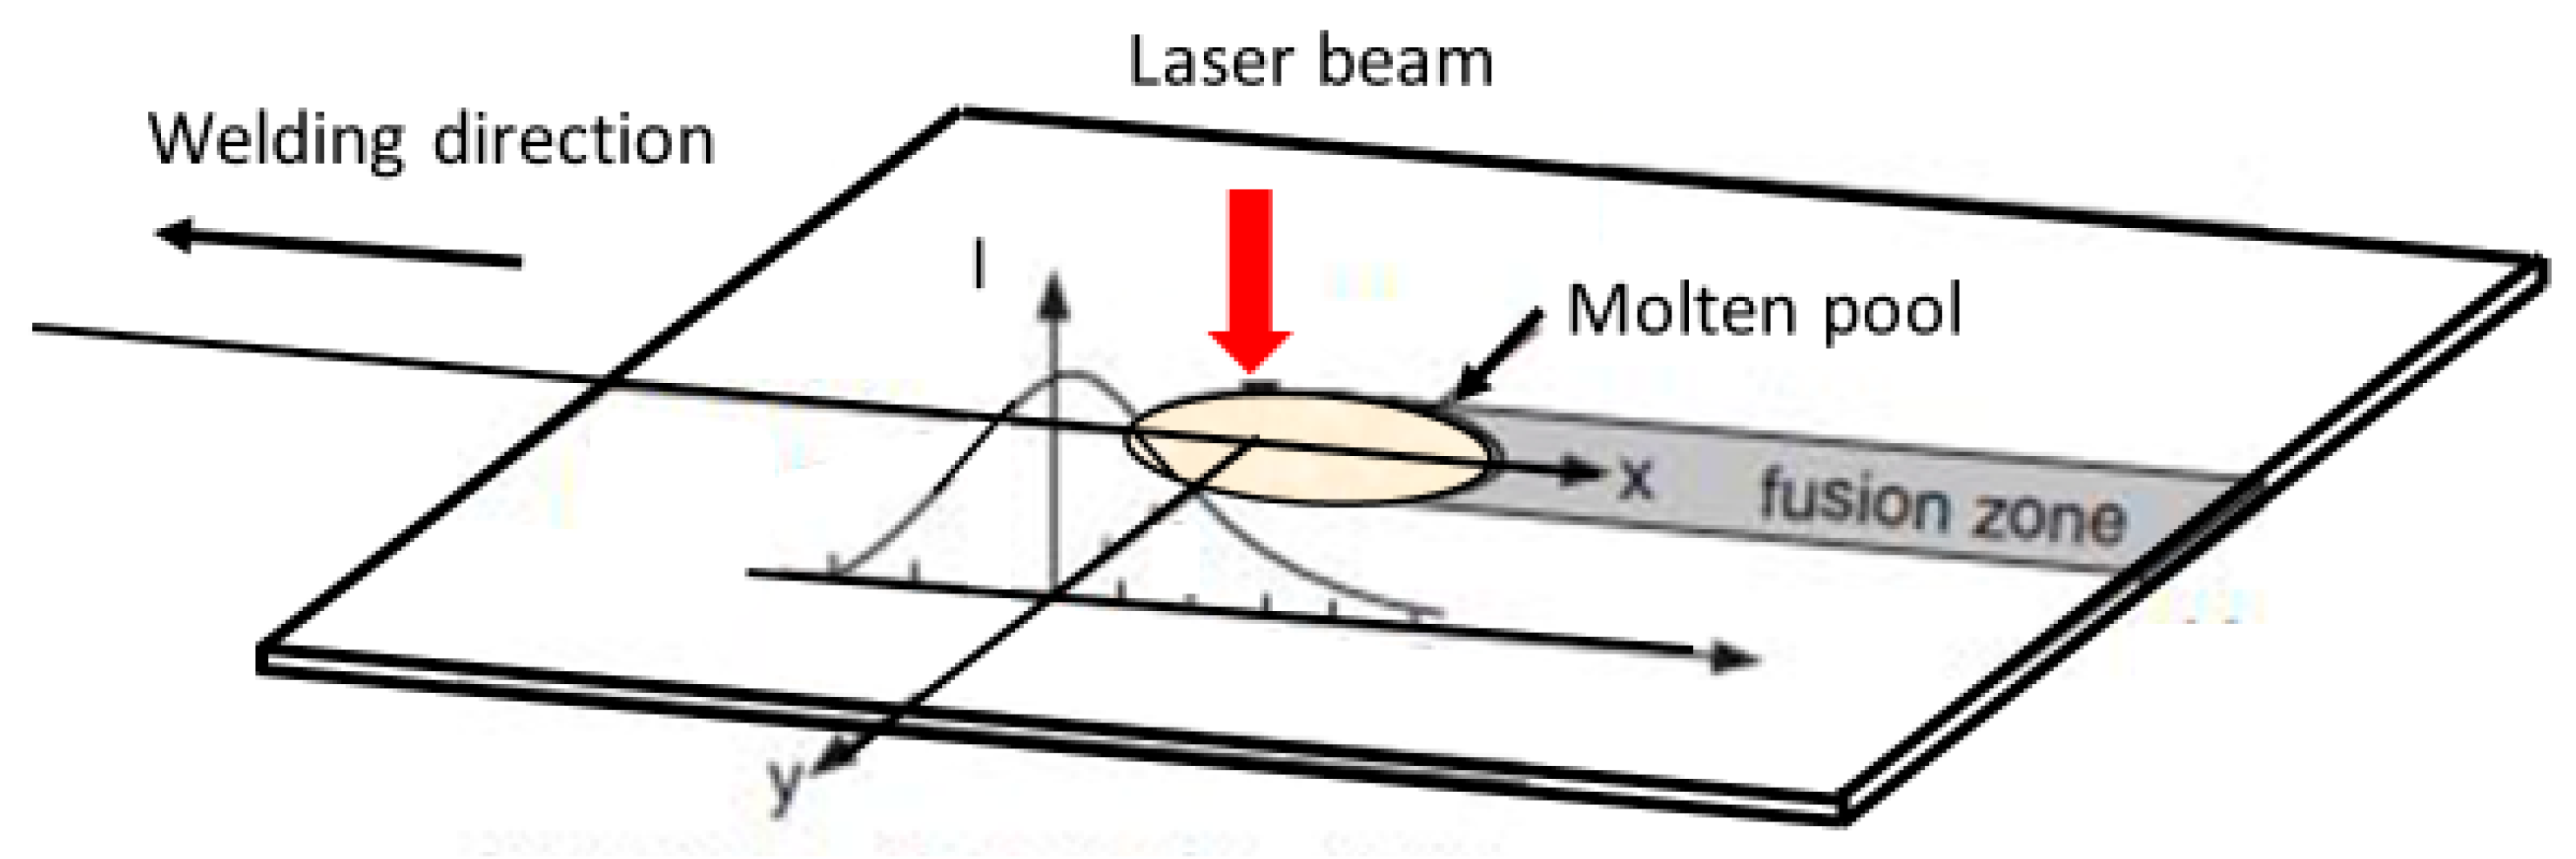
The welding process is schematically displayed in Figure 8. The advancement of the laser beam induces heating of the material all around the molten pool.

Figure 8.
Schematic view of the welding process. The temperature profile depends on the distance y from the seam centre.
By considering a system of mobile coordinates (x-y), the thermal profiles along the x-direction depend on the distance y from the seam. Under the assumption of thermo-physical parameters constant with temperature, the analytical solution of the problem of heat exchange in the examined geometry is given by Rosenthal’s relationship [38]:
where T is the temperature, T0 is the temperature before welding, k is the thermal conductivity, g is the sheet thickness, Q is the transferred power, V is the welding speed, α is the thermal diffusivity, K0 is the modified Bessel function of the second type and zero order, r = (x2 + y2)1/2 the radial distance from the origin. The Adams’ equation [39], obtained from Equation (1) through suitable simplification, gives the peak temperature TP reached in a point p distant yp from the edge of the melt zone:
where ρ, C, and Tm are density, specific heat and melting point of the welded metal, respectively.
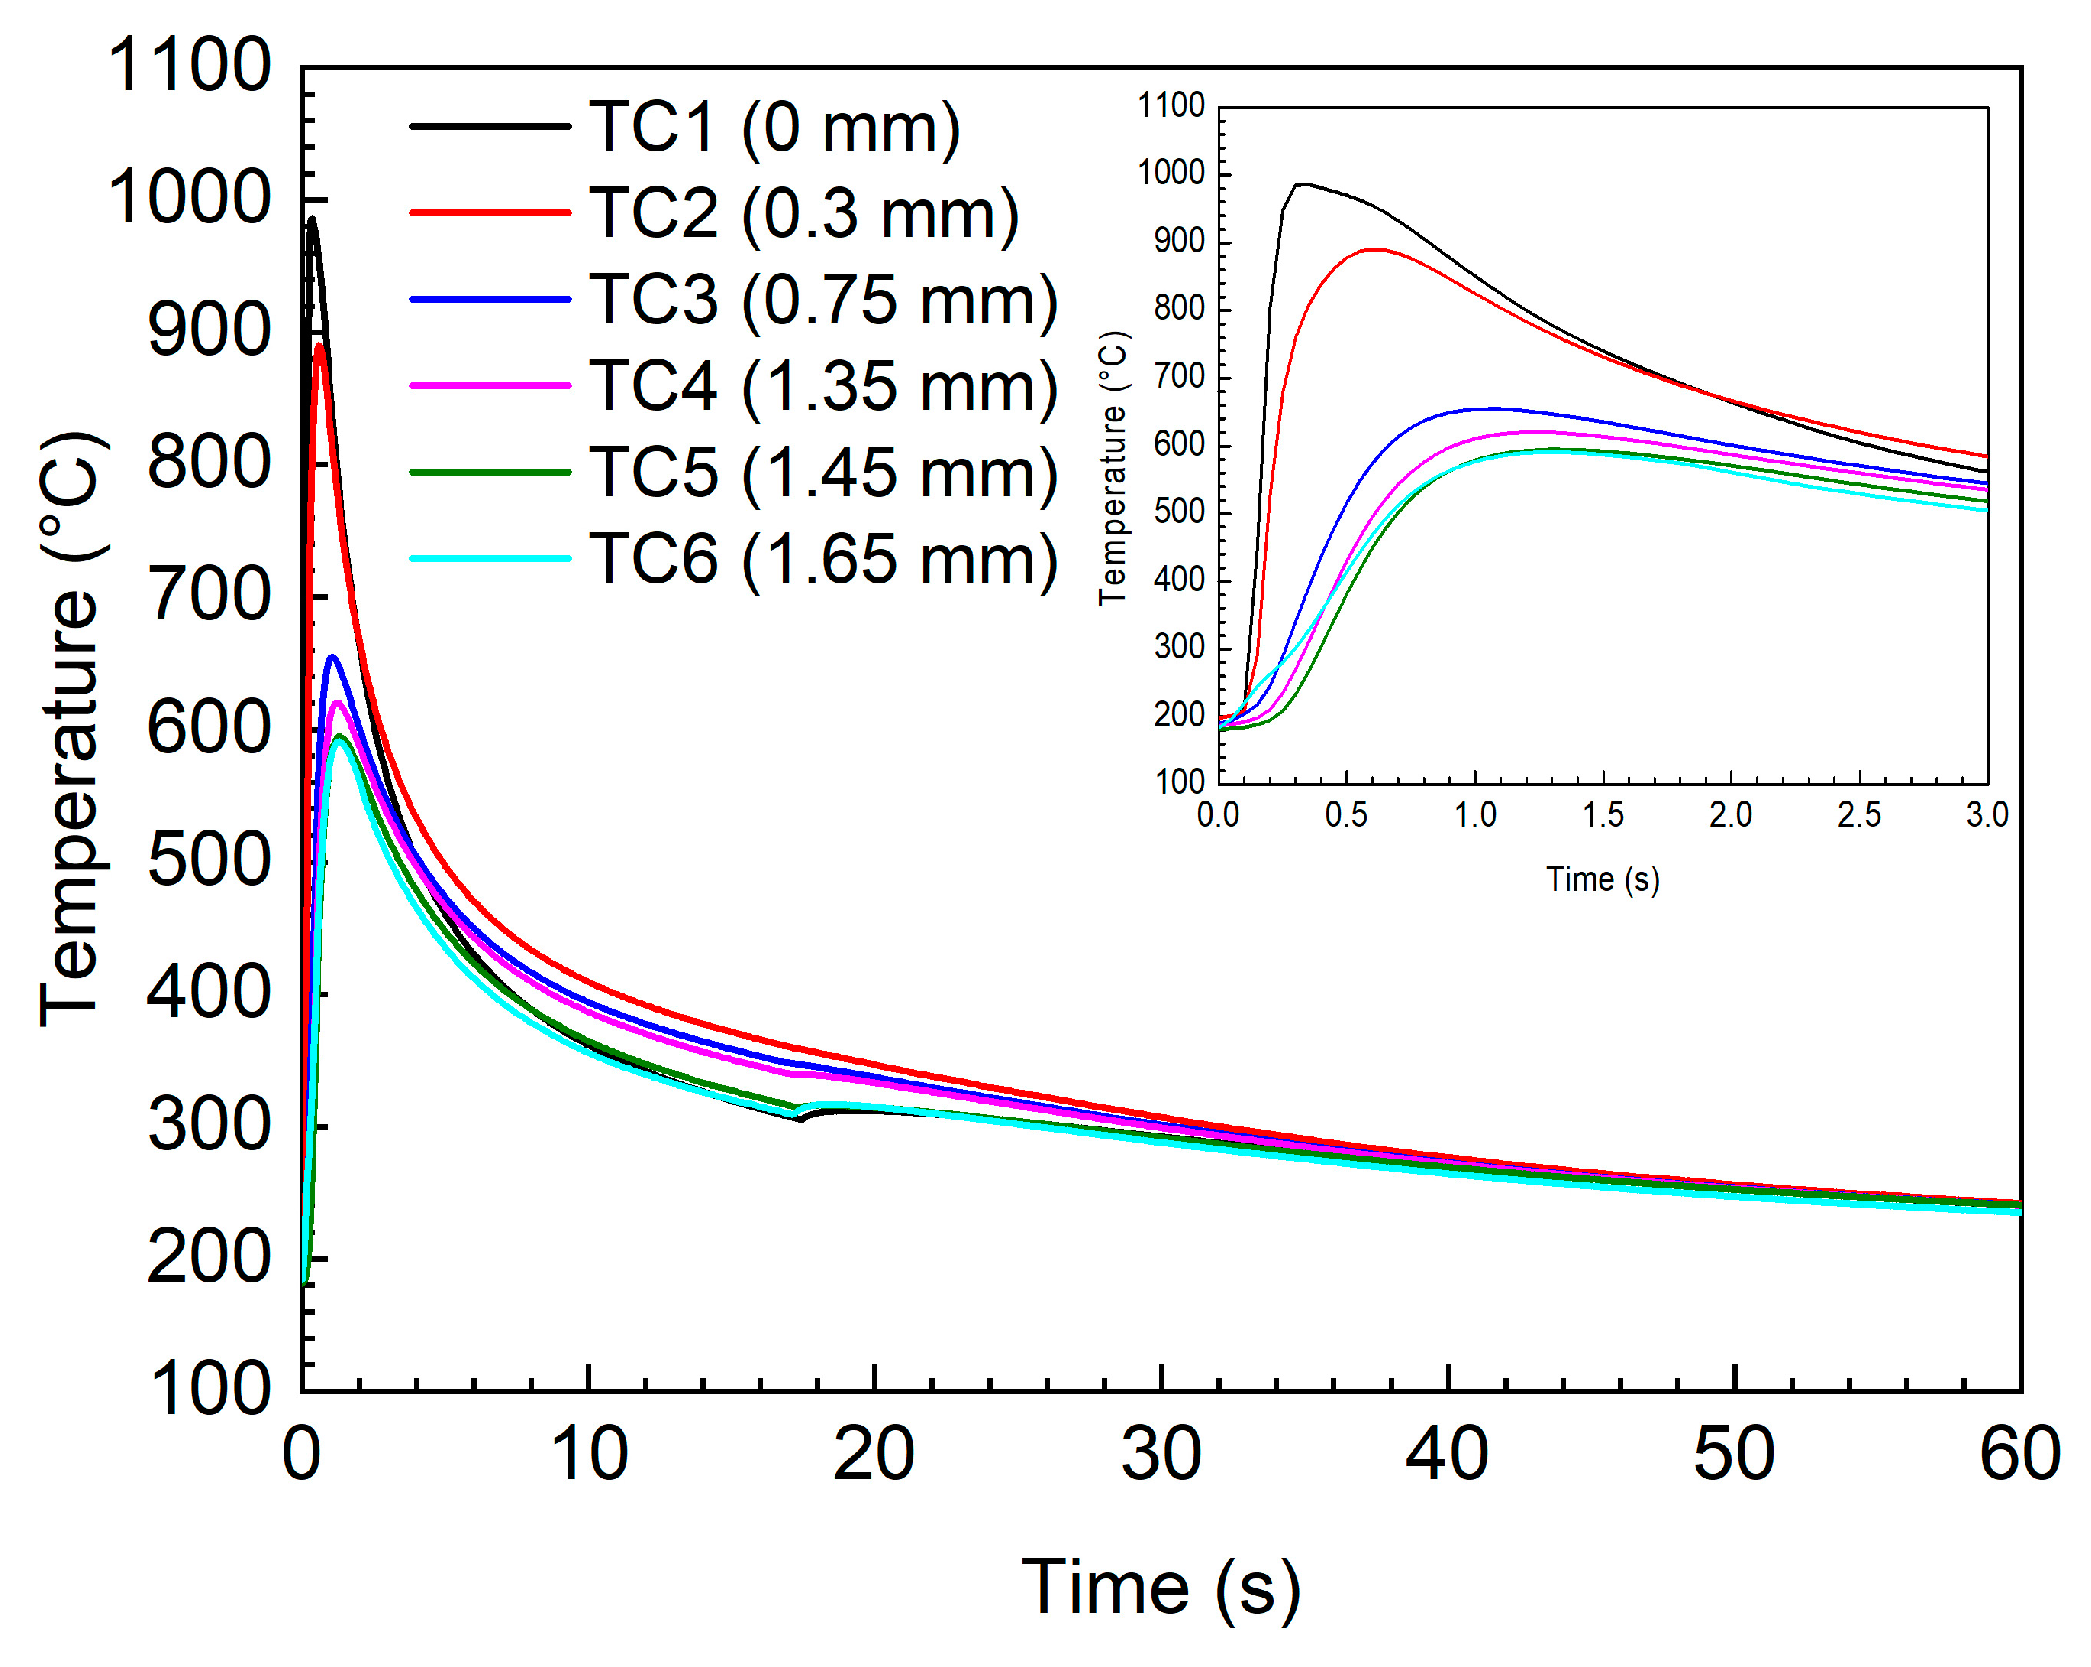
In the welding condition of L3 and L4 samples, the temperature vs. time profiles recorded by the six thermocouples placed at a different distance from the seam border are shown in Figure 9. From the peak temperatures, the value of Q = 1000 W was calculated through Equation (2); the result demonstrates the excellent efficiency of the process. By introducing this value into Equation (1), the temperature reached at any point on the sheet during welding can be determined.
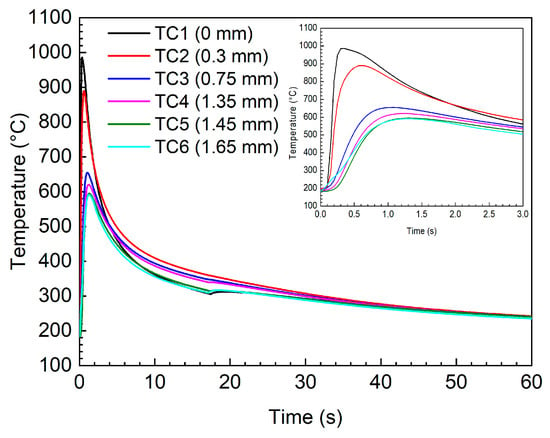
Figure 9.
Temperature vs. time curves measured at different distance from the seam border. The initial part of the curves is shown in detail in the insert.
The measured temperature vs. time profiles indicate that the thermal cycle is extremely fast and, in any position, the temperature falls below 600 °C in quite a short time (~3 s). Indeed, the thermocouple TC3 at 0.75 mm from the seam weld reaches a maximum temperature of ~650 °C, which is not high enough to significantly modify the microstructure. This is supported by a simple estimation of atomic diffusion induced by the thermal history of the metal near the seam.
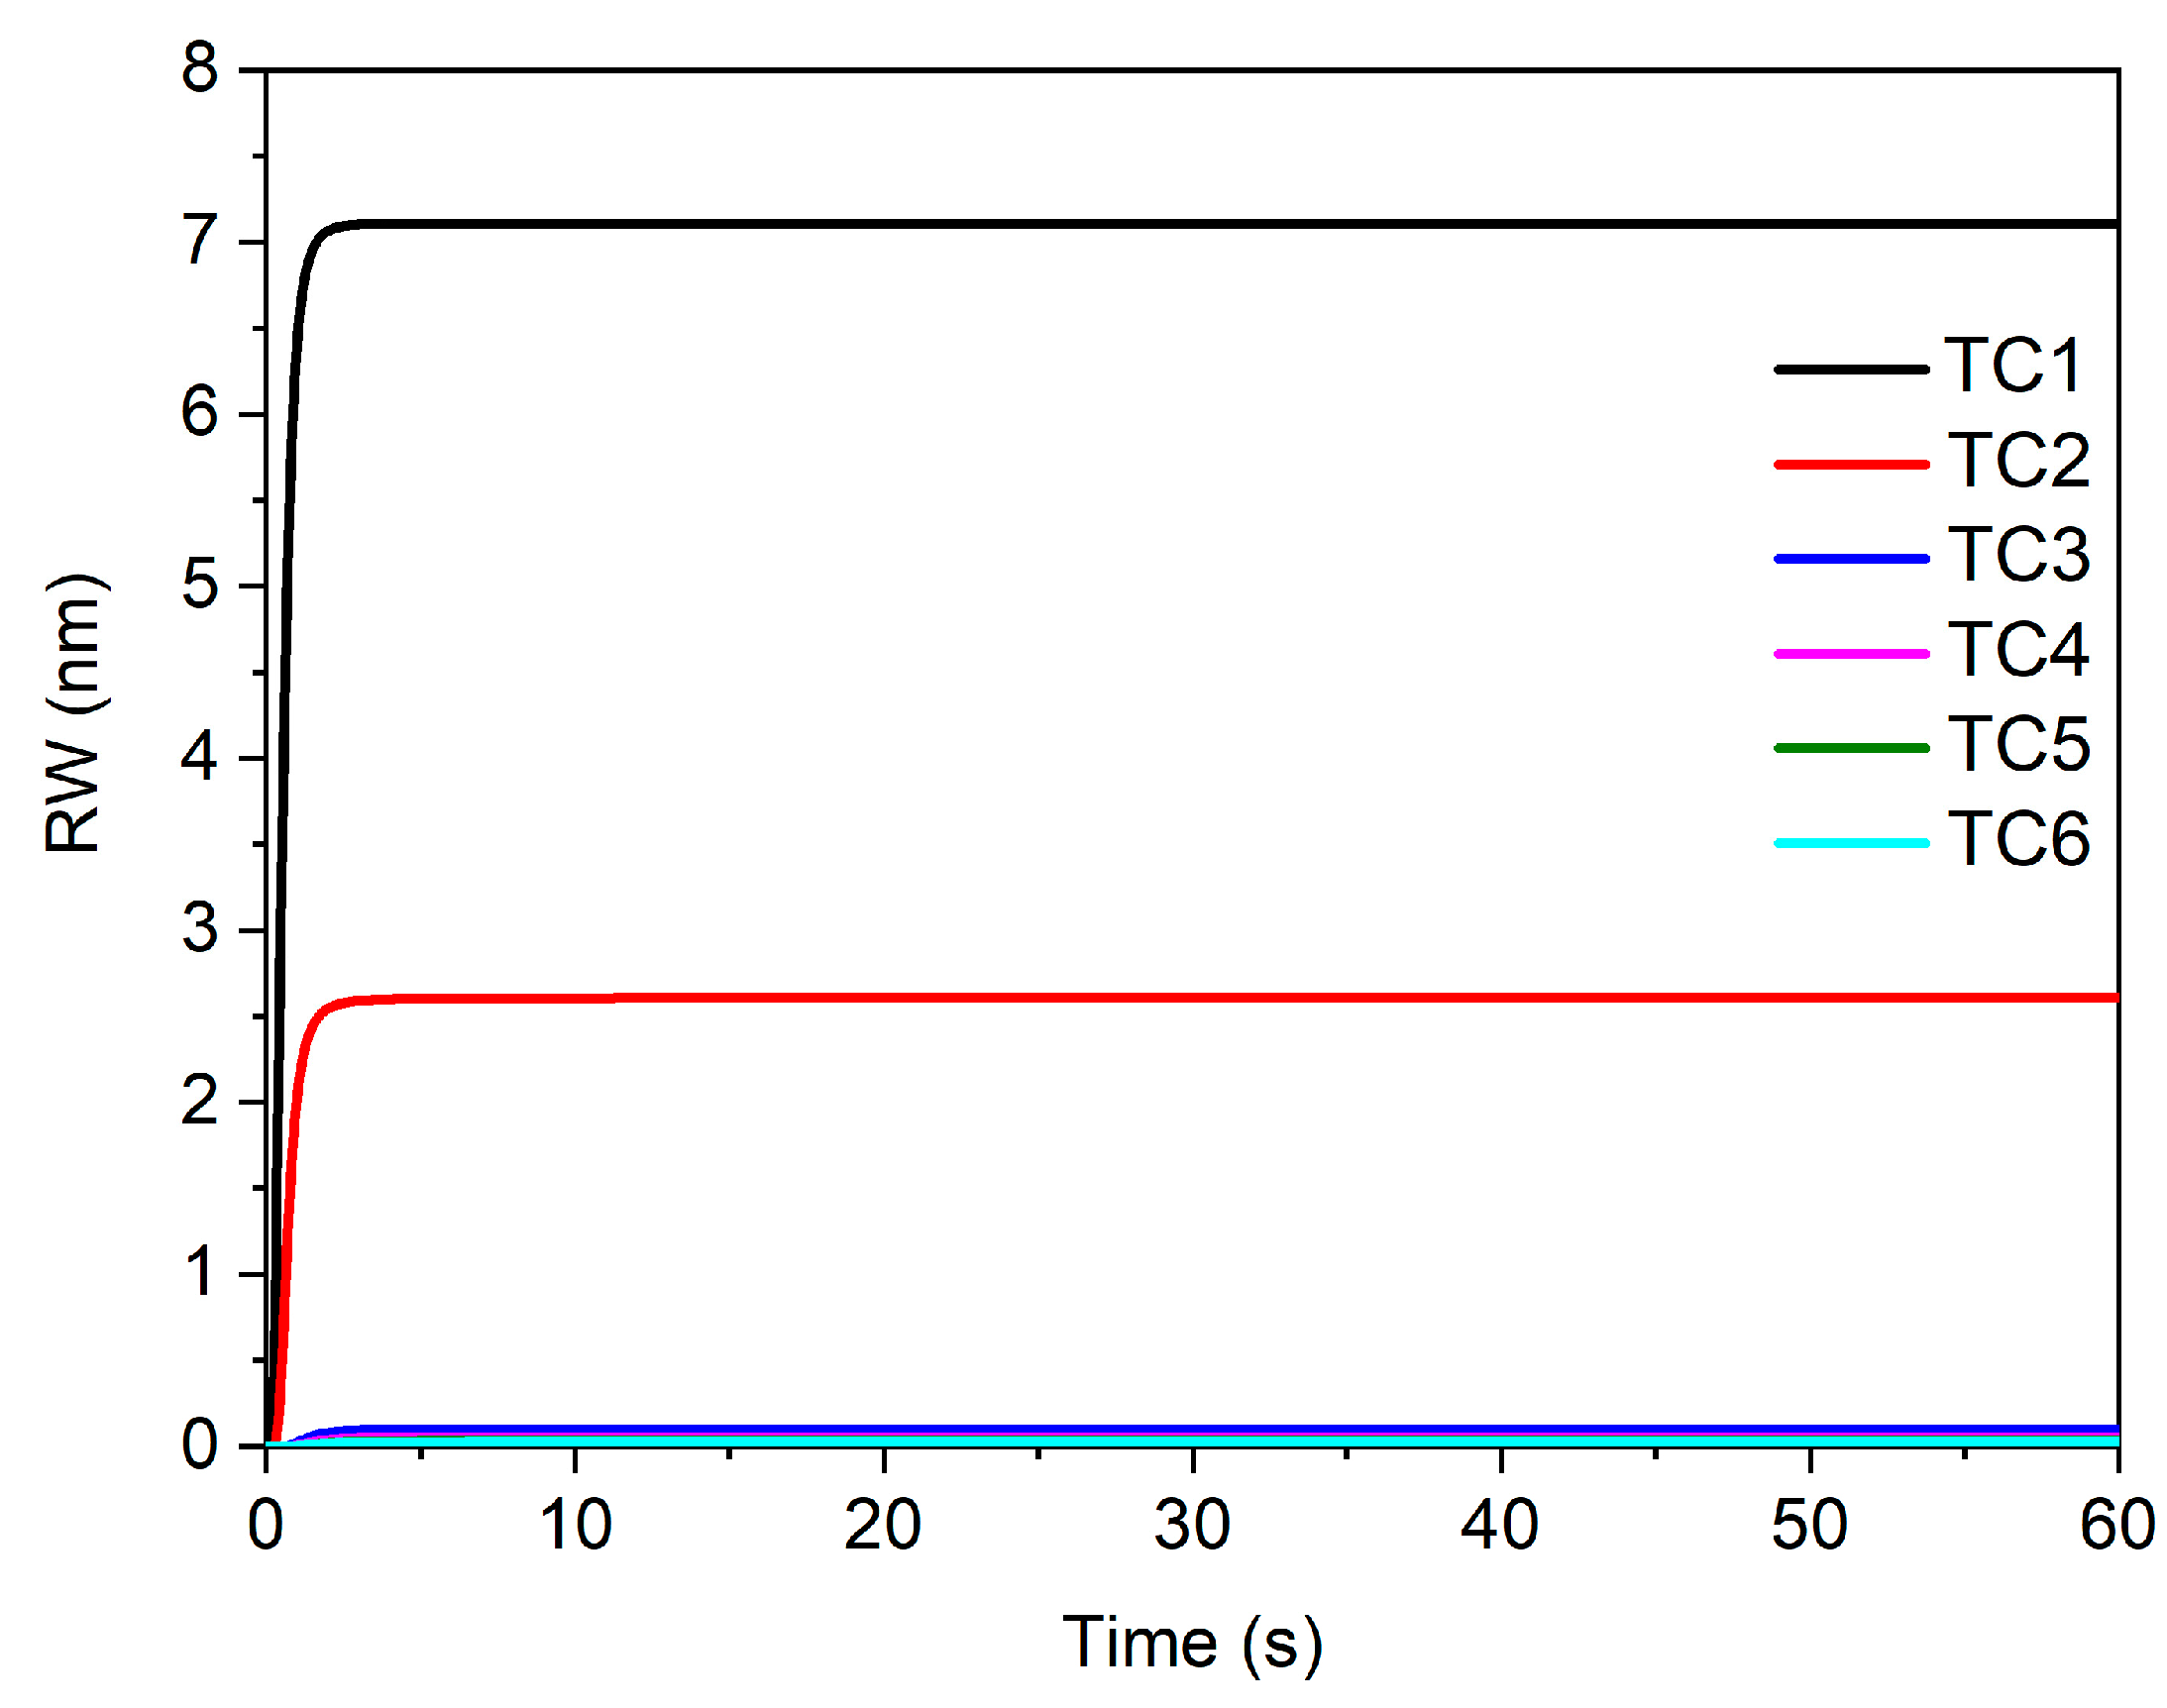
The total random walk RW(t) of Al and Ti atoms in the Ni matrix vs. time can be calculated on the basis of the temperature trends reported in Figure 10. RW for the temperature T and time t is given by
where D is the diffusion coefficient given by the following expression:
where R = 1.987 cal mol−1K−1 the gas constant, D0 = 1.1 × 10⁻³ m2 s−1 the pre-exponential factor and E = 74.745 cal mol−1 the activation energy taken from ref. [40].
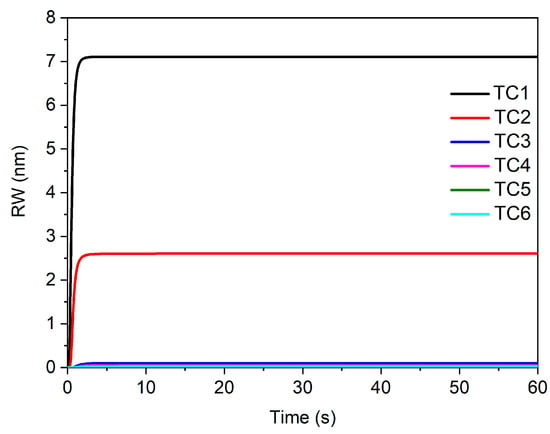
Figure 10.
Total RW vs. time curves calculated by integrating Equation (3) with time steps dt of 0.05 s for each of the temperature profiles displayed in Figure 9.
RW(t) curves determined for the six thermal profiles reported in Figure 9 are plotted in Figure 10. They were calculated by integrating Equation (3) with time steps dt of 0.05 s from 0 to t = 600 s:
In each integration step, the value of D were calculated through Equation (4) for the specific temperature T measured by the thermocouple (see Figure 9). The procedure has been described in detail elsewhere [41].
Figure 10 clearly shows that RW(t) calculated from thermal profiles recorded by TC1 and TC2 changes only at the beginning (t ≤ 3 s), then remains nearly constant. Indeed, diffusion is appreciable if temperature is above ~650 °C and the maximum value of RW(t) substantially corresponds to the radius of round γ′ particles precipitating during cooling. Moreover, the diffusive motion of Al and Ti atoms is negligible at the distance of 0.75 mm from molten metal (TC3) or greater; thus, HAZ thickness is small and lower than 0.3 mm on each side of the seam.
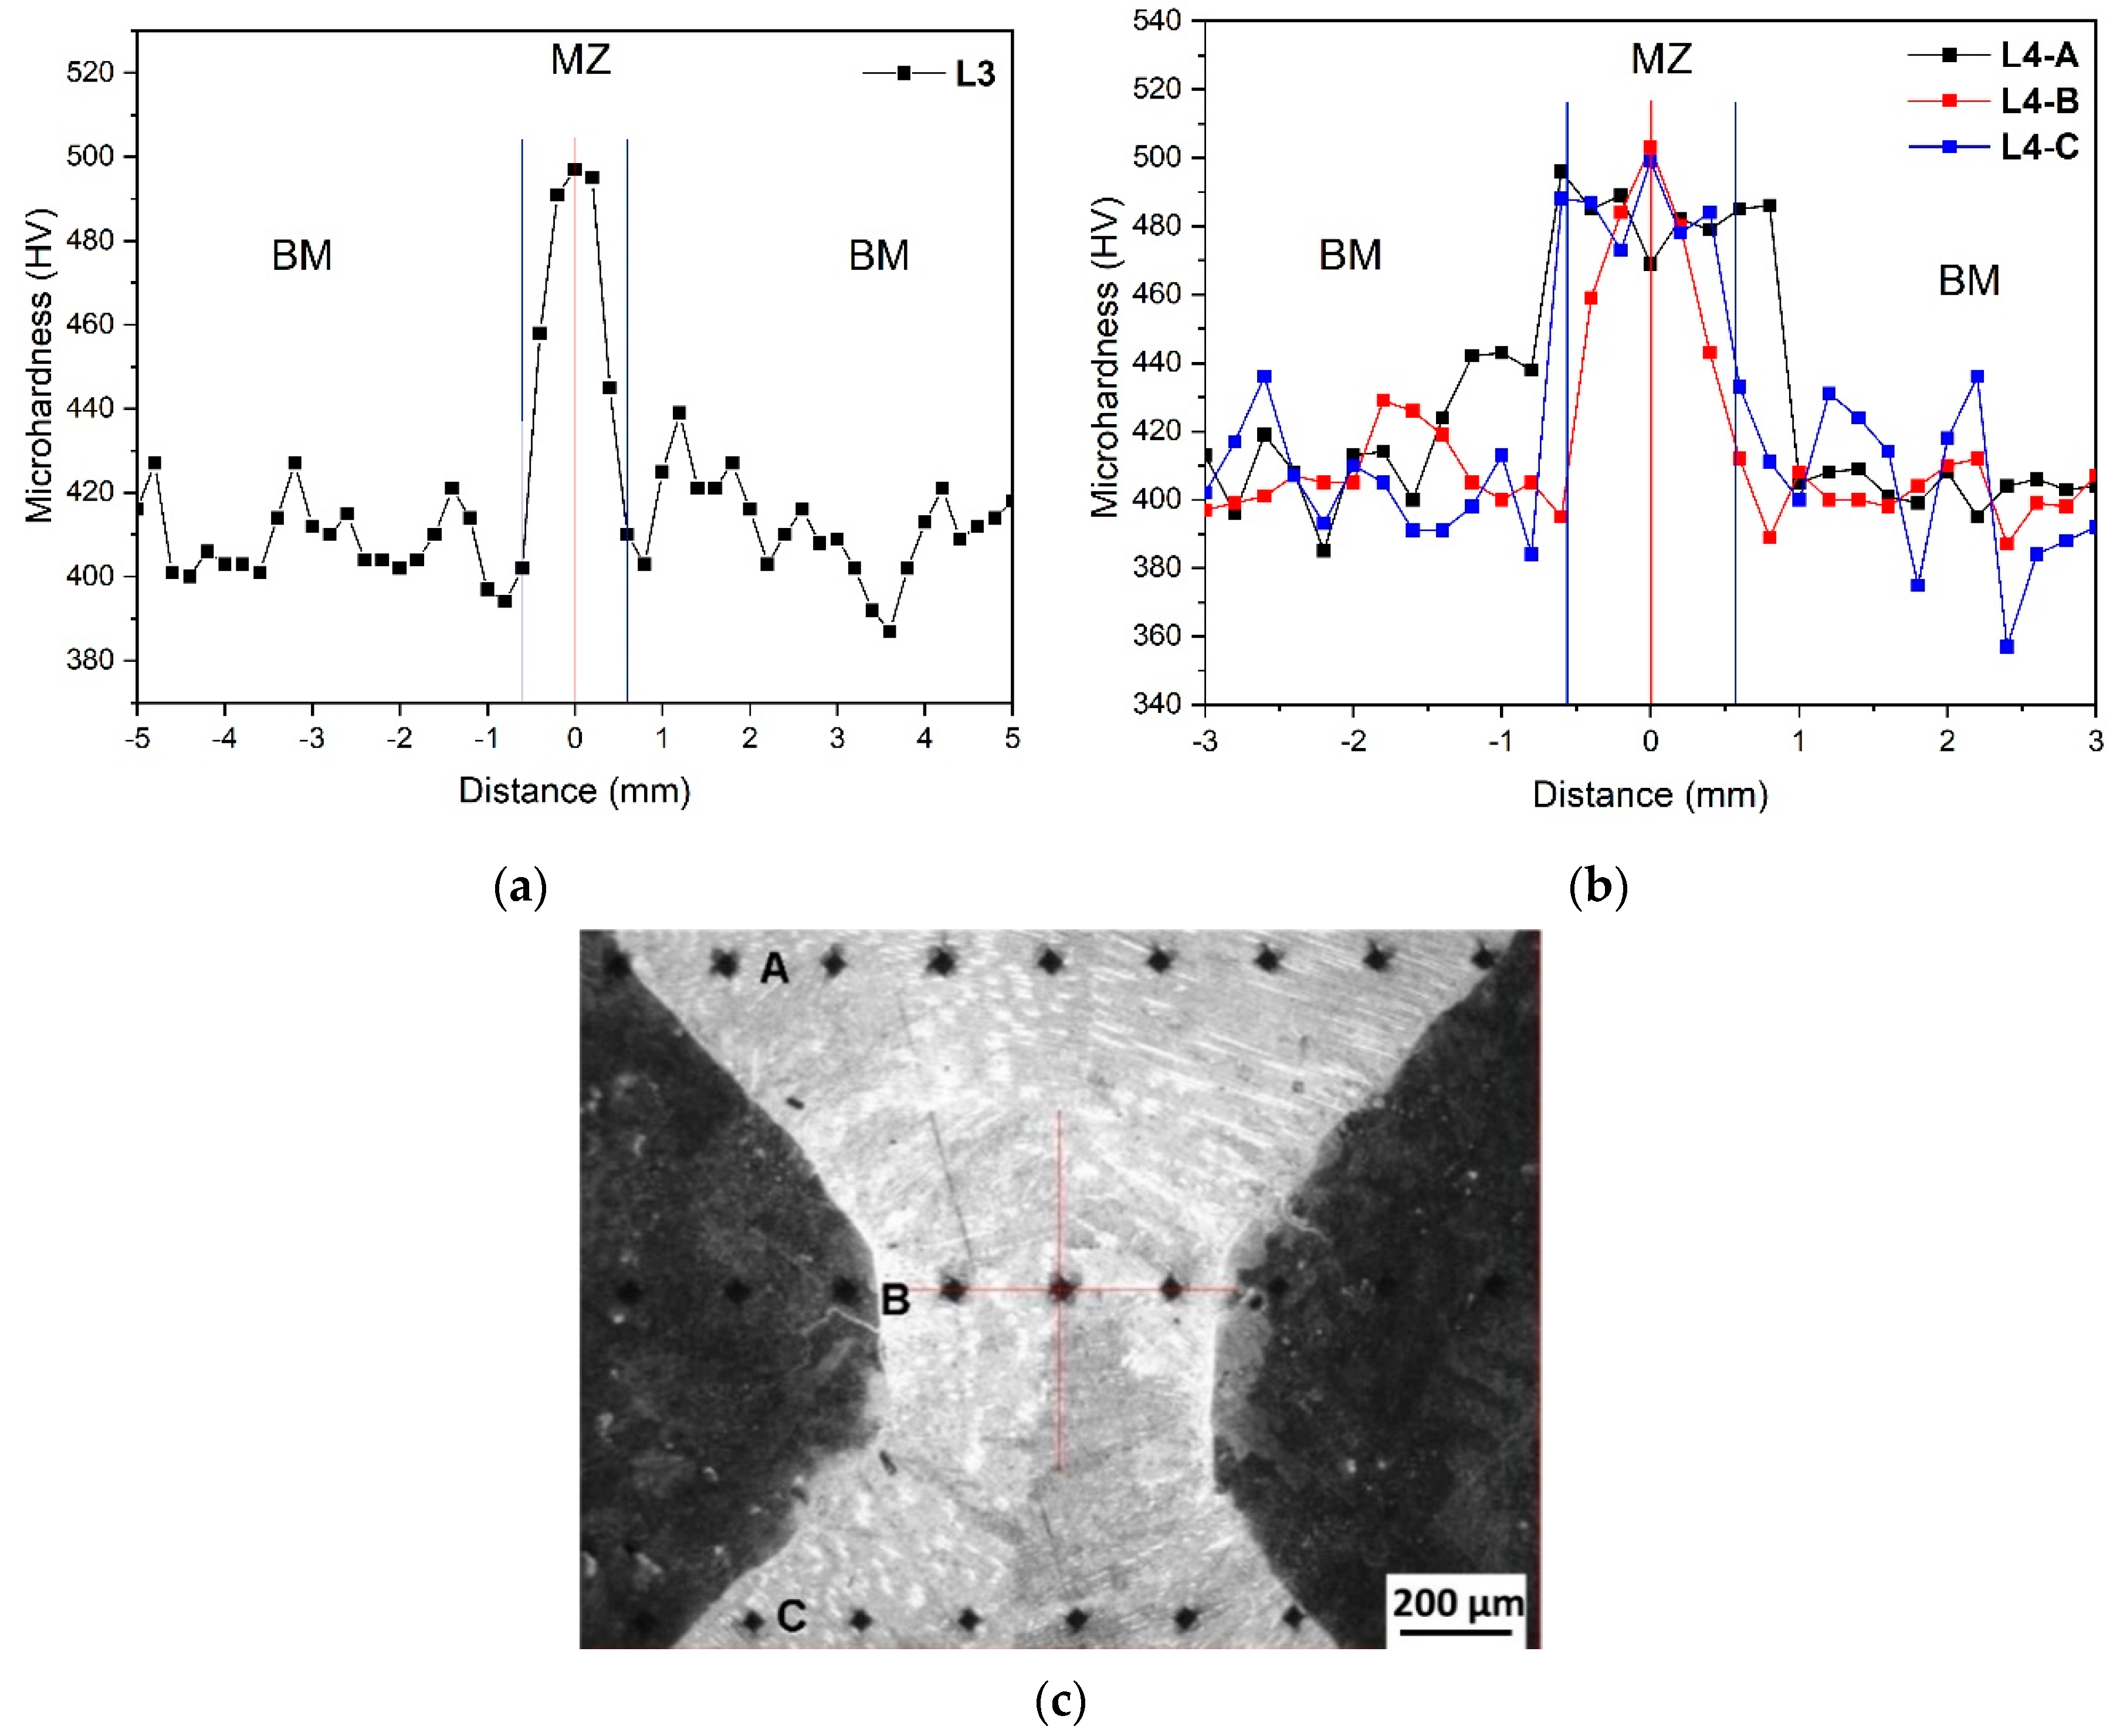
Figure 11 displays the results of Vickers micro-hardness measurements with constant steps of 200 μm across the joints of L3 (a) and L4 (b) samples. In the case of the BoP sample (L3), micro-hardness tests were carried out at the centre of the seam, while for butt welding (L4), the tests were carried out along three different lines on the top (A), centre (B) and bottom (C) of the seam, as shown in (c).
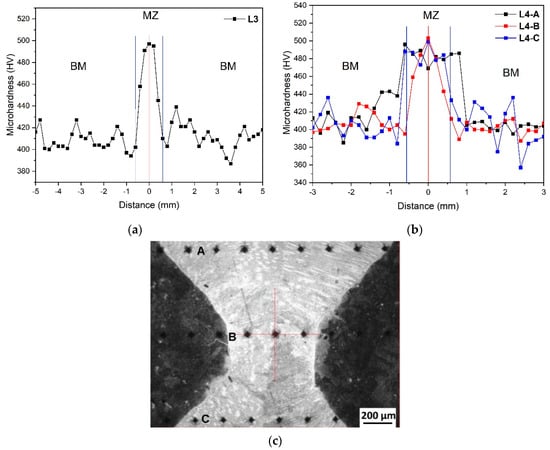
Figure 11.
Vickers micro-hardness values measured across the L3 (a) and L4 (b) joints. The hardness peak in (a,b) corresponds to the MZ whose extension is indicated in the figure. In the case of L4 sample (c), the tests were carried out on the top (A), centre (B) and bottom (C) of the seam.
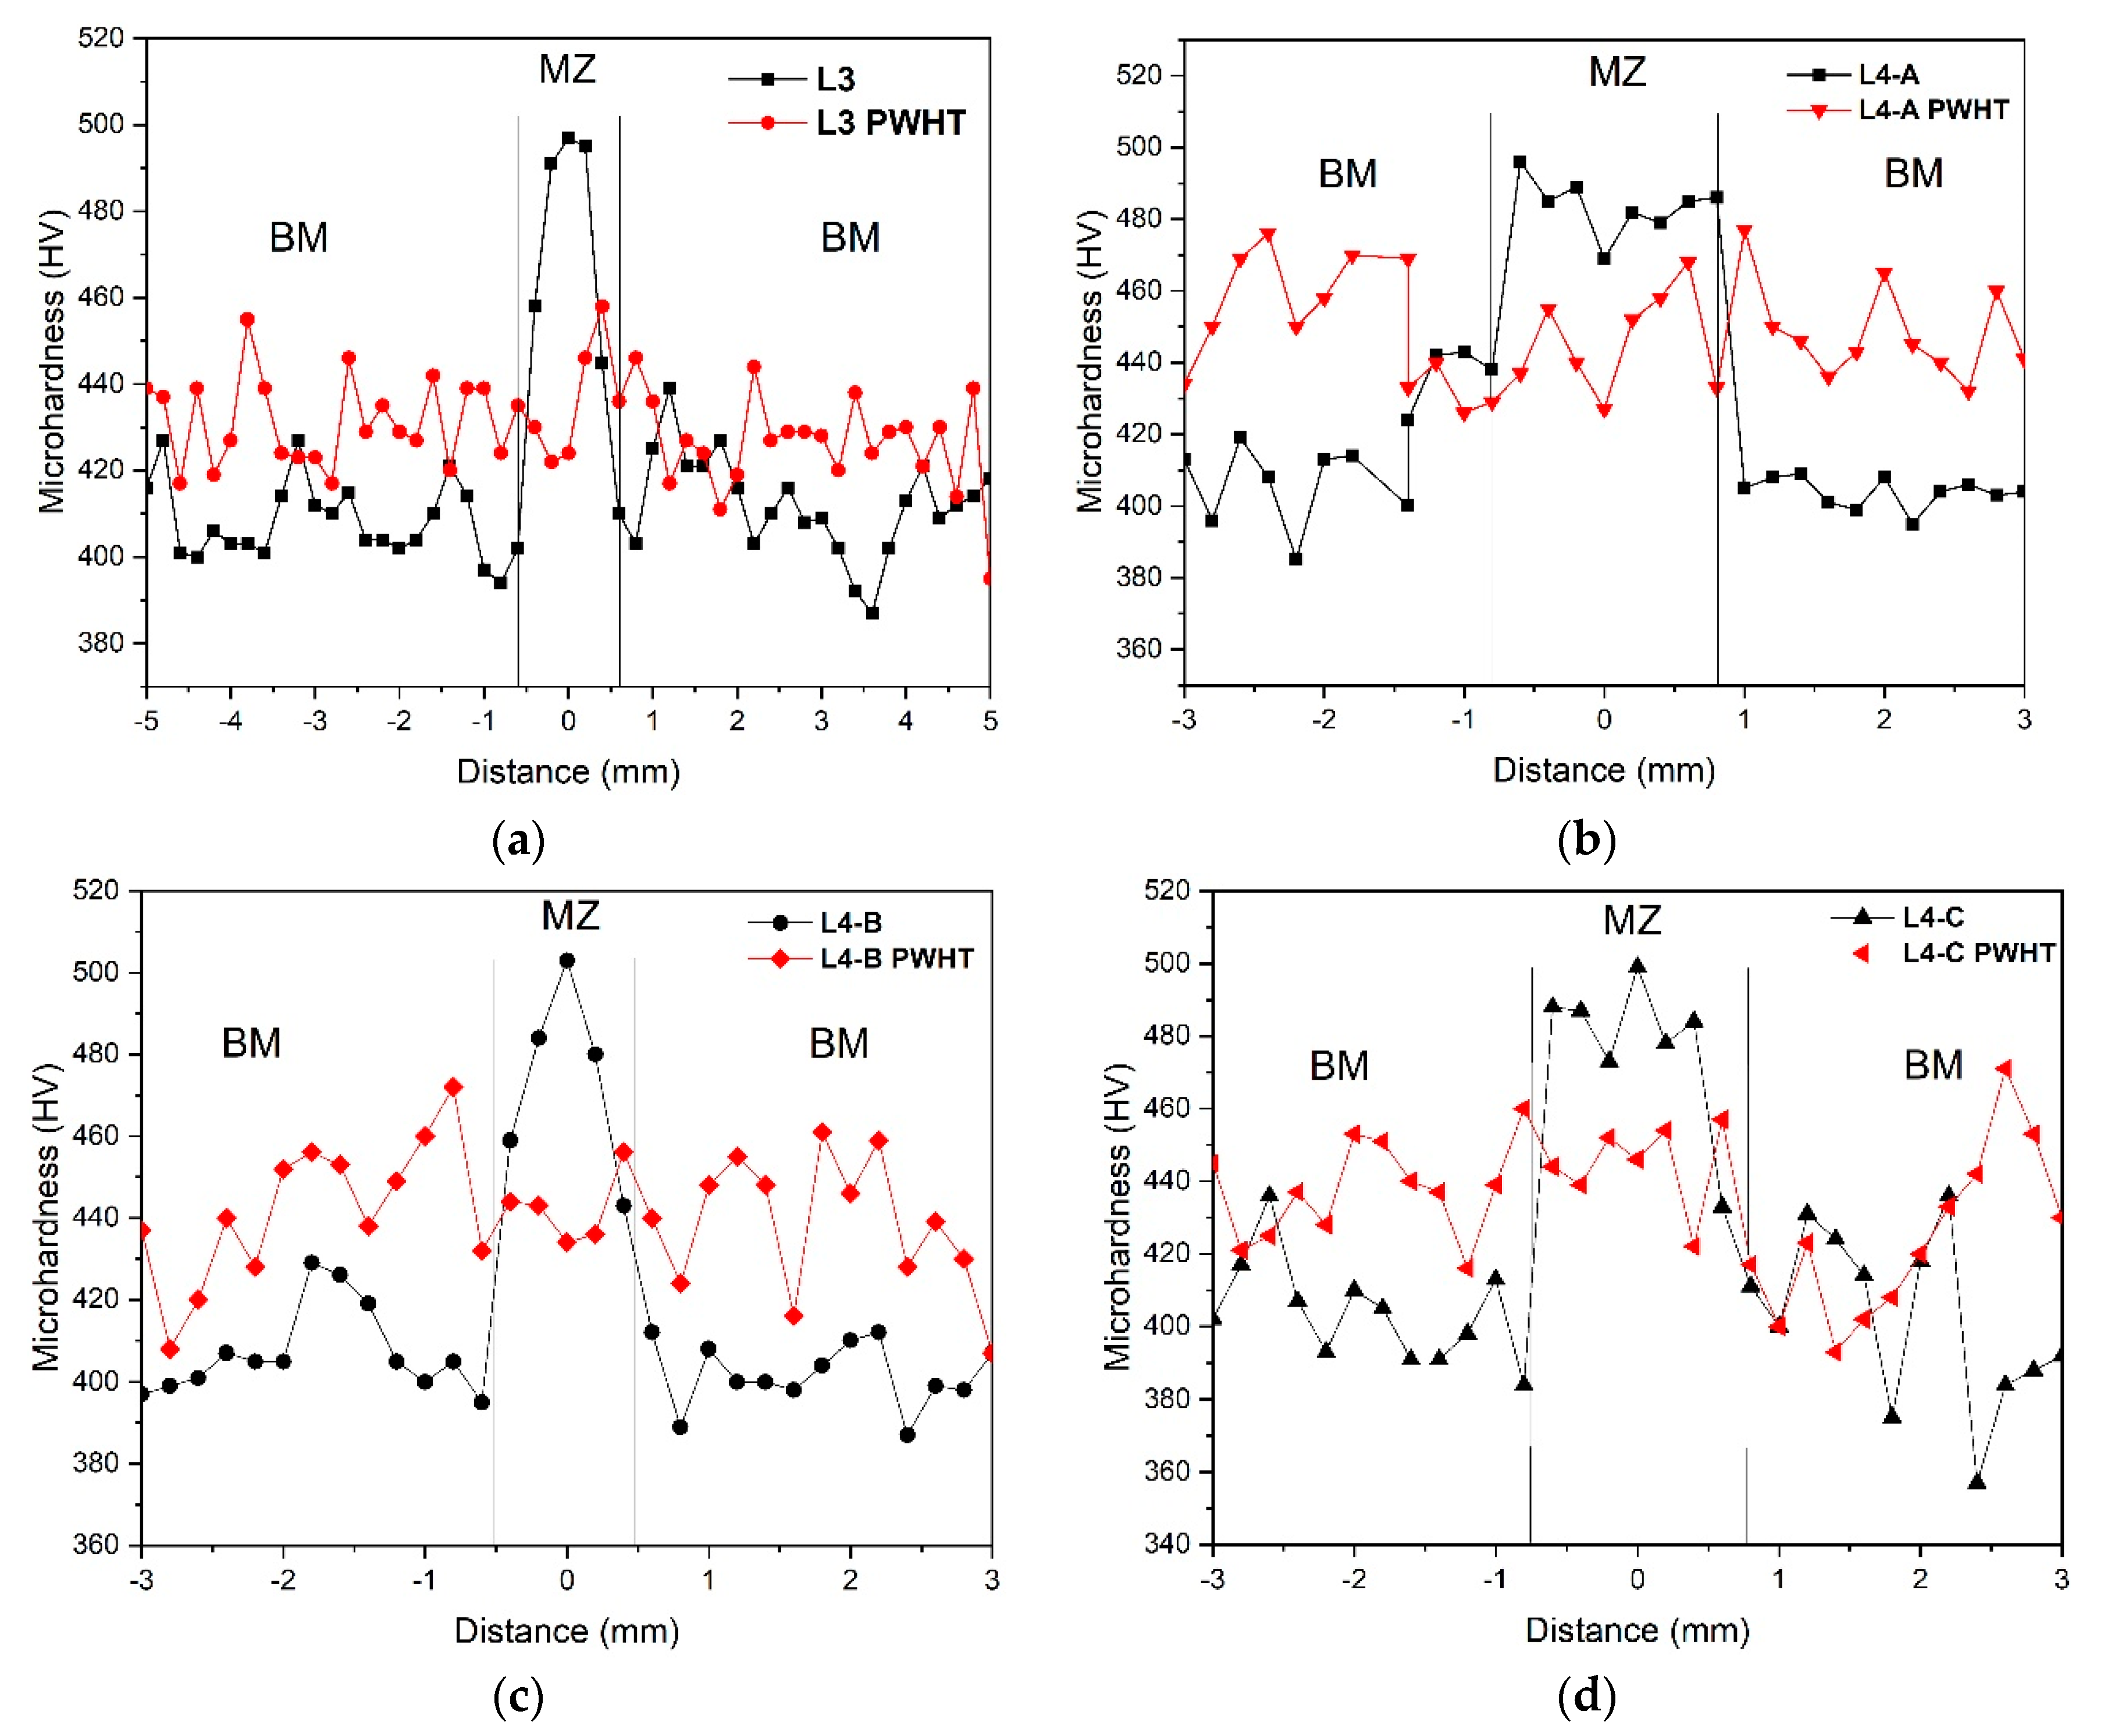
In the L3 sample, the average hardness value of BM is 410 HV, whereas in the MZ, a peak of 500 HV is reached. HAZ is not represented in Figure 11a,b because it is very narrow (~130 μm) and exhibits a hardness slightly lower than that of BM (390 HV) due to some coarsening of γ′ particles. As shown in Figure 11c, in the case of the L4 sample, micro-hardness was measured along three different lines (A, B, C) crossing the seam. The average hardness value of BM is ~403 HV, whereas in the MZ hardness reaches values of about 500 HV, as for the L3 sample.
In both the samples, a relevant increase in hardness is evidenced in the MZ. The difference of hardness between BM and MZ depends on their microstructural features, in particular, the size of γ′ particles: the ordered γ′ phase in the MZ has a finer structure (round particles of 10–30 nm) than in BM (cuboid particles of 400 nm). Of course, finer γ′ particles with reduced inter-particle spacings represent harder obstacles for dislocation motion and induce an increase in mechanical properties.
3.3. Post-Welding Heat Treatment
The PWHT was carried out to homogenize the microstructure and the mechanical properties in the joints. This is common practice after the welding of superalloys [42,43].
As shown in Figure 7, after welding, the microstructure of MZ results were strongly modified because here the ordered γ′ phase re-precipitates during fast cooling to room temperature to form particles of nanometric size which cause the hardness peak (Figure 11). The scope of PWHT is to restore, as far as possible, the original microstructure of the alloy. Figure 12 displays SEM images of an L4 sample after PWHT.
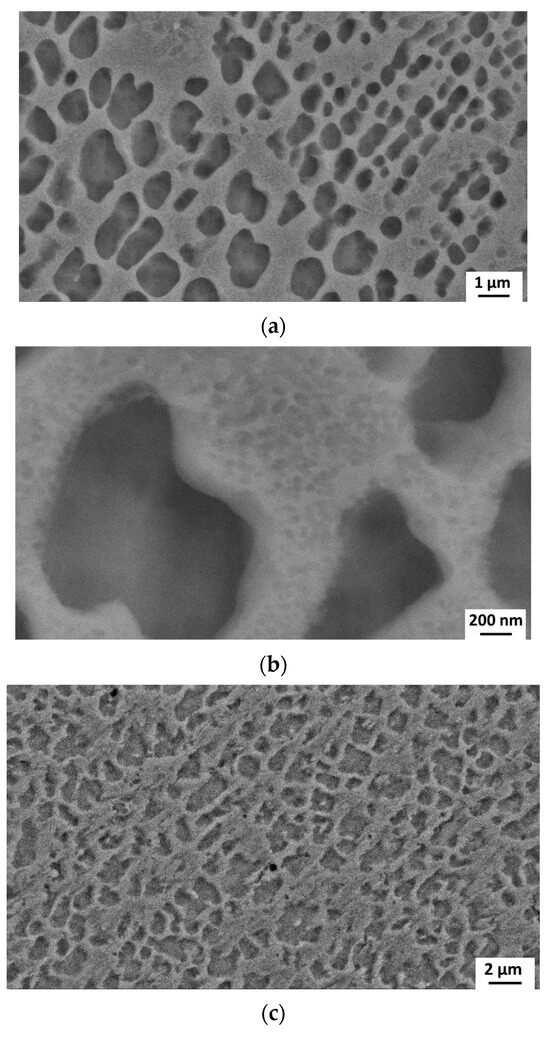
Figure 12.
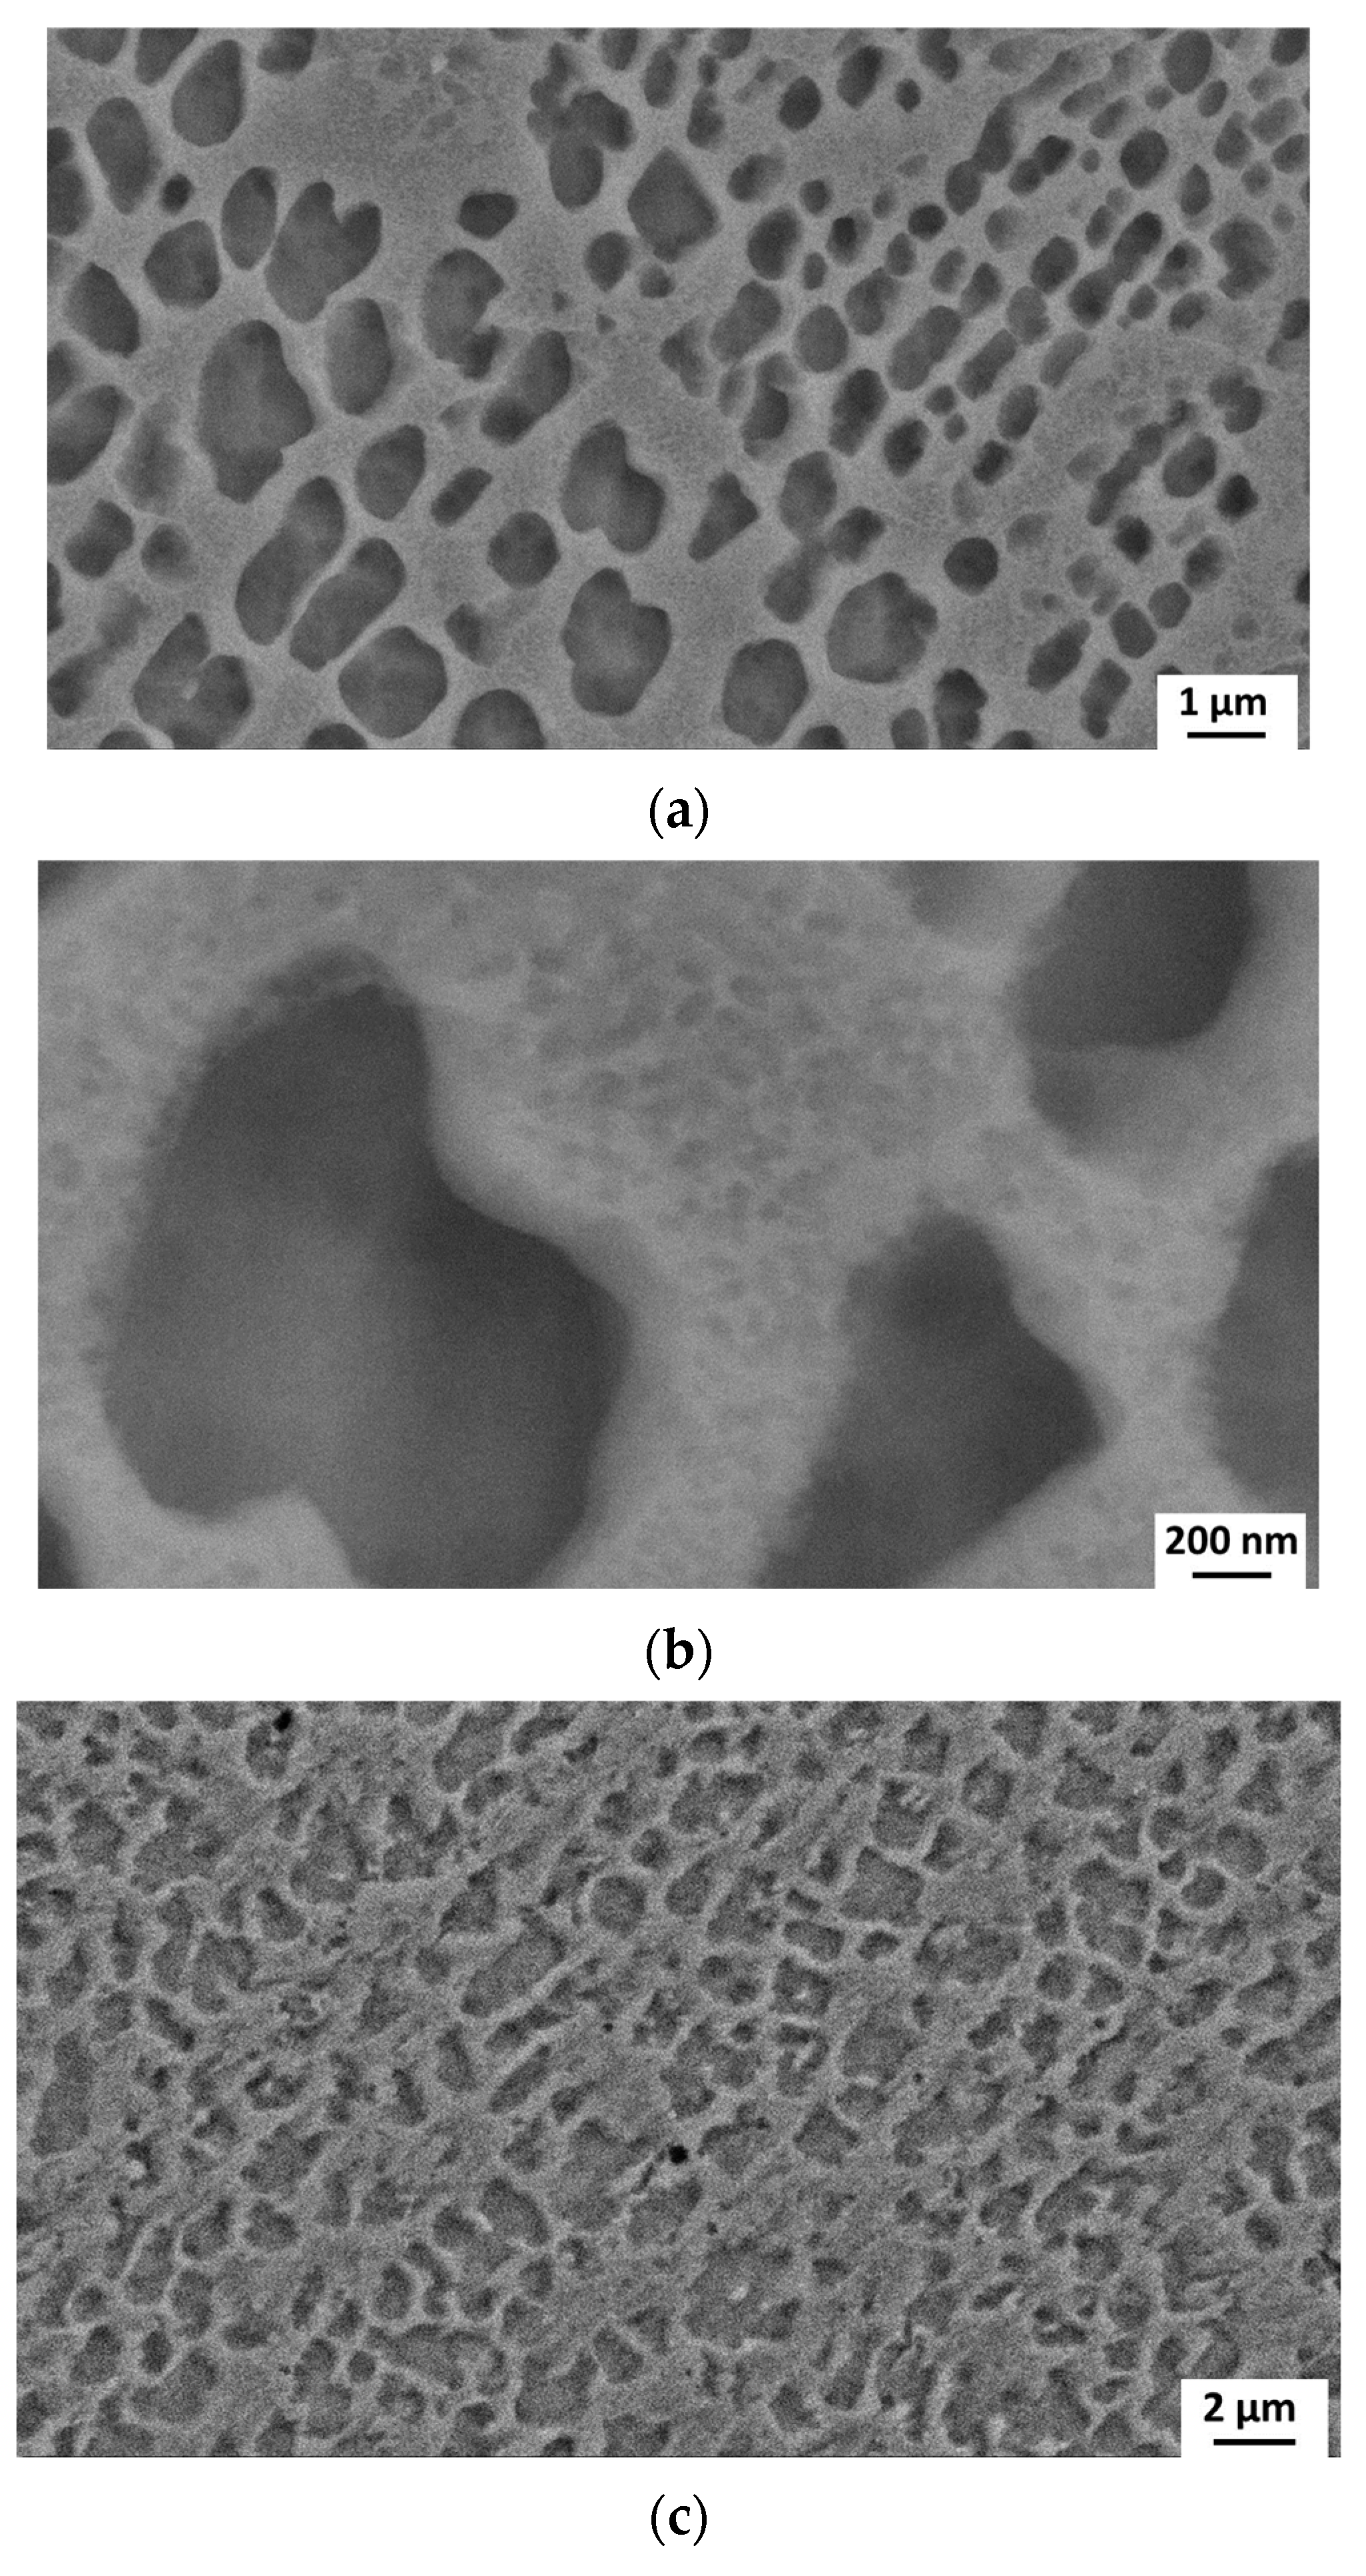
SEM micrograph of the sample L4 after the PWHT: BM with γ′ size of ~550 nm (a) and secondary γ′ with a size of tens of nanometers (b). Homogeneous structure of MZ and BM (c).
The BM (a) exhibits a population of γ′ particles with a bimodal size distribution: large size of ~550 nm and small size of ~40 nm. As shown by the detail of (a) displayed at a higher magnification in (b), the particles of smaller size (secondary γ′) grow in the channels between the particles of larger size and do not yet have the cuboid shape.
After PWHT, the samples have a homogeneous microstructure, and it is no more possible to distinguish a well-defined boundary between the MZ and BM ©.
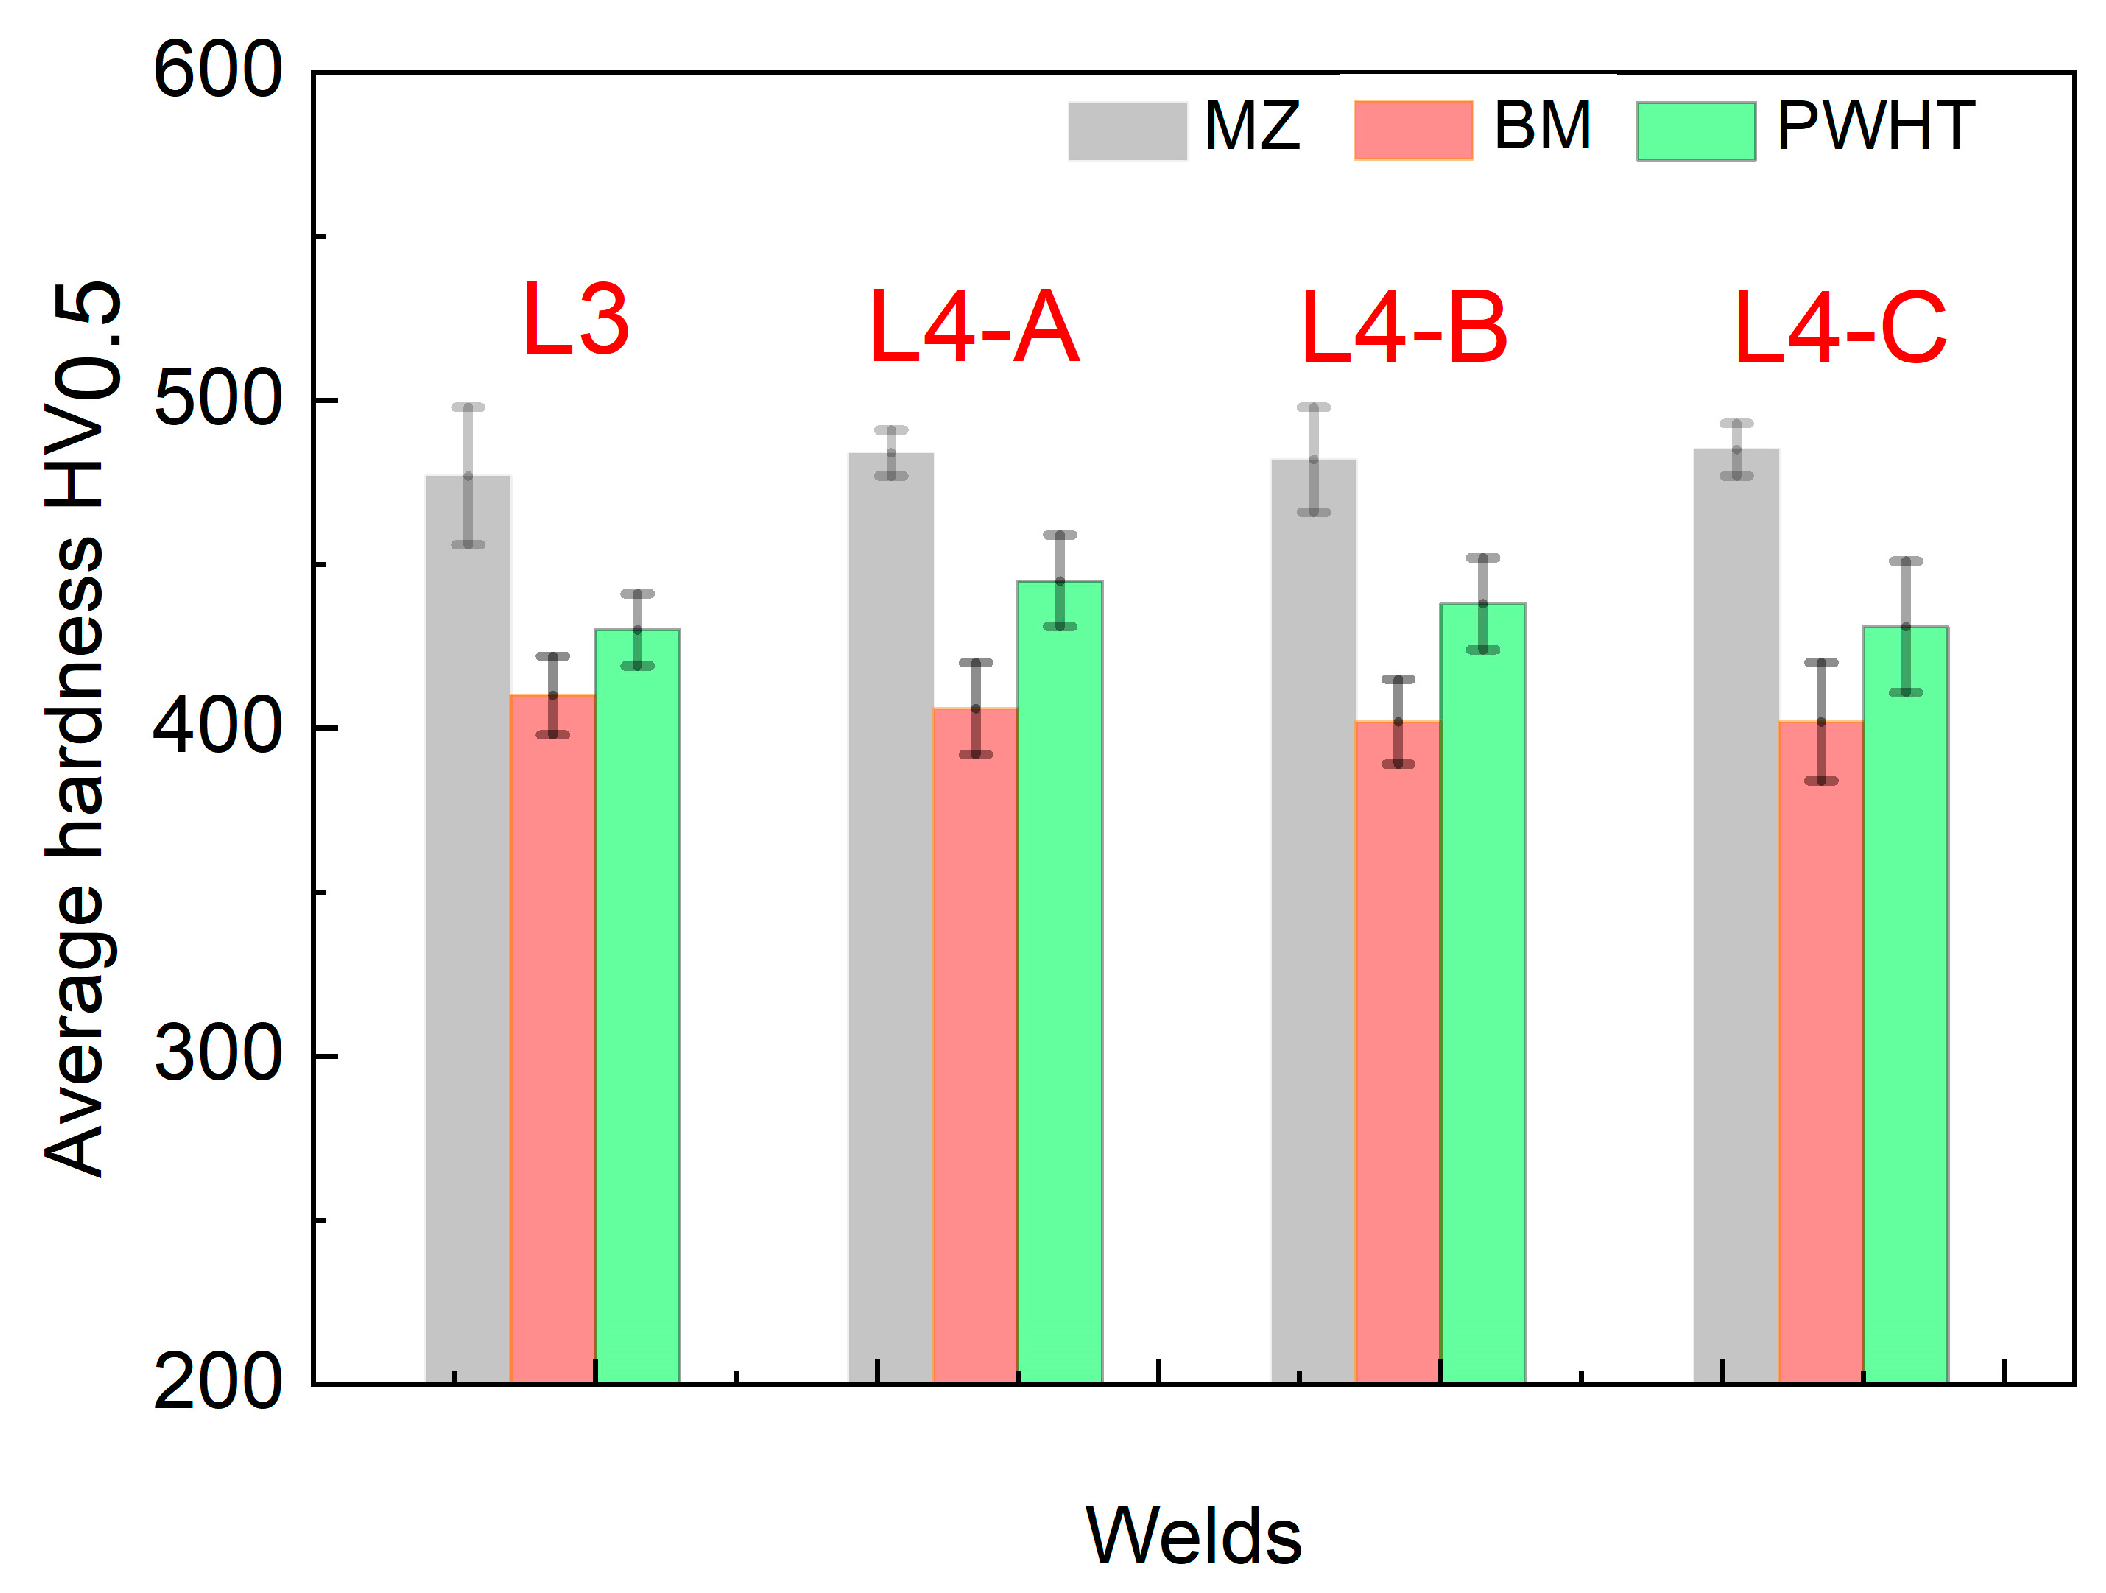
Vickers micro-hardness profiles across the joints of the L3 and L4 samples, before and after PWHT, are reported in Figure 13, while Figure 14 shows the average hardness values in the BM and MZ.
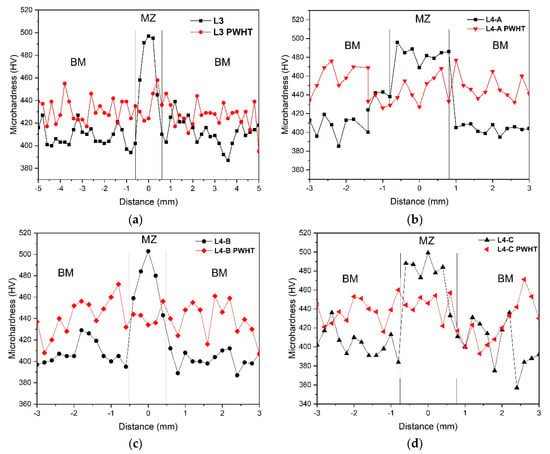
Figure 13.
Comparison between Vickers micro-hardness profiles measured across the L3 (a) and L4-A (b), L4-B (c) and L4-C (d) samples, before and after the post-welding heat treatment (PWHT). In all the plots, the hardness peak corresponding to the MZ disappears after PWHT.
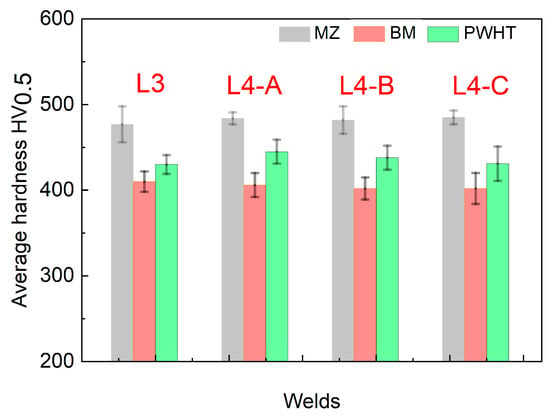
Figure 14.
Average hardness in MZ, BM and heat-treated material (PWHT) of L3 and L4 samples. As shown in Figure 11, micro-hardness measurements in L4 sample were made along three different lines (A, B and C).
On the basis of the results in Figure 12, Figure 13 and Figure 14, the main effects of PWHT are the following:
- (i)
- The microstructure becomes homogeneous in the whole joint;
- (ii)
- The peak of hardness in MZ disappears;
- (iii)
- MZ and BM have, substantially, the same hardness;
- (iv)
- Such hardness value is intermediate between those of MZ and BM before PWHT.
In conclusion, the LW process parameters used for L3 and L4 samples are suitable for producing joints of IN792 DS without macro-defects, such as cracks and pores, and the adopted PWHT allows to homogenize microstructure and mechanical properties of the welded metal in all its parts. The present results are quite encouraging because they were obtained without a brazing metal, as has been the process in other approaches (e.g., see patents [44,45,46]), to overcome the crack susceptibility and mitigate the poor weldability of IN 792. Indeed, the use of brazing metals in the welding of superalloys with high γ′ contents allows to close the cracks but deeply modifies the microstructure of the repaired zone. Nevertheless, in the future, a more extended campaign of mechanical tests, in particular tensile tests at room temperature and 850 °C, and creep tests at 760 °C and 870 °C, will be carried out on welded coupons to compare their properties to the standard datasheet of the material.
Moreover, the present results will be used to orientate future research aimed at optimizing the LW of other Ni-base superalloys.
4. Conclusions
The laser welding of the IN792 DS superalloy has been investigated to find suitable process parameters for producing joints without macro-defects, such as cracks and pores. The results can be resumed as follows:
- In all the preliminary bead-on-plate tests carried out by using laser beams in different conditions, pre-heating at 200 °C resulted in being necessary for reducing thermal stresses and avoiding the formation of cracks in welded samples.
- Cooling rates of welds made with fixed laser beam or wobbling beam are too fast and some gas remains entrapped in the metal during solidification, giving rise to significant porosity. Such phenomenon was not observed in samples welded by a pulsed laser beam.
- Joints without cracks and pores were obtained by using a pulsed rectangular beam with the following characteristics: peak power Ppk = 2080 W, average power Pav = 1250 W, pulse duration τh = 10 ms, time between two successive pulses τp = 16 ms, frequency f = 60 Hz and a duty cycle of 60%. The welding speed was 25 mm s−1.
- Base metal structure consists of γ′ particles with a cuboid shape and average size of ~400 nm, separated by channels of ~50–150 nm where finer round particles (10–30 nm) are observed. In the melt zone, only round particles of 10–30 nm are present because they nucleate below solvus (~1120 °C) and have a short time to grow during fast cooling. The heat-affected zone has a thickness <0.3 mm and exhibits similar characteristics of base metal.
- The original structure and mechanical properties in the melt zone are substantially recovered after a post-welding heat treatment consisting of the following: (i) homogenization at 1200 °C for 1 h, (ii) cooling at room temperature, (iii) solubilization at 1110 °C for 4 h, (iv) cooling at room temperature, (v) aging at 870 °C for 4 h and (vi) cooling at room temperature.
To overcome crack susceptibility and mitigate the poor weldability of IN 792 superalloy, the present results are quite promising; however, further qualifications on welded coupons are needed to compare their properties to the standard datasheet and reach an industrial applicability.
Author Contributions
Conceptualization, R.M., A.F. and G.B.; methodology R.M. and G.B.; software, F.C.; validation, A.F., C.d.C. and M.R.; formal analysis, M.R., C.d.C., M.M. and A.V.; investigation, F.C., C.d.C., A.F., M.M. and A.V.; writing—original draft preparation, A.F.; writing—review and editing, all the authors; supervision, R.M.; project administration, G.B. and A.F.; funding acquisition, R.M. and G.B. All authors have read and agreed to the published version of the manuscript.
Funding
This research was funded by Regione Lazio-DIREZIONE PER LO SVILUPPO ECONOMICO, LE ATTIVITA’ PRODUTTIVE E LA RICERCA (determinazione dirigenziale 14 Luglio 2021, n. G09493), PO FESR LAZIO 2014/2020—“Progetti di Gruppi di Ricerca 2020”. Project title: “Ni-AwaRe: Nickel Alloys Welding and Repairing by High Density Energy Processes”, Project code A0375E0171.
Data Availability Statement
Data is contained within the article.
Acknowledgments
The authors are grateful to Piero Plini and Benedetto Iacovone of the Department of Industrial Engineering at the University of Rome Tor Vergata for sample preparation and assistance in the experiments.
Conflicts of Interest
The authors declare no conflicts of interest.
References
- Thellaputta, G.R.; Chandra, P.S.; Rao, C.S.P. Machinability of Nickel Based Superalloys: A Review. Mater. Today Proc. 2017, 4, 3712–3721. [Google Scholar] [CrossRef]
- Gloria, A.; Montanari, R.; Richetta, M.; Varone, A. Alloys for aeronautic applications: State of art and perspectives. Metals 2019, 9, 662. [Google Scholar] [CrossRef]
- Pollock, M.T.; Sammy, T. Nickel-Based Superalloys for Advanced Turbine Engines: Chemistry, Microstructure, and Properties. J. Propuls. Power. 2006, 22, 361–374. [Google Scholar] [CrossRef]
- Reed, R.C. The Superalloys: Fundamentals and Applications; Cambridge University Press: Cambridge, UK, 2006. [Google Scholar] [CrossRef]
- Ye, W.; Hu, X.; Song, Y. The relationship between creep and tensile properties of a nickel-based superalloy. Mater. Sci. Eng. A 2020, 774, 138847. [Google Scholar] [CrossRef]
- Zhao, P.; Shen, C.; Niezgoda, S.R.; Wang, Y. Heterogeneous γ’ microstructures in nickel-base superalloys and their influence on tensile and creep performance. Int. J. Plast. 2018, 109, 153–168. [Google Scholar] [CrossRef]
- Darolia, R. Development of strong, oxidation and corrosion resistant nickel-based superalloys: Critical review of challenges, progress and prospects. Int. Mater. Rev. 2019, 64, 355–380. [Google Scholar] [CrossRef]
- Deodati, P.; Montanari, R.; Tassa, O.; Ucciardello, N. Single crystal PWA 1483 superalloy: Dislocation rearrangement and damping phenomena. Mater. Sci. Eng. A. 2009, 521–522, 102–105. [Google Scholar] [CrossRef]
- Kaciulis, S.; Mezzi, A.; Amati, M.; Montanari, R.; Angella, G.; Maldini, M. Relation between the Microstructure and Microchemistry in Ni-based Superalloy. Surf. Interf. Anal. 2012, 44, 982–985. [Google Scholar] [CrossRef]
- Belan, J. GCP and TCP phases presented in nickel-base superalloys. Mater. Today Proc. 2016, 3, 936–941. [Google Scholar] [CrossRef]
- Zhang, J.; Huang, T.; Lu, F.; Cao, K.; Wang, D.; Zhang, J.; Zhang, J.; Su, H.; Liu, L. The effect of rhenium on the microstructure stability and γ/γ′ interfacial characteristics of Ni-based single crystal superalloys during long-term aging. J. Alloys Compd. 2021, 876, 160114. [Google Scholar] [CrossRef]
- Meher, S.; Carroll, M.C.; Pollock, T.M.; Carroll, L.J. Designing nickel base alloys for microstructural stability through low γ-γ′ interfacial energy and lattice misfit. Mater. Des. 2018, 140, 249–256. [Google Scholar] [CrossRef]
- Wu, L.; Osada, T.; Watanabe, I.; Yokokawa, T.; Kobayashi, T.; Kawagishi, K. Strength prediction of Ni-base disc superalloys: Modified γ′ hardening models applicable to commercial alloys. Mater. Sci. Eng. A 2021, 799, 140103. [Google Scholar] [CrossRef]
- Wu, L.; Osada, T.; Watanabe, I.; Yokokawa, T.; Kobayashi, T.; Kawagishi, K. A New Approach to Strength Prediction of Ni-Base Disk Superalloys with Dual-Phase γ/γ′. In Superalloys 2020; Springer: Berlin/Heidelberg, Germany, 2020; pp. 651–658. [Google Scholar] [CrossRef]
- Fleury, R.M.N.; Nowell, D. Evaluating the influence of residual stresses and surface damage on fatigue life of nickel superalloys. Int. J. Fatigue 2017, 105, 27–33. [Google Scholar] [CrossRef]
- Xiao, Q.; Xu, Y.; Liu, X.; Wang, Y.; Zhang, W. Oxidation-induced recrystallization and damage mechanism of a Ni-based single-crystal superalloy during creep. Mater. Charact. 2023, 195, 112465. [Google Scholar] [CrossRef]
- Choudhury, B.; Chandrasekaran, M. Investigation on welding characteristics of aerospace materials—A review. Mater. Today Proc. 2017, 4, 7519–7526. [Google Scholar] [CrossRef]
- AL-Nafeay, R.H.; AL-Roubaiy, A.O.; Omidvar, H. Overview of Joining and Repairing Techniques of Ni-Based Superalloy for Industrial Gas Turbine Applications. IOP Conf. Ser. Mater. Sci. Eng. 2021, 1094, 012141. [Google Scholar] [CrossRef]
- Taheri, M.; Kashani-Bozorg, S.F.; Alizadeh, A.; Beni, M.H.; Jam, J.E.; Khorram, A. Analysis of liquation and solidification cracks in the electron beam welding of GTD-111 nickel-base superalloy joint. Mater. Res. Express 2021, 8, 076507. [Google Scholar] [CrossRef]
- Sharma, S.K.; Biswas, K.; Dutta Majumdar, J. Studies on Electron Beam Surface Remelted Inconel 718 Superalloy. Met. Mater. Int. 2021, 27, 5360–5373. [Google Scholar] [CrossRef]
- Pariyar, A.; John, A.; Perugu, C.S.; Edachery, V.; Kailas, S.V. Influence of laser beam welding parameters on the microstructure and mechanical behavior of Inconel X750 superalloy. Manuf. Lett. 2023, 35, 33–38. [Google Scholar] [CrossRef]
- Cheng, H.; Kang, L.; Wang, C.; Li, Q.; Chang, B.; Du, D. Dynamic behavior of molten pool backside during full-penetration laser welding of Ni-based superalloys. Int. J. Adv. Manuf. Technol. 2022, 119, 4587–4598. [Google Scholar] [CrossRef]
- Montanari, R.; Varone, A.; Barbieri, G.; Soltani, P.; Mezzi, A.; Kaciulis, S. Welding of IN792 DS superalloy by electron beam. Surf. Interface Anal. 2016, 48, 483–487. [Google Scholar] [CrossRef]
- Patterson, T.; Hochanadel, J.; Sutton, S.; Panton, B.; Lippold, J. A review of high energy density beam processes for welding and additive manufacturing applications. Weld World. 2021, 65, 1235–1306. [Google Scholar] [CrossRef]
- Taheri, M.; Halvaee, A.; Kashani-Bozorg, S.F. Effect of Pre- and Post-weld Heat Treatment on Microstructure and Mechanical Properties of GTD-111 Superalloy Welds. Met. Mater. Int. 2021, 27, 1173–1192. [Google Scholar] [CrossRef]
- Wang, W.; Jiang, L.; Li, C.; Leng, B.; Ye, X.-X.; Liu, R.; Chen, S.; Yu, K.; Li, Z.; Zhou, X. Effects of post-weld heat treatment on microstructure and mechanical properties of Hastelloy N superalloy welds. Mater. Today Commun. 2019, 19, 230–237. [Google Scholar] [CrossRef]
- Angella, G.; Barbieri, G.; Donnini, R.; Montanari, R.; Richetta, M.; Varone, A. Electron Beam Welding of IN792 DS: Effects of Pass Speed and PWHT on Microstructure and Hardness. Materials 2017, 10, 1033. [Google Scholar] [CrossRef] [PubMed]
- Zhang, J. Effect of Ti and Ta on hot cracking susceptibility of directionally solidified Ni-based superalloy IN792. Scr. Mater. 2003, 48, 677–681. [Google Scholar] [CrossRef]
- Barbieri, G.; Bifaretti, S.; Bonaiuto, V.; Montanari, R.; Richetta, M.; Varone, A. Laser beam welding of IN792 DS superalloy. Mater. Sci. Forum. 2018, 941, 1149–1154. [Google Scholar] [CrossRef]
- Jiang, Z.; Tao, W.; Yu, K.; Tan, C.; Chen, Y.; Li, L.; Li, Z. Comparative study on fiber laser welding of GH3535 superalloy in continuous and pulsed waves. Mater. Des. 2016, 110, 728–739. [Google Scholar] [CrossRef]
- Taheri, M.; Halvaee, A.; Kashani-Bozorg, S.F. Effect of Nd:YAG pulsed-laser welding parameters on microstructure and mechanical properties of GTD-111 superalloy joint. Mater. Res. Express 2019, 6, 076549. [Google Scholar] [CrossRef]
- Hou, J.; Li, R.; Xu, C.; Li, T.; Shi, Z. A comparative study on microstructure and properties of pulsed laser welding and continuous laser welding of Al-25Si-4Cu-Mg high silicon aluminum alloy. J. Manuf. Process. 2021, 68, 657–667. [Google Scholar] [CrossRef]
- Zhao, H.; He, L.; Niu, W.C.; Zhang, B. Investigation on porosity suppression in deep-penetration laser welding by using computational fluid dynamics. J. Laser App. 2016, 28, 032011. [Google Scholar] [CrossRef]
- Wei, M.; Jun Ding, W.; Vastola, G.; Zhang, Y.-W. Quantitative study on the dynamics of melt pool and keyhole and their controlling factors in metal laser melting. Addit. Manuf. 2022, 54, 102779. [Google Scholar] [CrossRef]
- Kang, Y.; Zhao, Y.; Li, Y.; Wang, J.; Zhan, X. Simulation of the Effect of Keyhole Instability on Porosity during the Deep Penetration Laser Welding Process. Metals 2022, 12, 1200. [Google Scholar] [CrossRef]
- Sohn, H.; Liu, P.; Yoon, H.; Yi, K.; Yang, L.; Kim, S. Real-time porosity reduction during metal directed energy deposition using a pulse laser. J. Mater. Sci. Technol. 2022, 116, 214–223. [Google Scholar] [CrossRef]
- Sun, W.R.; Hu, Z.Q.; Lee, J.H.; Cheo, S.M.; Choe, S.J. Influence of solidification rate on precipitation and microstructure of directional solidification IN792+Hf superalloy. J. Mater. Res. 1999, 14, 3873–3881. [Google Scholar] [CrossRef]
- Rosenthal, D. The theory of moving sources of heat and its application to metal treatments. Trans. Am. Soc. Mech. Eng. 1946, 68, 849–865. [Google Scholar] [CrossRef]
- Adams, C.M. Cooling rates and peak temperatures in fusion welding. Weld. J. 1958, 37, 210–215. [Google Scholar]
- Karunaratne, M.S.A.; Carter, P.; Reed, R.C. On the diffusion of aluminium and titanium in the Ni-rich Ni–Al–Ti system between 900 and 1200 °C. Acta Mater. 2001, 49, 861–875. [Google Scholar] [CrossRef]
- Bolli, E.; Fava, A.; Ferro, P.; Kaciulis, S.; Mezzi, A.; Montanari, R.; Varone, A. Cr Segregation and Impact Fracture in a Martensitic Stainless Steel. Coatings 2020, 10, 843. [Google Scholar] [CrossRef]
- Baldan, R.; Pereira da Rocha, R.L.; Tomasiello, R.B.; Nunes, C.A.; Matos da Silva Costa, A.; Ribeiro Barboza, M.J.; Coelho, G.C.; Rosenthal, R. Solutioning and Aging of MAR-M247 Nickel-Based Superalloy. J. Mater. Eng. Perform. 2013, 22, 2574–2579. [Google Scholar] [CrossRef]
- Rettig, R.; Ritter, N.C.; Müller, F.; Franke, M.M.; Singer, R.F. Optimization of the Homogenization Heat Treatment of Nickel-Based Superalloys Based on Phase-Field Simulations: Numerical Methods and Experimental Validation. Metall. Mater. Trans. A 2015, 46, 842–5855. [Google Scholar] [CrossRef]
- Puidokas, S.M.; Mangano, F. Method of Repairing Superalloys. Patent EP3441180A1, 13 February 2019. [Google Scholar]
- Goncharov, A.B.; Liburdi, J.; Lowden, P. Precipitation Strengthened Nickel Based Welding Material for Fusion Welding of Superalloys. Patent WO2015/095949A1, 15 April 2020. [Google Scholar]
- Eminoglu, C.M.; Cui, Y.; Dorriety, D.J.; Tollison, B.L.; Cook, P.A. Method of Welding Superalloys. Patent EP3417972B1, 29 September 2021. [Google Scholar]
Disclaimer/Publisher’s Note: The statements, opinions and data contained in all publications are solely those of the individual author(s) and contributor(s) and not of MDPI and/or the editor(s). MDPI and/or the editor(s) disclaim responsibility for any injury to people or property resulting from any ideas, methods, instructions or products referred to in the content. |
© 2024 by the authors. Licensee MDPI, Basel, Switzerland. This article is an open access article distributed under the terms and conditions of the Creative Commons Attribution (CC BY) license (https://creativecommons.org/licenses/by/4.0/).

