Article

Study on Mechanical Properties and Deformation Mechanism of Fe-28Mn-10Al-C High-Strength Steel during Dynamic Deformation Process

1
School of Materials Science and Engineering, Northeastern University, Shenyang 110819, China
2
Key Laboratory of Lightweight Structural Materials, Northeastern University, Shenyang 110819, China
*
Author to whom correspondence should be addressed.
Metals 2024, 14(1), 47; https://doi.org/10.3390/met14010047
Submission received: 30 November 2023 / Revised: 20 December 2023 / Accepted: 27 December 2023 / Published: 29 December 2023

Abstract

:
For the purpose of investigating the microstructure deformation of 28Mn-10Al-C steel at high speeds under different strain rates, the dynamic properties of 28Mn-10Al-C steel under varying strain rates and the feasibility of the tensile specimens with a variable cross-section were evaluated using a combination of tensile test, optical microscopy (OM), X-ray diffraction (XRD), scanning electron microscope (SEM), and electron back scatter diffraction (EBSD). The test results demonstrate that the high-tension tensile process of 28Mn-10Al-C steel involves a competitive process of work hardening, deformation speed reinforcement, and adiabatic temperature elevation. The elasticity limit, tensile strength, and elongation of 28Mn-10Al-C steel increase with the rate of deformation. Specifically, at a deformation rate of 103 s−1, the yield strength, tensile strength, and elongation of the test steel increase to 817 MPa, 1047 MPa, and 60.6%, respectively, indicating significant improvements in all properties. Through analyzing its mechanical properties, dislocation density, and angle grain boundary density, this article discusses the deformation behavior of 28Mn-10Al-C steel during dynamic deformation. It is found that the dominant hardening mechanism and softening mechanism in the deformation process change with the increase in strain rate.

1. Introduction

With the rapid development of the automotive industry, lightweight design has become a global trend. It is essential for energy conservation, emission reduction, and the advancement of the automotive industry. As a traditional metal material in the automobile industry, steel has significant advantages in formability, weldability, and processing technology. Recently, Fe-Mn-Al-C series automotive lightweight steels with high strength and ductility have attracted wide attention by adding a certain amount of aluminum in medium- and high-manganese steels.
Studies [1,2,3,4,5,6,7,8,9,10,11,12,13] have shown that the yield strength of Fe-Mn-Al-C series automotive steels ranges from 400 to 1000 MPa, the ultimate tensile strength ranges from 600 to 2000 MPa, and the elongation varies between 20% and 100%. Compared with traditional high-strength steel, Fe-Mn-Al-C high-specific-strength steel has excellent specific strength and ductility. However, due to the lack of understanding of dynamic deformation, Fe-Mn-Al-C high-strength steel has not been widely used in automotive manufacturing. Therefore, it is necessary to further study the dynamic deformation of Fe-Mn-Al-C high-strength steel, understand its response to extreme loads, and investigate high-strain-rate forming technology, in order to enable its effective application in the automotive industry.
In recent years, research on Fe-Mn-Al-C high-strength steel has mainly focused on deformation under quasi-static conditions and the dynamic deformation process of TRIP/TWIP steel. There is relatively little research on the dynamic deformation performance of Fe-Mn-Al-C pure austenite steel under high-speed tensile conditions. Xing Min et al. [14] investigated the effect of the Al element on Fe-Mn-Al-C series steel and found that the content of the Al element should be controlled to be less than 10% to ensure the excellent mechanical properties and application properties of Fe-Mn-Al-C series steel. Ren Ping et al. [15] investigated the deformation principle and micro-structure property regulation of Fe-Mn-Al-C austenitic steel and showed that the gradual refinement of micro-structure significantly increases the yield strength to 2.0 GPa. Yoo et al. [16] investigated the tensile properties of Fe-28Mn-9Al-0.8C austenitic steel at room temperature. Rahman et al. [17] investigated the dynamic behavior of Fe-15Mn-2Si-2Al-0.7C TWIP and indicated that the yield stress increased with the increase in strain rate from 0.01 to 950 s−1. Z.Y. Tang et al. [18] studied the dynamic tensile behavior of Fe-15Mn-3Al-0.23C TRIP/TWIP steel and indicated that a transformation-induced plasticity (TRIP) effect, a twinning-induced plasticity (TWIP) effect, dislocation glide, and an adiabatic temperature rise effect coexisted during dynamic deformation. Park et al. [19] investigated the quasi-static and dynamic deformation mechanism of Fe-15Mn-1.2Al-0.6C TWIP steel and demonstrated that the TWIP steel shows higher strength and similar ductility under dynamic loading because of the favorable effect of increased planar slip and twinning on tensile properties.
At present, heat treatment is generally used to improve the material properties of Fe-Mn-Al-C series automotive steels [20,21,22,23,24,25,26,27,28,29,30]. However, after heat treatment, although plasticity can be improved, the tensile strength will generally decrease. The possibility of enhancing the strength of Fe-Mn-Al-C series automotive steels without reducing their plasticity or even improving their plasticity has become the main problem. Studies have shown that the formability of metal materials, such as dual-phase steel, magnesium alloys, and aluminum alloys, can be significantly improved under high-strain-rate conditions [31,32,33,34]. High strain rate forming is also considered an important method to improve the room temperature formability of alloys [35]. Considering the complexity of the effect of the strain rate on the deformation behavior and mechanical properties of Fe-Mn-Al-C pure austenite steel, as well as the necessity of developing high-strain-rate forming technology, it is particularly important to further investigate the deformation mechanism of Fe-Mn-Al-C pure austenite steel during dynamic deformation. Therefore, it is necessary to further study the effect of the strain rate on the dynamic behavior of Fe-Mn-Al-C pure austenite steel.
The annealing process for Fe-28Mn-10Al-C high-strength steel designed in this paper has a density of 6.59 g/cm3 measured by the buoyancy method, which is reduced by 16.16% compared with pure iron (7.86 g/cm3), and energy consumption can be saved by 16.16% [36]. It has good dynamic mechanical properties, with a yield strength of 817 MPa, a tensile strength of 1047MPa, and an elongation up to 60.6%, achieving a very strong plastic product while improving the strength.
This article studies the dynamic tensile deformation mechanism and micro-structure changes in Fe-28Mn-10Al-C high-strength steel to provide some reference value for the early industrial applications of the system of high-strength steel. In this experiment, high-speed tensile tests were conducted on a cold-rolled test steel in the as-annealed state. Modern characterization methods such as OM, SEM, XRD, and EBSD were used to analyze the competition and dominant relationship between the work-hardening mechanism and the softening mechanism caused by dynamic recovery during the dynamic deformation process of high-speed stretching. This laid a foundation for the application of high-strain-rate forming technology. Simultaneously, this is also beneficial for us to better understand its response to extreme loads, which is crucial when designing structures and components that can withstand dynamic forces.

2. Materials and Methods

In this test, we will perform a 950 °C annealing treatment on Fe-28Mn-10Al cold-rolled test steel and process it into four tensile specimens for high-speed tensile testing at different strain rates. After the completion of the experiment, four tensile specimens will be cut and characterized using OM, SEM, XRD, and EBSD analysis methods to investigate the effect of strain rate on their deformation mechanisms.
For this test, 28Mn-10Al cold-rolled test steel was utilized, and its composition is presented in Table 1.

2.1. Annealed Test Steel

When the austenitic Fe-Mn-Al-C steel is slowly cooled, κ-carbide and/or α-phase will precipitate along the austenite grain boundaries or the austenite matrix, which will affect the ductility and toughness of the material. Therefore, the annealing treatment temperature range for austenitic Fe-Mn-Al-C steel is 900–1100 °C, followed by water quenching and rapid cooling to room temperature to avoid the formation of coarse κ-carbide or α-phase.
In the heat treatment experiment, the raw materials were annealed within the specified process range in a box-type resistance furnace. The cold-rolled test steel was annealed at 950 °C for 30 min and subsequently cooled by water, as illustrated in Figure 1. The quasi-static mechanical properties of the test steel were characterized by a yield strength of 562 MPa, a tensile strength of 1035 MPa, and total elongation of 56.9%.
In accordance with the international standard of high-strain-rate loading on sheet metal with a hydraulic servo tensile testing machine recommended by ISO26203-2:2011 [37], the cold-rolled test steel plates after annealing were processed into standard tensile specimens using an electric spark wire-cutting machine. The thickness of both the cold-rolled test steel plate and the standard tensile specimens is 1 mm. The standard distance for the high-speed specimens was 12.5 mm long and 5 mm wide, as shown in Figure 2. After grinding and marking the high-speed tensile specimens, high-speed tensile tests were conducted on a ZwickHTM5020 high-speed tensile tester of ZwickRoell Corporation, Boston, MA, USA at strain rates of 1, 10, 102, and 103 s−1. Before the test, equal interval marks are made on the gauge length, and the distance between two consecutive marks is equal to a divisor of the original gauge length. The mark of the original gauge length should be accurate to ±0.5 mm or less. The post-fracture gauge length is measured on the longest part of the sample accurately at ±0.5 mm. A strain value is calculated based on the gauge length before and after fracture. As high-speed tensile testing cannot use an extensometer, we can only measure displacement. Another strain value is obtained by dividing displacement by the gauge length. By comparing the two values, a relatively accurate strain value can be calculated.

2.2. Tensile Specimen Treatment

The four tensile samples were analyzed separately, and one example was used to introduce the whole process.
The tensile sample was first cut and sampled. The size of the sample was measured to be 10 mm × 8 mm × 1 mm.
The microstructure of the Fe-28Mn-10Al-C test steel was analyzed using an OLYMPUS-GSX500 optical microscope of Olympus Corporation, Tokyo, Japan. The size of the sample measured 10 mm × 8 mm × 1 mm.
The microstructure and fracture morphology of the test steel were investigated using an SSX-550 field emission scanning electron microscope of Shimadzu Corporation, Kyoto, Japan. The process of preparing SEM samples was similar to that of preparing metallographic samples, requiring grinding, electrolytic polishing, and corrosion.
The Rigaku Ultima IV X-ray diffractometer was employed to analyze the phase composition of the samples after cold rolling and heat treatment. The observation surface of the XRD samples was the plane formed by the rolling direction and transverse direction. The samples were successively ground with 400#, 800#, 1000#, 1500#, and 2000# sandpaper, followed by electrolytic polishing with a mixture of 900 mL anhydrous ethanol and 60 mL perchloric acid. Data acquisition conditions included a Cu target Kα line for the ray, a Ni filter, a step scanning speed of 2°/min, a voltage of 56 kV, a current of 180 mA, and a measurement angle range of 40°–100°.
The microstructure of the middle line side of the tensile sample was analyzed by EBSD to investigate the feasibility of the double-trapezoid specimen. The samples were ground with 400–2000# sandpaper in turn, followed by electrolytic polishing. After polishing, the samples were rinsed with anhydrous ethanol and dried using a hair dryer. The SSX-550 scanning electron microscope was used for EBSD detection, with an accelerating voltage of 15 kV and a scanning step of 0.05 μm. The data collected by the computer were processed using HKL Channel 5 software.

3. Results

3.1. Metallographic Structure

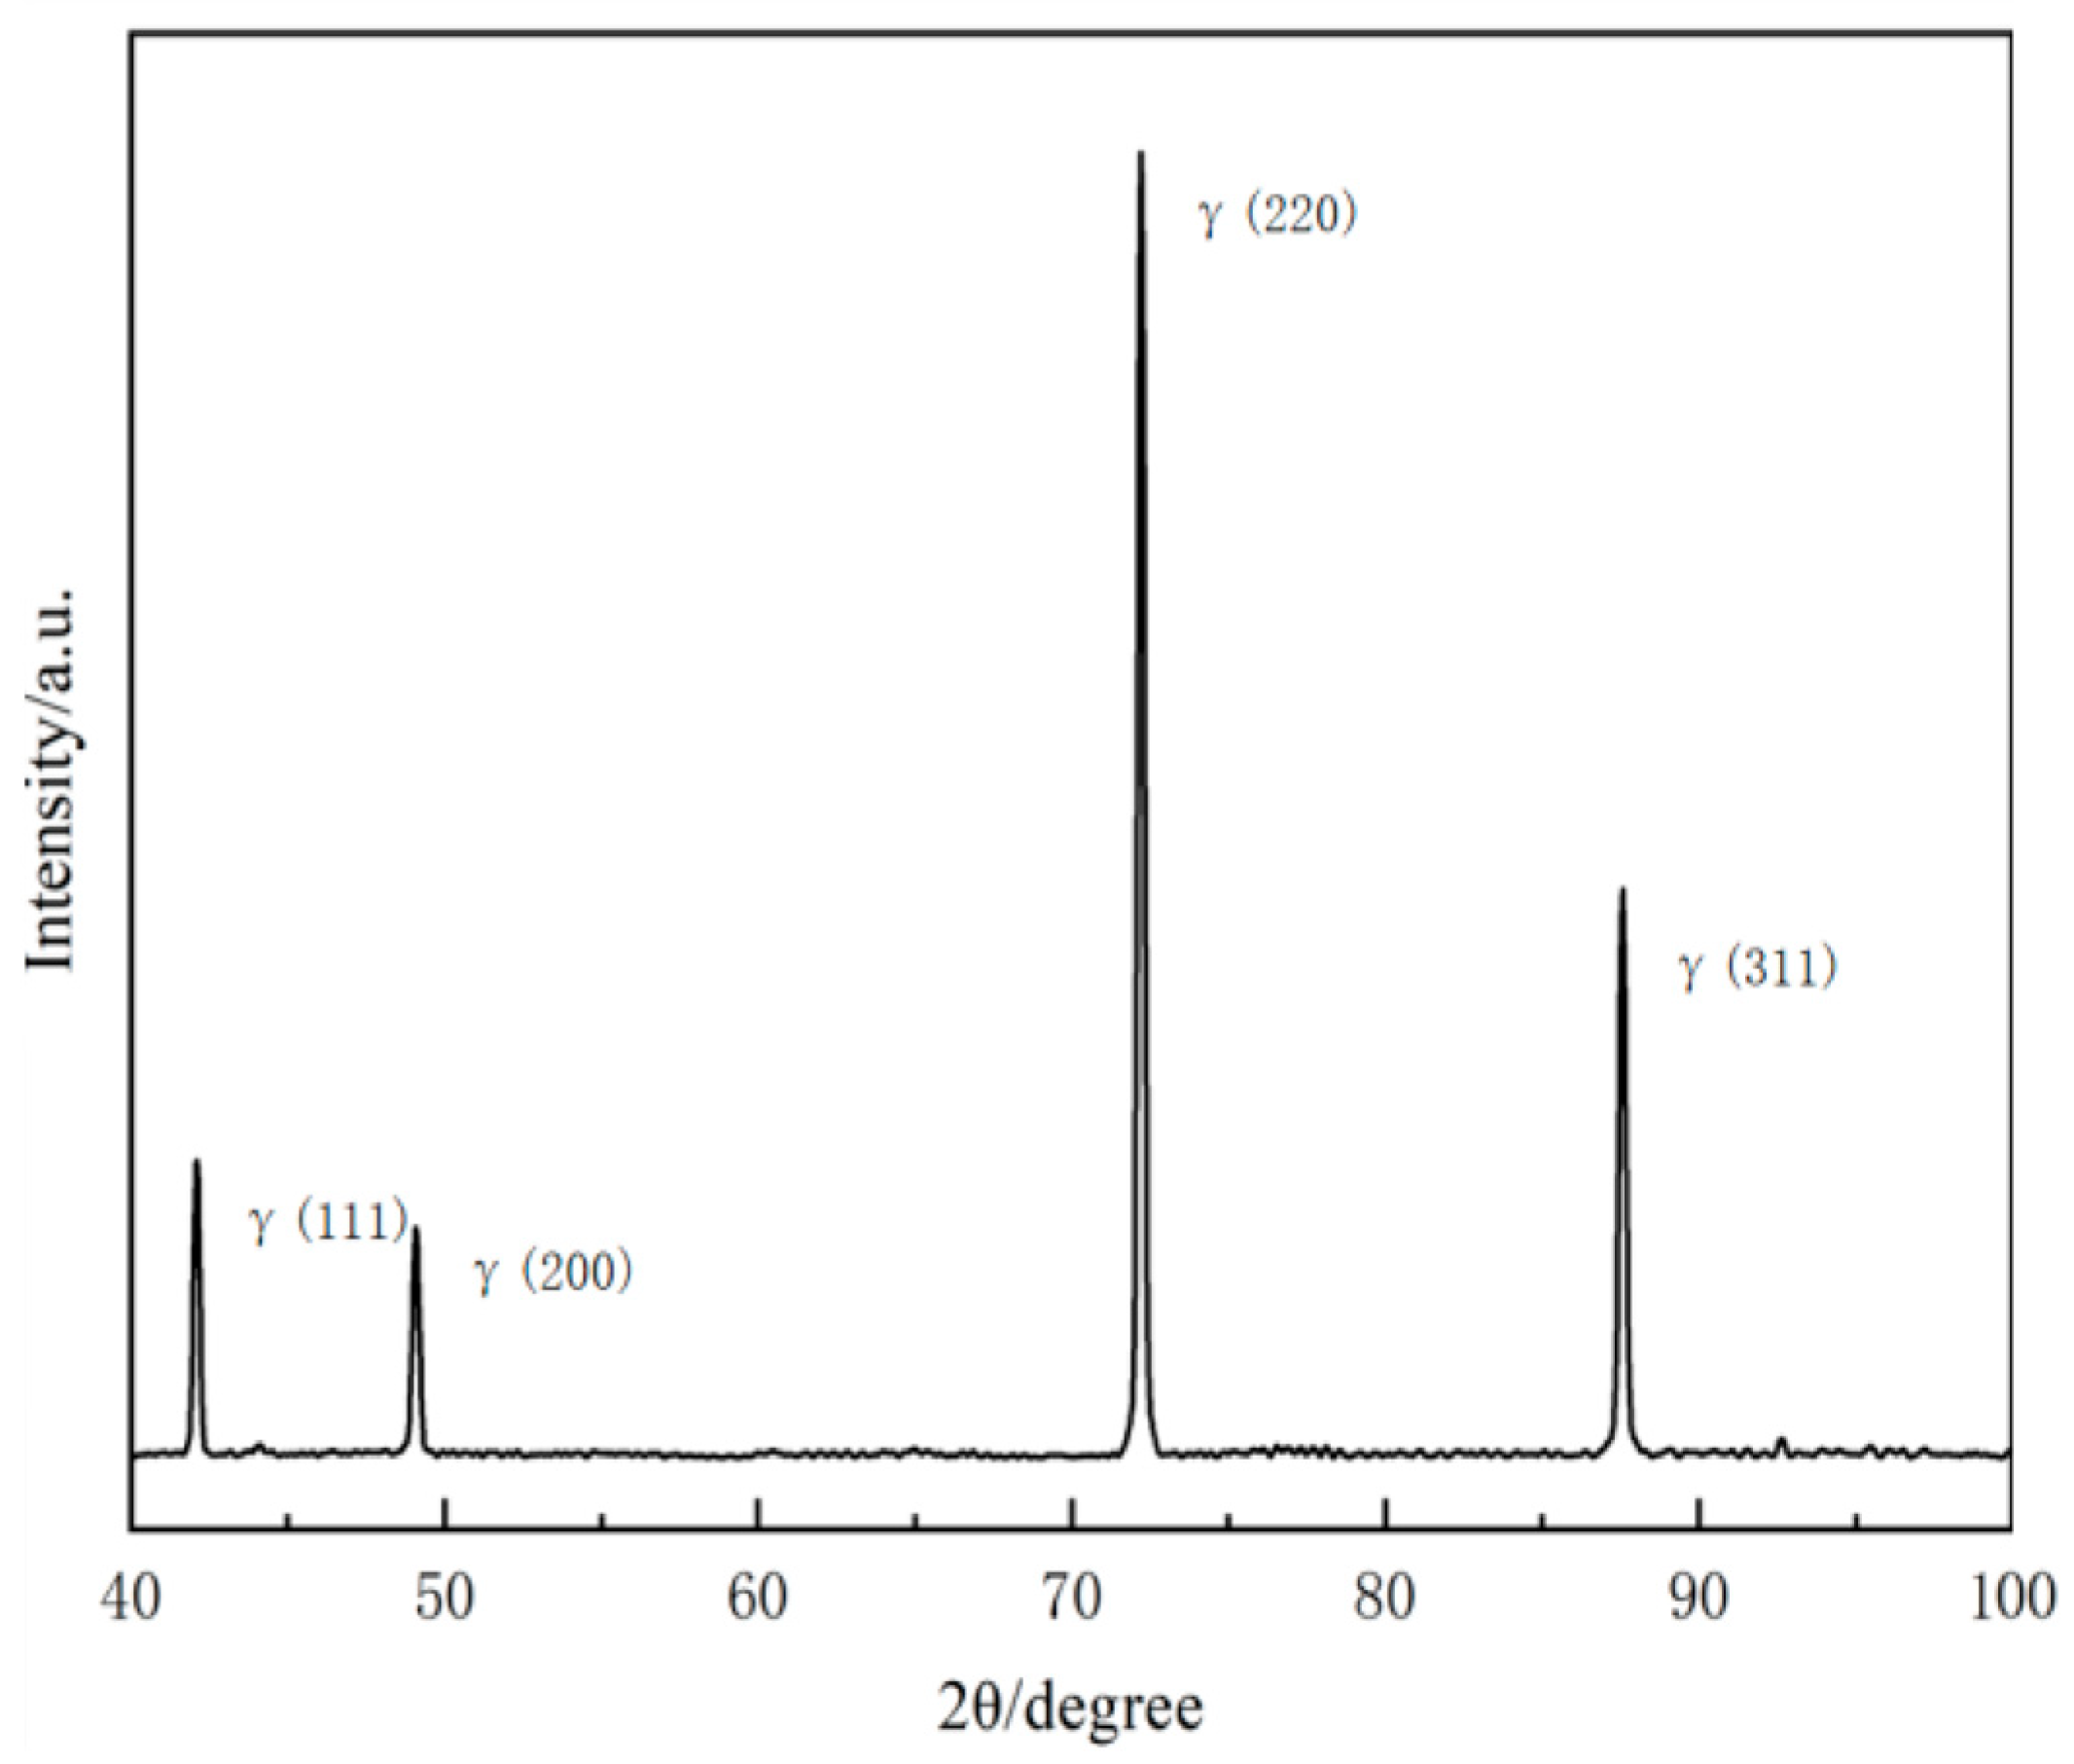
Figure 3 exhibits the X-ray diffraction (XRD) pattern of 28Mn-10Al cold-rolled annealed test steel following annealing for 30 min at 950 °C. The test steel exhibits a sole austenitic structure, with diffraction peaks predominantly comprising austenite (111), (200), (220), and (311), with (220) exhibiting the highest diffraction peak intensity.
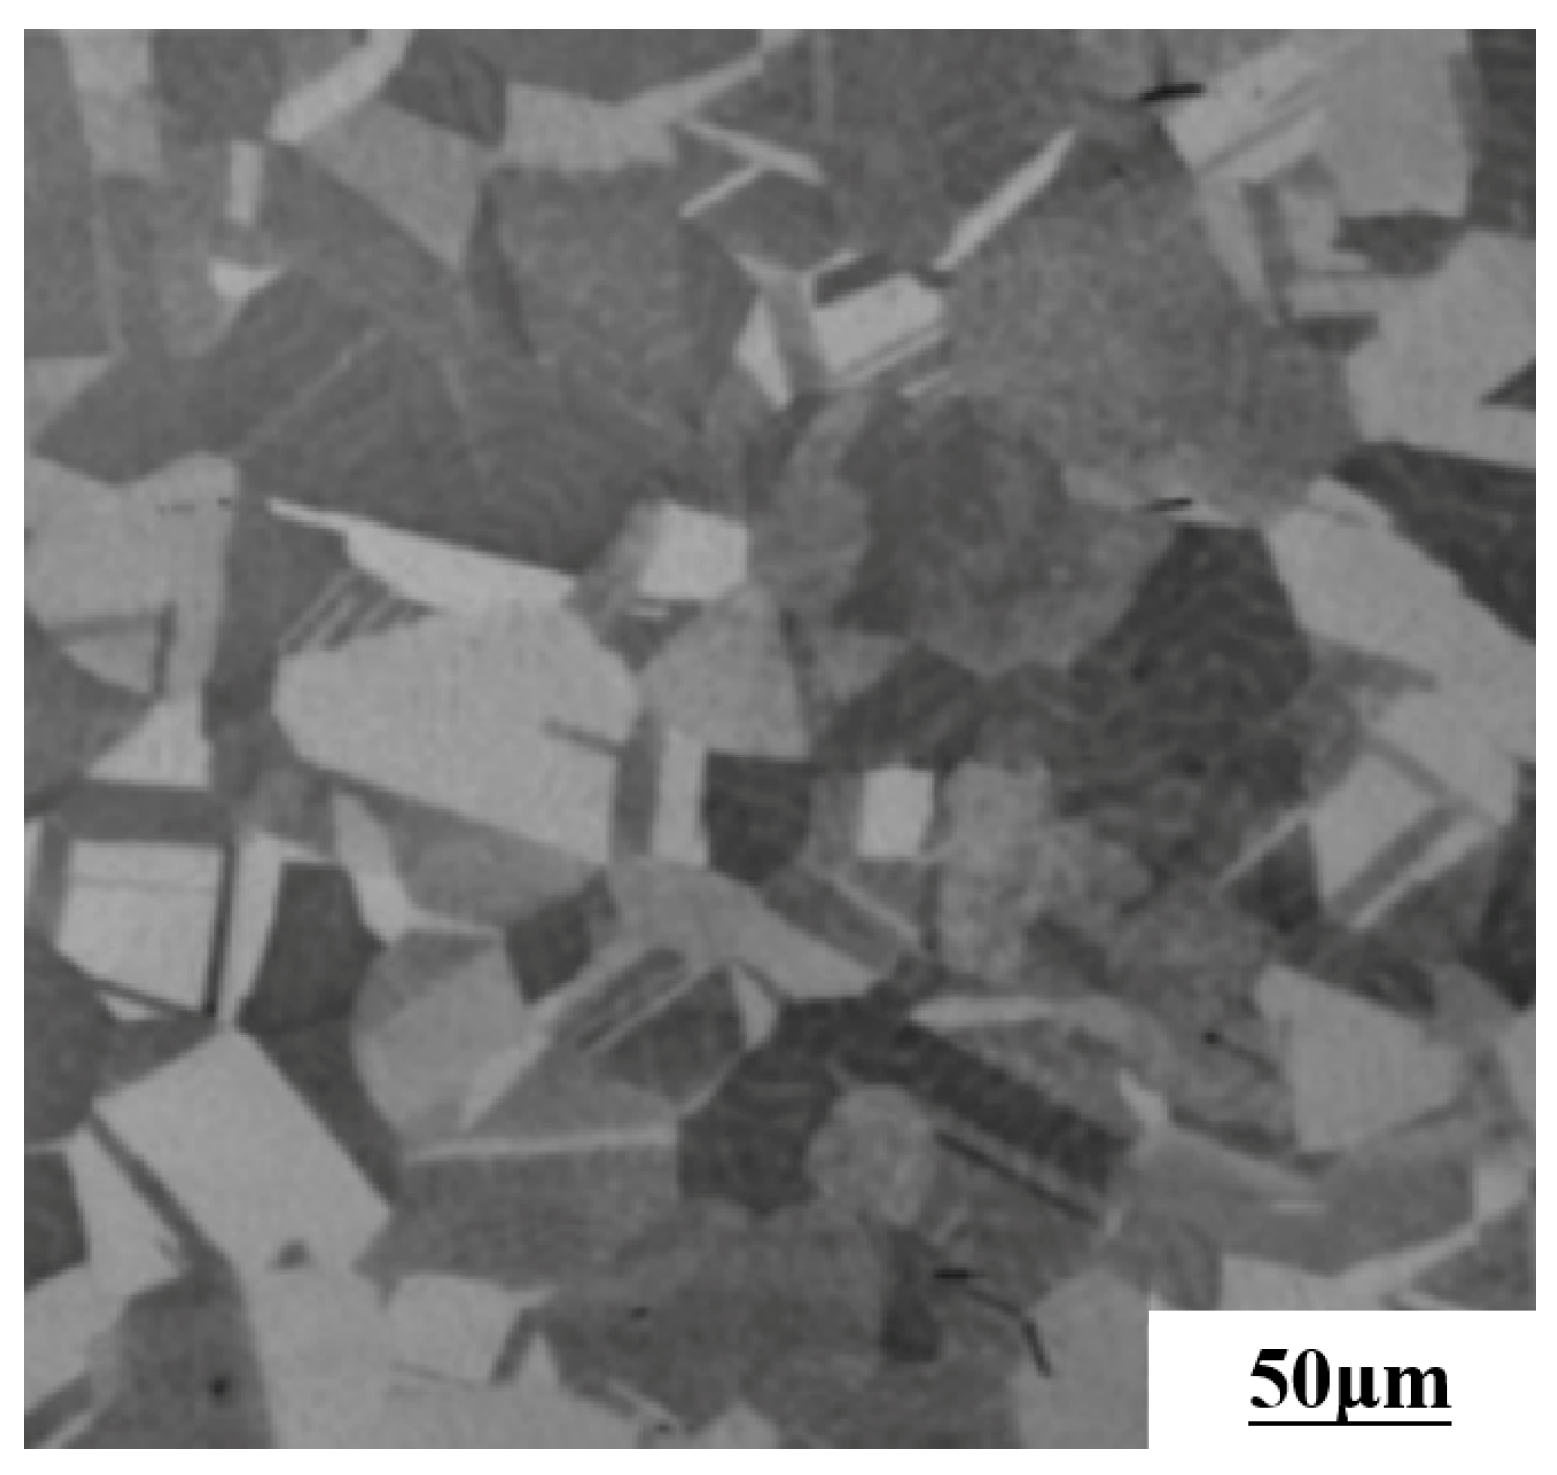
Figure 4 displays the microstructure of the 28Mn-10Al cold-rolled annealed test steel after annealing for 30 min at 950 °C. At 950 °C, austenitic grains transform into equiaxed grains with uniform size, and some grains form banded annealing twin crystals.

3.2. Analysis of Mechanical Properties

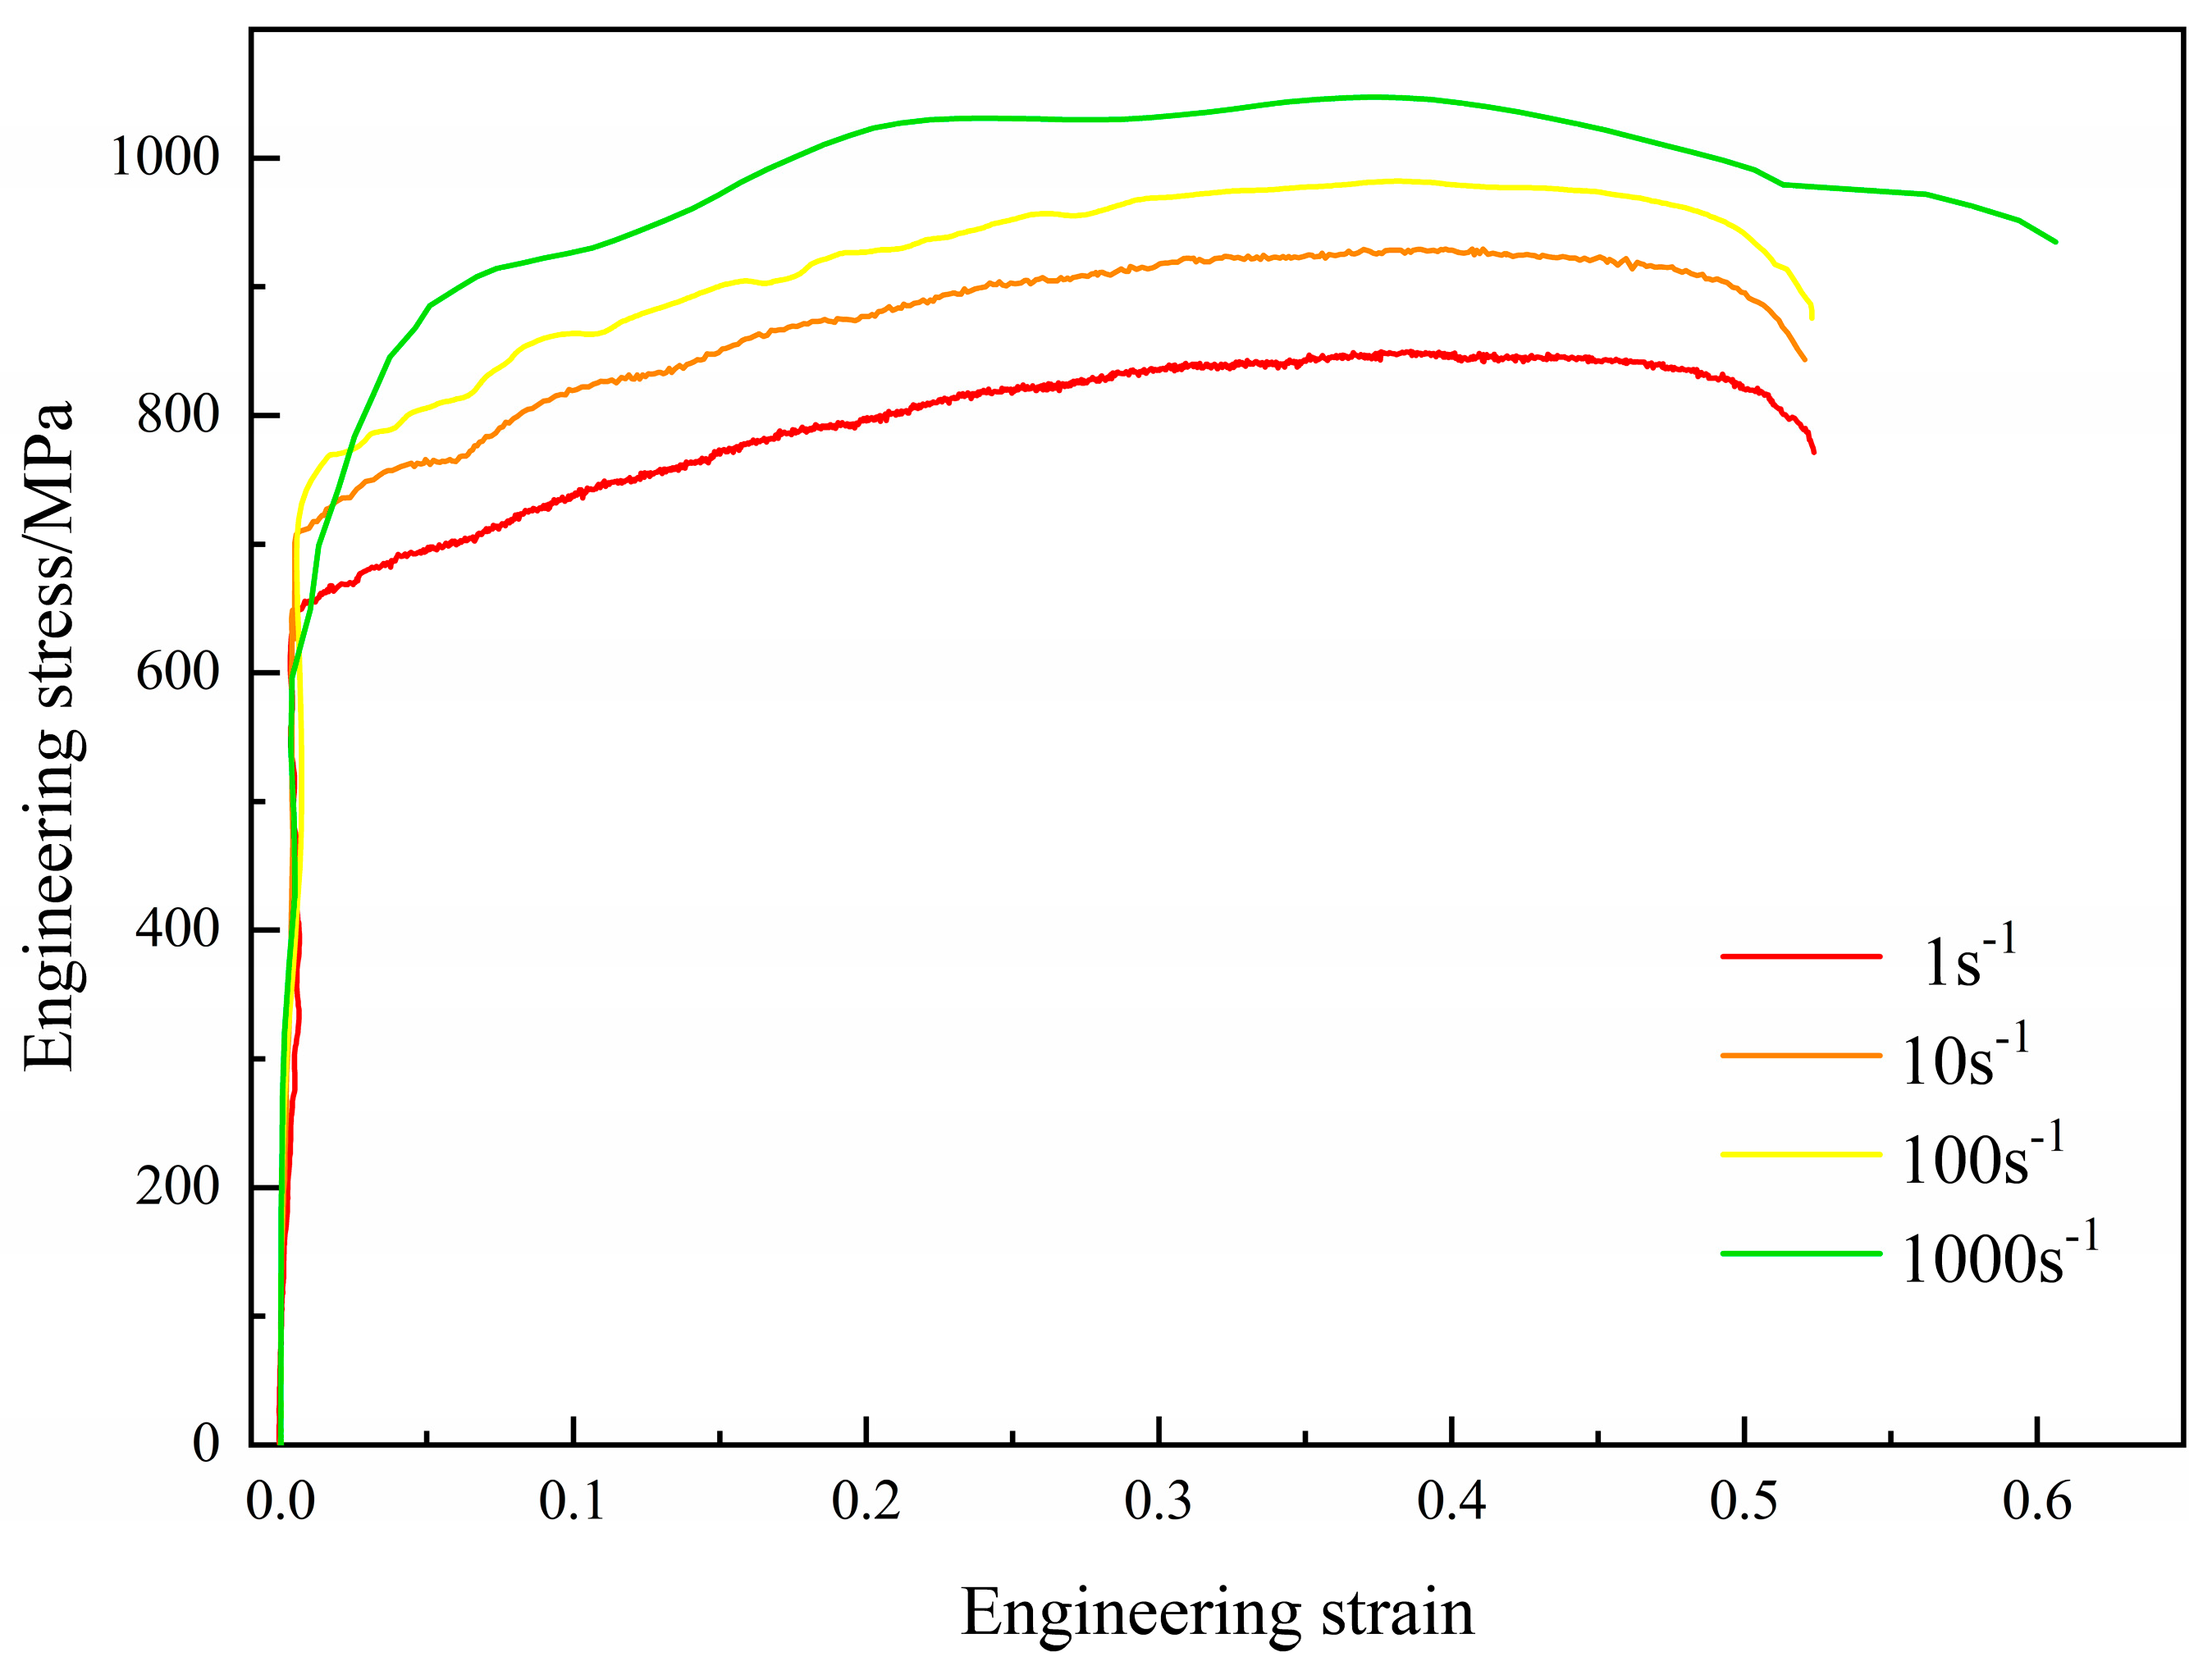
Figure 5 illustrates the engineering stress–strain curves of standard tensile specimens made of 28Mn-10Al cold-rolled annealed test steel after being subjected to various strain rates, as presented in Table 2, for the specific mechanical properties. The results indicate that the yield strength of the tested steel increases from 678 MPa to 907 MPa, and the tensile strength increases from 849.2 MPa to 1047.4 MPa, corresponding to an increase of 33.8% and 23.3%, respectively, as the strain rate increases from 1 to 103 s−1. The elongation remains almost constant in the strain rate range of 1 to 102 s−1 but increases significantly by 16.5% in the range of 102 to 103 s−1, as evidenced by the combined data presented in the figure and table.
The 28Mn-10Al cold-rolled annealed test steel exhibits a remarkable work-hardening ability [38]. As the strain rate increases, the dislocations face greater difficulty in coordinating their motion due to the large number of dislocations generated by constant proliferation and their entanglement. Simultaneously, the shear stress that the material can withstand and the shear stress that the material is subjected to also increase. In the case of polycrystalline materials, the operation of multiple slip systems is a crucial mode of motion coordination. Grains with different orientations are bound together, and when the yield strength of several sliding systems is reached, multiple sliding systems work in tandem to coordinate the strain. From another perspective, the time from plastic deformation with high strain rates to fracture is fleeting and can be considered a thermodynamic process that occurs without any loss or gain of heat. During this process, the vast majority of the strain energy is transformed into thermal energy. The thermal energy raises the temperature of the deformation zone, resulting in local softening of the material and an adiabatic temperature rise [39].
In conclusion, the combined effects of work hardening, multi-slip system operation, and adiabatic temperature rise may be the primary reason for the increased plasticity (elongation after breaking) and strength (yield strength, tensile strength) of the material when the strain rate increases from 1 s−1 to 103 s−1. In the following analysis, the mechanism of strain rate strengthening will be meticulously examined by combining the adiabatic heating curve, work-hardening curve, and strain rate sensitivity curve.
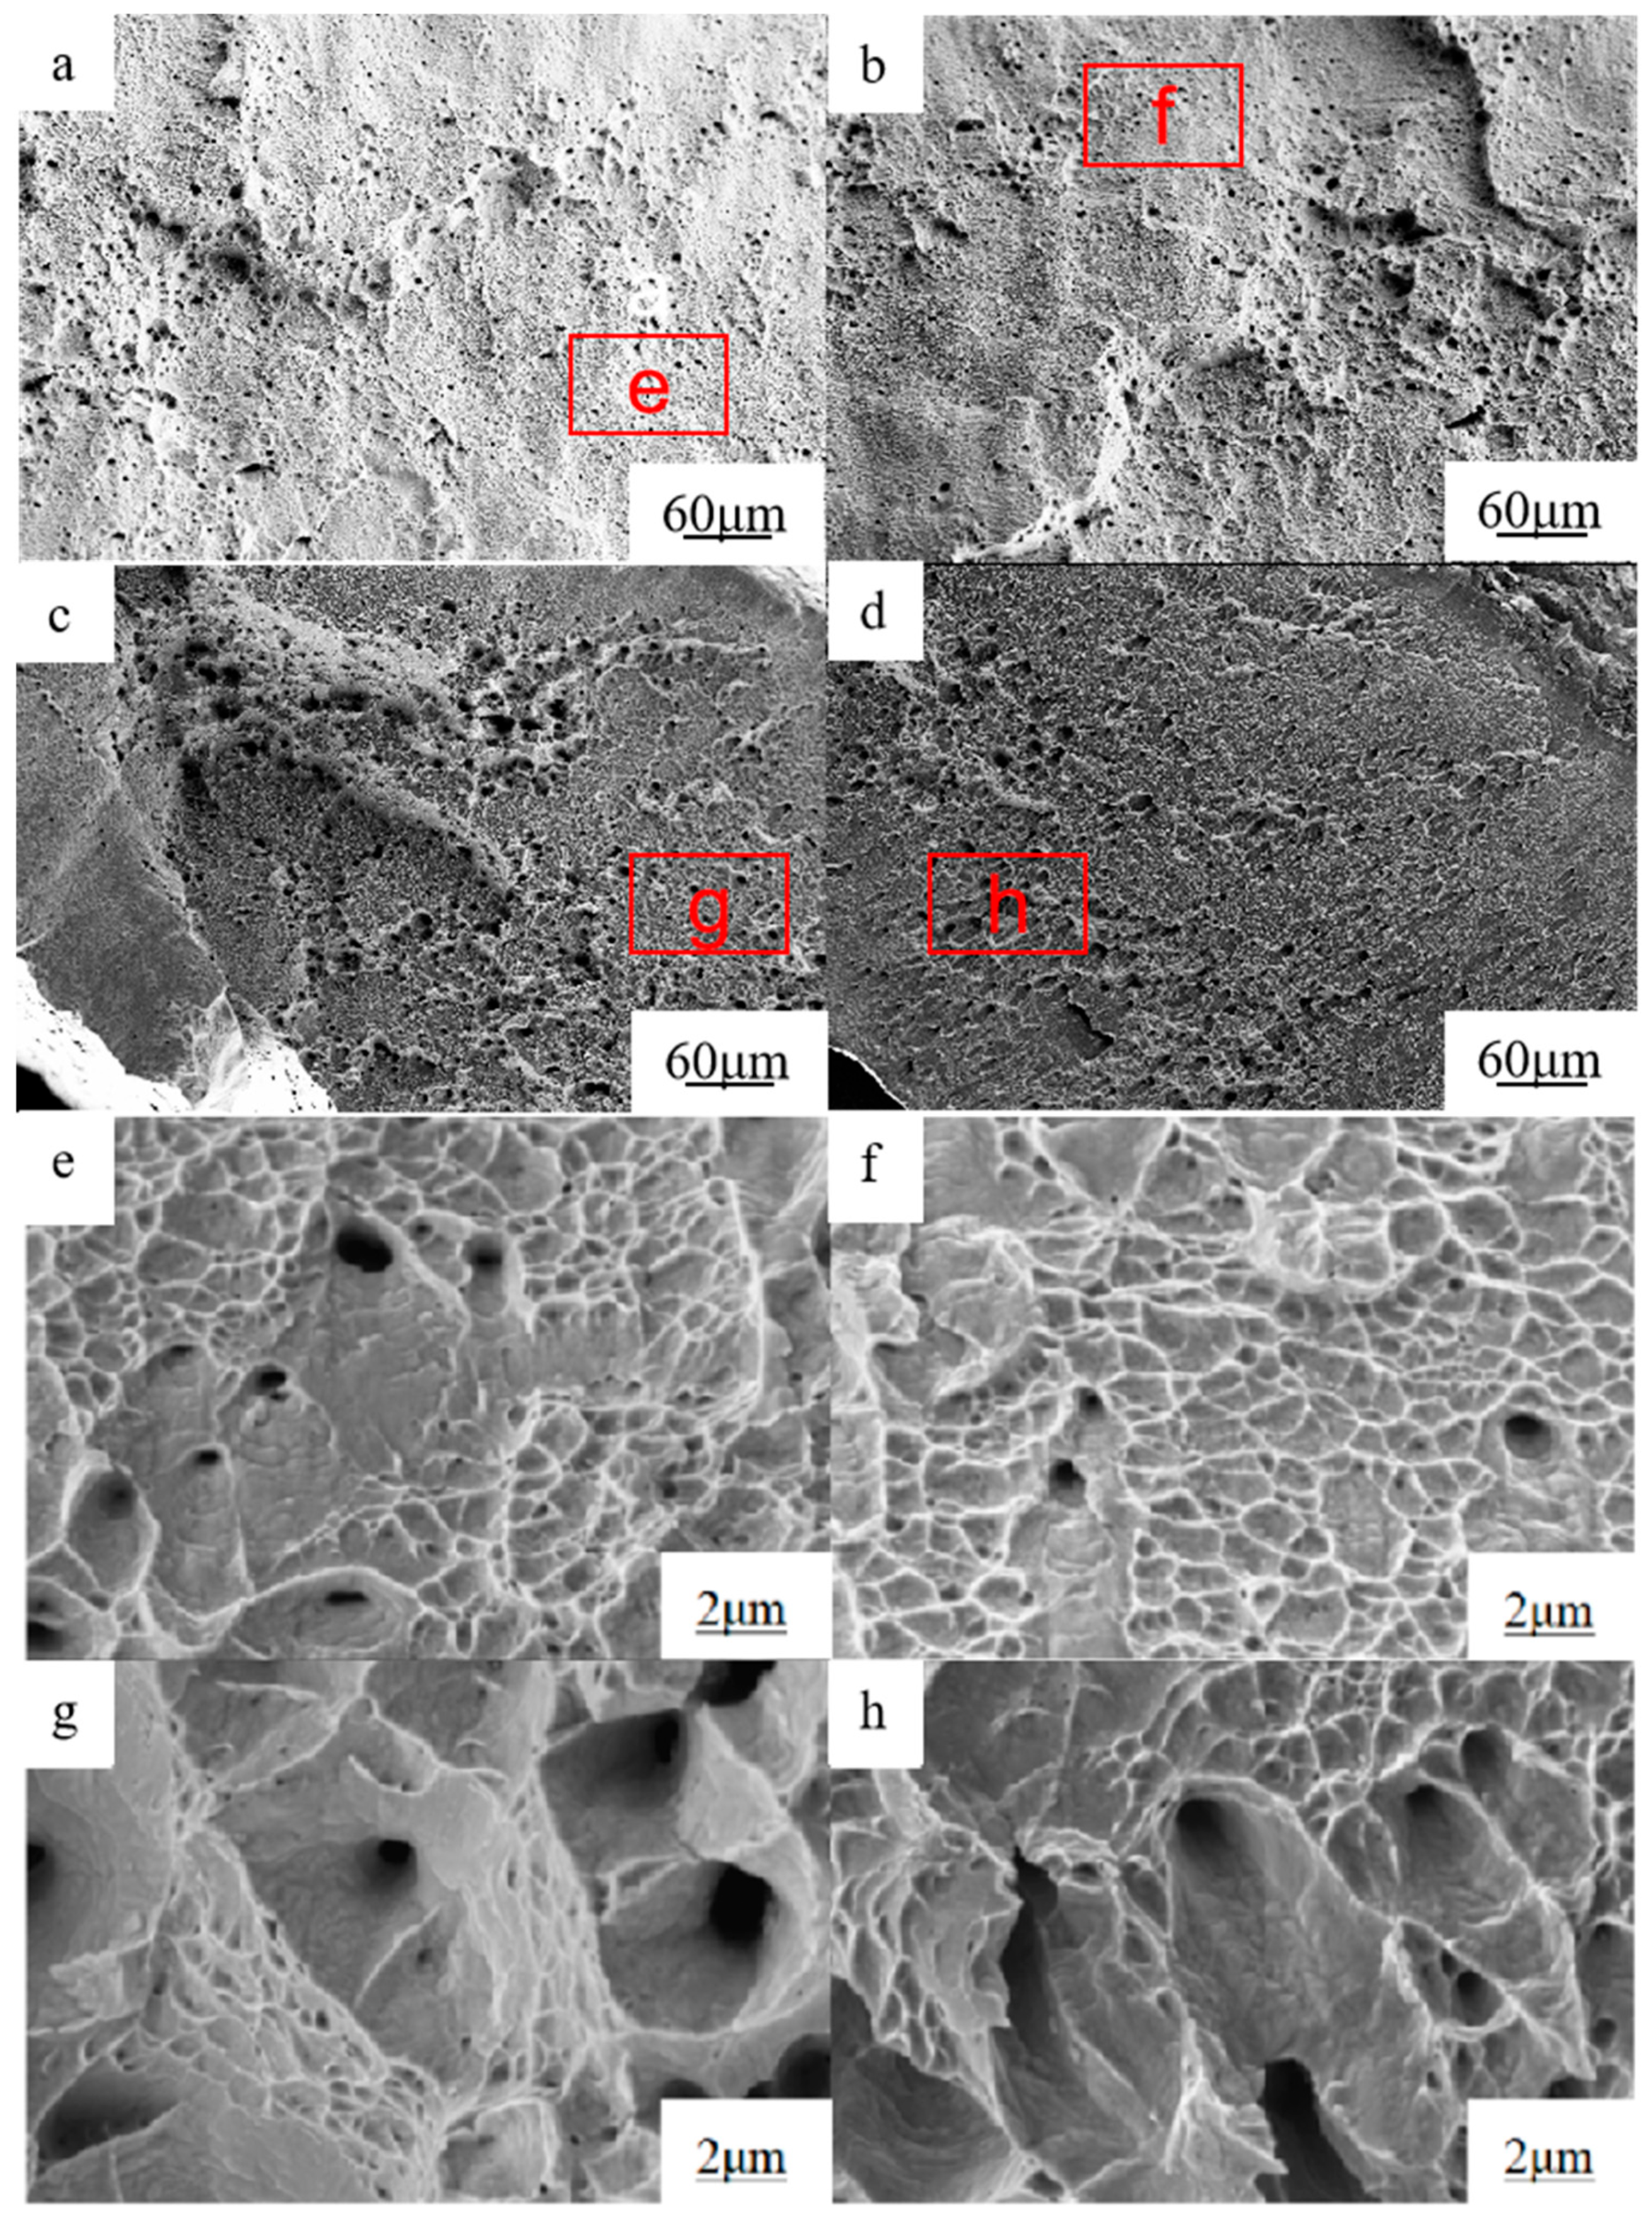
As depicted in Figure 6, the tensile fracture of 28Mn-10Al cold-rolled annealed steel under dynamic tension is characterized by a large number of dimples, indicating ductile fracture. As can be seen from Figure 6a,e, at a strain rate of 1 s−1, there are numerous equiaxial dimples of varying sizes, but the dimples are relatively shallow, and the plasticity is ordinary. As can be seen from Figure 6b,f, the size of dimples becomes more uniform at a strain rate of 10 s−1, but there is little difference in the morphology and plasticity of the dimples compared to the strain rate of 1 s−1. As can be seen from Figure 6c,g, at a strain rate of 102 s−1, the distribution of dimples is relatively uniform, and the dimples are relatively deep, resulting in slightly better plasticity than that observed at a strain rate of 10 s−1. As can be seen from Figure 6d,g, when the strain rate is increased to 103 s−1, the dimples become larger and deeper, and the plasticity reaches its maximum. The change in fracture morphology is consistent with the test results that plasticity increases first at a small amplitude and then at a large amplitude.

4. Discussion

4.1. Analysis of Dynamic Properties

Table 2 presents the relationship between strain rates and the yield strength as well as tensile strength of the test steel. The results indicate that higher strain rates lead to higher values of both yield strength and tensile strength. This phenomenon can be attributed to the fact that as the strain rate increases, the stretching process occurs within a significantly shorter time frame. This process can be considered adiabatic, as no heat is gained or lost during the stretching. At high tensile speeds, both strain hardening and softening occur, with the latter being caused by the temperature rise of the internal material. Due to the transient nature of the high-strain-rate tensile process, the thermal energy generated from the strain energy cannot be fully dissipated in such a short period of time.
Consequently, local temperature rises, leading to the adiabatic heating effect. It is hypothesized that a portion of the mechanical energy in the dynamic tensile experiment is converted into heat energy. The calculation formula for the temperature increase is presented in Equation (1) [40]:
Δ T = Δ Q ρ C p = β ρ C p ε 0 ε 1 σ d ε
In the presented formula, ΔQ represents the magnitude of mechanical energy that is transformed into thermal energy. The variables ρ, CP, β, σ, and ε denote the density of the test steel, specific heat capacity, coefficient of conversion of mechanical energy into heat energy, true stress, and true strain, respectively. With respect to Fe-Mn-Al-C high-specific-strength steel during the dynamic tensile process, the coefficient of conversion of mechanical energy into heat energy (β) is determined as 0.95, the density (ρ) is 7.14 g/cm3, and the specific heat capacity (CP) is 0.46 kJ/(kg·K). The mechanical energy is computed by integrating the true stress–strain curve. Formula (1) enables the calculation of the adiabatic temperature rise (ΔT) of the test steel after stretching at various strain rates. The results can be visualized through the use of Figure 7, which is plotted using Formula (1).
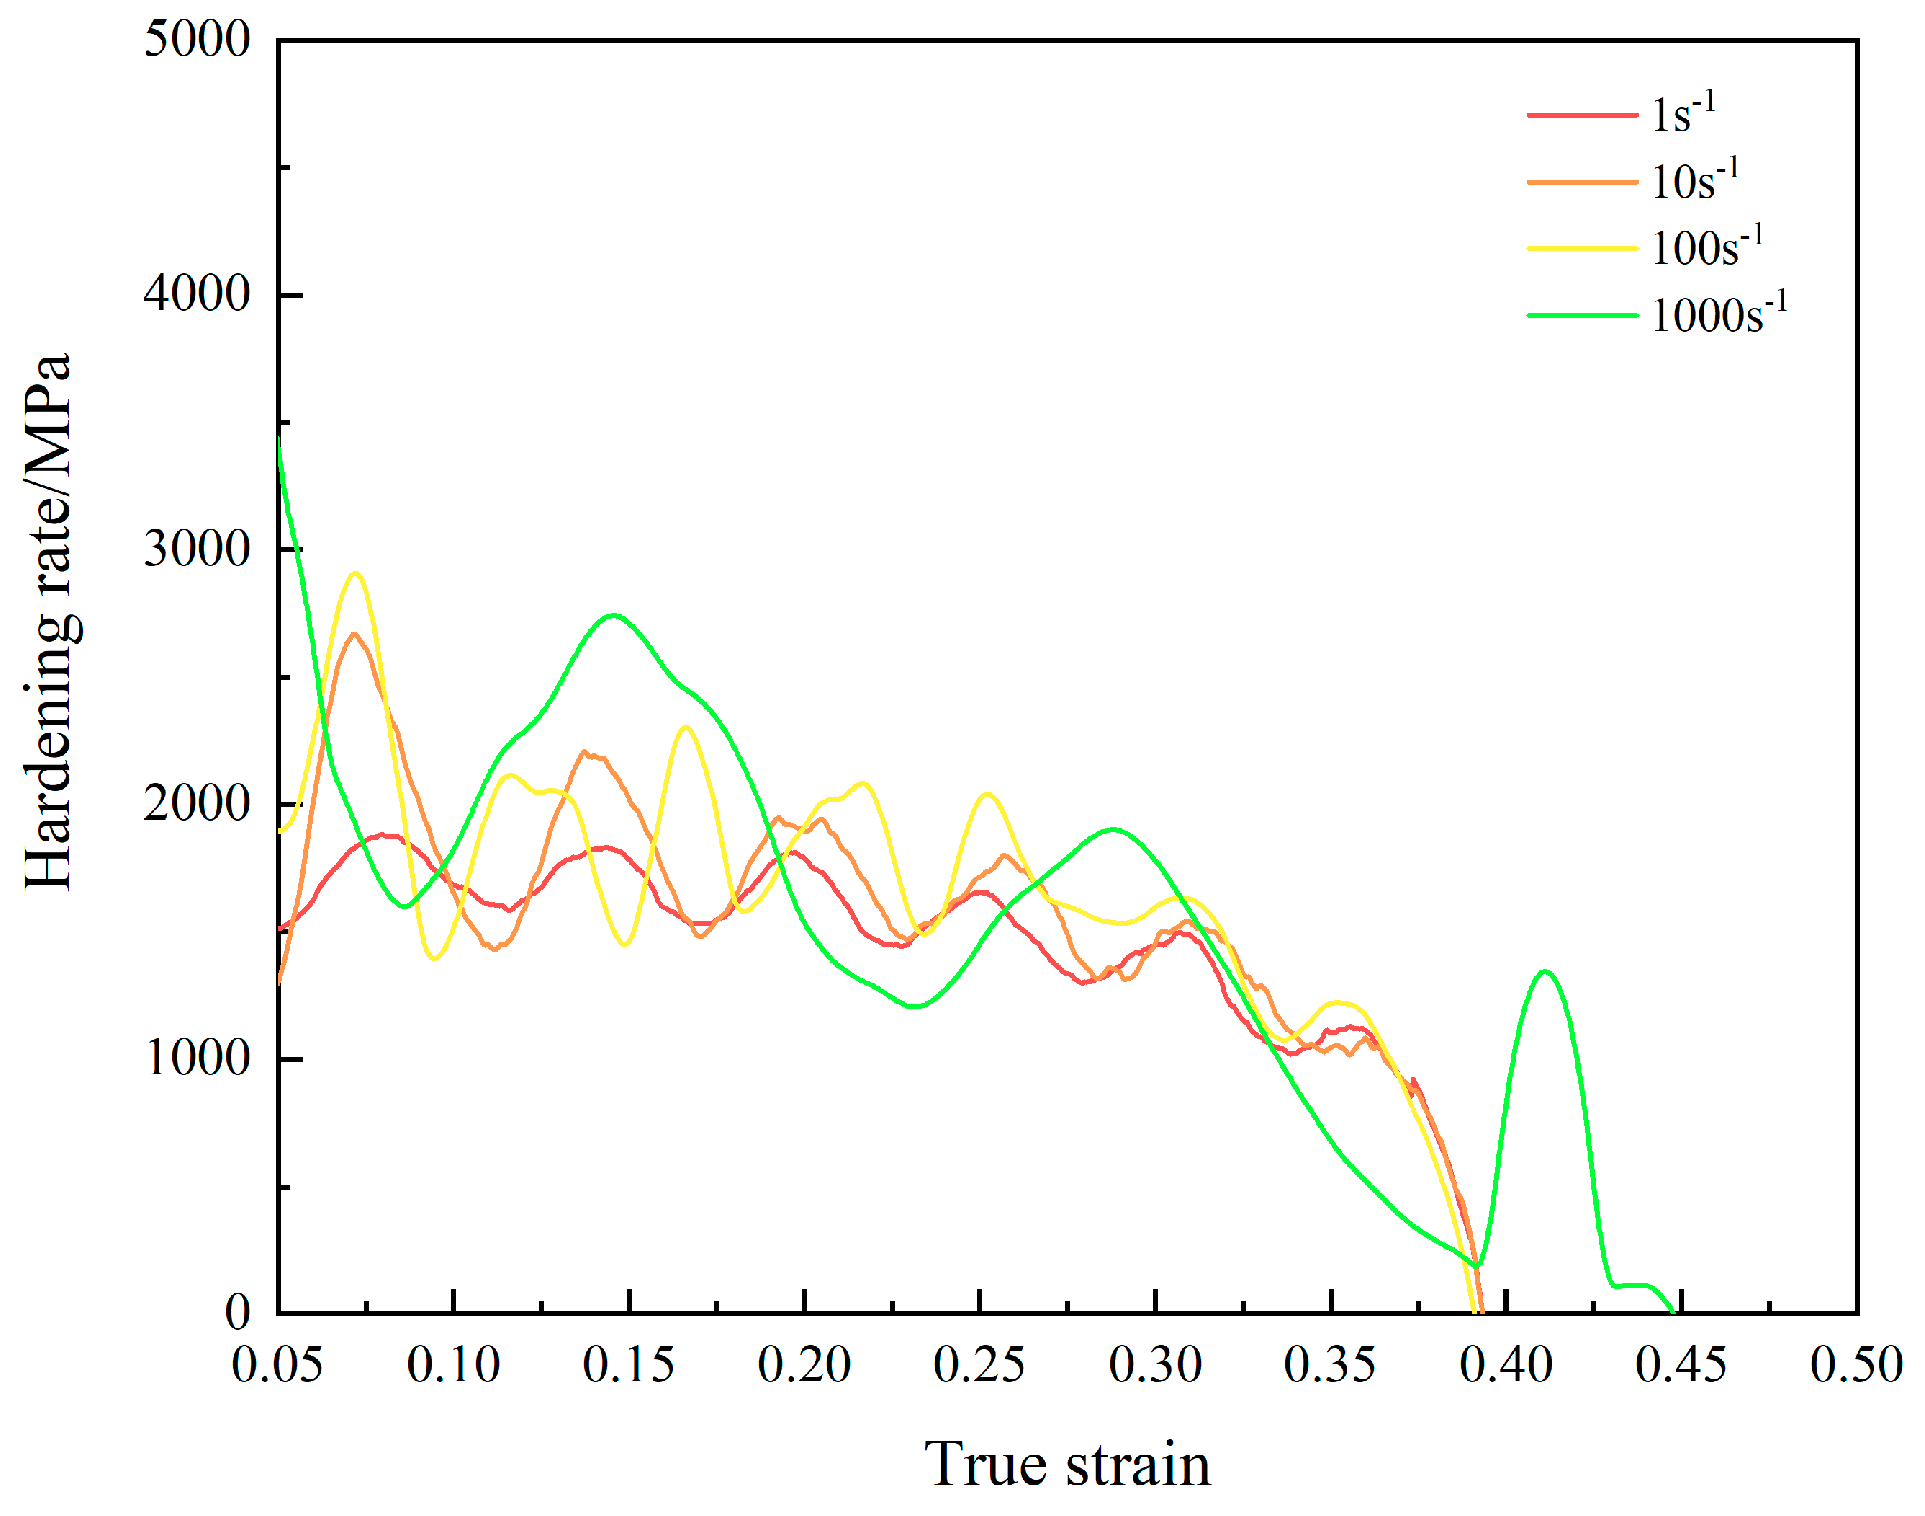
As depicted in Figure 7, the adiabatic temperature rise resulting from dynamic tensile deformation with strain rates of 1, 10, 102, and 103 s−1 causes the temperature of the test steel to increase by approximately 124, 135, 142, and 177 °C, respectively. Notably, the adiabatic heating effect initially increases insignificantly and then experiences a sudden substantial increase with the rise in strain rate. Figure 8 (the work-hardening curve) exhibits a similar trend to that of the adiabatic temperature rise, intensifying with the increase in strain rate. The generation of adiabatic temperature rise necessitates the accumulation of strain, thus resulting in a relatively small proportion of temperature rise during the initial phase of deformation, during which strain hardening dominates. The adiabatic temperature rise escalates with the increase in strain. The interaction between strain softening caused by adiabatic temperature rise and work hardening ensures stable flow, leading to a high strain-hardening rate and improved plasticity. This phenomenon is consistent with the observation that the plasticity of 28Mn-10Al cold-rolled annealed steel remains almost constant initially and then increases significantly with the rise in strain rate.
As depicted in Figure 5 and Table 2, the yield strength of the test steel exhibits a monotonic increase with the rise in strain rate from 1 s−1 to 103 s−1. The tensile strength also increases with the increase in strain rate, and the elongation experiences a slight increase from 1 s−1 to 102 s−1 and a significant increase from 102 s−1 to 103 s−1. These observations indicate that the plasticity and strength of the test steel are significantly altered by the strain rate, with the strength of the material exhibiting a marked increase at higher strain rates, demonstrating notable strain rate sensitivity.
The strain rate sensitivity index m of material strength can be calculated using Formula (2) [41] to describe the strain rate sensitivity of material strength:
m = l n σ l n ε ˙
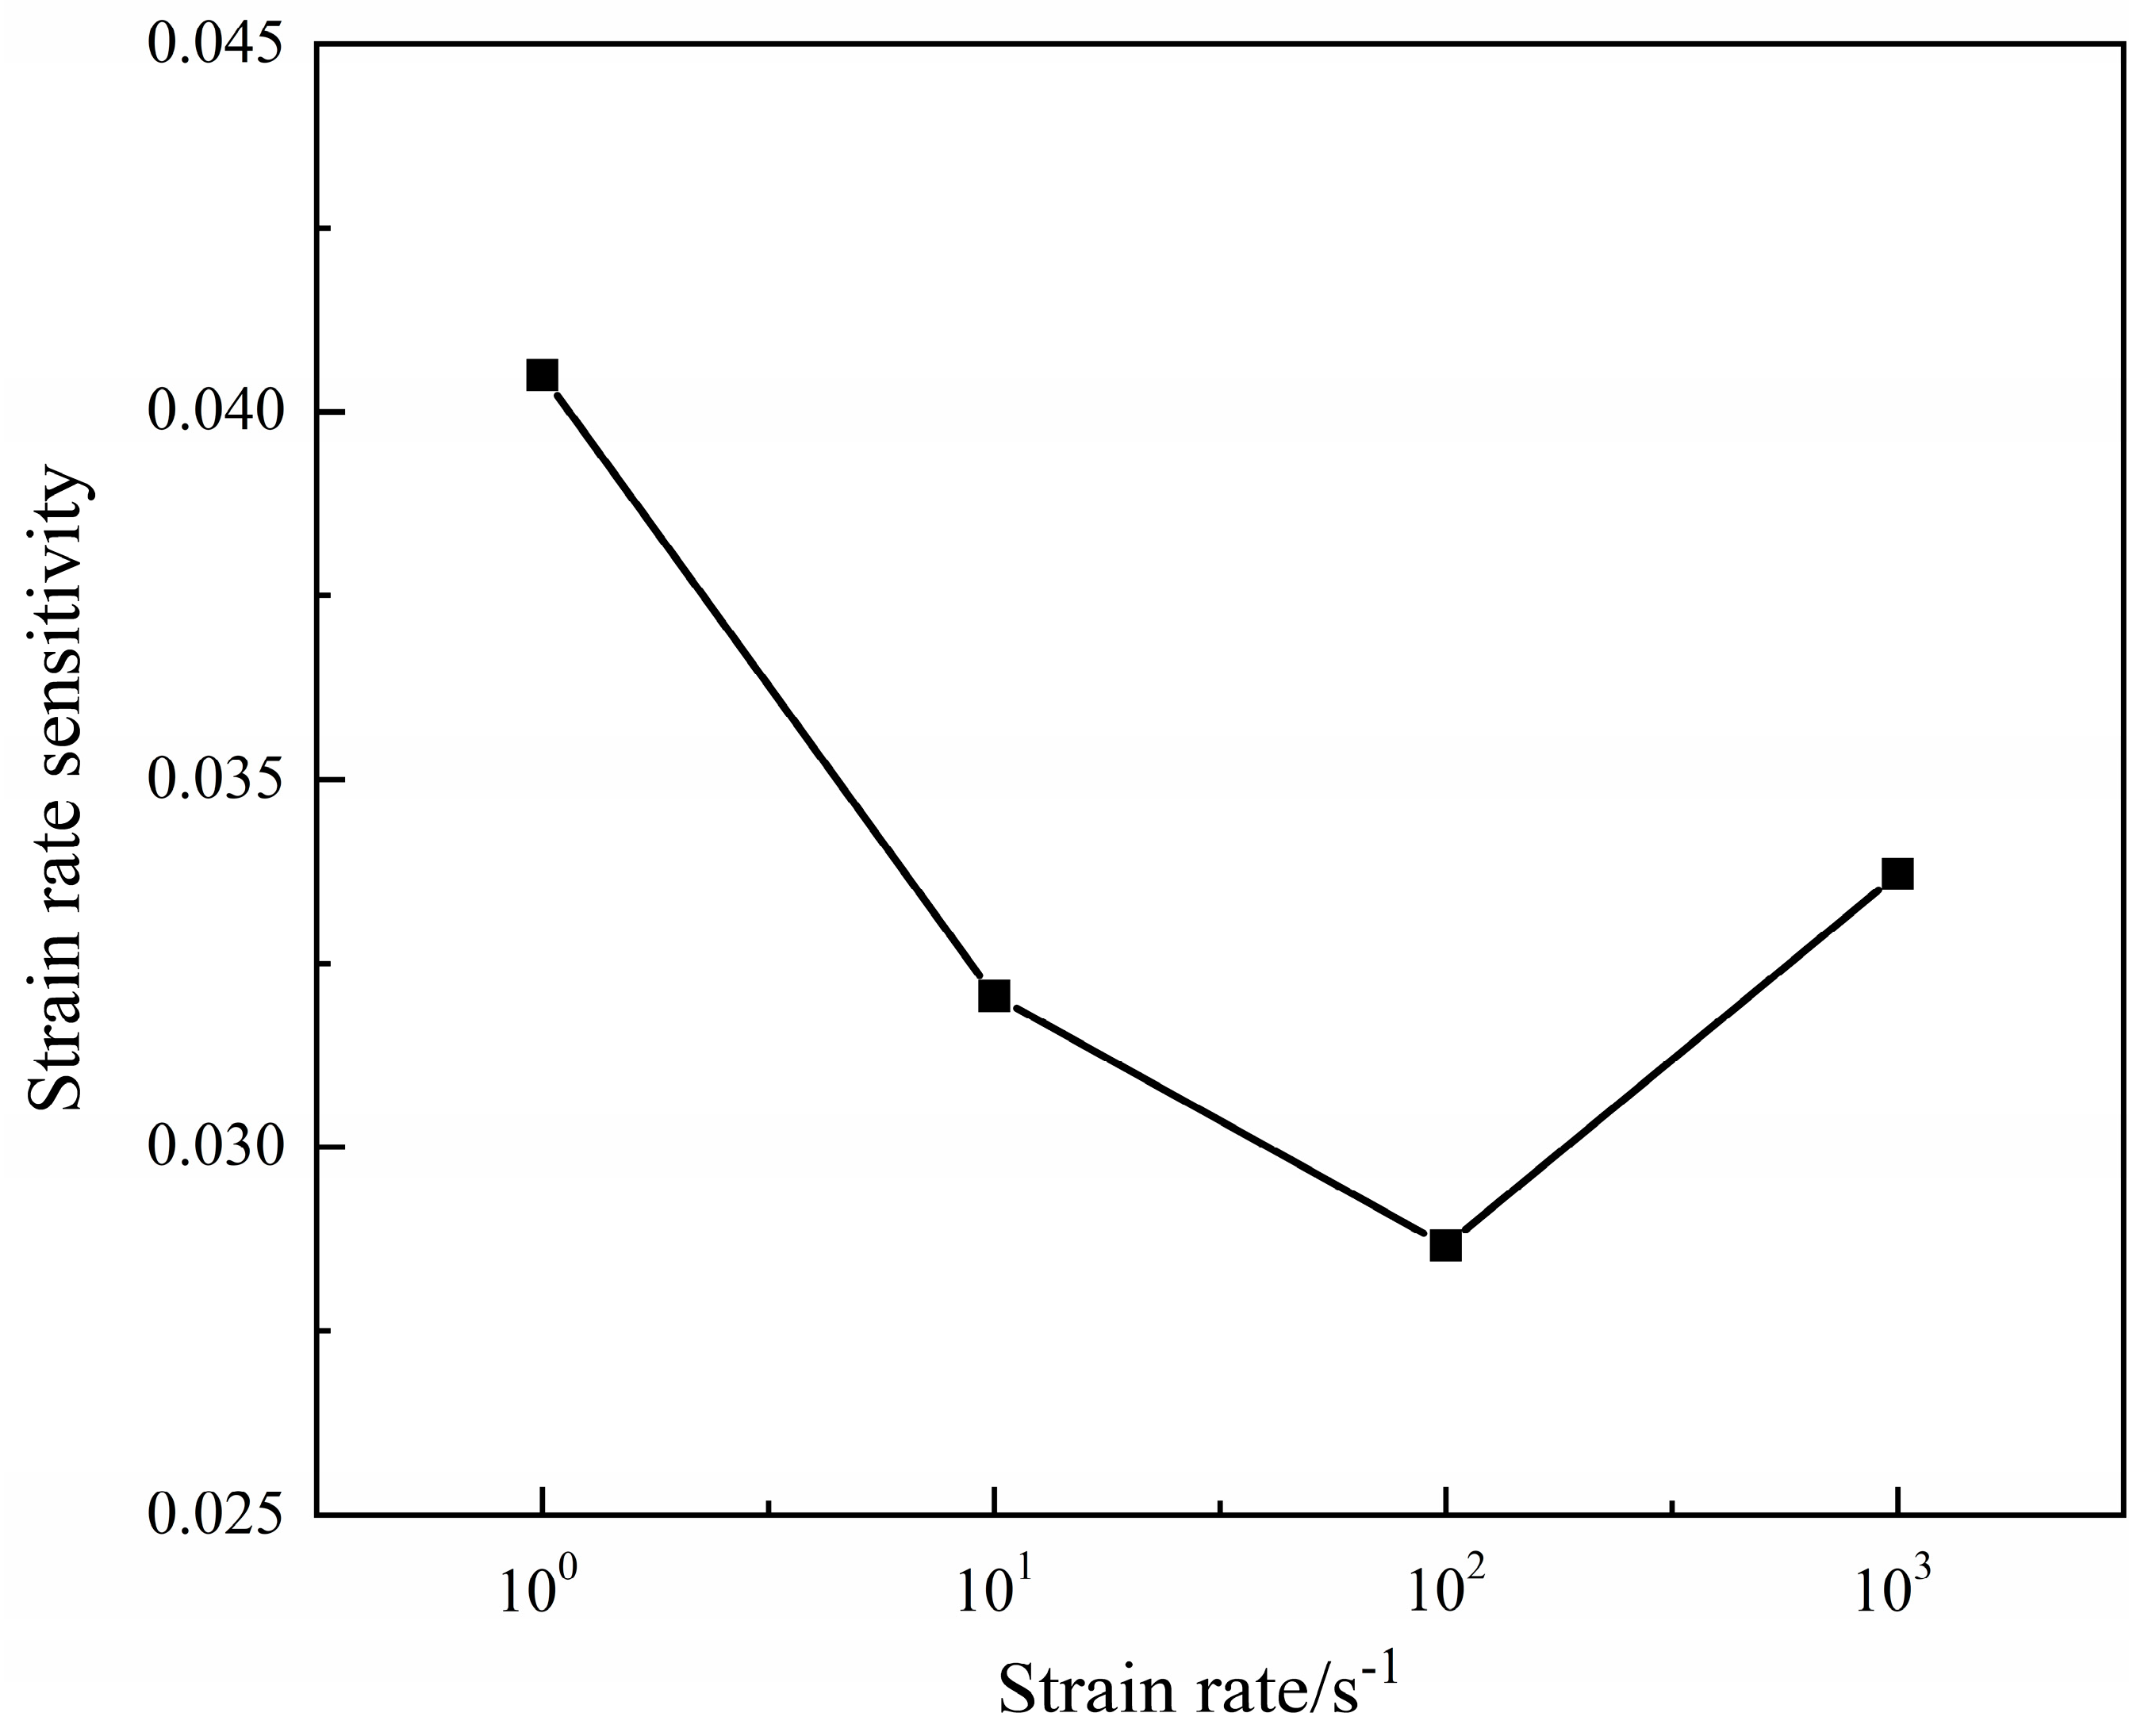
The presented formula features the flow stress (σ) as a function of the strain rate ( ε ˙ ). As illustrated in Figure 9, the strain rate sensitivity index m exhibits a relatively large value of approximately 0.041 at a strain rate of 1 s−1. At a strain rate of 10 s−1, the m value is approximately 0.032, whereas it is relatively small, about 0.0275, at a strain rate of 102 s−1. The m value rises to approximately 0.034 when the strain rate is 103 s−1. Given that the process of metal plastic deformation involves the sliding motion of dislocations, the observed fluctuations in strain rate sensitivity indicate a change in the mechanism of dislocation motion of the test steel during high-speed tensile [42].
Based on the principle of motion resistance of dislocations, an increase in the strain rate is accompanied by an increase in external force on the test steel in a tensile state. During the tensile process, the applied stress on the test steel increases proportionally with the strain rate, resulting in an acceleration required by dislocation motion, which is provided by the applied stress [43].
The main resistance to dislocation motion is attributed to point defects, line defects, and plane defects. Additionally, operating a dislocation within a crystal necessitates overcoming lattice resistance, also known as Peierls–Nabarro stress.
Recent studies [44] have demonstrated that the thermal vibration of atoms and extranuclear electrons can also impede the slip of dislocations. In a tensile state, the dislocation motion velocity is enhanced by increasing the strain rate, and the thermal vibration, Peierls–Nabarro stress, electron cloud resistance, and other factors that hinder dislocation motion are also intensified by an increasing strain rate.
Evidently, an increase in acceleration leads to an increase in dislocation velocity per unit time. In conjunction with the aforementioned studies and factors that impede dislocation motion, it can be inferred that a faster dislocation acceleration results in a greater number of dislocations overcoming defects, Peierls–Nabarro stress, thermal vibration of the crystal, and resistance of electrons outside the nucleus per unit time. Therefore, under dynamic deformation conditions, a higher strain rate leads to faster dislocation motion in the material, accompanied by a significant increase in resistance to dislocation motion. This phenomenon causes the strength of annealed 28Mn-10Al cold-rolled test steel to increase with increasing strain rate.
From the standpoint of the dislocation motion mechanism, an increase in dislocation motion acceleration impedes the relaxation process at high strain rates. Dislocations that are too late for decomposition and newly proliferated dislocations accumulate and become entangled, resulting in an increase in the number of dislocations. Dislocation motion typically releases obstacles through dislocation climbing or dislocation decomposition. However, compared to dislocation slip, these processes require more time to proceed [43]. As the strain rate increases, there is insufficient time for dislocations to hinder release, leading to more severe strain hardening of the material and requiring more force to drive additional dislocation movements. Deformation coordination mechanisms, such as dislocation climbing, decomposition, and crystal rotation, also require a certain amount of time, which is difficult to achieve under high-speed tensile conditions. In the meantime, for metal polycrystalline materials under high-speed tensile conditions, it is more effective to operate multiple slip systems simultaneously to coordinate deformation, and the probability of occurrence is greater [45,46]. As the strain rate increases from 1 s−1 to 103 s−1, the time required for other deformation coordination mechanisms becomes increasingly insufficient, leading to a gradual decrease in their contribution to deformation coordination. However, the coordinated deformation mechanism of multi-slip systems does not exhibit obvious time dependence. Therefore, the coordinated deformation mechanism of multi-slip systems is the primary deformation coordination mechanism of 28Mn-10Al annealed test steel under high-speed tensile conditions.
During dynamic tensile deformation, the test steel is affected by strain hardening, strain rate strengthening, and adiabatic temperature rise softening. Among them, work hardening and strain rate strengthening enhance the strength of the test steel, and the adiabatic temperature rise effect occurs during the plastic flow stage, which can reduce the contribution of strain hardening and strain rate strengthening to the strength to a certain extent. However, the results indicate that work hardening and strain rate strengthening of 28Mn-10Al cold-rolled annealed steel play a dominant role in the process of increasing strain rate from 1 s−1 to 103 s−1.
The plasticity of the material also increases with an increasing strain rate, which is attributed to the combined effects of work hardening, multi-slip system operation, and adiabatic temperature rise. The interaction between strain hardening and the adiabatic temperature rise effect, caused by work hardening and strain rate strengthening, as well as the coordinated deformation caused by multi-slip system operation, maintain stable metal flow under high-tensile-speed conditions. It is not until the work-hardening effect attenuates with increasing strain that the specimen begins to experience necking fracture. As a result, the plasticity of the material is significantly improved (as evidenced by an increase in elongation after breaking).

4.2. EBSD Analysis of Test Steel

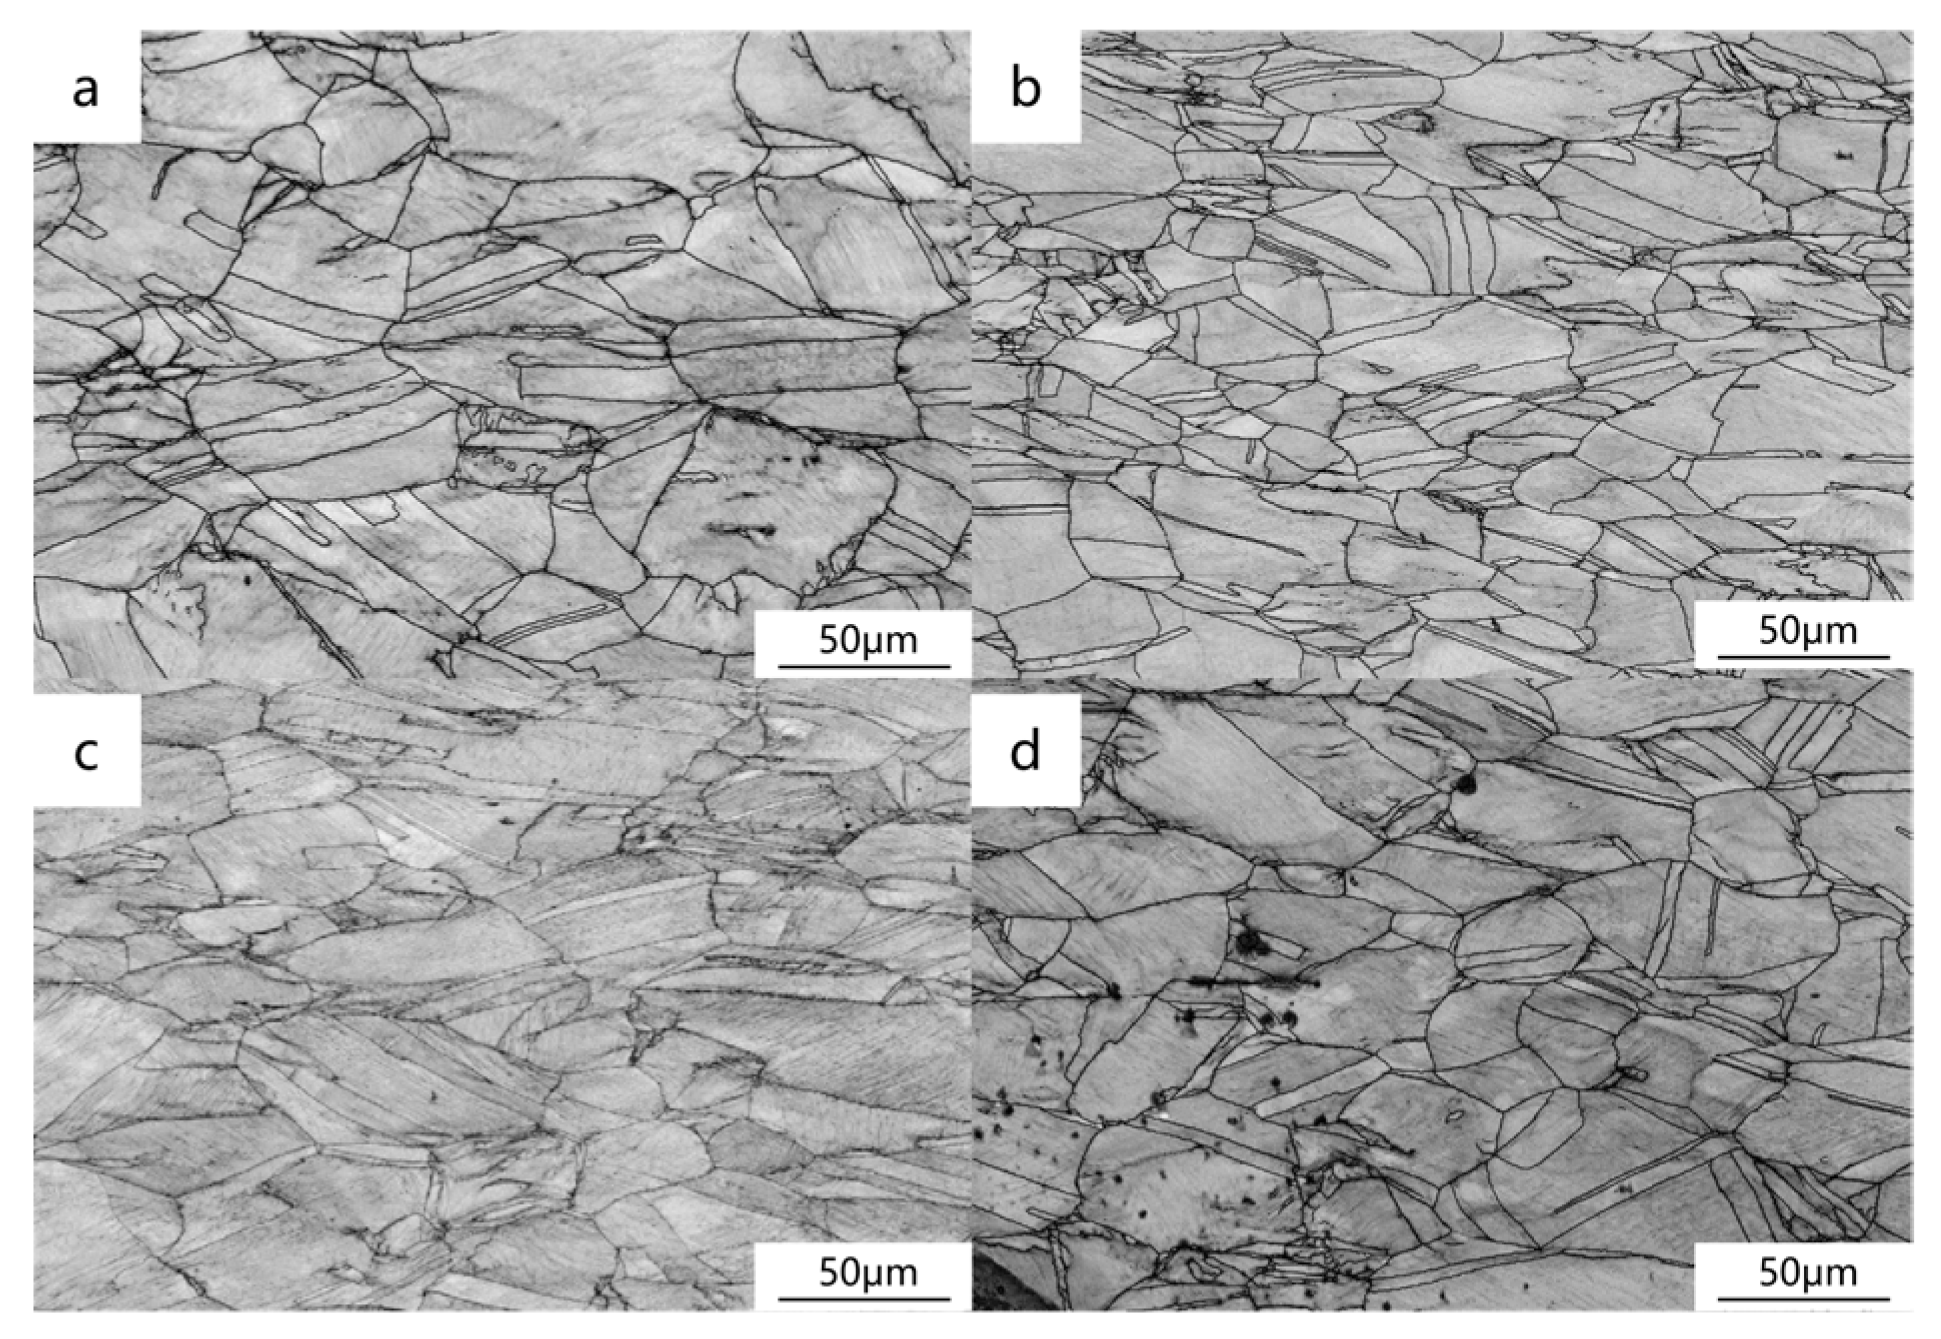
From Figure 10, it can be observed that the sample grains are elongated, and there are obvious annealing twins present, with visible staircase-like slip bands.
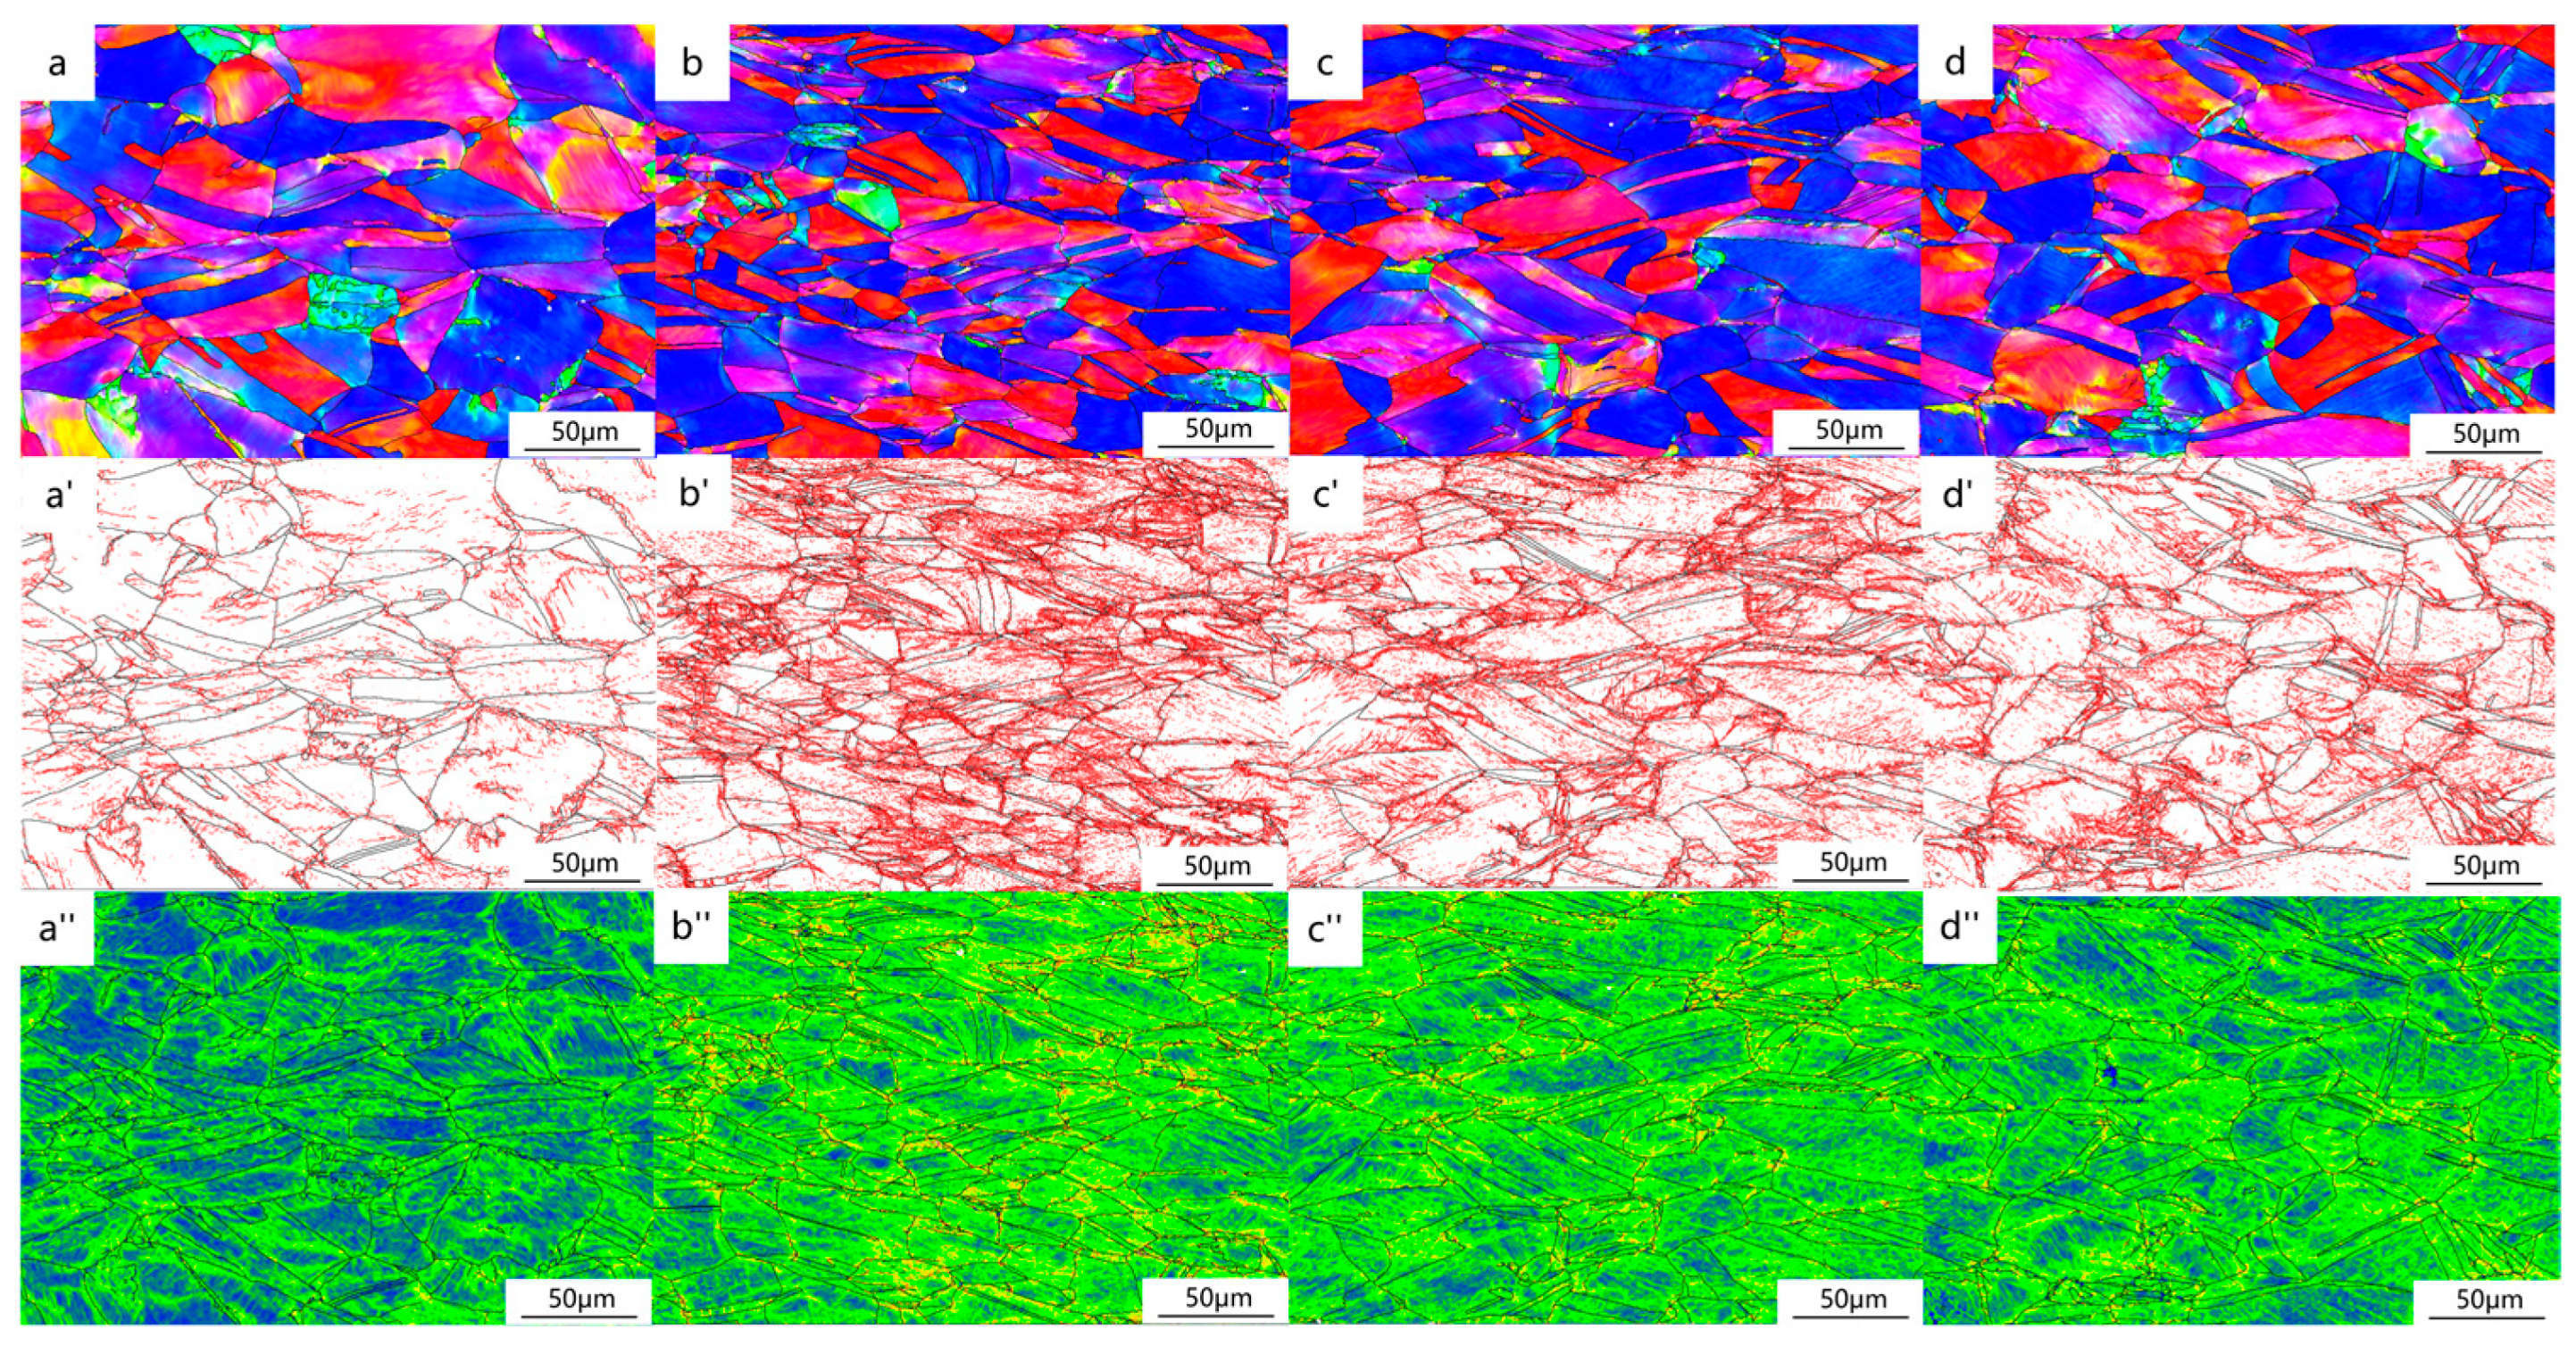
It can be observed from the Figure 11a–d that there are grains with basically consistent colors within the grains, as well as a large number of grains with uniform colors within the grains. This is because the deformation inside the same grain is uneven, and the grain rotates to adapt to the uneven deformation, resulting in orientation gradients.
The red part in Figure 11a’–d’ represents the small-angle grain boundaries, and the black part represents the large-angle grain boundaries. It can be observed from the figure that there are a large number of small-angle grain boundaries inside the large-angle grain boundaries, and the small-angle grain boundaries are mainly concentrated around the large-angle grain boundaries.
The average value of KAM, θ, can be theoretically calculated from the density of geometrically necessary dislocations (GND), and the density of GND, ρGND, can be calculated using Formula (3) [47]:
ρ G N D = a θ μ b
In the above formula, a represents a constant that depends on the boundary geometry, θ denotes the average KAM value, μ indicates the step size of the EBSD testing scan, and b represents the Burgers vector.
In Figure 11a”–d”, the closer the color is to red, the higher the dislocation density, and the closer the color is to blue, the lower the dislocation density. It is evident that the distribution of dislocation density basically matches the distribution of small-angle grain boundaries.
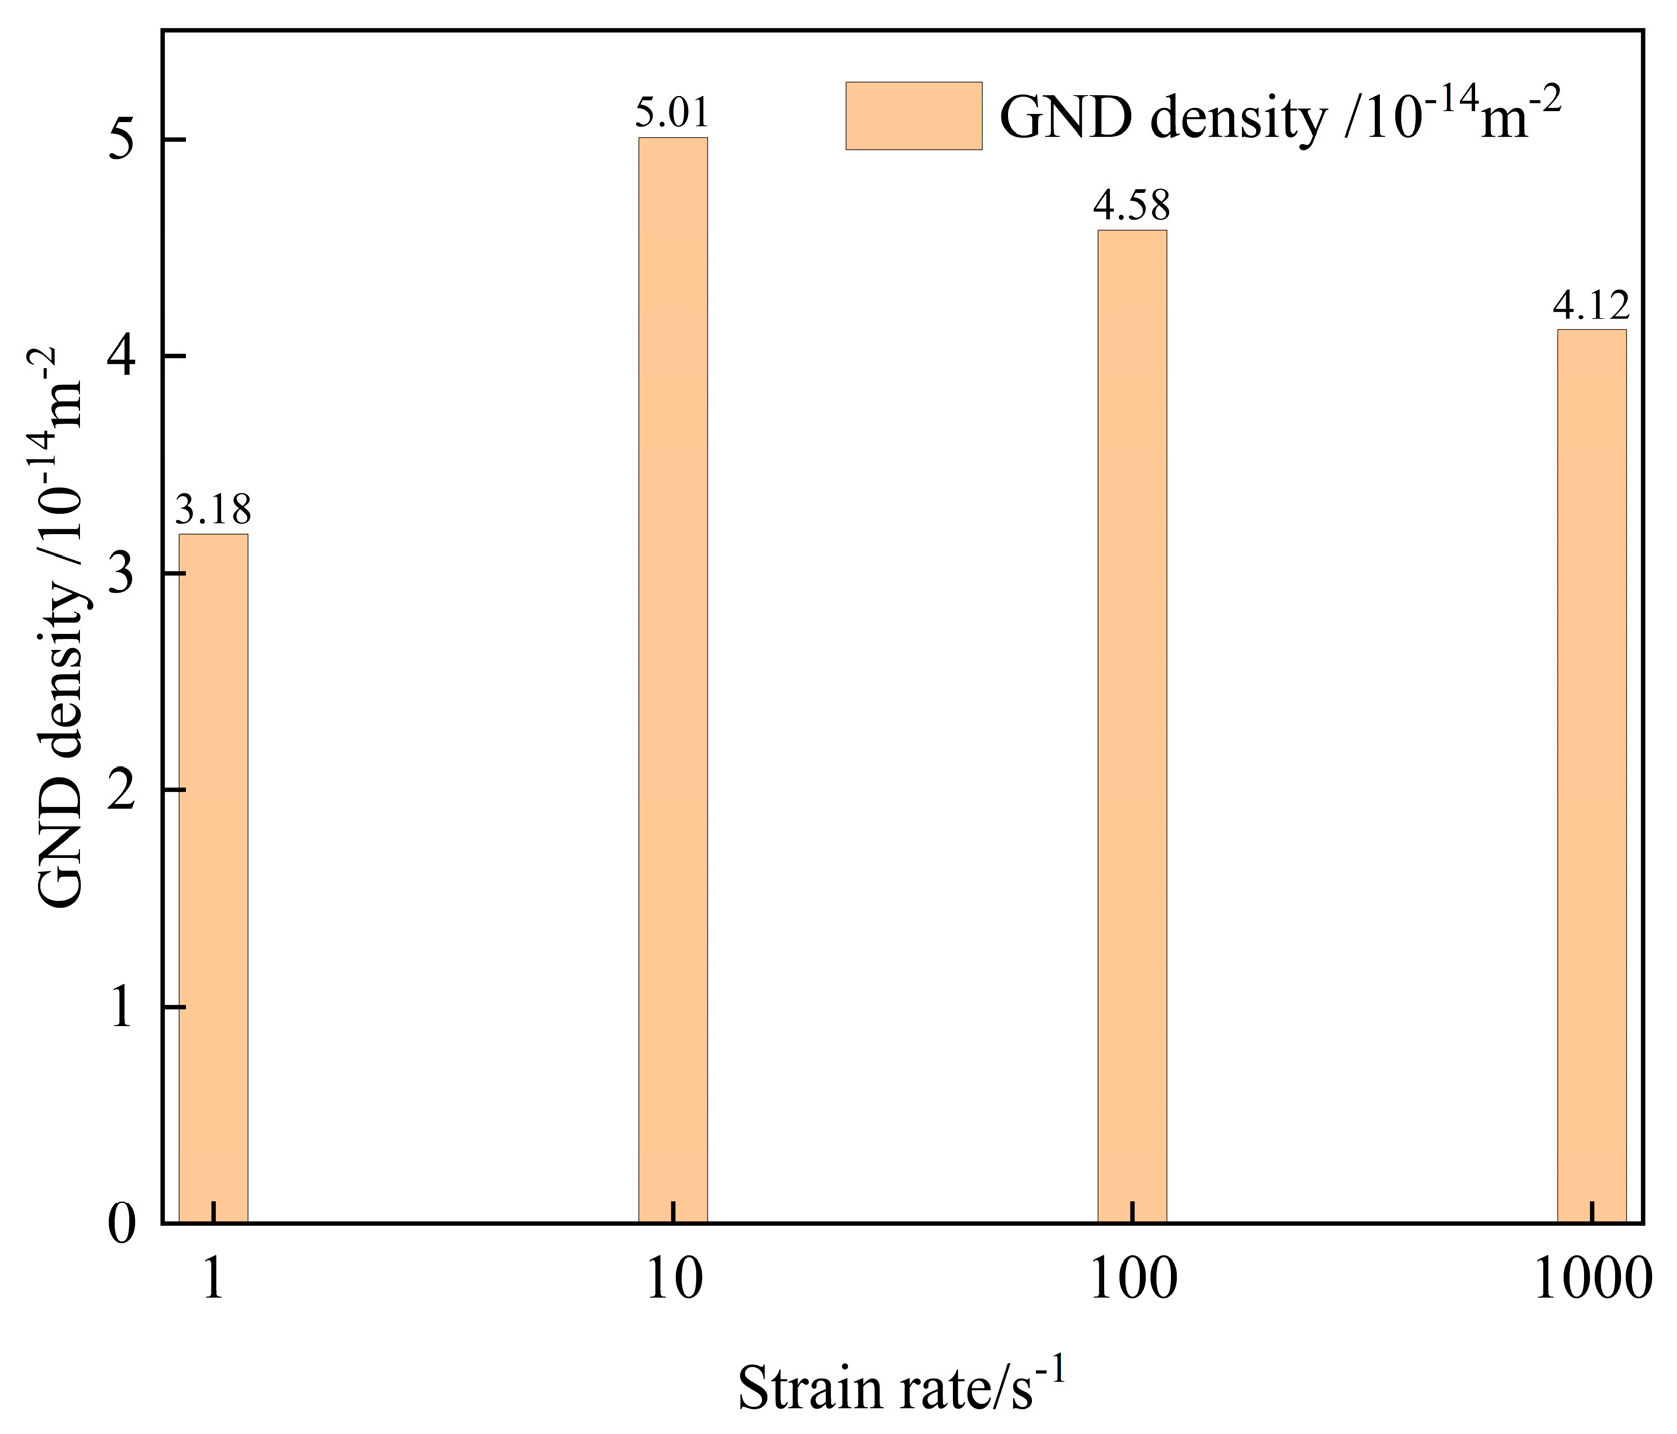
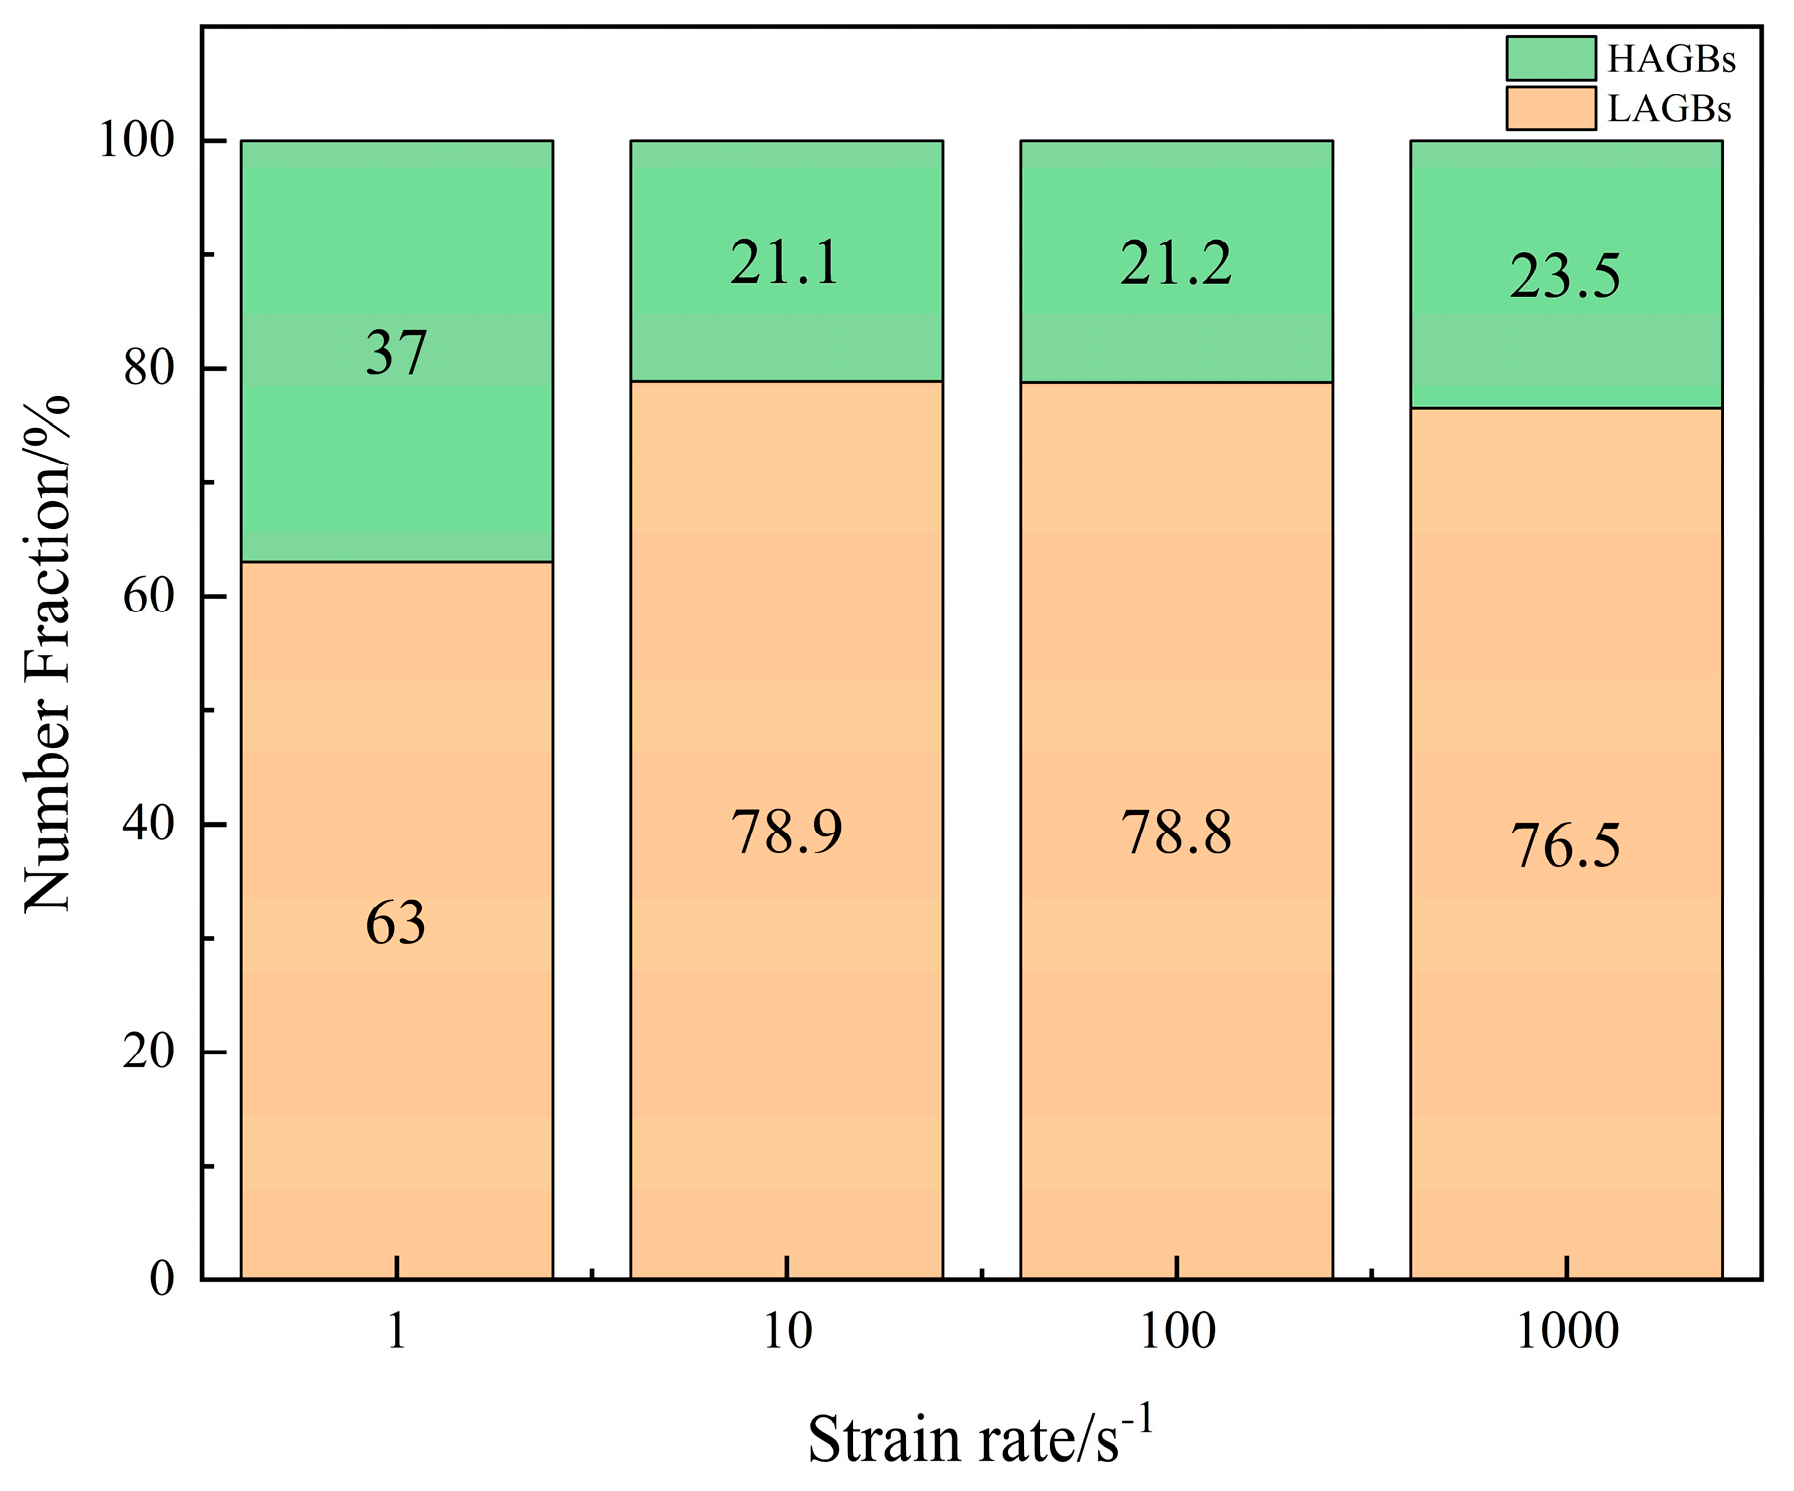
As shown in the figure, Figure 12 shows the dislocation density under different strain rates. Figure 13 displays the relative volume fractions of LAGB and HAGB under different strain rates. It can be inferred from the figure that as the strain rate increases, the density of small-angle grain boundaries and dislocation density exhibit different trends.
The increase in small-angle grain boundary density is due to the high density of dislocations at grain boundaries. To reduce the stored strain energy during deformation, dislocations aggregate and merge at interfaces, resulting in the annihilation of opposite-sign dislocations or the formation of small-angle grain boundaries. Since small-angle grain boundaries have a more ordered state compared to large-angle grain boundaries, at high strain rates, dislocations tend to be rearranged into a more ordered state to reduce stored energy and maintain a more stable state. Therefore, there is a direct correlation between the density and distribution of small-angle grain boundaries and dislocation density and distribution. A higher dislocation density results in more small-angle grain boundaries, whereas a lower dislocation density leads to fewer small-angle grain boundaries. Additionally, since dislocations aggregate at interfaces, small-angle grain boundaries also aggregate at these locations, which is consistent with our results from the size grain boundary and dislocation density plots.
To illustrate the competition between dislocation storage and annihilation in heterogeneous metals under different strain rates, we use the well-known K-M dislocation model to describe this relationship. The K-M model is based on dislocation generation and annihilation theory and describes the evolution of dislocation density during plastic deformation stages. The K-M model can be expressed as (4) [48]:
d ρ d ε = 3 k 8 b ρ 8 3 K F C C ρ
where d ρ d ε is the evolution of dislocation density (ρ) with strain (ε). k is the dislocation storage coefficient. b is the size of the Burgers vector, and KFCC is the dislocation annihilation coefficient.
The annihilation rate of dislocations, kFCC, can be expressed as (5) and (6) [48]:
K F C C = 4 M ε . d d i p b
d d i p = M 8 π 1 υ G b σ
In the formula above, ε ˙ represent the strain rate, b represents the Burgers vector, ddip represents the dipole capture distance, which can be calculated using the formula below, M is the Taylor factor, G is the shear modulus, and σ is the applied stress [47]. It is worth noting that KFCC is directly proportional to the strain rate. Therefore, an increase in strain rate promotes the annihilation rate of dislocations.
The evolution of grain boundaries during dislocation annihilation can be roughly divided into two stages. The first stage is the transformation from GNDs to LAGBs, which takes a relatively short time of about 400 ps. This transformation process is dependent on the movement of dislocations within the grain boundaries under external forces, overcoming thermal vibrations through cross-slip and multiplication into LAGBs.
The second stage is the transformation from LAGBs to HAGBs, which relies on the migration of LAGBs. This migration process takes a relatively long time and may therefore limit the progress of the first stage. However, due to the short time required for stretching under high strain rates, the second stage may not have enough time to occur, so this effect is almost negligible.
LAGBs are unevenly distributed within grains, dividing the internal structure into many strain-free or slightly strained regions and highly strained regions, which is consistent with the results shown in the size-grain boundary map.
Overall, high strain rates promote the accumulation of GNDs and LAGBs.
The decrease in small-angle grain boundary density is due to the increase in dynamic recovery, which leads to a decrease in dislocation density. Dynamic recovery occurs during deformation at high temperatures due to the combined effects of temperature and deformation, resulting in a decrease in dislocation density and a corresponding decrease in work hardening.
At high temperatures, the microscopic structure of metals changes. When metals undergo plastic deformation, dislocations are the main microscopic structural changes. Dislocations are linear defects that can occur in crystals through processes such as slip and climb.
During dynamic recovery, the high concentration of vacancies in the metal at high temperatures promotes vacancy diffusion and dislocation movement. These movements provide opportunities for dislocations to transfer between slip planes and annihilate with other dislocations. When opposite dislocations annihilate, the dislocation density decreases, the distortion energy decreases, and the microscopic structure gradually returns to a new equilibrium state.
This new equilibrium state is usually more ordered and stable than the initial state before deformation, indicating that dynamic softening has occurred. Simultaneously, due to the decrease in dislocation density and microstructure adjustment, the degree of work hardening also decreases.
As shown in the above figure, when the strain rate increases from 1 s−1 to 10 s−1, the dislocation density increases from 3.18 × 10¹⁴/m2 to 5.01 × 10¹⁴/m2, and the proportion of small-angle grain boundaries increases from 63% to 78.9%. When the strain rate increases from 10 s−1 to 1000 s−1, both the dislocation density and small-angle grain boundary density decrease together. The dislocation density decreases from 5.01 × 10¹⁴/m2 to 4.12 × 10¹⁴/m2, and the proportion of small-angle grain boundaries decreases from 78.9% to 76.5%. The decrease in dislocation density and small-angle grain boundary density shows a clear trend of increase and decrease, with a turning point at a strain rate of 10 s−1.
Combining the previous analysis of adiabatic temperature rise curves with work-hardening curves, when the strain rate increases from 1 s−1 to 10 s−1, the increase in dislocation density is due to the increase in strain rate, which also increases the work-hardening rate and dislocation multiplication. At this time, the adiabatic temperature rise effect is relatively weak, so the dislocation density still increases significantly. The competition between work hardening and dynamic recovery at this time is dominated by work hardening, resulting in an increase in both dislocation density and small-angle grain boundary density.
As the strain rate continues to increase from 10 s−1 to 1000 s−1, although the work-hardening rate still increases with the strain rate, both the dislocation density and small-angle grain boundary density decrease. As shown in the adiabatic temperature rise curve, from 10 s−1 to 1000 s−1, the adiabatic temperature rise effect increases significantly, indicating an increase in dynamic recovery capacity. The decrease in dislocation density and small-angle grain boundary density indicates that dynamic recovery dominates deformation processes at this time. Dynamic recovery promotes climbing and annihilation of dislocations, leading to a decrease in dislocation density. Dynamic recovery also promotes the formation of HAGBs. Since LAGB evolution is closely related to GNDs, LAGB density also decreases.
This result is consistent with the curves of the adiabatic temperature rise and the work-hardening rate analyzed earlier. It indicates that the work-hardening mechanism dominates when the strain rate is from 1 s−1 to 10 s−1, whereas the softening mechanism caused by dynamic recovery dominates when the strain rate is from 10 s−1 to 1000 s−1.

5. Conclusions

(1) The elasticity limit, tensile strength, and elongation of 28Mn-10Al annealed test steel increase with an increase in the rate of deformation. At a strain rate of 1 s−1, the elasticity limit, tensile strength, and elongation of the test steel are 668 MPa, 849 MPa, and 52.4%, respectively. However, at a strain rate of 103 s−1, the elasticity limit, tensile strength, and elongation of the test steel increase significantly to 817 MPa, 1047 MPa, and 60.6%, respectively. These findings demonstrate a significant enhancement in the performance of the test steel.
(2) The high strain rate tensile process of 28Mn-10Al annealed test steel is a competitive process that involves work hardening, strengthening by a high strain rate, and a rise in adiabatic temperature. As the strain rate of 28Mn-10Al cold-rolled annealed steel increases from 1 s−1 to 103 s−1, the work-hardening and strain rate strengthening effect play a dominant role in strengthening the test steel and improving the material strength. The interaction between strain hardening caused by work hardening and strengthening by high strain rate and strain softening resulting from the adiabatic temperature increasing effect, as well as the coordinated deformation of multiple slip systems, maintain the stable metal flow under high tensile speed and improve the toughness of materials. In general, this process is conducive to enhancing the strength and plasticity of 28Mn-10Al test steel when strain rates range from 1 to 103 s−1.
(3) Research has shown that during tensile testing of the test steel at strain rates ranging from 1 s−1 to 10 s−1, the work-hardening mechanism dominates. In tensile testing of the same steel at strain rates ranging from 10 s−1 to 1000 s−1, the softening mechanism caused by dynamic recovery takes precedence.

Author Contributions

Conceptualization, S.C. and H.Z.; methodology, H.Z.; software, S.C.; validation, S.C., H.Z. and S.Y.; formal analysis, S.C.; investigation, H.Z.; resources, Z.T.; data curation, S.C.; writing—original draft preparation, S.C.; writing—review and editing, S.C.; visualization, S.Y.; supervision, Z.T.; project administration, Z.T.; funding acquisition, Z.T. All authors have read and agreed to the published version of the manuscript.

Funding

The research was supported by the National Natural Science Foundation of China (Grant No. 51874088) and Fundamental Research Funds for the Central Universities (N2002015).

Data Availability Statement

The data presented in this study are available on request from the corresponding author. The data are not publicly available due to privacy.

Conflicts of Interest

The authors declare no conflicts of interest.

References

  1. Chen, P.; Li, X.; Yi, H. The κ-carbides in low-density Fe-Mn-Al-C steels: A review on their structure, precipitation and deformation mechanism. Metals 2020, 10, 1021. [Google Scholar] [CrossRef]
  2. Wang, Z.G.; Shen, C.L.; Zhang, J.L.; Song, C.J.; Zhai, Q.J. An accelerated aging assisted by electric current in a Fe-Mn-Al-C low-density steel. China Foundry 2022, 19, 395–402. [Google Scholar] [CrossRef]
  3. Ren, J.K.; Zhang, L.; Li, Z.H.; Chen, J.; Zhang, W.N.; Wu, S.W.; Liu, Z.Y. Fe-Mn-Al-C high-entropy steels with superior mechanical properties at 4.2 K. Mater. Des. 2023, 228, 111840. [Google Scholar] [CrossRef]
  4. Picak, S.; Vaughan, M.; El Atwani, O.; Mott, A.; Limmer, K.; Karaman, I. Effects of chemical segregation on ductility-anisotropy in high strength Fe-Mn-Al-C lightweight austenitic steels. Acta Mater. 2023, 245, 118589. [Google Scholar] [CrossRef]
  5. Ding, H.; Liu, D.; Cai, M.; Zhang, Y. Austenite-Based Fe-Mn-Al-C Lightweight Steels: Research and Prospective. Metals 2022, 12, 1572. [Google Scholar] [CrossRef]
  6. Riaz, T.; Das, S.R.; Sahu, P. Influence of Al Variation on the Mechanical Properties and Critical Shear Stress of Twinning in Fe-Mn-Al-C Steels. J. Mater. Eng. Perform. 2023, 32, 1636–1644. [Google Scholar] [CrossRef]
  7. Shyamal, S.; Das, S.R.; Jaskari, M.; Sahu, P. Evolution of deformation microstructure in a coarse-grained Fe-Mn-Al-C steel under bending fatigue. Mater. Lett. 2022, 327, 133006. [Google Scholar] [CrossRef]
  8. Zhang, X.-F.; Li, J.-X.; Yang, Y.; Zhang, K.; Wu, X.-J.; Huang, Z.-Y. Austenite Stability and Cryogenic Impact Toughness of a Lamellar Fe-Mn-Al-C Lightweight Structural Steel Subjected to Quenching and Tempering Process. J. Mater. Eng. Perform. 2022, 31, 5259–5268. [Google Scholar] [CrossRef]
  9. Li, Z.; Wang, Y.C.; Cheng, X.; Gao, C.; Li, Z.; Langdon, T.G. Microstructure and mechanical properties of an Fe–Mn–Al–C lightweight steel after dynamic plastic deformation processing and subsequent aging. Mater. Sci. Eng. A 2022, 833, 142566. [Google Scholar] [CrossRef]
  10. Jang, G.; Kim, J.N.; Lee, H.; Lee, T.; Enikeev, N.; Abramova, M.; Valiev, R.Z.; Kim, H.S.; Lee, C.S. Microstructural evolution and mechanical properties of nanocrystalline Fe–Mn–Al–C steel processed by high-pressure torsion. Mater. Sci. Eng. A 2021, 827, 142073. [Google Scholar] [CrossRef]
  11. Durán, J.F.; Pérez, G.A.; Rodríguez, J.S.; Aguilar, Y.; Logé, R.E.; Zambrano, O.A. Microstructural Evolution Study of Fe–Mn–Al–C Steels Through Variable Thermomechanical Treatments. Metall. Mater. Trans. A 2021, 52, 4785–4799. [Google Scholar] [CrossRef]
  12. Li, Z.; Wang, Y.; Cheng, X.; Li, Z.; Gao, C.; Li, S. The effect of rolling and subsequent aging on microstructures and tensile properties of a Fe–Mn–Al–C austenitic steel. Mater. Sci. Eng. A 2021, 822, 141683. [Google Scholar] [CrossRef]
  13. Ley, N.A.; Young, M.L.; Hornbuckle, B.C.; Field, D.M.; Limmer, K.R. Toughness enhancing mechanisms in age hardened Fe–Mn–Al–C steels. Mater. Sci. Eng. A 2021, 820, 141518. [Google Scholar] [CrossRef]
  14. Xing, M.; Lin, F.; Tang, L.; Wu, X.; Zhang, X.; Huang, Z. A review of the influence of Al element on Fe-Mn-Al-C low density steel. China Metall. 2022, 32, 15–26. (In Chinese) [Google Scholar]
  15. Ren, P. Deformation Mechanism and Micro-Structure Property Control of Fe-Mn-Al-C Austenitic Low Density Steel. Ph.D. Thesis, Chongqing University, Chongqing, China, 2021. (In Chinese). [Google Scholar]
  16. Sun, J.; Huang, Z.; Li, J.; Wang, P. Thermal deformation behavior of Fe-28 Mn-9Al-1C lightweight alloy steel. Ansactions Mater. Heat Treat. 2022, 43, 142–150. (In Chinese) [Google Scholar]
  17. Rahman, K.M.; Vorontsov, V.A.; Dye, D. The dynamic behaviour of a twinning induced plasticity steel. Mater. Sci. Eng. A 2014, 589, 252–261. [Google Scholar] [CrossRef]
  18. Tang, Z.Y.; Huang, J.N.; Ding, H.; Cai, Z.H.; Misra, R.D.K. On the dynamic behavior and relationship to mechanical properties of cold-rolled Fe-0.2C-15Mn-3Al steel at intermediate strain rate. Mater. Sci. Eng. A 2019, 742, 423–431. [Google Scholar] [CrossRef]
  19. Park, J.; Kang, M.; Sohn, S.S.; Kim, S.H.; Kim, H.S.; Kim, N.J.; Lee, S. Quasi-static and dynamic deformation mechanisms interpreted by microstructural evolution in TWinning Induced Plasticity (TWIP) steel. Mater. Sci. Eng. A 2017, 684, 54–63. [Google Scholar] [CrossRef]
  20. Yoo, J.D.; Park, K.T. Microband-induced plasticity in a high Mn-Al-C light steel. Mater. Sci. Eng. A 2008, 496, 417–424. [Google Scholar] [CrossRef]
  21. Hou, M.; Li, C.; Kong, W.; Bai, Y. Effect of Heat treatment on micro-structure and properties of Fe-Mn-Al-C steel. Spec. Steel 2023, 44, 96–100. (In Chinese) [Google Scholar]
  22. Wu, Z.; Zhao, J.; Zhou, N.; Luo, X. Effect of quench-tempering heat treatment on micro-structure and mechanical properties of ultra-high strength Fe-Mn-Al-C alloy steel. Angang Technol. 2023, 439, 23–27+62. (In Chinese) [Google Scholar]
  23. Li, X. Effect of Heat Treatment on Micro-Structure and Mechanical Properties of Rolled Fe-Mn-Al-C Steel. Master’s Thesis, North University of China, Taiyuan, China, 2022. (In Chinese). [Google Scholar]
  24. Meng, J.; Liu, R.; Guo, J.; Xu, R.; Wang, K.; Jin, X. Study on the effect of heat treatment temperature on the precipitation of aluminum series carbides in Fe-Mn-Al-C light steel. In The Chinese Society for Metals, Proceedings of the 13th China Steel Annual Conference-7. Advanced Steel Materials and Their Applications, Online, 23–24 November 2022; Metallurgical Industry Press: Beijing, China, 2022; Volume 6. (In Chinese) [Google Scholar]
  25. Hao, Y. Effect of Manganese Content and Heat Treatment on Micro-Structure and Mechanical Properties of Fe-Mn-Al-C Steel. Master’s Thesis, Xiangtan University, Xiangtan, China, 2020. (In Chinese). [Google Scholar]
  26. Yang, F.; Song, B.; Li, Y.; Sun, T.; Wang, K.; Kang, T. Effect of annealing temperature on properties of cold-rolled Fe-Mn-Al-C low-density steel. Chin. J. Mater. Res. 2015, 29, 108–114. (In Chinese) [Google Scholar]
  27. Mi, Z.L.; Tang, D.; Jiang, H.T.; Dai, Y.J.; Li, S.S. Effects of annealing temperature on the micro-structure and properties of the 25Mn-3Si-3Al TWIP steel. Int. J. Miner. Metall. Mater. 2009, 16, 154–158. [Google Scholar] [CrossRef]
  28. Seo, E.J.; Cho, L.; Estrin, Y.; De Cooman, B.C. Micro-structure-mechanical properties relationships for quenching and partitioning(Q&P) processed steel. Acta Mater. 2016, 113, 124–139. [Google Scholar]
  29. Sohn, S.S.; Lee, B.J.; Lee, S.; Kim, N.J.; Kwak, J.H. Effect of annealing temperature on microstructural modification and tensile properties in 0.35C-3.5Mn-5.8Al lightweight steel. Acta Mater. 2013, 61, 5050–5066. [Google Scholar] [CrossRef]
  30. Li, H.; Xia, P.; Xie, K.; Cao, M.; Tan, Y.; Jin, X. Effect of annealing temperature on micro-structure and tensile properties of Fe-Mn-Al-C steel. Heat Treat. Met. 2021, 46, 77–82. (In Chinese) [Google Scholar]
  31. Das, A.; Tarafder, S.; Sivaprasad, S.; Chakrabarti, D. Influence of microstructure and strain rate on the strain partitioning behaviour of dual phase steels. Mater. Sci. Eng. A 2019, 754, 348–360. [Google Scholar] [CrossRef]
  32. Daochun, H.; Minghe, C. Tensile Properties and Deformational Mechanism of C5191 Phosphor. Rare Met. Mater. Eng. 2017, 46, 1518–1523. [Google Scholar] [CrossRef]
  33. Tamuly, S.; Dixit, S.; Kombaiah, B.; Parameswaran, V.; Khanikar, P. High strain rate deformation behavior of Al0.65CoCrFe2Ni dual-phase high entropy alloy. Intermetallics 2023, 161, 107983. [Google Scholar] [CrossRef]
  34. El-Aty, A.A.; Xu, Y.; Zhang, S.-H.; Ha, S.; Ma, Y.; Chen, D. Impact of high strain rate deformation on the mechanical behavior, fracture mechanisms and anisotropic response of 2060 Al-Cu-Li alloy. J. Adv. Res. 2019, 18, 19–37. [Google Scholar] [CrossRef]
  35. Abd El-Aty, A.; Xu, Y.; Guo, X.; Zhang, S.H.; Ma, Y.; Chen, D. Strengthening mechanisms, deformation behavior, and anisotropic mechanical properties of Al-Li alloys: A review. J. Adv. Res. 2017, 10, 49–67. [Google Scholar] [CrossRef] [PubMed]
  36. Zhang, M.; Zhao, S.; Yang, Y. Discussion on automobile lightweight and application of aluminum alloy. Environ. Technol. 2021, 1, 62–66. (In Chinese) [Google Scholar]
  37. DIN EN ISO 26203-2-2011; Metallic Materials-Tensile Testing at High Strain Rates-Part 2: Servo-Hydraulic and Other Test Systems. German Institute for Standardization: Berlin, Germany, 2011.
  38. Coronado, J.J. Stacking Fault Energy Determination in Fe-Mn-Al-C Austenitic Steels by X-ray Diffraction. Metals 2021, 11, 1701. [Google Scholar]
  39. Zou, D.Q.; Li, S.H.; He, J. Temperature and strain rate dependent deformation induced martensitic transformation and flow behavior of quenching and partitioning steels. Mater. Sci. Eng. A 2016, 680, 54–63. [Google Scholar] [CrossRef]
  40. Curtze, S.; Kuokkala, V.-T. Dependence of tensile deformation behavior of TWIP steels on stacking fault energy, temperature and strain rate. Acta Mater. 2010, 58, 5129–5141. [Google Scholar] [CrossRef]
  41. Shen, Y.F.; Jia, N.; Misra, R.D.K.; Zuo, L. Softening behavior by excessive twinning and adiabatic heating at high strain rate in a Fe-20Mn-0.6C TWIP steel. Acta Mater. 2016, 103, 229–242. [Google Scholar] [CrossRef]
  42. Dong, Y.; Liu, Y.; Wang, L.; Su, L. Effect of strain rate on dynamic tensile deformation behavior of DP780 steel. Acta Metall. Sin. 2013, 49, 159–166. (In Chinese) [Google Scholar] [CrossRef]
  43. Meyers, M.A.; Zhang, Q.M.; Liu, Y.; Huang, F.L.; Lu, Z.J. Dynamic Behavior of Materials; National Defense Industry Press: Beijing, China, 2006; Volume 225. [Google Scholar]
  44. Kapoor, R.; Nemat-Nasser, S. Comparison between high and low strain-rate deformation of tantalum. Metall. Mater. Trans. A 2000, 31, 815–823. [Google Scholar] [CrossRef]
  45. Liu, Y.; Wang, L.; He, S.; Feng, F.; Lv, X.; Zhang, B. Effect of long-term aging on dynamic tensile deformation behavior of GH4169 alloy. Acta Metall. Sin. 2012, 48, 49–55. (In Chinese) [Google Scholar] [CrossRef]
  46. Liu, J.; Wang, Z.; Shang, J. Deformation behavior of β -Sn single crystals of [110] and [112] orientations. Acta Metall. Sin. 2008, 44, 1409–1414. (In Chinese) [Google Scholar]
  47. Moussa, C.; Bernacki, M.; Besnard, R.; Bozzolo, N. Statistical analysis of dislocations and dislocation boundaries from EBSD data. Ultramicroscopy 2017, 8, 63–72. [Google Scholar] [CrossRef] [PubMed]
  48. Shi, H.; Zong, N.; Le, J.; Li, S.; Huang, G.; Li, J.; Mao, J.; Lu, W. Strain hardening versus softening: Anisotropic response of strain hardening-softening transition in a polycrystalline zirconium alloy at room temperature from dislocation viewpoint. Mater. Sci. Eng. A 2022, 847, 143334. [Google Scholar] [CrossRef]
Figure 1. Heat treatment process diagram.
Metals 14 00047 g001
Figure 2. Schematic diagram of high-speed tensile specimen size (unit: mm).
Metals 14 00047 g002
Figure 3. XRD pattern of 28Mn10Al cold-rolled annealed test steel annealed at 950 °C for 30 min.
Metals 14 00047 g003
Figure 4. Micro-structure of 28Mn-10Al cold-rolled annealed test steel annealed at 950 °C for 30 min.
Metals 14 00047 g004
Figure 5. 28Mn-10Al cold-rolled annealed test steel engineering stress-strain curve.
Metals 14 00047 g005
Figure 6. Macroscopic fracture morphology of tensile sample with different strain rates: (a) 1 s−1; (b) 10 s−1; (c) 100 s−1; (d) 1000 s−1. Fracture morphology of tensile sample with different strain rates at a high magnification: (e) 1 s−1; (f) 10 s−1; (g) 100 s−1; (h) 1000 s−1.
Metals 14 00047 g006
Figure 7. Variation in adiabatic temperature rise of 28Mn-10Al cold-rolled annealed test steel at different strain rates.
Metals 14 00047 g007
Figure 8. 28Mn-10Al cold-rolled annealed test steel under different strain rate work-hardening curve.
Metals 14 00047 g008
Figure 9. Variation curve of strain rate sensitivity coefficient of 28Mn-10Al steel.
Metals 14 00047 g009
Figure 10. BC diagram of 28Mn-10Al steel: (a) strain rate is 1 s−1, (b) strain rate is 10 s−1, (c) strain rate is 100 s−1, (d) strain rate is 1000 s−1.
Metals 14 00047 g010
Figure 11. (ad) IPF diagram of 28Mn-10Al steel, (a’d’) grain boundary diagram of 28Mn-10Al steel, (a”d”) dislocation density distribution diagram of 28Mn-10Al steel. (aa”) Strain rate is 1 s−1, (bb”) strain rate is 10 s−1, (cc”) strain rate is 100 s−1, (dd”) strain rate is 1000 s−1.
Metals 14 00047 g011
Figure 12. Dislocation density of 28Mn-10Al steel under different strain rates.
Metals 14 00047 g012
Figure 13. Distribution of grain boundaries in 28Mn-10Al steel under different strain rates.
Metals 14 00047 g013
Table 1. The elemental composition of 28Mn-10Al steel (wt.%).
ElementMnAlCFe
Percentage28.710.21.02Bal.
Table 2. Mechanical properties of 28Mn-10Al cold-rolled annealed test steel.
Strain Rate/s−1YS/MPaUTS/MPaEL/%PSE/GPa·%
1668849.252.444.5
10736929.252.148.4
100775982.152.351.4
10008171047.460.663.5
Disclaimer/Publisher’s Note: The statements, opinions and data contained in all publications are solely those of the individual author(s) and contributor(s) and not of MDPI and/or the editor(s). MDPI and/or the editor(s) disclaim responsibility for any injury to people or property resulting from any ideas, methods, instructions or products referred to in the content.