Article

Miniature Tensile and Small Punch Testing: Mechanical Performance and Application in Hydrogen Embrittlement Analysis

by
Ping Tao
1,2,*,
Wei Zhou
1,
Xinting Miao
1,2,
Jian Peng
1,2 and
Xuedong Liu
1,2
1
School of Mechanical Engineering and Rail Transit, Changzhou University, Changzhou 213164, China
2
Jiangsu Key Laboratory of Green Process Equipment, Changzhou University, Changzhou 213164, China
*
Author to whom correspondence should be addressed.
Metals 2024, 14(10), 1104; https://doi.org/10.3390/met14101104
Submission received: 14 August 2024 / Revised: 9 September 2024 / Accepted: 23 September 2024 / Published: 26 September 2024
(This article belongs to the Special Issue Modeling, Simulation and Experimental Studies in Metal Forming)

Abstract

:
The utilization of micro-sample testing has demonstrated its effectiveness in conducting quantitative research on mechanical properties, damage evolutions and fracture features. For in-service equipment, millimicron sampling allows for non-destructive testing and analysis of mechanical performance evolution during operation. This paper presents a comparative study of the miniature uniaxial tensile test (MUTT) and small punch test (SPT) by experimental and finite element methods. As a comparison, the standard conventional-size tensile tests were also carried out. Detailed analyses of the elastoplastic behaviors and damage evolutions of MUTT and SPT were presented, followed by an application case illustrating the characterization of hydrogen embrittlement sensitivity based on MUTT and SPT. An inverse finite element modeling method of load–displacement curve reproduction was used to calibrate the variations of damage parameters of hydrogen-charged MUTT and SPT specimens. Hydrogen embrittlement (HE) indexes were determined by using different calculation methods. The results reveal that the HE sensitivity estimated by MUTT is higher than that measured by SPT, which is related to the different deformation processes and strain rates of the two testing methods.

1. Introduction

Small-size components (e.g., thin plates, and thin-wall pipe fittings) have been widely used in many fields. It is impossible to take conventional-size samples from these miniaturized structures due to volume and size limitations. Therefore, the micro-size sample testing was proposed, which has become an essential part of mechanical testing. Since the 1980s, the micro-sample testing method has been applied, which was first used to assess the risk of material embrittlement of pipelines and pressure vessels subjected to long-term neutron radiation in nuclear reactors [1,2,3]. For in-service equipment, the favorable advantage of micro-sample testing is that its sampling is generally considered non-destructive. Some commonly used micro-sample application scenarios include: (i) online inspection of in-service equipment [4,5]; (ii) local-region damage analysis of heterogeneous structures [6,7]; (iii) characterization of mechanical behaviors at meso- and micro-scales [8,9]; (iv) new material development [10,11,12]. In addition, for some environment-assisted damage detection, the micro-sample tests also have outstanding advantages. One of them is the characterization of hydrogen embrittlement sensitivity [13,14]. The small sample not only shortens the hydrogen charging time but also facilitates hydrogen charging and discharging tests in various hydrogen environments. For conventional-size tensile samples, it usually takes ten or even dozens of hours to reach hydrogen saturation concentration. However, for micro-sample testing, the hydrogen charging time can be reduced, and the experimental efficiency is improved [15,16].
Although many reports about micro-sample testing have been published, the combined experiments and analyses based on different sample shapes are few. There are still many uncertain and inconsistent viewpoints worth further exploration. In this paper, the performances of the miniature uniaxial tensile test (MUTT) and small punch test (SPT) are focused on. MUTT has the same shape as the standard tensile specimen, which is generally several times smaller than the standard specimen. When the sample size decreases from the conventional tensile sample, they can be described by continuum mechanics. Within a certain range, the testing results can still reflect the tensile properties of the material. Once the sample size reaches a certain critical value, the size effect becomes prominent. The lack of characteristic microstructure in the internal or characteristic deformation area of the specimen can lead to deviation from the intrinsic macroscopic mechanical behavior of the material under test. Therefore, some size restrictions should be performed to reduce or avoid the effects of size effect. For example, the ratio of thickness to grain size of flat samples should not be less than 5–10 [17]. The minimum sizes of thickness and gauge length were recommended as 0.2 mm and 2 mm, respectively [18,19]. For SPT, the load–displacement curves of the materials were obtained by small round specimens ( ϕ 10   mm × 0.5   m m ) with a constant loading rate (0.2~0.5 mm/min). SPT testing has played a positive role in the study of mechanical properties such as material testing, structural integrity assessment and control of damage or fracture. Many standards and studies have been published to correlate the SPT and standard tensile results [20,21,22], such as yield strength and tensile strength [23], ductile-to-brittle transition [24], fracture toughness [25,26], creep strength as well as life prediction [27,28], etc.
This study aims to present a comprehensive study on comparisons of mechanical properties between MUTT and SPT. And an application case of characterizing hydrogen embrittlement sensitivity by MUTT and SPT is performed. This research can provide reference and data support for early damage identification as well as life evaluation of pressure vessels, and improve the evaluation standard and theoretical prediction system of micro-size sample testing.

2. Experimental Procedures

The 316L steel was employed as the testing material, which was received in the form of a 4 mm thickness plate. The chemical compositions are listed in Table 1, and the optical microstructures are shown in Figure 1. The dimensions of standard, MUTT and SPT specimens are displayed in Figure 2. Specimens were machined from the as-received plate with tensile axis parallel to longitudinal (rolling) direction, based on the standard ASTM-E8/E8M [29] and SS-J (Small Specimen-Japan) [30,31].
The SPT specimen is a circular slice sample with a 10 mm diameter and 0.5 mm thickness. Both MUTT and SPT specimens were machined using the wire-cutting method, and a 0.2 mm thickness allowance was employed. Before the experiment, all specimens were successively ground with carbide silicon paper from 80 to 2000 grit. Then, they were polished with paste, cleaned with distilled water, and dried in air. Figure 3 shows the testing device (SUNS-UTM6503, Shenzhen, China) diagram of MUTT and SPT. In accordance with the standard requirements [22], the SPT lower die has a receiving hole with a diameter of 4 mm and a chamfer of 0.2 mm × 45°. The punching ball is made of Si3N4 ceramic with a diameter of 2.5 mm. The loading displacement rates of MUTT and SPT are both 0.2 mm/min. Hydrogen was introduced into specimens by a commonly used cathodic charging method. The charged solution is 0.5 mol/L of NaOH, and the current density is 100 mA/cm2. The 1 g/L of thiourea (CH4N2S) was added as a hydrogen recombination poison. In a preliminary experiment with 1 h, 2 h and 5 h hydrogen charging tests, the results showed that the hydrogen embrittlement sensitivities of the miniature specimens have basically reached the maximum state after 2 h charging. Therefore, the charging time is set to 2 h. When the charging process was completed, specimens were immediately taken to tensile or punch testing at the same constant displacement rate of 0.2 mm/min.

3. Finite Element Models and Material Parameters

The established three-dimensional models of MUTT and SPT within Abaqus software (version 6.13-4) are shown in Figure 4. Before numerical analysis, mesh size sensitivity analyses were performed to determine the appropriate mesh framework. The stress analysis step was defined as dynamic, explicit, and the C3D8R element type was applied. The boundary condition was set as displacement control.
The Gurson–Tvergaard–Needleman (GTN) model was used to define the specimen damage and fracture stage. The GTN model takes the voids percentage inside material as the damage variable to describe the fracture process with consideration of nucleation, growth and aggregation of voids. It has been widely used in predicting the damage and fracture of metal materials. The express function of the GTN model is [32,33]:
Φ = σ e q σ y 2 + 2 f q 1 cosh 3 q 2 σ h 2 σ y 1 q 3 ( f ) 2 = 0
where σ e q is equivalent von Mises stress; σ h is hydrostatic pressure; q 1 , q 2 and q 3 are dimensionless material parameters, for most metals, q 1 = 1.0 ~ 1.5 , q 2 = 1.0 , q 2 = ( q 1 ) 2 = 1.0 ~ 2.25 ; f is a damage function related to void volume fraction, described as:
f 0 ,                                                                             ( f f c ) f c + f ¯ f f c f f f c f f c                         ( f c < f < f f ) f ¯ f ,                                                                         ( f f f )
where f 0 , f c and f f respectively represent the initial, critical and complete failure void volume fraction; f ¯ f is expressed as ( q 1 + q 1 2 q 3 ) / q 3 .
The change rate of total void volume fraction ( f ˙ ) is due to the growth of existing voids ( f ˙ g r ) and nucleation of new voids ( f ˙ n u c l ), given as
f ˙ = f ˙ g r + f ˙ n u c l
where f ˙ g r is based on the law of conservation of mass, and f ˙ n u c l is a strain-controlled relationship, expressed as:
f ˙ g r = 1 f ε ˙ p l : I
f ˙ n u c l = A ε ¯ ˙ m p l
where ε ˙ p l is rate of plastic flow; I is unit tensor; ε ¯ ˙ m p l is evolution of equivalent plastic strain; A is a normal distribution function, defined as:
A = f N s N 2 π e x p 1 2 ε ¯ m p l ε N s N 2
where f N is the volume fraction of the nucleated voids; ε N and s N are the mean value and standard deviation of nucleation strain, respectively. The reported ranges of values for commonly used metals are: ε N = 0.1 ~ 0.3 , s N = 0.05 ~ 0.1 and f N = 0.04 .

4. Results and Discussions

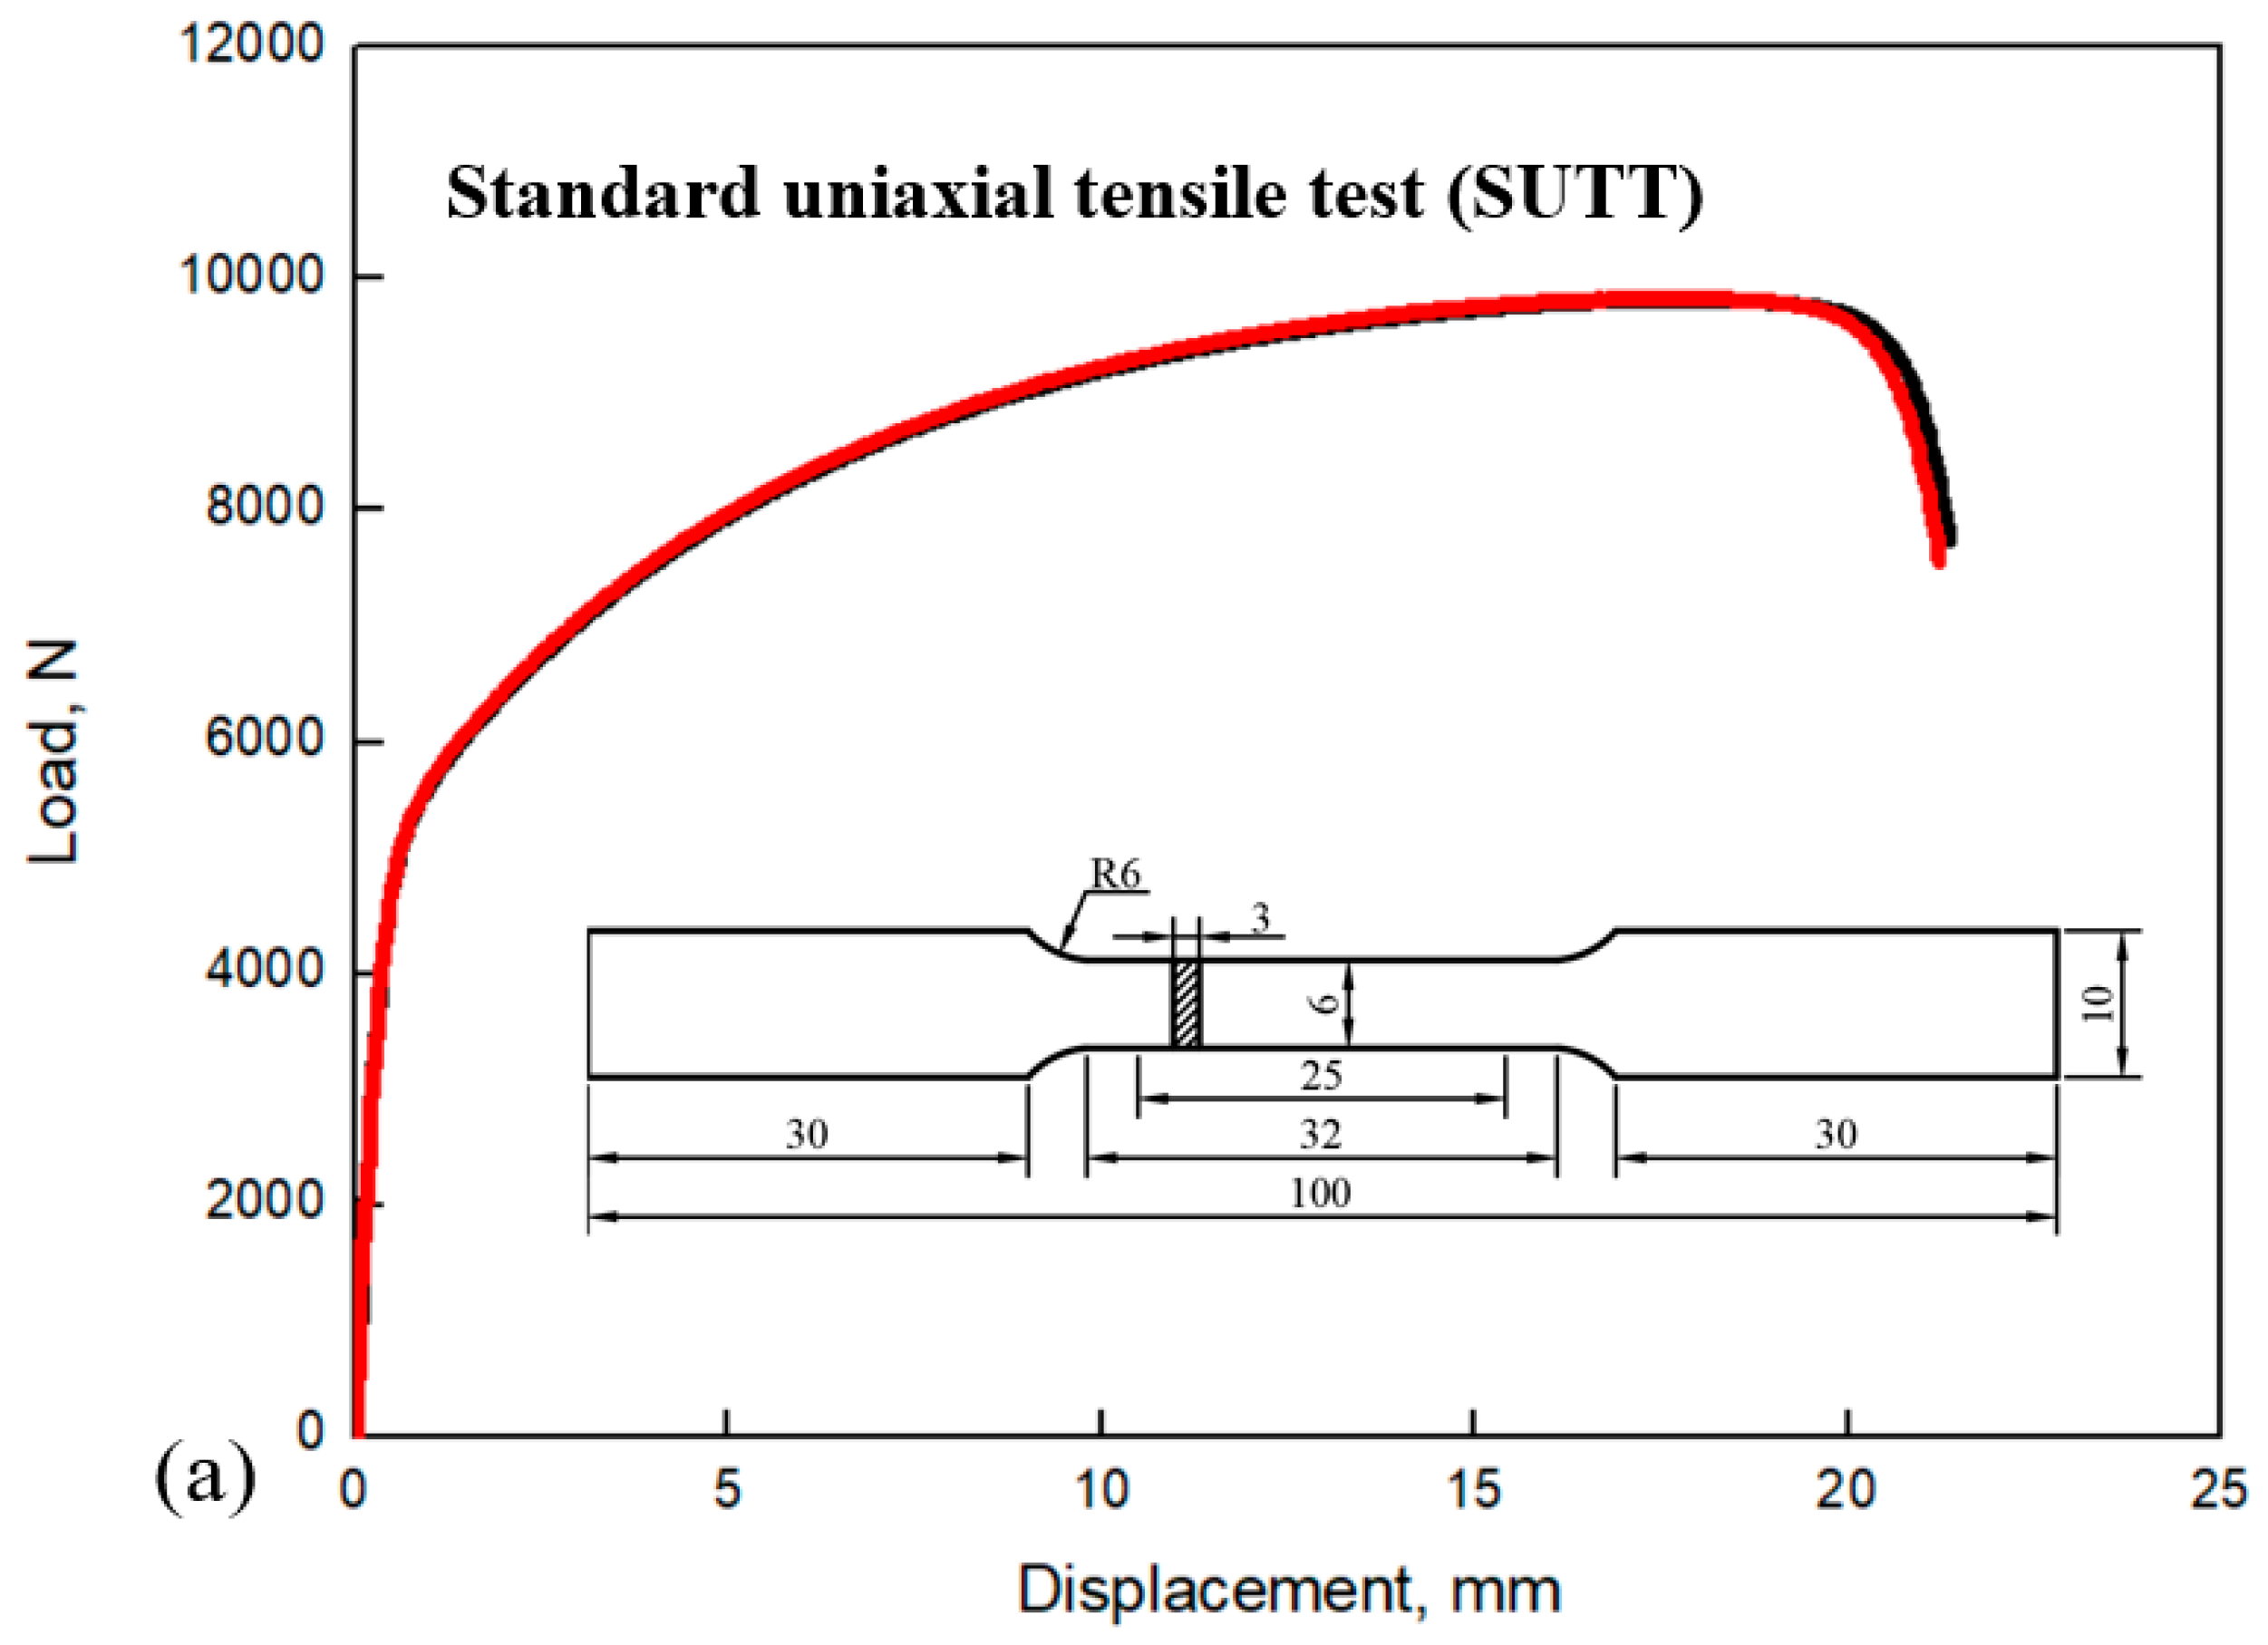
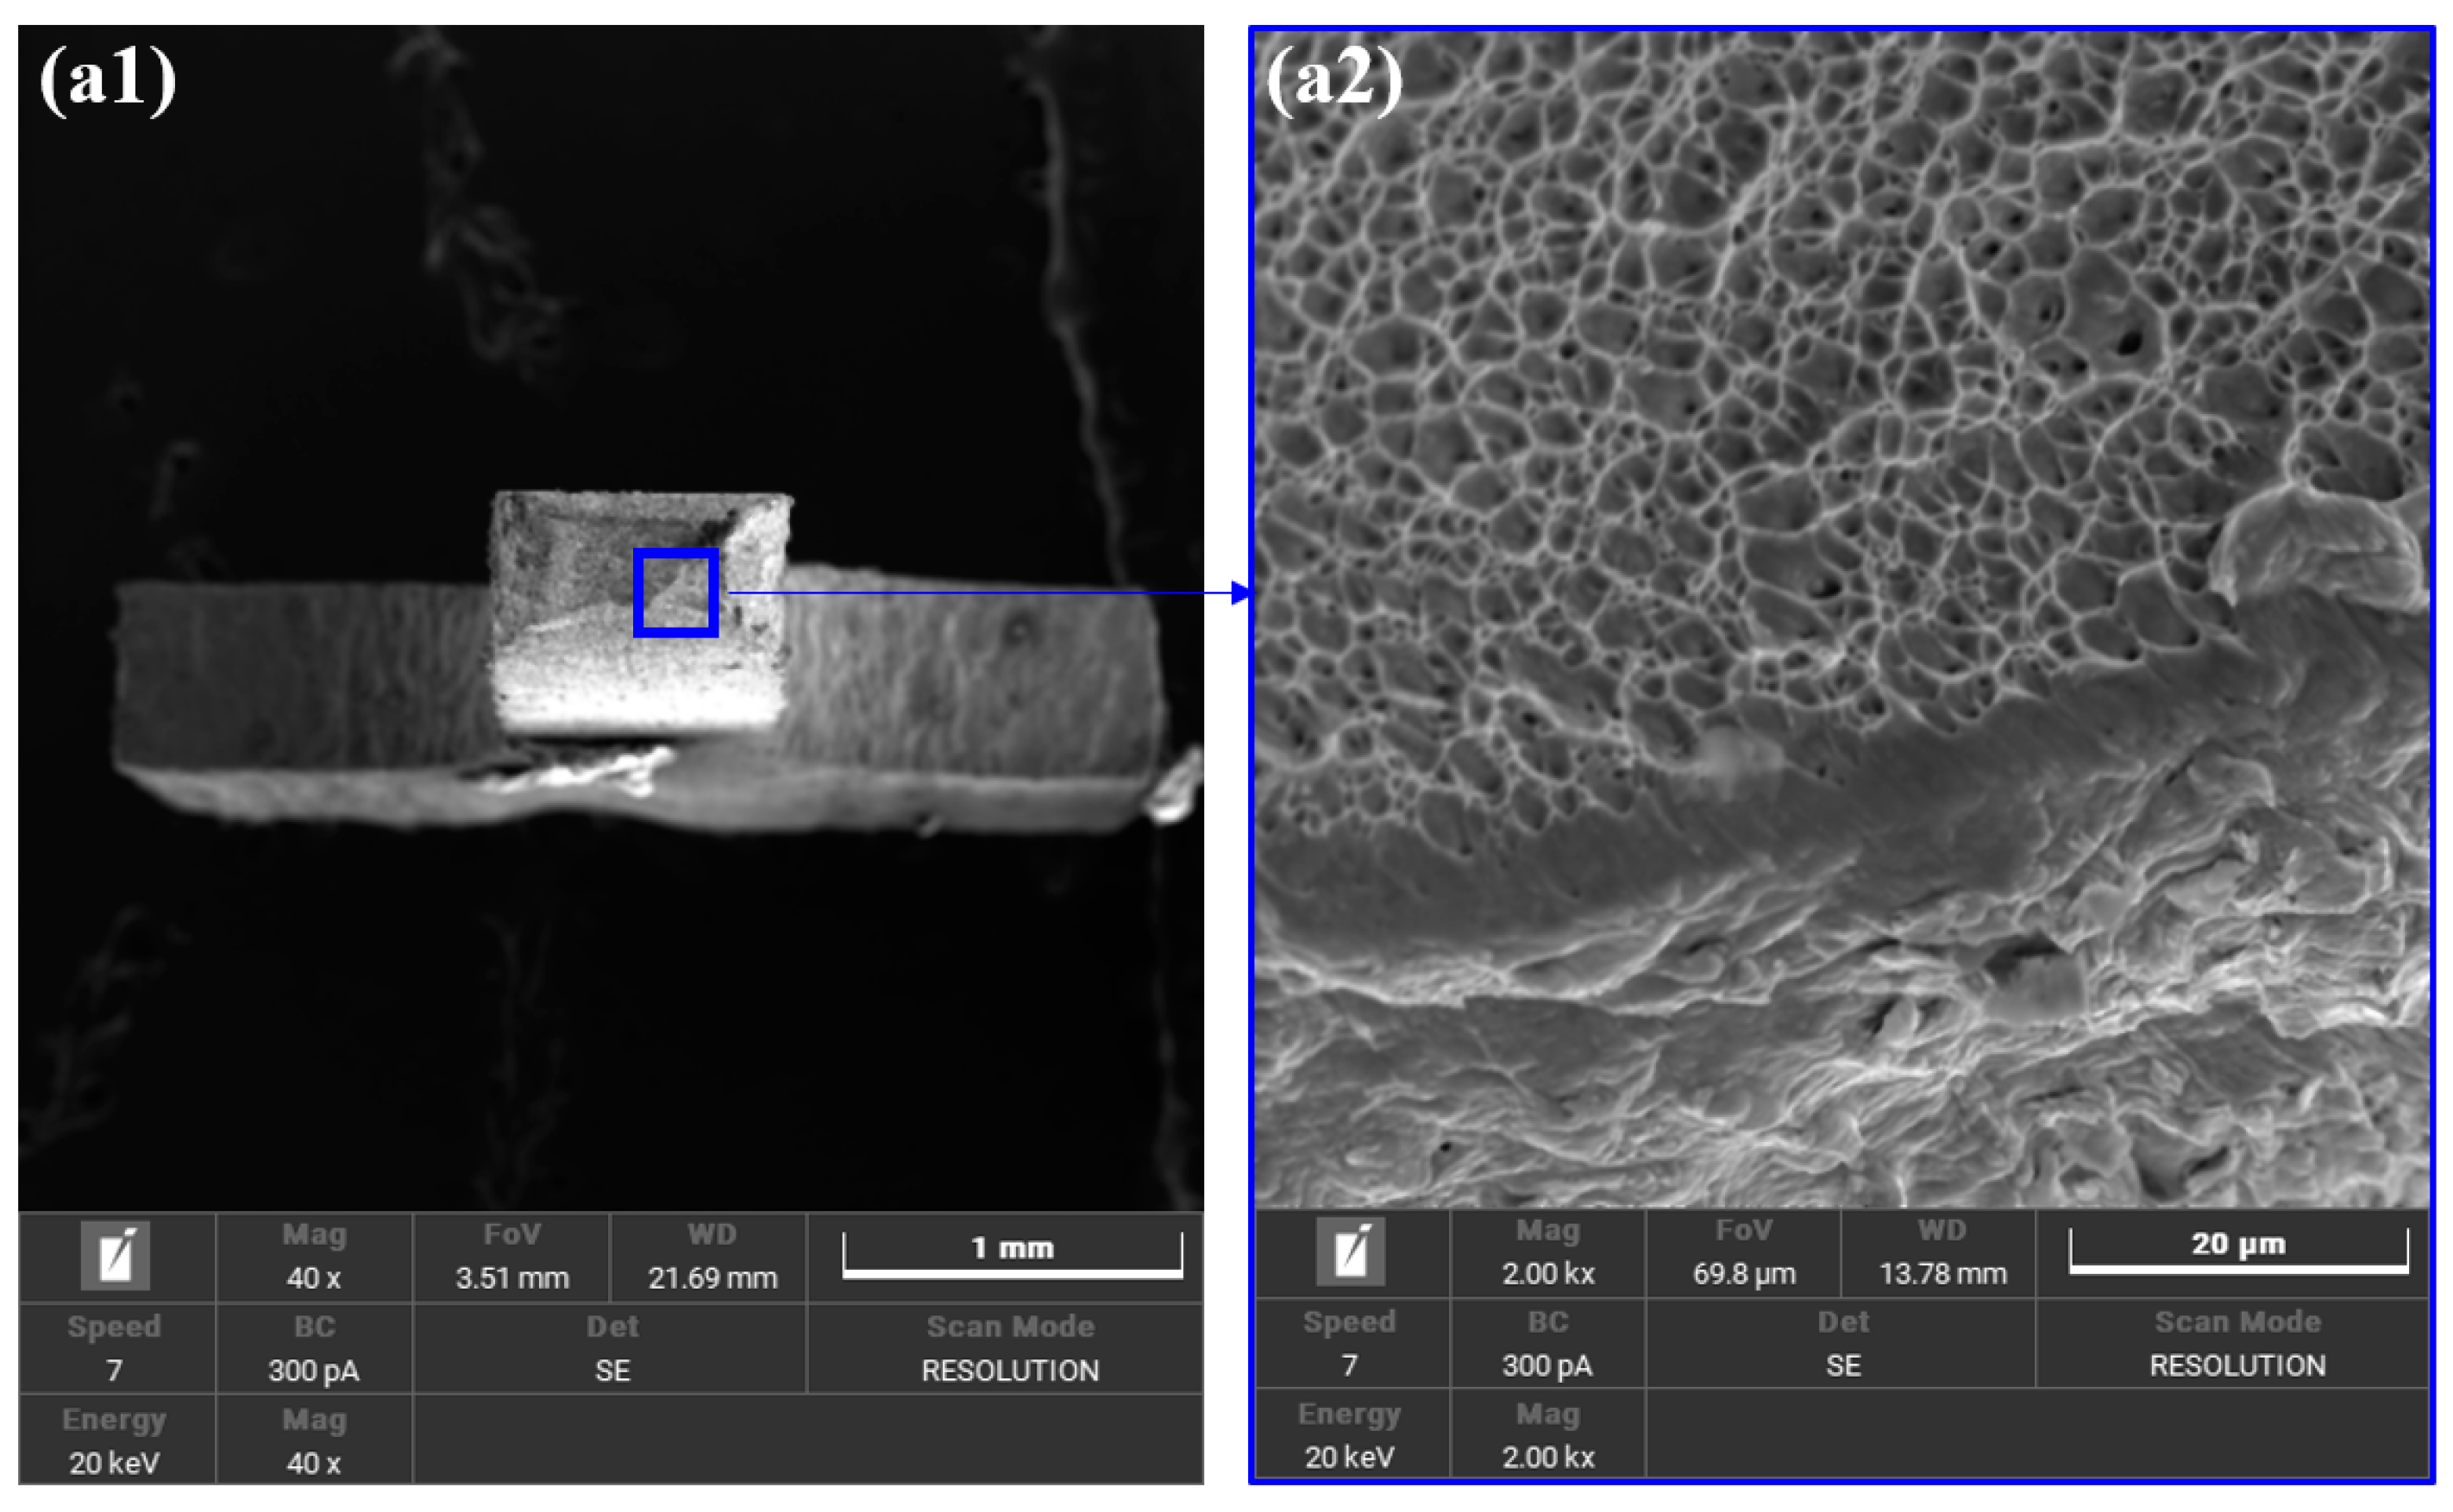
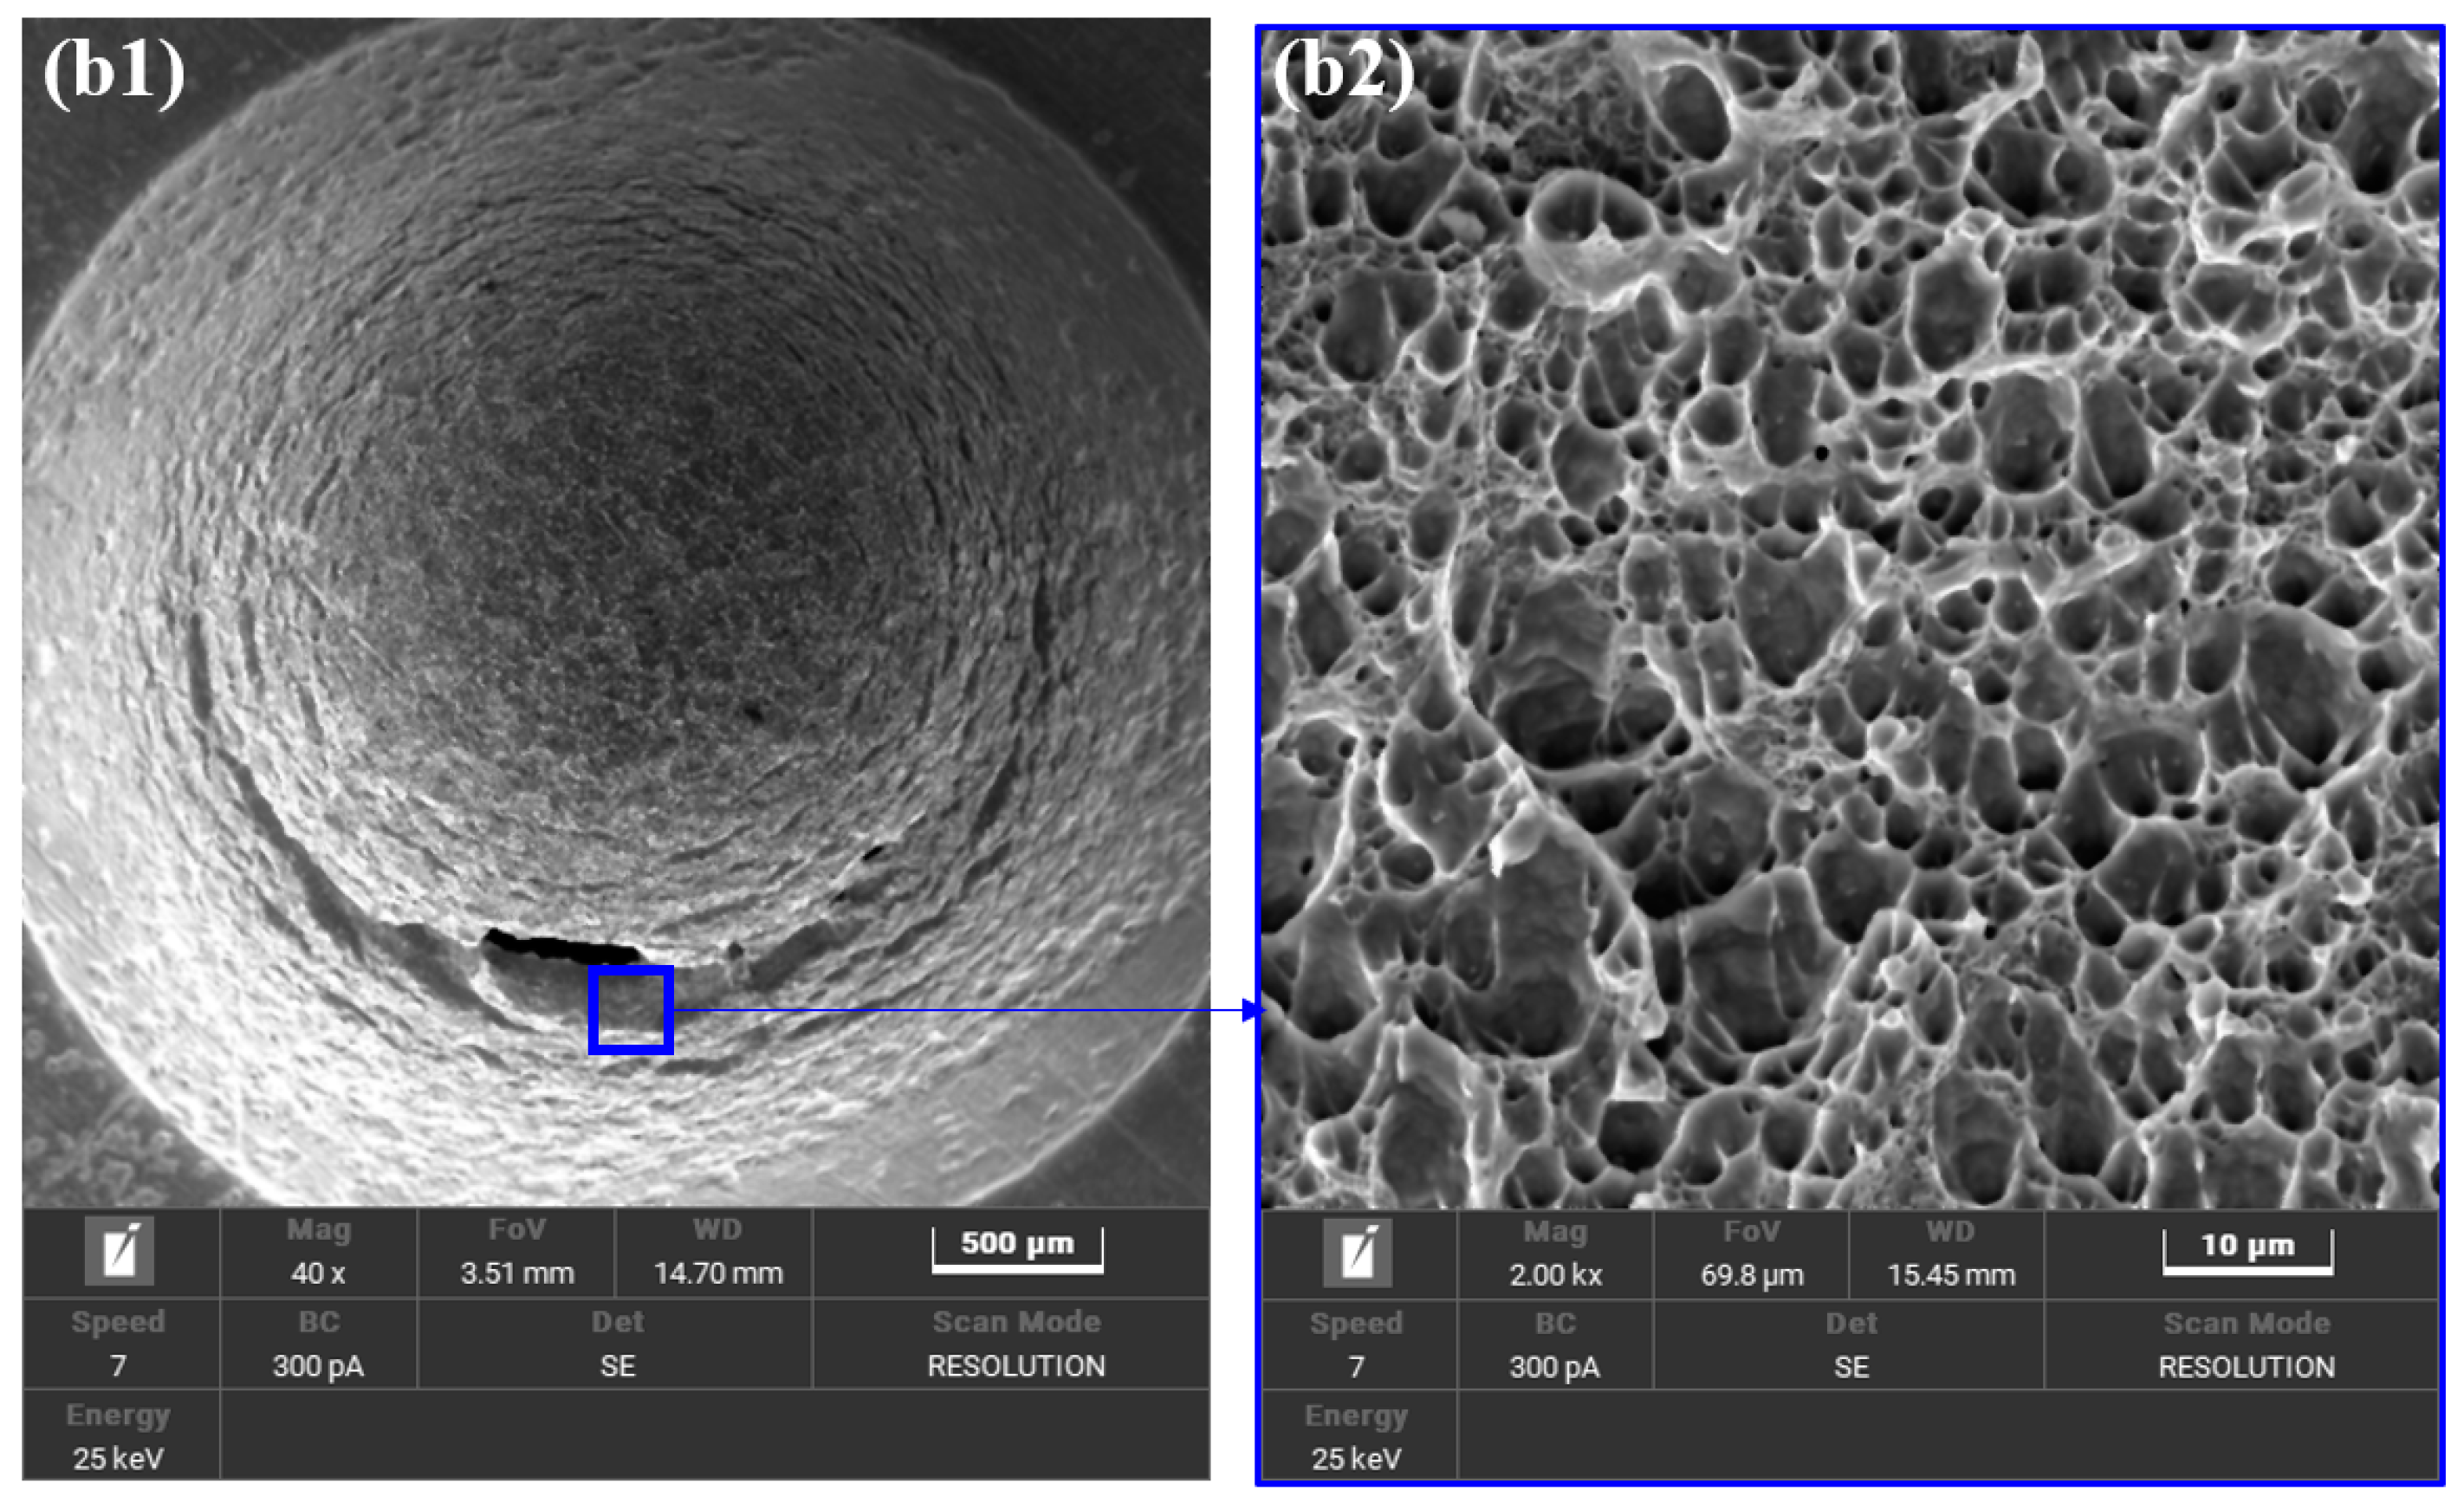
4.1. Experimental Results

Figure 5 shows the obtained load–displacement (LD) curves of standard, MUTT and SPT tests. It is shown that the MUTT curve presents same trend as that of the standard tensile test, showing the typical three stages of elastic deformation, plastic deformation and final fracture. Different from the characteristics of tensile testing, the LD curve of SPT is more complex. According to the different deformation processes of the sample, the load–displacement curve of SPT can be divided into five regions [20,21,22], i.e., Ⅰ-the elastic stage, Ⅱ-the elastoplastic transition stage, Ⅲ-the plastic bending section, Ⅳ-the film stretching stage, and Ⅴ-the fracture failure stage, as shown in Figure 6a.
As mentioned above, the yield strength of the SPT test is unable to be directly quantified. The yield load (FP) is generally used, which is defined according to the load value of the transition position of the I + II stage. The method of extracting FP by a least square method proposed by the European Committee Standard is often adopted [22], as shown in Figure 6b, which was determined by using the least square method between points A and B, described as:
f u = f A u A u               ,                               0 u < u A f B f A u B u A + f A   ,                 u A u < u B
The determined mechanical properties from experimental data, including yield load, maximum load, yield strength, ultimate strength, fracture load, fracture displacement and fracture energy, are listed in Table 2. It should be noted that for SPT, the yield and ultimate strength cannot be directly obtained. The recommended method in standard is to establish correlation formulae between SPT and tensile test based on a large number of tests. The formula fitted according to the least square method is:
σ y = α 1 F y t 2 + α 2
σ u s = β 1 F m a x t 2 + β 2
where α 1 , α 2 ,   β 1 and β 2 are material fitted constants, t is the specimen thickness, F y is the determined yield load, F m a x is the maximum load. Based on the results of SUTT and SPT in the table, if we assume α 2 and β 2 equal to 0, then the obtained values of α 1 and β 1 are 0.31 and 0.066, respectively. Currently, the material fitted constants ( α 1 , α 2 ,   β 1 and β 2 ) have not been unified, as they are sensitive to many influencing factors. Based on the previous study, the reported values for different materials of α 1 and α 2 are at the range of 0.26–0.90 and −161.9–257, and the values of β 1 and β 2 are 0.06–0.343 and −320–319 [34], respectively.
Figure 7 shows the fractographic morphologies of MUTT and SPT investigated by the scanning electron microscope (SEM) observation after specimen fracture. From the lower magnifications, the obvious plastic deformation can be seen, i.e., necking and convex cap features of MUTT and SPT, respectively. The dimples are observed at the higher magnifications.

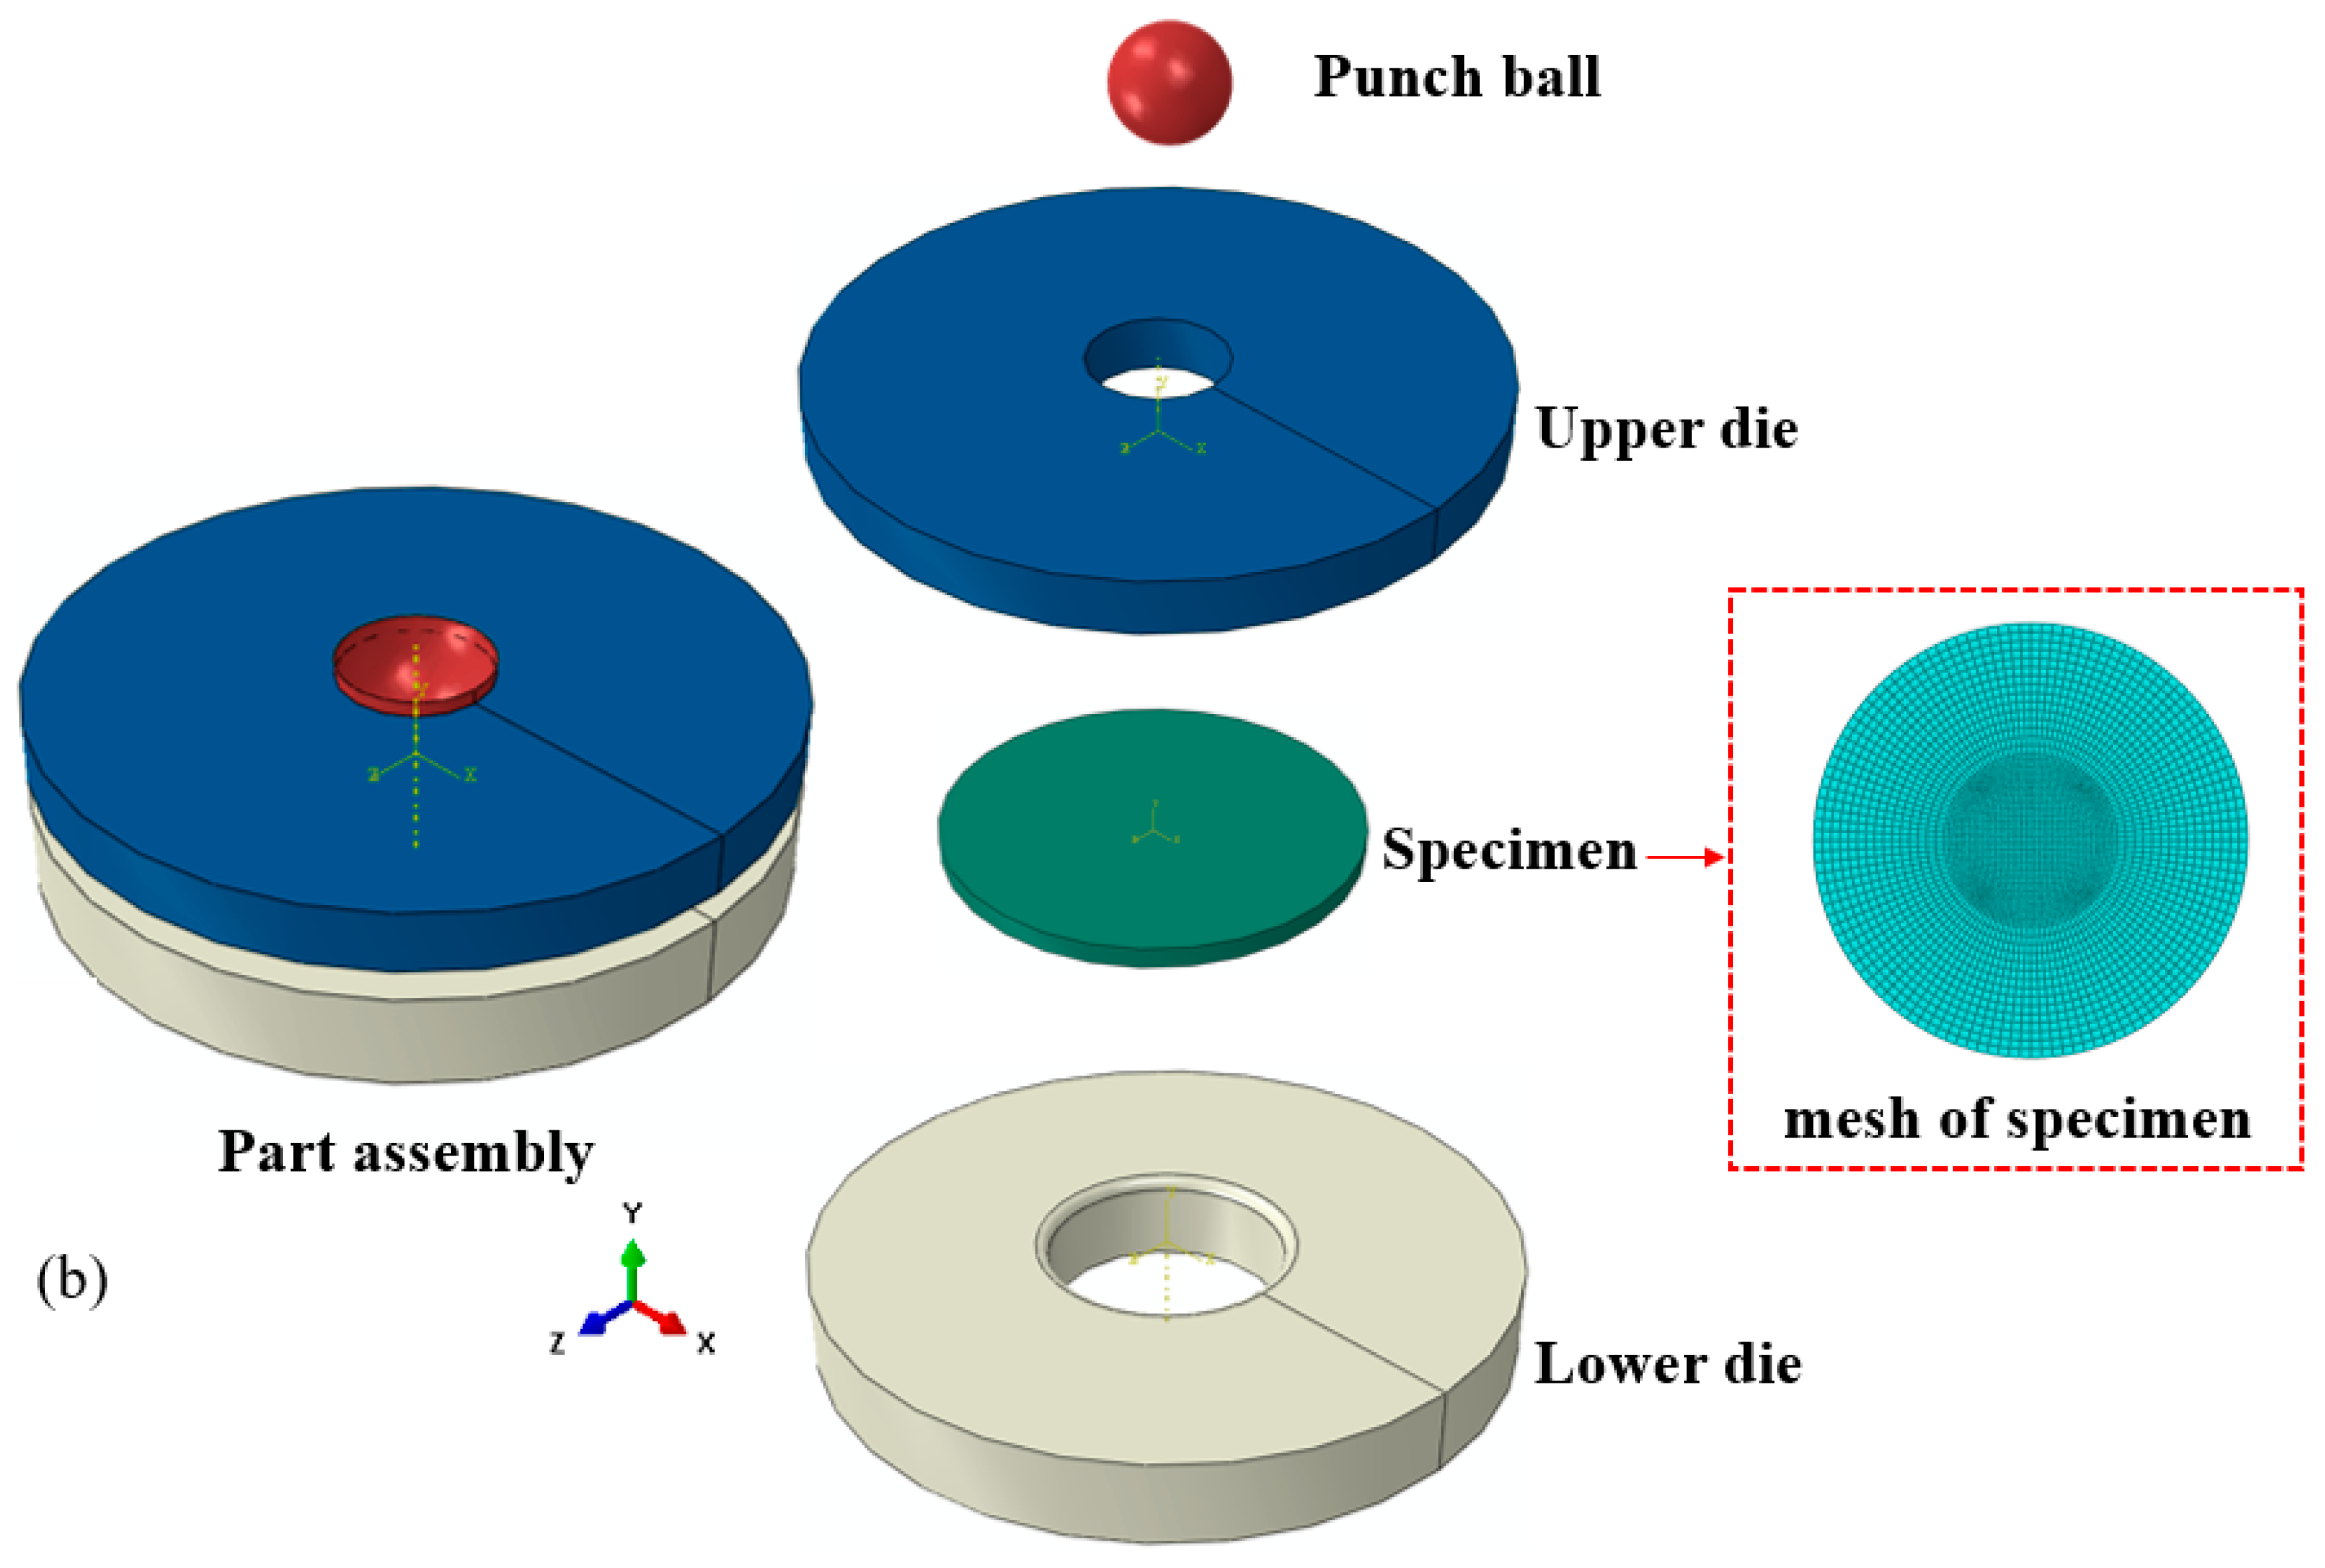
4.2. Finite Element Results

As shown in Figure 8, the input true stress and strain parameters of MUTT and SPT models were determined from the transformed load–displacement curve of standard testing data, as follows:
ε e n g = l l 0             σ e n g = F A 0
ε t r u e = ln 1 + ε               σ t r u e = σ e n g 1 + ε
where ε e n g is the engineering strain, σ e n g is the engineering stress, F is load, A 0 is initial cross-section area, l is the increase in specimen gauge length, l 0 is the gauge length of the original specimen, ε t r u e is the true strain, σ t r u e is the true stress. The GTN damage parameters are determined based on multiple optimized finite element calculations, as listed in Table 3.
The validations of the modeling results are based on the reproduction of the load–displacement curves. As plotted in Figure 9, it is seen that the numerical results are in agreement with the experimental tests of both MUTT and SPT. The average errors between experiment and modelling are less than 3%.
The marked points 1 and 2 represent the yield and maximum stress stages of MUTT and SPT, respectively. The yield stage of MUTT is determined according to 0.2% plastic strain, and the yield position of SPT is determined based on the European Committee Standard, as illustrated above in Figure 6. To analyze the results in detail, the values of Mises stresses σ Mises , equivalent plastic strains ε PEEQ and void volume fraction (VVF) were extracted at points 1 and 2. A diagram of the extraction path is shown in Figure 10.
Figure 11 shows the comparisons of distributions of σ Mises , ε PEEQ and VVF along the extraction path. From the results of the yield stage (point 1), it is clearly seen the plastic deformation of SPT is more obvious than MUTT, due to the punch ball loading effect. As shown in Figure 11(a1,b1,c1), the values of σ Mises , ε PEEQ and VVF of SPT are much higher than MUTT. With the increased deformation, differences in maximum σ Mises and ε PEEQ values of MUTT and SPT gradually decrease. At point 2, the σ Mises max values of MUTT and SPT are 1213.69 MPa and 1234.43 MPa, and the ε PEEQ max values of MUTT and SPT are 1.09 and 1.06, respectively, as shown in Figure 11(a2,b2). But the maximum VVF values of MUTT and SPT are still different, as plotted in Figure 11(c2).
For MUTT, VVF max is 0.02, while VVF max of SPT is 0.04, which is twice as much as MUTT. The contour plots of σ Mises , ε PEEQ and VVF at this stage are also displayed in Figure 12 and Figure 13. The increased VVF values of SPT explain the significant differences in fracture energies between MUTT and SPT, as listed above in Table 2. Due to the different deformation characteristics, the maximum stress, strain and VVF points of MUTT are distributed in the center of gauge length, while the maximum stress–strain points of SPT are concentrated on the circular contact surface with the punch ball.

4.3. Application in Hydrogen Embrittlement Sensitivity Analysis

In the latest research, the multi-scale and multiple analysis methods have been focused on, which requires the experimental testing of various specimens with limited shapes and sizes. The micro-specimen testing method is useful for investigation and illustration of hydrogen embrittlement in small-size equipment. An application of MUTT and SPT in the analysis of hydrogen embrittlement sensitivity is presented in this section. As shown in Figure 14, the load–displacement curves of hydrogen-charged MUTT and SPT specimens are obtained in the same hydrogen environment.
In order to quantitatively analyze the hydrogen embrittlement (HE) sensitivity, the HE index (HEI) parameter is commonly used, which represents the loss of plasticity in a material when exposed to a hydrogen environment. For uniaxial tensile testing, the elongation and reduction of area in the hydrogen-containing environment and non-hydrogen environment are used to calculate the HEI. However, SPT testing curves do not have clear quantitative characteristics of elongation and area reduction. According to the standard recommendations, the elongation and area reduction of the SPT specimen are associated with the maximum displacement at the sample center point and the maximum thickness reduction after fracture, respectively. Therefore, many reported studies have taken the reduction of thickness (ROT) and relative reduction of thickness (RRT) as the two main parameters to determine HEI, described as [15,35]:
ROT = t 0 t f t 0 ,           RRT = ROT H y d r o g e n ROT A i r / N 2
where t 0 is initial specimen thickness, t f is final specimen thickness at failure.
However, the measurement of thickness reduction is dependent on the material sensitivity of hydrogen. For materials with low hydrogen embrittlement sensitivity, the loss of thickness reduction caused by hydrogen is difficult to obtain accurately, especially for micro-scale samples. Based on the macro enlarged figures, as shown in Figure 14, the ductility loss before and after hydrogen charging of MUTT and SPT is not obvious and hard to determine based on manual measurements.
Except for the ROT and RRT, G.’Alvarez et al. [14] also proposed some other parameters to characterize HEI, including equivalent biaxial deformation at failure ( ε q f ), the rate of change of fitted circle to failure shape ( Φ q f ) and fracture energy ( W S P T ). Among them, the fracture energy is calculated from the load–displacement curves, which can reduce the errors by imprecise measurement or manual fitting methods. HEI based on W S P T is as follows:
H E I W S P T = W S P T A i r / t 0 2 W S P T H y d r o g e n / t 0 2 W S P T A i r / t 0 2 ,         W S P T = 0 u F m a x F u d u
According to Equation (13), the calculated HEI of SPT is 11.99%. For MUTT, the fracture energy is also calculated by integral computation, while the data of t 0 2 are replaced with the thickness multiplied by width. The obtained HEI for MUTT is 19.52%, as plotted in Figure 15.
The investigations into the fracture surface morphologies of MUTT and SPT after hydrogen charging are shown in Figure 16 and Figure 17, respectively. Although the charging time is 2 h, the brittle fracture features with the quasi-cleavage fracture mode have already been observed near the edge of the fracture surface, where the material was exposed to hydrogen charging solution.
According to the experimental results of uncharged and hydrogen-charged MUTT and SPT, hydrogen mainly affects the later stage of specimen deformations. Inverse finite element calculations were performed to determine the GTN damage parameters after hydrogen was charged. Based on many published results, it is known that the parameters of ε N , s N , f N , f c and f F are the main factors affecting the later deformation segment. The optimized process is firstly applied based on the orthogonal method of 2-level multi-factor to determine the most sensitive factors. Then, we minimized the changes to the parameters to ensure that the simulation results matched the experimental results with an error of less than 3%. Based on this, the inverse computations of MUTT are 12 times, and SPT is calculated only 6 times. The final results are listed and shown in Table 4 and Figure 18.
It is determined that for MUTT, the nucleation strain ε N decreased from 0.3 to 0.15, the volume fraction of the nucleated voids f N increased from 0.0025 to 0.004, and the critical void volume fraction f c decreased from 0.025 to 0.0055. For SPT, the nucleation strain ε N decreased from 0.3 to 0.2 and the critical void volume fraction f c decreased from 0.025 to 0.002. From the determined GTN damage parameters based on inverse finite element modeling, it is also shown that the HE sensitivity characterized by MUTT is higher than that of SPT. After hydrogen charging, the value of the critical void volume fraction f c of MUTT is only about a quarter of that of SPT. Based on the inverse finite element analysis, the hydrogen embrittlement index can also be determined by the modeling results, and the calculated values are listed in Table 5 and Table 6.
It should be noted that the distribution of hydrogen concentration in the hydrogen-charged specimens is uniform. Although the GTN parameters determined by optimization are related to the average values, they can also reflect the differences between MUTT and SPT after hydrogen charging. Based on the HEI results and fracture surface observations, it is concluded that the hydrogen embrittlement sensitivity characterized by MUTT is higher than that of SPT. This is because, for MUTT, both the upper and lower surfaces charged with hydrogen will increase the damage degree of the specimen. However, for SPT, the hydrogen-increased damage is mainly caused by the lower surface. During plastic deformation, the severe damage regions of MUTT are concentrated in the limited areas of gauge length. And the serve damage areas of SPT are the regions contacted with punch ball, which are larger than that of MUTT. Thus, the hydrogen-influenced areas in MUTT are higher than in SPT. Another influence factor is related to the different strain rates. The employed 0.2 mm/min displacement rate corresponds to a strain rate of about 10−4 for MUTT, while the SPT strain rate is about 10−3 [35].

5. Conclusions

The stress–strain performances of miniature uniaxial tensile and small punch tests were investigated through experimental testing and inverse finite element modeling in this paper. And an application case of hydrogen embrittlement sensitivity characterization was also presented. The main conclusions can be summarized as follows:
(1)
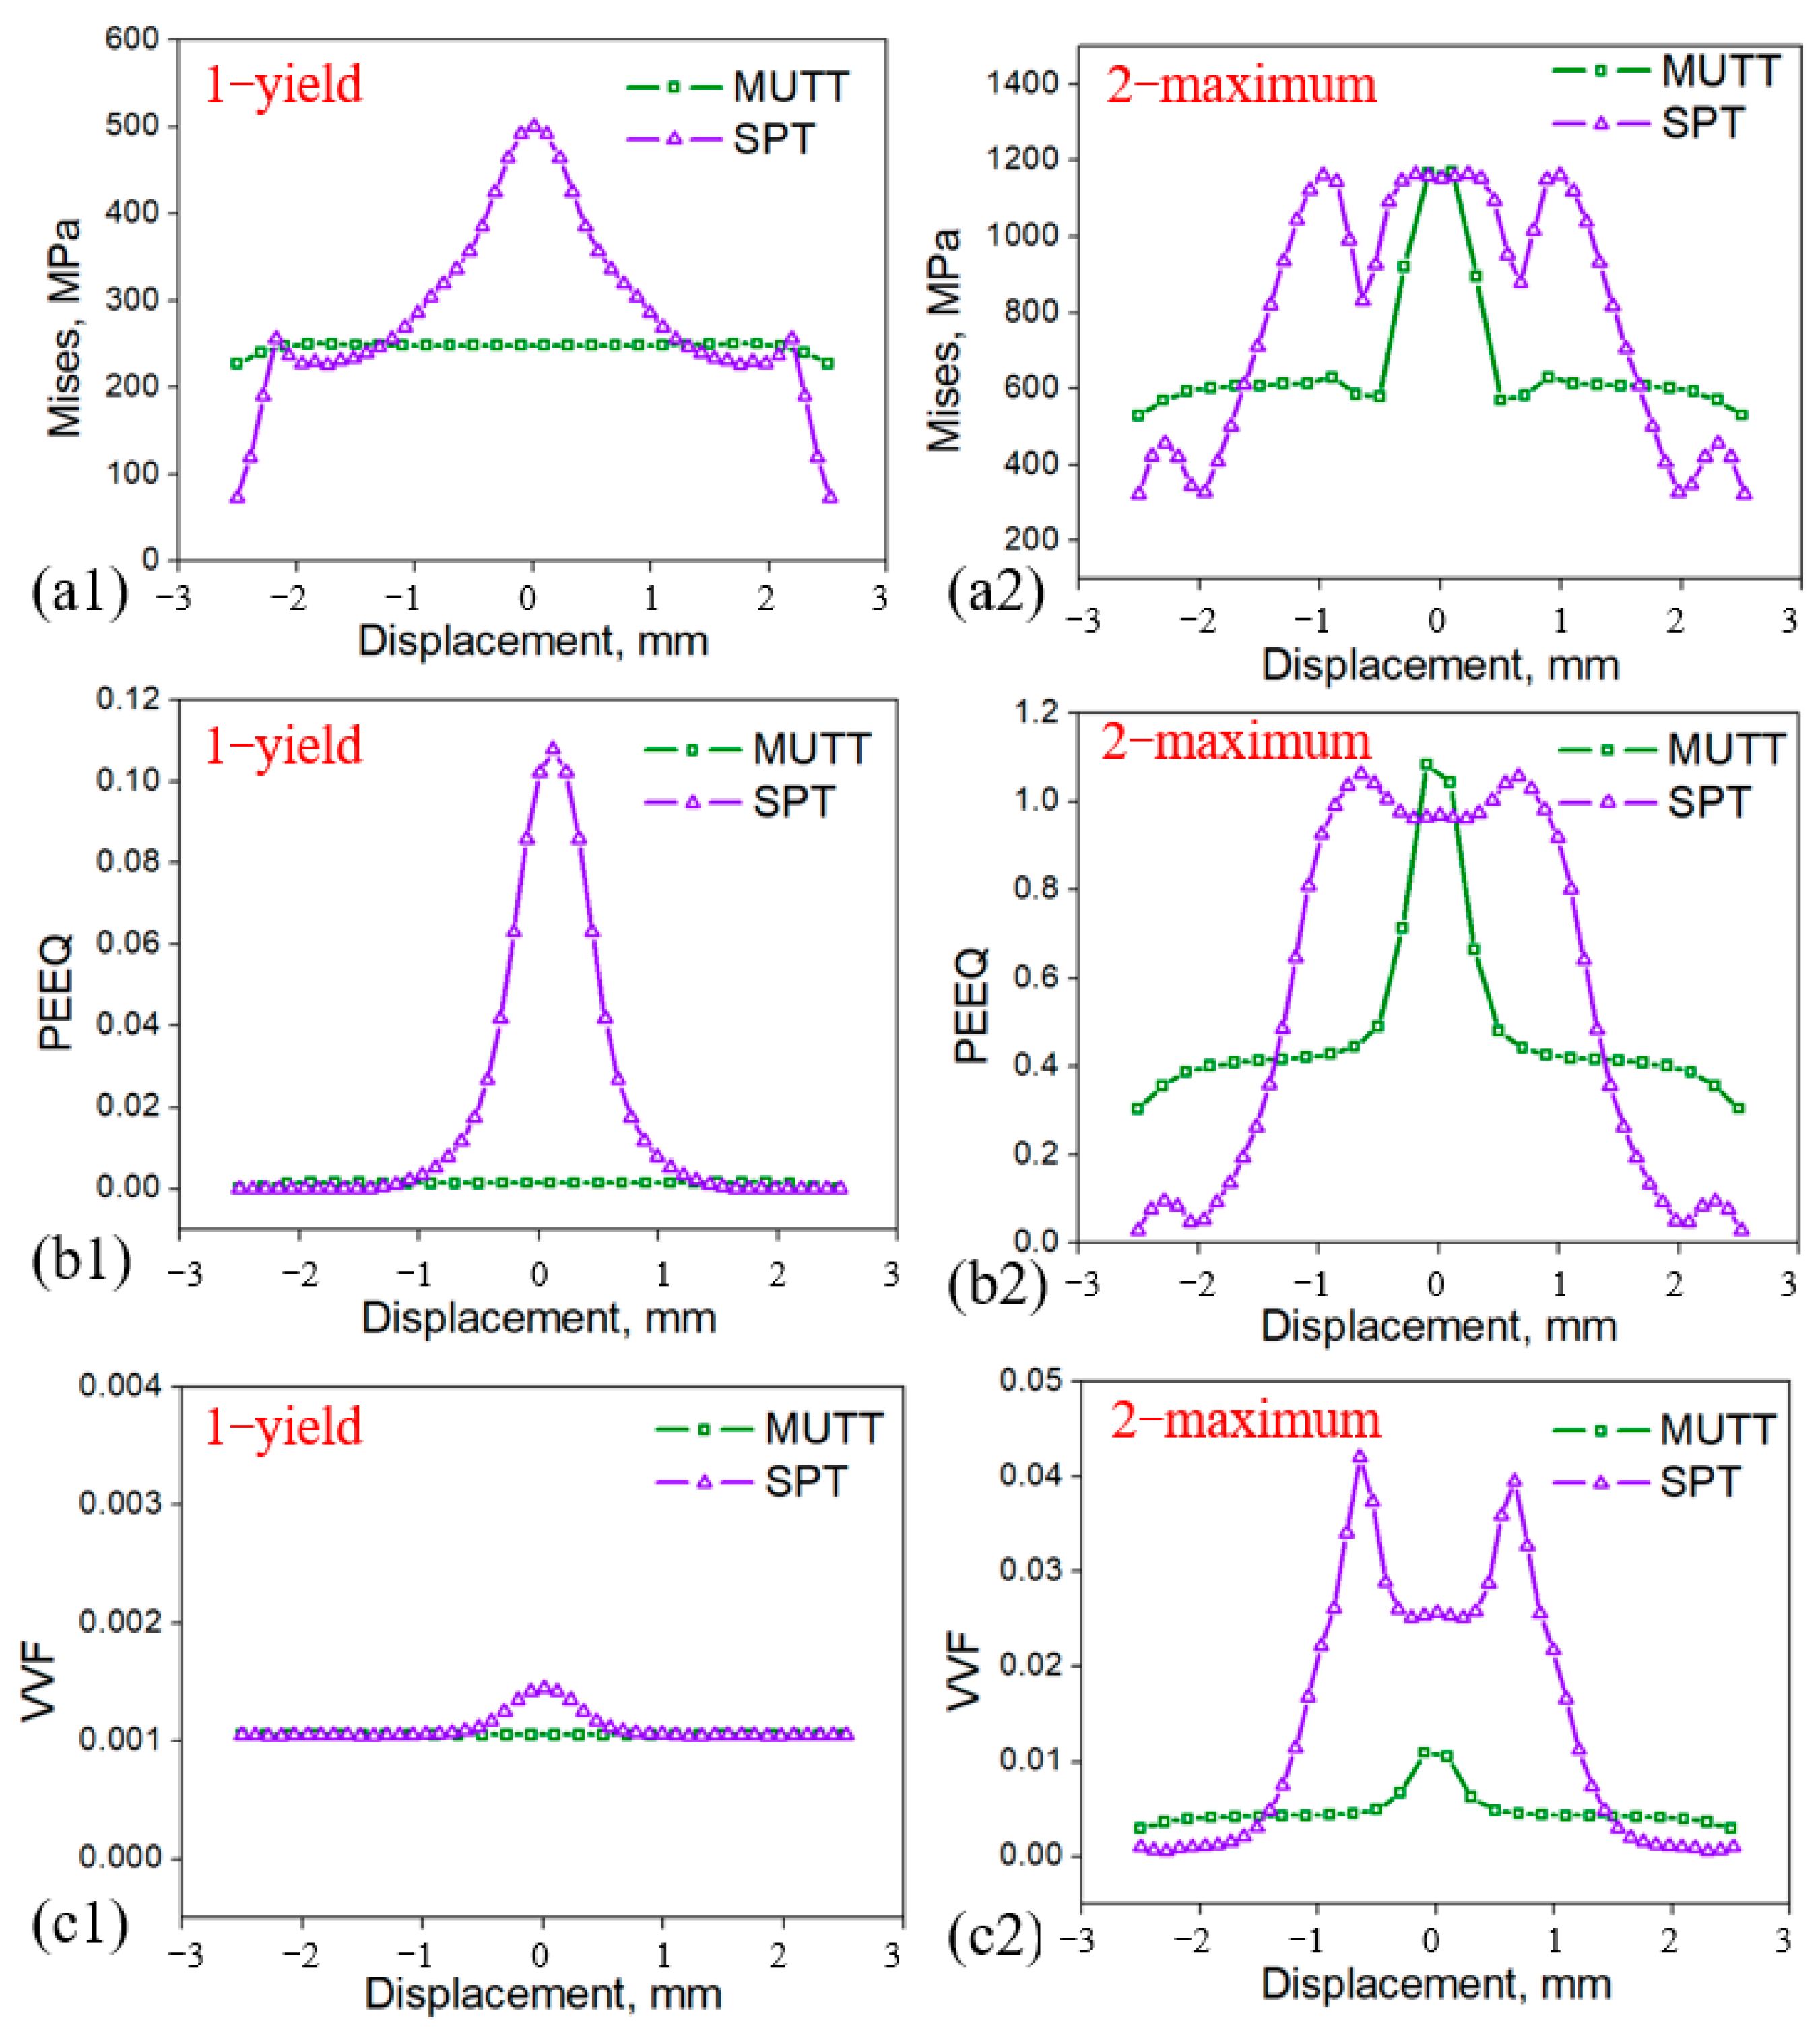
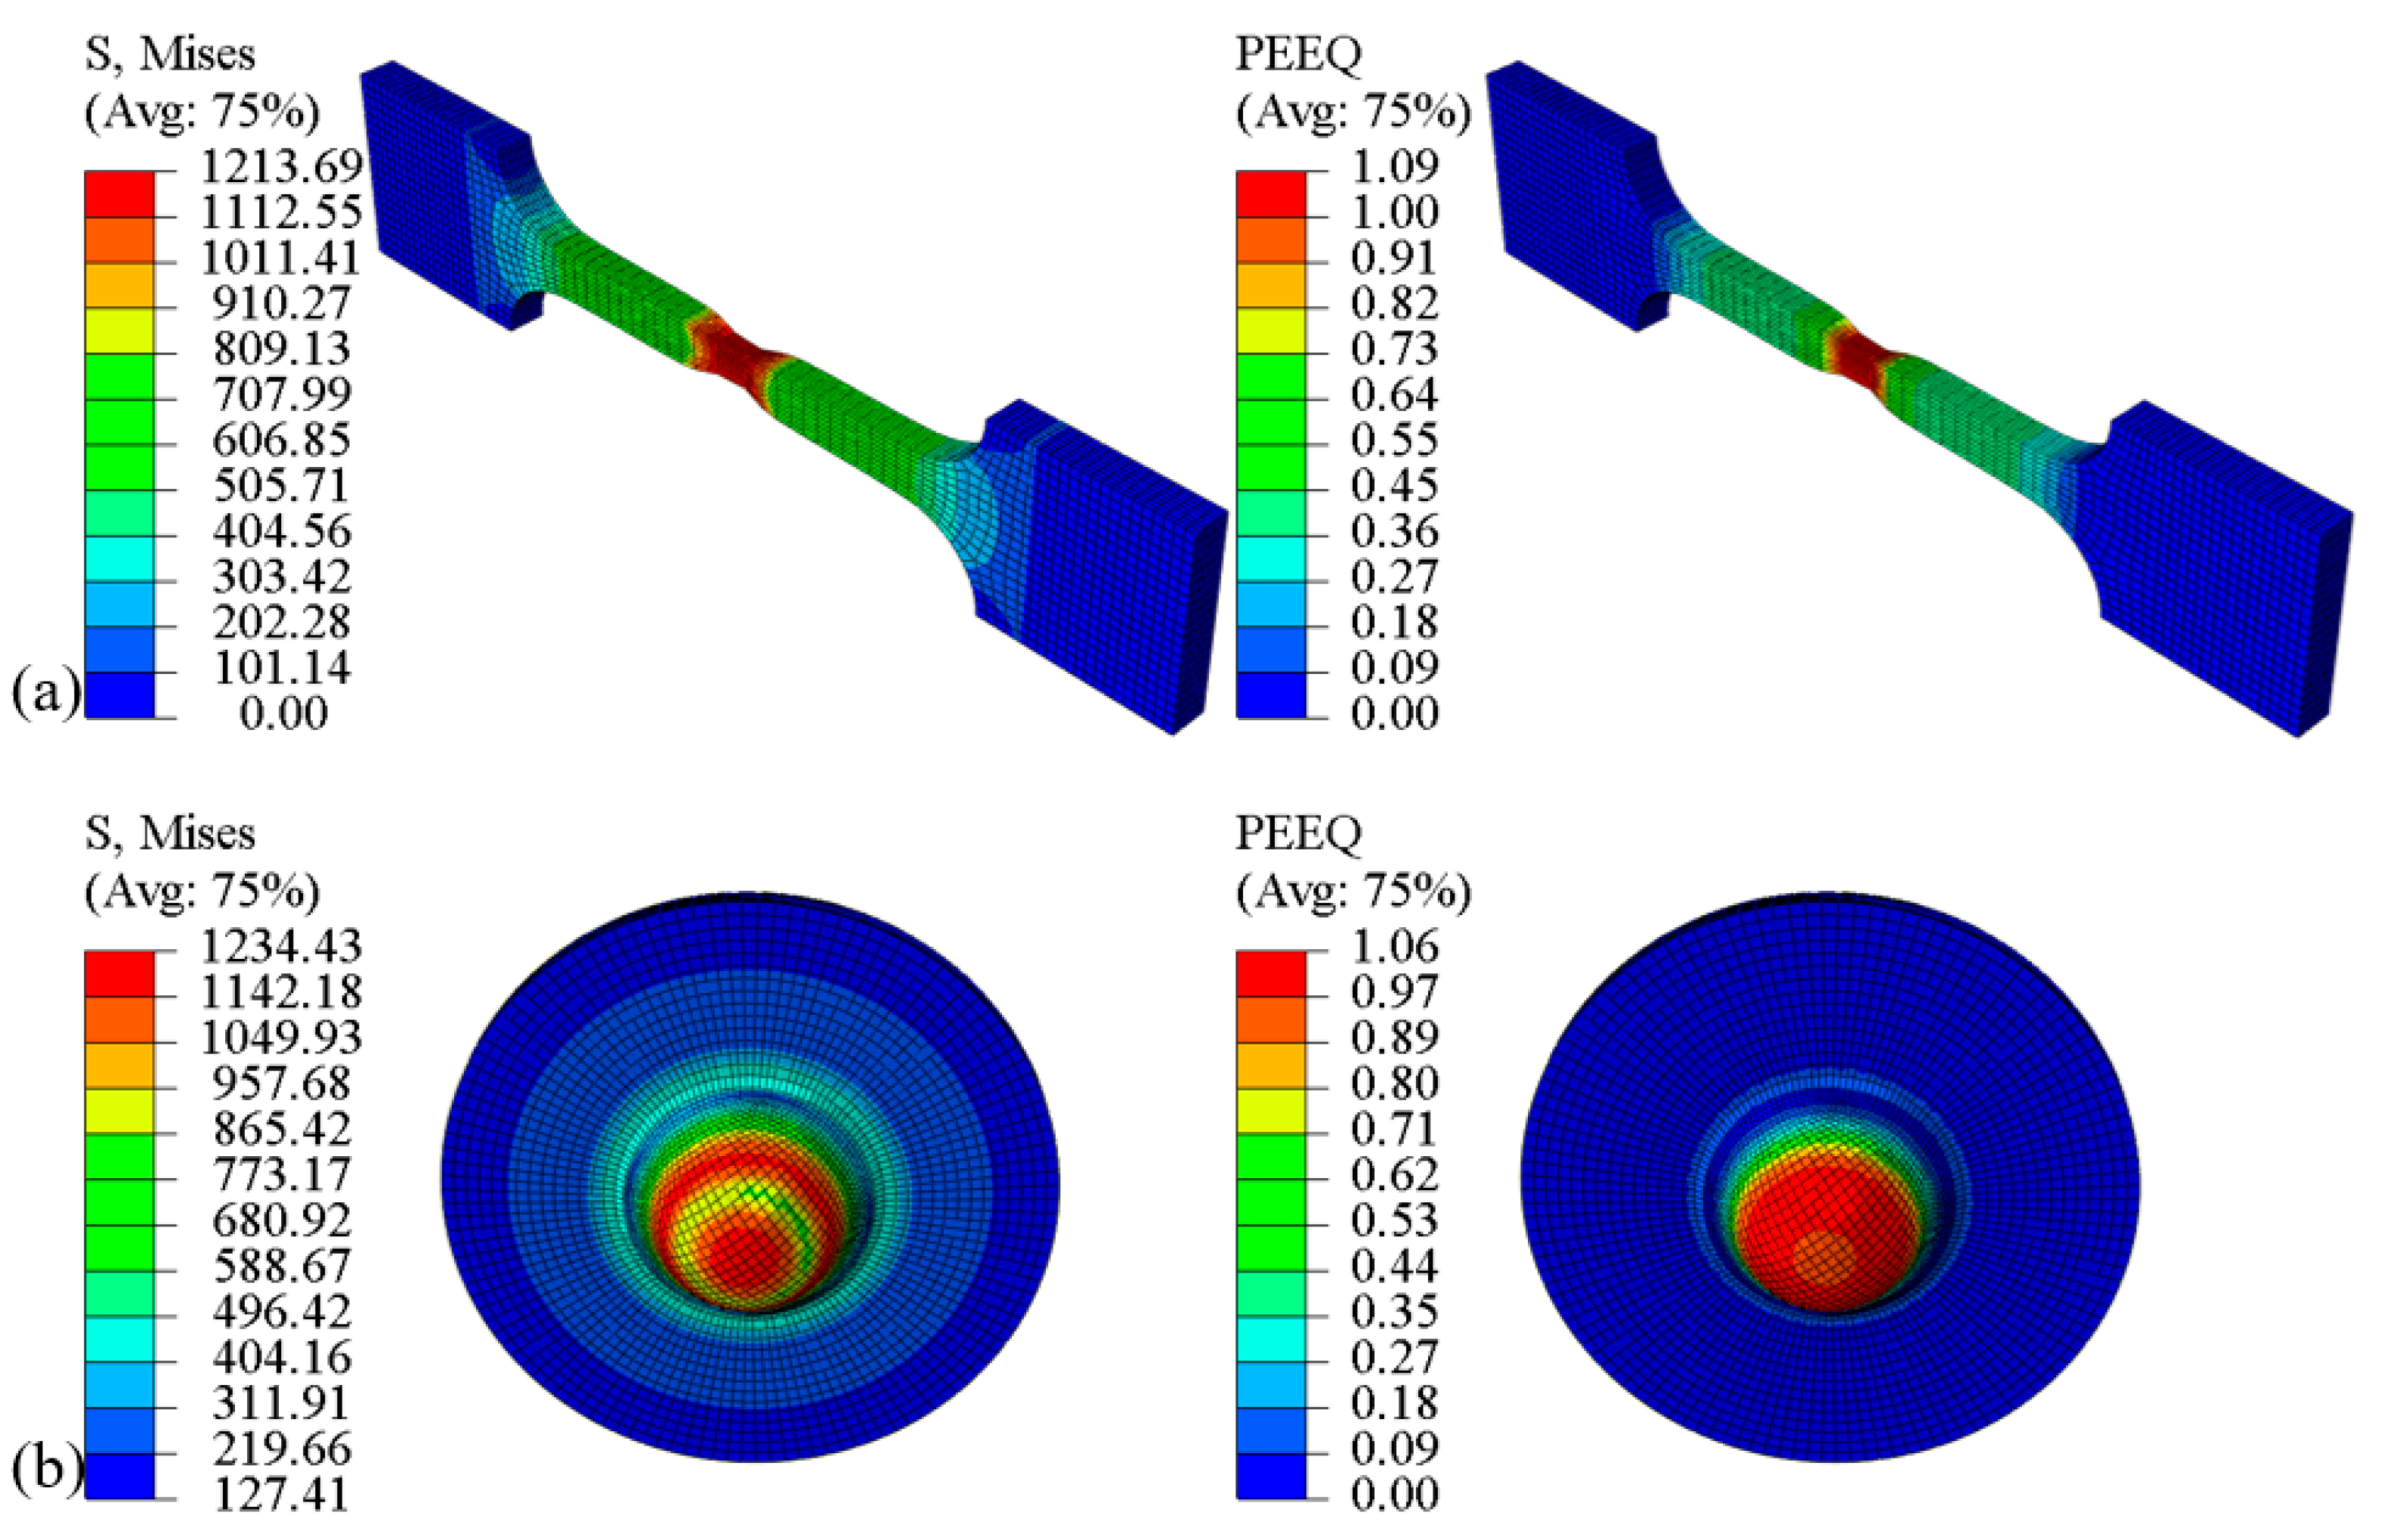
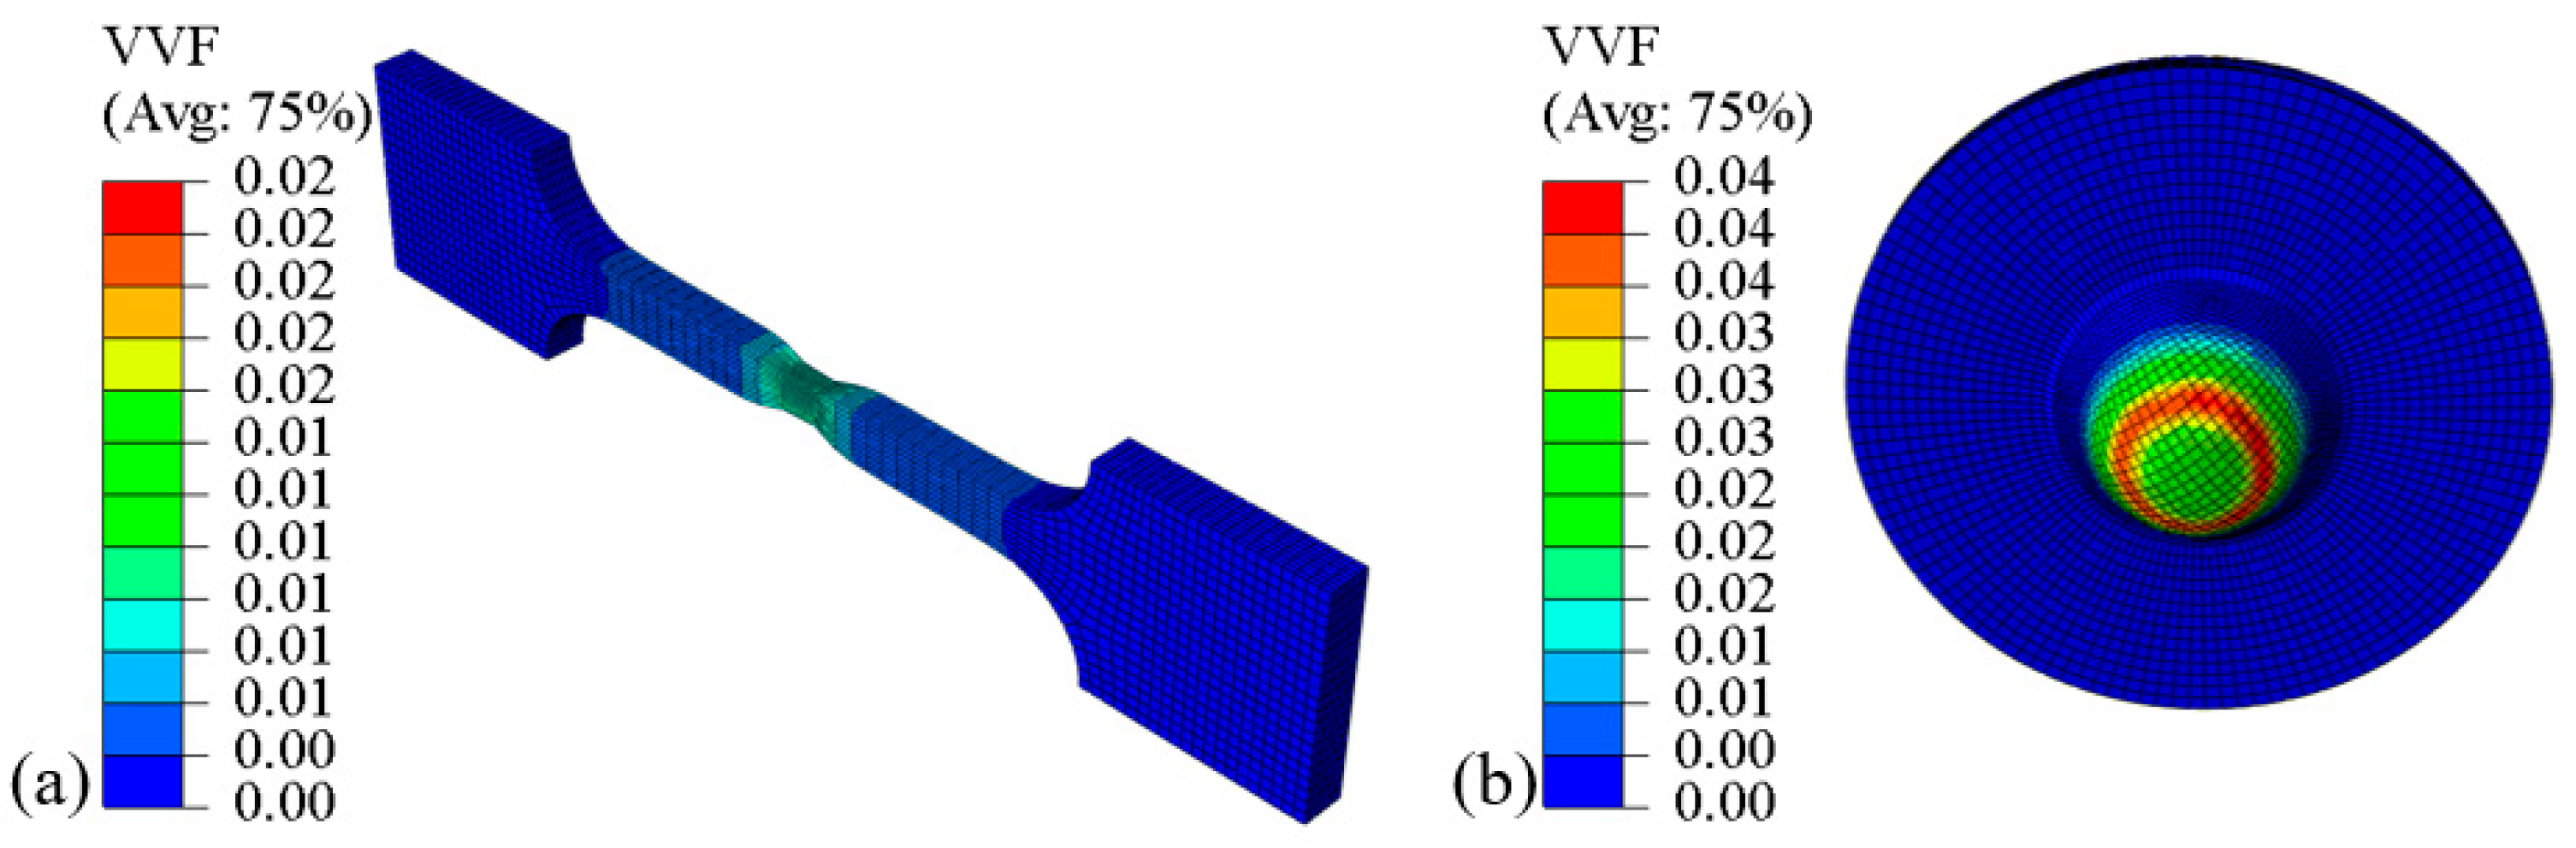
The stress–strain distributions of the miniature tensile test and small punch test are different due to their distinct deformation processes. The maximum stress–strain points of the miniature tensile test specimen are located at the gauge length center, whereas those of the small punch specimen are concentrated on the circular contact surface with the punch ball. Before the failure stage, the achieved maximum Mises stress and equivalent plastic strain values of the miniature tensile test and small punch test were very close, but the areas reaching the maximum damage of the small punch specimen are relatively large. During damage evolution, the maximum void volume fraction values of the small punch test ( VVF max SPT = 0.04 ) are twice that of the miniature uniaxial tensile test ( VVF max MUTT = 0.02 ).
(2)
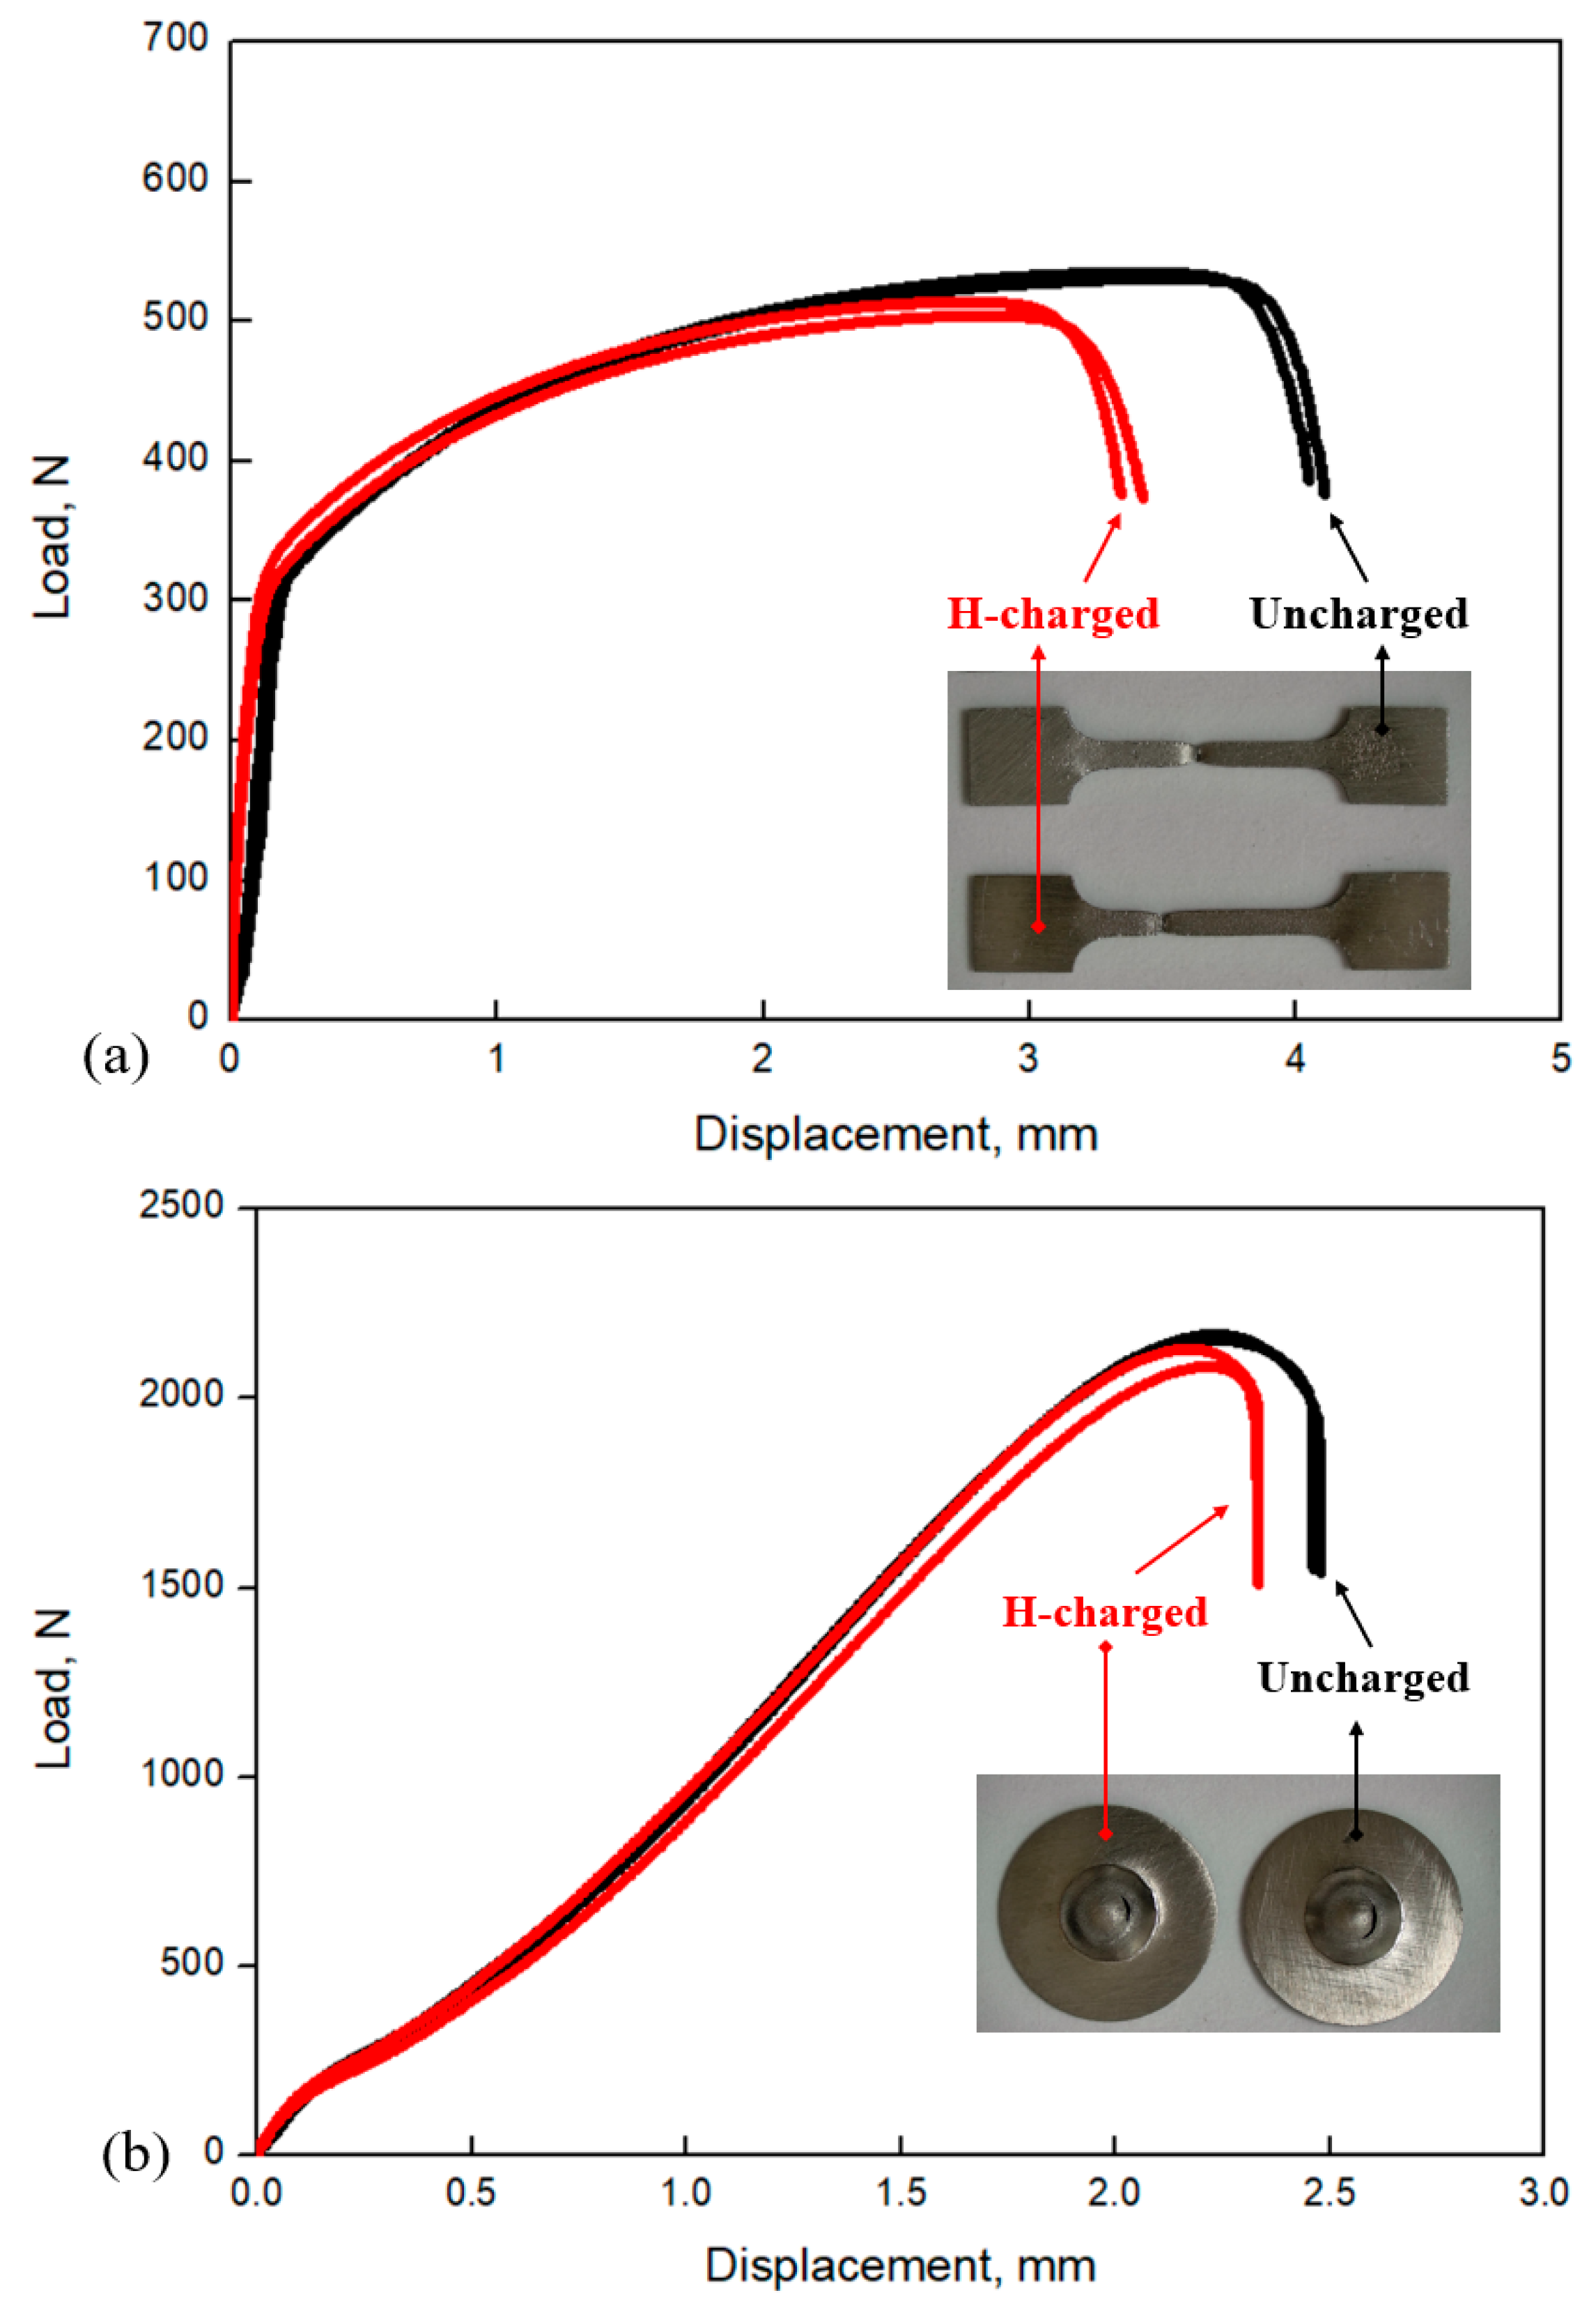
The hydrogen embrittlement sensitivity of 316L stainless steel was characterized through miniature tensile test and small punch test. The GTN damage parameters of hydrogen-charged miniature tensile specimen and small punch specimen were determined based on the inverse finite element analysis. The hydrogen-induced ductility loss is mainly related to the parameters of nucleation strain ε N , volume fraction of the nucleated voids f N and critical void volume fraction f c . Among them, the difference in critical void volume fraction is the most obvious. The value of the hydrogen-charged miniature tensile specimen f c MUTT was reduced from 0.025 to 0.0055, which is about a quarter smaller than that of the hydrogen-charged small punch specimen ( f c SPT = 0.02 ).
(3)
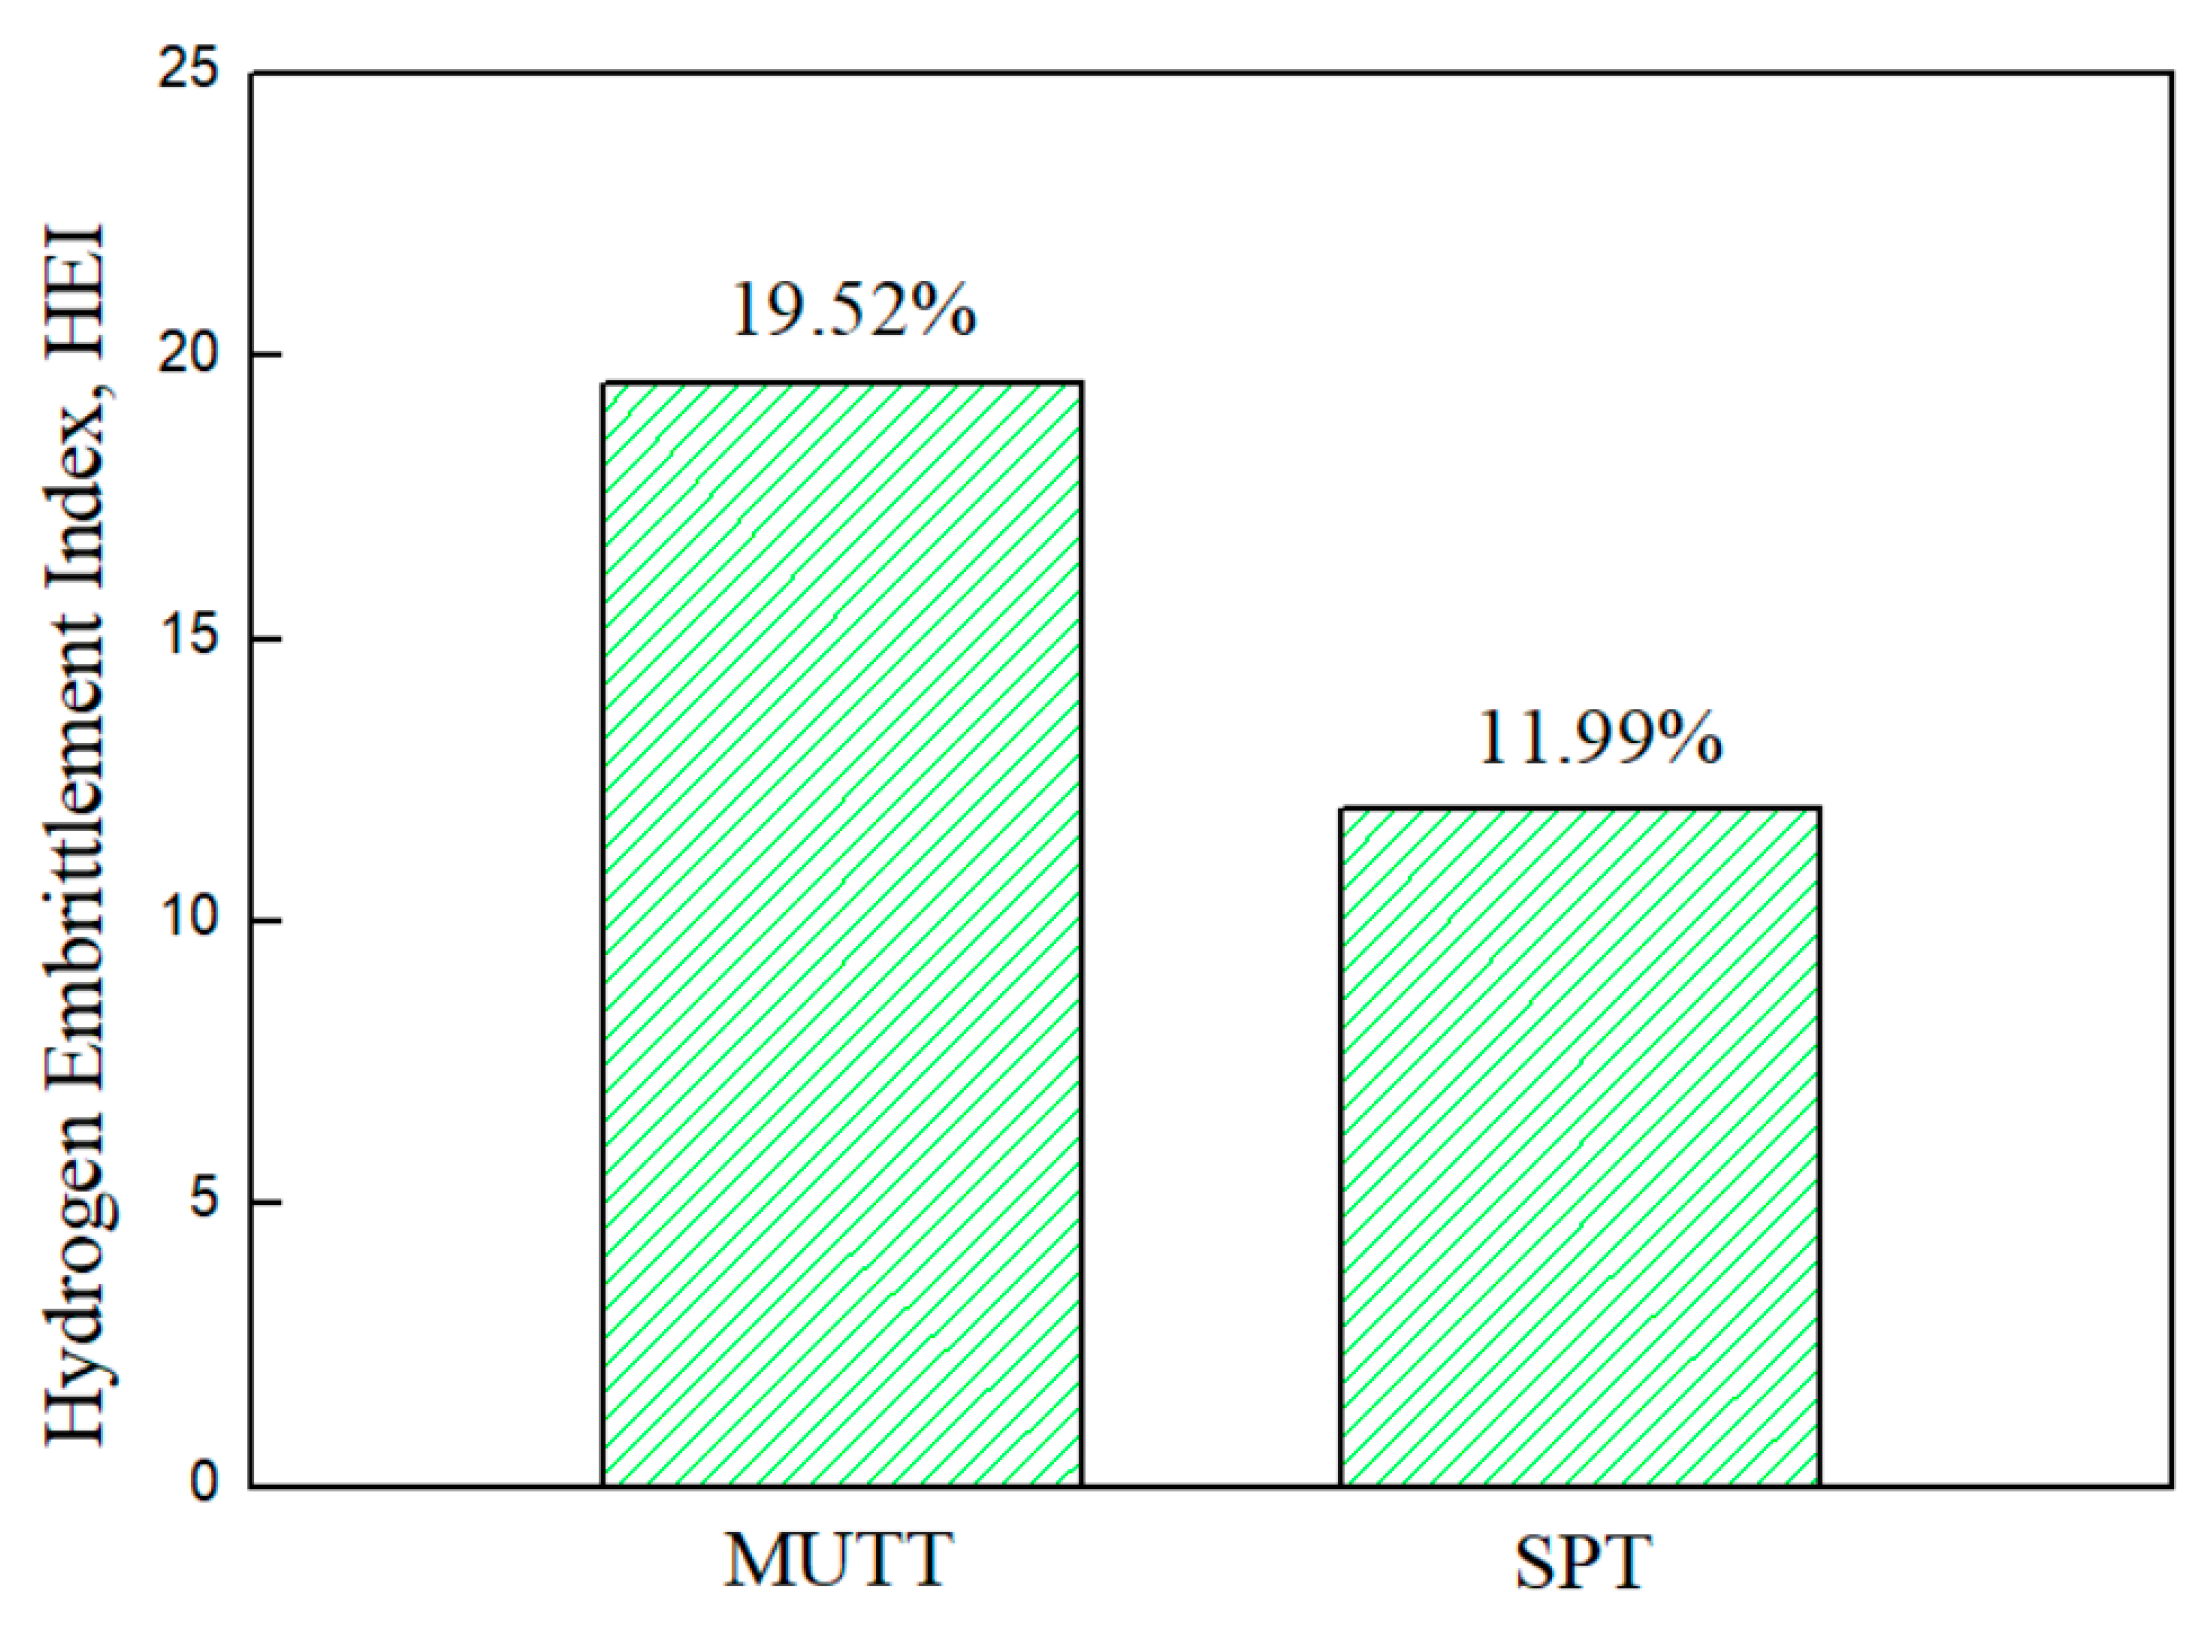
Under the same hydrogen charging environment and displacement rate, the determined hydrogen embrittlement index based on the loss of fracture energy of miniature tensile test ( H E I W MUTT = 19.52 % ) is higher than that of the small punch test H E I W SPT = 11 . 99 % , which is consistent with the determined embrittlement indexes based on the elongation, area reduction and thickness reduction. The calculations and correlations of hydrogen embrittlement sensitivity under different sizes of specimens need to be focused on. This research can provide a reference for the comparison of multi-scale combined testing and its application performance.

Author Contributions

Conceptualization, P.T. and J.P.; methodology, P.T. and W.Z.; software, P.T. and W.Z.; validation, P.T. and X.M.; formal analysis, P.T., J.P. and X.L.; investigation, P.T., W.Z. and X.M.; data curation, P.T., W.Z., X.M., J.P. and X.L.; writing—original draft preparation, P.T., W.Z. and X.M.; writing—review and editing, P.T., W.Z., X.M., J.P. and X.L.; supervision, P.T., J.P. and X.L.; funding acquisition, P.T., J.P. and X.L. All authors have read and agreed to the published version of the manuscript.

Funding

This research was funded by the financial support of the National Natural Science Foundation of China (52205142), Natural Science Research of Jiangsu Higher Education Institutions of China (22KJB460012), Postgraduate Research & Practice Innovation Program of Jiangsu Province (KYCX23_3089, YPC23020133), and the Postgraduate Research & Practice Innovation Program of Jiangsu Province (KYCX23_3088).

Data Availability Statement

The raw data supporting the conclusions of this article will be made available by the authors on request.

Conflicts of Interest

The authors declare no conflict of interest.

References

  1. Baik, J.M.; Buck, O.; Kameda, J. Small punch test evaluation of intergranular embrittlement of an alloy steel. Scr. Metall. 1983, 17, 1443–1447. [Google Scholar] [CrossRef]
  2. Misawa, T.; Adachi, T.; Saito, M.; Hamaguchi, Y. Small punch tests for evaluating ductile-brittle transition behavior of irradiated ferritic steels. J. Nucl. Mater. 1987, 150, 194–202. [Google Scholar] [CrossRef]
  3. Bruchhausen, M.; Holmström, S.; Simonovski, I.; Austin, T.; Lapetite, J.M.; Ripplinger, S.; De Haan, F. Recent developments in small punch testing: Tensile properties and DBTT. Theor. Appl. Fract. Mech. 2016, 86, 2–10. [Google Scholar] [CrossRef]
  4. Wang, J.; Zheng, Y.; Ling, X. Damage analysis of in-service ethylene cracking furnace tubes using small punch test. Eng. Fail. Anal. 2023, 152, 107438. [Google Scholar] [CrossRef]
  5. Seo, K.W.; Kim, Y.J.; Kim, K.S. Quantification of pre-strain effect on ductile fracture and application to irradiation embrittlement problems. Eng. Fract. Mech. 2024, 300, 109986. [Google Scholar] [CrossRef]
  6. Kodaira, Y.; Takano, Y.; Yonezu, A. Characterization of creep deformation behavior of porous polymer membrane under Small-Punch test. Eng. Fail. Anal. 2022, 135, 106149. [Google Scholar] [CrossRef]
  7. Geng, X.; Peng, J.; Jiang, L.; Liu, X.; Tu, Y.; Xue, Z. Experimental study of mechanical properties and fracture modes in different regions of the nickel-based welding joint based on small punch test. Weld. World 2023, 67, 637–650. [Google Scholar] [CrossRef]
  8. Singh, S.; Santana Pérez, O.; Rodríguez González, M.C.; Oksman, K.; Maspoch, M.L. Mechanical behaviour of poly (lactic acid)/cellulose nanocrystal nanocomposites: A comparative study between conventional tensile test and small punch test. Express Polym. Lett. 2020, 14, 1127–1136. [Google Scholar] [CrossRef]
  9. Reggente, M.; Angeloni, L.; Passeri, D.; Chevallier, P.; Turgeon, S.; Mantovani, D.; Rossi, M. Mechanical characterization of methanol plasma treated fluorocarbon ultrathin films through atomic force microscopy. Front. Mater. 2020, 6, 338. [Google Scholar] [CrossRef]
  10. Lucon, E.; Benzing, J.T.; Derimow, N.; Hrabe, N. Small punch testing to estimate the tensile and fracture properties of additively manufactured Ti-6Al-4V. J. Mater. Eng. Perform. 2021, 30, 5039–5049. [Google Scholar] [CrossRef]
  11. Torres, J.; Gordon, A.P. Mechanics of the small punch test: A review and qualification of additive manufacturing materials. J. Mater. Sci. 2021, 56, 10707–10744. [Google Scholar] [CrossRef]
  12. García-Blanco, I.; García, T.E.; Cabezas, J.G.; González, R.; Álvarez, G.; Rodríguez, C. Use of the small punch test for mechanical characterization of co– based laser cladding joint. Eng. Fail. Anal. 2024, 159, 108129. [Google Scholar] [CrossRef]
  13. Depover, T.; Wan, D.; Wang, D.; Barnoush, A.; Verbeken, K. The effect of hydrogen on the crack initiation site of TRIP-assisted steels during in-situ hydrogen plasma micro-tensile testing: Leading to an improved ductility? Mater. Charact. 2020, 167, 110493. [Google Scholar] [CrossRef]
  14. Álvarez, G.; Arniella, V.; Belzunce, F.J.; Rodríguez, C. Study of the influence of current density and displacement rate on hydrogen embrittlement using small punch tests. Theor. Appl. Fract. Mech. 2023, 125, 103838. [Google Scholar] [CrossRef]
  15. Bae, K.O.; Shin, H.S.; Baek, U.B. Quantitative evaluation of hydrogen embrittlement susceptibility in various steels for energy use using an in-situ small punch test. Int. J. Hydrogen Energy 2021, 46, 20107–20118. [Google Scholar] [CrossRef]
  16. Arroyo, B.; Andrea, L.; Gutiérrez-Solana, F.; Álvarez, J.A. Time optimization of the step loading technique in hydrogen embrittlement small punch tests. Theor. Appl. Fract. Mech. 2022, 117, 103206. [Google Scholar] [CrossRef]
  17. Gussev, M.N.; Howard, R.H.; Terrani, K.A.; Field, K.G. Sub-size tensile specimen design for in-reactor irradiation and post-irradiation testing. Nucl. Eng. Des. 2017, 320, 298–308. [Google Scholar] [CrossRef]
  18. Wang, X.; Zhu, T.; Zhang, J.; Ding, H.; Xiao, S.; Lu, L.; Yang, B.; Yang, G.; Liu, Y. A review of selected small specimen test techniques for identifying deformation and failure properties of metallic materials. J. Mater. Sci. 2023, 58, 63–100. [Google Scholar] [CrossRef]
  19. Liu, H.; Chen, R.; Wen, M.; Zhang, L.; Shen, Y. Optimizing parallel section length for small tensile specimen with fabrication non-uniformity in thickness. Fusion Eng. Des. 2019, 147, 111244. [Google Scholar] [CrossRef]
  20. GB/T 29459-2012; Test Method for Small Punch Testing of Metallic Materials for in-Service Pressurized Equipment. China National Standardization Management Committee: Beijing, China, 2012.
  21. ASTM E3205-2020; Standard Test Method for Small Punch Testing of Metallic Materials. ASTM International: West Conshohocken, PA, USA, 2020.
  22. BS EN 10371-2021; Metallic Materials—Small Punch Test Method. British Standards Institution: London, UK, 2021.
  23. Cao, Y.; Ren, C.; Zu, Y.; Zhen, Y. Quantitative Characterization of Strength Properties of Girth Welded Joints Based on Small Punch Test. J. Mater. Eng. Perform. 2023, 1–12. [Google Scholar] [CrossRef]
  24. Bruchhausen, M.; Holmström, S.; Lapetite, J.M.; Ripplinger, S. On the determination of the ductile to brittle transition temperature from small punch tests on Grade 91 ferritic-martensitic steel. Int. J. Press. Vessel. Pip. 2017, 155, 27–34. [Google Scholar] [CrossRef]
  25. Álvarez, G.; Rodríguez, C.; Belzunce, F.J.; García, T.E. Use of notched small punch test specimens for the determination of fracture properties in structural steels. Theor. Appl. Fract. Mech. 2020, 106, 102442. [Google Scholar] [CrossRef]
  26. Lai, H.S.; Jiang, X. Determination of fracture toughness through small punch test of notched-tube specimen. Eng. Fract. Mech. 2023, 279, 109059. [Google Scholar] [CrossRef]
  27. Wen, C.; Xu, T.; Guan, K. Correlation factor study of small punch creep test and its life prediction. Materials 2016, 9, 796. [Google Scholar] [CrossRef]
  28. Peng, J.; Gao, M.; Zhang, H.; Geng, X.; Liu, X.; Pan, H. Small punch creep test reveals the differences of high-temperature creep behaviours for laser powder bed fusion and Rolled Inconel 718 alloys. Mater. Sci. Eng. A 2023, 886, 145698. [Google Scholar] [CrossRef]
  29. ASTM E8/E8M-15a; Standard Test Methods for Tension Testing of Metallic Materials. ASTM International: West Conshohocken, PA, USA, 2015.
  30. Gussev, M.; Busby, J.; Field, K.; Sokolov, M.; Gray, S. Role of scale factor during tensile testing of small specimens. In Small Specimen Test Techniques: 6th Volume; ASTM International: West Conshohocken, PA, USA, 2015. [Google Scholar]
  31. Zheng, P.; Chen, R.; Liu, H.; Chen, J.; Zhang, Z.; Liu, X.; Shen, Y. On the standards and practices for miniaturized tensile test—A review. Fusion Eng. Des. 2020, 161, 112006. [Google Scholar] [CrossRef]
  32. Gurson, A.L. Continuum theory of ductile rupture by void nucleation and growth: Part I—Yield criteria and flow rules for porous ductile media. J. Eng. Mater. Technol. 1977, 99, 2–15. [Google Scholar] [CrossRef]
  33. Tvergaard, V. Influence of voids on shear band instabilities under plane strain conditions. Int. J. Fract. 1981, 17, 389–407. [Google Scholar] [CrossRef]
  34. Peng, J.; Li, K.; Dai, Q.; Gao, G.; Zhang, Y.; Cao, W. Estimation of mechanical strength for pre-strained 316L austenitic stainless steel by small punch test. Vacuum 2019, 160, 37–53. [Google Scholar] [CrossRef]
  35. Shin, H.S.; Custodio, N.A.; Baek, U.B. Numerical analysis for characterizing hydrogen embrittlement behaviors induced in STS316L stainless steel using an in-situ small-punch test. Theor. Appl. Fract. Mech. 2021, 116, 103139. [Google Scholar] [CrossRef]
Figure 1. Optical microstructures of 316L steel: (a) 200 and (b) 500 magnifications.
Metals 14 01104 g001
Figure 2. Dimensions of (a) standard, (b) MUTT and (c) SPT specimens (unit: mm).
Metals 14 01104 g002
Figure 3. Diagrams of testing device: (a) MUTT and (b) SPT.
Metals 14 01104 g003
Figure 4. Three-dimensional finite element models and mesh details: (a) MUTT and (b) SPT.
Metals 14 01104 g004aMetals 14 01104 g004b
Figure 5. Obtained load–displacement testing curves: (a) SUTT, (b) MUTT and (c) SPT.
Metals 14 01104 g005aMetals 14 01104 g005b
Figure 6. (a) Schematic diagram of divided regions. (b) the European Union Standard method of extracting yield load of SPT.
Metals 14 01104 g006
Figure 7. (a1,a2) necking and dimple fracture morphologies of MUTT. (b1,b2) convex cap and dimple fracture morphologies of SPT.
Metals 14 01104 g007aMetals 14 01104 g007b
Figure 8. Diagram of engineering, true stress–strain and modeling input data.
Metals 14 01104 g008
Figure 9. Comparisons of experimental and numerical curves of (a) MUTT and (b) SPT.
Metals 14 01104 g009
Figure 10. Schematic diagram showing extraction path of (a) MUTT and (b) SPT.
Metals 14 01104 g010
Figure 11. Distributions of Mises stresses (Mises), equivalent plastic strains (PEEQ) and void volume fraction (VVF) along extraction path of MUTT and SPT at the yield stage (a1,b1,c1) and maximum stress position (a2,b2,c2).
Metals 14 01104 g011
Figure 12. Contour plots of Mises stresses (S) and equivalent plastic strains (PEEQ): (a) MUTT and (b) SPT.
Metals 14 01104 g012
Figure 13. Contour plots of void volume fraction (VVF): (a) MUTT and (b) SPT.
Metals 14 01104 g013
Figure 14. Load–displacement curves of uncharged and H-charged specimens: (a) MUTT and (b) SPT.
Metals 14 01104 g014
Figure 15. Hydrogen embrittlement index of MUTT and SPT based on the fracture energy variations after hydrogen charging.
Metals 14 01104 g015
Figure 16. Fracture surface of the hydrogen-charged MUTT specimen: (a) full-scale view and (b,c) local magnified fragments showing quasi-cleavage features.
Metals 14 01104 g016
Figure 17. Fracture surface of the hydrogen-charged SPT specimen: (a) full-scale view and (b,c) local magnified fragments showing quasi-cleavage features.
Metals 14 01104 g017
Figure 18. Obtained load–displacement curves of uncharged and hydrogen-charged specimens based on experiment and inverse modeling: (a) MUTT and (b) SPT.
Metals 14 01104 g018
Table 1. Chemical compositions of 316L stainless steel (wt. %).
CSiMnPSNiCrMoFe
0.020.421.630.0230.00212.1717.232.18Bal.
Table 2. The obtained material properties of SUTT, MTT and SPT.
Testing Type Yield   Load ,   F y (N) Maximum   Load ,   F m (N) Yield   Strength ,   σ y (MPa) Ultimate   Strength ,   σ b (MPa) Fracture   Load ,   F f (N) Fracture   Displacement ,   u f (mm)Fracture Energy
E S P   (N·mm)
SUTT4102.589889.90272.05578.027911.9221.31183,618.61
MUTT260.19534.12289.11593.46427.304.061883.66
SPT173.652179.06/ 1757.652.493179.80
Note: The data in the table are the averaged values, the fracture load is defined as 80% of the maximum load, the fracture displacement is the displacement corresponding to the fracture load, and the fracture energy is calculated by the integral computation, which is illustrated in Figure 6a.
Table 3. Determined GTN damage parameters in finite element models.
Parameters q 1 q 2 q 3 f 0 ε N s N f N f c f F
Values1.512.250.998950.30.10.00250.0250.1
Table 4. GTN damage parameters of uncharged and hydrogen-charged MUTT and SPT based on inverse finite element calculations.
Parameters q 1 q 2 q 3 f 0 ε N s N f N f c f F
Uncharged1.512.250.998950.30.10.00250.0250.1
H-charged MUTT1.512.250.998950.15 0.10.004 0.0055 0.1
H-charged SPT1.512.250.998950.2 0.10.00250.02 0.1
Note: the and respectively indicate a decrease and increase in the values compared to uncharged values.
Table 5. Hydrogen embrittlement index of MUTT based on the obtained elongation and area reduction from inverse modeling results.
UnchargedHydrogen-ChargedHEI (%)
Elongation, A (%)52.6338.9725.95
Area reduction, Z (%)62.9827.5456.27
Table 6. Hydrogen embrittlement index of SPT based on the obtained maximum displacement and thickness reduction from inverse modeling results.
UnchargedHydrogen-ChargedHEI (%)
Maximum displacement, u m , (mm)2.482.336.04
Thickness reduction, ROT (%)63.7559.826.16
Note: the HEI of thickness reduction is calculated by HEI = 1 R R T , where RRT is determined as 93.84%.
Disclaimer/Publisher’s Note: The statements, opinions and data contained in all publications are solely those of the individual author(s) and contributor(s) and not of MDPI and/or the editor(s). MDPI and/or the editor(s) disclaim responsibility for any injury to people or property resulting from any ideas, methods, instructions or products referred to in the content.

