Article

Microstructure and Characteristics of the Welded Joint between Ni-Cr Alloys and Copper

1
Chinese National Engineering Research Center for Petroleum and Natural Gas Tubular Goods, Xi’an 710018, China
2
CNPC Baoji Petroleum Steel Pipe Co., Ltd., Baoji 721008, China
3
Zhejiang Key Laboratory of Advanced Solid State Energy Storage Technology and Applications, Taizhou Institute of Zhejiang University, Taizhou 318000, China
4
State Key Laboratory of Advanced Processing and Recycling of Non-Ferrous Metals, Lanzhou University of Technology, Lanzhou 730050, China
*
Authors to whom correspondence should be addressed.
Metals 2024, 14(10), 1105; https://doi.org/10.3390/met14101105
Submission received: 23 August 2024 / Revised: 16 September 2024 / Accepted: 22 September 2024 / Published: 26 September 2024
(This article belongs to the Special Issue New Technology of Welding/Joining of Metallic Materials)

Abstract

:
In the field of petroleum extraction, the welding technology of the core wire (the hybrid structure of copper and the Ni-Cr alloy) in high-power oilfield heaters is a key process that determines the efficiency of the heater. Using the tungsten inert gas (TIG) welding method of filling pure copper wire, this work effectively joins the dissimilar metals of red copper and the Cr20Ni80 nickel–chromium alloy. The microstructure, mechanical properties, and conductivity of the joint were analyzed. The results showed that the surface of the welded dissimilar metal joint was smooth and uniform; radiographic nondestructive testing did not reveal any macroscopic forming defects such as pores or cracks. The microstructure of the joint fusion zone exhibits an equiaxed grain morphology. The interface between the copper and the fusion zone displays a columnar grain structure, growing perpendicular to the fusion line. An interdiffusion layer of elements was formed at the interface between the Ni-Cr alloy and the fusion zone. The microhardness of the joint shows a stepwise decreasing trend, with the highest hardness on the nickel–chromium alloy side, followed by the fusion zone, and the lowest on the copper side. The joint fractures at the copper base material, with a tensile strength greater than 220 MPa, indicating a ductile fracture mode. During the electrical heating process, the joint temperature does not significantly increase compared to the copper side, demonstrating good thermal stability.

1. Introduction

The core wire, as the key component of oil-layer-extraction electric heating technology, is mainly composed of a copper alloy and a nickel–chromium alloy [1]. The hybrid structure of the Cu-NiCr core wire uses copper as the conductive end material and the Ni-Cr alloy as the heating end material. The different parts (the copper and nickel–chromium alloys) of this core wire need to be welded. However, due to significant differences between dissimilar metals in terms of melting point, thermal conductivity, and other properties, the welding process faces great challenges [2,3,4,5]. Therefore, the reliability of dissimilar metal welding becomes extremely important in the connection of long-distance core wires.
To achieve high-quality welding between copper and other metals, researchers have conducted many studies on welding methods, welding metallurgy, and interface control. Using filler-wire arc brazing, Zhou et al. [6] achieved effective joining of aluminum and brass. The results indicated that the Al-12% Si flux-cored wire exhibited poor wettability on the brass base material surface, making it difficult to obtain high-quality brazed joints. The transition zone near the interface layer on the brass side contained a high aluminum content, and large strip-shaped Al-Cu intermetallic compounds (IMCs) formed at the interface, severely affecting the mechanical properties of the joint. Singla et al. [7] studied the effect of heat treatment on the mechanical properties of copper–stainless steel welded joints and found that the tensile strength and microhardness of the samples increased after heat treatment.
The brittle and hard intermetallic compounds (IMCs) might form at the interface of dissimilar metals, which significantly reduces the mechanical properties of the joint. It is essential to control the interfacial phases to obtain a high-quality dissimilar welded joint [8,9,10]. Zuo et al. reported that increasing the welding speed resulted in a reduction in both the thickness of the IMCs’ phase and the shear tensile strength of the joint. They also found that the presence of eutectic and hypoeutectic structures could lead to cracking in the joint [11]. In another study, Zhu et al. used a nanosecond-pulsed laser to weld aluminum to copper in an overlapping configuration. They examined how different laser scanning paths affected weld formation, microstructure, and bonding strength [12]. One challenge with laser welding is the concentration of the laser beam. In comparison, arc welding offers advantages over laser welding. The arc has a heat diameter that provides benefits such as lower welding heat input, higher connection reliability, and better on-site operability [13,14].
Cheng et al. [15] performed a new arc welding method, combined metal inert gas welding (MIG) and tungsten inert gas welding (TIG), and successfully obtained crack-free and pore-free joints. However, this MIG-TIG method might increase the welding cost and energy consumption. In addition, the use of ultrasound-assisted plasma arc brazing technology has also achieved the connection of dissimilar metals [16], obtaining well-formed lap joints. The addition of ultrasound significantly reduces the thickness of intermetallic compounds and increases the tensile strength of the joints [17]. On this basis, the technology of AC-assisted plasma arc fusion brazing [18], assisted by adding SiO2 nanopowder, was proposed from the perspective of process method and interface control, and dissimilar metal joints with good shape and mechanical properties were realized. Due to the high thermal conductivity and fast heat dissipation of copper, higher heat input was required in the welding process to reach the melting point of the base metal, which led to difficult welding operation and reduced the mechanical properties of the joints to varying degrees, and it was difficult to obtain high-quality welding joints [19]. In summary, researchers have continually explored the welding of copper with dissimilar metals (such as stainless steel, aluminum, and Ni-Cr alloys), conducting many studies on the connection methods, microstructure, and joint performance. The connection of copper with other metals has always been the focus of research and the difficulty therein [20,21].
According to the binary phase diagram, Ni and Cr have large solubility and can form a solid solution in a wide concentration range. Therefore, Ni and Cr can fully diffuse during the welding process to create an alloy phase with good mechanical properties [22]. Since the atomic number of Cu is close to that of Ni and the atomic radius and lattice constant are similar, both of them have a face-centered cubic (FCC) structure, which makes Ni and Cu completely miscible, and Ni atoms can easily diffuse into copper during welding [23]. However, Cr has a body-centered cubic (BCC) structure, and according to the Cu-Cr phase diagram, stable solid solutions or compounds rarely form between Cu and Cr [24]. During the welding process of copper and the Ni-Cr alloy, phase formation in the Ni-Cr-Cu system is limited by the solubility of the binary systems from the perspective of the ternary phase equilibrium. Due to the high miscibility of Ni and Cr, a Ni-Cr solid solution phase will form in the welded joint. At the interface between the Ni-Cr alloy and the fusion zone, a continuous Ni-Cu solid solution may form as Ni atoms diffuse. Meanwhile, due to the very low solubility of Cu and Cr, Cr-rich regions may appear at the interface between the copper and the Ni-Cr alloy joints.
In this study, the tungsten inert gas (TIG) welding method, involving filling pure copper wire, was used to effectively achieve the connection of dissimilar metals between the conductive end (the red copper) and the heating end (the Cr20Ni80 alloy) of the cable core wire in electric heating technology for oil field development. An interface microstructure analysis is carried out through an optical microscope, a scanning electron microscope, and other testing techniques to reveal the evolution of the microstructure at the dissimilar metal interface. X-ray diffraction technology is used to confirm the formation and transformation of new phases and mechanical performance testing is used to evaluate the strength, toughness, and elongation of the joint. The conductivity of the joint is also evaluated. The test results will provide an important reference and key technical support for the application of TIG welding in core wire welding construction sites and for the safe service of cables.

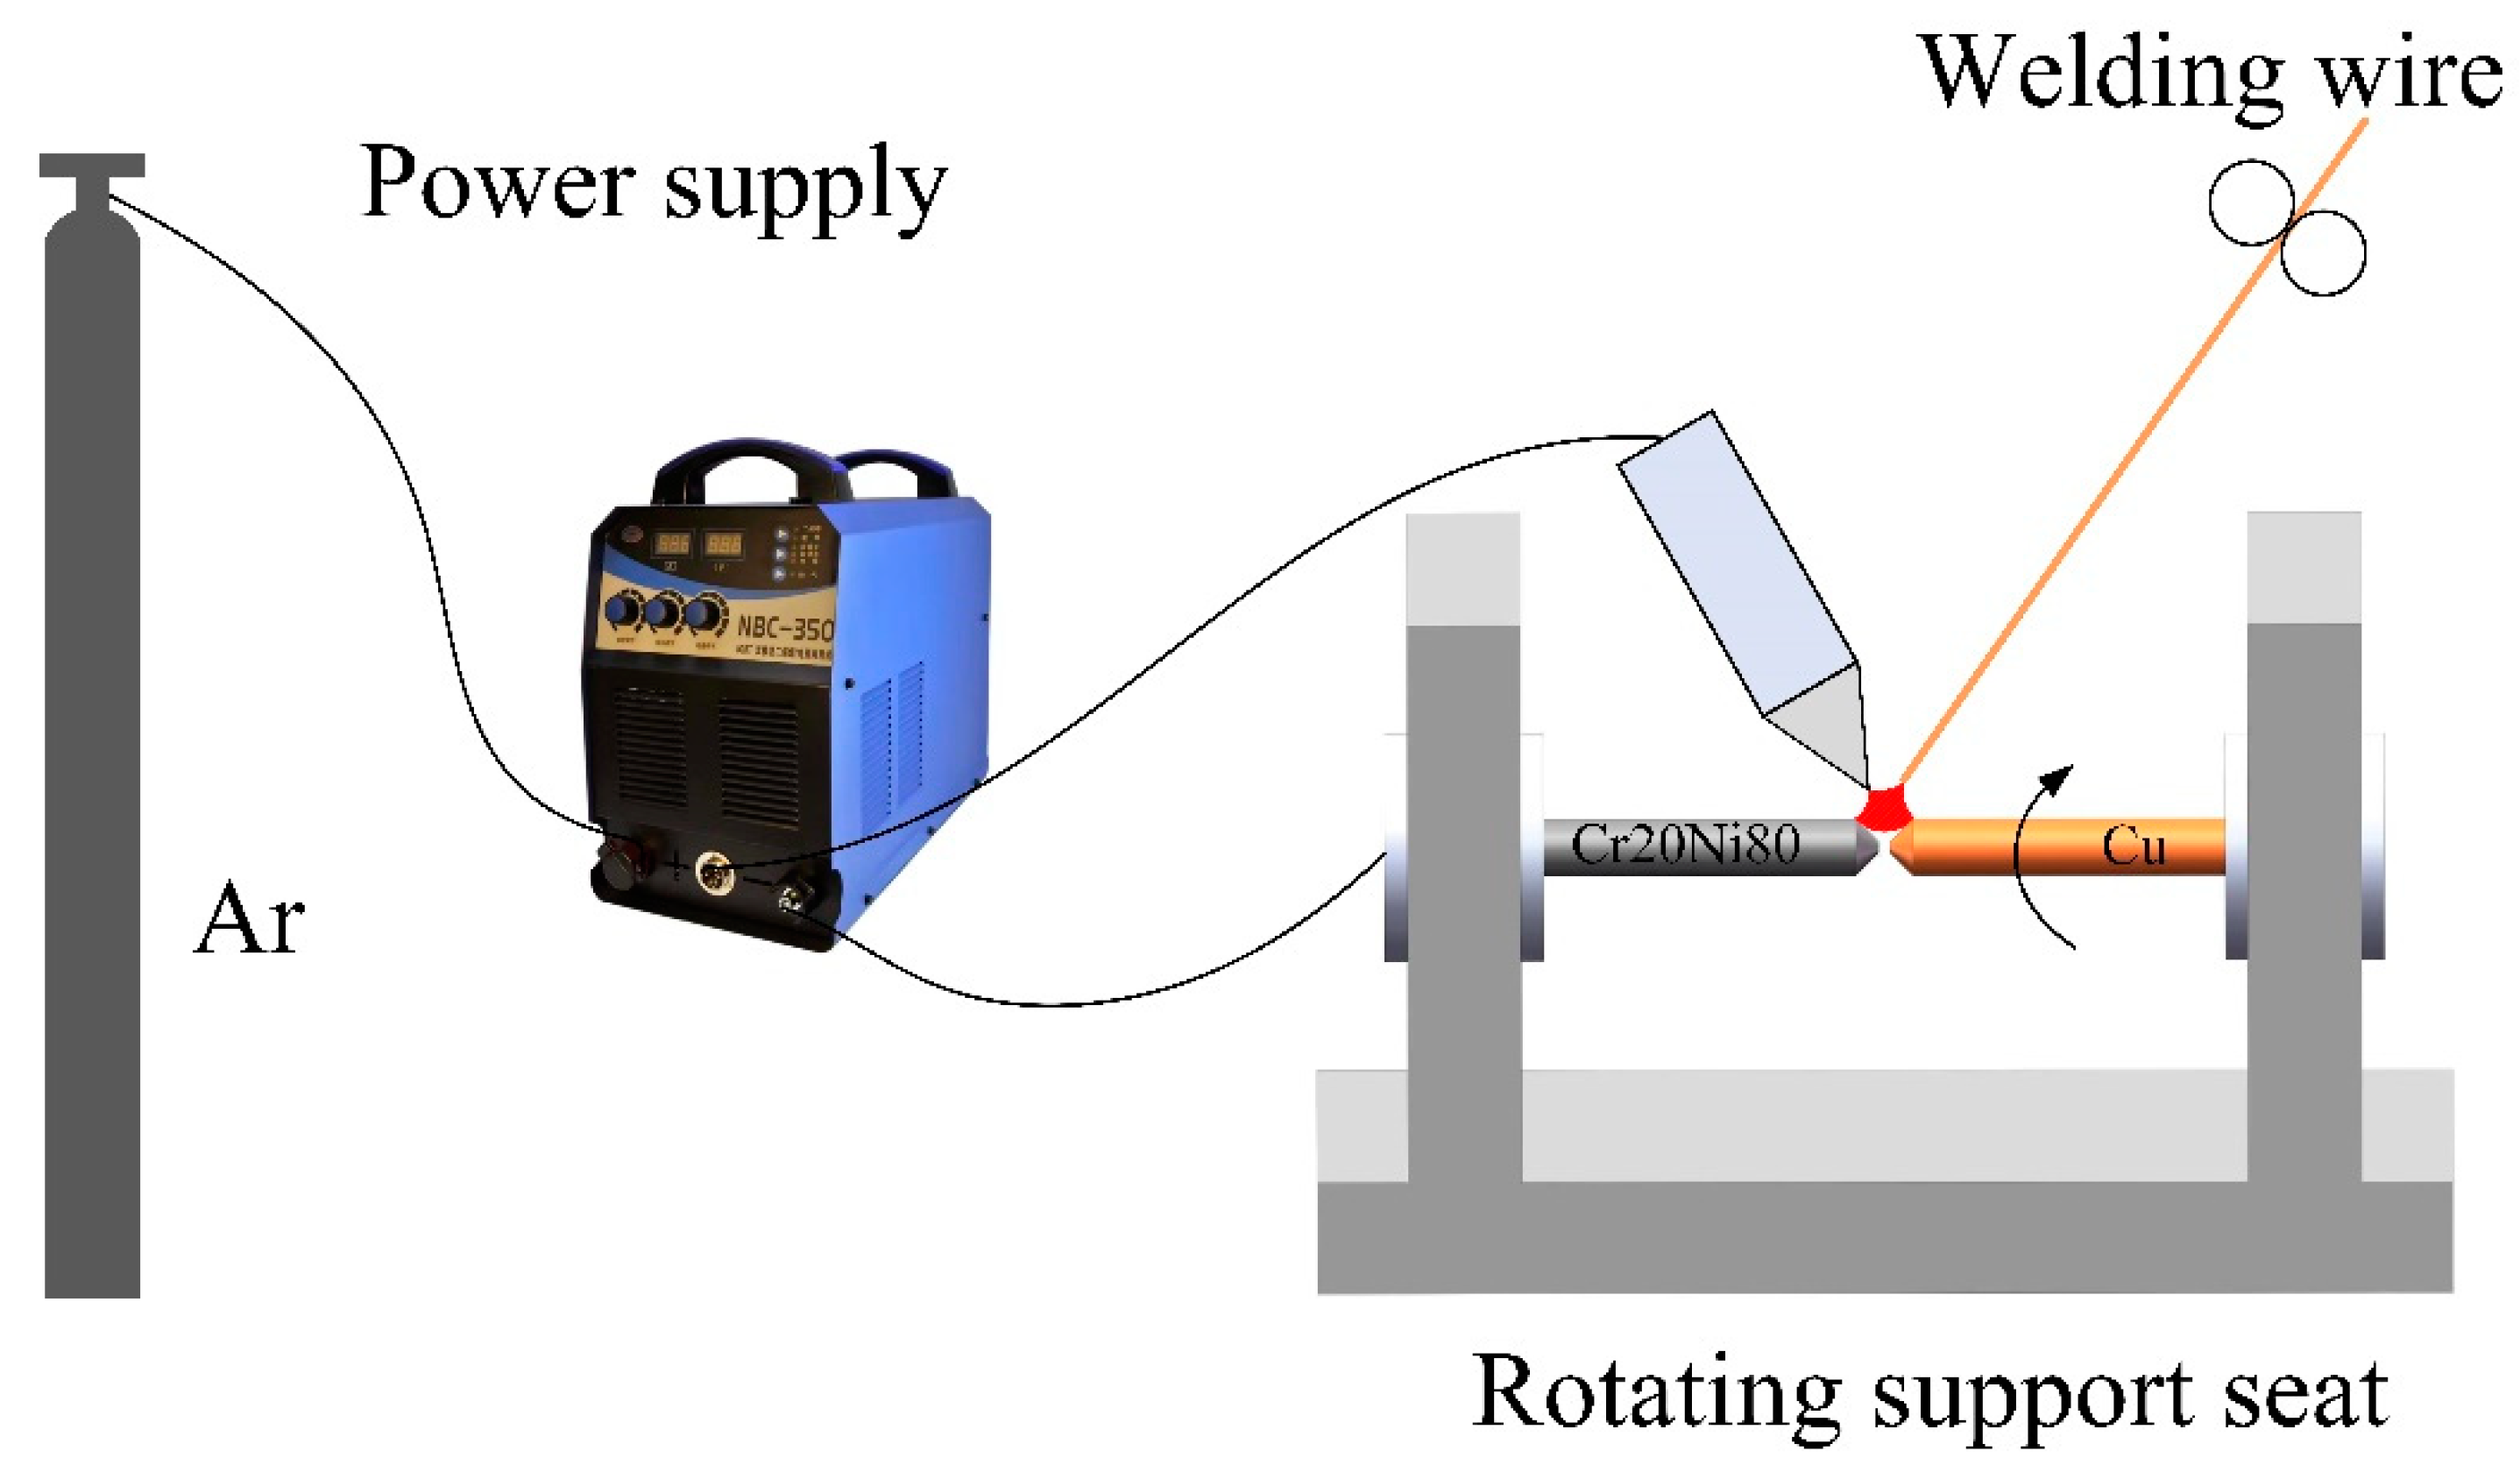
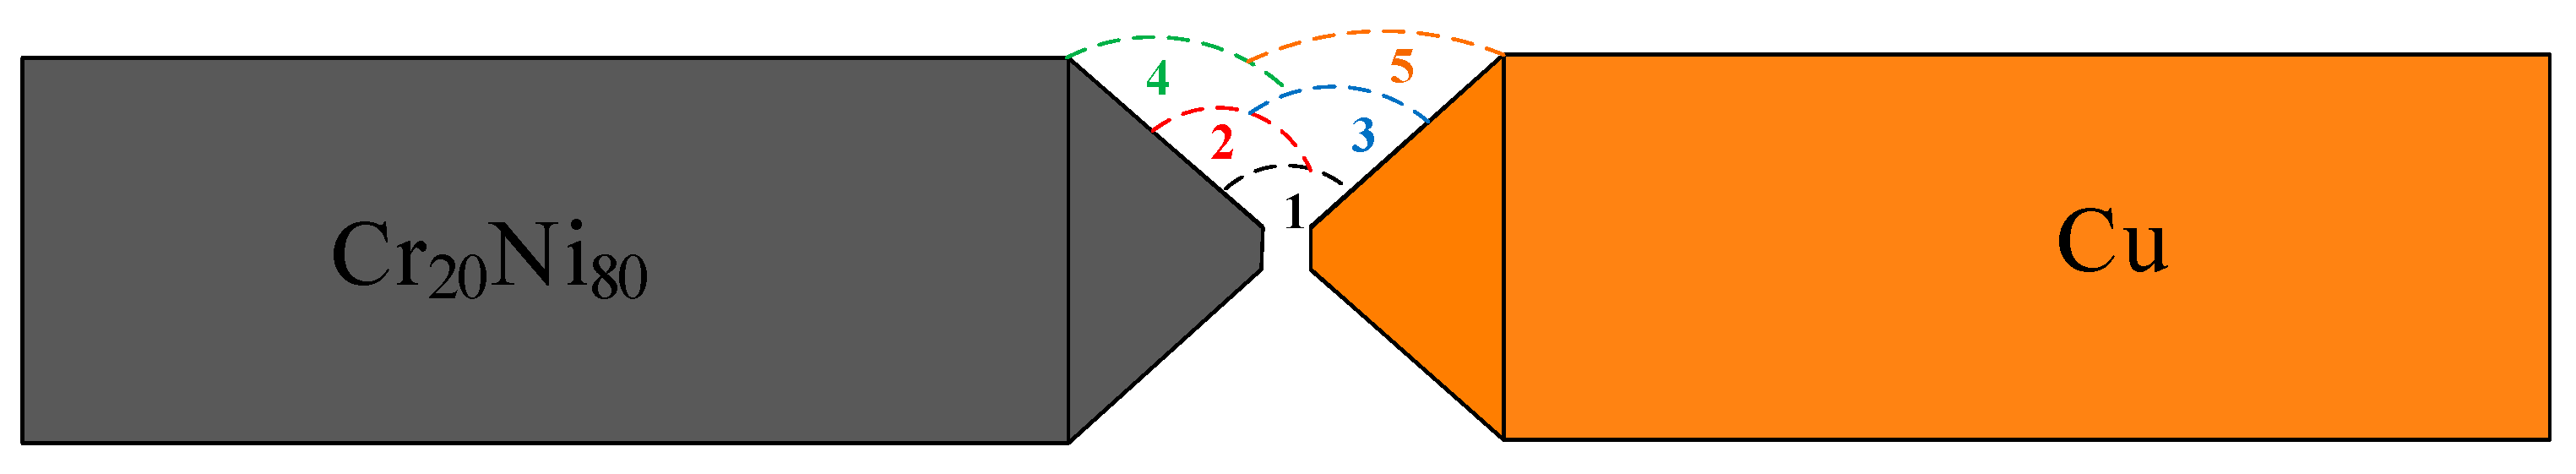
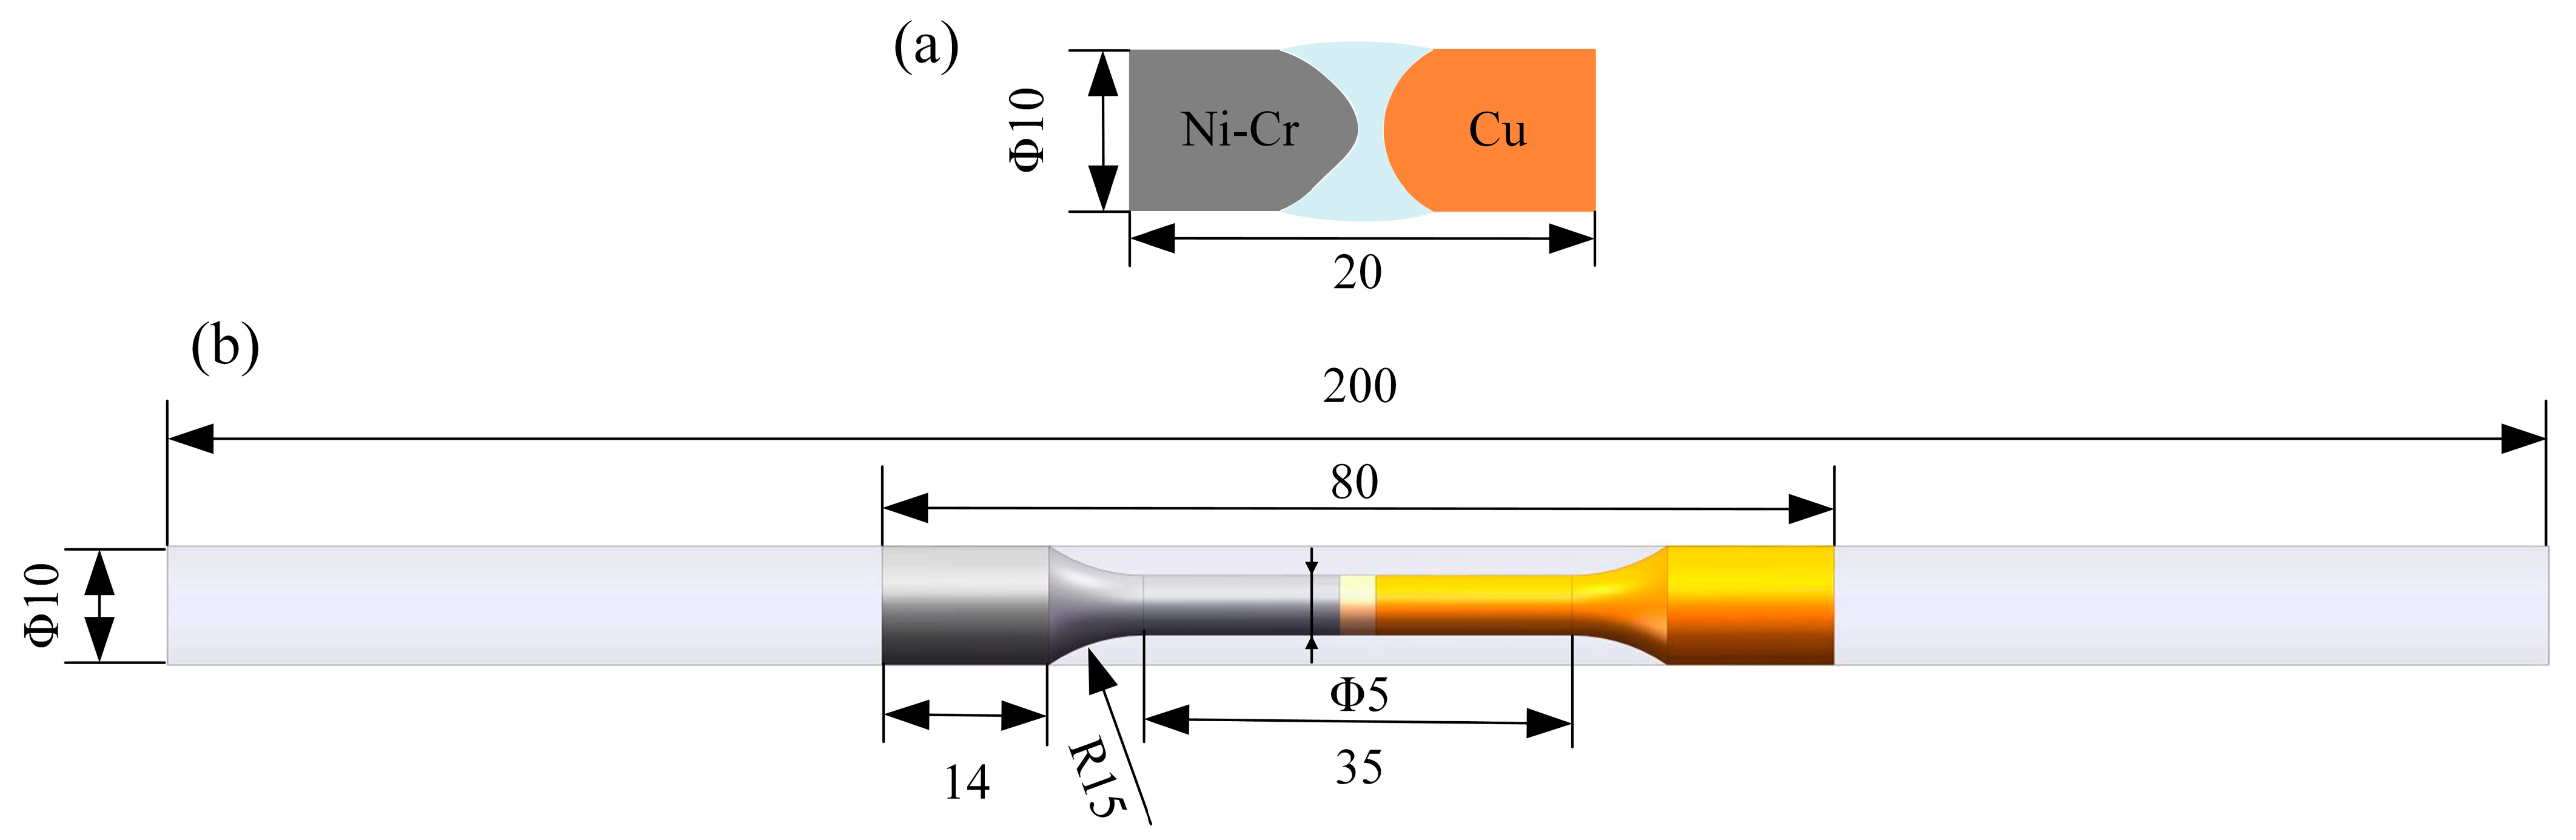
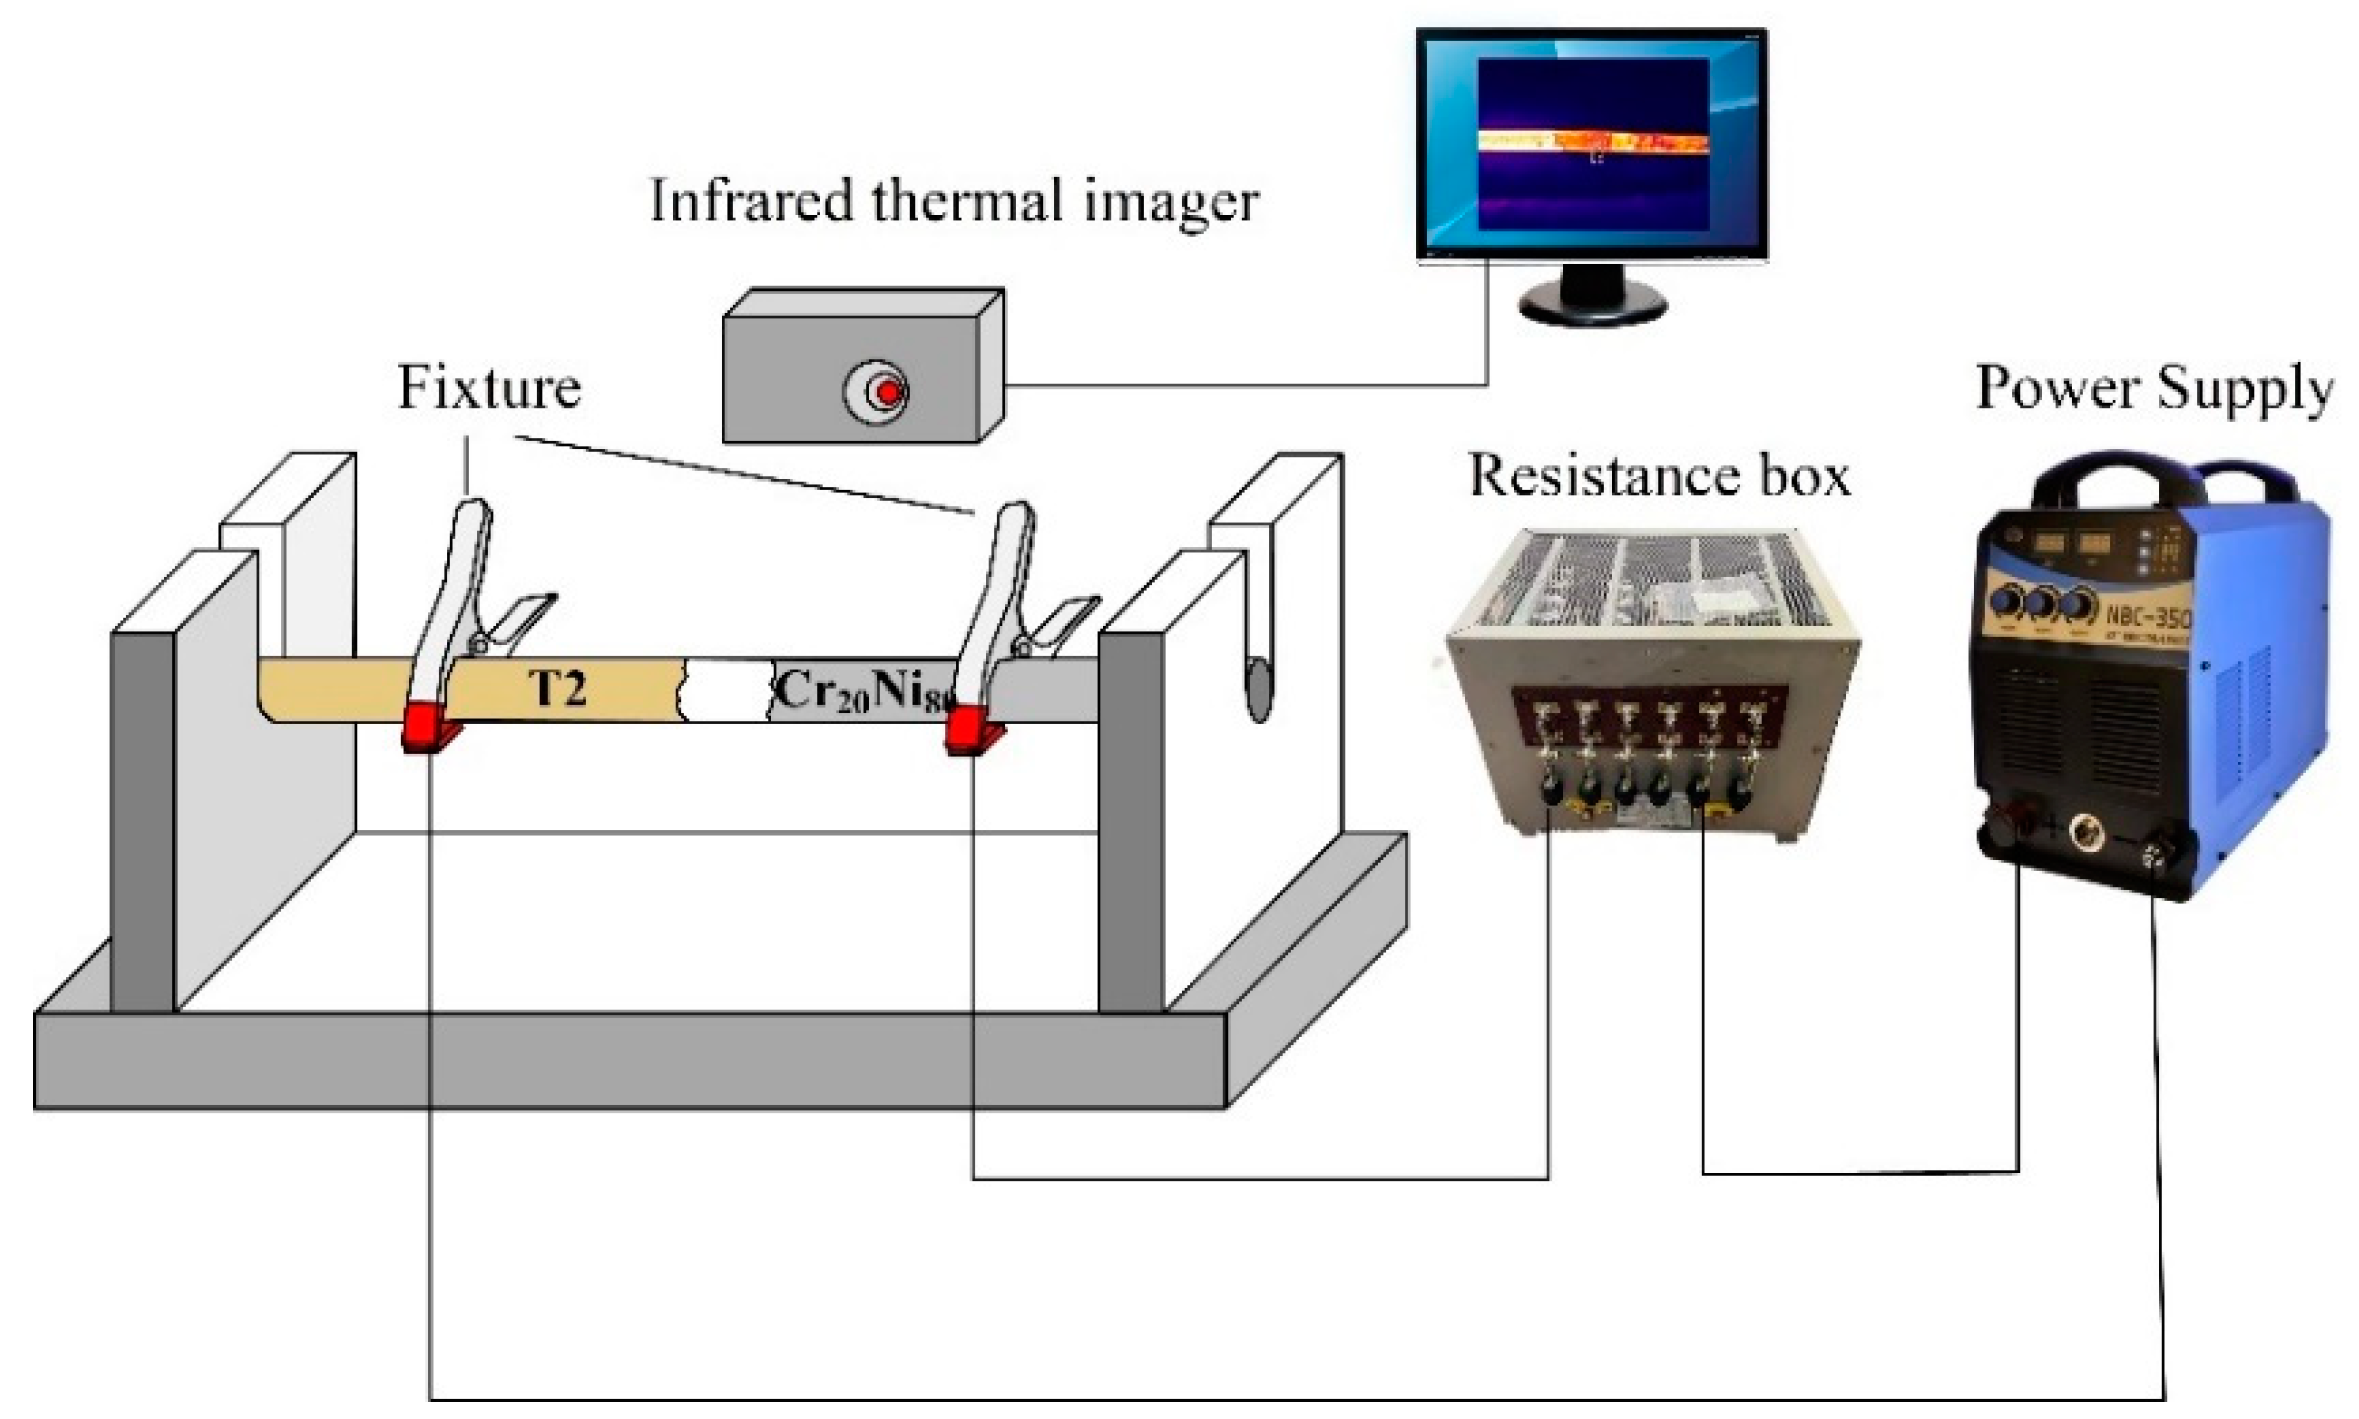
2. Materials and Experiment Details

In electric heating technology for oil reservoir exploitation, the core wire plays a key role in conducting electricity and generating heat. The heat produced by the core wire improves crude oil flow while reducing viscosity and resistance during transportation, as shown in Figure 1. This technology places the cable core into hollow oil pipes and uses them to enter the well, with a maximum heating depth of over 3000 m.
As shown in Figure 2, the tungsten inert gas (TIG) welding method is used to connect the conductive section and the heating section of the cable core. The materials used were red copper and nickel–chromium alloy round rods, both with a diameter of 10 mm and a length of 100 mm. During welding, a pure copper wire with a diameter of 2 mm, matching the chemical composition of red copper, is chosen as the filler material. The main chemical compositions of the copper and nickel–chromium alloys, as provided by the supplier, are listed in Table 1 and Table 2.
To avoid defects such as lack of fusion, an X-shape groove with a blunt edge was used, with a blunt edge of 1~2 mm and a reserved gap of 1~2 mm. Such an X-shape groove can reduce the amount of filler in the weld and minimize the deformation of the welded joint. The joint was filled using a multi-layer, multi-pass technique, as shown in Figure 3. The welding current was 130A and the shielding gas flow rate was 15 L/min. Through experiments to explore the welding process parameters of copper and the Ni-Cr alloy, the welding current was finally determined to be 130A and the shielding gas flow rate was 15 L/min.
The macroscopic forming of the Cr20Ni80 nickel–chromium alloy and the T2 copper filler wire TIG welding joint is shown in Figure 4. In Figure 4a, the welding joint is formed uniformly and smoothly, without forming defects such as undercutting and cracks. The partially melted nickel–chromium alloy base material, the copper base material, and the melted pure copper filler wire form the welding joint, and the overall cross-sectional morphology shows an “X” shape, as shown in Figure 4b.
The forming quality of welded joints was tested using the XXQ2005 X-ray flaw detector purchased from Red Star Instrument Factory in Dandong, China. The tube voltage was 130 kV, the tube current was 3 mA, and the exposure time was 1.5 min. The test results are shown in Figure 5. The internal structure of the joint area is continuous and uniform and no obvious defects such as pores, slag inclusions, cracks, or other discontinuities were found.
After welding, wire-cutting technology was used to prepare metallographic and tensile specimens from the center of the welded joint, as shown in Figure 6. The specimens were polished and etched using a solution composed of 10 g FeCl3, 6 mL HCl, 20 mL C2H5OH, and 80 mL H2O. Subsequently, the fusion zone and interface of the welded joint were analyzed for microstructure using a Zeiss AXIO Scope A1 optical microscope (OM) from the German company Carl Zeiss (Jena, Germany), an FEG-450 field emission scanning electron microscope (SEM), and an energy-dispersive spectrometer (EDS). Phase analysis was conducted using a D8 DISCOVER high-resolution X-ray diffractometer produced by Bruker, Berlin, Germany, combined with Jade 6.0 software, with a diffraction angle range of 20° to 110° and a scanning speed of 15°/min. To evaluate the mechanical properties of the welded joint, a VH1102 microhardness tester produced by Wilson Company (Fort Worth, TX, USA) of the United States was employed with a load of 200 g and a loading time of 15 s. Tensile strength tests were performed at room temperature using a WDW-100KN universal testing machine produced by Shandong Wanchen Testing Machine Co., Ltd. (Jinan, China) with a loading speed of 0.5 mm/min, and three tensile specimens were tested to ensure data accuracy and reliability. Nanoindentation tests were carried out using an Anton Paar nanoindenter produced by Graz, Austria, with a load of 1000 mN, and both loading and unloading rates set to 2000 mN/min.
The working condition of the core wire depends on its ability to withstand heat, so we designed a core wire heating test to simulate the temperature changes in the welded joint. The conductivity performance of the joints was tested using an electrified test system, as shown in Figure 7. A non-contact infrared thermometer was used to measure and collect the joint temperature. Two points were selected at the joint for temperature measurement, and the average value was calculated. Finally, the conductivity at different positions of the joint was measured using an RTS-II metal four-probe tester.

3. Experimental Results and Discussion

During the welding process of dissimilar metals, due to the rapid heating and cooling of the heat source, as well as the different melting points of the base metal, severe and complex metallurgical reactions could occur at the joint. In this section, the micromorphology, phase composition, element distribution, and mechanical properties of the samples were studied by OM, SEM, and XRD. The electrical and mechanical properties of the joint are also studied.

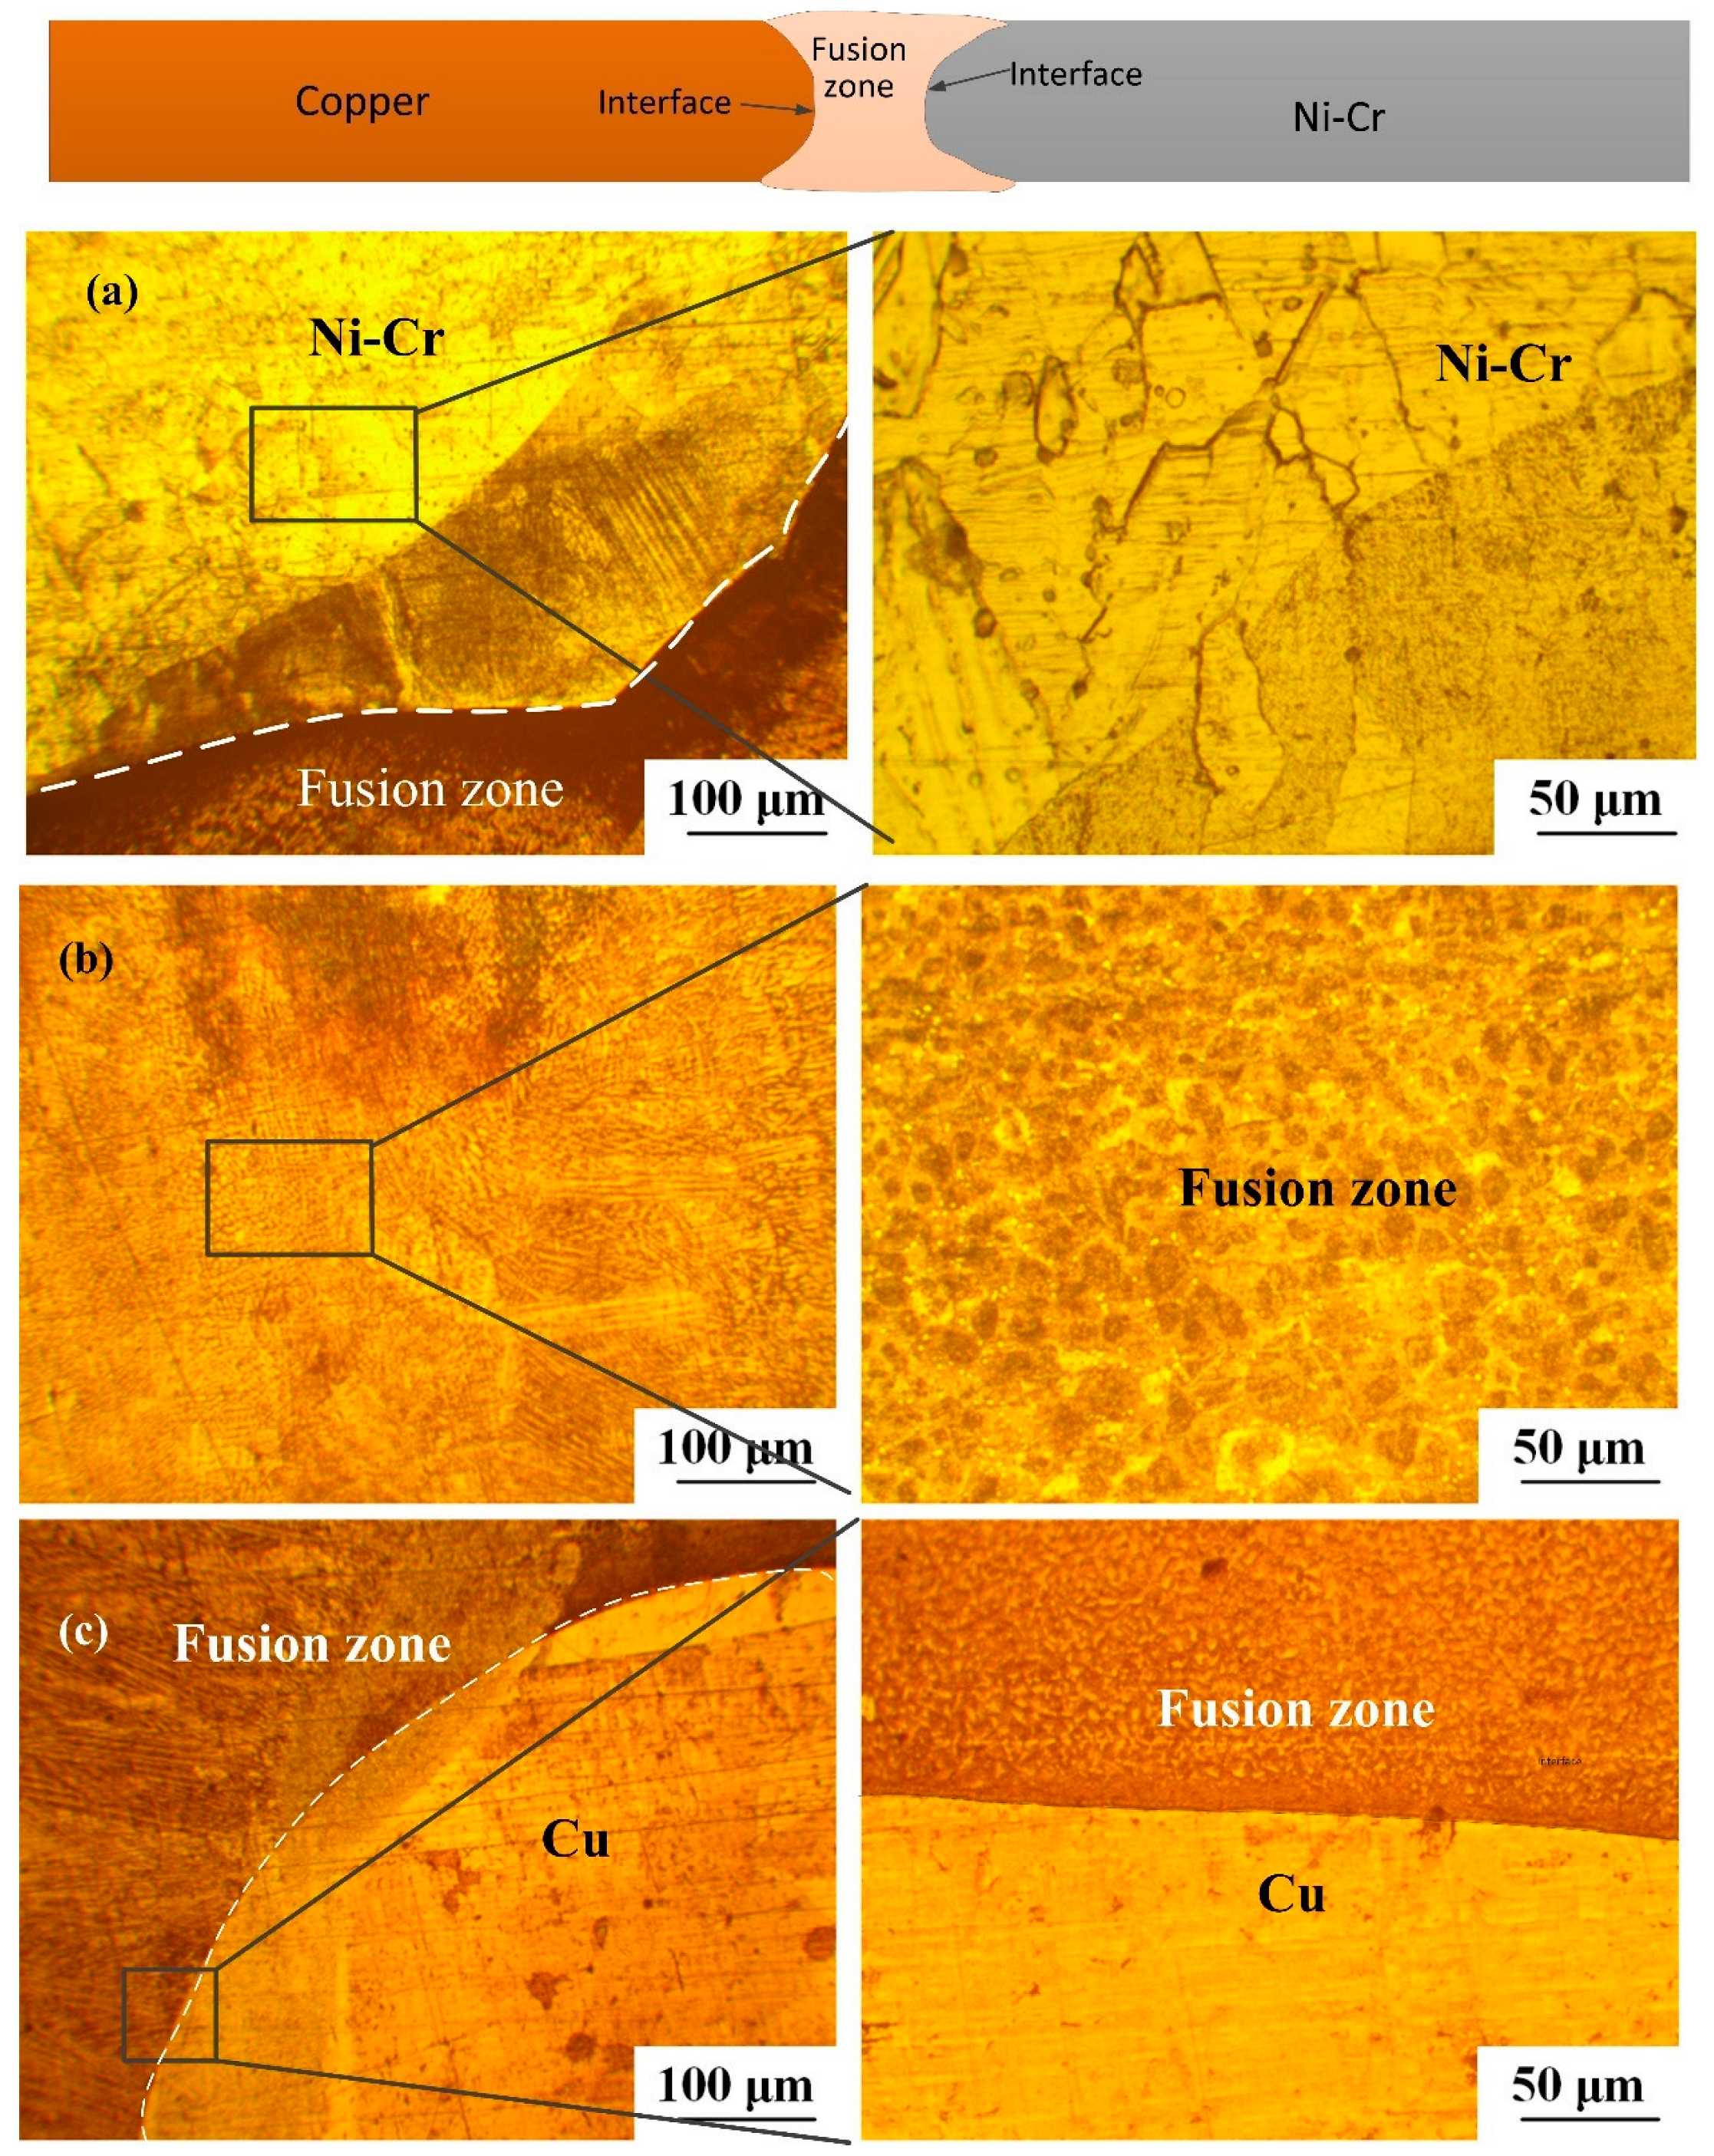
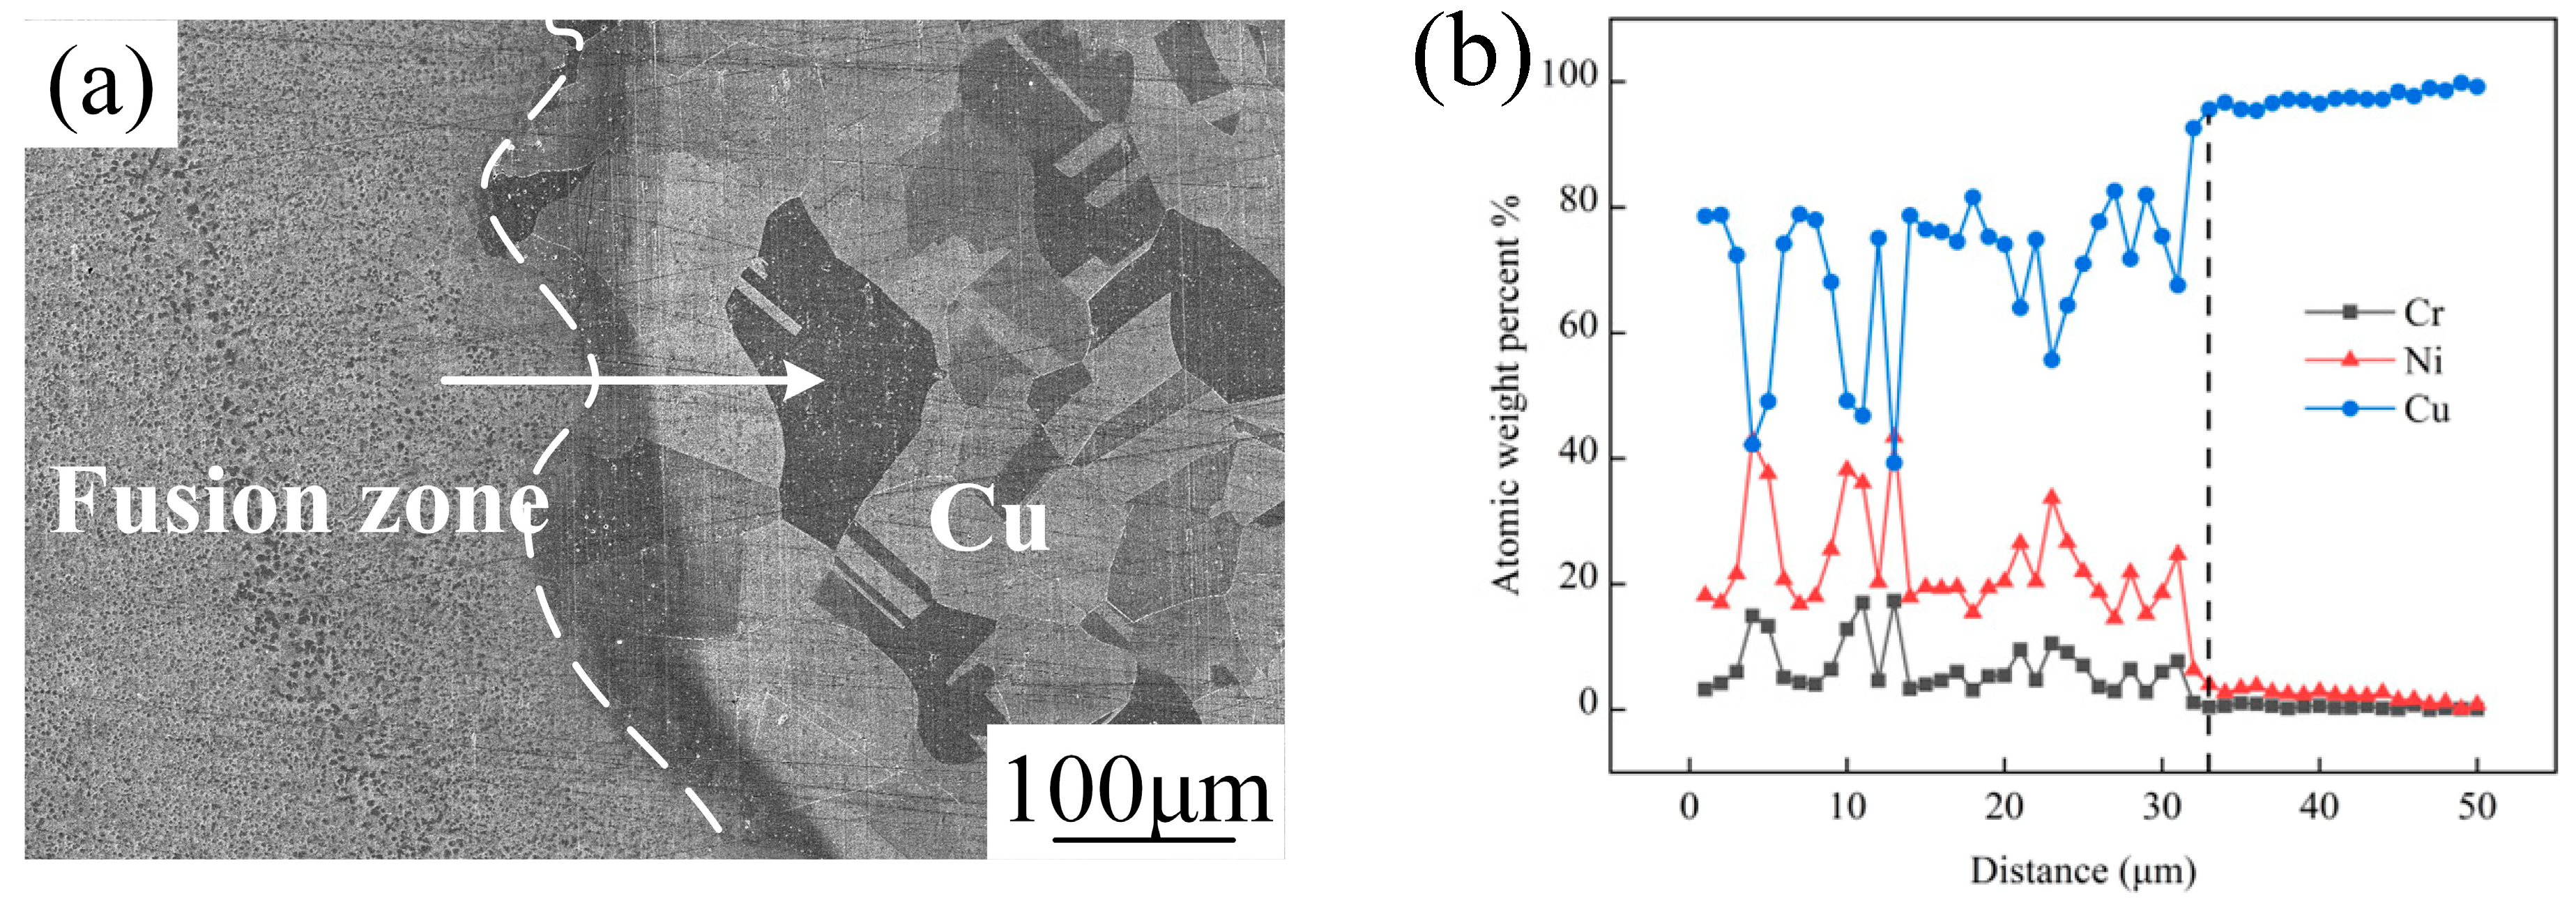
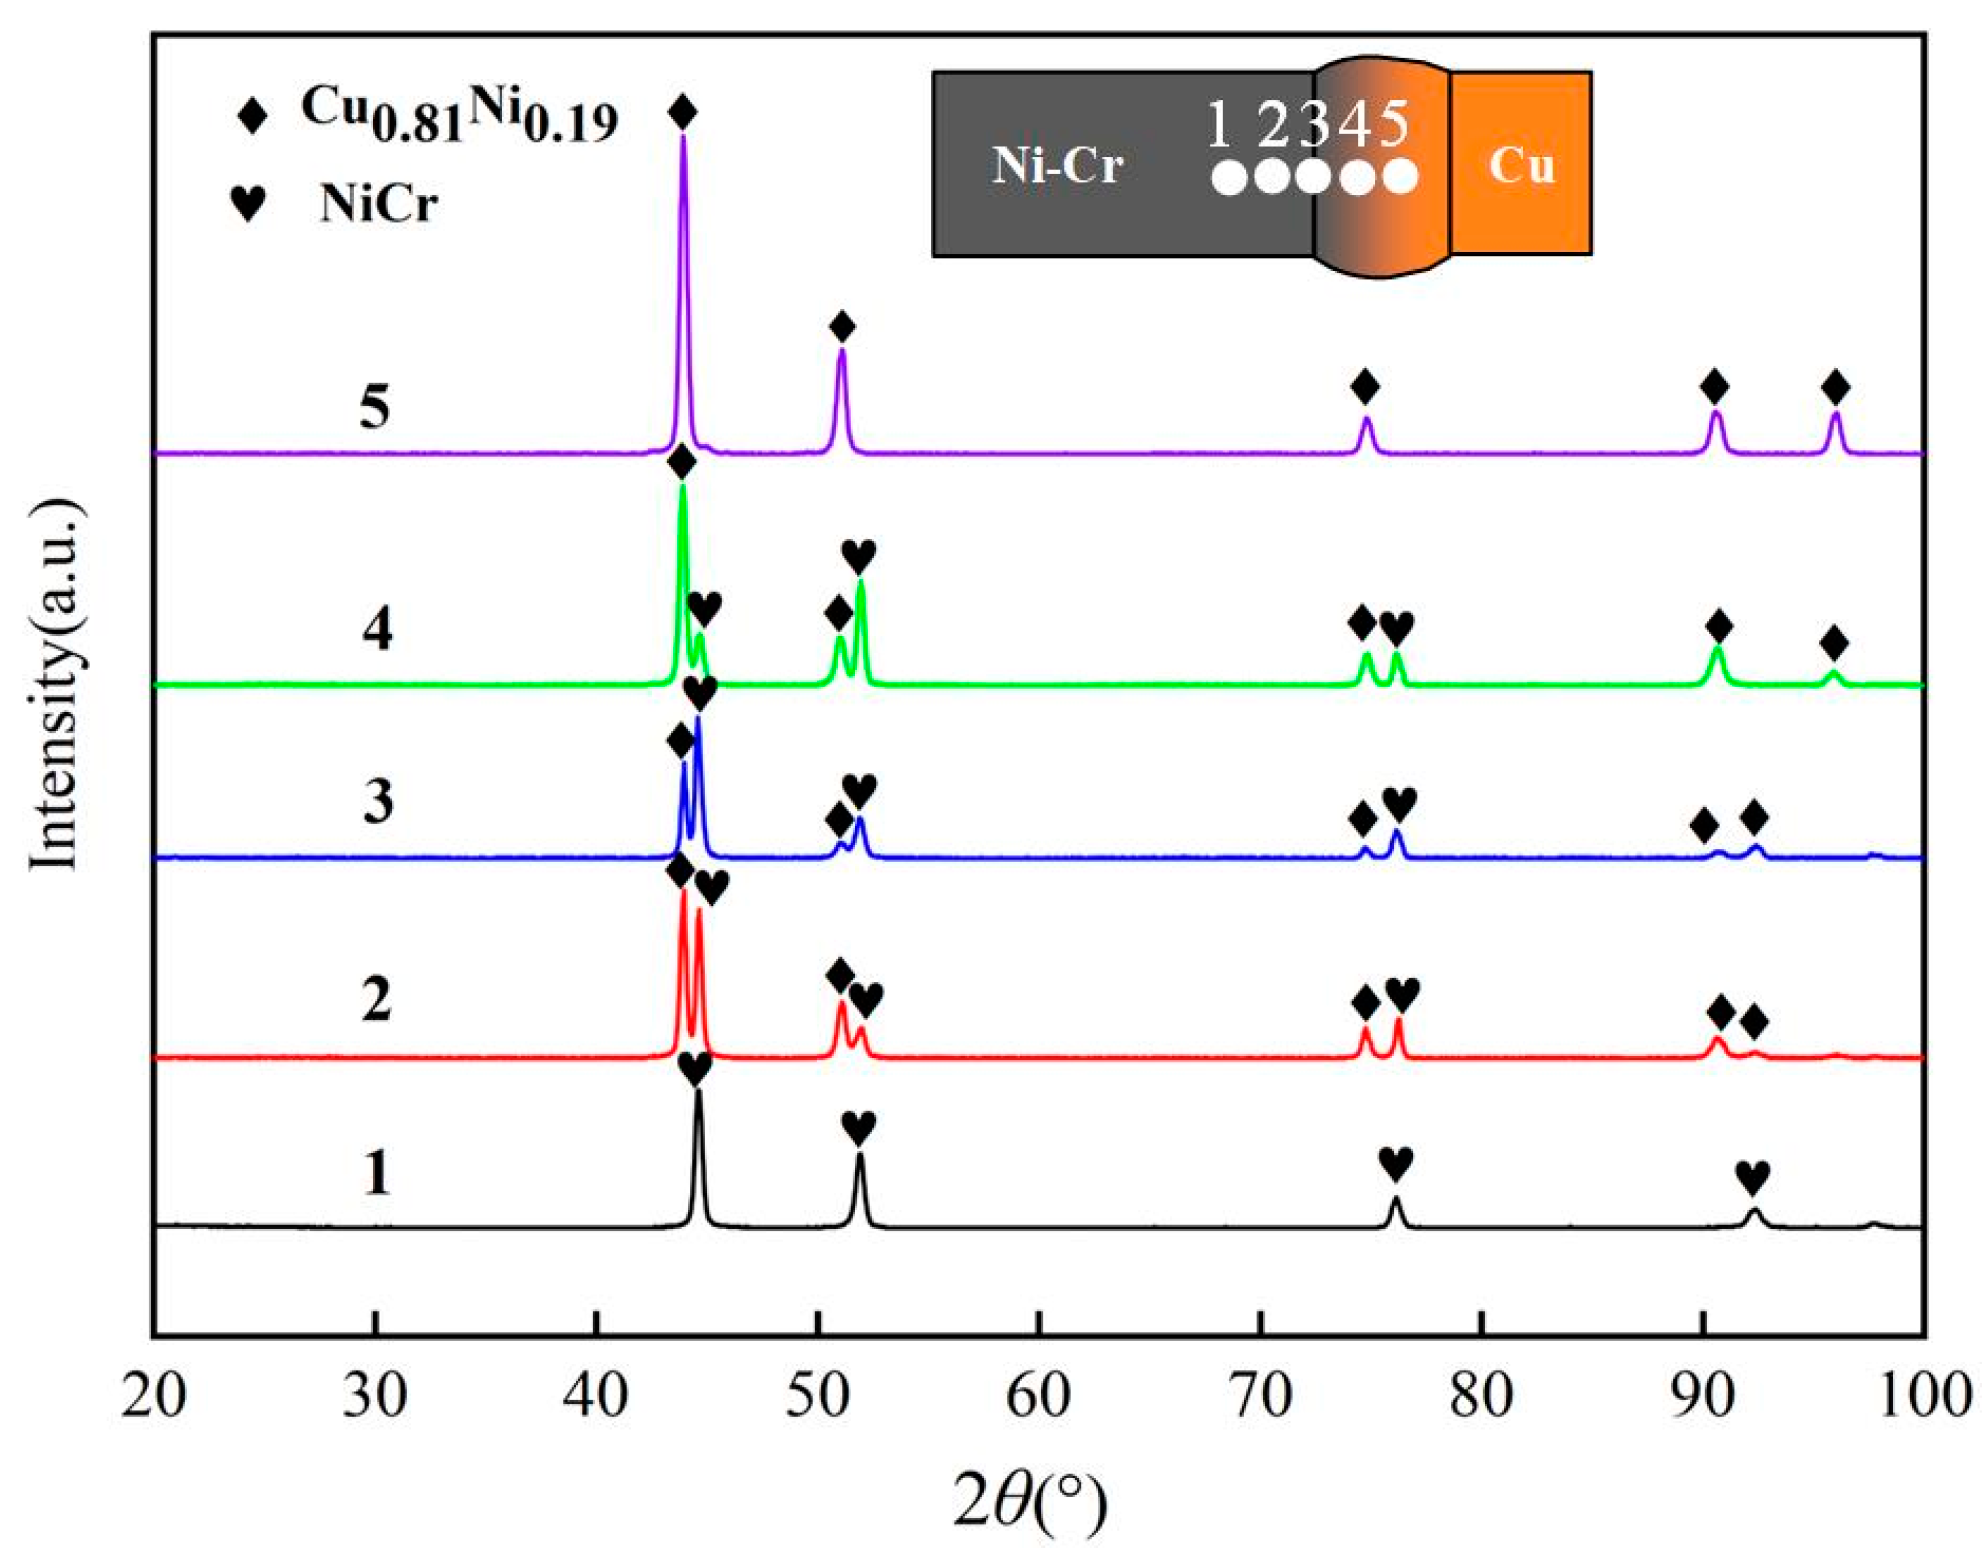
3.1. Microstructure and Phase Composition

The microstructure of the copper side, the nickel–chromium alloy side, and the fusion zone are shown in Figure 8. The welded joint can be divided into four regions: copper, the interface between Cu and the fusion zone, the fusion zone, and the interface between the fusion zone and the Ni-Cr alloy. The microstructure at different regions was observed by the OM. The microstructure of the nickel–chromium alloy side is mainly composed of austenite, with columnar crystals as the main morphology, accompanied by a small amount of equiaxed crystals. The microstructure of the fusion zone is all alpha-phase, as shown in Figure 8b, with columnar crystals perpendicular to the fusion line and equiaxed crystals at the center. The average size of the isaemic crystals measured by Image-J 2.14 software is 11.8 μm. During the welding process, the heat of the molten pool diffuses outwards from the fusion line and the direction of heat flow is perpendicular to the fusion line, resulting in the formation of columnar crystals perpendicular to the fusion line in the region. In the center of the fusion zone, the heat loss is more uniform, the region is relatively far from the fusion line, and the influence of heat diffusion from the fusion line is less, so the grains grow in multiple directions at the same time and finally form equiaxed crystals. The base material on the copper side is mainly composed of small equiaxed crystals, which is consistent with the results in references [25,26].
To test the diffusion behavior of alloy elements at the interface, EDS line scanning and map analysis were performed across the interface. The element distribution at the interface between the copper side and the fusion zone is shown in Figure 9. Small amounts of Cr and Ni diffuse to the copper side in the fusion zone and the Cu element distribution in the fusion zone is uniform without segregation or enrichment.
The elements at the interface between the nickel–chromium side and the fusion zone are shown in Figure 10. The Cr and Ni elements diffuse to the fusion zone and are uniformly distributed on the nickel–chromium alloy side, with a small amount of Cu element also present at the interface.
The line scan results at the interface between the copper side and the fusion zone are shown in Figure 11. Pure copper is selected as the filling material, and the main element in the fusion zone is Cu, accompanied by a small amount of Cr and Ni. The content of Cr and Ni decreases sharply as they approach the interface, while the content of the Cu element gradually stabilizes. The thickness of the copper-side interface is about 25 μm. At 3, 10, 12, and 23 µm from the starting point, the copper content decreased significantly, while the nickel and chromium content increased correspondingly. This is mainly due to the diffusion of elements such as nickel and chromium from the nickel–chromium alloy side to the copper side during welding. According to the Ni-Cr-Cu ternary phase diagram, nickel, chromium, and copper may form nickel- or chromium-rich solid solutions during welding, leading to higher nickel and chromium content in certain areas and a corresponding reduction in local copper content.
The line scan results at the interface between the nickel–chromium side and the fusion zone are shown in Figure 12. As the interface approaches, the Cr and Ni contents gradually decrease while the Cu content sharply increases. A diffusion zone was formed by the Cr, Ni, and Cu elements with a thickness of 20 μm.
The X-ray diffraction pattern of the Cr20Ni80 nickel–chromium side and fusion zone interface is shown in Figure 13. The main phases at the interface are Cu0.81Ni0.19 and NiCr and the main phase in the fusion zone is Cu0.81Ni0.19.
As shown in Figure 14, the phase of the fusion zone is mainly Cu0.81Ni0.19, with Cu as the main component on the copper side. Overall, NiCr is the main component on the nickel–chromium alloy side and the fusion zone is mainly composed of Cu0.81Ni0.19.

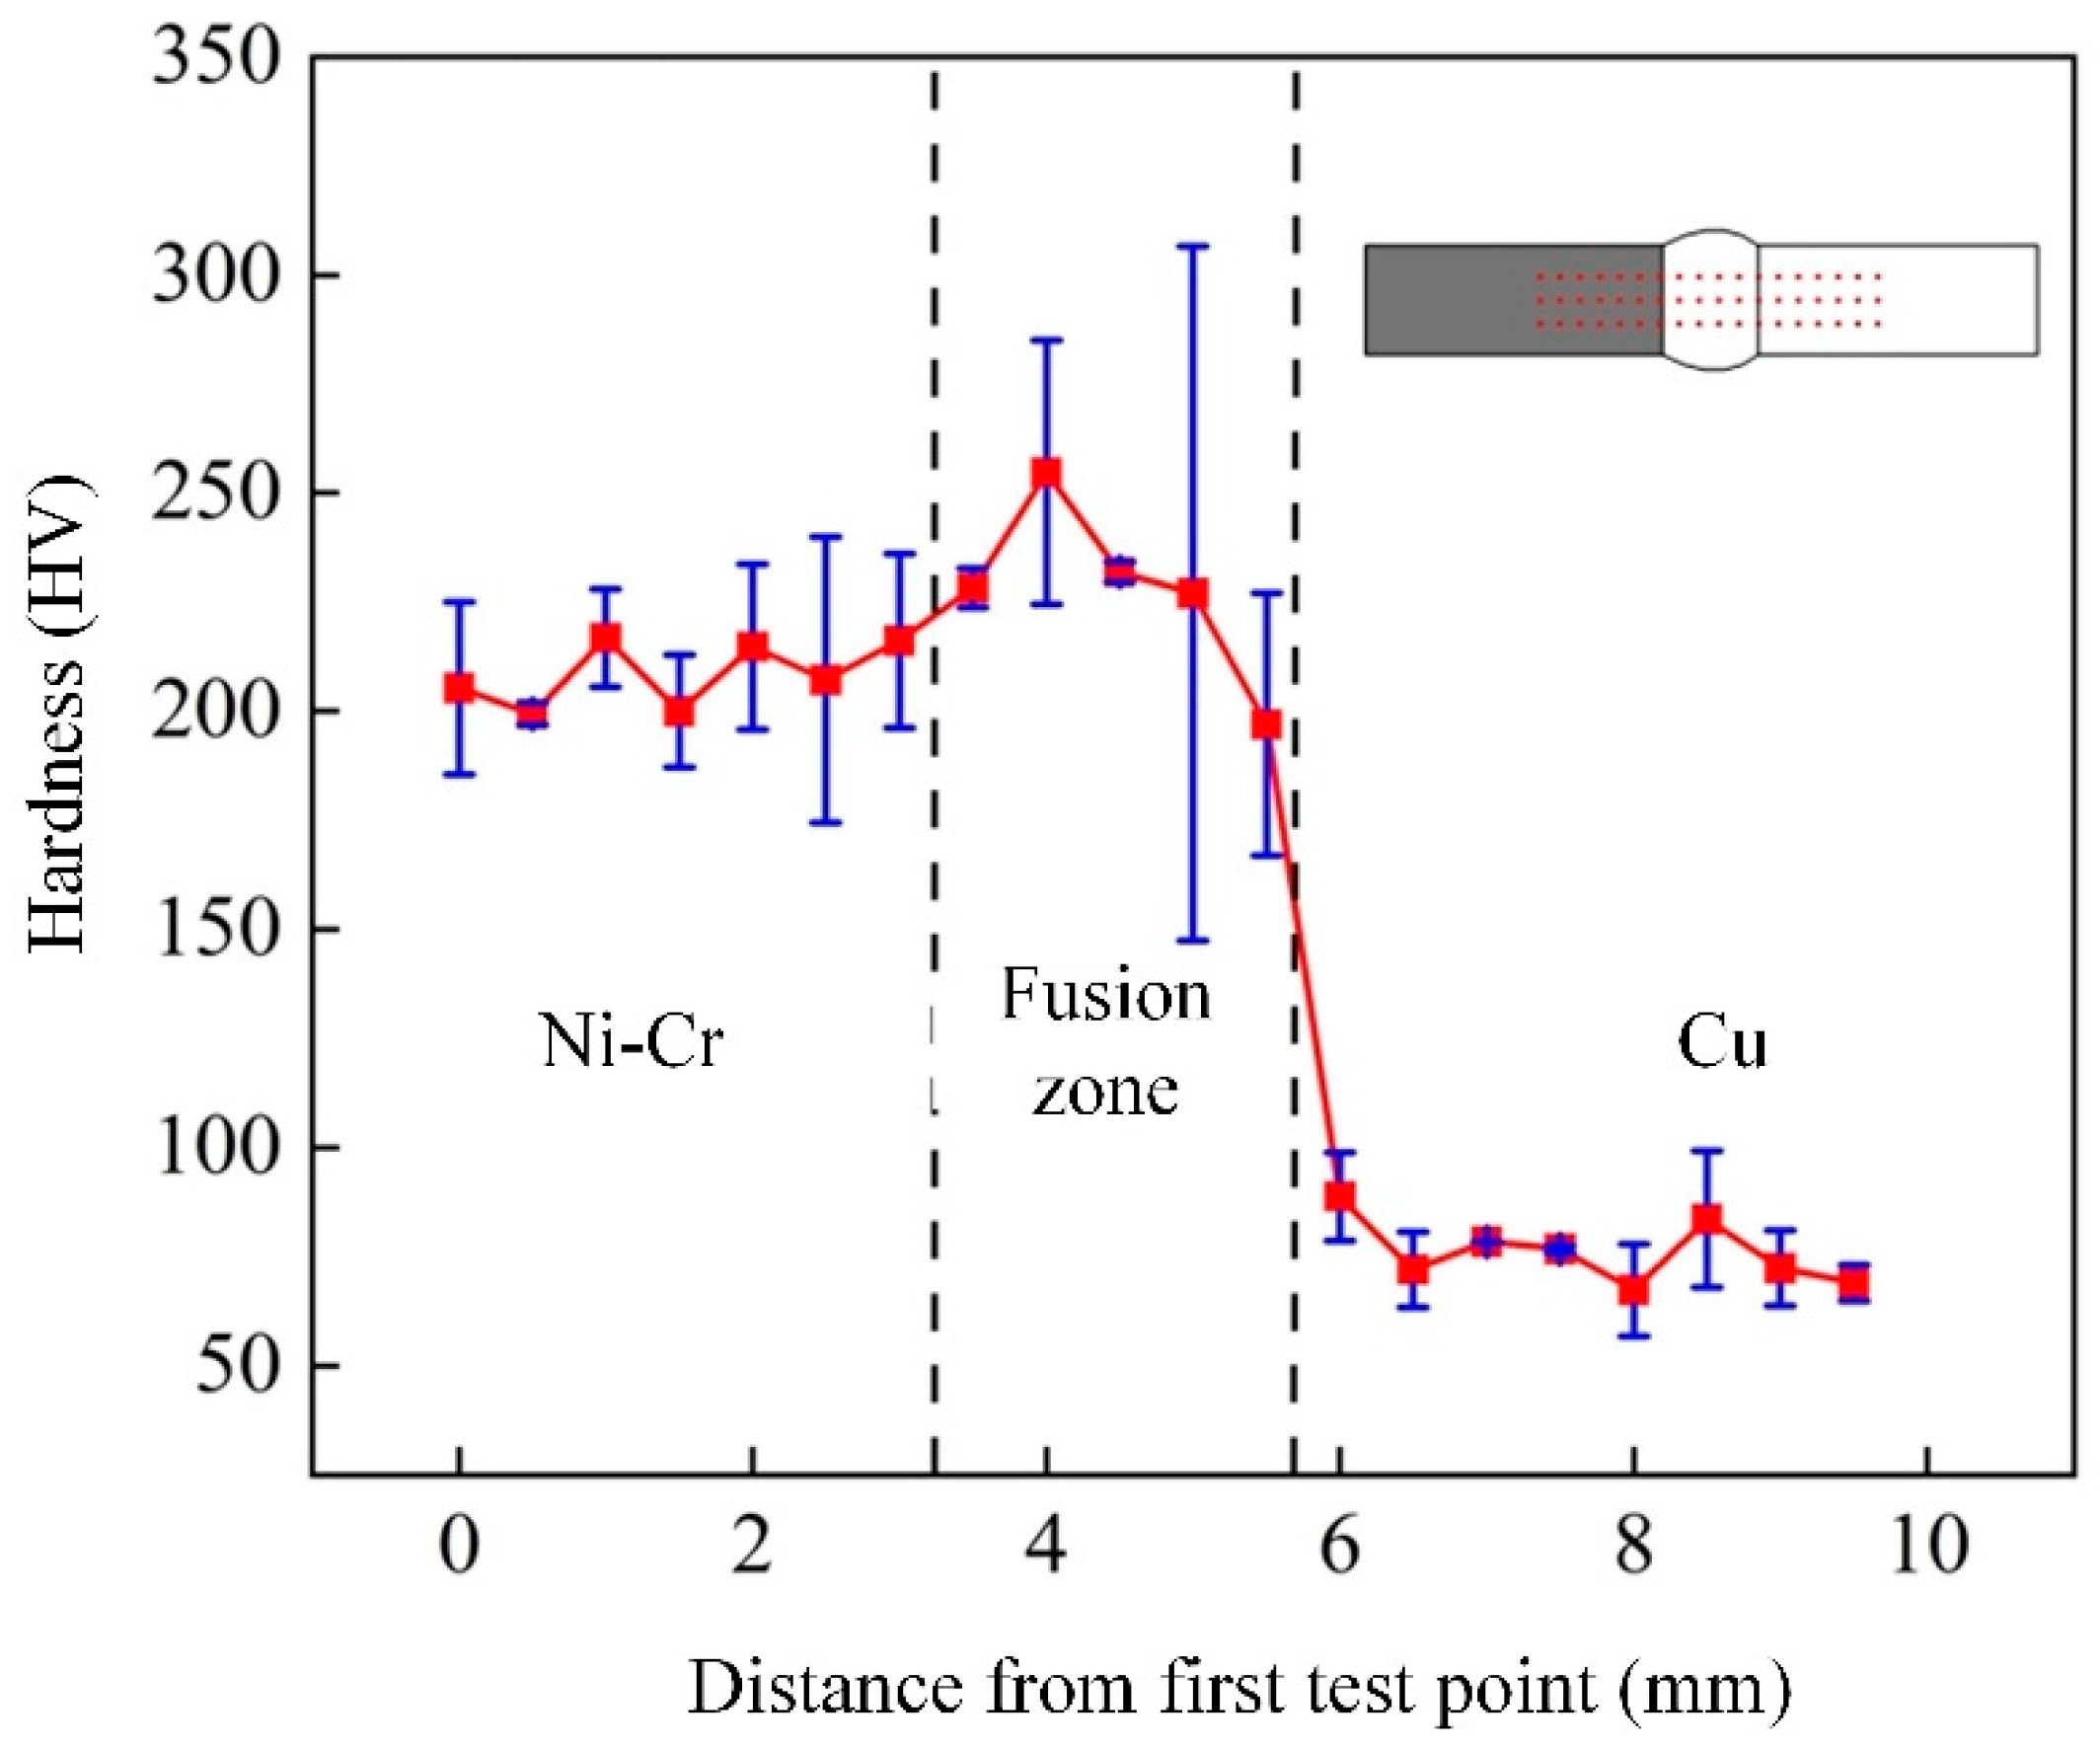
3.2. Mechanical Properties

To verify the strength and welding reliability of the joint, microhardness tests were performed on the dissimilar metal welding joints. The microhardness distribution of the joint is shown in Figure 15. The hardness of the nickel–chromium side was about 200–220 HV, the fusion zone was about 190–260 HV, and the copper side was about 60–90 HV. During the welding process, due to rapid cooling, especially on the nickel–chromium alloy side, the heat conduction is fast, which may lead to grain refinement, thereby improving the hardness of the fusion zone. At the same time, XRD results show two solid solutions in the fusion zone near the nickel–chromium alloy side. These solid solutions cause lattice distortion and hinder the movement of dislocations, thereby further improving the hardness of the material, ultimately leading to a slight increase in microhardness [23,27].
To obtain a deeper understanding of what occurred near the interface, the nanoindentation methods were applied at different areas on both sides. Figure 16 shows the typical loading–unloading curves of different regions of the interface on both sides. Figure 16a shows the loading–penetration depth curve at the interface between the Ni-Cr alloy and the fusion zone. The penetration depth of the diffusion layer is significantly smaller than that of the Ni-Cr side but greater than that of the copper. The lower penetration depth at the diffusion layer indicates that its deformation resistance is higher than copper and a strong connection is achieved at the interface. In other words, the interface between the Ni-Cr and the copper is well metallurgically bonded during welding. Similarly, solid solution strengthening might occur, leading to a higher hardness than that of copper [28].
The hardness and elastic modulus values of different regions of the joint were obtained using the Oliver Pharr method [29], as shown in Table 3. The hardness and elastic modulus measured of the nickel–chromium alloy were the highest, at 2232.5 MPa and 266.39 GPa, respectively. It is worth noting that the decreasing trend of the elastic model in different regions of the joint is as follows: nickel–chromium > fusion zone > copper. The hardness change trend in different regions is as follows: Hcopper < Hfusion zone < Hnickel–chromium.
The stress–strain curve of the specimen after being pulled apart is shown in Figure 17. In tensile tests, the applied stress is usually concentrated at the weakest point. As shown in Figure 17a, all joints broke on one side of the base material, and a distinct “necking” pattern was observed. The results show that when the welded joint is subjected to the same stress as the base material, no fracture occurs at the joint, so the connection strength of the joint is greater than that of the copper base material and a strong metallurgical connection is formed between the alloy and copper. The maximum tensile strength of all joints exceeds 200 MPa and the elongation is about 25%, showing ductile fracture, as shown in Figure 17b.

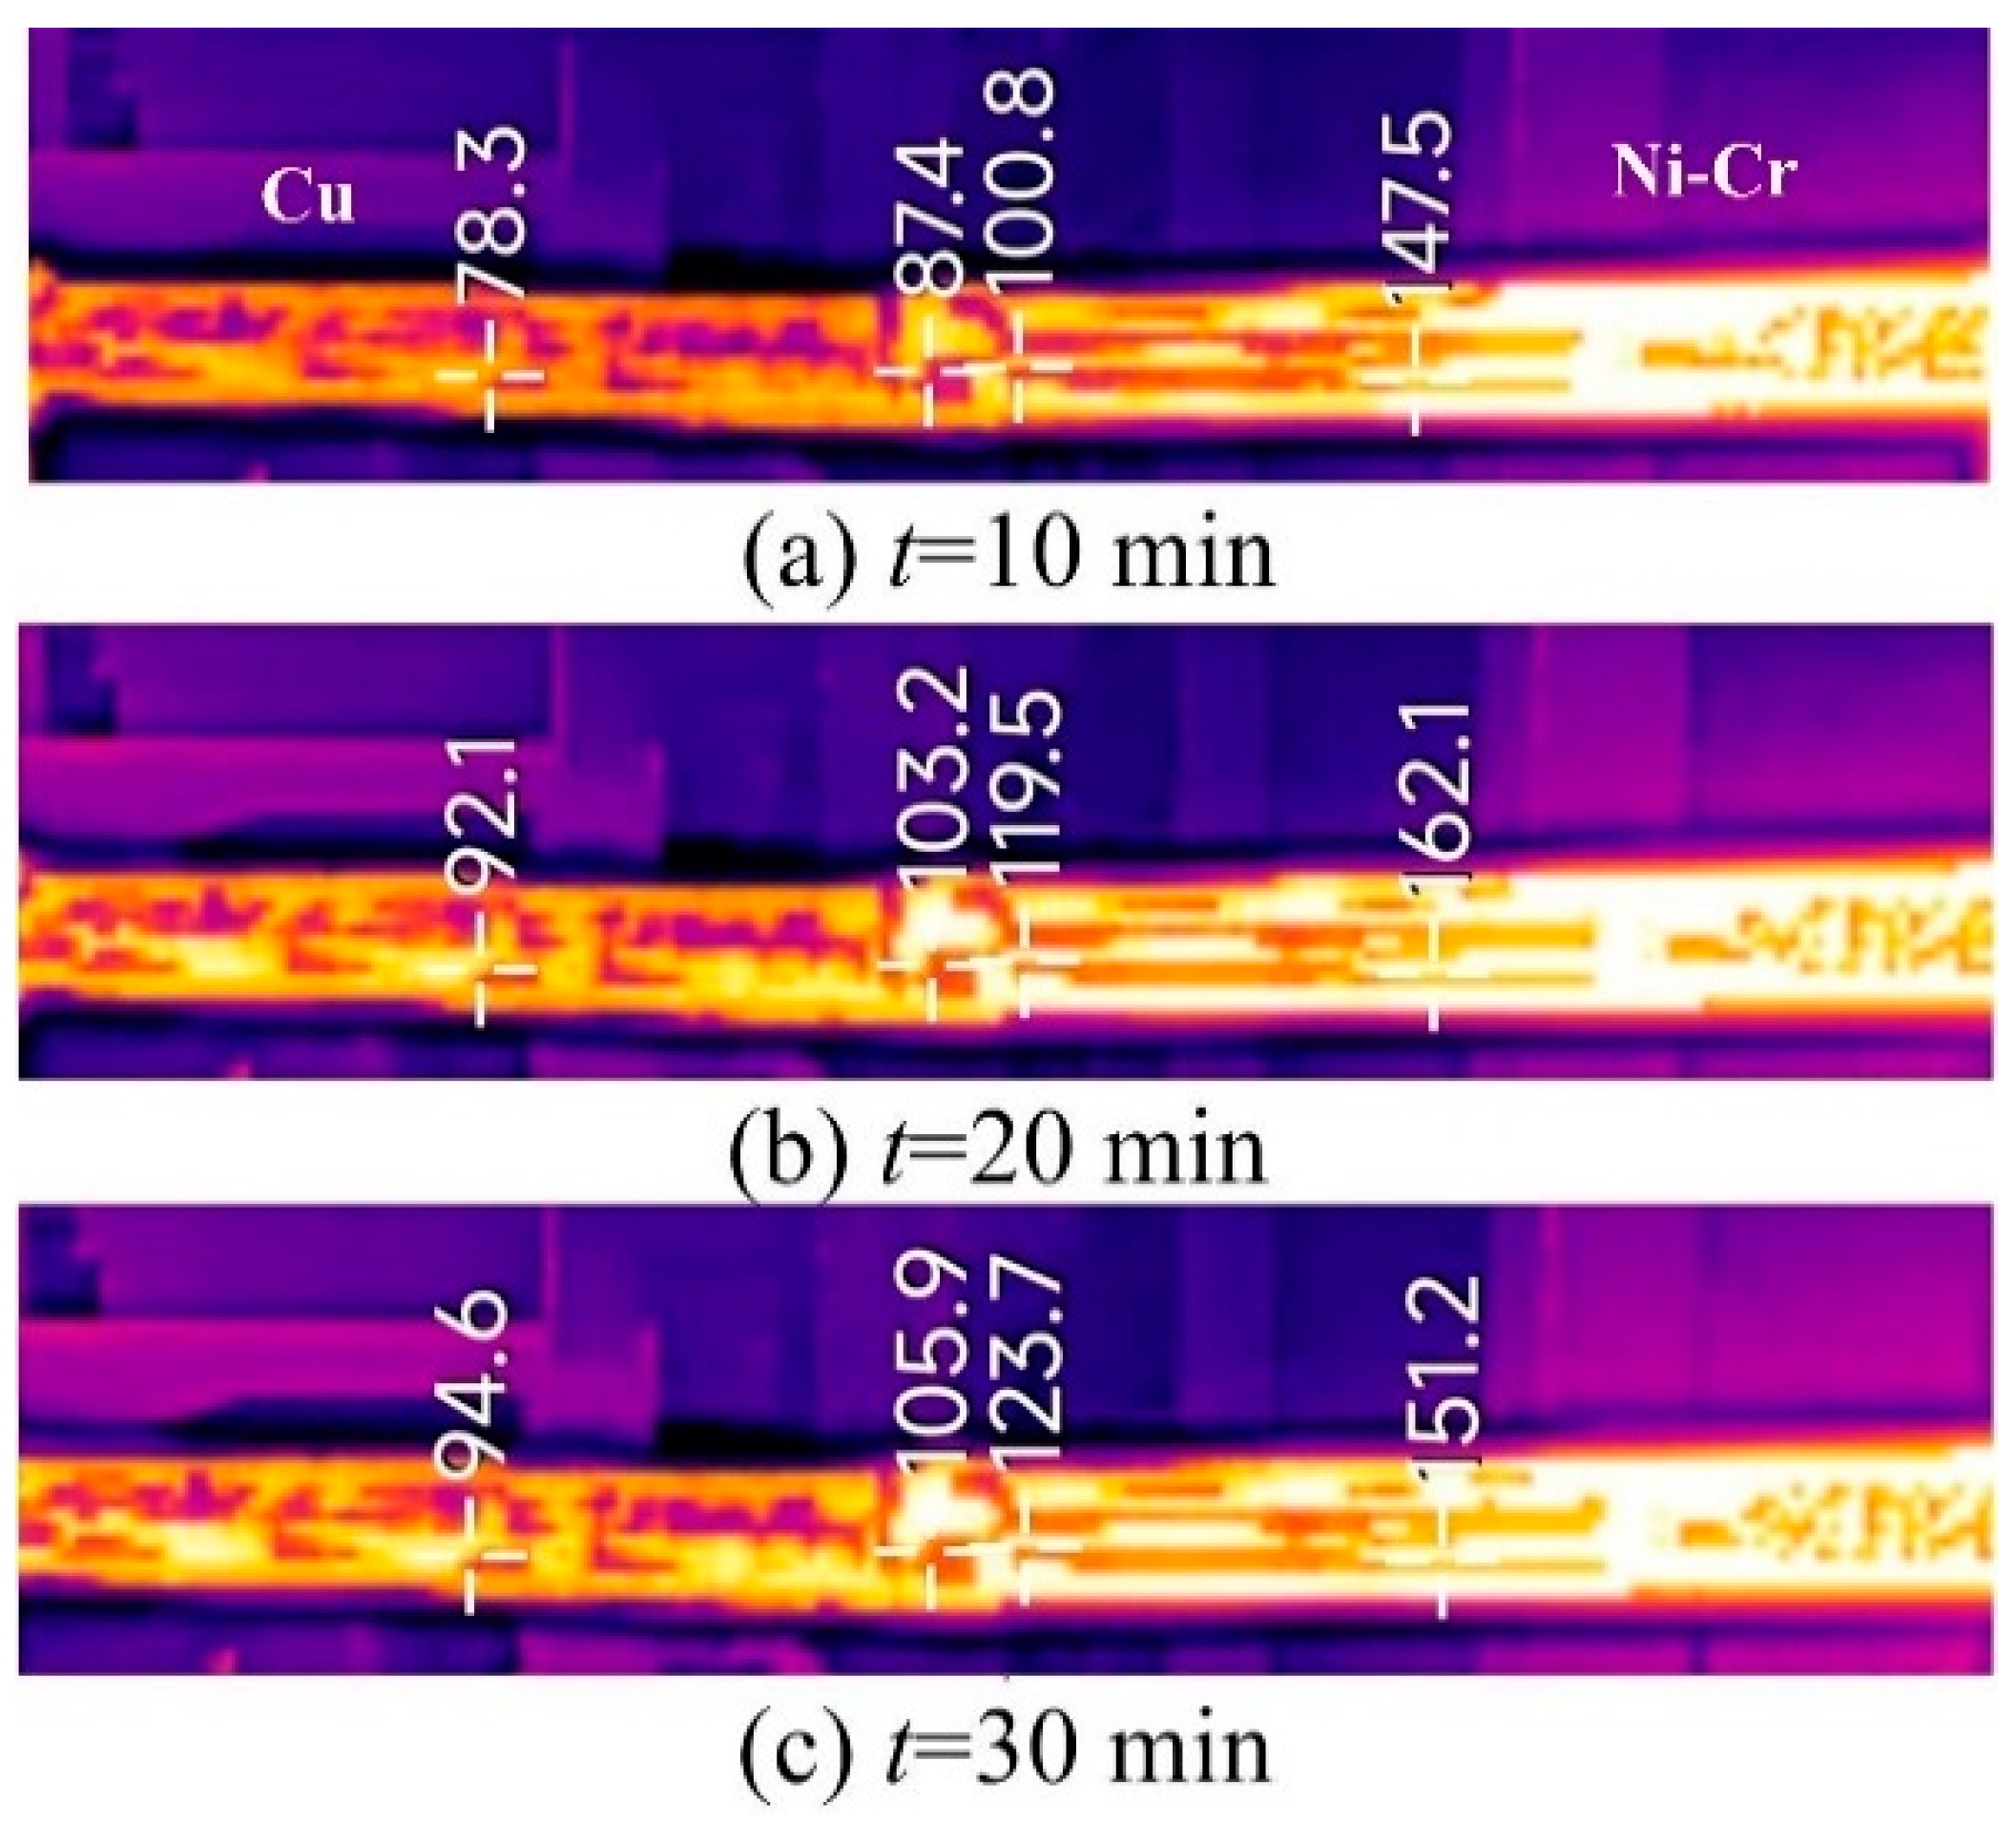
3.3. Electrical and Thermal Conductivity Characteristics of Joints

To ensure long-term electrical heating of the core wire, we conducted an electrical testing experiment. This experiment aimed to investigate the thermal stability of the welded joint under continuous current load conditions and assess how the joint’s performance changes during prolonged operation. The applied current was 100 A and the electrical durations were 10 min, 20 min, and 30 min, respectively. The infrared thermography of the welded joint is shown in Figure 18. Unlike connections of the same metal, the electrical resistance at different positions of the core wire is different (Ni-Cr > fusion zone > copper) [30], resulting in varying amounts of Joule heat generated at different locations of the joint. The temperature of the entire core wire gradually increases from the copper side to the nickel–chromium alloy side.
The temperature at different positions of the joint varies with the duration of the current flow, as shown in Figure 19. After 10 min of current flow, the joint temperature is approximately 94 °C, while the temperature on the copper side is about 78.3 °C. After 20 min, the joint temperature stabilizes at approximately 111.4 °C and the copper-side temperature is about 92 °C. After 30 min, there is no significant increase in the joint temperature, remaining around 114.8 °C, with the copper-side temperature at about 94 °C. Neither the joint temperature nor the copper-side temperature increased significantly.
The electrical conductivity of dissimilar metal joints at different positions is shown in Figure 20. The copper side exhibits the highest electrical conductivity, followed by the fusion zone, while the nickel–chromium alloy side has the lowest conductivity. According to Joule’s law, when the Joule heat generated during the electrification process is minimal, the temperature change of the joint remains insignificant. In contrast, nickel–chromium alloys have relatively low conductivity, which leads to the generation of more Joule heat during electrification. As a result, the joint experiences a more noticeable temperature change during the heating process. This pattern of temperature change aligns with the results obtained from the experiment.

4. Discussion

This work joined red copper to a Ni-Cr alloy by the TIG filler wire method. The microstructure, electric conduction, and mechanical properties were studied. It is worth noting that in past dissimilar metal welding procedures, the fracture location of the joint was mostly at the interface between the two different metals [31]. However, in this work, the fracture of the welded joint occurred in the copper base material, which indicates that the strength of the joint structure is significantly greater than that of the copper base material (as shown in Figure 16). Previous studies have shown that the microstructure of the interface determines the mechanical strength of the joint [32]. Additionally, if intermetallic compounds were formed at the interface, they could severely reduce the strength of the joint. In this work, through observation and testing, no intermetallic compounds were found. Instead, only a diffusion layer was observed at the interface. This section will discuss the formation process of the interfacial layer and the strengthening of the related joint microstructure.
Firstly, the molten copper and the Ni-Cr alloy mix with each other in a liquid state at the fusion zone and the interface, as shown in Figure 21a,b. Next, as the temperature decreases, Cu-Ni can dissolve and form a strengthening phase, Cu0.81Ni0.19. During the melting process, the concentration gradient of atoms on both sides of the interface causes Cr, Ni, and Cu to diffuse and mix. In the cooling process, the solid solution phase precipitates and forms a diffusion layer on one side of the interface, as shown in Figure 21c,d. The presence of this microstructure enhances the joint, resulting in the hardness and tensile strength at the connection being greater than that of the copper base material.

5. Conclusions

Copper was joined to a Ni-Cr alloy by the TIG filler wire welding method. The microstructure, phase composition, mechanical properties, and electrical conductivity of the joints were studied. The main conclusions are as follows:
1.
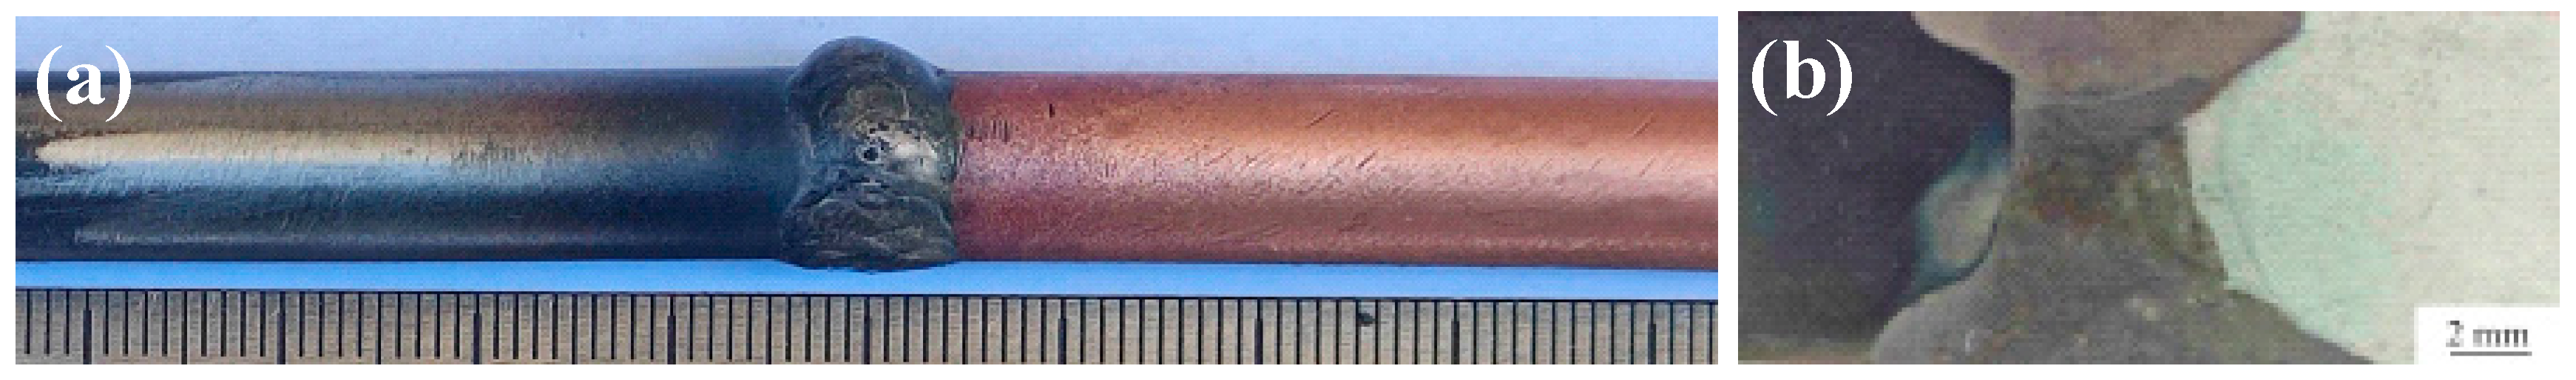
Using filler wire TIG welding allows for the effective joining of nickel–chromium alloys and copper as dissimilar metals. The joint forms well, with no defects such as pores or cracks on the surface, and the joint strength exceeds 220 MPa, meeting the performance requirements.
2.
There is a mutual transition of alloy elements at the interface on both sides of the fusion zone, and the tensile fracture mode is a plastic fracture with an obvious necking phenomenon during the tensile process.
3.
The results of the joint power-on test showed that the temperature change of the joint reached a stable state after 20 min of power-on, about 114 °C, and the temperature on the low-temperature side was about 92 °C. Compared with the low-temperature side, the temperature of the joint did not increase significantly.

Author Contributions

Conceptualization, J.Z., X.Y. and J.H.; methodology, W.Z. and H.S.; software, J.Z. and W.Z.; validation, X.Y. and J.H.; formal analysis, J.Z. and X.Y.; investigation, C.Z. and H.S.; resources, H.X. and J.H.; data curation, H.X. and C.Z.; writing—original draft, J.Z. and X.Y.; writing—review and editing, X.Y. and J.H.; supervision, J.H.; project administration, J.H. All authors have read and agreed to the published version of the manuscript.

Funding

This research was funded by the National Natural Science Foundation of China grant number 52165045 and the China National Petroleum Corporation 2022 Science and Technology Project Plan grant number 2022DJ1409.

Data Availability Statement

The original contributions presented in the study are included in the article, further inquiries can be directed to the corresponding authors.

Conflicts of Interest

Authors Jingang Zhang, Wanpeng Zhang, Hang Xie, Chao Zhou and Hongbin Song were employed by the company CNPC Baoji Petroleum Steel Pipe Co., Ltd. The remaining authors declare that the research was conducted in the absence of any commercial or financial relationships that could be construed as a potential conflict of interest.

References

  1. Marya, M. A Brief Review of Challenges & Technologies to Weld Dissimilar Metals in Two Industries: The Upstream Oil & Gas and the Automotive. Mater. Sci. Forum 2008, 580–582, 155–158. [Google Scholar] [CrossRef]
  2. Karim, M.A.; Park, Y.D. A review on welding of dissimilar metals in car body manufacturing. J. Weld. Join. 2020, 38, 8–23. [Google Scholar] [CrossRef]
  3. Carlone, P.; Astarita, A. Dissimilar metal welding. Metals 2019, 9, 1206. [Google Scholar] [CrossRef]
  4. Singh, S.; Kumar, V.; Kumar, S.; Kumar, A. Variant of MIG welding of similar and dissimilar metals: A review. Mater. Today Proc. 2022, 56, 3550–3555. [Google Scholar] [CrossRef]
  5. Kuryntsev, S. A review: Laser welding of dissimilar materials (Al/Fe, Al/Ti, Al/Cu)—Methods and techniques, microstructure and properties. Materials 2021, 15, 122. [Google Scholar] [CrossRef]
  6. Zhou, L.; Jiang, Z.; Lei, S.; Yu, M.; Zhao, H. Process study for friction stir lap welding of copper/steel dissimilar metals. Trans. China Weld. Inst. 2019, 40, 22–27. [Google Scholar] [CrossRef]
  7. Singla, Y.; Joshi, R. Mechanical properties study of copper/stainless steel dissimilar weld joints. Mod. Approaches Mater. Sci. 2020, 2, 271–273. [Google Scholar] [CrossRef]
  8. Lu, W.; Zhang, Y.; Yu, D.; Sun, D.; Li, H. Research progress on control strategy of intermetallic compounds in welding process of heterogeneous materials. Steel Res. Int. 2022, 93, 2100427. [Google Scholar] [CrossRef]
  9. Jain, A.; Sonia, P.; Kumari, S.; Pushp, P. Study of intermetallic compound (IMC) formed in welding of steel with magnesium: A review. Mater. Today Proc. 2020, 26, 1159–1166. [Google Scholar] [CrossRef]
  10. Huang, W.; Wang, H.; Rinker, T.; Tan, W. Investigation of metal mixing in laser keyhole welding of dissimilar metals. Mater. Des. 2020, 195, 109056. [Google Scholar] [CrossRef]
  11. Zuo, D.; Hu, S.S.; Shen, J.Q.; Xue, Z. Intermediate layer characterization and fracture behavior of laser-welded copper/aluminum metal joints. Mater. Des. 2014, 58, 357–362. [Google Scholar] [CrossRef]
  12. Zhu, B.; Zhen, L.; Xia, H.; Su, J.; Niu, S.; Wu, L.; Tan, C.; Chen, B. Effect of the scanning path on the nanosecond pulse laser welded Al/Cu lapped joint. Opt. Laser Technol. 2021, 139, 106945. [Google Scholar] [CrossRef]
  13. Afriansyah, A.A. Dissimilar metal welding using Shielded metal arc welding: A Review. Technol. Rep. Kansai Univ. 2020, 62, 1935–1948. [Google Scholar]
  14. Xie, Y.; Zhuang, J.; Huang, B.; Chen, Q.; Li, G. Effect of different welding parameters on residual stress and deformation of 20/0Cr18Ni9 dissimilar metal arc-welding joint. J. Adhes. Sci. Technol. 2020, 34, 1628–1652. [Google Scholar] [CrossRef]
  15. Cheng, Z.; Huang, J.; Ye, Z.; Chen, Y.; Yang, J.; Chen, S. Microstructures and mechanical properties of copper-stainless steel butt-welded joints by MIG-TIG double-sided arc welding. J. Mater. Process. Technol. 2019, 265, 87–98. [Google Scholar] [CrossRef]
  16. Li, Y.; Fan, D.; Li, Y.-P.; Huang, J.-K.; Yu, X.-Q. Effect of ultrasonic power on microstructural and mechanical properties of Al/Cu plasma arc welding–brazing joints. J. Mater. Eng. Perform. 2023, 32, 5365–5374. [Google Scholar] [CrossRef]
  17. Wang, Y.; Yu, C.; Lu, H.; Chen, J. Research status and future perspectives on ultrasonic arc welding technique. J. Manuf. Process. 2020, 58, 936–954. [Google Scholar] [CrossRef]
  18. Diab, J.; Dames, E.; Rohani, V.; Wyse, E.; Fulcheri, L. Review of DC and AC Arc Plasma at High Pressures Above Atmospheric Pressure. Plasma Chem. Plasma Process. 2024, 44, 687–720. [Google Scholar] [CrossRef]
  19. Sadeghian, A.; Iqbal, N. A review on dissimilar laser welding of steel-copper, steel-aluminum, aluminum-copper, and steel-nickel for electric vehicle battery manufacturing. Opt. Laser Technol. 2022, 146, 107595. [Google Scholar] [CrossRef]
  20. Isa, M.S.M.; Moghadasi, K.; Ariffin, M.A.; Raja, S.; bin Muhamad, M.R.; Yusof, F.; Jamaludin, M.F.; bin Yusoff, N.; bin Ab Karim, M.S. Recent research progress in friction stir welding of aluminium and copper dissimilar joint: A review. J. Mater. Res. Technol. 2021, 15, 2735–2780. [Google Scholar] [CrossRef]
  21. Ma, B.; Gao, X.; Huang, Y.; Gao, P.P.; Zhang, Y. A review of laser welding for aluminium and copper dissimilar metals. Opt. Laser Technol. 2023, 167, 109721. [Google Scholar] [CrossRef]
  22. Otsuka, K.; Ren, X. Martensitic transformations in nonferrous shape memory alloys. Mater. Sci. Eng. A 1999, 273, 89–105. [Google Scholar] [CrossRef]
  23. Xie, Y.; Huang, J.; Su, J.; Luo, Y.; Du, H.; Fan, D. Effect of nickel interlayer on laser welding of copper/titanium dissimilar metal joint. J. Mater. Res. Technol. 2023, 27, 4416–4429. [Google Scholar] [CrossRef]
  24. Chakrabarti, D.J.; Laughlin, D.E. The Cr-Cu (chromium-copper) system. Bull. Alloy Phase Diagr. 1984, 5, 59–68. [Google Scholar] [CrossRef]
  25. Bogdanov, A.I.; Kulevich, V.P.; Shmorgun, V.G. Microstructure evolution and growth of interfacial intermetallic compounds in NiCr/Ti alloy laminated composite after explosive welding and heat treatment. Metals 2023, 13, 1417. [Google Scholar] [CrossRef]
  26. Ioannidou, D.; Kaldellis, A.; Makris, N.; Deligiannis, S.; Skarvelis, P.; Tsakiridis, P.E. Copper contribution on microstructure and mechanical properties of dissimilar gas tungsten arc welded Ti–6Al–4V to Inconel® X-750. Weld. World 2024, 68, 2577–2588. [Google Scholar] [CrossRef]
  27. Xin, J.; Zhang, H.; Sun, W.; Huang, C.; Wang, S.; Wei, J.; Wang, W.; Fang, Z.; Wu, D.; Li, L. The microstructures and mechanical properties of dissimilar laser welding of copper and 316L stainless steel with Ni interlayer. Cryogenics 2021, 118, 103344. [Google Scholar] [CrossRef]
  28. Yang, K.; Wang, Y.; Guo, M.; Wang, H.; Mo, Y.; Dong, X.; Lou, H. Recent development of advanced precipitation-strengthened Cu alloys with high strength and conductivity: A review. Prog. Mater. Sci. 2023, 138, 101141. [Google Scholar] [CrossRef]
  29. Kossman, S.; Coorevits, T.; Iost, A.; Chicot, D. A new approach of the Oliver and Pharr model to fit the unloading curve from instrumented indentation testing. J. Mater. Res. 2017, 32, 2230–2240. [Google Scholar] [CrossRef]
  30. Dugdale, J.S. The Electrical Properties of Metals and Alloys; Courier Dover Publications: Mineola, NY, USA, 2016. [Google Scholar]
  31. Kah, P.; Shrestha, M.; Martikainen, J. Trends in joining dissimilar metals by welding. Appl. Mech. Mater. 2014, 440, 269–276. [Google Scholar] [CrossRef]
  32. Baghel, P.K. Effect of SMAW process parameters on similar and dissimilar metal welds: An overview. Heliyon 2022, 8, e12161. [Google Scholar] [CrossRef] [PubMed]
Figure 1. Schematic diagram of the oil-well electric heating technology system.
Metals 14 01105 g001
Figure 2. Schematic diagram of welding Ni-Cr alloy and copper round rod.
Metals 14 01105 g002
Figure 3. The welding sequence of X groove in butt joint.
Metals 14 01105 g003
Figure 4. Welded joint of Ni-Cr alloy and copper. (a) Surface morphology, (b) cross-sectional morphology.
Metals 14 01105 g004
Figure 5. X-ray nondestructive testing film of welded joint.
Metals 14 01105 g005
Figure 6. The cutting position and dimension of the specimen (unit: mm). (a) Metallographic specimen, (b) tensile test specimen.
Metals 14 01105 g006
Figure 7. Schematic diagram of the joint conductive heating test system.
Metals 14 01105 g007
Figure 8. Microstructure of different positions at the welded joint. (a) Ni-Cr side, (b) Fusion zone, (c) Cu side.
Metals 14 01105 g008
Figure 9. EDS map scanning at the interface between the copper and the fusion zone. (a) Microstructure, (b) Cu atom distribution, (c) Cr atom distribution, (d) Ni atom distribution.
Metals 14 01105 g009
Figure 10. EDS map scanning at the interface between the Ni-Cr alloy side and the fusion zone. (a) Microstructure, (b) Cu atom distribution, (c) Cr atom distribution, (d) Ni atom distribution.
Metals 14 01105 g010
Figure 11. Copper-side and fusion zone interface line scanning. (a) Microstructure, (b) Atomic weight percent.
Metals 14 01105 g011
Figure 12. CrNi alloy-side and fusion zone interface line scanning results. (a) Microstructure, (b) Atomic weight percent.
Metals 14 01105 g012
Figure 13. X-ray diffraction pattern at the interface of the Cr20Ni80 nickel–chromium alloy and the fusion zone.
Metals 14 01105 g013
Figure 14. X-ray diffraction pattern at the interface of Cu and the fusion zone.
Metals 14 01105 g014
Figure 15. Joint microhardness distribution.
Metals 14 01105 g015
Figure 16. Loading–depth curves of nanoindentation at different regions of the joint: (a) the interface of the Ni-Cr alloy and the fusion zone; (b) the interface of the fusion zone and copper.
Metals 14 01105 g016
Figure 17. Tensile test results of welded joint. (a) Specimens after tensile fracture, (b) Stress-strain curve.
Metals 14 01105 g017
Figure 18. Thermal image of joint temperature at different energizing times.
Metals 14 01105 g018
Figure 19. The effect of energization time on joint temperature changes.
Metals 14 01105 g019
Figure 20. Conductivity of joint at different positions.
Metals 14 01105 g020
Figure 21. Mechanism of diffusion layer formation process at the interface. (a) Atoms begin to spread, (b) Atoms begin to combine, (c) Solid solution ratio, (d) Forming a diffusion layer.
Metals 14 01105 g021
Table 1. Chemical composition of red copper and filler wire (wt.%).
MaterialCuBiSbAsFePbS
Red copper≥99.9≤0.001≤0.002≤0.002≤0.005≤0.005≤0.005
Table 2. Chemical composition of Cr20Ni80 alloy (wt.%).
MaterialCMnPSSiFeAlCrNi
Cr20Ni80≤0.08≤0.6≤0.02≤0.00150.75–1.60≤1≤0.520–23Balance
Table 3. Hardness and elastic modulus at different regions.
RegionHardness (MPa)Elastic Modulus (GPa)
Ni-Cr side2232.5266.39
Ni-Cr/Fusion zone interface1847.3163.62
Fusion zone1473.3157.37
Fusion zone/Cu interface1031.6164.86
Cu side666.76137.06
Disclaimer/Publisher’s Note: The statements, opinions and data contained in all publications are solely those of the individual author(s) and contributor(s) and not of MDPI and/or the editor(s). MDPI and/or the editor(s) disclaim responsibility for any injury to people or property resulting from any ideas, methods, instructions or products referred to in the content.

