
Enhanced DC and AC Soft Magnetic Properties of Fe-Co-Ni-Al-Si High-Entropy Alloys via Texture and Iron Segregation


Abstract
:
1. Introduction
2. Materials and Methods
3. Results
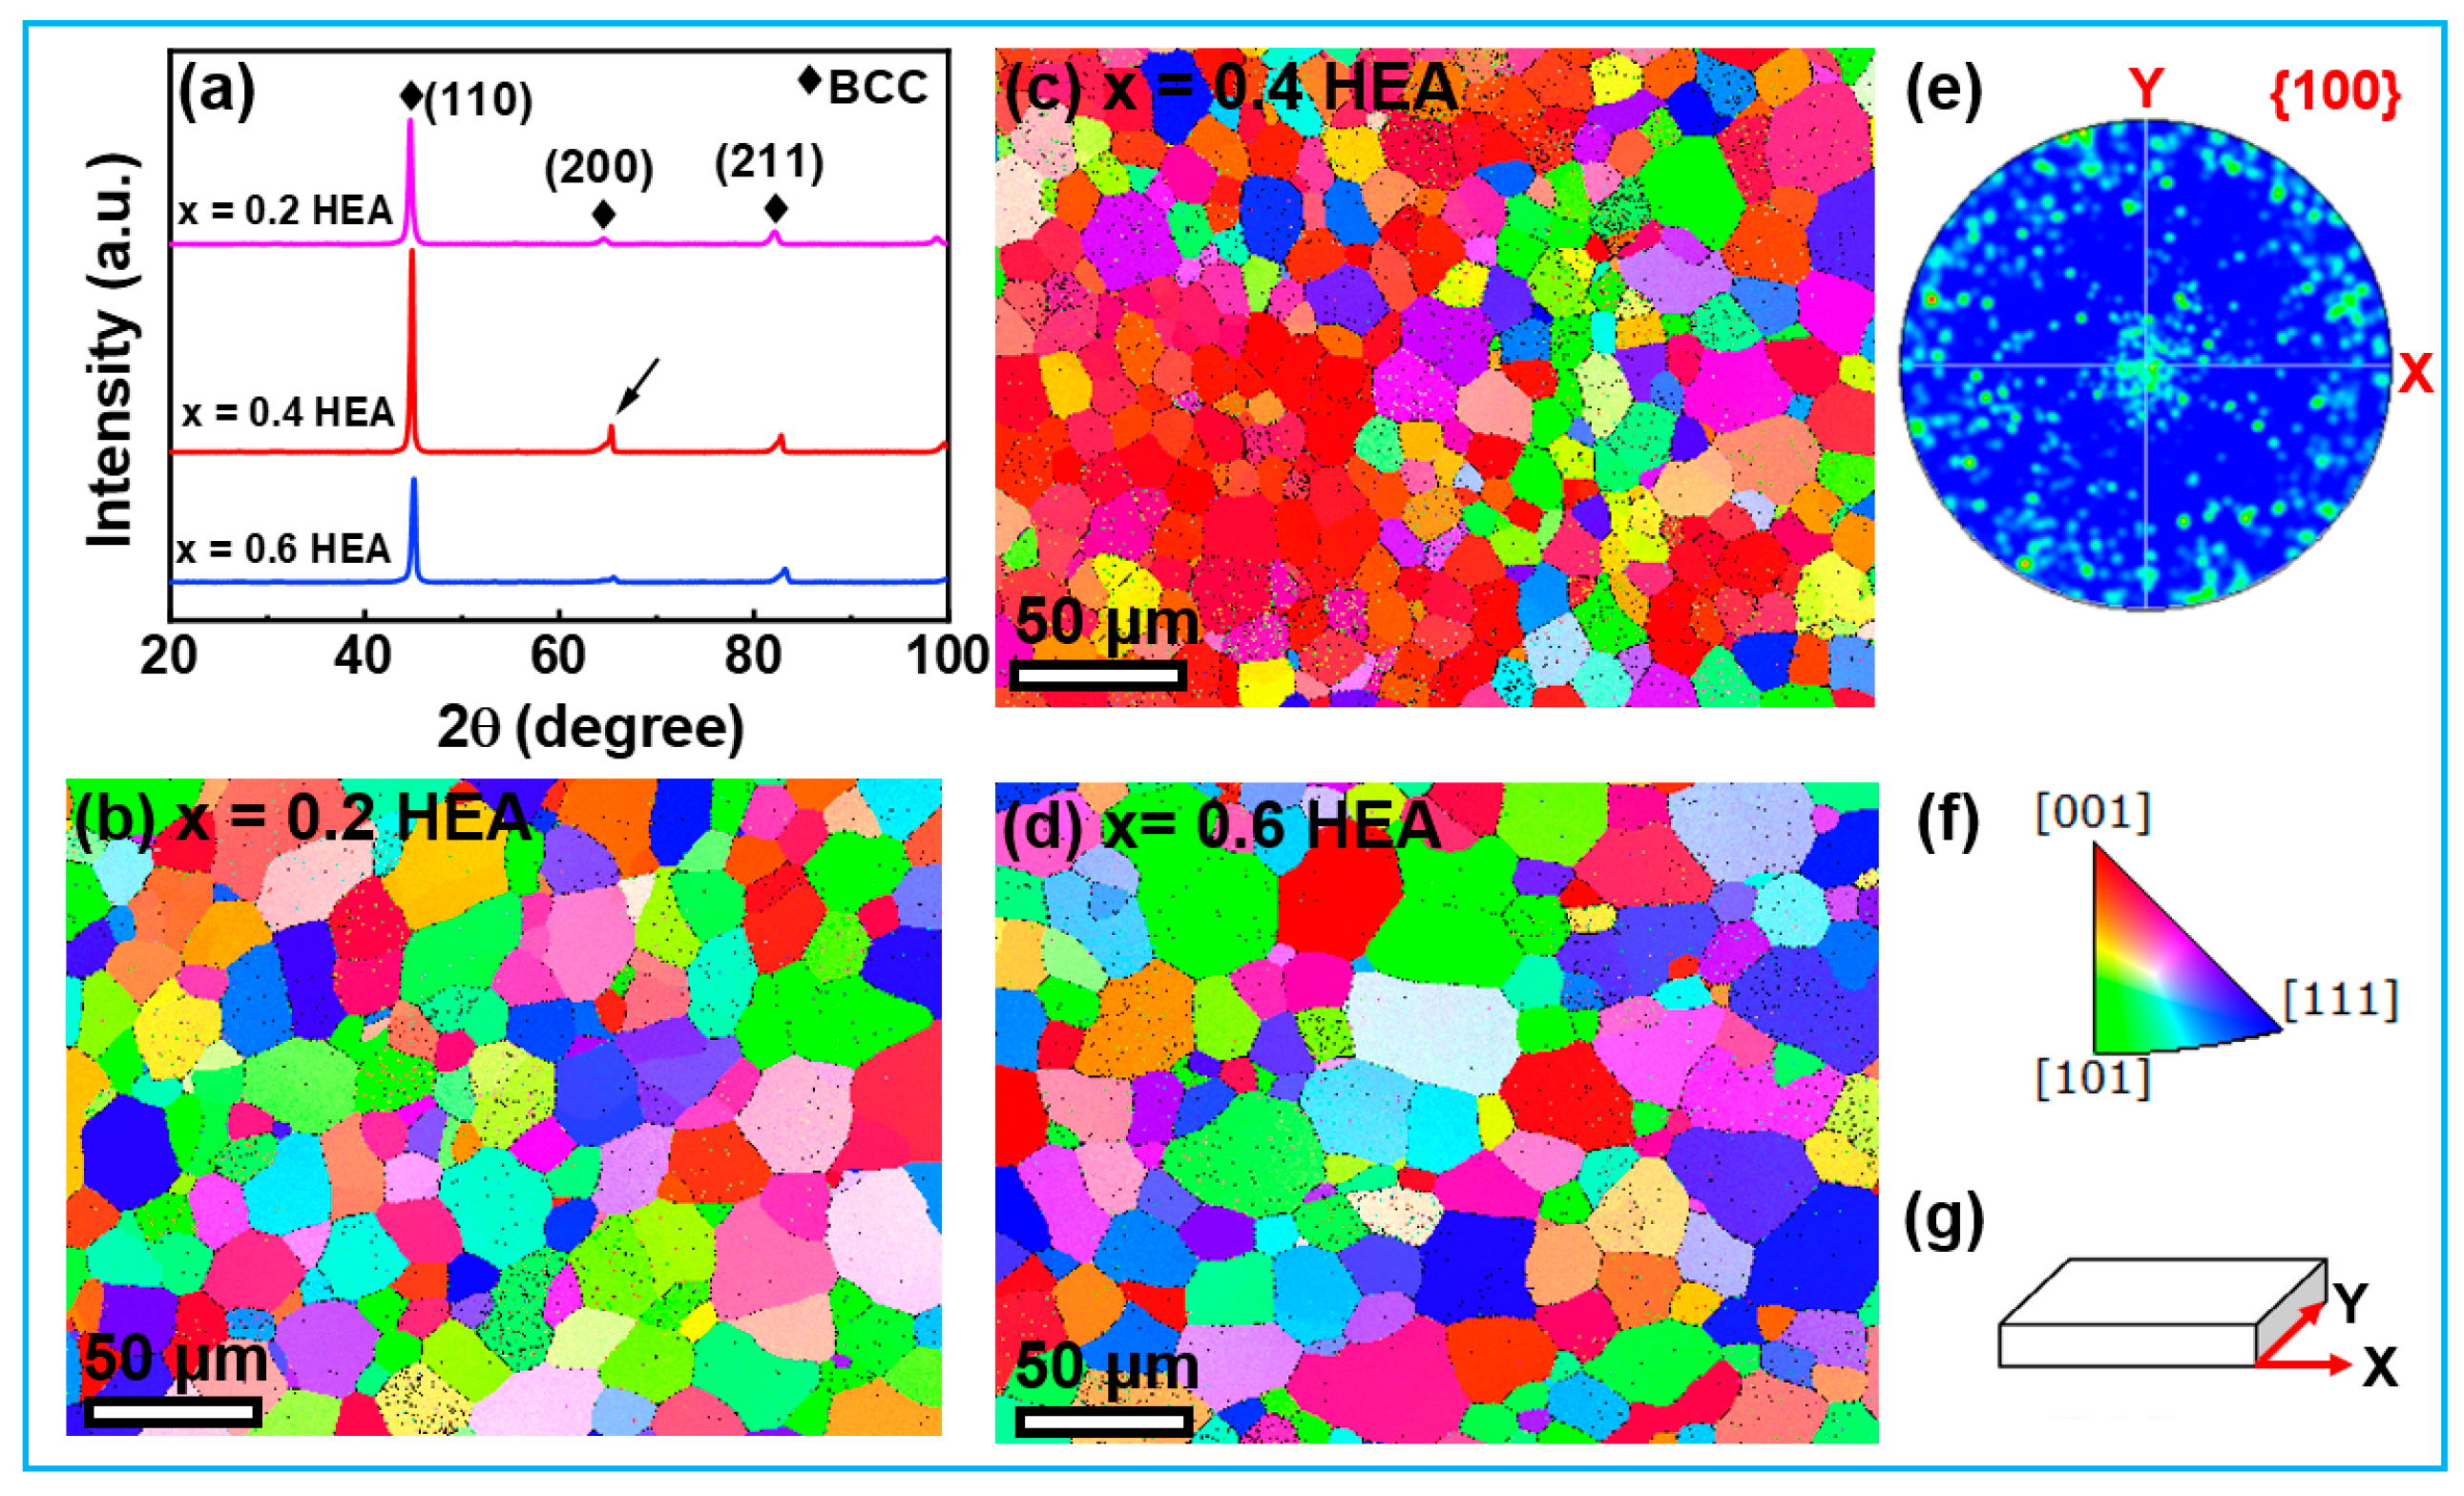
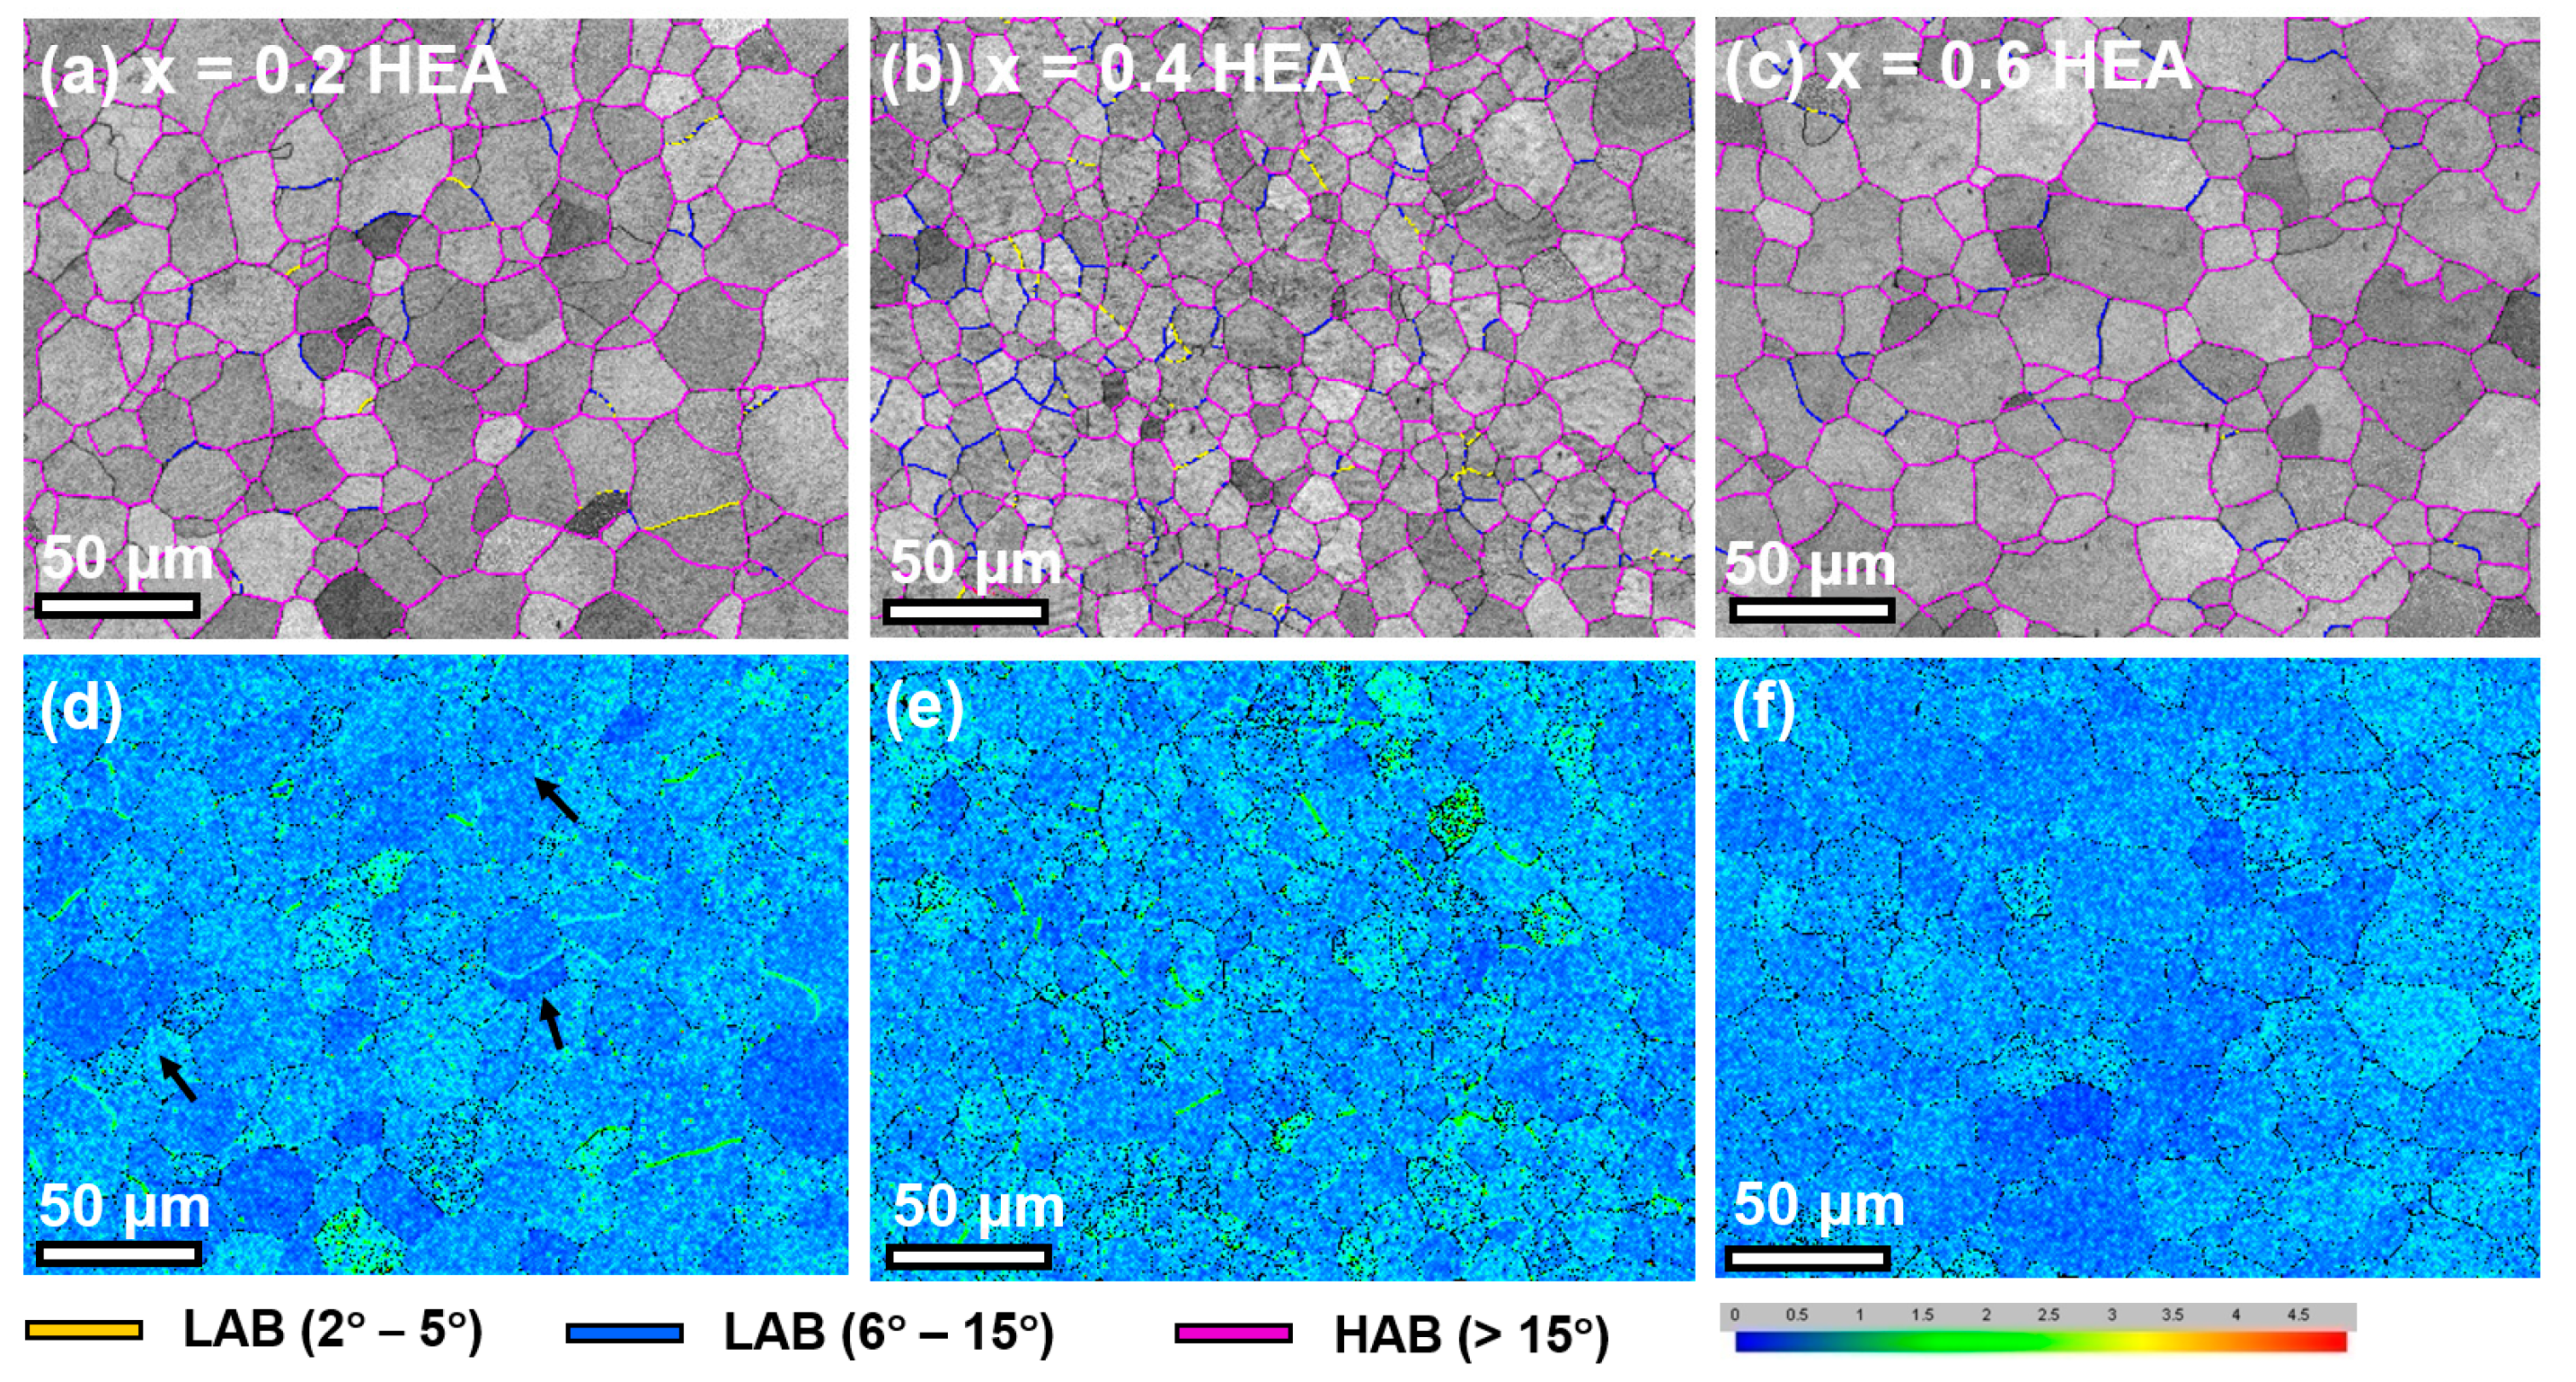
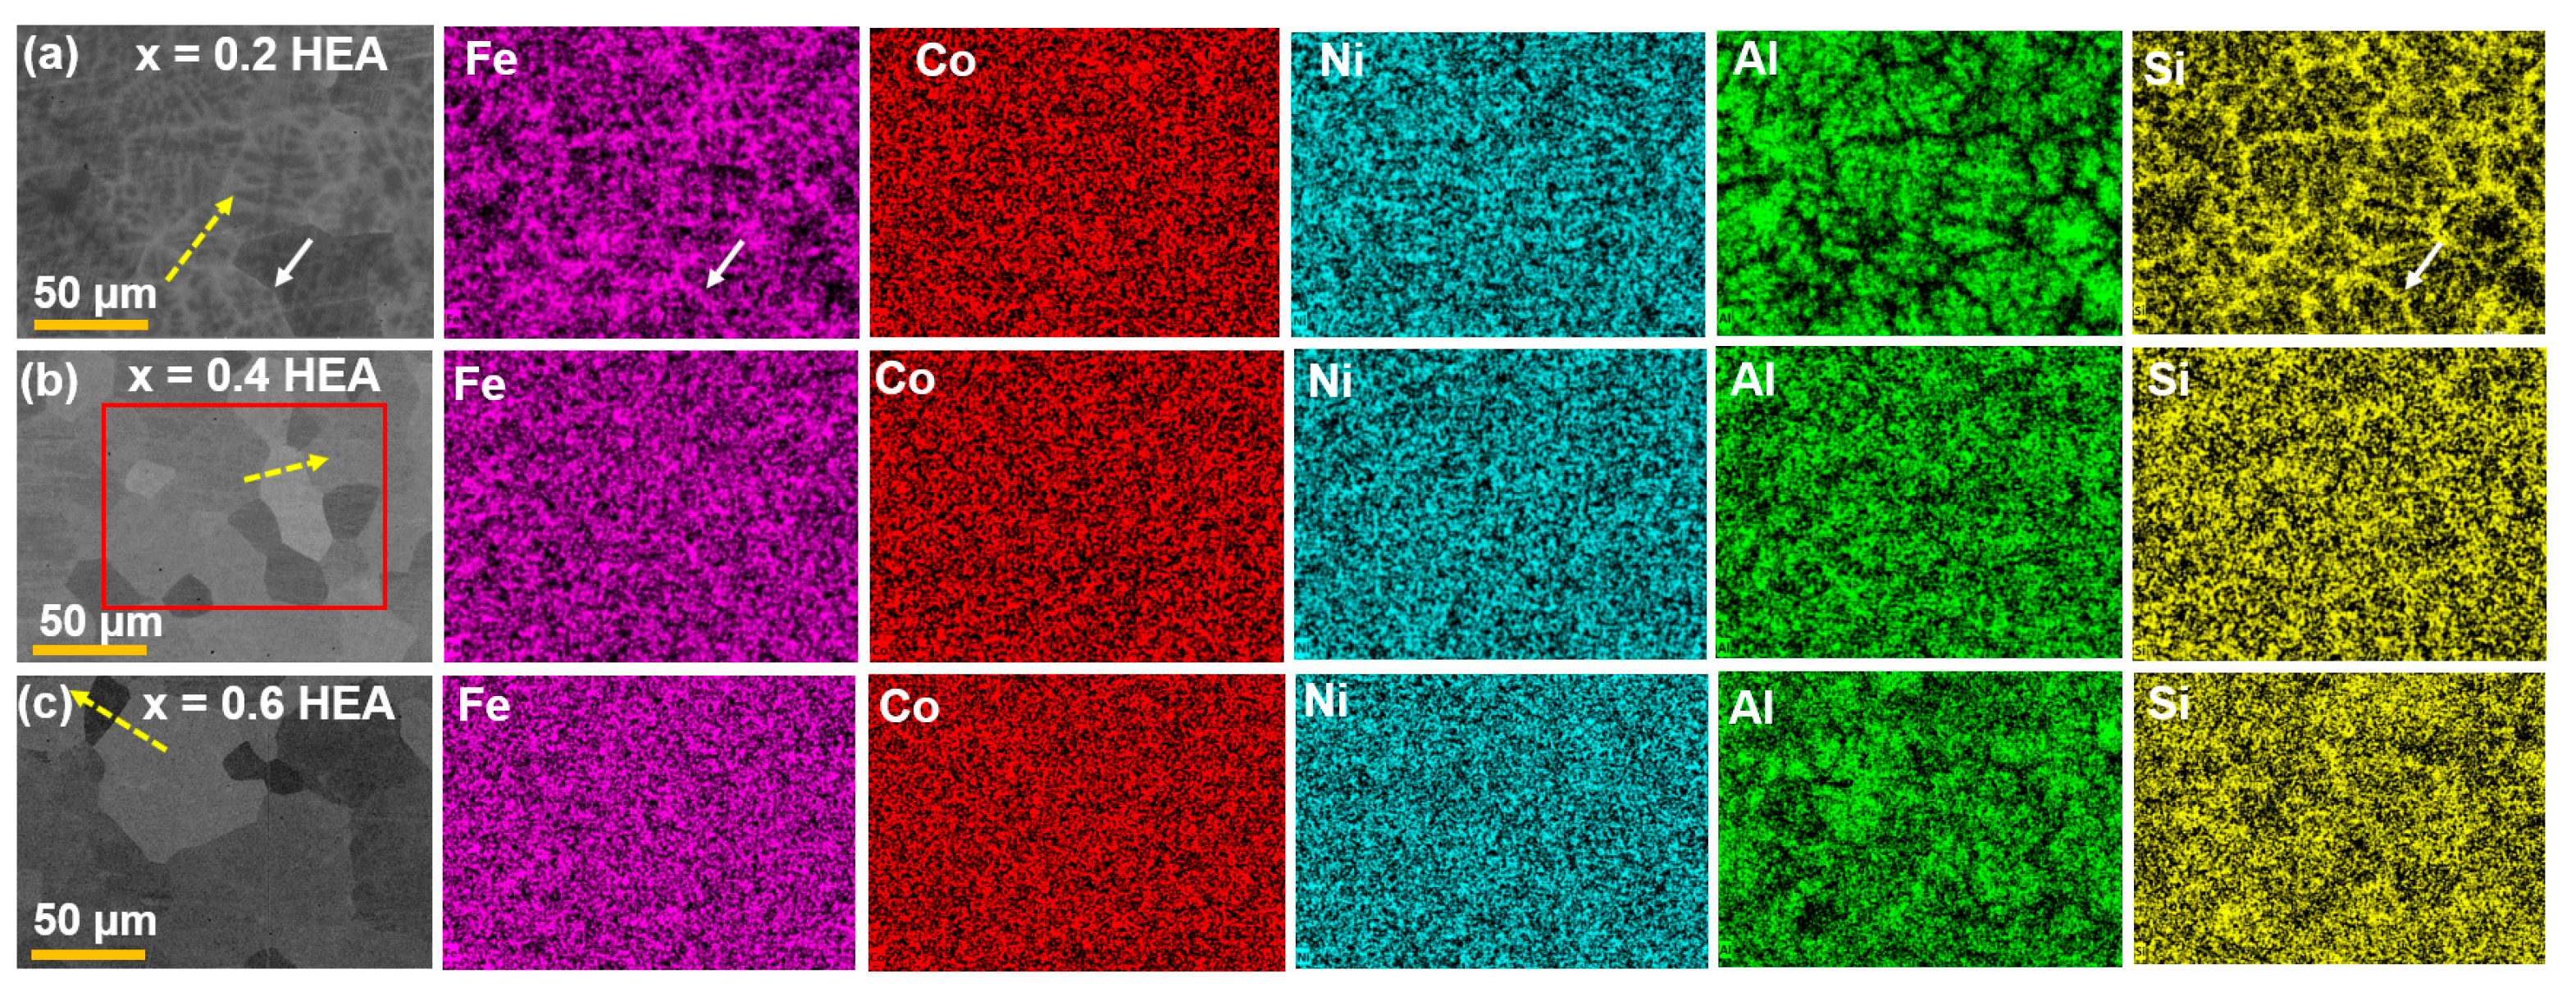
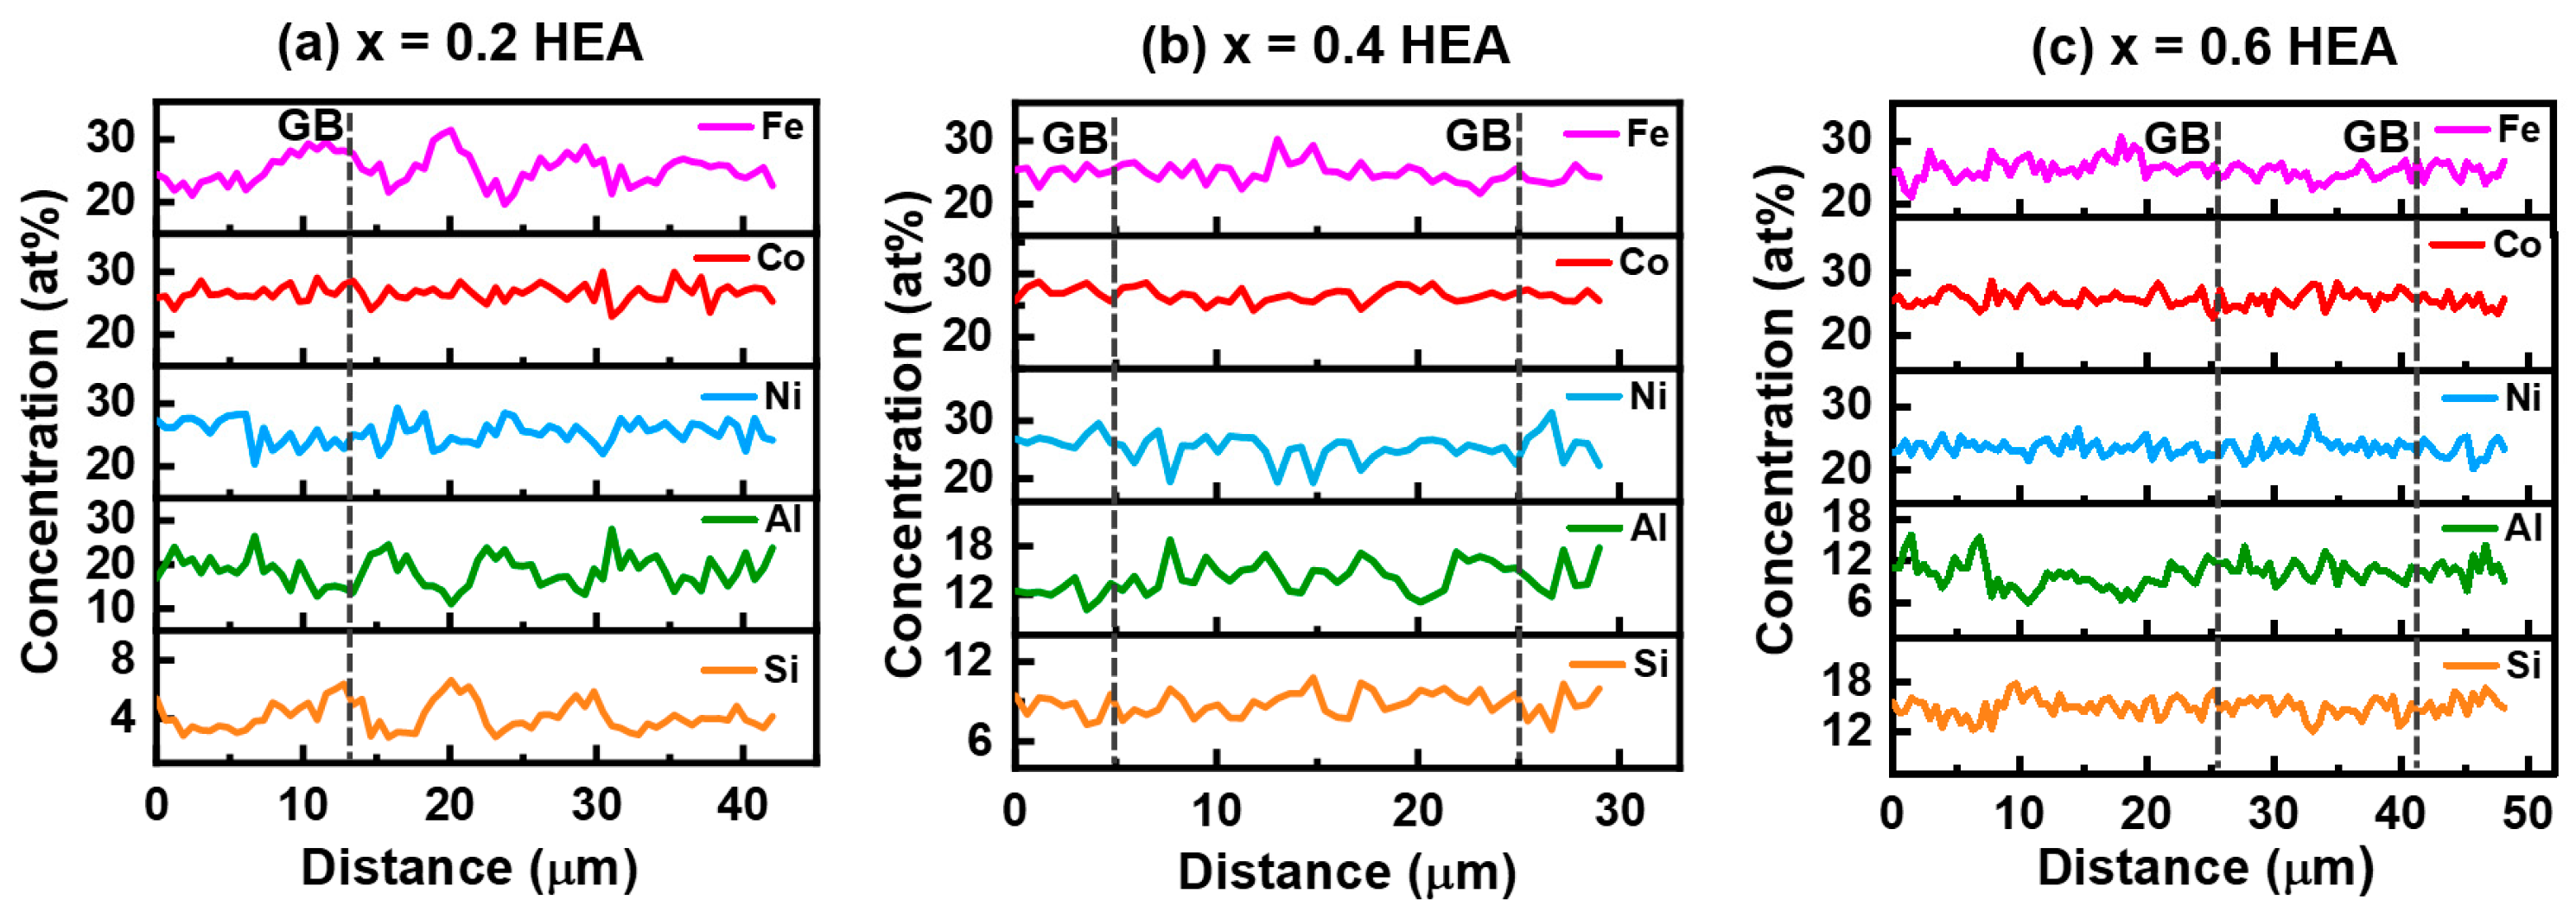
3.1. Microstructure
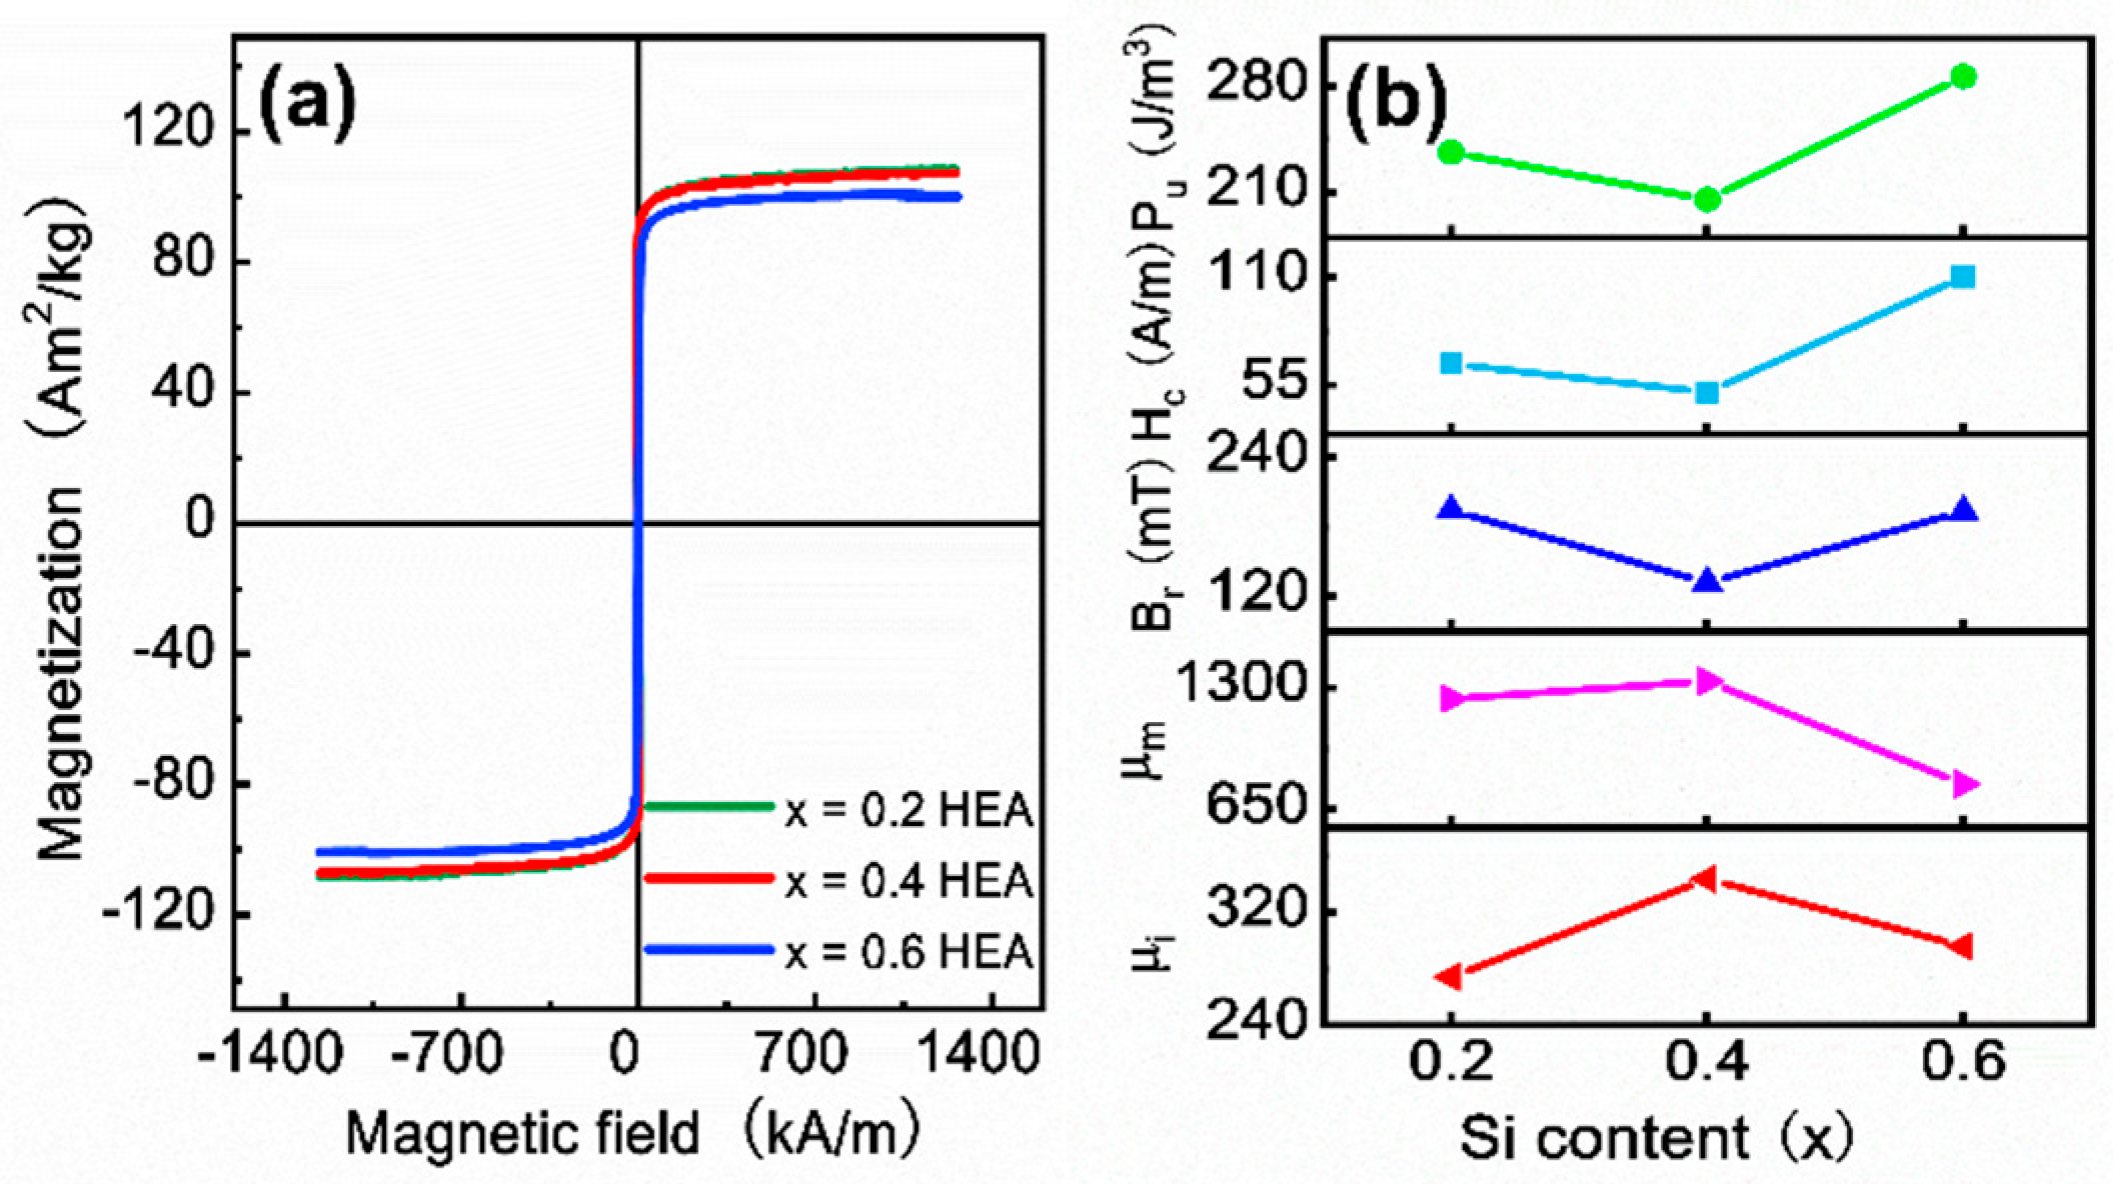
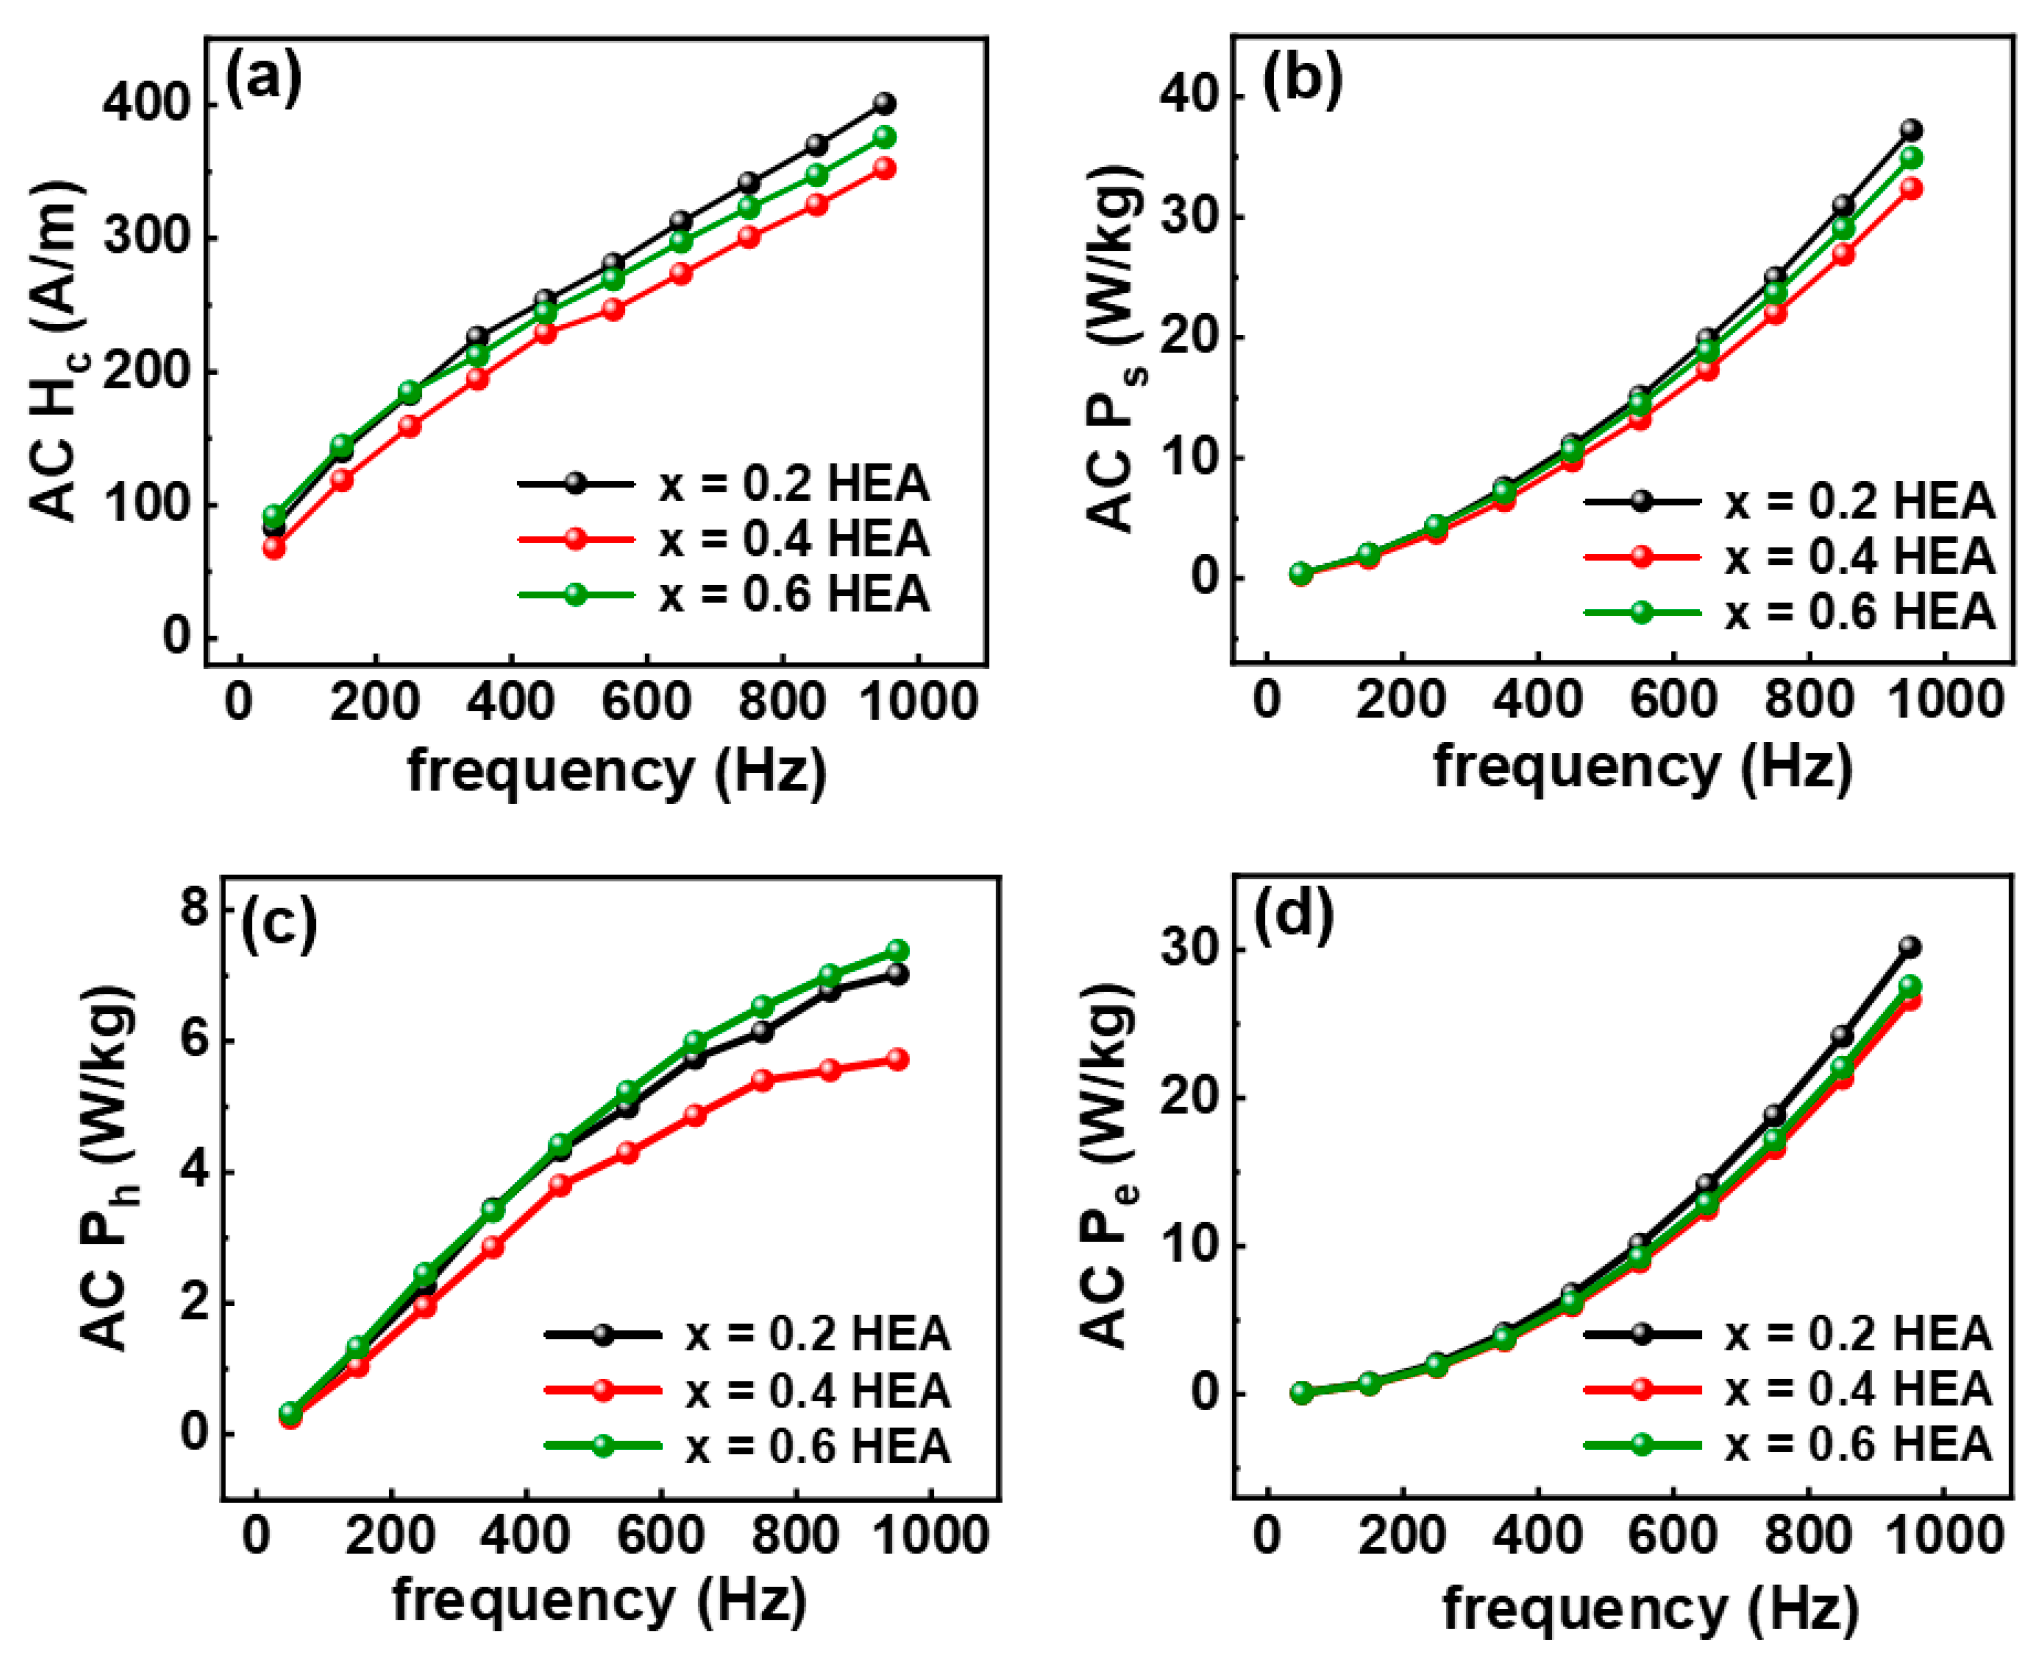
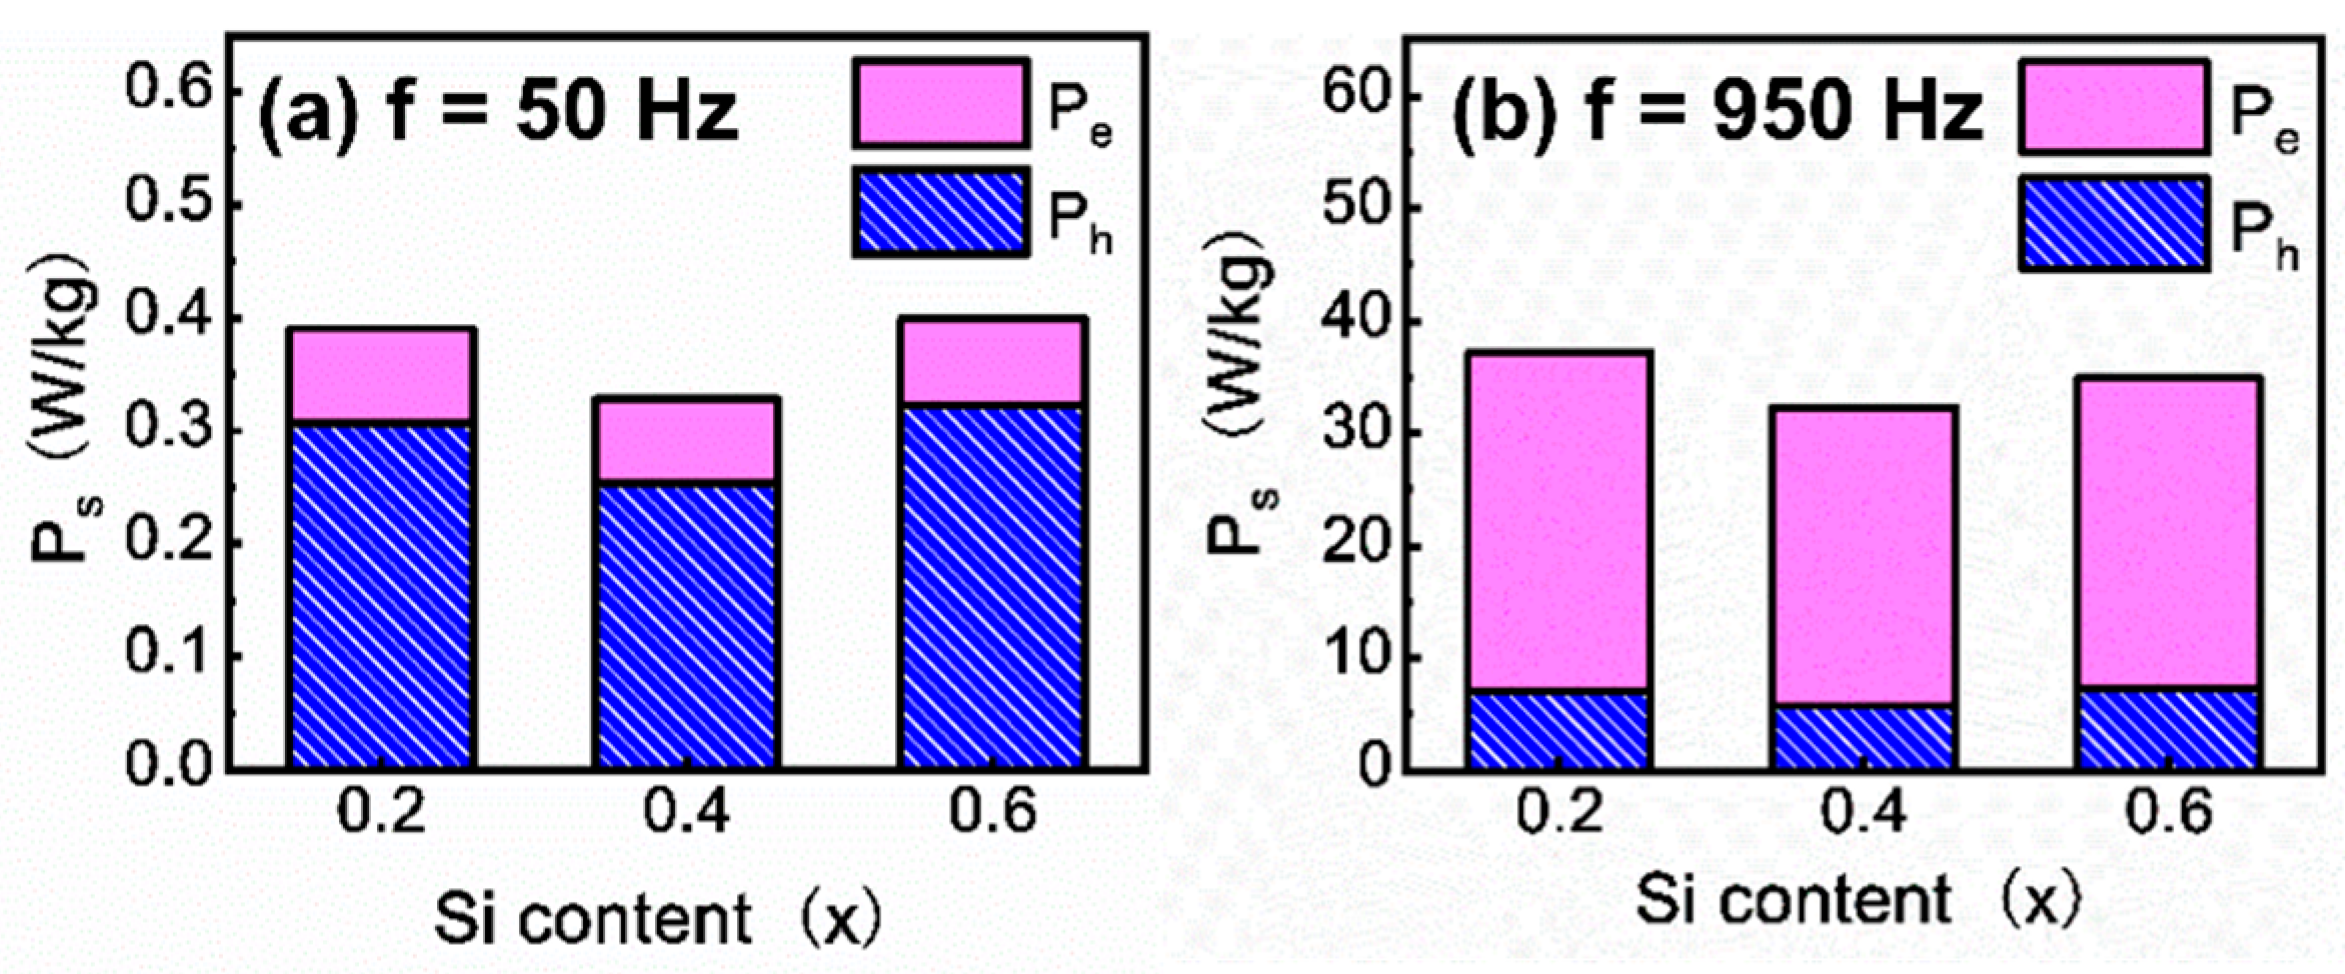
3.2. Soft Magnetic Properties
4. Discussion
5. Conclusions
Author Contributions
Funding
Data Availability Statement
Acknowledgments
Conflicts of Interest
References
- Ram, B.S.; Paul, A.K.; Kulkarni, S.V. Soft magnetic materials and their applications in transformers. J. Magn. Magn. Mater. 2021, 537, 168210. [Google Scholar] [CrossRef]
- Henke, M.; Narjes, G.; Hoffmann, J.; Wohlers, C.; Urbanek, S.; Heister, C.; Steinbrink, J.; Canders, W.R.; Ponick, B. Challenges and opportunities of very light high-performance electric drives for aviation. Energies 2018, 11, 344. [Google Scholar] [CrossRef]
- Silveyra, J.M.; Ferrara, E.; Huber, D.L.; Monson, T.C. Soft magnetic materials for a sustainable and electrified world. Science 2018, 362, eaao0195. [Google Scholar] [CrossRef] [PubMed]
- Ouyang, G.Y.; Chen, X.; Liang, Y.F.; Macziewski, C.; Cui, J. Review of Fe-6.5 wt% Si high silicon steel—A promising soft magnetic material for sub-kHz application. J. Magn. Magn. Mater. 2019, 481, 234–250. [Google Scholar] [CrossRef]
- Theisen, E. Development of new amorphous and nanocrystalline magnetic materials for use in energy-efficient devices. MRS Adv. 2017, 2, 3409–3414. [Google Scholar] [CrossRef]
- Coey, J.M.D. Magnetism and Magnetic Materials; Cambridge University Press: Cambridge, UK, 2009. [Google Scholar]
- Yeh, J.W.; Chen, S.K.; Lin, S.J.; Gan, J.Y.; Chin, T.S.; Shun, T.T.; Tsau, C.H.; Chang, S.Y. Nanostructured high-entropy alloys with multiple principal elements: Novel alloy design concepts and outcomes. Adv. Eng. Mater. 2004, 6, 299–303. [Google Scholar] [CrossRef]
- Cantor, B.; Chang, I.T.H.; Knight, P.; Vincent, A.J.B. Microstructural development in equiatomic multicomponent alloys. Mater. Sci. Eng. A 2004, 375, 213–218. [Google Scholar] [CrossRef]
- Kumar, D. Recent advances in tribology of high entropy alloys: A critical review. Prog. Mater. Sci. 2023, 136, 101106. [Google Scholar] [CrossRef]
- Wang, B.Y.; Yang, C.; Shu, D.; Sun, B.D. A review of irradiation-tolerant refractory high-entropy alloys. Metals 2023, 14, 45. [Google Scholar] [CrossRef]
- Moniri, S.; Yang, Y.; Ding, J.; Yuan, Y.K.; Zhou, J.H.; Yang, L.; Zhu, F.; Liao, Y.X.; Yao, Y.G.; Hu, L.B.; et al. Three-dimensional atomic structure and local chemical order of medium-and high-entropy nanoalloys. Nature 2023, 624, 564–569. [Google Scholar] [CrossRef] [PubMed]
- Wu, Z.N.; Wang, S.S.; Jia, Y.F.; Zhang, W.J.; Chen, R.G.; Cao, B.X.; Yu, S.Z.; Wei, J. Review on the tensile properties and strengthening mechanisms of additive manufactured CoCrFeNi-based high-entropy alloys. Metals 2024, 14, 437. [Google Scholar] [CrossRef]
- Zirari, T.; Trabadelo, V. A review on wear, corrosion, and wear-corrosion synergy of high entropy alloys. Heliyon 2024, 10, e25867. [Google Scholar] [CrossRef] [PubMed]
- Chaudhary, V.; Chaudhary, R.; Banerjee, R.; Ramanujan, R.V. Accelerated and conventional development of magnetic high entropy alloys. Mater. Today 2021, 49, 231–252. [Google Scholar] [CrossRef]
- Huang, E.W.; Hung, G.Y.; Lee, S.Y.; Jain, J.; Chang, K.P.; Chou, J.J.; Yang, W.C.; Liaw, P.K. Mechanical and magnetic properties of the high-entropy alloys for combinatorial approaches. Crystals 2020, 10, 200. [Google Scholar] [CrossRef]
- Kang, T.X.; Wu, S.Y.; Wang, M.L.; Wang, J.; Fan, X.L.; Lu, Y.P. Novel Fe2CoNi(AlSi)x high-entropy alloys with attractive soft magnetic and mechanical properties. Appl. Phys. A Mater. Sci. Process. 2021, 127, 829. [Google Scholar] [CrossRef]
- Zhou, K.X.; Sun, B.R.; Liu, G.Y.; Li, X.W.; Xin, S.W.; Liaw, P.K.; Shen, T.D. FeCoNiAlSi high entropy alloys with exceptional fundamental and application-oriented magnetism. Intermetallics 2020, 122, 106801. [Google Scholar] [CrossRef]
- Sahu, P.; Samal, S.; Kumar, V. Microstructural, magnetic, and geometrical thermodynamic investigation of FeCoNi(MnSi)x (0.0, 0.1, 0.25, 0.5, 0.75, 1.0) high entropy alloys. Materialia 2021, 18, 101133. [Google Scholar] [CrossRef]
- Zuo, T.T.; Yang, X.; Liaw, P.K.; Zhang, Y. Influence of Bridgman solidification on microstructures and magnetic behaviors of a non-equiatomic FeCoNiAlSi high-entropy alloy. Intermetallics 2015, 67, 171–176. [Google Scholar] [CrossRef]
- Chen, C.; Zhang, H.; Fan, Y.Z.; Wei, R.; Zhang, W.W.; Wang, T.; Zhang, T.; Wu, K.; Li, F.S.; Guan, S.K.; et al. Improvement of corrosion resistance and magnetic properties of FeCoNiAl0.2Si0.2 high entropy alloy via rapid-solidification. Intermetallics 2020, 122, 106778. [Google Scholar] [CrossRef]
- Zhang, Y.; Zuo, T.T.; Cheng, Y.Q.; Liaw, P.K. High-entropy alloys with high saturation magnetization, electrical resistivity and malleability. Sci. Rep. 2013, 3, 1455. [Google Scholar] [CrossRef]
- Chen, C.; Fan, Y.Z.; Zhang, H.; Hou, J.J.; Zhang, W.W.; Wei, P.; Wang, W.; Qin, J.W.; Wei, R.; Wang, T.; et al. A novel Fe-Co-Ni-Si high entropy alloy with high yield strength, saturated magnetization and Curie temperature. Mater. Lett. 2020, 281, 128653. [Google Scholar] [CrossRef]
- Zhang, Y.; Zhang, M.; Li, D.Y.; Zuo, T.T.; Zhou, K.X.; Gao, M.C.; Sun, B.R.; Shen, T.D. Compositional design of soft magnetic high entropy alloys by minimizing magnetostriction coefficient in (Fe0.3Co0.5Ni0.2)100−x(Al1/3Si2/3)x system. Metals 2019, 9, 382. [Google Scholar] [CrossRef]
- Wu, Y.; Dai, Z.K.; Liu, R.R.; Zhou, H.T. Effects of heat treatment on the microstructures and magnetic properties of Co28Fe28Ni19Si13B12 high-entropy amorphous toroidal core. J. Alloy Compd. 2024, 981, 173713. [Google Scholar] [CrossRef]
- Li, Z.; Gu, Y.; Pan, M.X.; Wang, C.X.; Wu, Z.Y.; Hou, X.L.; Tan, X.H.; Xu, H. Tailoring AC magnetic properties of FeCoNi(MnSi)x (0 ≤ x ≤ 0.4) high-entropy alloys by the addition of Mn and Si elements. J. Alloy Compd. 2019, 792, 215–221. [Google Scholar] [CrossRef]
- Shen, R.R.; Ström, V.; Efsing, P. Spatial correlation between local misorientations and nanoindentation hardness in nickel-base alloy 690. Mater. Sci. Eng. A 2016, 674, 171–177. [Google Scholar] [CrossRef]
- Deng, Q.; Tang, Y.J.; Tan, Y.F.; Tan, X.H.; Yang, Y.; Xu, H. Effect of grain boundary character distribution on soft magnetic property of face-centered cubic FeCoNiAl0.2 medium-entropy alloy. Mater. Charact. 2020, 159, 110028. [Google Scholar] [CrossRef]
- Herzer, G. Modern soft magnets: Amorphous and nanocrystalline materials. Acta Mater. 2013, 61, 718–734. [Google Scholar] [CrossRef]
- Tang, Y.J.; Sun, S.B.; Lv, M.X.; Zhu, J.X.; Tan, Y.F.; Tan, X.H.; Yang, Y.; Xu, H. Effect of Ho addition on AC soft magnetic property, microstructure and magnetic domain of FeCoNi(CuAl)0.8Hox (x = 0–0.07) high-entropy alloys. Intermetallics 2021, 135, 107216. [Google Scholar] [CrossRef]
- Wu, Z.Y.; Wang, C.X.; Zhang, Y.; Feng, X.M.; Gu, Y.; Li, Z.; Jiao, H.S.; Tan, X.H.; Xu, H. The AC soft magnetic properties of FeCoNixCuAl (1.0 ≤ x ≤ 1.75) high-entropy alloys. Materials 2019, 12, 4222. [Google Scholar] [CrossRef] [PubMed]
- Chang, T.; Zou, C.M.; Zhu, D.D.; Wang, X.H.; Wei, Z.J.; Wang, H.W.; Fang, N.; Chen, J.H. The evolution of microstructure, micromechanical and magnetic properties of FeCoNiAlSi alloys with peritectic structure processed by high-pressure solidification. J. Alloys Compd. 2022, 920, 165958. [Google Scholar] [CrossRef]
- Basso, A.; Toda-Caraballo, I.; San-Martín, D.; Caballero, F.G. Influence of cast part size on macro-and microsegregation patterns in a high carbon high silicon steel. J. Mater. Res. Technol. 2020, 9, 3013–3025. [Google Scholar] [CrossRef]
- Thapliyal, S.; Agrawal, P.; Agrawal, P.; Nene, S.S.; Mishra, R.S.; McWilliams, B.A.; Cho, K.C. Segregation engineering of grain boundaries of a metastable Fe-Mn-Co-Cr-Si high entropy alloy with laser-powder bed fusion additive manufacturing. Acta Mater. 2021, 219, 117271. [Google Scholar] [CrossRef]
- Li, X.; Hu, B.; Guo, Q.Y.; Wu, X.; Sui, H.; Xiang, L.; Luo, H.W. Characterizing changes in microstructures, mechanical and magnetic properties of non-oriented silicon steel due to pulsed current. Mater. Charact. 2024, 211, 113904. [Google Scholar] [CrossRef]
- Jiao, H.T.; Xu, Y.B.; Zhao, L.Z.; Misra, R.D.K.; Tang, Y.C.; Liu, D.J.; Hu, Y.; Zhao, M.J.; Shen, M.X. Texture evolution in twin-roll strip cast non-oriented electrical steel with strong Cube and Goss texture. Acta Mater. 2020, 199, 311–325. [Google Scholar] [CrossRef]
- Liu, H.T.; Schneider, J.; Li, H.L.; Sun, Y.; Gao, F.; Lu, H.H.; Song, H.Y.; Li, L.; Geng, D.Q.; Liu, Z.Y.; et al. Fabrication of high permeability non-oriented electrical steels by increasing < 0 0 1> recrystallization texture using compacted strip casting processes. J. Magn. Magn. Mater. 2015, 374, 577–586. [Google Scholar]
- Fang, F.; Zhang, Y.X.; Lu, X.; Wang, Y.; Lan, M.F.; Yuan, G.; Misra, R.D.K.; Wang, G.D. Abnormal growth of {100} grains and strong Cube texture in strip cast Fe-Si electrical steel. Scripta Mater. 2018, 147, 33–36. [Google Scholar] [CrossRef]


| Alloys | Region | Fe (at%) | Co (at%) | Ni (at%) | Al (at%) | Si (at%) |
|---|---|---|---|---|---|---|
| x = 0.2 | GB | 27.06 ± 0.70 | 26.98 ± 0.31 | 24.61 ± 0.65 | 16.38 ± 0.54 | 4.96 ± 0.29 |
| grain | 23.54 ± 0.72 | 26.19 ± 0.35 | 26.27 ± 0.60 | 20.59 ± 0.43 | 3.40 ± 0.27 | |
| x = 0.4 | GB | 25.93 ± 0.58 | 26.89 ± 0.36 | 25.35 ± 0.56 | 12.43 ± 0.51 | 9.40 ± 0.36 |
| grain | 23.82 ± 0.63 | 25.87 ± 0.39 | 26.50 ± 0.62 | 14.98 ± 0.53 | 8.83 ± 0.38 | |
| x = 0.6 | GB | 26.54 ± 0.63 | 25.98 ± 0.41 | 22.74 ± 0.53 | 9.47 ± 0.44 | 15.27 ± 0.42 |
| grain | 25.63 ± 0.65 | 25.54 ± 0.38 | 23.18 ± 0.57 | 11.27 ± 0.56 | 14.38 ± 0.45 |
| Alloys | Ms (Am2/kg) | μi | μm | Hc (A/m) | Br (mT) | Pu (J/m3) | AC Ps (W/kg) 50 Hz | AC Ps (W/kg) 950 Hz |
|---|---|---|---|---|---|---|---|---|
| x = 0.2 | 108 | 274 | 1240 | 66 | 192 | 236 | 0.39 | 37.20 |
| x = 0.4 | 106 | 344 | 1334 | 51 | 132 | 205 | 0.33 | 32.37 |
| x = 0.6 | 101 | 296 | 785 | 110 | 193 | 286 | 0.40 | 34.92 |
Disclaimer/Publisher’s Note: The statements, opinions and data contained in all publications are solely those of the individual author(s) and contributor(s) and not of MDPI and/or the editor(s). MDPI and/or the editor(s) disclaim responsibility for any injury to people or property resulting from any ideas, methods, instructions or products referred to in the content. |
© 2024 by the authors. Licensee MDPI, Basel, Switzerland. This article is an open access article distributed under the terms and conditions of the Creative Commons Attribution (CC BY) license (https://creativecommons.org/licenses/by/4.0/).
Share and Cite
Tan, X.; Li, J.; Zhang, S.; Xu, H. Enhanced DC and AC Soft Magnetic Properties of Fe-Co-Ni-Al-Si High-Entropy Alloys via Texture and Iron Segregation. Metals 2024, 14, 1113. https://doi.org/10.3390/met14101113
Tan X, Li J, Zhang S, Xu H. Enhanced DC and AC Soft Magnetic Properties of Fe-Co-Ni-Al-Si High-Entropy Alloys via Texture and Iron Segregation. Metals. 2024; 14(10):1113. https://doi.org/10.3390/met14101113
Chicago/Turabian StyleTan, Xiaohua, Junyi Li, Shiqi Zhang, and Hui Xu. 2024. "Enhanced DC and AC Soft Magnetic Properties of Fe-Co-Ni-Al-Si High-Entropy Alloys via Texture and Iron Segregation" Metals 14, no. 10: 1113. https://doi.org/10.3390/met14101113