Abstract
Reducing the saturation magnetostriction is an effective way to improve the performance of soft magnetic materials and reduce core losses in present and future applications. The magnetostrictive properties of binary Fe-based alloys are investigated for a broad variety of alloying elements. Although several studies on the influence of Cu-alloying on the magnetic properties of Fe are reported, few studies have focused on the effect on its magnetostrictive behavior. High pressure torsion deformation is a promising fabrication route to produce metastable, single-phase Fe-Cu alloys. In this study, the influence of Cu-content and the chosen deformation parameters on the microstructural and phase evolution in the Fe-Cu system is investigated by scanning electron microscopy and synchrotron X-ray diffraction. Magnetic properties and magnetostrictive behavior are measured as well. While a reduction in the saturation magnetostriction λs is present for all Cu-contents, two trends are noticeable. λs decreases linearly with decreasing Fe-content in Fe-Cu nanocomposites, which is accompanied by an increasing coercivity. In contrast, both the saturation magnetostriction as well as the coercivity strongly decrease in metastable, single-phase Fe-Cu alloys after HPT-deformation.
1. Introduction
Soft magnetic materials play a key role in present and future energy generation, conversion and consumption. In recent years, nanocrystalline and amorphous soft magnetic materials have attracted increased interest, as they show enhanced energy efficiency. To enhance the efficiency of energy generation and transformation as well as of consumer devices, a minimization of the core losses of soft magnetic materials has to be addressed. Besides decreasing hysteresis and eddy current losses, a reduction in the magnetostriction λ has a beneficial effect on the performance of soft magnetic materials [1].
Magnetostriction is referred to as the change in the outer dimensions (e.g., the length) of a material, when it is exposed to an external magnetic field H. A principal magnetostrictive effect is the Joule magnetostriction, which describes the extension or contraction in the direction of the applied magnetic field. The relative change in length in one dimension is described by Δl/l = λ. The straining of the material originates from the asymmetrically shaped outer shell electron orbitals of each atom that align in an applied magnetic field H and cause a change in the material’s shape. This change in the shape in the direction of the applied field is accompanied by a contrary change in the material’s outer dimensions in perpendicular directions, resulting in an almost unchanged volume of the material [2,3].
For alloys and composites, either a strong enhancement or a reduction in λ can be obtained, depending on the respective material combination. The magnetostrictive behavior of Fe can be tuned by the substitution of small amounts of Fe with non-ferromagnetic metals (M) and the formation of Fe-rich Fe-M alloys. A well-known candidate is Ga, which leads to a strong enhancement of the saturation magnetostriction λs in polycrystalline Fe-Ga alloys [4]. An enhancement of λs has also been reported for Fe-Al and Fe-Cr alloys, which makes them potential candidates for sensor and actuator applications [5,6,7,8]. In contrast, an addition of 3 wt.% Ti or Mn additions of about 50 at.% lead to a decreasing saturation magnetostriction down to approximately 0 µm m−1 [9,10]. Low magnetostriction values of approximately 2 µm m−1 are reported in Fe-6.5 wt.% Si fabricated by a planar flow casting process and subsequent annealing [11]. As magnetostriction causes vibration in electric motors and transformers, which lead to a life span shortening, alloys with low λs are attractive for the application as stator cores [10].
In the case of the Fe-Cu system, the magnetostrictive behavior was investigated in multilayered thin film systems fabricated by sputtering techniques. Small values for λ between approximately −3 and +5 µm m−1 are reported by Avano et al. [12] and Kozono et al. [13], yet with different trends in the magnetostrictive behavior in dependence on the layer thickness. Magnetovolume effects are estimated to occur in face-centered cubic (fcc) Fe-Cu alloys with approximately 50 at.% Cu [14,15].
In contrast to most of the above-mentioned Fe-M systems, the Fe-Cu system possesses a large miscibility gap and only small amounts of Cu are soluble in Fe in the equilibrium state. Thus, new fabrication routes are necessary to enhance the solubility of Cu in Fe and to achieve a single-phase structure. Potential fabrication routes are mechanical alloying, vapor quenching and deposition methods [14,15,16,17]. Depending on the respective production route, body-centered cubic (bcc) single-phase alloys with up to 45 at.% Cu dissolved in the Fe-matrix can be fabricated [17]. A promising method is the application of high-pressure torsion (HPT) deformation, a method of severe plastic deformation (SPD). Grain refinement down to the nanocrystalline regime is achieved by applying shear strain under hydrostatic pressure. In addition, partial amorphization, deformation induced phase transformations and texture formation can be achieved, making HPT a powerful method to tailor mechanical and functional properties [18]. HPT-deformation has been reported to be an effective fabrication route for metastable, single-phase Fe-Cu nanocomposites with up to 25 at.% Cu dissolved in the Fe-matrix [19]. In addition, HPT-deformation has been reported as a powerful method to tailor the magnetic properties of soft and hard magnetic materials [20,21].
In this study, we present the influence of the Cu-content and the chosen fabrication parameters on the microstructural and phase evolution in the Fe-Cu system as well as on its magnetic properties with a focus on the saturation magnetostriction λs.
2. Materials and Methods
Commercially available powders of Fe (MaTeck, Juelich, Germany, −100 +200 mesh, 99.9%) and Cu (Alfa Aesar, Ward Hill, MA, USA, −170 +400 mesh, 99.9%) were used as starting materials. To prevent oxidation, the powders were stored and handled in an Ar-filled glove box. Pure Fe and powder blends with a nominal Cu-content of 5, 15 and 30 at.% were compacted using an HPT device with a pressure of 5 GPa, resulting in dense, bulk samples with a nominal diameter of 8 mm and approximate height of 1 mm. The powder blends were sealed in a customized, Ar-filled container to prevent oxidation during transport between the glove box and HPT for subsequent consolidation.
The pure Fe sample was deformed for 20 rotations with a nominal pressure of 7 GPa at room temperature (RT). In the case of all powder blends, HPT-deformation was conducted at two different temperatures. In a first deformation step, the samples were deformed for 50 rotations at 500 °C and a nominal pressure of 4 GPa. The following second deformation step was conducted at RT with an applied pressure of 5 GPa with up to 50 rotations. The more elaborate deformation process is a necessity to enhance the amount of Cu dissolved in the Fe-matrix. A detailed description of the used HPT-setup is given in [18].
To show that the resulting magnetostrictive properties are independent from the distinct execution of the HPT-process and demonstrate that only the applied shear deformation has to be high, one sample with 15 at.% Cu-content (marked with *) was deformed using a different two-step process. In a first step, the powder blend was consolidated and deformed for 10 rotations at RT in a larger HPT tool, resulting in an HPT sample with a diameter of ~30 mm and a thickness of ~6 mm. From this large HPT sample, a strip with a thickness of 3 mm was cut out at the disc center. A new HPT sample with a diameter of 6 mm was cut out by electrical discharge machining at a radial position of 5 mm of the initial HPT disc. The axial direction of the cut-out disc for the second deformation step was tangential direction of the initial HPT sample. A schematic illustration of the sample preparation for this two-step procedure is shown in Figure 1a. In a second step, the cut-out sample was HPT-deformed for 100 rotations at 300 °C and a nominal pressure of 5 GPa. With the exception of the HPT-deformation conducted on the large HPT tool, all deformations were conducted with a rotational speed of 1.2 min−1. A summary of the deformation parameters is given in Table 1.
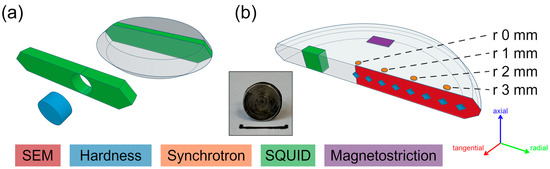
Figure 1.
(a) A schematic illustration of the sample preparation for the two-step deformation process with the first deformation step conducted on the big HPT-tool. From the obtained big sample, a strip (green) was cut out, from which the new sample (blue disc) for the second HPT-deformation step was fabricated. (b) A schematic illustration of a bisected small HPT disc with the areas, where measurements were conducted, marked as colored surfaces. The color code of the captions refers to the colored surfaces. The inset shows a sample after HPT-deformation. The black bar is in the size of 10 mm. The orthogonal reference system “axial–radial–tangential” refers to (a,b). The radial positions are highlighted.

Table 1.
Summary of the HPT-deformation parameters of all investigated Fe-Cu compositions.
Microstructural characterizations were carried out using scanning electron microscopy (SEM, LEO 1525, Carl Zeiss Microscopy GmbH, Oberkochen, Germany) in the tangential specimen direction using the back scattered electron (BSE) detection mode. The chemical composition was investigated using energy-dispersive X-ray spectroscopy (EDS; XFlash 6-60, Bruker, Berlin, Germany mounted on SEM TESCAN Magna, Brno, Czech Republic) with the software package Esprit 2.3 (Bruker). Forty spot measurements of the chemical composition at a radial position of 2 mm were conducted and the chemical mean composition was calculated.
Vickers hardness measurements were conducted in the tangential disc direction along the sample radius with a step-size of 0.25 mm (Micromet 5102, Buehler). With the exception of Fe85Cu15 No. 2, hardness measurements for all specimens were conducted with a load of HV 0.5 (0.5 kg load weight). Fe85Cu15 No. 2 was measured with a load of HV 0.3 (0.3 kg load weight). The determined hardness values were averaged for 2 mm ≤ r ≤ 3.5 mm.
After each processing step, the HPT-deformed samples were bisected for subsequent microstructural and magnetic characterization, as schematically illustrated in Figure 1b. The areas where measurements were conducted are highlighted.
To investigate the appearance of phases and the evolution of the crystal structures dependent on the applied deformation, synchrotron wide-angle X-ray scattering (WAXS) measurements were conducted on selected specimens in transmission mode with the beam in the axial disc direction. All investigated HPT discs were screened in the radial direction with a step size of 1 mm or less. For the measurements conducted at beamline P21.2 at PETRA III (DESY, Hamburg), a photon energy of 60 keV and a beam size of 0.2 × 0.2 mm2 were used. The recording of the diffraction patterns was conducted using a Varex XRD 4343 flat-panel detector. A photon energy of 87.1 keV and a beam size of 0.5 × 0.5 mm2 were used for the WAXS measurements conducted at beamline P07B and a Perkin Elmer XRD 1621 flat-panel detector (Waltham, MA, USA) was used for data acquisition. The azimuthal integration of all measurements was conducted using the pyFAI software package (version 0.22.0a10) [22]. For data evaluation, theoretical reference patterns from the Crystallography Open Database (COD) were used (Fe: COD 9008536, Cu: COD 9013014).
Hysteresis measurements were conducted using a superconducting quantum interference device (SQUID) magnetometer (Quantum Design MPMS-XL-7, Quantum Design Inc., San Diego, CA, USA) with the operating software MPMSMultiVu (version 1.54). SQUID specimens with an approximate base of 1.2 × 0.8 mm2 (radial × tangential) were cut out of the deformed HPT disc at a radial position of ~2 mm. All hysteresis measurements were conducted at 300 K with magnetic fields up to 40 kOe (3183 kA m−1), being applied in the radial disc direction. For the determination of the saturation magnetization Ms, the mass magnetization M was plotted over the inverse applied magnetic field H−1 and the theoretical Ms at H−1 = 0 was determined by a linear fit.
For the determination of the magnetostrictive behavior, the surface of a bisected HPT sample (see Figure 1b) was polished. The magnetostrictive strain λ in dependence on the applied magnetic field H were determined using strain gauges (HBM, type 1-LY11-0.6/120) with a graticule size of 0.6 × 1 mm2. Prior to the strain gauge application, the sample surface was polished. The strain gauges were placed onto the specimen with the graticule located at a radial position of approximately 1.5 to 2 mm and fixed with a glue (Z 70, HBM). Magnetostriction measurements were conducted within a Type B-E 30 electromagnet (Bruker) with conical poles (diameter 176 mm), providing a maximal field of 2.25 T (1791 kA m−1) in a constant air gap of 50 mm. To compensate the magnetoresistive behavior of the strain gauge graticule, a dummy strain gauge, taken from the same batch, was placed on a reference piece of non-magnetostrictive W, which was reported to exhibit a magnetostriction below 0.005 µm m−1 in an applied magnetic field of 2 T (1592 kA m−1) [23,24]. The specimen was placed above and parallel to the reference in the air gap of the magnet. Both specimens were placed inside a plastic case, protecting them from circulating air within the lab, which could have caused temperature changes and thus affected the magnetostriction measurements. Temperature monitoring inside the encapsulation was conducted to ensure a constant temperature inside the specimen chamber using a Yocto-thermocouple USB temperature sensor equipped with a type-K thermocouple. The strain gauges of both specimens were aligned in parallel and connected to a half Wheatstone bridge. Data acquisition and signal processing were conducted using a Quantumx MX410 amplifier and the software package CATMAN Easy V5.3. Measurements in an applied magnetic field range of 0 A m−1 ≤ H ≤ 1791 kA m−1 were conducted with the strain gauge graticules aligned either in parallel or perpendicular to the applied field direction. Measurements of the applied magnetic field were conducted using a Model 475 DSP Hall-probe (Lake Shore Cryotronics, Inc., Westerville, OH, USA). To determine the saturation magnetostriction λs, all values of the magnetostrictive strain, measured in parallel (λ‖) and perpendicular (λ⊥) to the magnetic field direction, above an applied field of 1 T (796 kA m−1) were averaged, yielding λs‖ and λs⊥, and λs was calculated according to Equation (1) [2]:
More details on the setup for the magnetostriction measurements can be found in [25].
3. Results and Discussion
3.1. Microstructural Characterization
The microstructure of Fe after 20 rotations as well as of all investigated Fe-Cu compositions after the second HPT-deformation step at a radial position of 2 mm are shown in Figure 2. Strong grain refinement down to the nanocrystalline regime was observed for all samples. Compared to pure Fe, the addition of Cu leads to a stronger grain refinement, which is in agreement with the reported microstructural evolution of pure elements and immiscible composites after SPD treatment [18]. In addition, the increasing Cu-concentration leads to a change in the microstructural morphology. For pure Fe, both samples with a nominal Cu-content of 5 at.% and sample Fe85Cu15 No. 1 *, nanocrystalline, equiaxed grains were observable. In contrast, a finely lamellar microstructure was present for Fe85Cu15 No. 2 and Fe70Cu30. An inhomogeneous, lamellar microstructure in Fe70Cu30 composites after a two-step deformation process has been reported by Bachmaier et. al., which shows resemblance with the layered microstructures in the present case [19]. Both samples with nominally 5 at.% Cu possessed similar microstructural refinement and grain sizes after the second deformation step. An explanation for the formation of the different microstructural morphology for both samples with nominally 15 at.% Cu might be the chosen two-step deformation process of the respective samples. While in the case of Fe85Cu15 No. 2, the shearing direction of the first and the second HPT-deformation steps was identical, the shearing direction of the second deformation step of the sample Fe85Cu15 No. 1 * was perpendicular to the shearing direction of the first deformation step. Bachmaier et al. showed that microstructural refinement can be accelerated in a two-step deformation process if the shearing direction of the second step is perpendicular to the first step’s shearing direction [19]. For the sample Fe85Cu15 No. 1 *, a similar two-step deformation process as reported in Ref. [19] was used, resulting in comparable microstructural morphology and grain refinement. In addition, for the sample Fe85Cu15 No. 2, the second deformation step was conducted for only one rotation, which also may have affected grain refinement and the microstructural morphology.
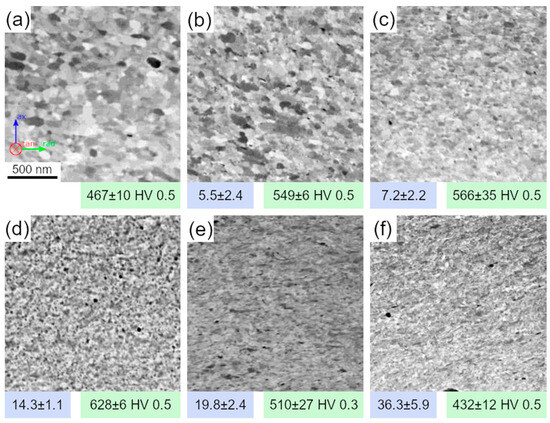
Figure 2.
BSE images of (a) Fe after 20 rotations as well as (b) Fe95Cu5 No. 1, (c) Fe95Cu5 No. 2, (d) Fe85Cu15 No. 1 *, (e) Fe85Cu15 No. 2 and (f) Fe70Cu30 after the second deformation step at a radial position of 2 mm. The Cu-content in at.% determined by EDS is given in the blue boxes. The mean hardness values are given in the green boxes. The scalebar in (a) refers to all microstructures in Figure 2. The coordinate system in (a) refers to all subsequent BSE images. All obtained hardness values have been previously published in ref. [25].
The chemical compositions in at.%, determined by EDS spot measurements at a radial position of 2 mm, are shown for all Fe-Cu specimens in the blue boxes in Figure 2. The differences in chemical composition of both samples of the nominal compositions Fe95Cu5 and Fe85Cu15 are attributed to the preparation of the powder blend prior to the fabrication process. The high standard deviation for Fe70Cu30 indicates a heterogeneous microstructure and a strong variation in the Cu-content, which is in agreement with the observed lamellar microstructure. The formation of an inhomogeneous, layered microstructure might also be attributed to the Cu-content of the respective samples. For Fe85Cu15 No. 2, the determined Cu-content at radius 2 mm was approximately 5 at.% higher than for No. 1 *. An inhomogeneous, layered microstructure after a two-step HPT-deformation process has been reported for the composition Fe70Cu30, while microstructures with equiaxed grains were observed for all other investigated compositions [19]. Although the same two-step deformation route, that was used for the fabrication of Fe85Cu15 No. 2 and Fe70Cu30, was used for both specimens with nominally 5 at.% Cu, equiaxed grains were observed after the second deformation process. Thus, the formation of an inhomogeneous, lamellar microstructure is expected to depend more on the Cu-content than on the chosen fabrication route and the formation appears in a composition range of approximately 20 to 35 at.% Cu.
The corresponding mean hardness value of each sample is given in the green boxes in Figure 2. Compared to pure Fe, Cu-addition up to 15 at.% led to an increasing trend in the samples’ mean hardness. An even higher Cu-concentration led to a decreasing mean hardness below the mean hardness value of pure Fe. The mean hardness values of both samples of Fe95Cu5 were in good accordance. In contrast, a strong variation in the mean hardness values of Fe85Cu15 No. 1 * and No. 2 was present. Comparable, but slightly lower hardness values for bulk, pure Fe after HPT-deformation are reported in the literature [20]. Hardness values for Fe-Cu composites show good agreement with the determined hardness values of Fe85Cu15 No. 1 * and Fe70Cu30. The lower mean hardness of Fe85Cu15 No. 2 might be attributed to the higher Cu-content of the sample (19.8 at.%) as its hardness value is between the hardness values of Fe-Cu composites with a nominal Cu-content of 15 and 30 at.% [19].
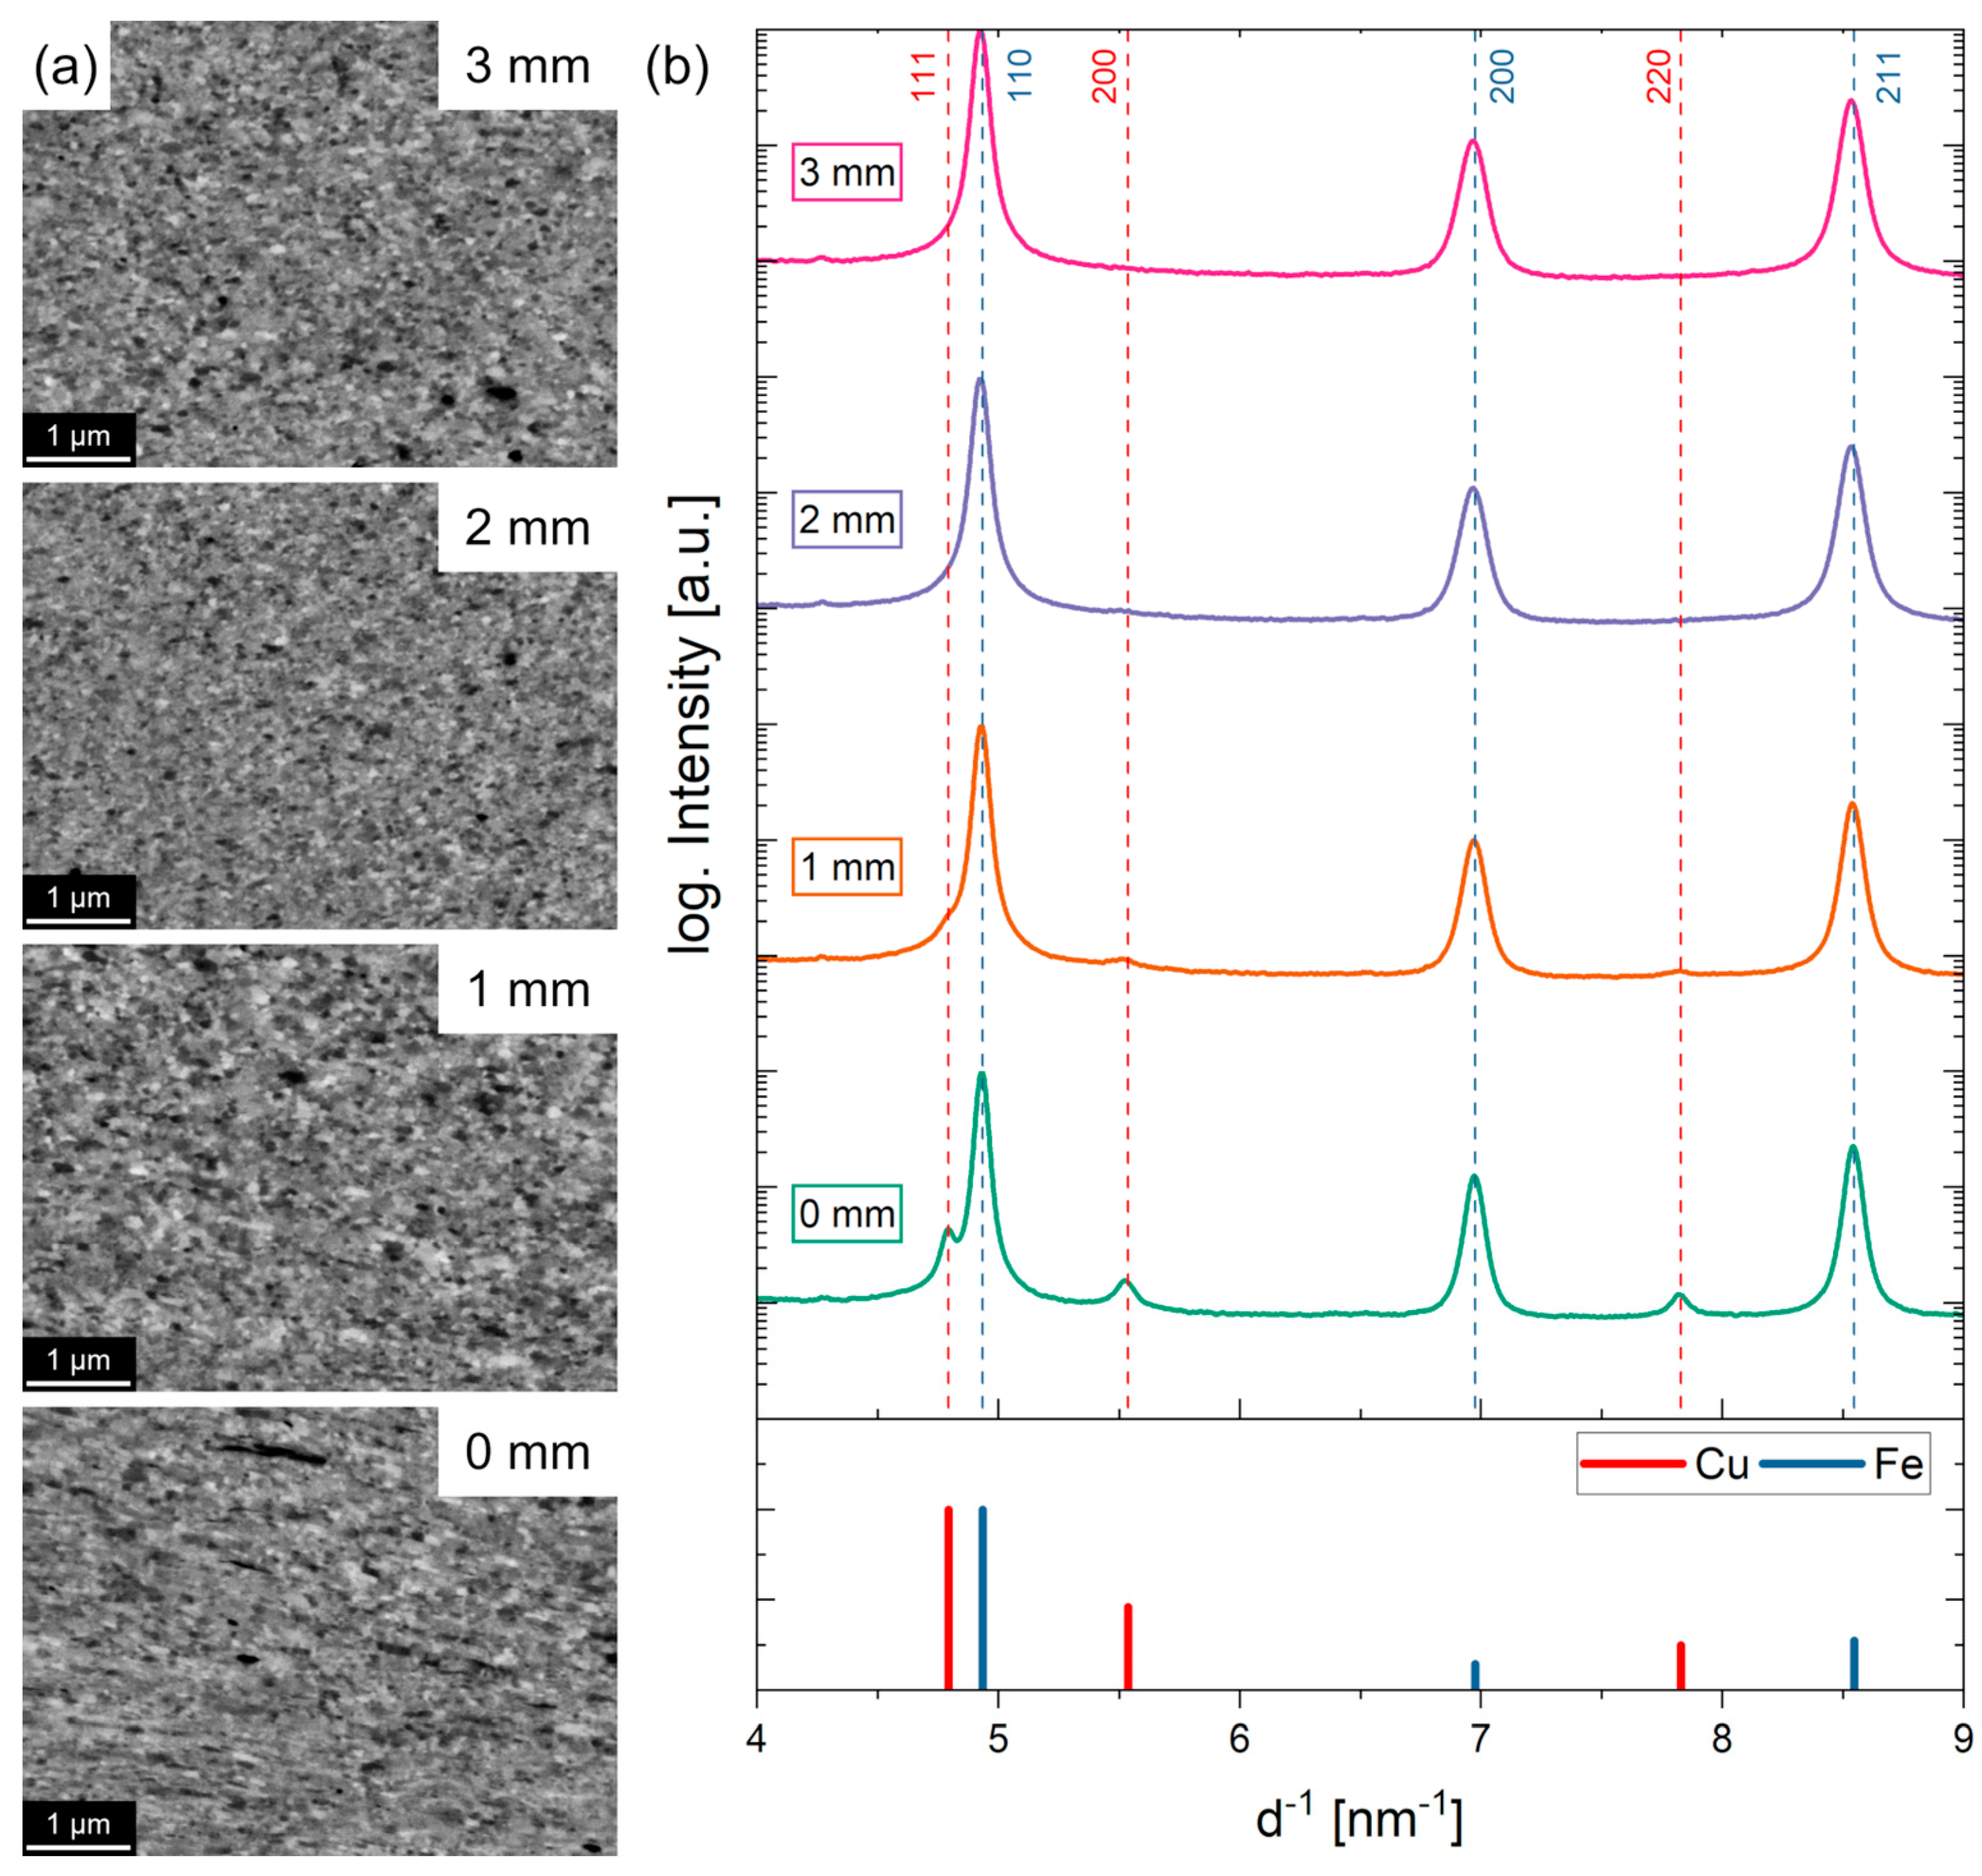
Figure 3a shows the microstructure in dependence on the radial position after the two-step deformation process of Fe95Cu5 No. 1. While a nanocrystalline microstructure was present for all radial positions, the microstructure became more equiaxed at outer radii. The corresponding WAXS patterns are illustrated in Figure 3b. Cu-peaks are visible at a radial position of 0 mm. With increasing radial position and thus applied torsional strain, the present Cu-peaks diminished. At the outer radial position (r ≥ 2 mm), only Fe-peaks were present, indicating that the Cu was dissolved in the Fe-matrix and a supersaturated solid solution with a single-phase matrix was formed.
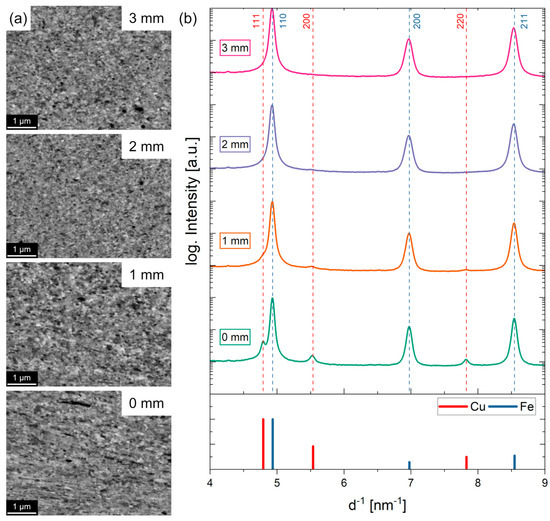
Figure 3.
(a) BSE images of Fe95Cu5 No. 1 after the second deformation step at a radial position of 0 mm, 1 mm, 2 mm and 3 mm. (b) The corresponding diffraction patterns. The positions and intensities of the reference patterns are indicated as colored bars. Measurements were carried out at DESY PETRA III at beamline P07B.
The microstructure of Fe95Cu5 No. 2 showed the same behavior along the sample’s radius. Stronger grain refinement and more equiaxed grains were present at outer radii, while a nanocrystalline microstructure was present at all radial positions. Even at the HPT disc center, no Cu-peak was observed in the corresponding WAXS patterns. An explanation for why no Cu-peaks were observed even in the disc center might be a slight misalignment of the sample disc in the anvil’s cavities during the second deformation step, which leads to more induced deformation in the disc center. This additional deformation might be enough to dissolve all present Cu in the Fe-matrix in the disc center.
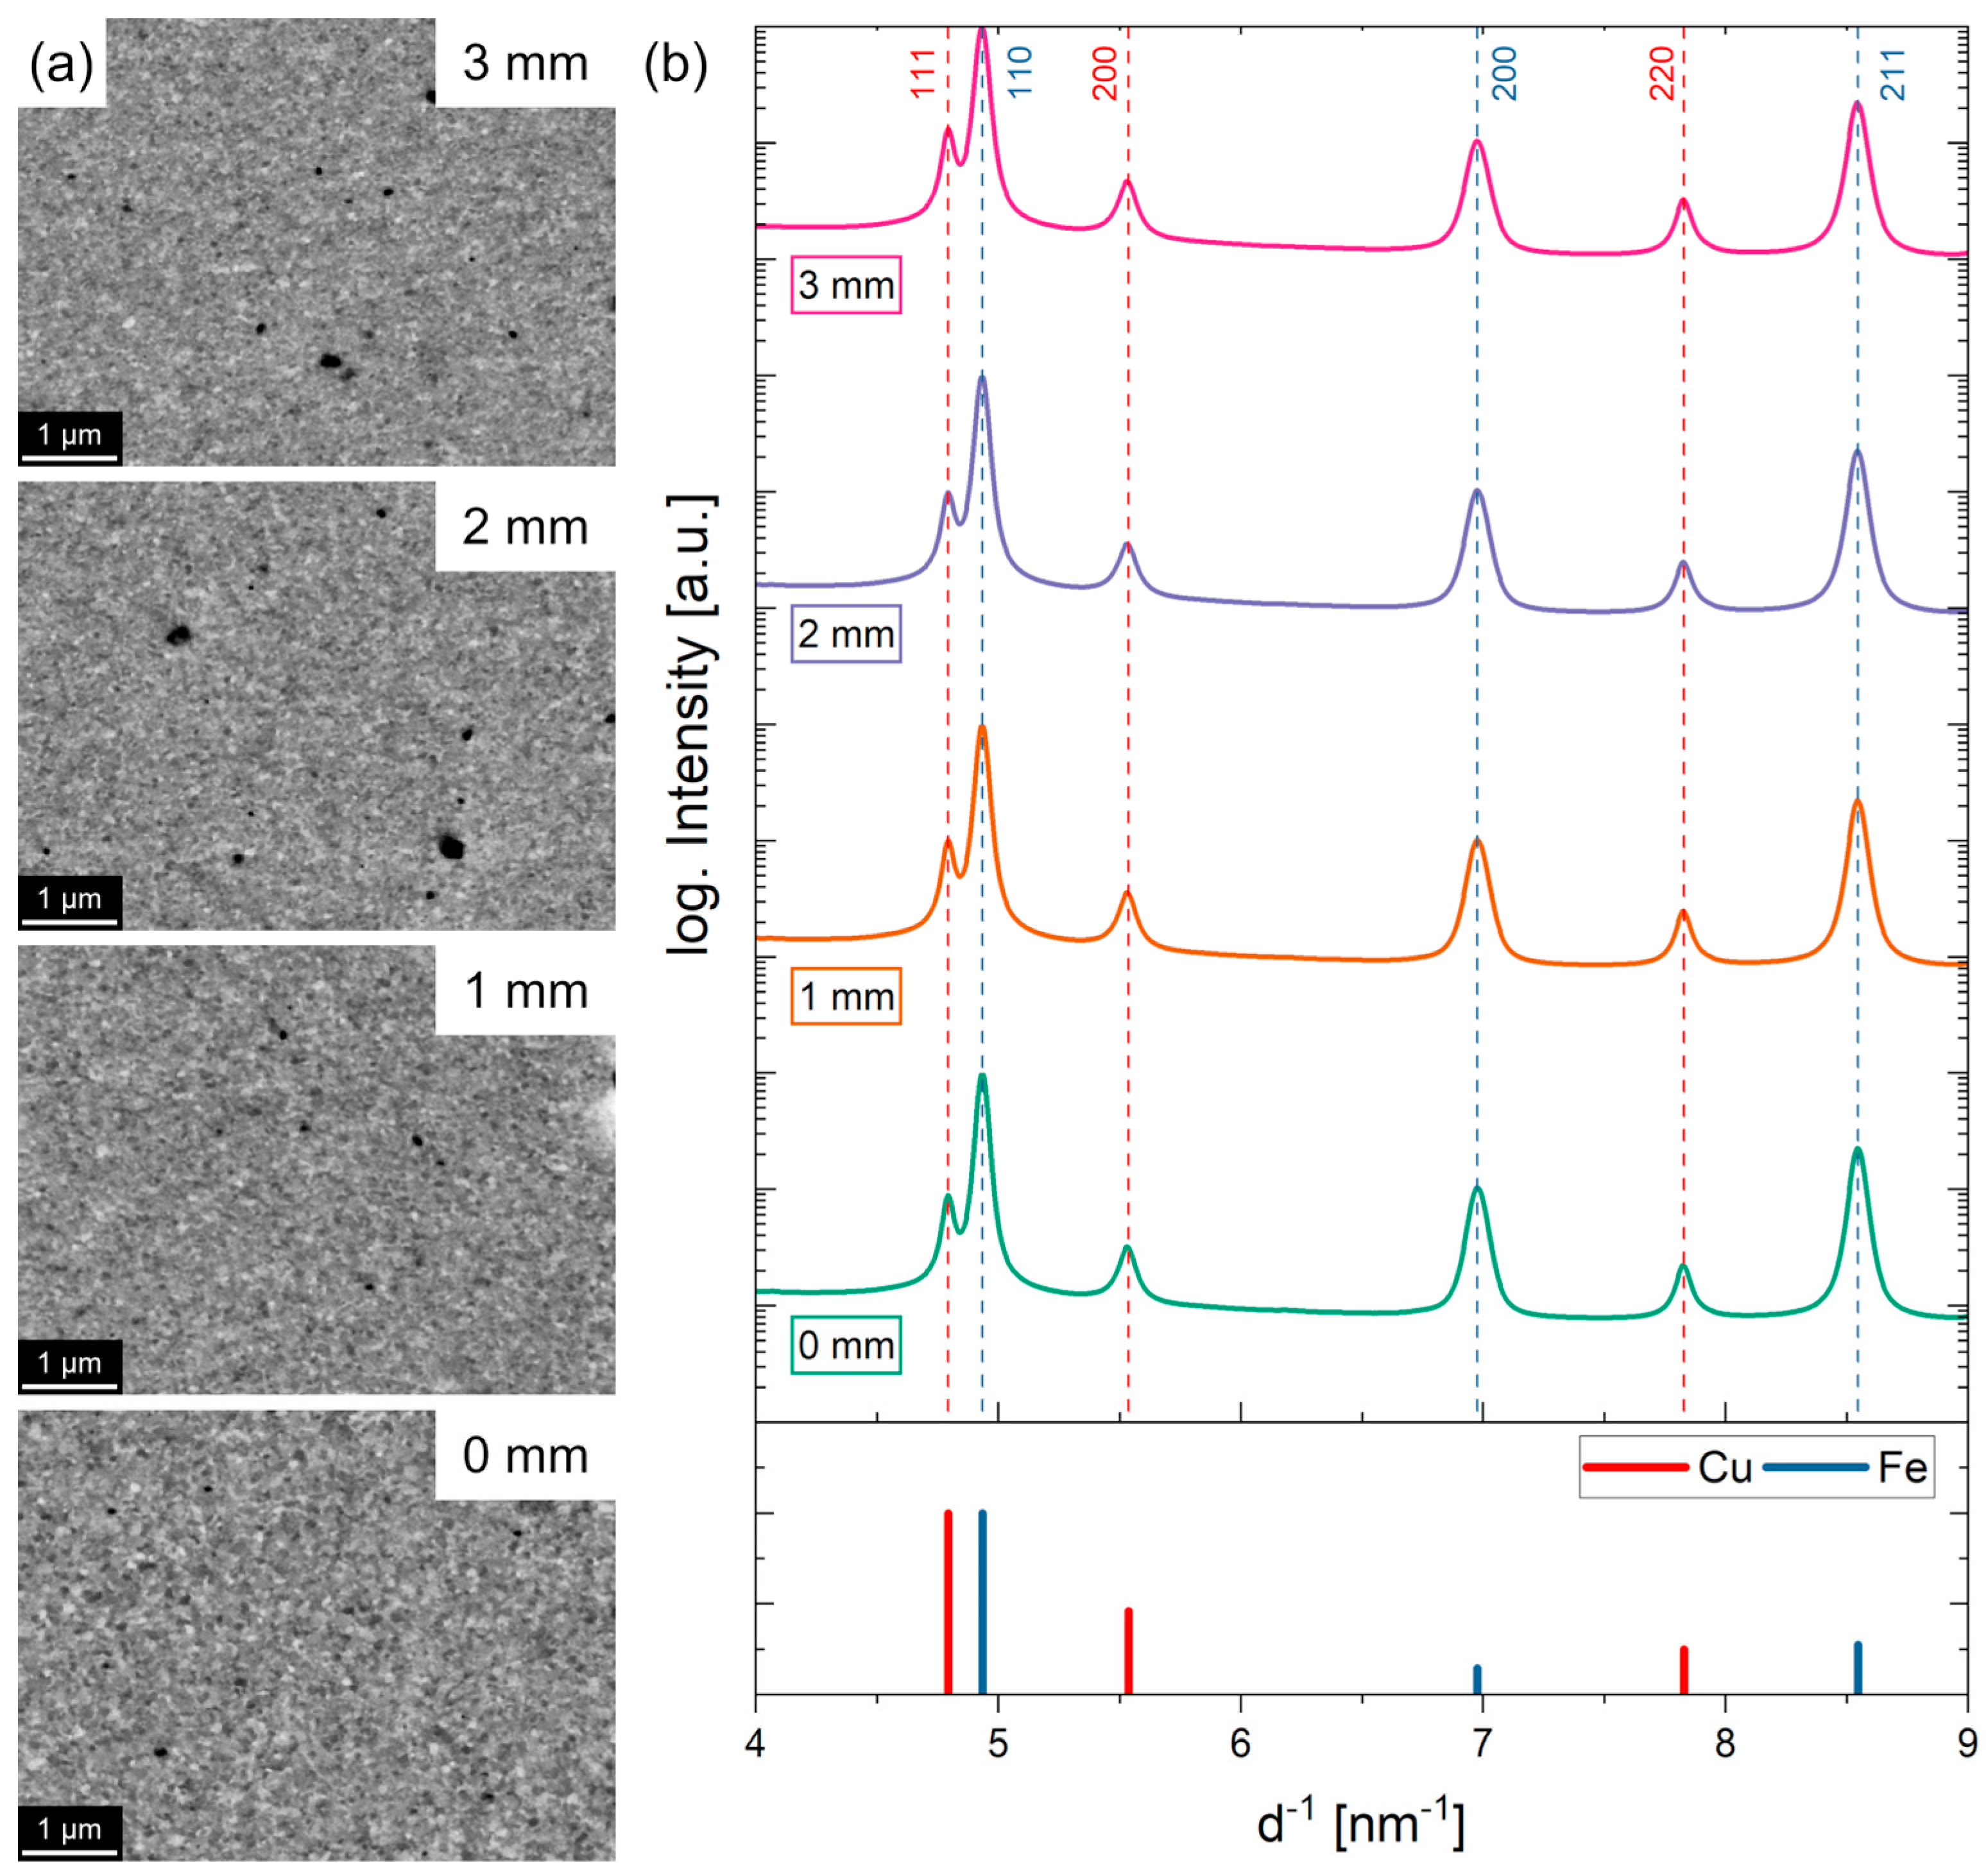
In Figure 4a, the microstructure of Fe85Cu15 No. 1 * in dependence on the radial position after the second deformation step are illustrated. Equiaxed grains and a nanocrystalline microstructure are visible at all radial positions. The formation of equiaxed grains at inner radii is attributed to the chosen sample fabrication route. The corresponding diffraction patterns, illustrated in Figure 4b, show fcc Cu- in addition to bcc Fe-peaks at all radial positions, indicating that the two-step deformation process at a Cu-concentration of approximately 15 at.% does not lead to a dissolution of Cu in the Fe-matrix. Instead, a Fe-Cu nanocomposite is formed.
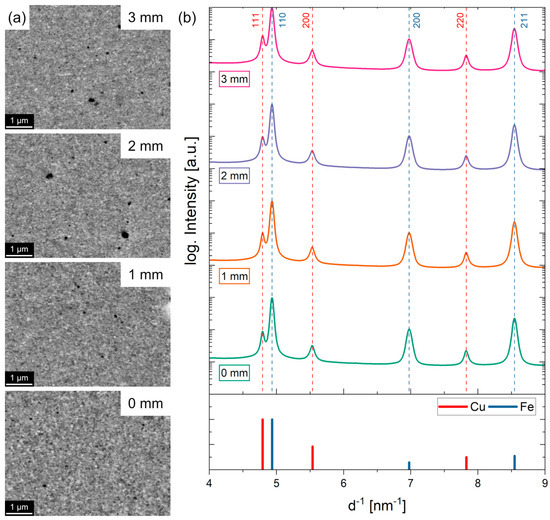
Figure 4.
(a) BSE images of Fe85Cu15 No. 1 * after the second deformation step at a radial position of 0 mm, 1 mm, 2 mm and 3 mm. (b) The corresponding diffraction patterns. The positions and intensities of the reference patterns are indicated as colored bars. Measurements were carried out at DESY PETRA III at beamline P21.2.
By applying Vegard’s law, the amount of Cu that is dissolved in the Fe-matrix by forming a supersaturated solid solution can be estimated from the shift of the Fe-peaks in the WAXS patterns according to Equation (2) [26]. aA and aB are the lattice parameters of component A (Fe) and B (Cu), respectively, and x is the mole fraction of component B:
For the estimation, the lattice constants of bcc Fe and fcc Cu were used from COD 9008536 and COD 9013014, respectively. For Cu, a “theoretical” bcc lattice constant was calculated for further calculations. For both specimens with a nominal Cu-content of 5 at.%, No. 1 and No. 2, the estimated Cu-content dissolved in Fe at a radial position of 2 mm due to HPT-deformation was 5.0 and 4.2 at.%, respectively. In comparison, only 0.6 at.% Cu dissolved in Fe were estimated at radius 2 for Fe85Cu15 No. 1 *. It is pointed out that the determined amounts of Cu dissolved in the Fe-matrix according to Vegard’s law are only approximations [26] and become visible by the comparison of the Cu-contents determined by EDS measurements compared to the dissolved Cu-content according to Vegard’s law, especially for Fe95Cu5 No. 2 (7.2 ± 2.2 at.% determined by EDS/4.2 at.% determined by Vegard’s law). No Cu-peaks were observed for Fe95Cu5 No. 2. Thus, the amount of Cu dissolved in Fe determined by Vegard’s law underestimates the actual amount of dissolved Cu in Fe.
The formation of single-phase bcc supersaturated solid solutions with up to 25 at.% Cu dissolved in the Fe-matrix by HPT-deformation is reported in [19]. In contrast, only a small fraction of Cu might be dissolved in Fe85Cu15 No. 1 *, as Cu-peaks at radius 2 mm are clearly visible and the shift of the Fe-peaks is small. In the present study, a higher number of rotations was applied in the second deformation step, but the deformation was conducted at a temperature of 300 °C. The formation of single-phase Fe-Cu alloys by HPT-deformation at elevated temperatures might be prevented as phase separation of metastable Fe-Cu alloys above 227 °C are reported in the literature [14,16]. A similar two-phase microstructure is assumed for Fe85Cu15 No. 2, as only one rotation could be conducted at RT and almost no shear deformation was applied.
In summary, the chosen deformation temperature, especially of the second deformation step, as well as the orientation of the shearing directions, play an important role in the formation of single-phase supersaturated solid solutions in Fe-Cu alloys.
3.2. Magnetic Characterization
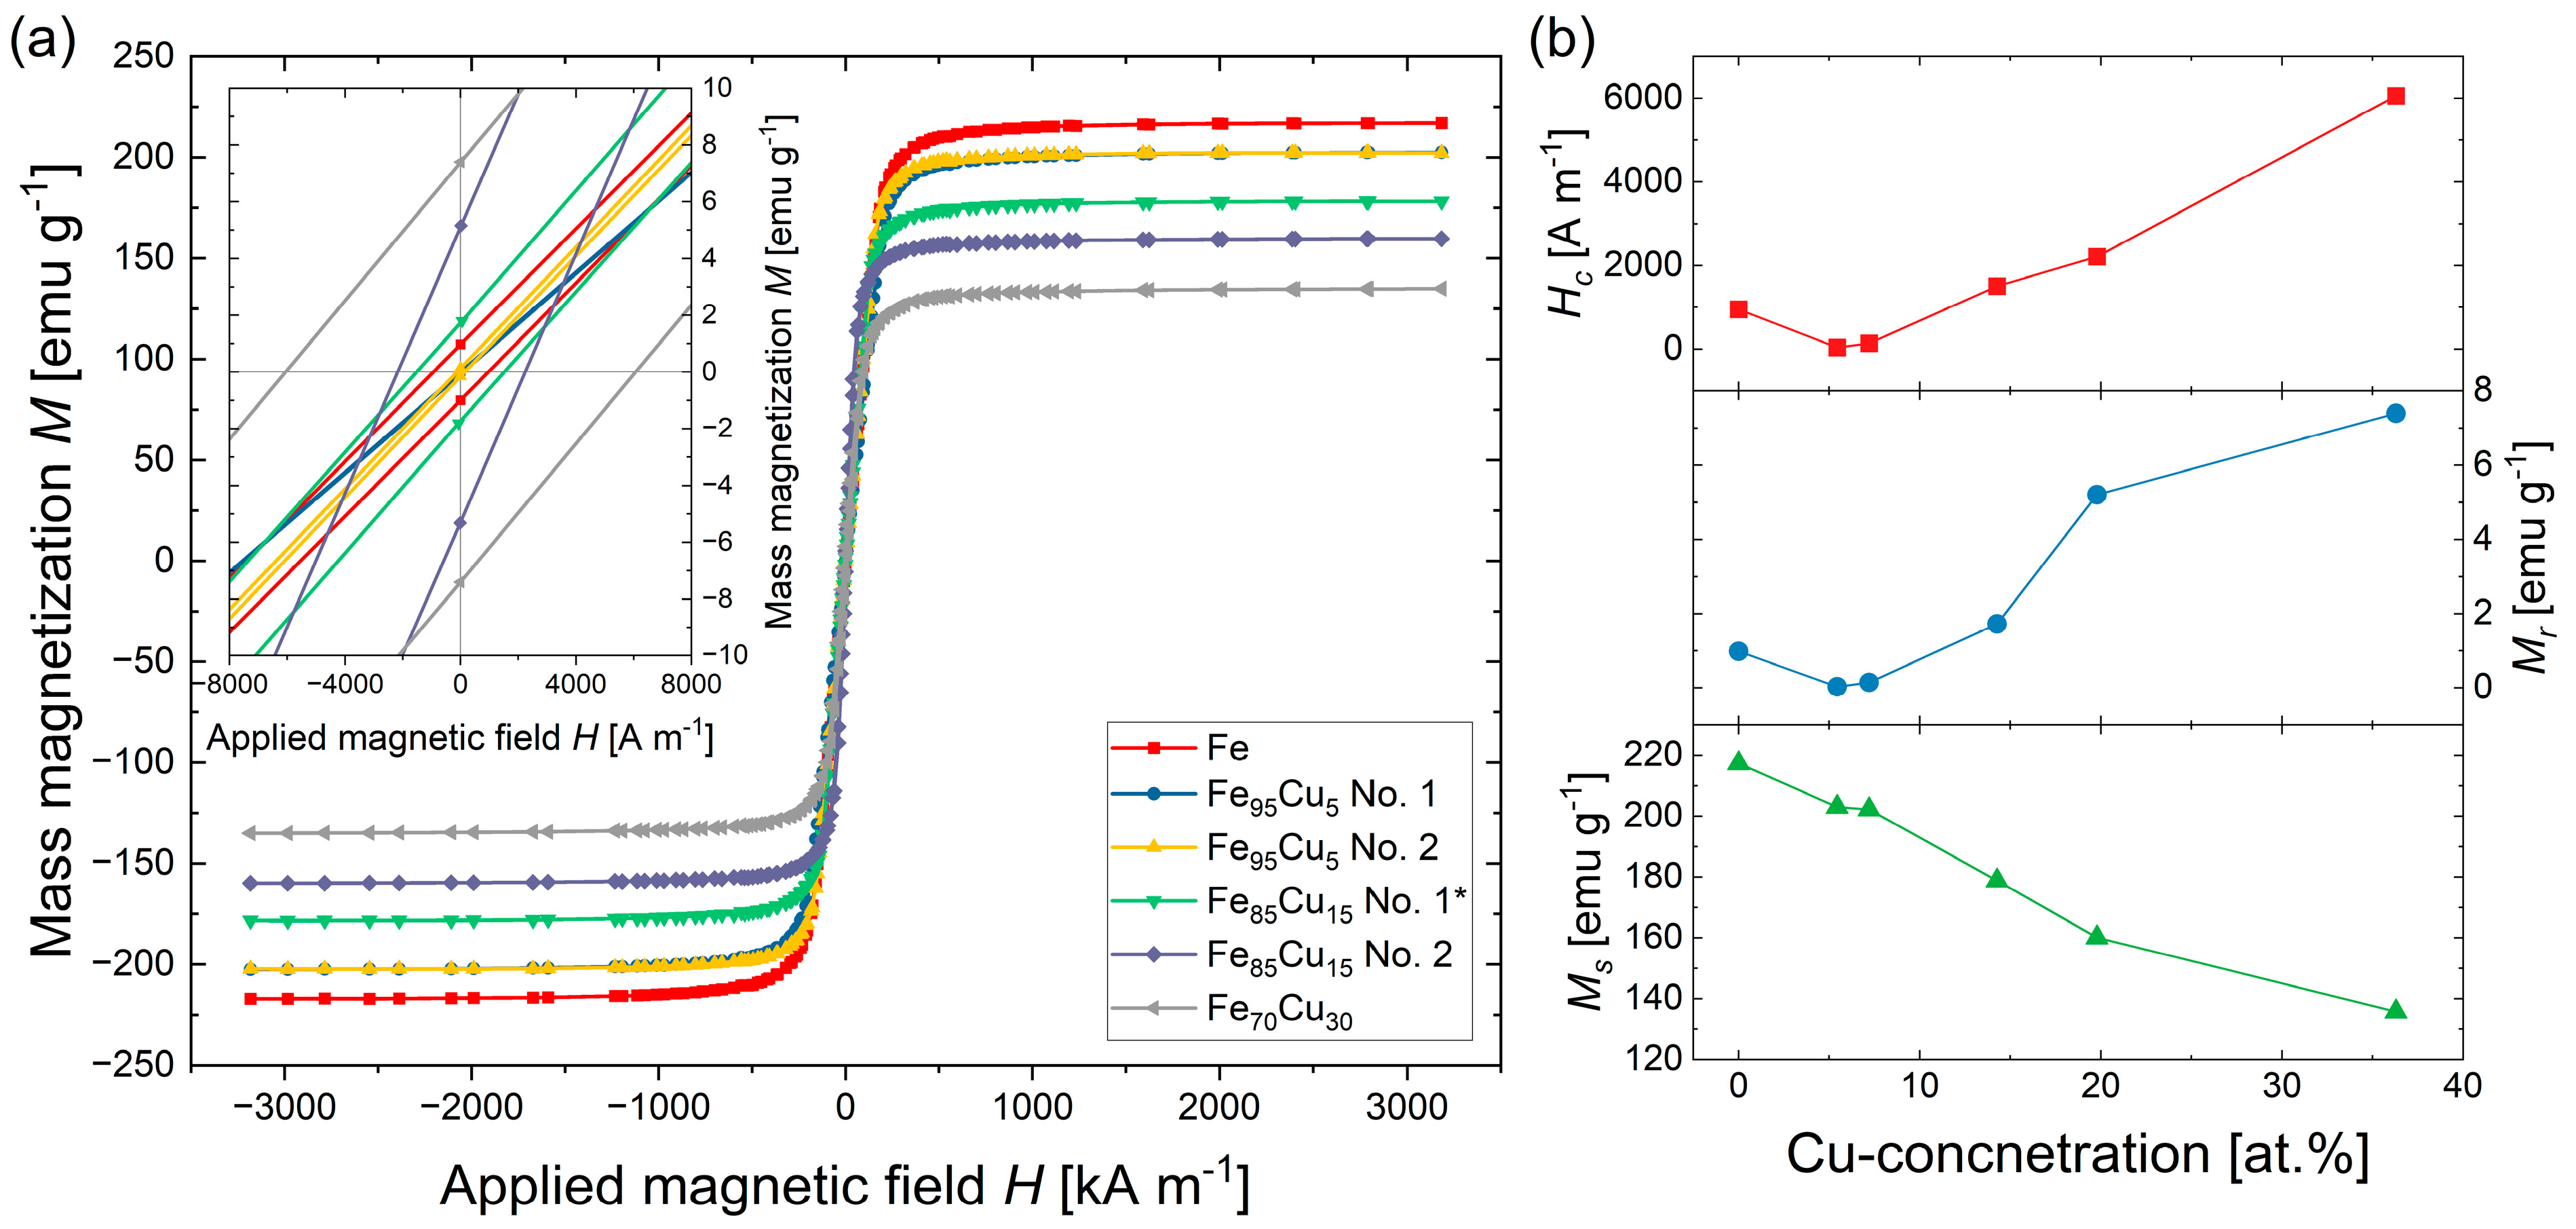
The magnetic properties of the processed Fe-Cu samples are summarized in Table 2. In Figure 5a, the magnetic hysteresis loops measured by SQUID magnetometry at 300 K are illustrated. The evolution of the magnetic key values coercivity Hc, remanence Mr and saturation magnetization Ms in dependence on the measured Cu-concentration is illustrated in Figure 5b. While the lowest values of Hc and Mr were measured for both samples containing nominally 5 at.% Cu, Ms showed a linear decrease with increasing Cu-content. The determined Ms of the deformed Fe-powder is in accordance with values for Fe reported in the literature [24,27]. With an increasing amount of Cu, Ms decreases from 217.3 emu g−1 for the deformed Fe-powder to 135.8 emu g−1 for Fe70Cu30, as illustrated in Figure 5b. By determining the ratio between Ms of the Fe-Cu samples related to the Ms-value of pure Fe, the Cu-content of each SQUID specimen was estimated and listed in comparison to the Cu-concentration determined by EDS in Table 2. With the exception of Fe85Cu15 No. 2, the amount of Cu determined using the Ms ratios shows very good agreement with the values measured by EDS. The deviation of the chemical composition of Fe85Cu15 No. 2, determined by EDS measurements and via Ms, is attributed to an inhomogeneous distribution of Cu in the specimen and different investigated specimen volumes for both measurement methods.
Table 2.
Coercivity Hc and saturation magnetization Ms measured in the radial direction and the saturation magnetostriction λs of the investigated Fe-Cu samples. The values of the Cu-content determined by Ms ratios are shown in comparison to the Cu-content determined by EDS (also shown in Figure 2). All values of λs have been previously published in ref. [25].

Figure 5.
(a) Hysteresis loops determined by SQUID magnetometry of the investigated Fe-Cu system after the second HPT-deformation step. The inset gives a detailed view of the intercepts of the hysteresis loops with the abscissa. (b) Evolution of coercivity Hc, remanence Mr and saturation magnetization Ms in dependence on the Cu-concentration.
Compared to pure Fe, the addition of small amounts of Cu led to a strong decrease in Hc from 954 A m−1 to 41 A m−1 and 140 A m−1 for Fe95Cu5 No. 1 and No. 2, respectively, as illustrated in Figure 5b. Further increases in the Cu-concentration led to an increase in Hc of 1508 A m−1 and 2209 A m−1 for Fe85Cu15 No. 1 * and No. 2, respectively, and up to 6059 A m−1 for Fe70Cu30. The results indicate that the dissolution of Cu in Fe and the formation of a single-phase supersaturated solid solution led to a decrease in Hc whereas the coercivity of Fe-Cu nanocomposites increased with an increasing amount of Cu in the nanocomposite phase. A reason for the decreasing coercivity of Fe95Cu5 No. 1 and No. 2, compared to pure Fe, might be the smaller grain size after the two-step deformation process (Figure 2a–c). The grain size D strongly affects Hc, as reported in [28]. While a reduction in grain size first led to an increase in coercivity by 1/D, a strong decrease in Hc was present for small grain sizes with a dependence on D6 and the lowest coercivities were achieved at grain sizes below 20 nm. In the present case, the grain sizes of pure Fe and Fe95Cu5 No. 1 and No. 2 decreased with increasing Cu-content (c.f. Figure 2a–c). The dependence of Hc on the grain size was estimated to depend on D6. Although even smaller grain sizes were present for higher Cu-concentrations (Figure 2d–f), a strong increase in Hc with increasing Cu-content was observable. A similar behavior has been reported in single-phase Co-Fe-Cu alloys with nominally 20 at.% Cu after annealing. Decomposition of the single-phase microstructure into a nanocomposite resulted in the formation of pinning centers, which led to an increasing coercivity [29]. In our study, the increase in Hc is also attributed to the nanocomposite formation, which leads to an high amount of phase boundaries acting as pinning sites.
A value for Hc of 1870 A m−1 is reported in [20] for bulk Fe after HPT-deformation at RT, which is twice as large as in the present case. Coercivity values of Fe-3 % Si and Fe-6.5 % Si after HPT-deformation were 700 A m−1 and 465 A m−1, respectively, which are clearly higher than the Hc values determined for Fe95Cu5 No. 1 and No. 2 [20]. In contrast to the present study, magnetic properties in [20] were determined on ring-shaped specimens using AC-hysteresis measurements.
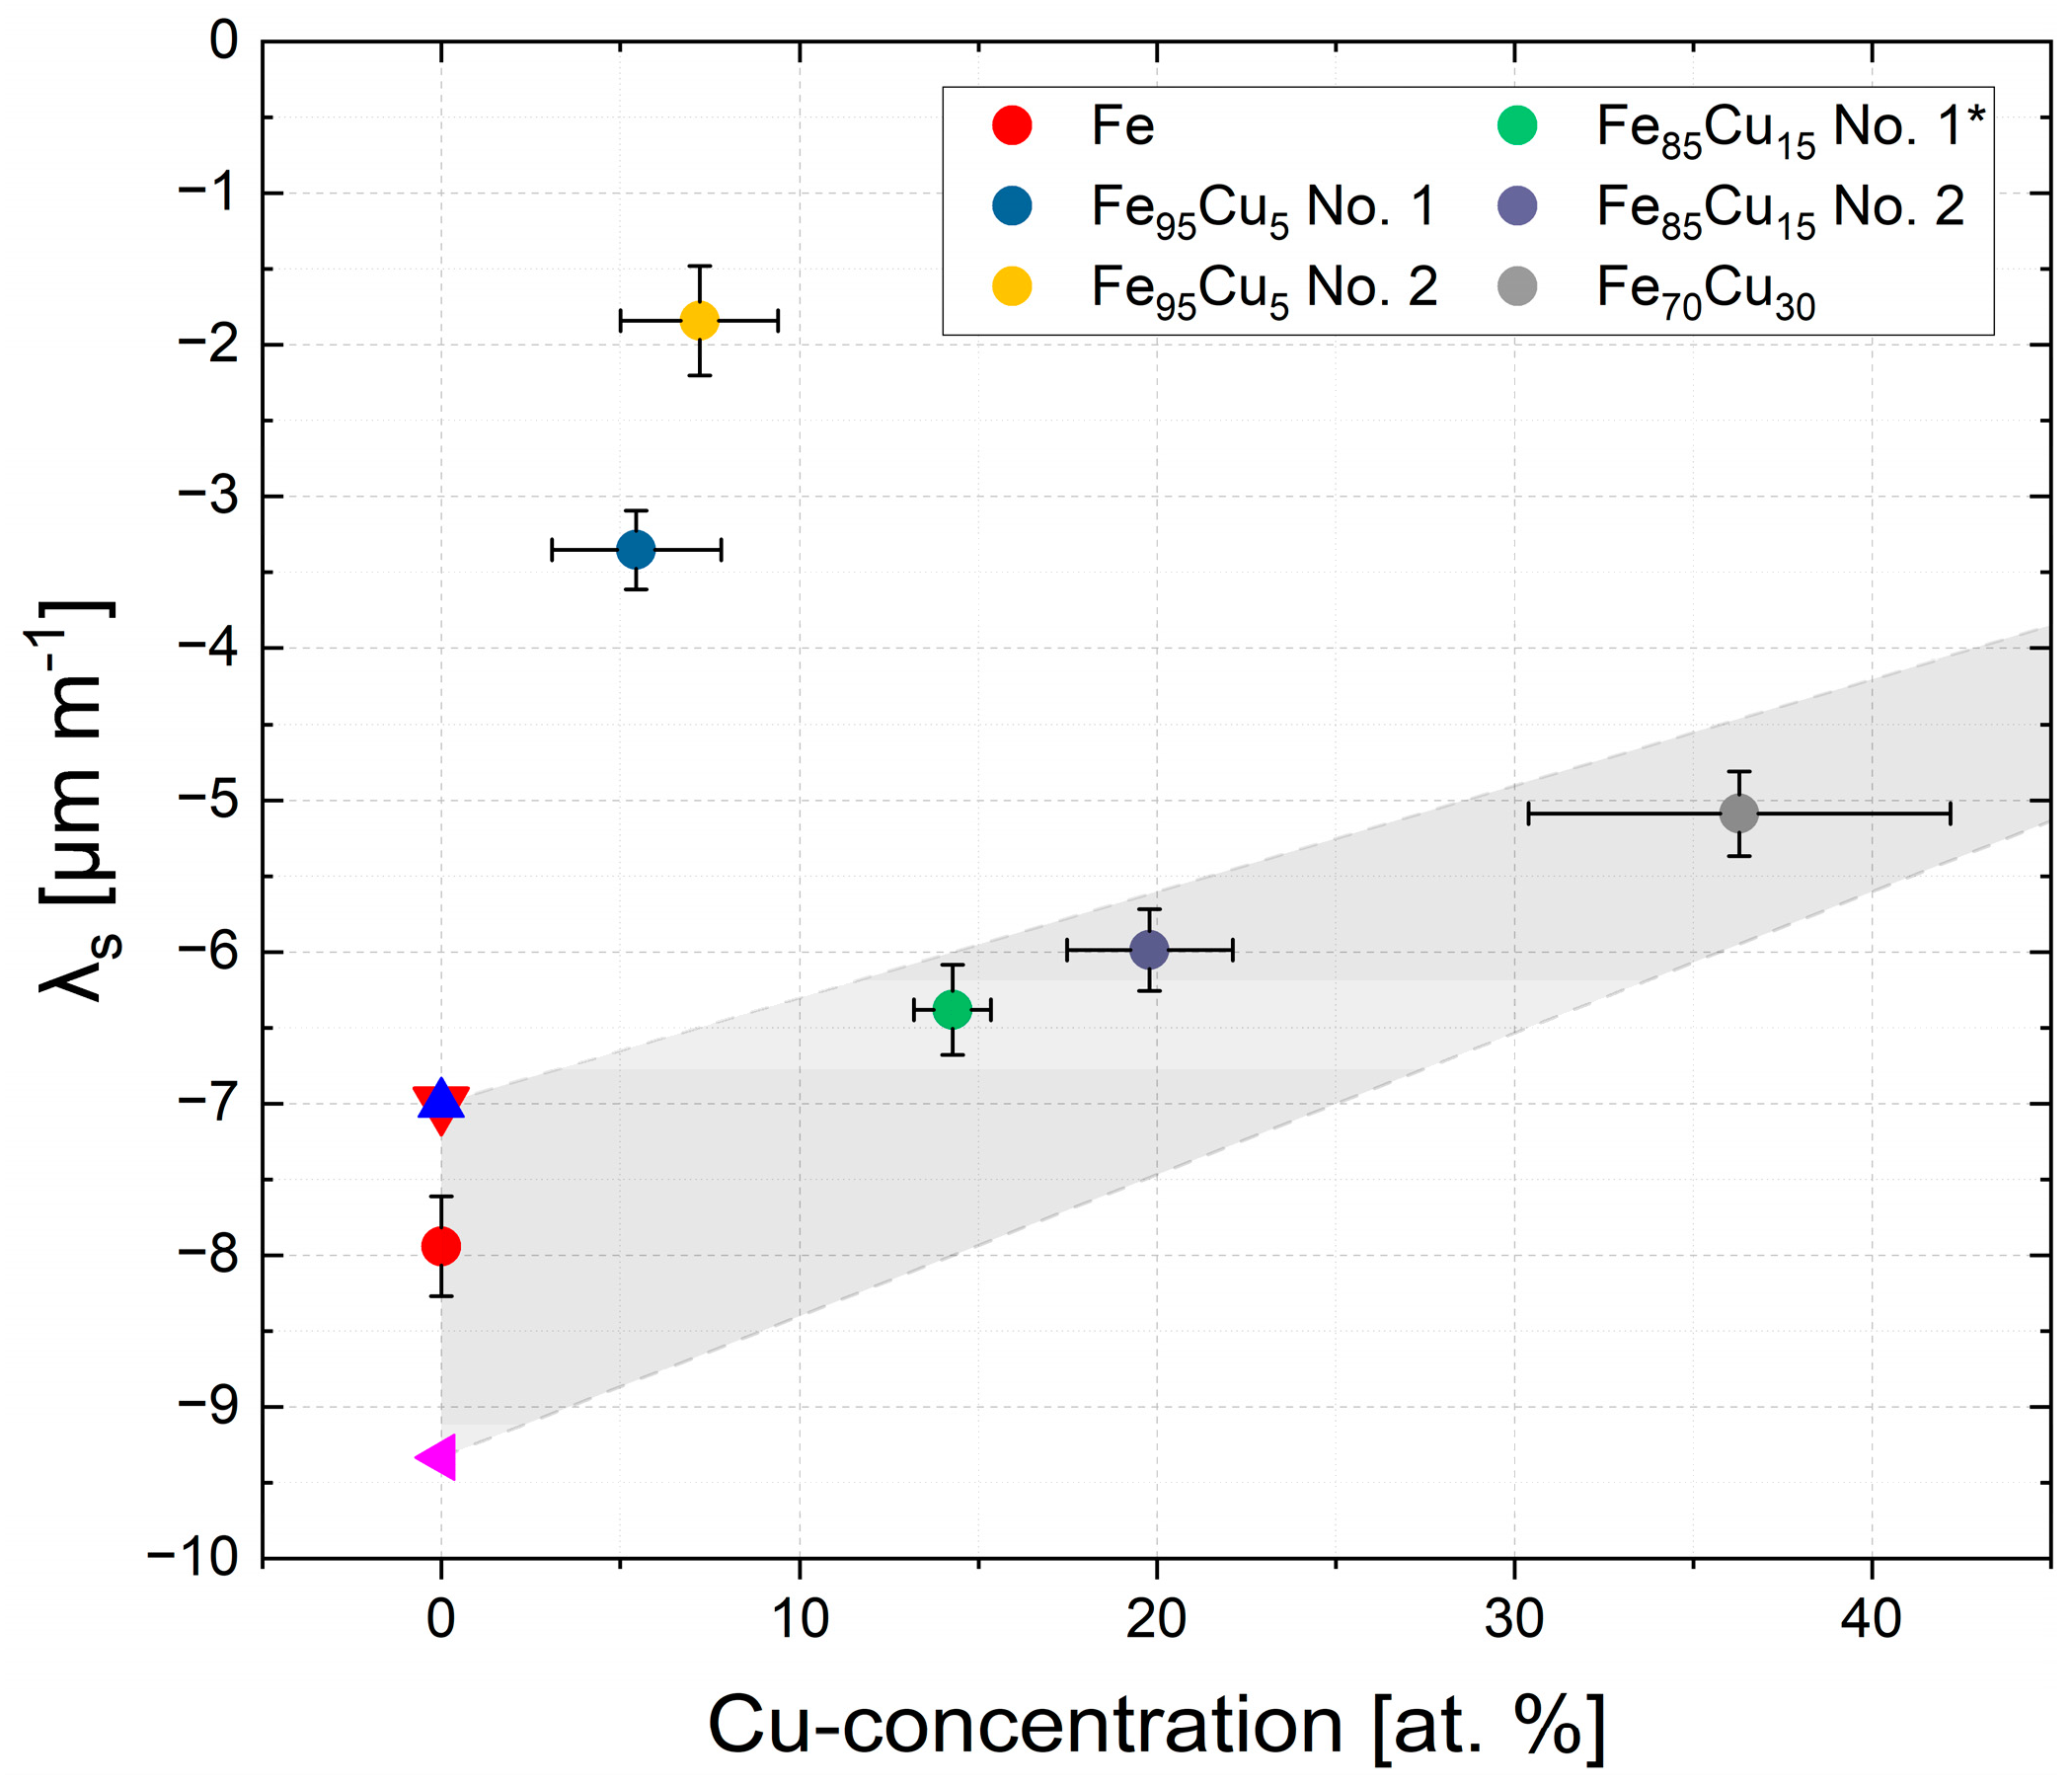
Figure 6 illustrates the determined values of the saturation magnetostriction λs and its dependence on the Cu-content determined by EDS measurements. The corresponding values are summarized in Table 2. The measured λs of Fe is in good agreement with the literature values of 7 µm m−1 and 9.3 µm m−1 for polycrystalline Fe, which are illustrated as colored triangles [2,24,27]. By assuming that the saturation magnetostriction of Cu is 0 µm m−1, a linear approximation of the magnetostrictive behavior, starting at the reference values of Fe, for Fe-Cu compositions in dependence on Cu-concentration are shown as the shadowed area enclosed by dashed lines in Figure 6. For Fe-Cu multilayered thin film systems with a high Cu-content, values of about 0 to 1 µm m−1 for λ are reported, which support the assumption of the linear approximation [12,13].
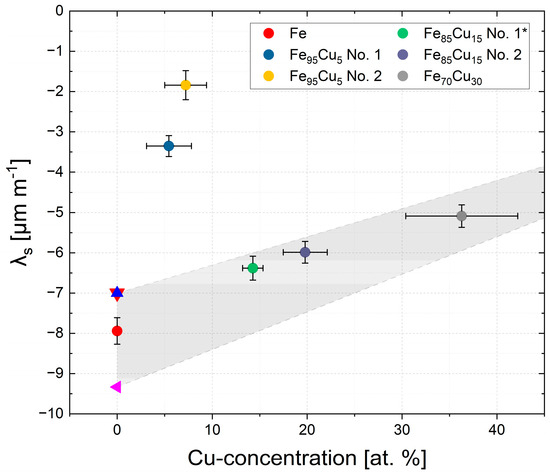
Figure 6.
Saturation magnetostriction λs and its dependence on the determined Cu-concentration. The blue, red and magenta triangles are reference values of λs for polycrystalline Fe [2,24,27]. The dashed lines, which enclose the gray area, are a linear approximation of λs in dependence on Cu-content, following a simple rule of mixture. All values of λs have been previously published in ref. [25].
Two trends in the magnetostrictive behavior are observable in Figure 6. For Fe-Cu nanocomposites with a nominal Cu-content of ≥15 at.%, a linear decrease in λs with increasing Cu-concentration is observable. The determined values of the saturation magnetostriction are in good agreement with a linear trend, as visible in Figure 6. In contrast, a strong decrease in λs is observable for the samples Fe95Cu5 No. 1 and No. 2. Both samples exhibit a single-phase microstructure. Thus, it can be concluded that the formation of a single-phase supersaturated solid solution leads to a strong decrease of the saturation magnetostriction in Fe-Cu alloys.
The values of the magnetostrictive behavior in Fe-Cu multilayered thin film systems are of the same order of magnitude as the presented results. Yet, in dependence on the thickness of the Fe- and Cu-layers and thus on the respective “effective” Cu-concentration, different trends for λ are reported, which are not in agreement with the behavior of λs shown in Figure 6 [12,13]. For a multilayered film system with a Cu-film thickness of 2 nm and a Fe-film thickness of 4 and 8 nm, a single-phase bcc structure is reported. The corresponding magnetostriction values are below −1 µm m−1 [13]. Although the Cu-content in this case is higher than in the investigated single-phase materials in the present case, these results indicate which values of λs could be achieved in bulk, single-phase Fe-Cu alloys with a Cu-content ≥ 20 at.%.
An improvement of soft magnetic properties is achieved by a reduction of the average magnetic anisotropy constant <K1> as well as of the magnetoelastic anisotropy Kσ. The average magnetic anisotropy <K1> can be reduced by a reduction in grain size below the basic exchange length L0 (about 20–40 nm for Fe [28]). A reduction in grain size below L0 leads to an alignment of the magnetic moments by ferromagnetic exchange interactions, resulting in an averaging of the local randomly oriented magnetocrystalline anisotropies K1 [28,30]. The average grain sizes of all the samples in the present study seem to be above L0 of Fe (c.f. Figure 2). A reduction of the effective magnetocrystalline anisotropy Keff might also be achieved by alloying [31].
Another explanation for the low coercivities of the single-phase Fe-Cu alloys might be provided by the magneto-elastic anisotropy Kσ. According to Equation (3), Kσ can be affected by λs and external and internal mechanical stresses σ [30]:
Both single-phase Fe-Cu alloys, which have low coercivity values, exhibit lower values of λs compared to the other samples of the investigated Fe-Cu system. A similar behavior is reported for low-magnetostrictive Fe-Si alloys in comparison with pure Fe after HPT-deformation [20].
According to [32], the radial and tangential stresses in Fe discs after HPT-deformation yielded values up to 200 MPa, which in addition affected Kσ and Hc. It can be assumed that the residual stresses are approximately the same for Fe and Fe-Cu samples after HPT-deformation. The reduction in saturation magnetostriction for the samples with nominally 5 at.% Cu contributed to a lower magnetoelastic anisotropy and, hence, to better soft magnetic properties.
A similar effect of alloying on the magnetostrictive behavior has been reported for Fe-Mn and Fe-Ti alloys possessing a single-phase structure. For the addition of 3 wt.% Ti to Fe, a reduction in saturation magnetostriction down to approximately zero at an applied magnetic induction B up to 1.25 T has been reported. In comparison to the magnetic results of the samples possessing nominal 5 at.% Cu, the reported values of Hc (250 A m−1) and Ms (210 Am2 kg−1) are slightly higher but show good agreement [10]. A similar magnetostrictive behavior has been reported for Fe-Mn alloys with a Mn-content ranging from 45 to 55 at.%. In the as-cast and annealed state, a single, orthorhombic γ-phase is present and values for λs of about zero are reported. Subsequent cold-rolling did not lead to a change in the magnetostrictive behavior. In the case of the alloy containing 55 at.% Mn, α-Fe with a content of 77% is reported besides the orthorhombic γ-phase, leading to a λs of −6 µm m−1 [9]. The results of the investigated Fe-Cu system show a similar behavior as that reported for the Fe-Mn system. The dissolution of Cu in the Fe-matrix and the formation of a supersaturated single-phase alloy leads to a strong decrease in λs. In contrast, the presence of a second phase besides Fe leads to a linear decrease in saturation magnetostriction with a decreasing amount of Fe. The reported value of −6 µm m−1 at an Fe-concentration of 77% fits well to the linear trend in the obtained results of the investigated Fe-Cu system shown in Figure 6.
Further research will focus on an optimization of the fabrication process by an adaptation of the HPT-deformation parameters to increase the amount of dissolved Cu in the Fe-matrix and appropriate stress relief treatments to reduce the residual stresses present in the HPT-deformed disks.
4. Conclusions
In this work, the influence of atwo-step HPT-deformation on the microstructural refinement, phase formation and magnetic properties of pure Fe and Fe-Cu samples with a nominal Cu-content from 5 at.% to 30 at.% was studied. The respective deformation parameters in combination with the Cu-content have a strong influence on the evolving microstructure and thus on the magnetic properties. The most important findings of this study can be summarized as follows:
- A nanocrystalline microstructure was present in all the samples after the second HPT-deformation step. The microstructural morphology changed from equiaxed grains at low Cu-contents to a lamellar microstructure at Cu-contents of 15 at.% and higher.
- In both samples with a nominal Cu-content of 5 at.%, a single-phase bcc structure was obtained after HPT-deformation.
- For compositions containing 15 at.% Cu or higher, a Fe-Cu nanocomposite was formed by HPT-deformation as bcc Fe and fcc Cu peaks were observed by WAXS measurements.
- The saturation magnetization Ms and the saturation magnetostriction λs of Fe-Cu nanocomposites decreased linearly with increasing Cu-content in the Fe-Cu nanocomposites, while the measured coercivities Hc strongly increased.
- In contrast, a stronger reduction in λs and Hc was observable in bcc single-phase Fe-Cu alloys. These results indicate that single-phase Fe-Cu alloys with up to 25 at.% Cu dissolved in the Fe-matrix might possess improved soft magnetic properties.
Author Contributions
Conceptualization, A.P. and A.B.; methodology, A.P. and S.W.; software, A.P. and S.W.; validation, A.P., S.W. and A.B.; formal analysis, A.P.; investigation, A.P. and S.W.; resources, H.K. and A.B.; data curation, A.P. and A.B.; writing—original draft preparation, A.P.; writing—review and editing, S.W., H.K. and A.B.; visualization, A.P.; supervision, A.B.; project administration, A.B.; funding acquisition, A.B. All authors have read and agreed to the published version of the manuscript.
Funding
This project received funding from the European Research Council (ERC) und the European Union’s Horizon 2020 research and innovation programme, grant agreement No. 757333.
Data Availability Statement
The original data presented in this study are openly available on Zenodo at https://zenodo.org/doi/10.5281/zenodo.13771441. URL accessed on 17 September 2024.
Acknowledgments
We acknowledge DESY (Hamburg, Germany), a member of the Helmholtz Association HGF, for the provision of experimental facilities. Parts of this research were carried out at beamline P21.2 at PETRA III under proposal I-20190577, as well as at beamline P07B at PETRA III and we would like to thank N. Schell and E. Maawad for their assistance in using P07B-High Energy Materials Science as well as M. Zawodzki for assistance in the measurements. We acknowledge the help and assistance of L. Winkler during the SQUID measurements and of C. Trost during data evaluation. The assistance of M. Kriegisch during the construction of the measurement setup is acknowledged.
Conflicts of Interest
The authors declare no conflicts of interest. The funders had no role in the design of the study; in the collection, analyses, or interpretation of data; in the writing of the manuscript; or in the decision to publish the results.
References
- Gutfleisch, O.; Willard, M.A.; Brück, E.; Chen, C.H.; Sankar, S.G.; Liu, J.P. Magnetic Materials and Devices for the 21st Century: Stronger, Lighter, and More Energy Efficient. Adv. Mater. 2011, 23, 821–842. [Google Scholar] [CrossRef] [PubMed]
- Dapino, M.J. On magnetostrictive materials and their use in adaptive structures. Struct. Eng. Mech. 2004, 17, 303–329. [Google Scholar] [CrossRef]
- Ekreem, N.B.; Olabi, A.G.; Prescott, T.; Rafferty, A.; Hashmi, M.S.J. An overview of magnetostriction, its use and methods to measure these properties. J. Mater. Process. Technol. 2007, 191, 96–101. [Google Scholar] [CrossRef]
- Bormio-Nunes, C.; Tirelli, M.A.; Sato Turtelli, R.; Grössinger, R.; Müller, H.; Wiesinger, G.; Sassik, H.; Reissner, M. Volume magnetostriction and structure of copper mold-cast polycrystalline Fe–Ga alloys. J. Appl. Phys. 2005, 97, 033901. [Google Scholar] [CrossRef]
- Sato Turtelli, R.; Vlasak, G.; Kubel, F.; Mehmood, N.; Kriegisch, M.; Grossinger, R.; Sassik, H. Effect of Rapid Solidification on Magnetostriction and Microstructure in Melt-Spun Fe-Al Ribbons. IEEE Trans. Magn. 2010, 46, 483–486. [Google Scholar] [CrossRef]
- Mehmood, N.; Sato Turtelli, R.; Grössinger, R.; Kriegisch, M. Magnetostriction of polycrystalline Fe100−xAlx (x = 15, 19, 25). J. Magn. Magn. Mater. 2010, 322, 1609–1612. [Google Scholar] [CrossRef]
- Bormio-Nunes, C.; Serra, J.P.; Barbosa, F.S.; Dias, M.B.S.; Turtelli, R.S.; Atif, M.; Grossinger, R. Magnetostriction of Fe–Cr and Fe–Cr–B Alloys. IEEE Trans. Magn. 2016, 52, 1–4. [Google Scholar] [CrossRef]
- Weissitsch, L.; Wurster, S.; Paulischin, A.; Stückler, M.; Pippan, R.; Bachmaier, A. Nanocrystalline FeCr alloys synthesised by severe plastic deformation–A potential material for exchange bias and enhanced magnetostriction. J. Magn. Magn. Mater. 2021, 534, 168017. [Google Scholar] [CrossRef]
- Turtelli, R.S.; Grijalva, C.; Kubel, F.; Geist, D.; Grössinger, R.; Kriegisch, M.; Sorta, S.; Zehetbauer, M.; Mehmood, N. Low magnetostriction in Fe 100-x Mn x (x = 45, 48, 50, 52, 55) alloys. IOP Conf. Ser. Mater. Sci. Eng. 2014, 60, 012006. [Google Scholar] [CrossRef]
- Fulop, G.O.; Dias, M.B.S.; Sandim, H.R.Z.; Bormio-Nunes, C. High saturation magnetic induction and low magnetostriction of a novel ferritic Fe-Ti alloy compared to a non-oriented silicon steel. J. Magn. Magn. Mater. 2021, 527, 167702. [Google Scholar] [CrossRef]
- Chang, C.; Bye, R.; Laxmanan, V.; Das, S. Texture and magnetic properties of rapidly quenched Fe-6.5wt%Si ribbon. IEEE Trans. Magn. 1984, 20, 553–558. [Google Scholar] [CrossRef]
- Awano, H.; Taniguchi, O.; Katayama, T.; Inoue, F.; Itoh, A.; Kawanishi, K. Magnetostriction of 3 d -transition metal/noble metal compositionally modulated multilayer films. J. Appl. Phys. 1988, 64, 6107–6109. [Google Scholar] [CrossRef]
- Kozono, Y.; Komuro, M.; Narishige, S.; Hanazono, M.; Sugita, Y. Structures and magnetic properties of Fe/Cu multilayered films fabricated by a magnetron sputtering method. J. Appl. Phys. 1987, 61, 4311–4313. [Google Scholar] [CrossRef]
- Gorria, P.; Martínez-Blanco, D.; Blanco, J.A.; Hernando, A.; Garitaonandia, J.S.; Fernández Barquín, L.; Campo, J.; Smith, R.I. Invar effect in fcc- FeCu solid solutions. Phys. Rev. B 2004, 69, 214421. [Google Scholar] [CrossRef]
- Gorria, P.; Martínez-Blanco, D.; Iglesias, R.; Palacios, S.L.; Pérez, M.J.; Blanco, J.A.; Fernández Barquín, L.; Hernando, A.; González, M.A. Magneto-volume effects in Fe–Cu solid solutions. J. Magn. Magn. Mater. 2006, 300, 229–233. [Google Scholar] [CrossRef]
- Chien, C.L.; Liou, S.H.; Kofalt, D.; Yu, W.; Egami, T.; Watson, T.J.; McGuire, T.R. Magnetic properties of Fe x Cu 100 − x solid solutions. Phys. Rev. B 1986, 33, 3247–3250. [Google Scholar] [CrossRef]
- Sumiyama, K.; Yoshitake, T.; Nakamura, Y. Magnetic Properties of Metastable bcc and fcc Fe–Cu Alloys Produced by Vapor Quenching. J. Phys. Soc. Jpn. 1984, 53, 3160–3165. [Google Scholar] [CrossRef]
- Edalati, K.; Bachmaier, A.; Beloshenko, V.A.; Beygelzimer, Y.; Blank, V.D.; Botta, W.J.; Bryła, K.; Čížek, J.; Divinski, S.; Enikeev, N.A.; et al. Nanomaterials by severe plastic deformation: Review of historical developments and recent advances. Mater. Res. Lett. 2022, 10, 163–256. [Google Scholar] [CrossRef]
- Bachmaier, A.; Kerber, M.; Setman, D.; Pippan, R. The formation of supersaturated solid solutions in Fe–Cu alloys deformed by high-pressure torsion. Acta Mater. 2012, 60, 860–871. [Google Scholar] [CrossRef]
- Scheriau, S.; Kriegisch, M.; Kleber, S.; Mehboob, N.; Grössinger, R.; Pippan, R. Magnetic characteristics of HPT deformed soft-magnetic materials. J. Magn. Magn. Mater. 2010, 322, 2984–2988. [Google Scholar] [CrossRef]
- Weissitsch, L.; Staab, F.; Durst, K.; Bachmaier, A. Magnetic Materials via High-Pressure Torsion of Powders. Mater. Trans. 2023, 64, 1537–1550. [Google Scholar] [CrossRef]
- Ashiotis, G.; Deschildre, A.; Nawaz, Z.; Wright, J.P.; Karkoulis, D.; Picca, F.E.; Kieffer, J. The fast azimuthal integration Python library: pyFAI. J. Appl. Cryst. 2015, 48, 510–519. [Google Scholar] [CrossRef] [PubMed]
- Kapitza, P.L. The study of the magnetic properties of matter in strong magnetic fields. Part V.—Experiments on magnetostriction in dia- and para-magnetic substances. Proc. R. Soc. Lond. Ser. A Contain. Pap. A Math. Phys. Character 1997, 135, 568–600. [Google Scholar] [CrossRef]
- Cullity, B.D.; Graham, C.D. Introduction to Magnetic Materials, 2nd ed.; IEEE/Wiley: Hoboken, NJ, USA, 2009; p. 243. ISBN 978-0-471-47741-9. [Google Scholar]
- Paulischin, A. Magnetostrictive Behavior of Severe Plastically Deformed, Nanocrystalline Materials. Master’s Thesis, Monatnuniversität Leoben, Leoben, Austria, 2021. [Google Scholar]
- Jacob, K.T.; Raj, S.; Rannesh, L. Vegard’s law: A fundamental relation or an approximation? Int. J. Mater. Res. 2007, 98, 776–779. [Google Scholar] [CrossRef]
- Coey, J.M.D. Magnetism and Magnetic Materials; Cambridge University Press: Cambridge, UK, 2010; ISBN 978-0-521-81614-4. [Google Scholar]
- Herzer, G. Modern soft magnets: Amorphous and nanocrystalline materials. Acta Mater. 2013, 61, 718–734. [Google Scholar] [CrossRef]
- Stückler, M.; Wurster, S.; Pippan, R.; Bachmaier, A. In situ AC-hysteresis measurements of SPD-processed Cu 20 (Fe 15 Co 85) 80. AIP Adv. 2021, 11, 015033. [Google Scholar] [CrossRef]
- Herzer, G. Soft magnetic nanocrystalline materials. Scr. Metall. Mater. 1995, 33, 1741–1756. [Google Scholar] [CrossRef]
- Rameš, M.; Kopecký, V.; Heczko, O. Compositional Dependence of Magnetocrystalline Anisotropy in Fe-, Co-, and Cu-Alloyed Ni-Mn-Ga. Metals 2022, 12, 133. [Google Scholar] [CrossRef]
- Todt, J.; Keckes, J.; Winter, G.; Staron, P.; Hohenwarter, A. Gradient residual strain and stress distributions in a high pressure torsion deformed iron disk revealed by high energy X-ray diffraction. Scr. Mater. 2018, 146, 178–181. [Google Scholar] [CrossRef]


Disclaimer/Publisher’s Note: The statements, opinions and data contained in all publications are solely those of the individual author(s) and contributor(s) and not of MDPI and/or the editor(s). MDPI and/or the editor(s) disclaim responsibility for any injury to people or property resulting from any ideas, methods, instructions or products referred to in the content. |
© 2024 by the authors. Licensee MDPI, Basel, Switzerland. This article is an open access article distributed under the terms and conditions of the Creative Commons Attribution (CC BY) license (https://creativecommons.org/licenses/by/4.0/).