Article

Influence of Al and Ti Alloying and Annealing on the Microstructure and Compressive Properties of Cr-Fe-Ni Multi-Principal Element Alloy

1
Jiangsu Province Engineering Laboratory of High Efficient Energy Storage Technology and Equipments, School of Materials and Physics, China University of Mining and Technology, Xuzhou 221116, China
2
Huaihai Holding Group, Xuzhou 221116, China
*
Authors to whom correspondence should be addressed.
Metals 2024, 14(11), 1223; https://doi.org/10.3390/met14111223
Submission received: 22 September 2024 / Revised: 22 October 2024 / Accepted: 24 October 2024 / Published: 26 October 2024
(This article belongs to the Special Issue Processing Technology and Properties of Light Metals)

Abstract

:
This study meticulously examines the influence of aluminum (Al) and titanium (Ti) on the genesis of self-generated ordered phases in high-entropy alloys (HEAs), a class of materials that has garnered considerable attention due to their exceptional multifunctionality and versatile compositional palette. By meticulously tuning the concentrations of Al and Ti, this research delves into the modulation of the in situ self-generated ordered phases’ quantity and distribution within the alloy matrix. The annealing heat treatment outcomes revealed that the strategic incorporation of Al and Ti elements facilitates a phase transformation in the Cr-Fe-Ni medium-entropy alloy, transitioning from a BCC (body-centered cubic) phase to a BCC + FCC (face-centered cubic) phase. Concurrently, this manipulation precipitates the emergence of novel phases, including B2, L21, and σ. This orchestrated phase evolution enacts a synergistic enhancement in mechanical properties through second-phase strengthening and solid solution strengthening, culminating in a marked improvement in the compressive properties of the HEA.

1. Introduction

Since their inception, HEA (High-Entropy Alloys) have attracted widespread attention, primarily because of their exceptional comprehensive properties and versatile design potential [1,2,3]. A multitude of studies have confirmed that, as a novel alloy system, high-entropy alloys can be synthesized, processed, and analyzed, exhibiting significant potential for applications across various fields, including soft magnetic materials, structural materials, hydrogen storage materials, electrothermal alloy materials, and anti-corrosion materials [4,5,6,7].
In the pursuit of high-entropy alloys with exceptional multifunctional properties, a variety of strengthening techniques have been persistently explored. Among these, alloying stands out as the oldest and most potent method. The selection of elements is crucial to the efficacy of the alloying process. Currently, the alloying of high-entropy alloys primarily concentrates on the addition of new elements or the simple adjustment of a single element. For instance, Yuan et al. [8] improved the mechanical properties of a FeMnCoCr-based high-entropy alloy (HEA) through the addition of copper. The alloy, doped with 0.3% copper, attained a yield strength of 768 MPa, a tensile strength of 960 MPa, and a uniform elongation of 33.6%. Zhang et al. [9] enhanced the corrosion resistance of a CoCrFeMnNi HEA by incorporating niobium. Liu et al. [10] found that for silicon micro-alloyed alloys, the annealed (Ti28Zr40Al20Nb12)100−xSix (where x = 0, 0.1, 0.2, 0.5) HEA exhibited an increase in compression strength and fracture strain.
The literature indicates that CrFeNi is a thoroughly researched medium-entropy alloy with a face-centered cubic (FCC) structure and a relatively uncomplicated phase composition [11,12]. To harness the atomic hysteresis diffusion effect observed in high-entropy alloys, elements with a significant disparity in atomic radius and robust affinity for the alloy constituents are introduced. This results in the creation of in situ, particle-reinforced phases within the high-entropy alloys [13,14,15,16]. This is accomplished via rapid solidification on water-cooled arc-melted copper disks, capitalizing on the distinctive attributes of this fabrication technique [17,18,19]. Merely adjusting the proportion of Al in the CrFeNi alloy proves challenging for controlling the size, morphology, and volume fraction of the nano-ordered precipitate phase. Ti, akin to Al but with a larger atomic size and a lower enthalpy of mixing with post-transition metal elements, is introduced [20]. The dual-element alloying of Al and Ti is designed to provoke the precipitation of secondary phases. When combined with heat treatment methodologies, it is anticipated that this approach will enable precise regulation of the precipitate phases within the alloy.
This study incorporates aluminum (Al) and titanium (Ti), elements characterized by their large atomic radii and a tendency for facile precipitation, into the CrFeNi high-entropy alloy to create an in situ particle-reinforced phase. This innovation aims to bolster the alloy’s compressive properties. The research zeroes in on the AlCrFeNiTi alloy, scrutinizing its microstructure and compressive characteristics under various conditions.

2. Experimental Methods

The precise determination of the purity and proportion of the five metallic elements is crucial in achieving the desired final phases. Theoretical phase formation standards, as documented in references [21,22,23], were utilized to estimate the final phases of each alloy.
  • To minimize the presence of impurities and other elements, the selected raw materials are high-purity metals with a purity of more than 99.9%. To account for the volatility of Al during the smelting process, an additional 1% of Al is added to the batch to compensate for any losses.
  • The proportioning of the metal elements is based on the molar ratio, with the molar content of Al and Ti in the alloy adjusted while maintaining the constant ratio of Cr-Fe-Ni. Alx(CrFeNi)88Ti(12−x)(x = 9, 8, 6, 4, 3) is abbreviated as A9T3, A8T4, A6T6, A4T8, and A3T9 in the following context. This study investigates the influence law of Al and Ti dual element alloying on the microstructure and compressive properties of the Cr-Fe-Ni medium-entropy alloy.
  • This study investigates the influence of intermediate temperature annealing on the microstructure and compressive properties of the Cr-Fe-Ni medium-entropy alloy, aiming to elucidate the strengthening and deformation mechanisms of this alloy.
  • The following four tables list the relevant parameters of each element in high entropy alloys [1,2,3,4,5,6,7]. The purpose of Table 1 is to facilitate composition design through auxiliary thermodynamic calculations. Table 2 presents the mass percentage and melting point of each element for different alloy compositions. Meanwhile, Table 3 includes various parameters corresponding to each alloy composition. These tables collectively contribute to a more comprehensive representation of material design and performance. According to Table 1, Table 2, Table 3 and Table 4, the liquid phase line temperature of our high-entropy alloy is higher than that of a single metal.

2.1. Alloy Sample Preparation Method

The Alx(CrFeNi)88Ti(12−x) alloys were fabricated using non-consumable vacuum arc melting and non-consumable vacuum induction melting technologies [24]. The weight of the ingot is controlled at approximately 45 g, and the size is φ 30 mm × 10 mm, with the aim of reducing material waste, increasing chemical homogeneity, and minimizing pollution. By regulating the elements Al and Ni, this study seeks to control the content of the NiAl intermetallic compound phase and Ni3Al intermetallic compound phase in the alloy, as well as the self-generated NiAl nanophase in the alloy [25,26]. All metals in this article were purchased from Beijing Yanbang New Material Technology Co., LTD (China).

2.2. Homogenization Annealing

The properties of the alloy and the factors affecting these properties were examined by comparing the characterization and test outcomes of the as-cast alloy. Samples of the selected as-cast alloy were subjected to homogenization annealing in a Hefei Kejing (China) KSL 1400 A3 box furnace. The annealing procedure consisted of progressively heating the samples to 800 °C at a rate of 5 °C per minute, holding this temperature for a duration of 8 h, and subsequently allowing for slow cooling inside the furnace.

2.3. X-Ray Diffraction Analysis

Crystal structure analysis was carried out using an X-ray diffraction analyzer (Bruker D8 Advanced, Brock AXS LTD, Germany, XRD). The X-ray source is Cu-Kα (λ = 0.15406 nm). The scanning angle is from 20° to 100°. The scanning speed is 5°/min. The tube voltage is 40 kV and the tube current is 30 mA. The smelted alloy ingot was transformed into a 15 × 15 × 3 mm sample using wire electric discharge cutting technology. The cut sample was subjected to multiple rounds of polishing with 180-2000 # SiC sandpaper, starting with coarse sandpaper and progressing to a finer sandpaper to remove the wire-cutting marks on the surface. The sample was then ultrasonic cleaned in pure ethanol to remove any remaining impurities and oil stains on the surface [27].

2.4. Scanning Electron Microscopy Analysis

The microstructures of the alloy samples were examined using a metallographic microscope (MEF-3, Japan, OM) following corrosion treatment. Additionally, the microstructural characteristics of the alloy before and after corrosion were analyzed in both backscattered electron mode and secondary electron mode utilizing a scanning electron microscope (FEI Quanta 250, Japan, SEM). Furthermore, an energy dispersive spectrometer (FEI Quanta 250, Japan, EDS) was employed for surface and point scanning to ascertain the composition distribution and content of the alloy. In this study, the SEM samples were polished using 180-2000# SiC sandpaper (Sihong grinding hardware, China) and subjected to mechanical polishing. Subsequently, a preprepared metallographic etching solution was uniformly applied onto the specimen surface for corrosion treatment for a duration of 10 s. The sample surface was then cleaned sequentially with anhydrous ethanol and distilled water. After three repetitions of this process, the microstructure of the sample could be observed [28].

2.5. Transmission Electron Microscopy Observation

Detailed observation of the microstructure of the alloy using high-resolution field emission transmission electron microscopy (FEI Tecnai G2 F20, USA, TEM), and characterize the crystal structure by using selected area electron diffraction (SAED) [29,30]. Requirements for the test sample: cut the alloy sample into a 10 × 10 × 1 (mm) thin sheet using wire electric discharge cutting technology, then stick the sample onto a smooth and flat surface of the metal block, grind the sheet to a thickness of approximately 0.4 mm with a pre-grinder, then use ion thinning to reduce the thickness of the sheet to 100 μm below, punch it into a circle with a diameter of 3 mm, further thinning the sample to perforation using electrolytic double spray method [31].

2.6. Compression Performance Evaluation of Alloy at Room Temperature

The alloy samples were cut into cylinder shapes with a height of 10 mm and a diameter of 5 mm using wire electric discharge cutting technology, on the basis of the standard “Test Method for Compressive Properties at Room Temperature” (GB T7314-2005) [32]. To minimize the impact of wire-cutting marks on the subsequent compression performance testing, the wire speed of the molybdenum wire in the wire-cutting machine was reduced to the lowest possible level. The samples were then smoothed with 1500# SiC sandpaper to remove any burrs on the surface, and ultrasonically cleaned in pure ethanol [28].
The alloy sample was subjected to room temperature testing using a vertical 100 KN electronic universal testing machine (AG-XPLUS, Shimadzu Corporation, Japan). The compressive strain rate employed was 2 × 10⁻⁴ s−1. Fracture failure samples were collected for subsequent fracture scanning and analysis. The testing process recorded the loading force and stroke data, which was then used to plot the quasi-static compression engineering stress-strain curve using Origin data processing software (Origin 2021). This allowed for a detailed analysis and comparison of the sample’s strength, plasticity, and other mechanical properties [33].

3. Results and Discussions

3.1. Analysis of Phase and Surface Morphology

As illustrated in Figure 1a, the incorporation of Al and Ti resulted in the emergence of BCC phase diffraction peaks, as well as the precipitation of ordered phases B2 and L21. The presence of the σ phase was detected at Al and Ti contents of A8T4 and A4T8, indicating that dual-element alloying with Al and Ti facilitated a transformation in crystal structure from FCC to a combination of FCC + BCC phases, leading to a substantial increase in precipitated phases. Following annealing at 800 °C, in addition to the aforementioned transformations, the L12 phase was also observed. The Ni3Al intermetallic phase formed at Al and Ti contents of A8T4 and A4T8. The diffraction peaks corresponding to each crystal plane exhibited strong agreement, suggesting that prolonged annealing provided sufficient energy for the diffusion of alloying elements while alleviating lattice distortion.
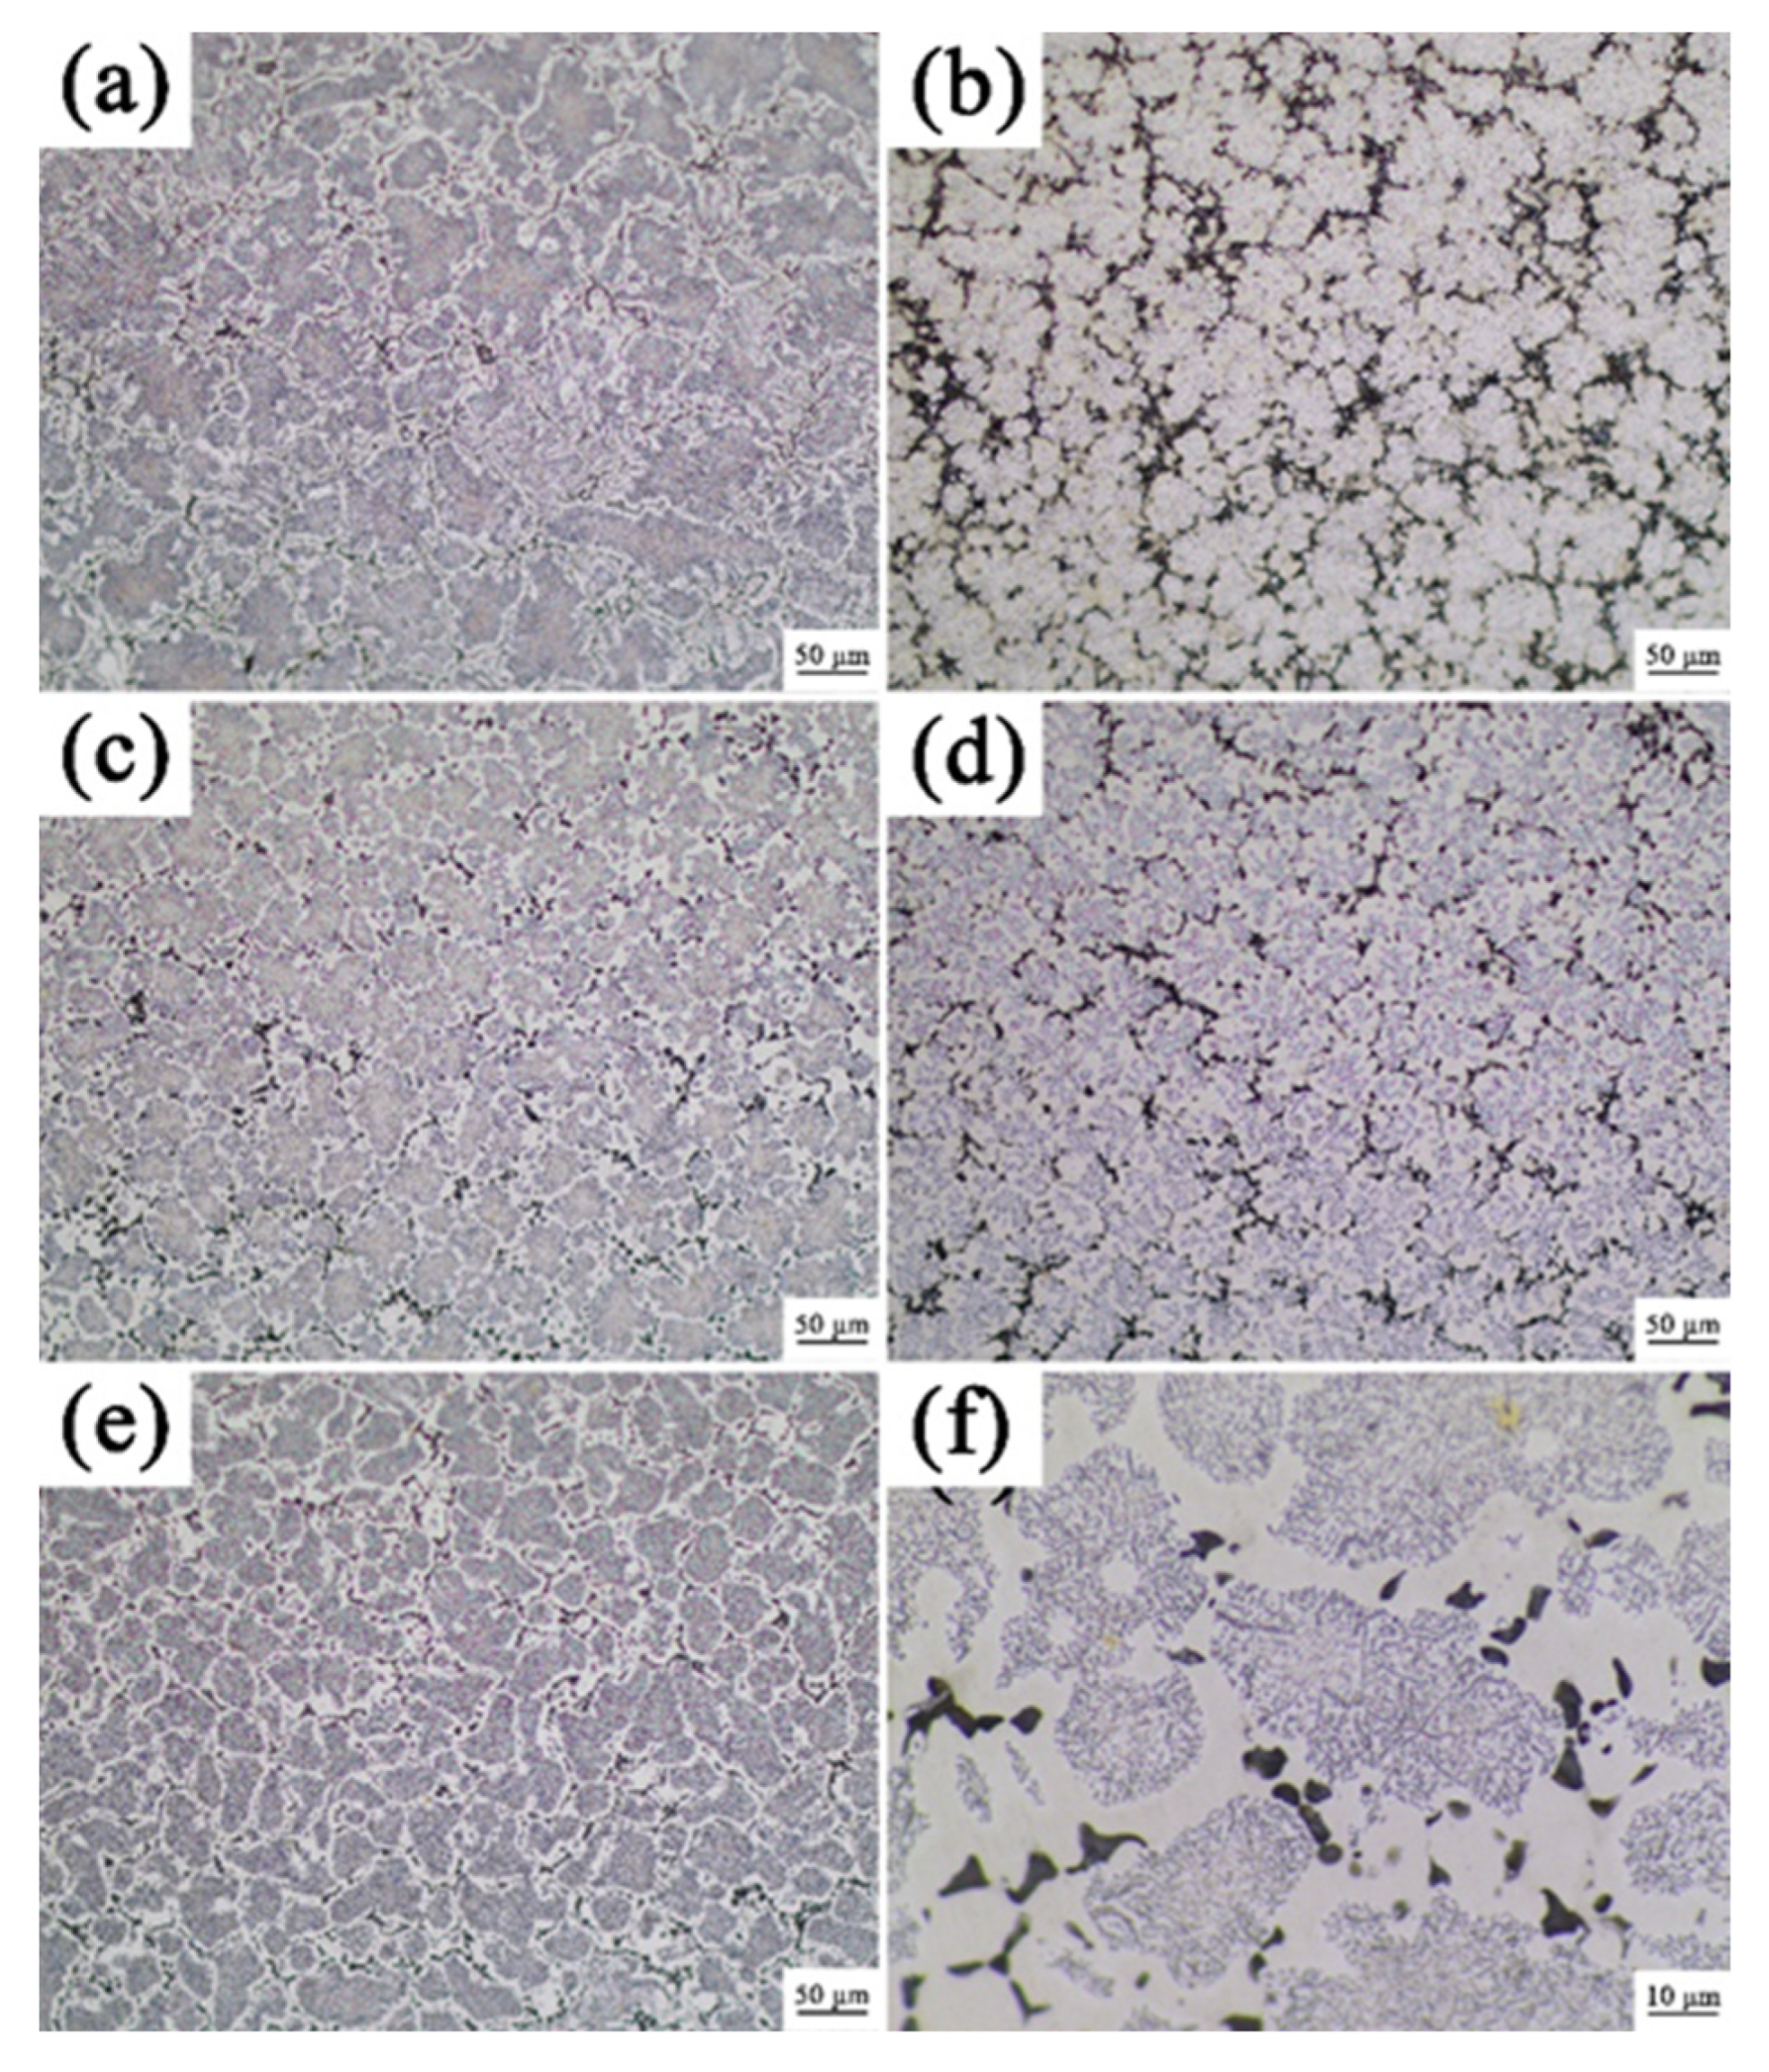
The optical microscopy (OM) images of as-cast samples with varying compositions are presented in Figure 2. Compared to the as-cast alloys, the annealed A9T3, A6T6, and A3T9 alloys still exhibit the dendritic structure of the as-cast state, consisting of dark, light, and black elongated phases. The continuous light phase forms the interdendritic structure while the discontinuous dark phase represents the dendritic structure, preserving the unique network structure of continuous light and discontinuous dark phases observed in the as-cast state. Figure 2f provides a magnified view of Figure 2c. Following the annealing treatment, the coral-like dark phase in the as-cast A6T6 alloy transforms into an ellipsoidal-like structure with a reduction in particle count and an increase in size within its original nanoscale particles. The previously irregularly distributed black rod-like phases within the light phase become more rounded and regular. Interestingly, numerous new black rod-like phases are observed within this light phase after annealing treatment. In contrast to A9T3, A6T6, and A3T9 alloys which maintain their dendritic structures albeit with changes described above; significant alterations occur in microstructures of A4T8 and A8T4 alloys following annealing treatment. While these alloys still retain a dendritic structure composed of discontinuous light phases, interdendritic regions consist of continuous dark phases instead. The fine and rounded nature of these light phases results in a unique network intertwined with dark phases. Compared to their respective as-cast states, grain distribution becomes more uniform after annealing treatment with only a few instances of black elongated phases observed within interdendritic regions. Original black particle phases within dendrites coarsen while numerous needle-like newly generated phases appear within dark areas post-annealing.
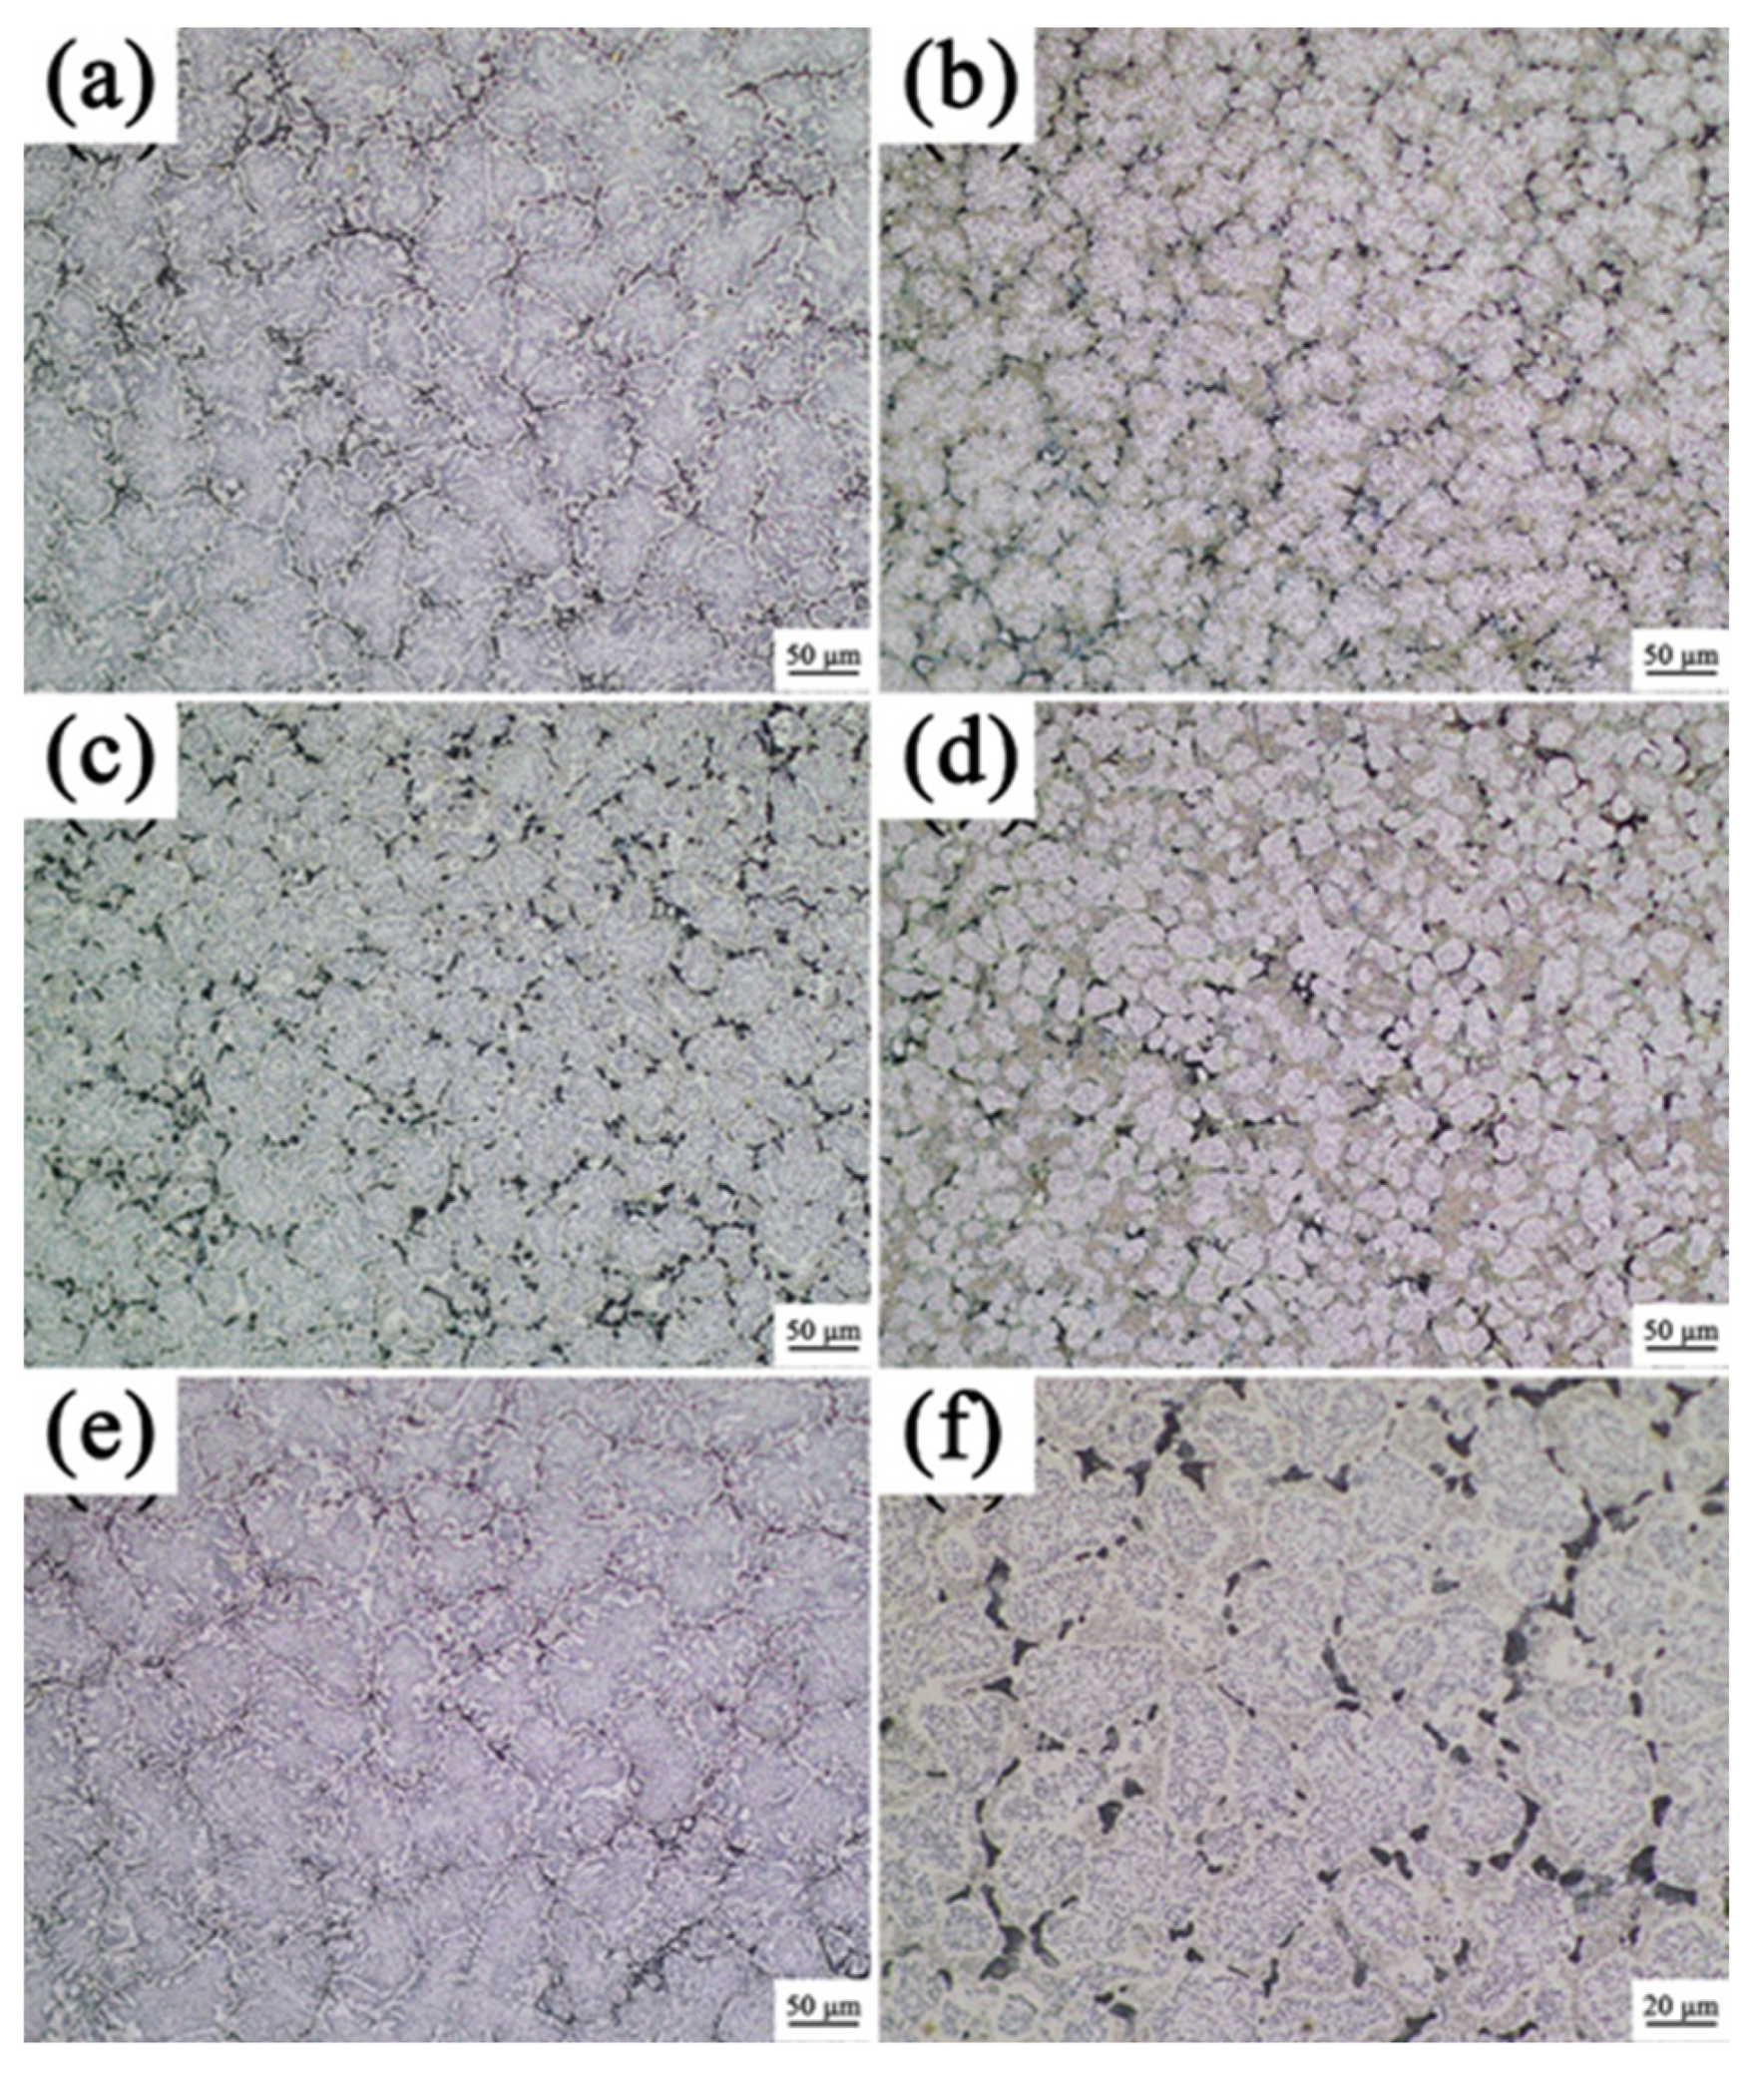
Figure 3 illustrates the OM image of the as-cast Alx(CrFeNi)88Ti(12−x) alloy after undergoing corrosion treatment. The figure clearly demonstrates that the alloy exhibits a distinctive dendritic structure, where the fragmented dark phase represents the dendritic arms, while the continuous light phase corresponds to the interdendritic regions. Numerous black strip-like phases can be observed within the light phase. As shown in Figure 3a–d, a noticeable trend is observed: with increasing Ti content in the alloy, there is a gradual refinement and more uniform distribution of the dendritic structure, transitioning from an initial bulky lath-like morphology to a coral-like configuration. Notably, among all compositions, A4T8 alloy displays the finest dendritic structure. However, it should be mentioned that despite this overall trend, A8T4 alloy possesses a finer dendritic structure compared to A6T6 alloy and also exhibits a significantly higher volume fraction of black strip-like phases than other alloys. An anomaly is observed in Figure 3e, where the unexpectedly enlarged size of dendritic structures is seen for the A3T9 alloy. Additionally, Figure 3f provides an enlarged view of Figure 3c, revealing numerous nanoscale fine particles embedded within the dark phase. These particles together with the matrix phase collectively formulate into dendritic structures.
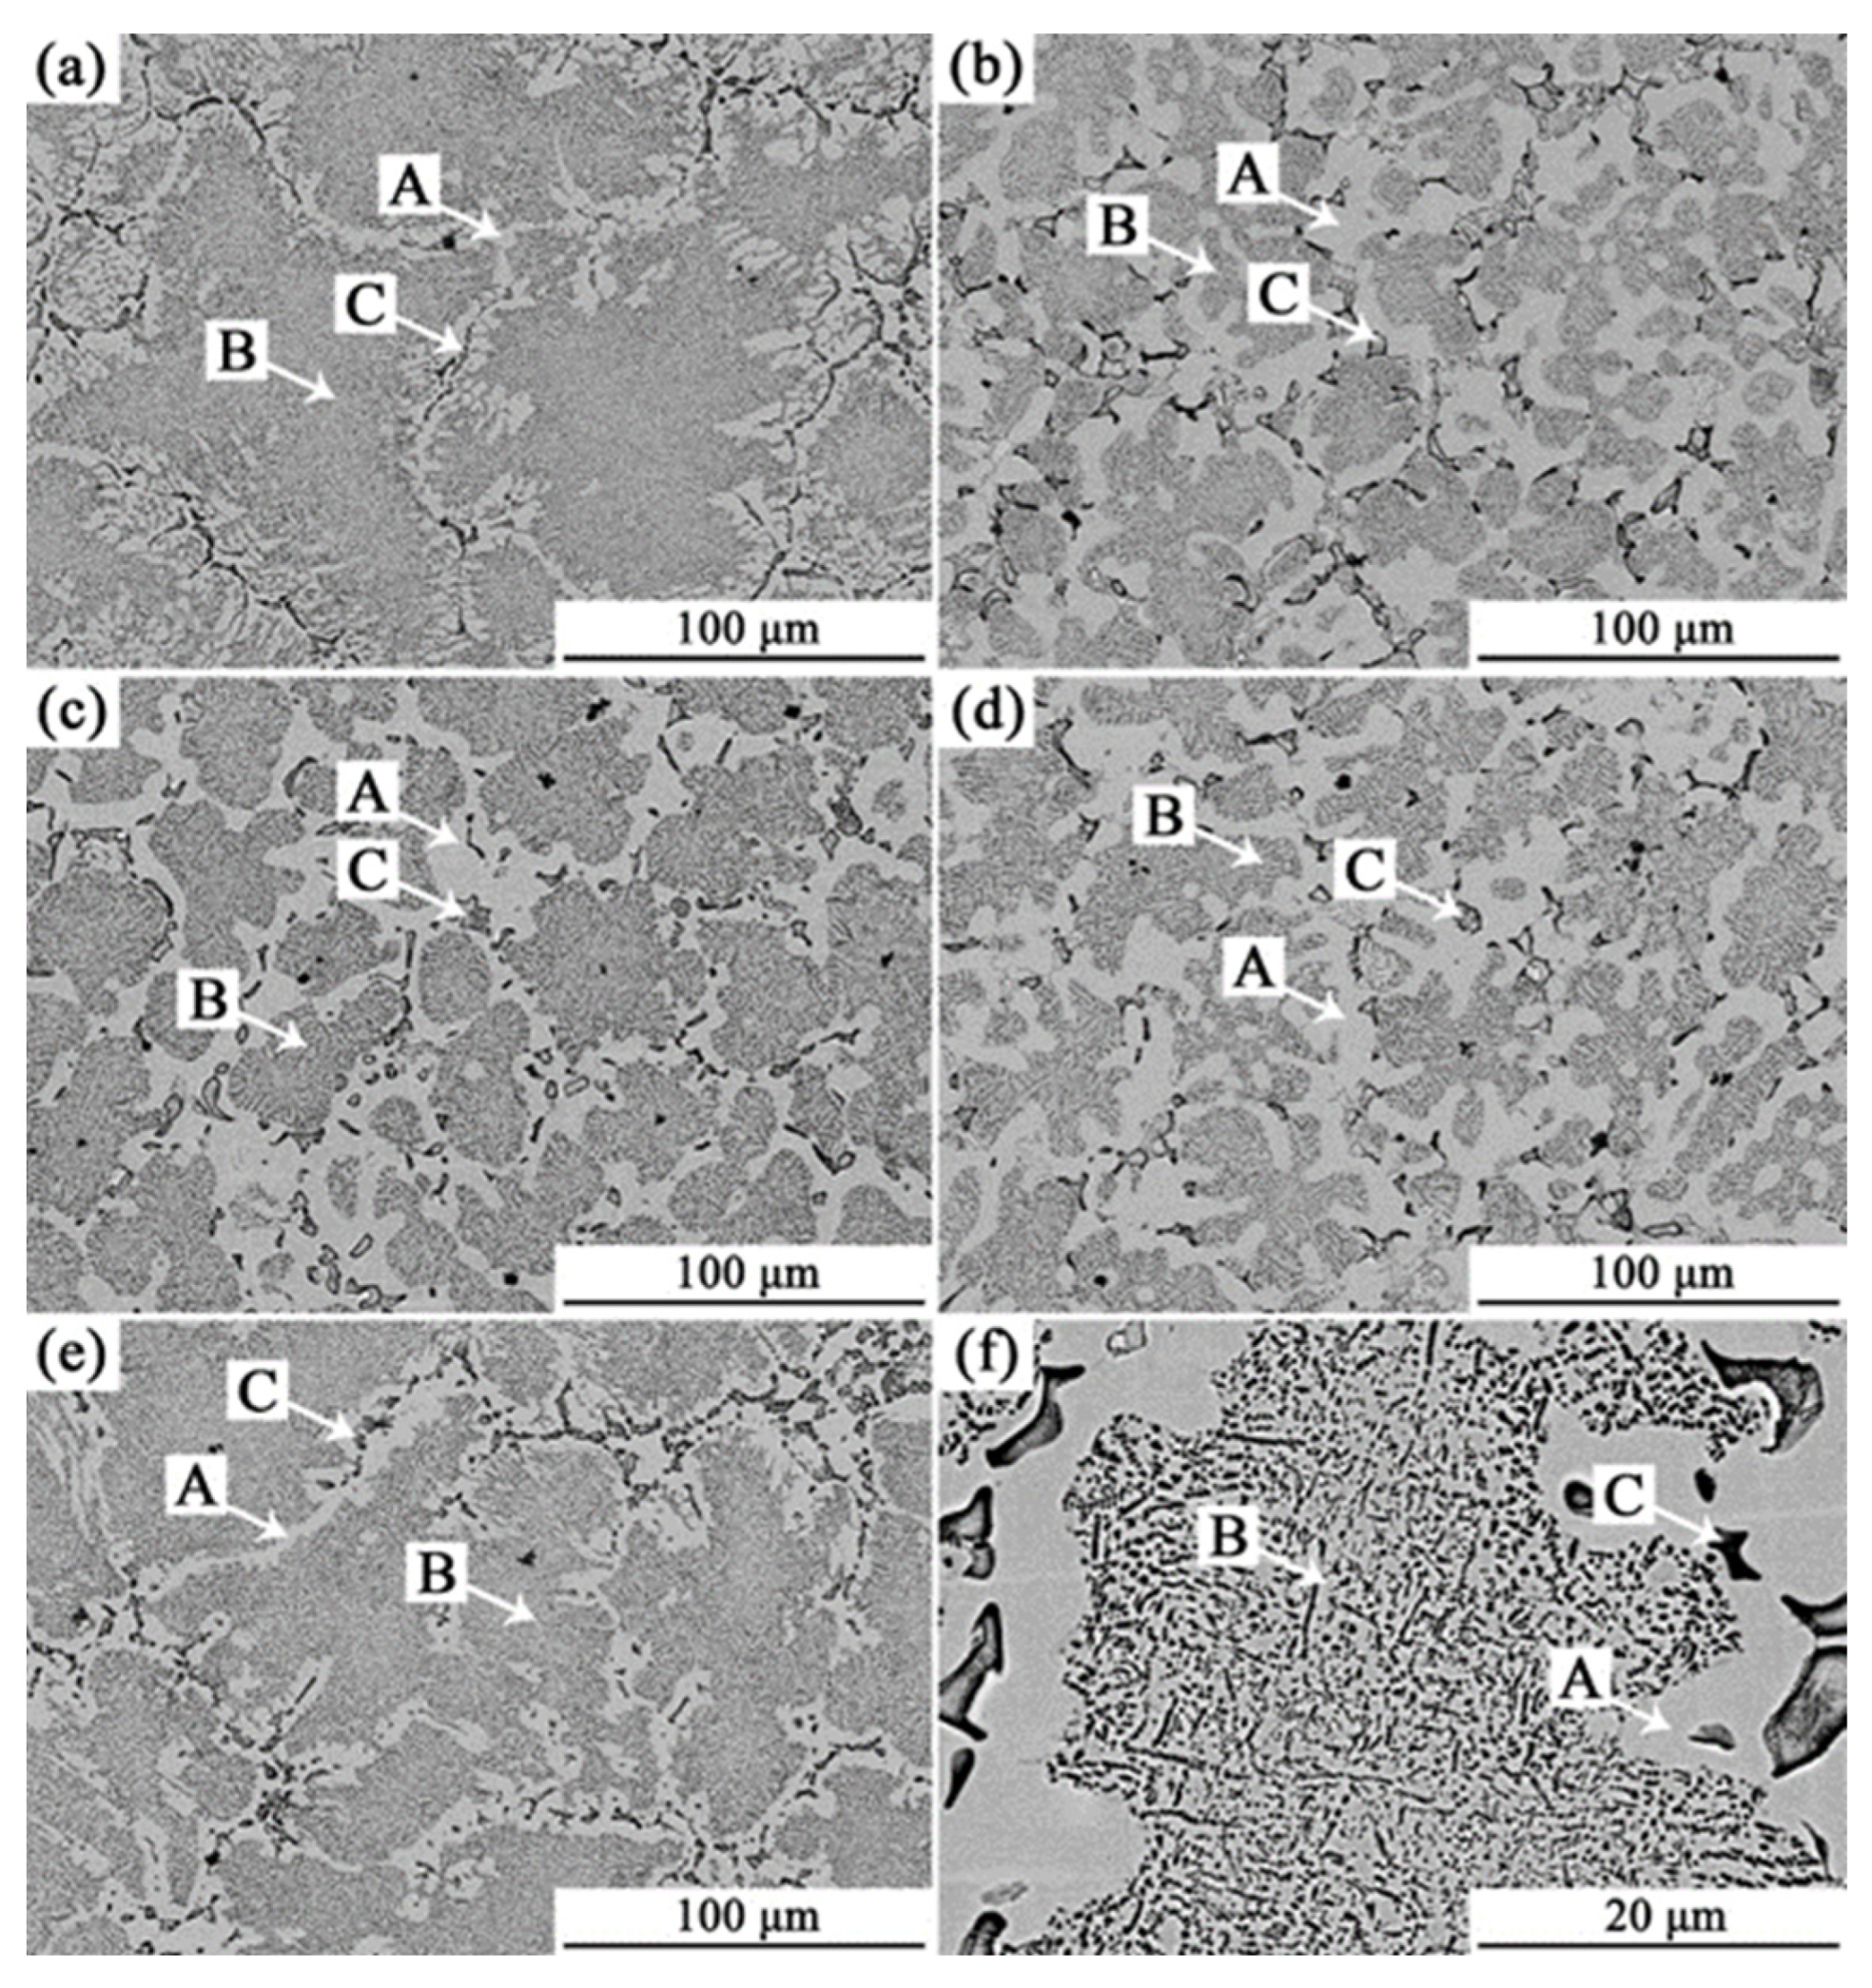
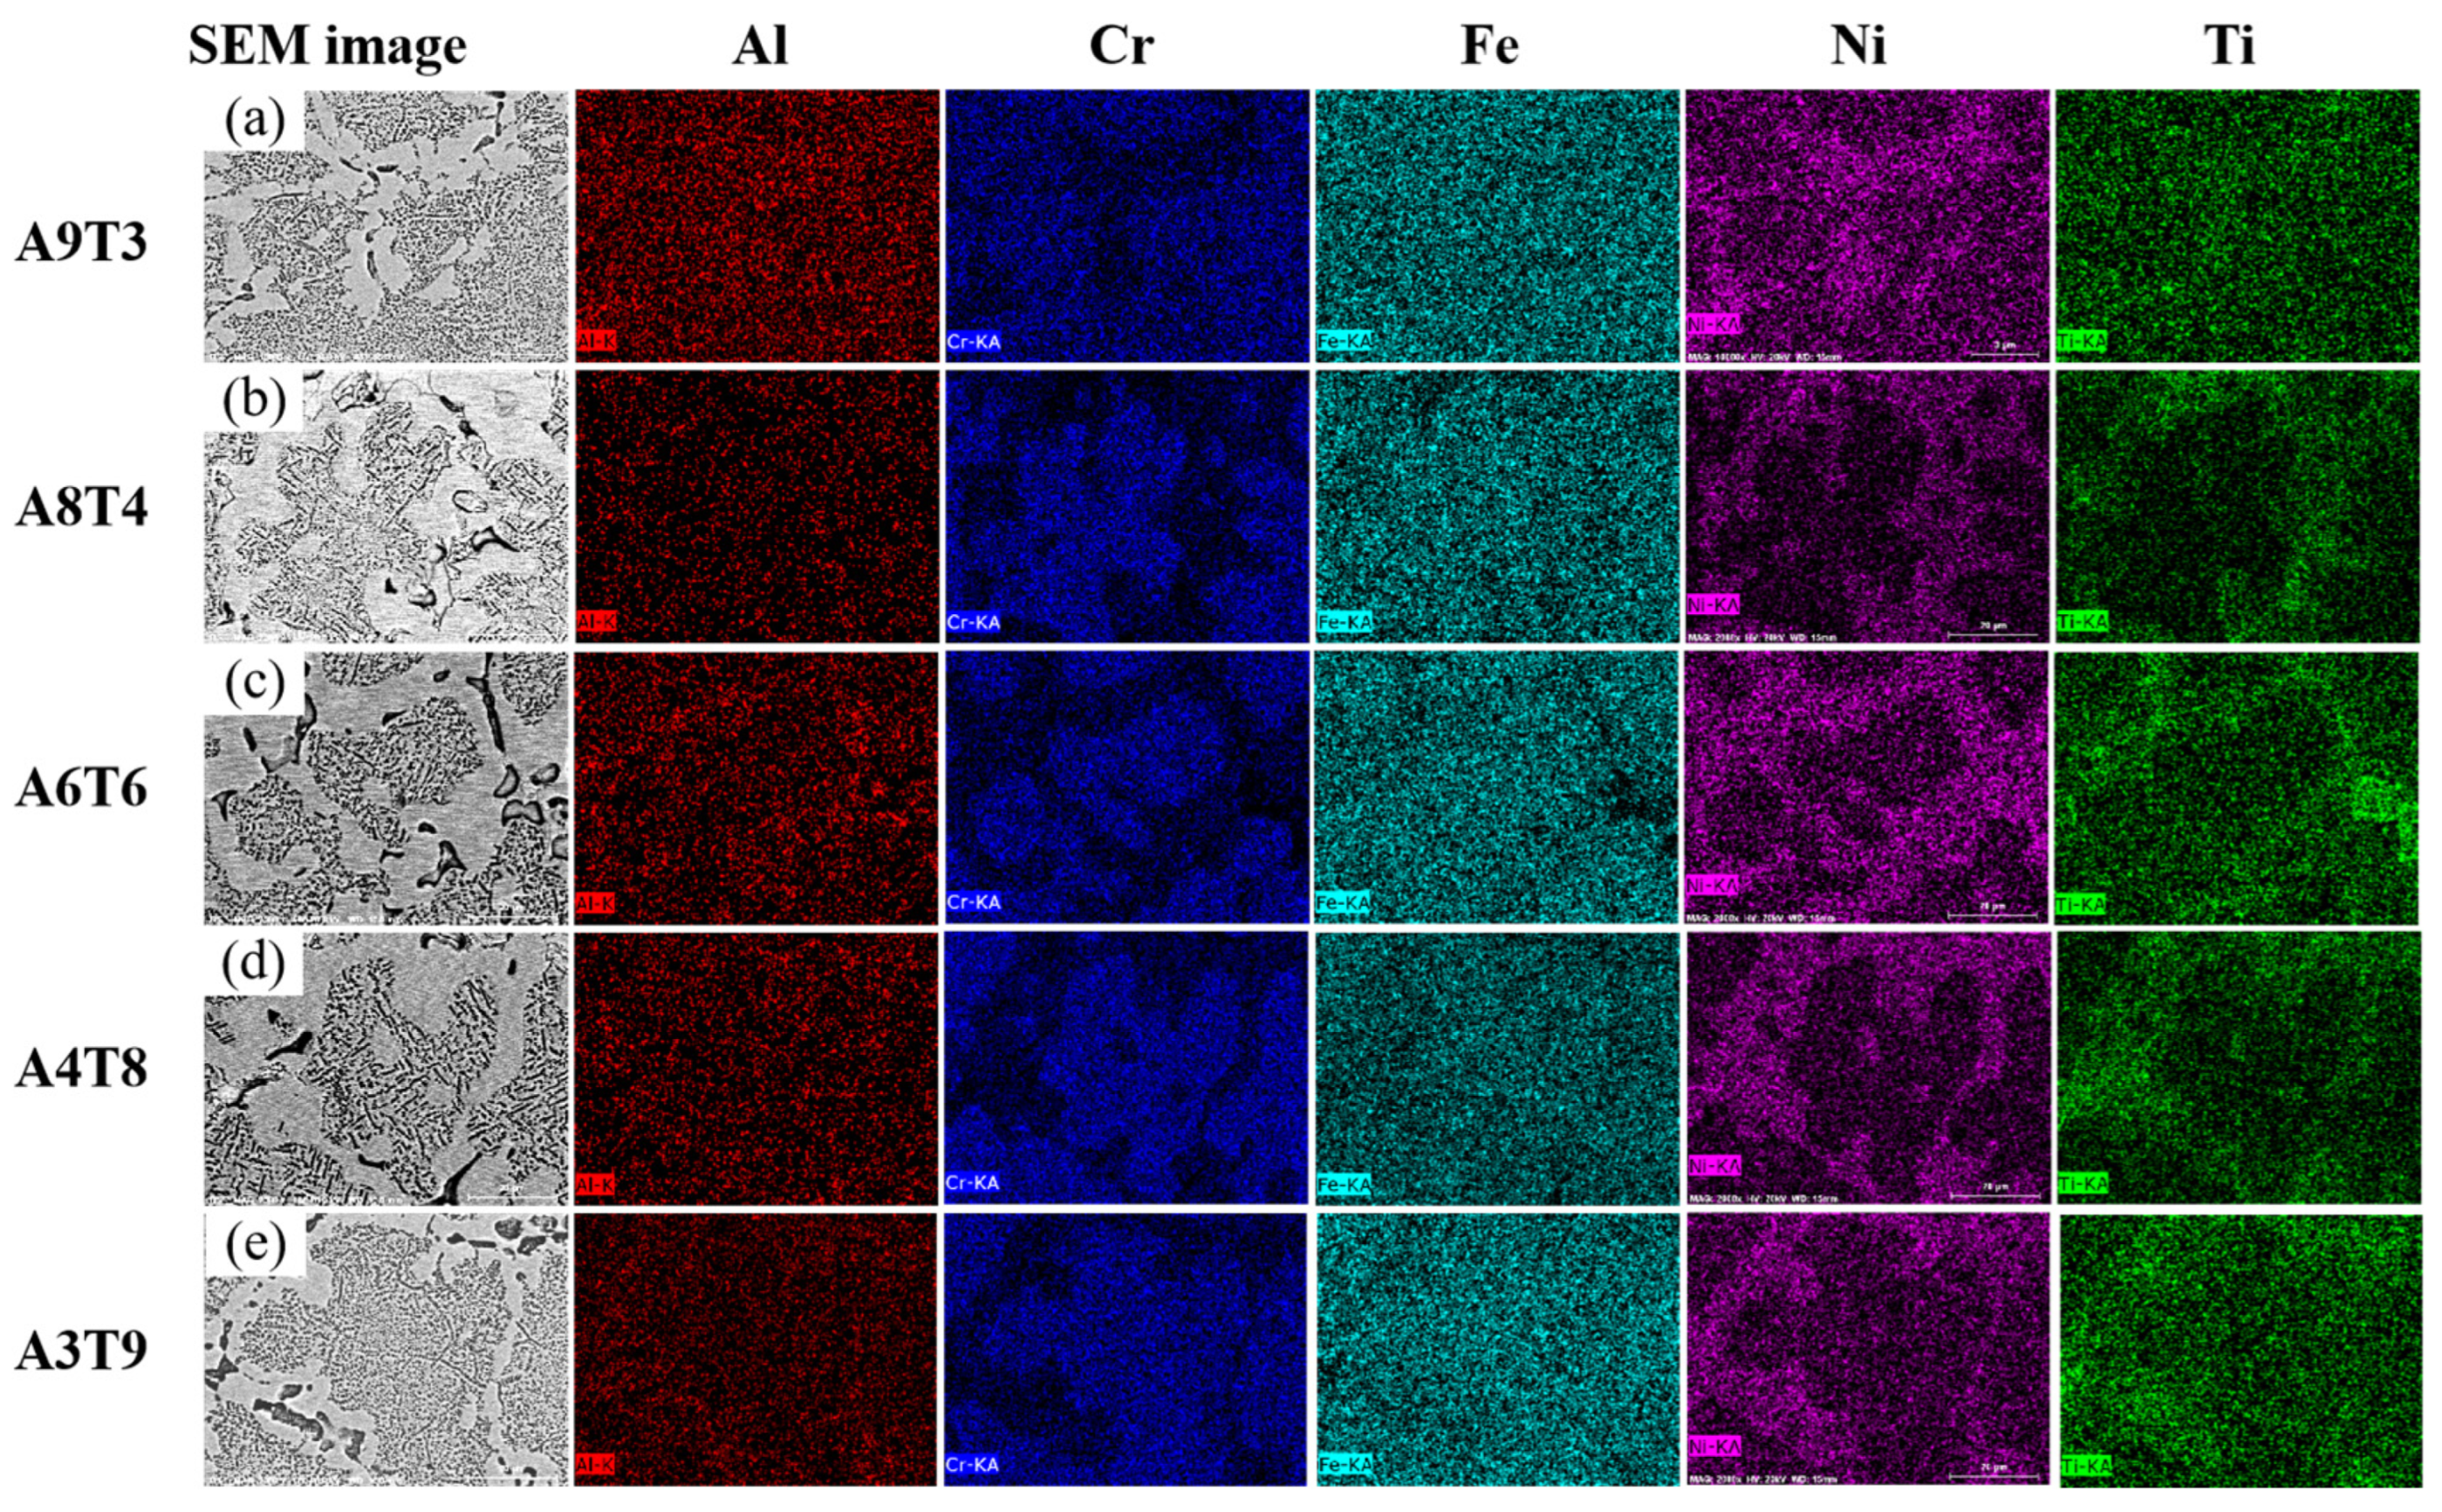
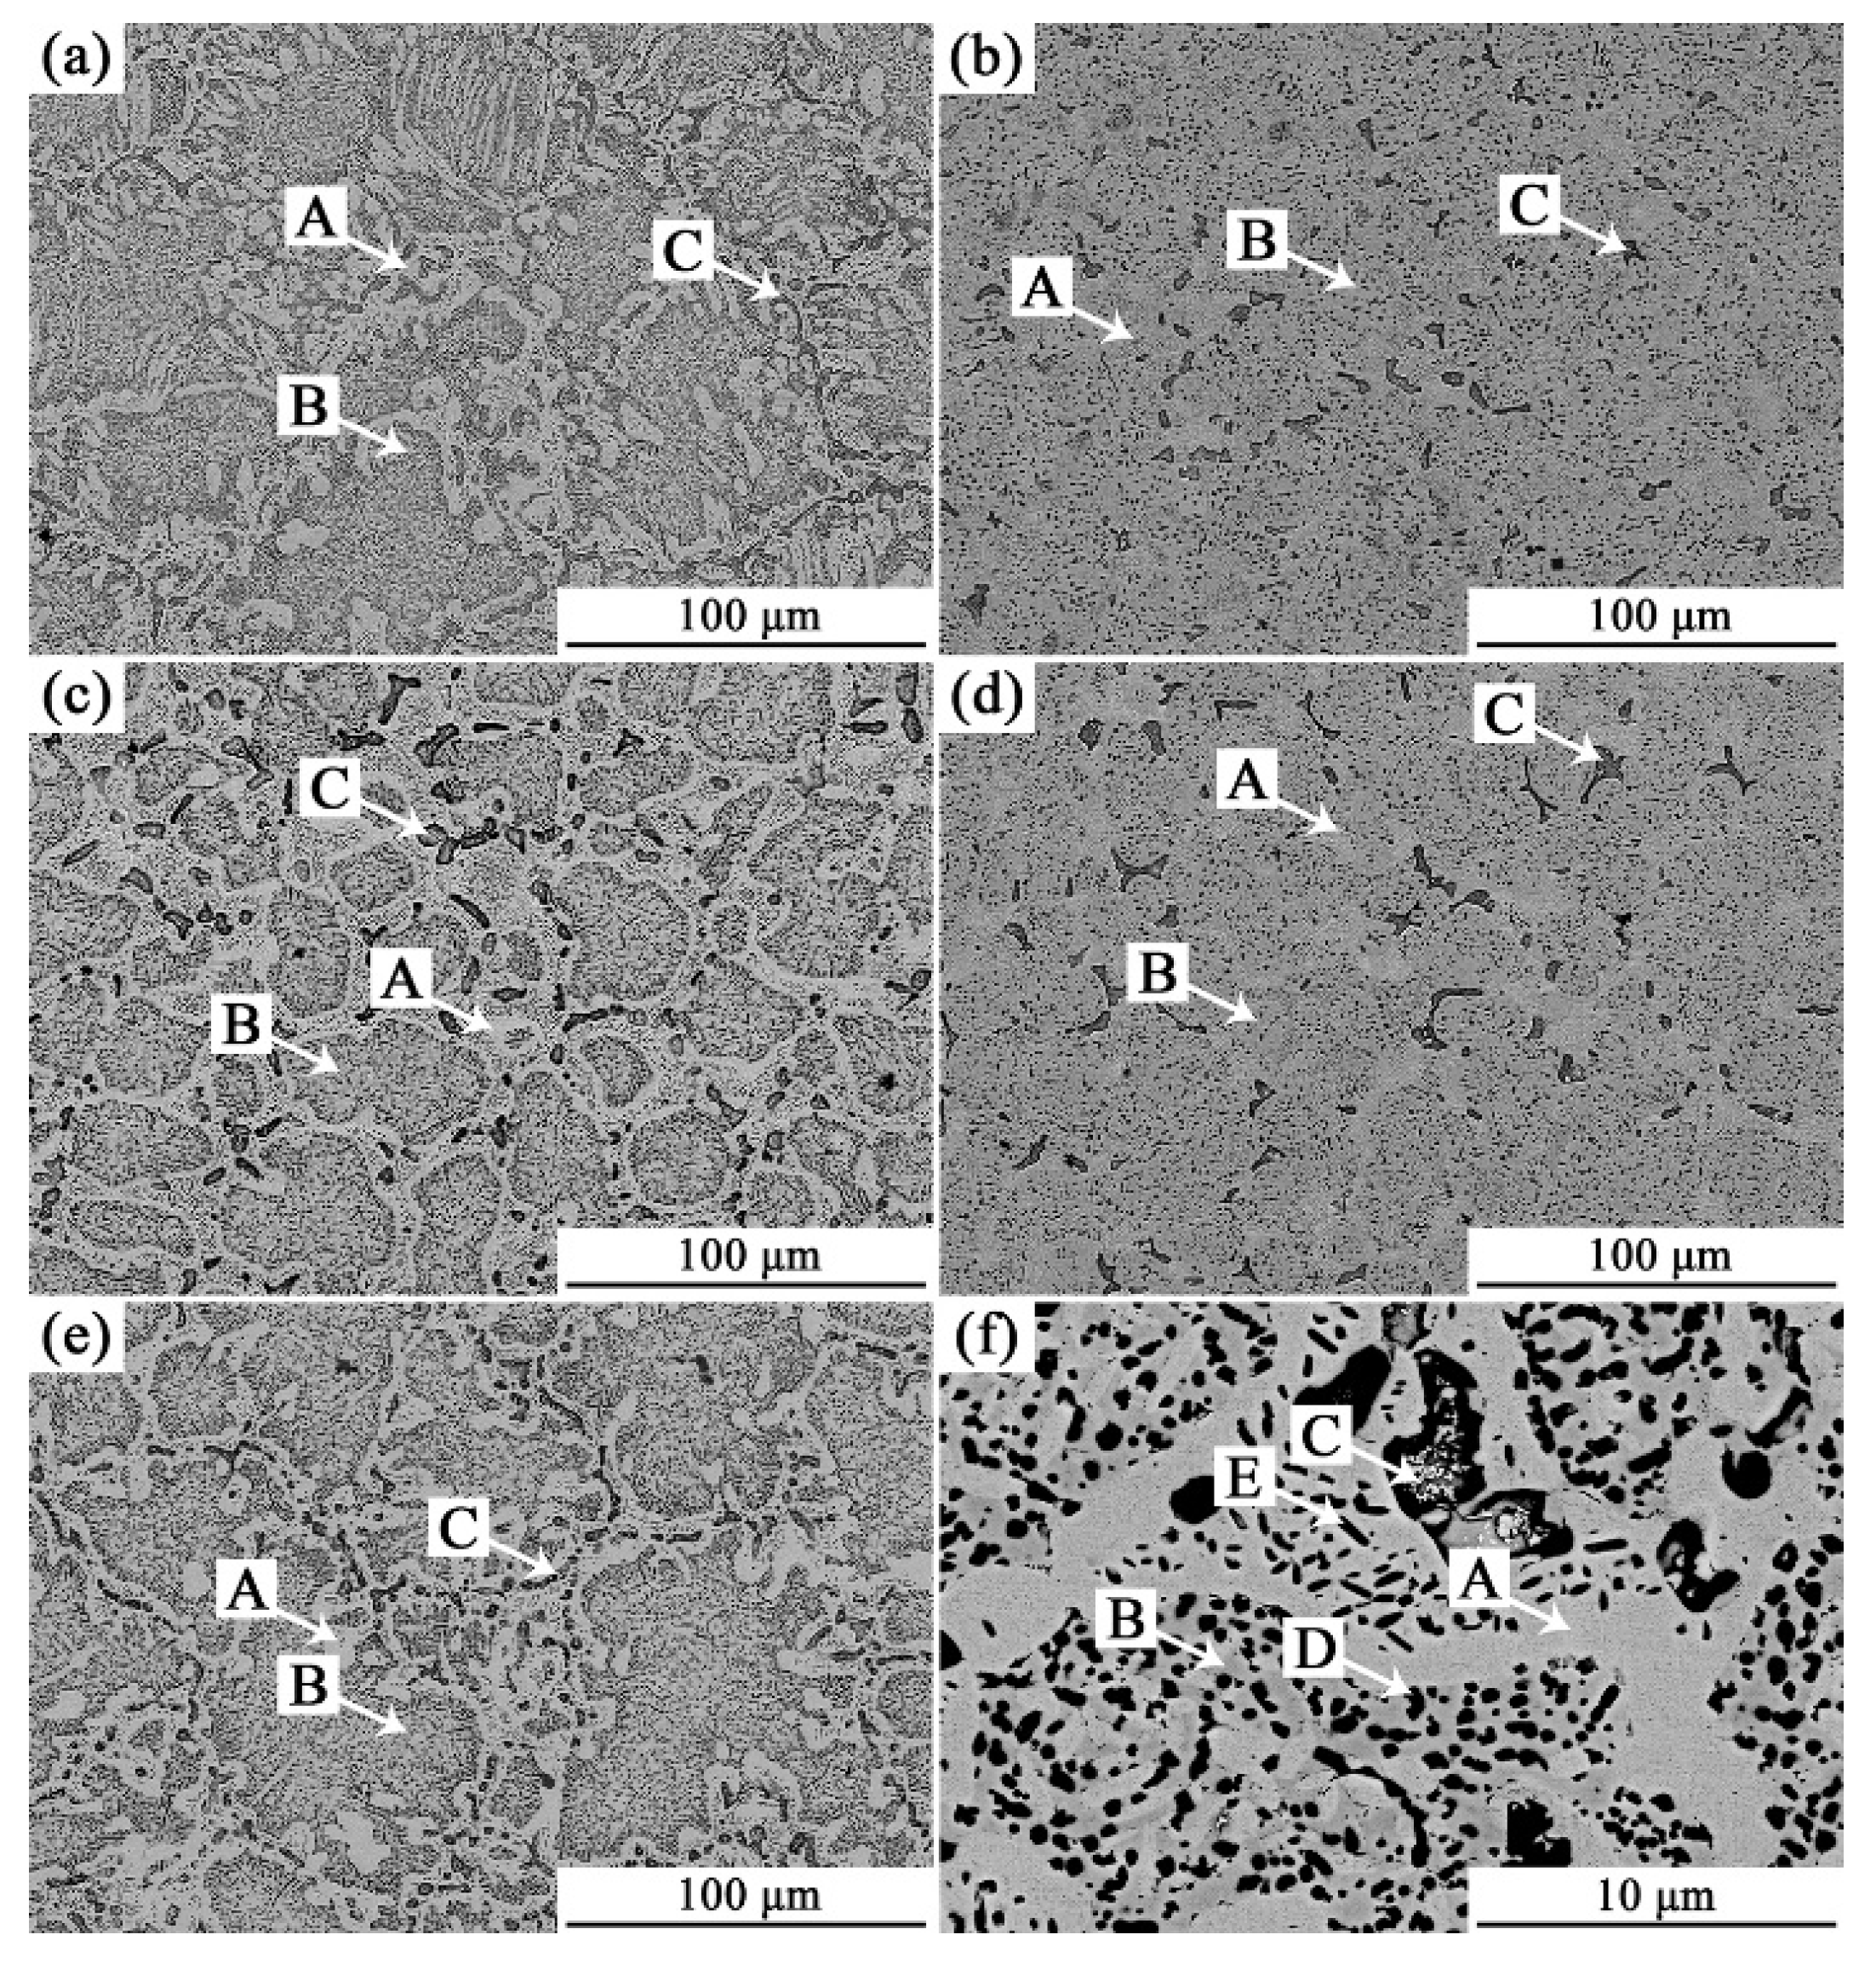
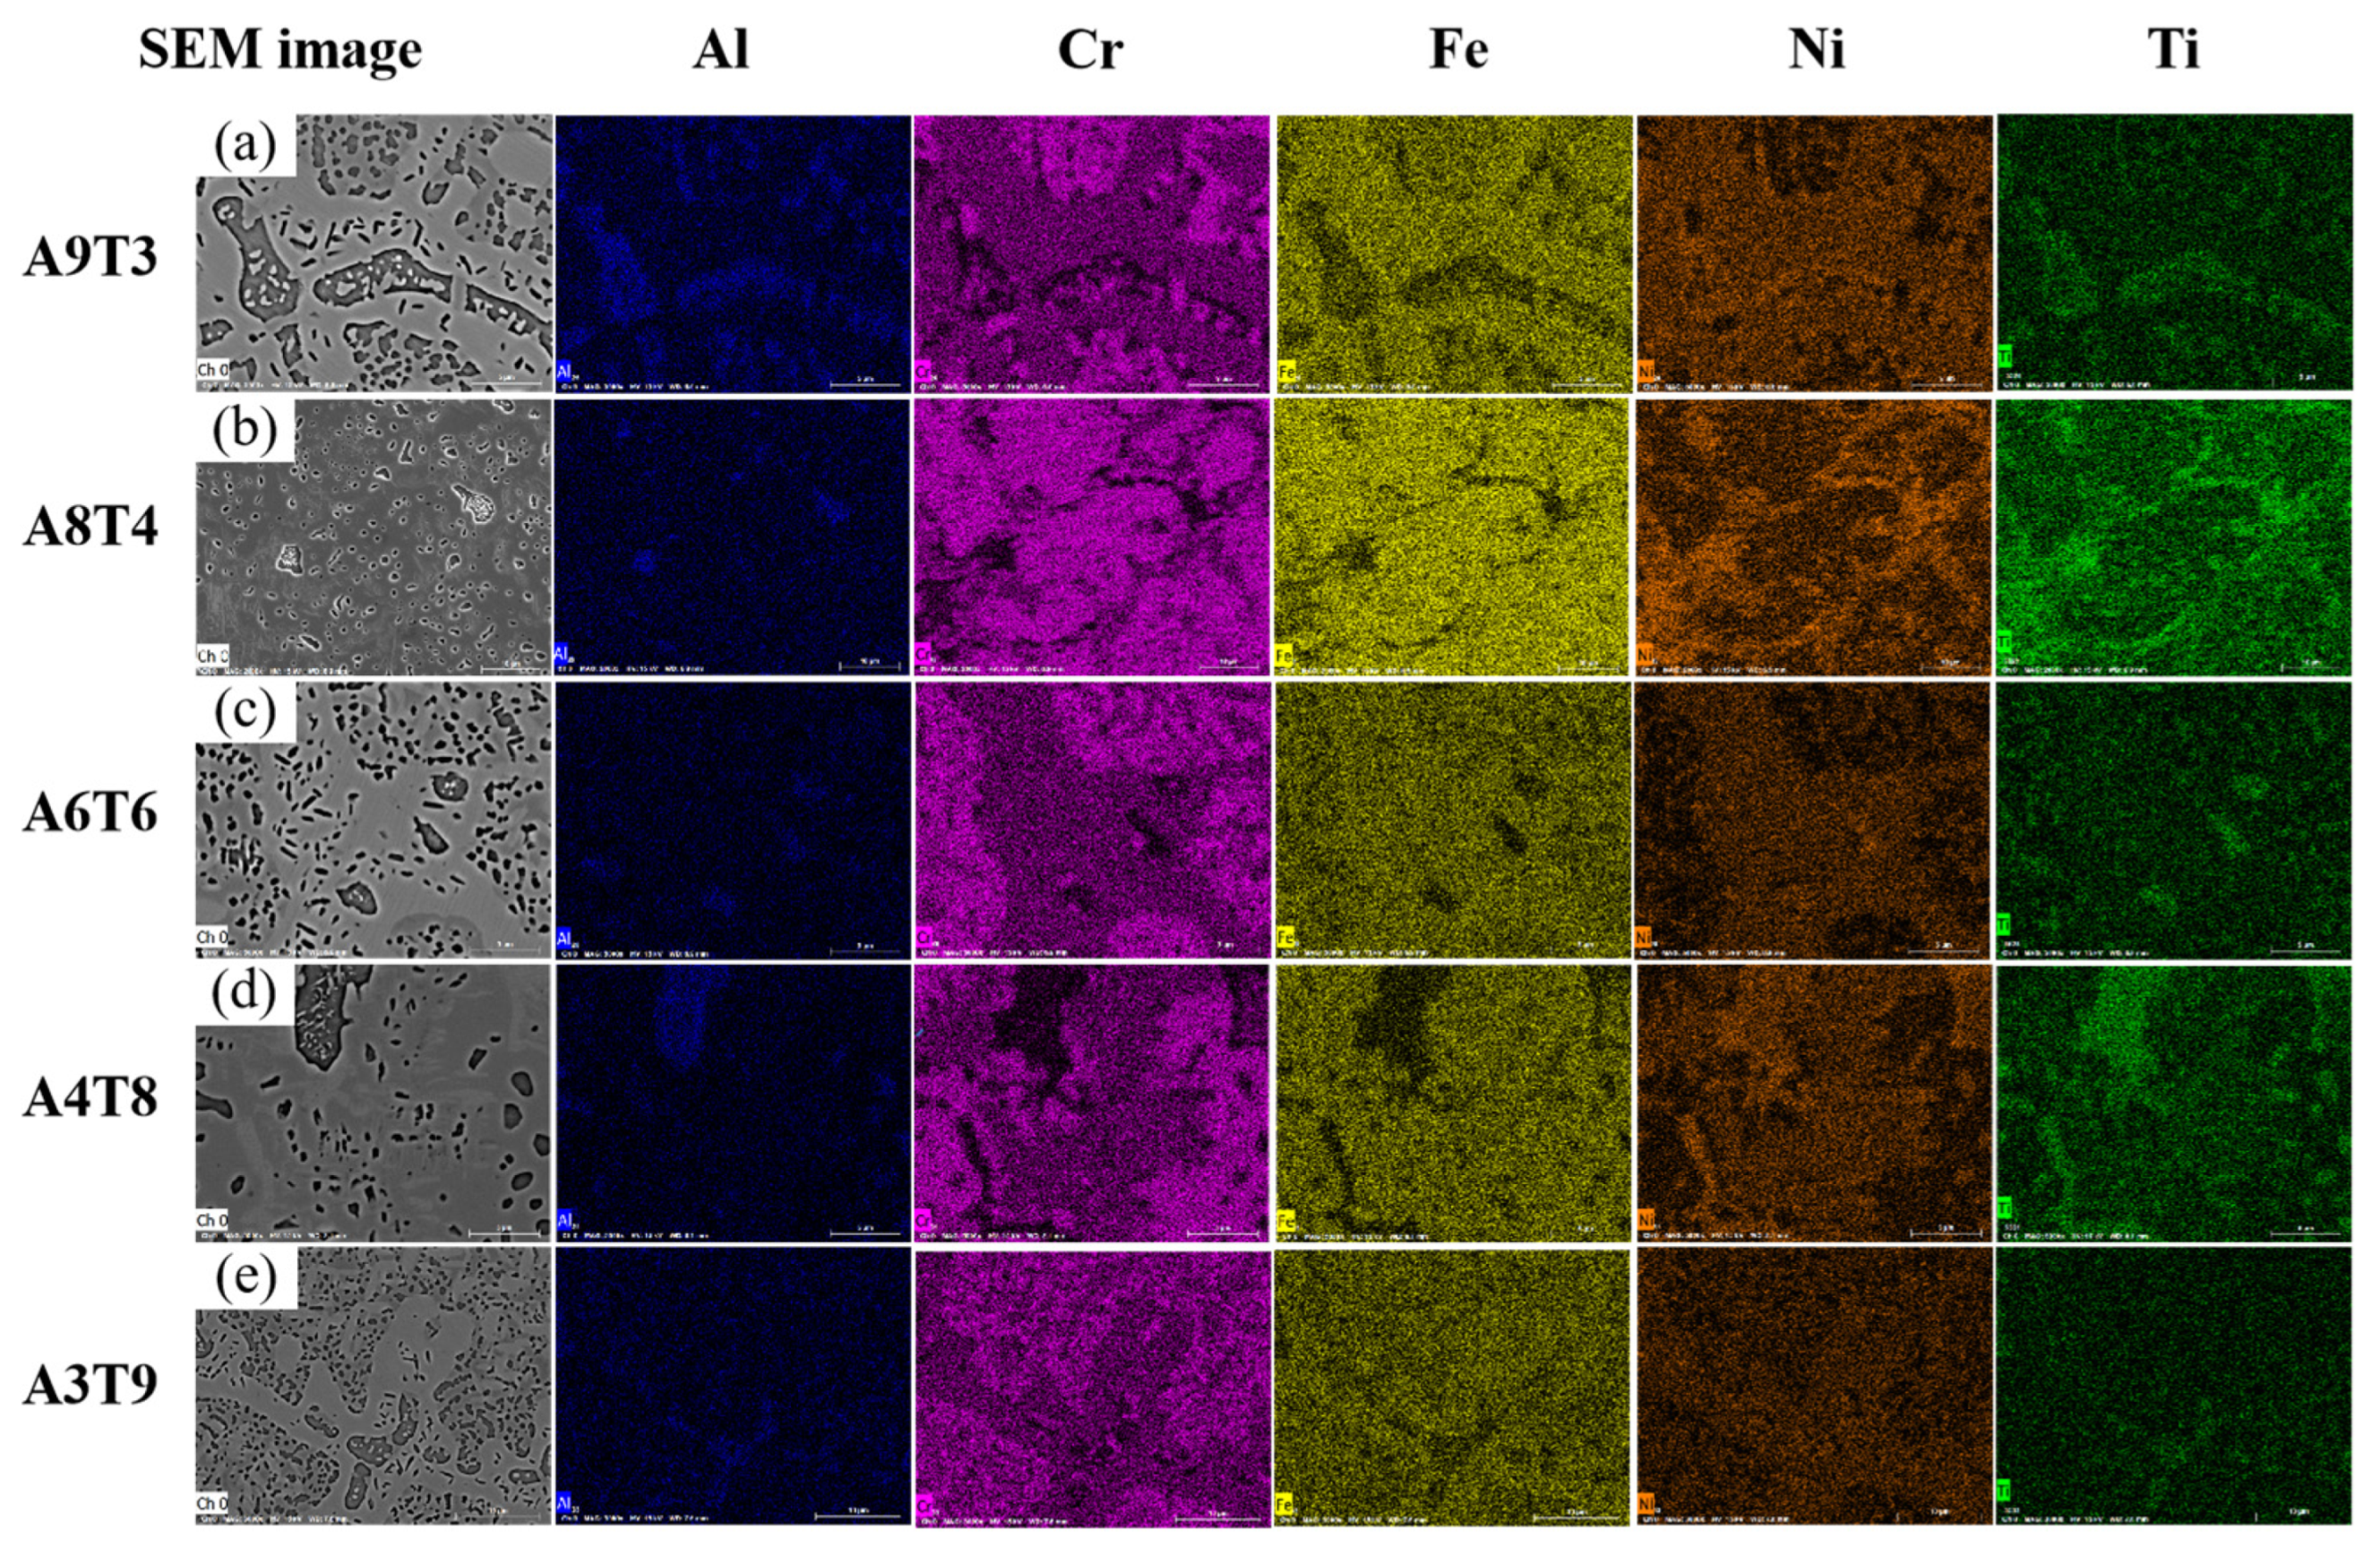
The SEM-BSE image of the cast alloy after corrosion exposure is presented in Figure 4, revealing a dendritic structure labeled as the A phase (interdendritic structure) and the B phase (dendritic structure). Additionally, a black elongated precipitated phase denoted as the C phase is observed primarily within the A phase between the dendrites. ImageJ software (ImageJ. 1.8.0) was utilized to calculate the average size of the dendrite structure for each composition, resulting in average dendrite sizes of 78 μm for A9T3, 28 μm for A8T4, 52 μm for A6T6, 24 μm for A4T8, and 74 μm for A3T9 alloys. Notably, among these compositions, the smallest dendritic structure was observed in the A4T8 alloy while an abnormally coarse appearance was noted in the dendrite structure of the A3T9 alloy when T content reached 9%. Figure 5 illustrates an elemental distribution surface scan diagram of the as-cast alloy indicating that Ni and Fe elements are predominantly present in Phase A whereas Cr and Fe elements dominate Phase B. Furthermore, higher concentrations of Al, Ti, and Ni elements are found within Phase C. No significant differences were observed regarding Fe element distribution between phases.
The SEM-BSE image of the alloy after annealing and corrosion treatment is presented in Figure 6. The phase composition rules remain consistent for A9T3, A6T6, and A3T9 alloys. The microstructure of the annealed samples shows no significant changes compared to the two-phase interwoven network structure observed in the as-cast state, except for the precipitation of new phases from dendritic and interdendritic regions. Similar to Figure 4, these phases are labeled as “A phase” (interdendritic structure) and “B phase” (dendritic structure). Additionally, a black elongated precipitated phase referred to as the “C phase” is found primarily within the A phase between dendrites. Figure 6f provides a locally enlarged view of Figure 6c, demonstrating that the C phase is mainly distributed within the A phase region. In the B phase, round rod-shaped light-colored phases were observed which are consistent with the color of A phase regions. Compared to as-cast alloys, previously nanoscale particles in the B phase exhibit growth phenomenon with an increase in size from a few hundred nanometers to a few micrometers. Similarly, microstructural and morphological changes in A8T4 and A4T8 alloys follow this regularity by presenting similar patterns where they become disordered while still retaining their dendrite structures observed in the as-cast state. To gain a deeper understanding of the distribution of elements within the alloy following annealing heat treatment, a mapping scan was performed, and the results are presented in Figure 7. The microstructural morphologies of A9T3, A6T6, and A3T9 alloys are notably different from those of A8T4 and A4T8 alloys, and these distinctions are discussed in this section. In the A9T3, A6T6, and A3T9 alloys, the segregation patterns of elements Al, Ti, Cr, Fe, and Ni are characterized by an interdendritic region enriched in Fe and Ni, a dendritic region with elevated concentrations of Cr and Fe, and a black elongated phase within the interdendritic region that is notably rich in Al, Ti, and Ni. Additionally, the black strip phase contains a white granular phase that is particularly enriched in Cr and Fe. In contrast, the A8T4 and A4T8 alloys exhibit distinct elemental distributions: the interdendritic regions are predominantly composed of Ni, Fe, and Cr, the dendritic regions show higher concentrations of Cr and Fe, the lamellar regions are enriched with Ni and Ti, the black striped C phase is significantly enriched with Al, Ni, and Ti, and the granular phase within the interdendritic regions also contains elevated levels of Al, Ni, and Ti.
Due to the similar microstructure of A9T3, A6T6, and A3T9 alloys before and after annealing treatment, the A6T6 alloy was selected as the target for study after annealing. To further investigate the nanoscale morphology and structure of dendrites and interdendritic regions, transmission electron microscopy (TEM) analysis was conducted. Figure 8a presents a bright-field TEM image of the annealed A6T6 alloy. Figure 8c displays a bright-field image showing precipitates in the dendritic structure. Figure 8b,d exhibit diffraction patterns along the [111] crystal band axis in regions A and C of Figure 8c, respectively. Figure 8f illustrates a high-resolution TEM image depicting the interface area between the precipitate phase and the dendrite phase. Figure 8e,g demonstrate diffraction patterns along the [111] crystal band axis in regions D and F of Figure 8f, respectively. As illustrated in the figure, a significant amount of precipitation particles, rich in Ni, Ti, and Al, are dispersed across the dendritic structure, displaying a size distribution that spans from a few hundred nanometers to several micrometers. Upon examination with high-resolution transmission electron microscopy (HRTEM) and selected area electron diffraction (SAED), it has been established that regions C and F correspond to diffraction patterns along the [111] crystallographic axis of the body-centered cubic (BCC) phase, featuring an interplanar spacing of roughly 0.204 nm for the (110) crystal plane. Conversely, regions A and D reveal diffraction patterns along the [111] crystallographic axis of the B2 phase, with an interplanar spacing of approximately 0.207 nm for the (110) crystal plane. By contrasting these findings with the standard PDF card diffraction peaks for the (110) crystal plane depicted in Figure 1b [34], it is inferred that region B represents a face-centered cubic (FCC) phase, whereas region C signifies an L12 structured solid solution phase. Additionally, there is a notable interfacial coherence between the FCC phase and the L12 structured solid solution phase.
Figure 9 presents the TEM image of the interdendritic structure of the A6T6 alloy post-annealing. Specifically, Figure 9b depicts the diffraction patterns along the [011] crystal band axis in region A of Figure 9a. Figure 9c illustrates the high-resolution TEM image of region A from Figure 9a, where the triangular area in the lower right corner of Figure 9c is subjected to diffraction analysis on both sides. Figure 9d,e displays the diffraction patterns along the [011] crystal band axis in regions B and C, respectively, of Figure 9c. In Figure 9b, the diffraction patterns along the [011] crystal band axis reveal weak superlattice diffraction spots. Upon examining the high-resolution TEM image in Figure 9c, the triangular area in the lower right corner is analyzed, and diffraction analysis is conducted on both sides of this area. In Figure 9d, which shows the diffraction patterns along the [011] crystal band axis in region B of Figure 9c, the absence of superlattice diffraction spots is noted, and the interplanar spacing of the (111) crystal face is approximately 0.211 nm. Conversely, Figure 9e illustrates that in the C region of Figure 9c, superlattice diffraction spots are distinctly visible, with the interplanar spacing of the (111) crystal face being approximately 0.212 nm. By comparing these results with the standard PDF card diffraction peak for the (110) crystal plane in Figure 1b [34], it is determined that the corresponding phase in region B is the FCC phase, and the phase in region C is the L12 structured solid solution phase. Notably, the FCC phase demonstrates good interfacial coherence with the L12 structured solid solution phase, indicating a stable microstructure.

3.2. Analysis of Compressive Properties at Room Temperature

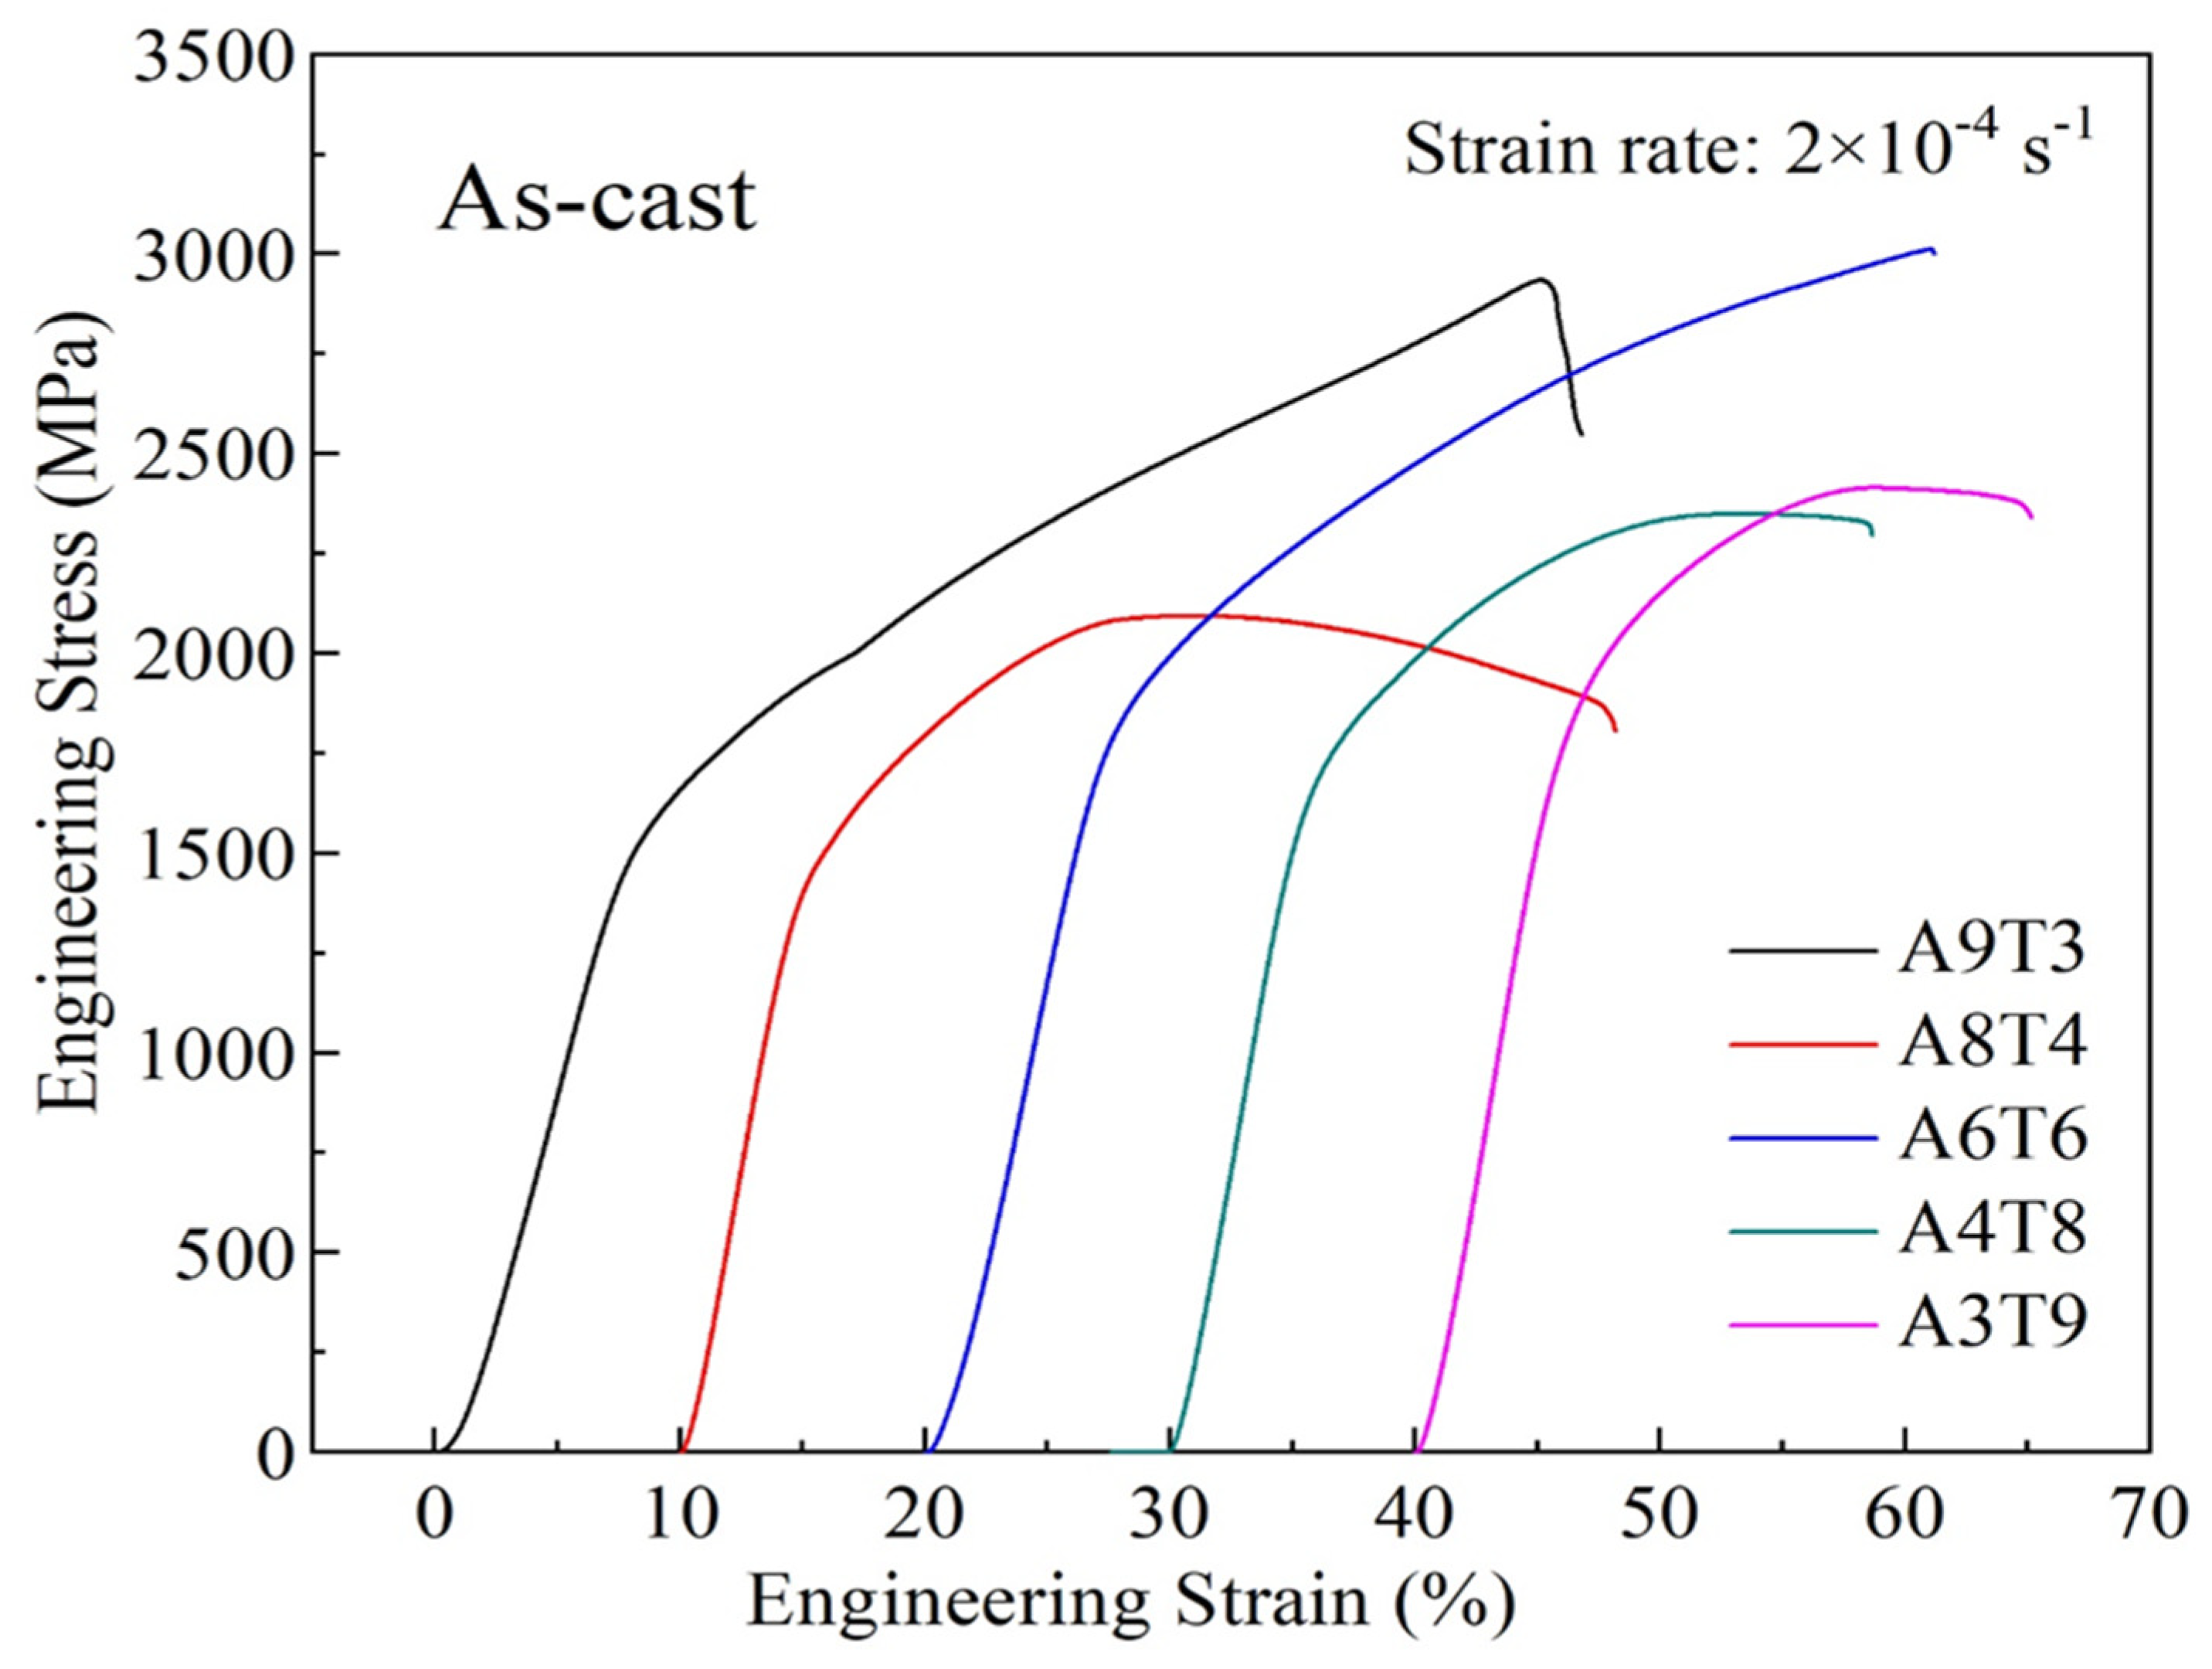
The engineering stress-strain curve of the sample is presented in Figure 10, with a test strain rate of 2 × 10⁻⁴ s−1. Table 5 provides the compressive property test results of as-cast alloys, including yield strength (σ0.2), fracture strength (σb), and degree of plastic strain (εp). As observed from the figure, the strain axes of the sample exhibit a stacking phenomenon. The data in Table 5 indicate that A8T4 alloy has a lower σ0.2 compared to A9T3 alloy, decreasing from 1435.93 MPa to 1338.13 MPa; likewise, its fracture strength decreases from 2934.41 MPa to 2093.71 MPa and plastic strain decreases from 36.4% to 32.4%. The highest σ0.2 value is achieved by the A6T6 sample at 1707.41 MPa, accompanied by σb and plastic strain values of 3010.29 MPa and 32.8%, respectively. As titanium content increases, the plastic strain of alloys continues to decrease. Compared to A9T3 alloy, the A3T9 alloy exhibits superior strength but poorer plasticity with a minimum plastic strain value of 17.6%.
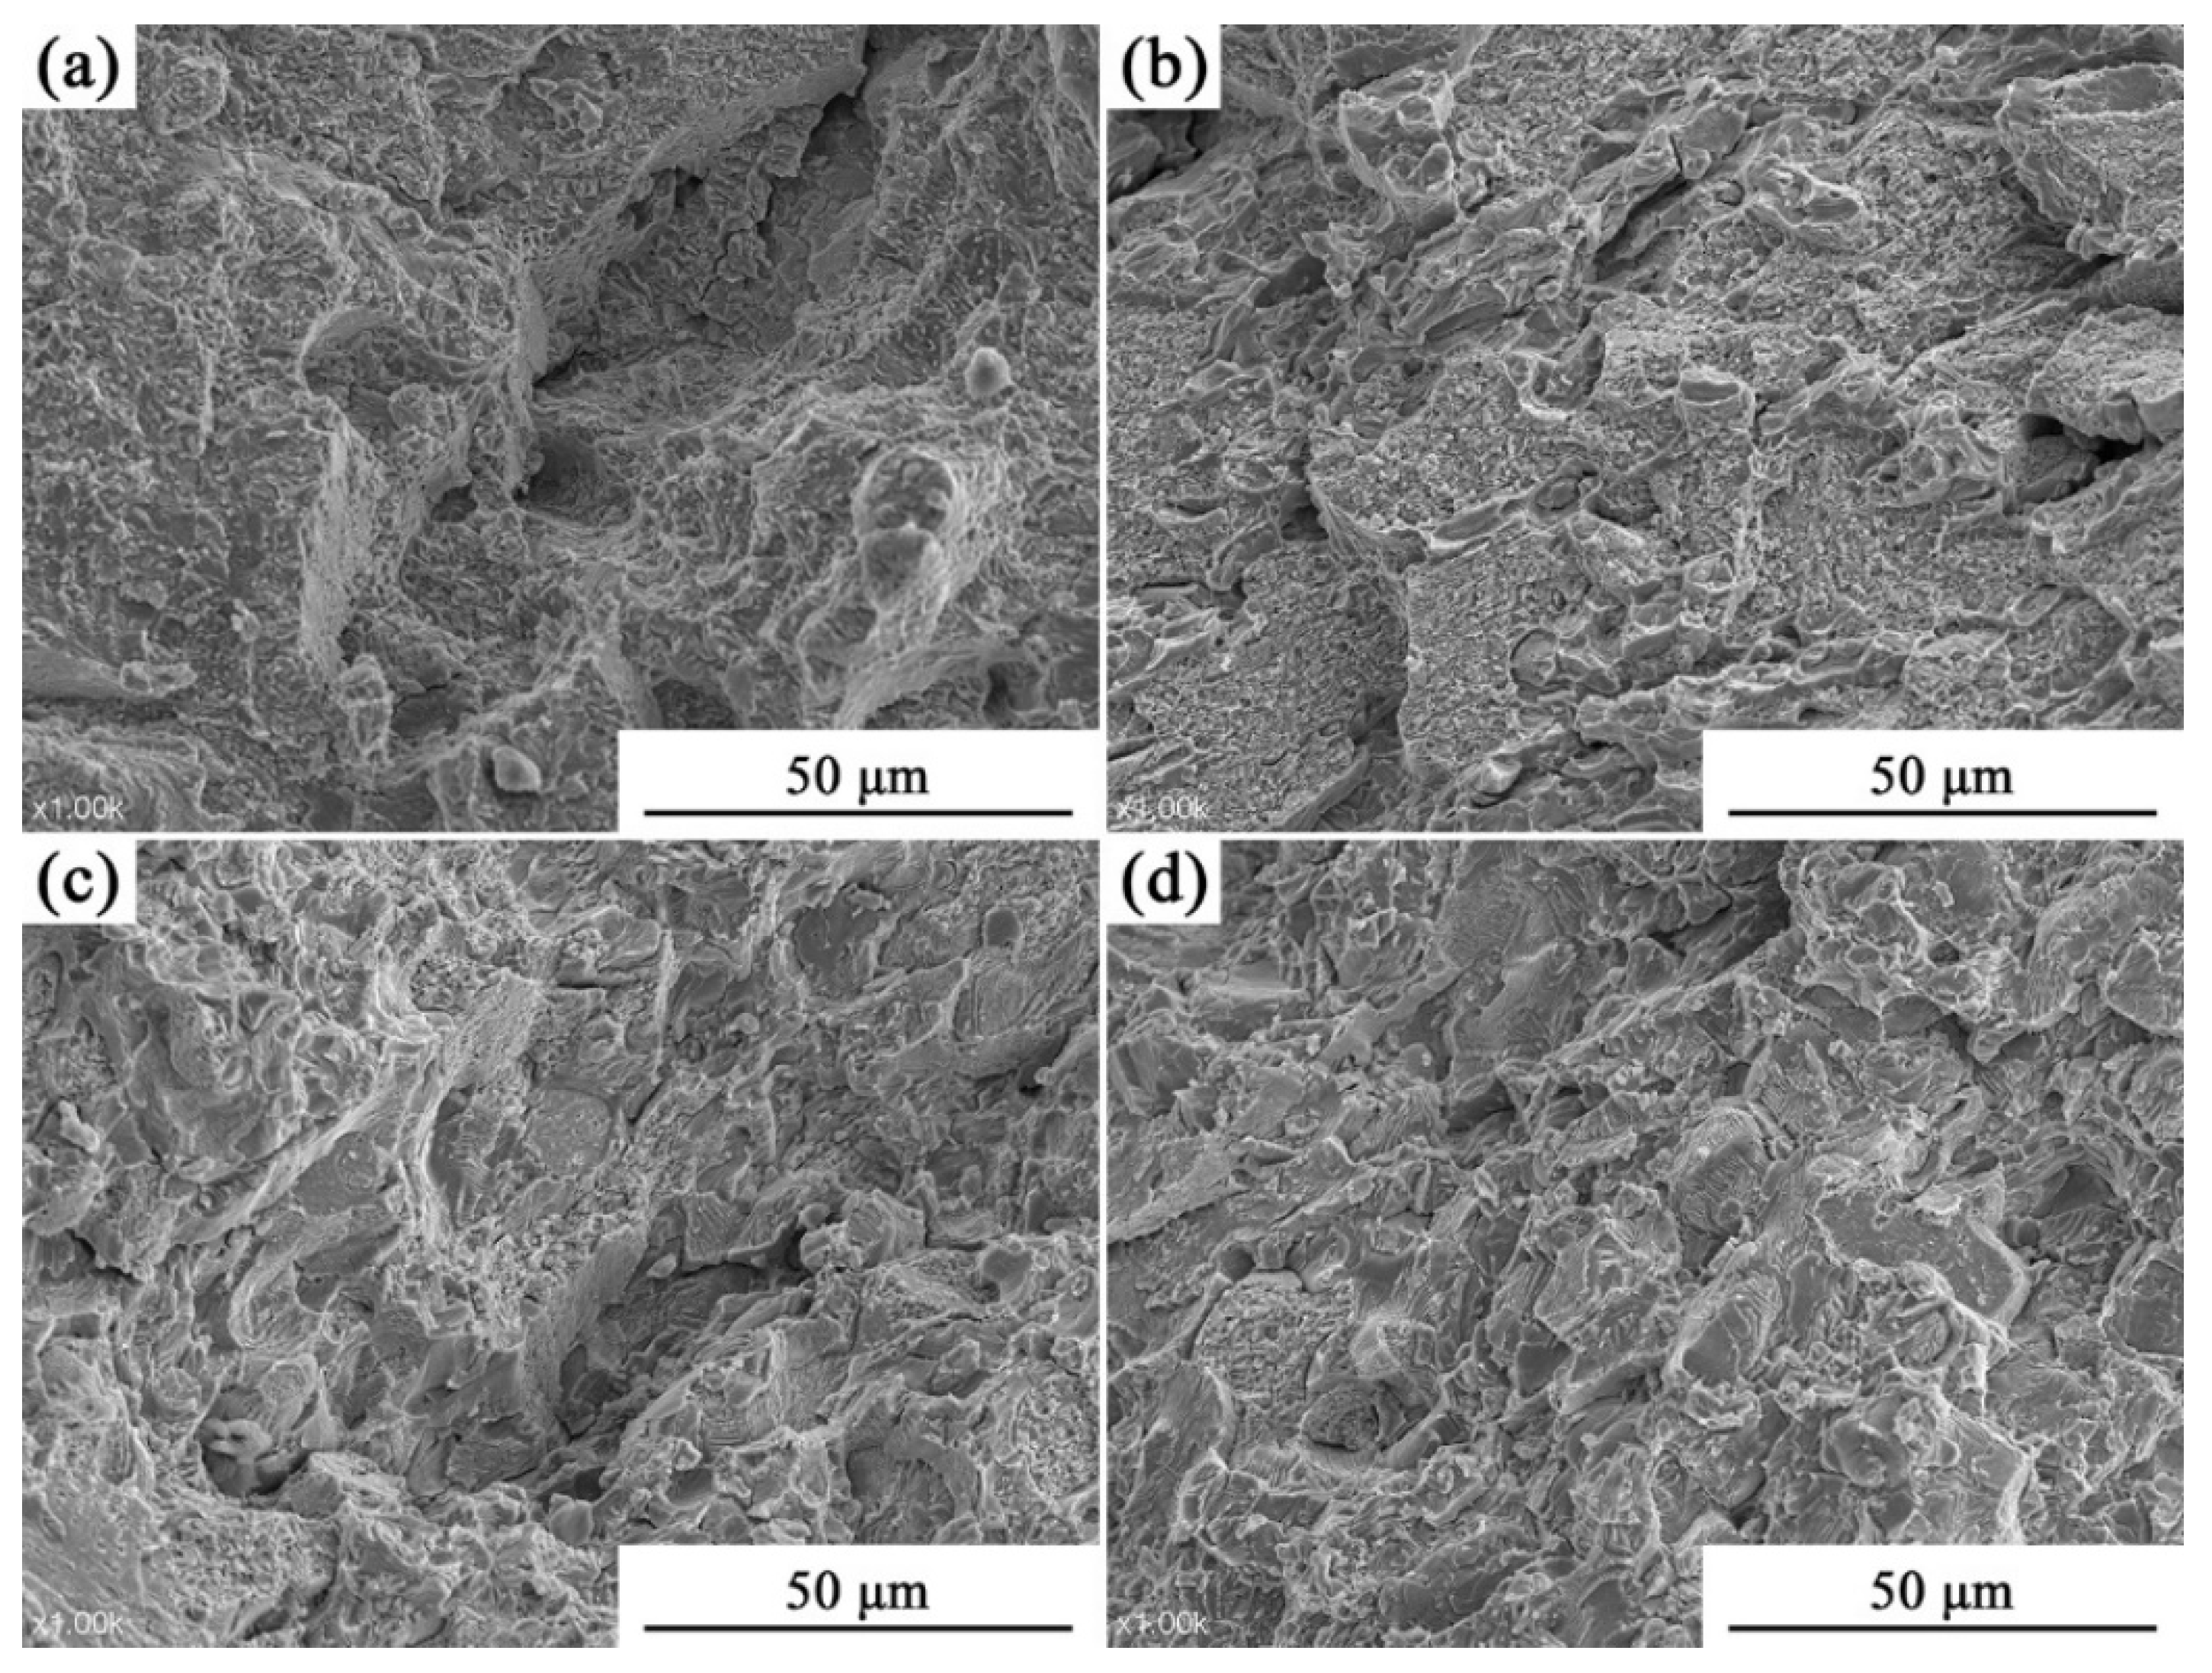
The fracture morphology of a cast alloy was examined using scanning electron microscopy in secondary electron mode following compressive mechanical properties testing to analyze the fracture mechanisms of the alloy specimens. Figure 11 illustrates the microscopic morphology of the fracture surface of an as-cast alloy sample. The A9T3 alloy exhibited excellent plasticity, as demonstrated by its intact and bonded state after compression testing. Consequently, we scrutinized the fracture surfaces of other samples. Figure 11a,b reveals a distinct dimple morphology characterized by numerous concave or convex micro pits on the fracture surface, within which second-phase particles are visible. Furthermore, a flat and shiny cleavage fracture morphology was also observed with numerous tearing edges interspersed with dimples, indicative of a typical quasi-cleavage fracture pattern. In Figure 11c, fewer dimples and a more pronounced cleavage morphology can be seen. Figure 11d primarily shows a cleavage morphology with fewer dimples but more visible tearing edges and discernible layer structure in the cleaved layers. The A3T9 alloy also exhibits quasi-cleavage fractures but demonstrates the highest tendency towards brittleness among all samples tested. From Figure 11a–d, it is evident that increasing titanium content progressively diminishes the plasticity of these alloys while shifting their fracture behavior from ductile to brittle.
The stress–strain curve for the compressive test of alloys subjected to homogenization annealing heat treatment is depicted in Figure 12a, conducted at a strain rate of 2 × 10⁻⁴ s−1. Table 6 showcases the outcomes of the compressive property tests on the annealed alloys, encompassing yield strength (σ0.2), fracture strength (σb), and degree of plastic strain (εp). Figure 12a reveals that annealed alloys possess a higher fracture strength (>2200 MPa), although the plastic strain diminishes to various extents. However, the yield strength varies irregularly, a consequence of the complex microstructural and morphological alterations induced by the annealing heat treatment. Post-annealing, both A9T3 and A6T6 alloys experience a reduction in uniform strength and fracture strength to varying degrees, due to the diminished solid solution strengthening effect of Ti elements, as evidenced by the reduced alloy hardness. The comparatively high yield strength of the A6T6 alloy can be ascribed to its finer grain size and the increased presence of Ti atoms in solid solution. A8T4 and A4T8 alloys undergo significant microstructural transformations post-annealing, characterized by a profusion of σ phases and a substantial increase in yield strength from the formation of Ni3Ti phases. Notably, the A8T4 sample boasts the highest σ0.2 value (2361.22 MPa) and σb value (2602.28 MPa), yet it displays a low fracture strain at merely 0.6%. Following annealing, the A3T9 sample exhibits an increase in σ0.2; however, this results in a diminished fracture strength, leading to a lower plastic strain at 7.2%.
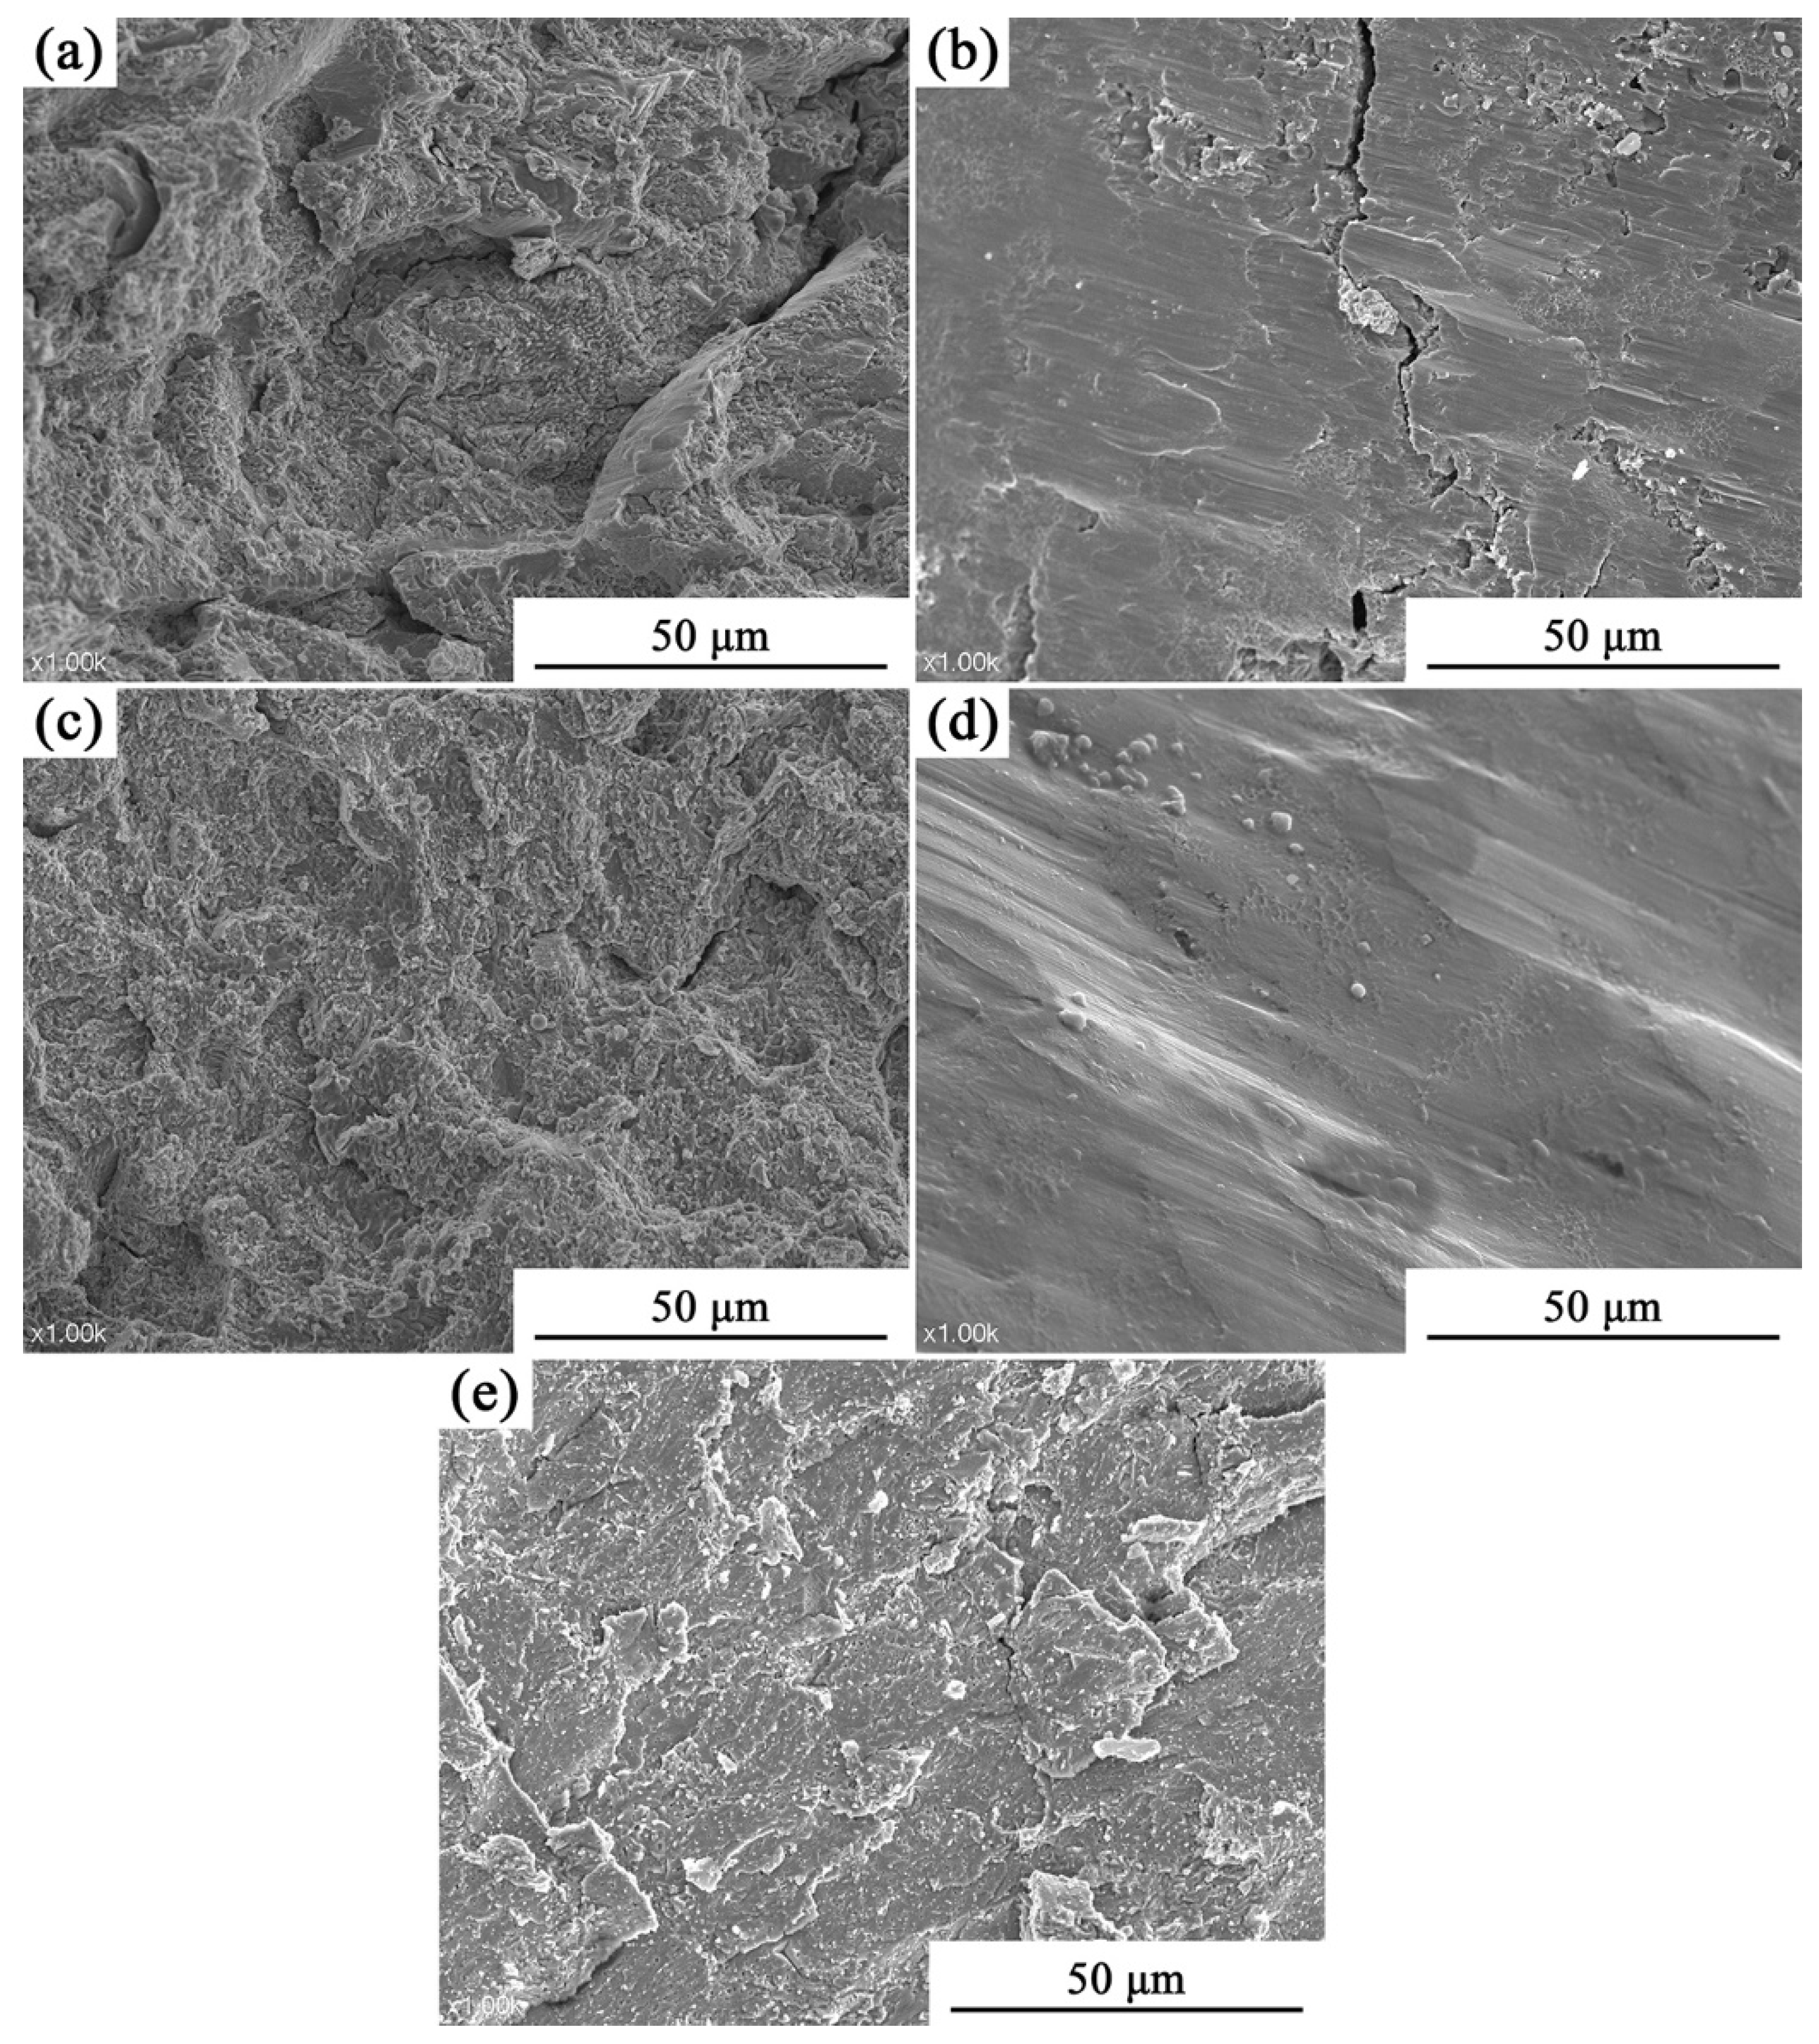
The fracture morphology of samples after room-temperature compression mechanical properties testing of the annealed alloy is depicted in Figure 13. After prolonged annealing treatment, a significant reduction in the plasticity of the alloy is observed. Notably, Figure 13a,c exhibits distinct dimple morphology with second-phase particles observed within the dimples, indicating coarser particle size compared to cast alloys. Additionally, a flat and shiny dissociation fracture morphology can be observed without any friction marks on the surface, suggesting quasi-dissociation fracture characteristics. Figure 13b reveals compound precipitation that increases brittleness at grain boundaries. Moreover, secondary cracks are evident which disperse stress during deformation and contribute to reduced plasticity following prolonged annealing treatment. The presence of compound precipitation in Figure 13b enhances the brittleness of grain boundaries, thereby increasing their susceptibility to fracture. Notably, secondary cracks are observed which effectively disperse stress from the main crack during alloy deformation, resulting in high yield strength. Friction marks on the shear fracture surface can be observed in Figure 13b,d, exhibiting a flat and river-like pattern indicative of step connection dissociation. Additionally, evident secondary cracks are also present in Figure 13d, indicating that A4T8 alloy possesses relatively high strength and exhibits dissociation fracture behavior. In Figure 13e, a typical shear fracture morphology is displayed as a result of shear failure, characterized by friction marks and a layered organizational structure representative of quasi-dissociation fracture behavior. Compared to as-cast alloys, annealing significantly reduces the plasticity of the alloy while inducing significant changes in microstructure and morphology for both A8T4 and A4T8 alloys, ultimately leading to an inability to maintain their original fracture behavior.

4. Conclusions

In this comprehensive study, we conducted a meticulous examination of the Alx(CrFeNi)88Ti(12−x) alloy, with a particular emphasis on elucidating its intricate microstructural composition and correlating it with its mechanical behavior. Our findings reveal that this alloy is predominantly composed of body-centered cubic (BCC), face-centered cubic (FCC), B2, and L21 phases, which collectively contribute to its characteristic dendritic architecture. Importantly, this architecture remains remarkably stable even under prolonged annealing treatments. Additionally, the incorporation of titanium into the as-cast alloy has been demonstrated to significantly enhance its strength, albeit at the expense of a concomitant reduction in ductility. This is exemplified by a notable increase in yield strength from 1338.13 MPa to 1707.41 MPa, accompanied by a substantial decrease in ductility from 36.4% to 17.6%. However, it is noteworthy that post-annealing leads to a decline in the compressive properties of the alloy, characterized by an isolated rise in yield strength and simultaneous reductions in fracture strength and ductility. The intricate interplay between microstructural evolution and mechanical properties in these alloys is underscored by these observations. These findings have profound implications for the advancement of alloy design and the development of high-performance materials. By meticulously adjusting the alloy composition and optimizing heat treatment protocols, it becomes feasible to tailor the mechanical properties of the alloy to meet specific application requirements. This study is expected to enhance the existing knowledge in alloy design and serve as a valuable reference for future innovations in materials science.

Author Contributions

K.A.: Writing—original draft, Formal analysis, Validation, Investigation, Methodology. T.Y.: Validation, Formal analysis. J.F.: Validation. H.D.: Validation. X.Z.: Validation. Z.Z.: Validation. Q.M.: Validation. J.Q.: Validation. F.W.: Validation. Y.S.: Writing—Review and Editing, Supervision, Funding acquisition. All authors have read and agreed to the published version of the manuscript.

Funding

This work was financially supported by the National Natural Science Foundation of China (52171227) and the Xuzhou Science and Technology Project (kc22483).

Data Availability Statement

The raw data supporting the conclusions of this article will be made available by the authors on request.

Conflicts of Interest

Author Keyan An was employed by the company Huaihai Holding Group. The remaining authors declare that the research was conducted in the absence of any commercial or financial relationships that could be construed as a potential conflict of interest.

References

  1. Joseph, J.; Senadefra, M.; Chao, Q.; Shamlaye, K.; Rana, S.; Gupta, S.; Venkatesh, S.; Hodgson, P.; Barnett, M.; Fabijanic, D.; et al. Computational design of thermally stable and precipitation-hardened Al-Co-Cr-Fe-Ni-Ti high entropy alloys. J. Alloys Compd. 2021, 888, 161496. [Google Scholar] [CrossRef]
  2. Kim, M.J.; Kang, G.C.; Hong, S.H.; Park, H.J.; Mun, S.C.; Song, G.; Kim, K.B. Understanding microstructure and mechanical properties of (AlTa0.76)xCoCrFeNi2.1 eutectic high entropy alloys via thermo-physical parameters. J. Mater. Sci. Technol. 2020, 57, 131–137. [Google Scholar] [CrossRef]
  3. Makhmutov, T.; Razumov, N.; Kim, A.; Ozerskoy, N.; Mazeeva, A.; Popovich, A. Synthesis of CoCrFeNiMnW0.25 High-Entropy Alloy Powders by Mechanical Alloying and Plasma Spheroidization Processes for Additive Manufacturing. Met. Mater. Int. 2021, 27, 50–54. [Google Scholar] [CrossRef]
  4. Yang, C.-B.; Zhang, J.; Li, M.; Liu, X.-J. Soft-magnetic high-entropy AlCoFeMnNi alloys with dual-phase microstructures induced by annealing. Acta Metall. Sin. (Engl. Lett.) 2020, 33, 1124–1134. [Google Scholar] [CrossRef]
  5. Zhang, Y.P.; Shen, Q.K.; Chen, X.Z.; Jayalakshmi, S.; Singh, R.A.; Konovalov, S.; Deev, V.B.; Prusov, E.S. Strengthening Mechanisms in CoCrFeNiX0.4 (Al, Nb, Ta) High Entropy Alloys Fabricated by Powder Plasma Arc Additive Manufacturing. Nanomaterials 2021, 11, 721. [Google Scholar] [CrossRef]
  6. Peng, J.; Li, Z.-Y.; Ji, X.-B.; Sun, Y.-L.; Fu, L.-M.; Shan, A.-D. Decomposition kinetics of carbon-doped FeCoCrNiMn high-entropy alloy at intermediate temperature. Trans. Nonferrous Met. Soc. China 2020, 30, 1884–1894. [Google Scholar] [CrossRef]
  7. Jiang, H.; Qiao, D.X.; Jiao, W.N.; Han, K.; Yiping, L.; Liaw, P.K. Tensile deformation behavior and mechanical properties of a bulk cast Al0.9CoFeNi2 eutectic high-entropy alloy. J. Mater. Sci. Technol. 2021, 61, 119–124. [Google Scholar] [CrossRef]
  8. Yuan, Y.; Wang, J.J.; Wei, J.; Chen, W.Y.; Yan, H.L.; Jia, N. Cu alloying enables superior strength-ductility combination and high corrosion resistance of FeMnCoCr high entropy alloy. J. Alloys Compd. 2024, 970, 172543. [Google Scholar] [CrossRef]
  9. Zhang, Z.; Li, X.; Yi, H.; Xie, H.; Zhao, Z.; Bai, P. Clarify the role of Nb alloying on passive film and corrosion behavior of CoCrFeMnNi high entropy alloy fabricated by laser powder bed fusion. Corros. Sci. 2023, 224, 111510. [Google Scholar] [CrossRef]
  10. Liu, B.; Li, J.; Peterlechner, M.; Zhang, H.; Wu, Y.; Wilde, G.; Ye, F. Microstructure and mechanical properties of Si micro-alloyed (Ti28Zr40Al20Nb12)100-xSix (x=0, 0.1, 0.2, 0.5) high entropy alloys. Intermetallics 2023, 161, 107959. [Google Scholar] [CrossRef]
  11. Gao, S.; Kong, T.; Zhang, M.; Chen, X.; Sui, Y.-W.; Ren, Y.-J.; Qi, J.-Q.; Wei, F.-X.; He, Y.-Z.; Meng, Q.-K.; et al. Effects of titanium addition on microstructure and mechanical properties of CrFeNiTix (x=0.2–0.6) compositionally complex alloys. J. Mater. Res. 2019, 34, 819–828. [Google Scholar] [CrossRef]
  12. Wang, L.L.; Zhou, J.Q.; Liu, H.X.; Zhang, F. Severe grain rotation behavior of L12-B2 nano lamellar eutectic structure. Mater. Lett. 2021, 302, 130393. [Google Scholar] [CrossRef]
  13. Cao, Y.-K.; Liu, Y.; Liu, B.; Zhang, W.-D.; Wang, J.-W.; Du, M. Effects of Al and Mo on high temperature oxidation behavior of refractory high entropy alloys. Trans. Nonferrous Met. Soc. China 2019, 29, 1476–1483. [Google Scholar] [CrossRef]
  14. Guo, R.; Pan, J.; Liu, L. Achieving dual-phase structure and improved mechanical properties in AlCoCrFeTi0.5 high-entropy alloys by addition of Ni. Mater. Sci. Eng. A 2022, 831, 142194. [Google Scholar] [CrossRef]
  15. Abhishek, M.; Yong, H.S. Fundamental Core Effects in Transition Metal High-Entropy Alloys: “High-Entropy” and “Sluggish Diffusion” Effects. Diffus. Found. 2021, 29, 75–93. [Google Scholar]
  16. Cai, Y.C.; Zhu, L.S.; Cui, Y.; Geng, K.; Han, T.; Manladan, S.M.; Luo, Z.; Han, J. Influence of high-temperature condition on the microstructure and properties of FeCoCrNiAl0.3 and FeCoCrNiAl0.7 high-entropy alloy coatings. Surf. Eng. 2021, 37, 179–187. [Google Scholar] [CrossRef]
  17. Gong, X.; Xiang, C.Y.; Auger, T.; Chen, J.; Liang, X.; Yu, Z.; Short, M.P.; Song, M.; Yin, Y. Liquid metal embrittlement of a dual-phase Al0.7CoCrFeNi high-entropy alloy exposed to oxygen-saturated lead-bismuth eutectic. Scr. Mater. 2021, 194, 113652. [Google Scholar] [CrossRef]
  18. Wen, X.; Cui, X.F.; Jin, G.; Liu, Y.; Zhang, Y.; Fang, Y. In-situ synthesis of nano-lamellar Ni1.5CrCoFe0.5Mo0.1Nbx eutectic high-entropy alloy coatings by laser cladding: Alloy design and microstructure evolution. Surf. Coat. Technol. 2021, 405, 126728. [Google Scholar] [CrossRef]
  19. Feng, S.; Fu, H.D.; Zhou, H.Y.; Wu, Y.; Lu, Z.; Dong, H. A general and transferable deep learning framework for predicting phase formation in materials. NPJ Comput. Mater. 2021, 7, 10. [Google Scholar] [CrossRef]
  20. Yan, Y.R.; Fang, L.Y.; Tan, Y.K.; Tao, X.M.; Ouyang, Y.F.; Du, Y. Mechanical properties and corrosion resistance of AlxCoCuFeMn high-entropy alloys. J. Mater. Res. Technol. 2023, 24, 5250–5259. [Google Scholar] [CrossRef]
  21. Zhang, M.D.; Ma, Y.M.; Dong, W.Q.; Liu, X.; Lu, Y.; Zhang, Y.; Li, R.; Wang, Y.; Yu, P.; Gao, Y.; et al. Phase evolution, microstructure, and mechanical behaviors of the CrFeNiAlxTiy medium-entropy alloys. Mater. Sci. Eng. A 2020, 771, 138566. [Google Scholar] [CrossRef]
  22. Kao, W.H.; Su, Y.L.; Horng, J.H.; Wu, W.C. Mechanical, tribological, anti-corrosion and anti-glass sticking properties of high-entropy TaNbSiZrCr carbide coatings prepared using radio-frequency magnetron sputtering. Mater. Chem. Phys. 2021, 268, 124741. [Google Scholar] [CrossRef]
  23. Li, Y.T.; Wang, C.T.; Ma, D.L.; Zeng, X.; Liu, M.; Jiang, X.; Leng, Y.X. Nano dual-phase CuNiTiNbCr high entropy alloy films produced by high-power pulsed magnetron sputtering. Surf. Coat. Technol. 2021, 420, 127325. [Google Scholar] [CrossRef]
  24. Kumar, A.; Singh, A.; Suhane, A. A critical review on mechanically alloyed high entropy alloys: Processing challenges and properties. Mater. Res. Express 2022, 9, 52001. [Google Scholar] [CrossRef]
  25. Zhang, G.Z.; Liu, H.; Tian, X.H.; Chen, P.; Yang, H.; Hao, J. Microstructure and Properties of AlCoCrFeNiSi High-Entropy Alloy Coating on AISI 304 Stainless Steel by Laser Cladding. J. Mater. Eng. Perform. 2020, 29, 278–288. [Google Scholar] [CrossRef]
  26. Qiu, H.; Zhu, H.G.; Zhang, J.F.; Xie, Z. Effect of Fe content upon the microstructures and mechanical properties of FexCoNiCu high entropy alloys. Mater. Sci. Eng. A 2020, 769, 138514. [Google Scholar] [CrossRef]
  27. Wang, H.J.; Wu, Z.Y.; Wu, H.; Zhu, H.; Tang, W. In Situ TiC Particle-Reinforced FeCoCrNiCu High Entropy Alloy Matrix Composites by Induction Smelting. Trans. Indian Inst. Met. 2021, 74, 267–272. [Google Scholar] [CrossRef]
  28. Jin, B.Q.; Zhang, N.N.; Zhang, Y.; Li, D.Y. Microstructure, phase composition and wear resistance of low valence electron concentration AlxCoCrFeNiSi high-entropy alloys prepared by vacuum arc melting. J. Iron Steel Res. Int. 2020, 28, 181–189. [Google Scholar] [CrossRef]
  29. Chen, C.L. Study of (Ni, Cr) pre-milling for synthesis of CoFe(NiCr)Mn high entropy alloy by mechanical alloying. Mater. Sci. Eng. A 2021, 807, 140810. [Google Scholar]
  30. Hansol, S.; Seungjin, N.; Hyunjoo, C. Development of porous high-entropy alloys by mechanical alloying and chemical de-alloying. Powder Metall. 2021, 64, 211–218. [Google Scholar]
  31. Wu, X.X.; Mayweg, D.; Ponge, D.; Li, Z. Microstructure and deformation behavior of two TWIP/TRIP high entropy alloys upon grain refinement. Mater. Sci. Eng. A 2021, 802, 140661. [Google Scholar] [CrossRef]
  32. Calin, M.; Vishnu, J.; Thirathipviwat, P.; Popa, M.M.; Krautz, M.; Manivasagam, G.; Gebert, A. Tailoring biocompatible Ti-Zr-Nb-Hf-Si metallic glasses based on high-entropy alloys design approach. Mater. Sci. Eng. C Mater. Biol. Appl. 2021, 121, 111733. [Google Scholar] [CrossRef] [PubMed]
  33. Miklós, K.D.; Nikolett, M.P.; Éva, F. Examination of microstructure and corrosion properties of novel AlCoCrFeNi multicomponent alloy. Mater. Today Proc. 2021, 45, 4250–4253. [Google Scholar]
  34. Wang, C.-C.; Chen, J.-H.; Yeh, J.-W. Microstructure evolution in high-pressure phase transformations of CrFeNi and CoCrFeMnNi alloys. J. Alloys Compd. 2022, 98, 165383. [Google Scholar] [CrossRef]
Figure 1. XRD patterns of as-cast and annealed alloys: (a) as-cast; (b) after annealing.
Metals 14 01223 g001
Figure 2. The OM images of as-cast: (a) A9T3; (b) A8T4; (c) A6T6; (d) A4T8; (e) A3T9; and (f) A6T6.
Metals 14 01223 g002
Figure 3. The OM images of the alloy after annealing at 800 °C: (a) A9T3; (b) A8T4; (c) A6T6; (d) A4T8; (e) A3T9; and (f) A6T6.
Metals 14 01223 g003
Figure 4. SEM-BSE image of the as-cast alloy: (a) A9T3; (b) A8T4; (c) A6T6; (d) A4T8; (e) A3T9; and (f) A6T6.
Metals 14 01223 g004
Figure 5. Surface scan of as-cast alloy: (a) A9T3; (b) A8T4; (c) A6T6; (d) A4T8; and (e) A3T9.
Metals 14 01223 g005
Figure 6. SEM-BSE image of the alloy after annealing: (a) A9T3; (b) A8T4; (c) A6T6; (d) A4T8; (e) A3T9; and (f) A6T6.
Metals 14 01223 g006
Figure 7. Surface scan of alloy after annealing: (a) A9T3; (b) A8T4; (c) A6T6; (d) A4T8; and (e) A3T9.
Metals 14 01223 g007
Figure 8. TEM images of annealed A6T6 alloy: (a,c) Bright-field images of annealed A6T6 alloy; (b,d) the corresponding SAED patterns of zone A and zone B along the [111] zone axis; (e,g) the corresponding SAED patterns of zone D and zone F along the [111] zone axis; and (f) HRTEM of zone B.
Metals 14 01223 g008
Figure 9. TEM images of annealed A6T6 alloy: (a) TEM images of dendrites; (b) the corresponding SAED patterns of zone A along the [011] zone axis; (c) HRTEM of zone A; and (d,e) the corresponding SAED patterns of zone A and zone B along the [011] zone axis.
Metals 14 01223 g009
Figure 10. Compressive engineering stress-strain curves of as-cast alloys at room temperature.
Metals 14 01223 g010
Figure 11. Compressive fracture morphology of as-cast Alx(CrFeNi)88Ti(12−x) alloy at room temperature: (a) A8T4; (b) A6T6; (c) A4T8; and (d) A3T9.
Metals 14 01223 g011
Figure 12. Compressive engineering stress–strain curves of alloys after annealing at room temperature (a); (bf) comparison between as-cast and annealed states.
Metals 14 01223 g012
Figure 13. Compressive fracture morphology of annealed Alx(CrFeNi)88Ti(12−x) alloy at room temperature: (a) A9T3; (b) A8T4; (c) A6T6; (d) A4T8; and (e) A3T9.
Metals 14 01223 g013
Table 1. Basic properties of alloying elements.
ElementAlCrFeNiTi
Atomic weight, g/mol26.985255.8558.6947.87
Atomic radius,Å1.4321.2491.2411.2461.47
Melting point, °C660.251857153514531668
Crystal Structure (Low Temperature)FCCBCCBCCFCCHCP
Crystal Structure (High Temperature)FCCBCCBCCFCCBCC
Table 2. Mass percentage and liquidus temperature of AlxCrFeNiTiy alloy components.
AlloyAl/wt. %Cr/wt. %Ti/wt. %Fe/wt. %Ni/wt. %Liquidus
Temperature (K)
Al9(CrFeNi)88Ti3529331331795.21
Al8(CrFeNi)88Ti4429431331802.48
Al6(CrFeNi)88Ti6329531321817.02
Al4(CrFeNi)88Ti8228.377.1230.46321831.56
Al3(CrFeNi)88Ti91.49928.267.98830.35131.901838.83
Table 3. Thermodynamic data of AlxCrFeNiTiy alloy.
AlloyΔHmixΔSmixδ/%VECΩTm/K
Al9(CrFeNi)88Ti3−10.38311.6494.77.431.61795.21
Al8(CrFeNi)88Ti4−10.63111.7234.77.441.6351802.48
Al6(CrFeNi)88Ti6−11.05511.784.87.461.7051817.02
Al4(CrFeNi)88Ti8−11.38211.7234.97.481.7781831.56
Al3(CrFeNi)88Ti9−11.5111.6494.97.491.8171838.83
Table 4. Mixing enthalpy between elements.
Mixing EnthalpyTiCrAlFeNi
Ti0−7−30−17−35
Cr 0−10−1−7
Al 0−11−22
Fe 0−2
Ni 0
Table 5. Compressive properties of as-cast Alx(CrFeNi)88Ti(12−x) alloys at room temperature.
Alloyσ0.2 (MPa)σb (MPa)εp (%)
Al9(CrFeNi)88Ti31436 ± 212935 ± 3036.4 ± 1
Al8(CrFeNi)88Ti41338 ± 202094 ± 3032.4 ± 1
Al6(CrFeNi)88Ti61707 ± 243010 ± 4232.8 ± 1
Al4(CrFeNi)88Ti81574 ± 222349 ± 3422.3 ± 1
Al3(CrFeNi)88Ti91698 ± 242414 ± 3517.6 ± 1
Table 6. Compressive properties of annealed Alx(CrFeNi)88Ti(12−x) alloys at room temperature.
Alloyσ0.2 (MPa)σb (MPa)εp (%)
Al9(CrFeNi)88Ti31302.6 ± 132578.1 ± 2525.8 ± 0.4
Al8(CrFeNi)88Ti42361.2 ± 242602.3 ± 250.6 ± 0.1
Al6(CrFeNi)88Ti61655.1 ± 172242.4 ± 2414.6 ± 0.3
Al4(CrFeNi)88Ti81965.4 ± 222227.1 ± 240.9 ± 0.1
Al3(CrFeNi)88Ti91917.5 ± 222404.2 ± 257.2 ± 0.3
Disclaimer/Publisher’s Note: The statements, opinions and data contained in all publications are solely those of the individual author(s) and contributor(s) and not of MDPI and/or the editor(s). MDPI and/or the editor(s) disclaim responsibility for any injury to people or property resulting from any ideas, methods, instructions or products referred to in the content.