Article

Realization of a Novel FeSiAlCuSn Multicomponent Alloy and Characterization of Intermetallic Phases Formed at Different Temperatures During Cooling

by
Pradeep Padhamnath
1,*,
Filip Kuśmierczyk
1,
Mateusz Kopyściański
1,
Łukasz Gondek
2,
Piotr Migas
1 and
Mirosław Karbowniczek
1
1
Faculty of Metals Engineering and Industrial Computer Science, AGH University of Krakow, al. Adama Mickiewicza 30, 30-059 Kraków, Poland
2
Faculty of Physics and Applied Informatics, AGH University of Krakow, al. Adama Mickiewicza 30, 30-059 Kraków, Poland
*
Author to whom correspondence should be addressed.
Metals 2025, 15(5), 479; https://doi.org/10.3390/met15050479
Submission received: 17 March 2025 / Revised: 17 April 2025 / Accepted: 22 April 2025 / Published: 24 April 2025
(This article belongs to the Special Issue Processing Technology and Properties of Light Metals)

Abstract

:
Ferrosilicon (FeSi) is a commercially important material with multiple uses in metallurgical processes. Recently, in an attempt to reduce the carbon impact of the FeSi production process, researchers have proposed using recycled Si recovered from electronic waste in the production of FeSi. However, Si recovered from electronic waste usually contains Al, Cu, and Sn as impurities. Hence, FeSi alloys produced with recycled Si from electronic waste may contain all these elements in varying proportions. Al, Cu, and Sn have been explored as alloying elements to produce alloys with Fe. FeSiAl alloys have also been studied recently for their superior properties. In this work, a multicomponent FeSiAlCuSn alloy is produced, and the phases formed at different temperatures are analyzed using different phase identification techniques. We also analyze the hardness of the multicomponent alloy to find any deviation from the standard FeSi alloy without the additional alloying elements. Understanding the phases and the composition of such alloys may help design future multi-component or high-entropy alloys involving Fe, Si, Al, Cu, and Sn for specific applications.

Graphical Abstract

1. Introduction

Ferrosilicon (FeSi) alloys are broadly used in the metallurgical industry for alloying, deoxidation, and casting operations. FeSi is used as the main source of silicon in steels for spring and electrical applications [1,2]. Traditional silicon production from primary sources relies on coal and coke, generating approximately 4 tons of CO₂ per ton of FeSi, with additional emissions of SOₓ, NOₓ, and particulate matter [3,4]. Most of these carbon emissions originate from the carbonaceous reduction process of SiO2. The production of FeSi uses quartz or silica (SiO2) as the source of silicon, which generates CO2 during reduction, usually using a carbonaceous source [5]. Recently, some efforts have been made to use recycled sources of carbon for the production of FeSi, which could potentially reduce overall carbon emissions [6]; however, they still do not completely eliminate the emission of CO2. Researchers recently proposed using Si recovered from end-of-life photovoltaic panels to produce ferrosilicon [7]. While FeSi production via silicon recycling offers a promising pathway in addressing modern environmental challenges, the silicon recovered from electronic waste contains different metals as impurities that may affect the quality of the final product [8].
The recycled silicon recovered from e-waste such as PV panels can have several other metal impurities in small quantities, such as aluminum (Al), copper (Cu), and tin (Sn), as these metals are used to make electrical contacts in PV panels and other electronic devices [9,10,11]. Usually, silicon recycling processes employ a number of mechanical, thermal, and chemical treatments in various combinations [12]. Various chemicals such as H3PO4, HNO3, HF, and HCl are used for removing impurities (including Ag, Al, Si compounds, etc.) to ensure the purity of the obtained product. However, this approach also generates problematic and potentially toxic gases and effluents [11,13,14,15]. While it is possible to obtain high-purity silicon for further use in high-end applications, in reality, the recovered silicon usually results in poor performance [16,17]. Despite the use of expensive and laborious techniques, the content of impurities in silicon still might be significant, above 2% [18,19]. Consequently, on several occasions, silicon modules have been dumped in landfill sites and are no longer suitable for recovering Si and other precious metals, essentially rendering them non-recyclable, which can lead to additional soil and water pollution [20,21,22]. While the metal-contaminated silicon is unsuitable for the electrical or PV industry, as it requires Si of extremely high purity, its potential use for metallurgical purposes has been proposed [7,23].
Researchers have investigated the effect of Al in ferrosilicon [24,25,26,27,28]. Including Al in ferrosilicon, resulting in FeSiAl, could improve the deoxidation efficiency in the production of killed steel [29]. Al-Si and Fe-Al intermetallic compounds, especially in steels or applications in steelmaking, have been investigated by researchers [30,31,32,33,34,35,36]. FeSiAl has found applications such as high temperature and soft magnetic materials. When Al is alloyed with Fe, Fe3Al, or FeAl, ordered phases are formed, imparting properties such as enhanced chemical resistance, resistance to high-temperature oxidation, sulfidation, and corrosion in highly oxidizing salts and anomalous temperature dependence of yield stress [31]. In some Fe-Al alloys that have the FeAl and Fe3Al phases, the yield stress is reported to increase with temperature within certain ranges [37]. For such applications, the Al content could be as high as 20% wt. of Fe [31]. FeSiAl soft magnetic composites are considered to be the most cost-effective material for applications below 100 kHz in electronic equipment [35,38]. Hence, intentional use of Al-rich silica for producing complex ferroalloys has also been investigated [39,40]. Fe-Cu alloys have also been investigated, as they offer superior electrical and thermal conductivity and magnetic and wear resistance characteristics [41,42,43,44,45,46,47]. Similarly, Fe-Sn alloys have also aroused interest among researchers, especially for their ferromagnetic properties [48,49,50,51,52,53,54].
The inclusion of Cu and Sn in FeSi alongside Al creates an interesting combination. This situation is possible if the Si recovered from electronic waste is used in the production of FeSi [55]. An alloy containing Al, Cu, and Sn along with Fe and Si creates a multicomponent alloy. It could even be classified as a high-entropy alloy (HEA) depending on the content of the alloying elements and the presence or the absence of intermetallics [56]. Several HEAs, including Fe, Si, and Al (along with other elements), have been studied [57,58,59]. However, an analysis of a multicomponent alloy with all these elements present together is missing from the published literature. The authors would like to clarify here that the alloy presented here is not an attempt to create a high-entropy alloy.
In this work, the first results of a novel FeSiAlCuSn multicomponent alloy are presented. Such an alloy could easily be produced by using recycled silicon recovered from electronic wastes. The alloy of a particular composition was simulated using FactSage to analyze the phases present under isothermal cooling at different temperatures. Then, the alloy with the same composition was fabricated in an induction furnace and annealed at specific temperatures for a specified duration to allow for the growth of different phases encountered in the simulated cooling of the alloy. The alloys were then quenched in ice-cold water to capture those phases. The distribution of the elements and phases formed are analyzed using three different techniques—energy dispersive X-ray spectroscopy (EDS), electron backscatter diffraction (EBSD), and X-ray diffraction (XRD). While the use of EBSD has been proposed to determine phase earlier [60], EDS combined with EBSD has recently been proposed as a novel method of phase identification [61,62,63,64]. Phases were identified using EDS and EBSD + EDS combined (focusing EBSD + EDS detectors on the same region of interest) and compared with phases identified using XRD. For measurements using EBSD, the dictionary indexing method was used [65,66,67]. The hardness of the samples was evaluated and compared with a standard FeSi sample to check for any differences in mechanical properties due to the presence of multiple alloying elements. A detailed analysis of different mechanical properties and the determination of the corresponding application of such a multicomponent alloy was beyond the scope of this work and was not attempted.

2. Materials and Methods

The aim of this work was to identify the alloys formed in the presence of multiple impurities commonly associated with silicon recovered from electronic waste. To aid in the easy detection and analysis of the intermetallic compounds, the relative amounts of the individual impurities were increased, forming a multicomponent alloy system. This could be viewed as a high-entropy alloy system; however, the aim of this work was to analyze the phases formed in ferrosilicon in the presence of impurities. Table 1 presents the composition of the alloy prepared in this work. The ratio of Fe/Si = 1.22 corresponds to FeSi45 alloy. To serve as a reference, FeSi45 alloy with only Fe (110 g) and Si (90 g) was also prepared.

2.1. Sample Preparation

Two crucibles were used to produce the samples: a graphite crucible (Carbo-Graf, Racibórz, Poland) and an alumina crucible (INCERAMICS, Warsaw, Poland). The alumina crucible was placed inside a larger graphite crucible. The dimensions of both crucibles along with the weights are given in Table 2. To remove the volatiles from the crucibles, all crucibles were annealed at 1000 °C for 10 min in normal air. The graphite crucible lost ~210 g after annealing, while there was no appreciable change in the weight of the alumina crucible.
Low-carbon iron (C < 0.002%) was used to prepare all the samples in this work. Commercially available high-quality metallurgy-grade Si (mg-Si) was used as the Si source, with an Si content of ~99.5%. Al, Cu, and Sn were used in the form of pellets, all commercially procured with a purity of ~99.9%. To prepare the sample, the required amounts of different components to prepare the alloy were weighed and kept aside. The required amount of Fe was placed inside an alumina crucible. The alumina crucible was placed in a graphite crucible to act as the secondary heat source. The crucible set was placed inside the induction furnace and covered with an alumina lid. The lid had an opening in the center through which a thermocouple was inserted to record the temperature. After the iron melted, Si, Al, Cu, and Sn were added consecutively. After adding each component, the solution was stirred using a quartz rod until it melted completely before adding the next component. After the complete dissolution of all the components in Fe, the furnace was switched off. One sample was cooled in ambient air to serve as a reference sample. To prepare the annealed samples at different temperatures, the crucible set (graphite and alumina crucible along with the molten sample) was covered with the alumina lid and then placed in another resistance heating furnace maintained at 50 °C above the desired temperature. After the sample was placed inside, the furnace was cooled at a rate of 10 °C/min to the desired temperature with argon flow. In this process, the different phases were exposed to different degrees of undercooling, which could impact the phase nucleation and phase growth, especially those of the metastable phases [68,69,70]. The sample was annealed at the desired temperature for the specified amount of time in the furnace under an argon atmosphere. After annealing, the sample was quenched in ice-cold water (~2 °C) to preserve the phase and prevent further phase transitions. The different temperatures used to prepare the samples along with the annealing durations are listed in Table 3.
Five different temperatures were selected to analyze the phases. These temperatures were selected on the basis of the FactSage simulation of the cooling behavior of the given alloy. The duration of the annealing was selected randomly. It is known that most phase transitions at lower temperatures are usually sluggish [71,72,73,74]. Samples annealed at lower temperatures were annealed for longer durations to allow for a greater probability of phase transition.

2.2. Characterization Details

The samples were cut using a circular saw (Struers, Ballerup, Denmark) and mounted on a thermosetting carbon-based resin (Struers, Ballerup, Denmark). The samples were polished using different grades of sandpaper, ranging from 100 to 4000. The final polishing was performed using an automatic polisher with alumina (~1 µm) as the abrasive. The samples were first washed in alcohol, then in DI water, and then in alcohol again using an ultrasonic cleaning tub. The samples were dried using an IR lamp and then immediately characterized.
The cooling behavior of the alloy was simulated using Factsage version 8.3 (GTT-Technologies, Herzogenrath, Germany). Steel and pure substances databases were used for this purpose. The compositional details of the alloy were kept the same as the experimental samples, and the cooling of the alloy was simulated from 1500 °C until reaching a temperature of 50 °C. During this simulated cooling, all phase transitions along with the temperature at which they were expected to occur were recorded. This information was then used to determine the different temperatures at which the alloy samples were annealed later.
The microstructure of the samples was analyzed using scanning electron microscopy (SEM), (Thermo Fisher Scientific Waltham, MA, USA). Energy-dispersive X-ray spectroscopy (EDS), AMETEK, Berwyn, PA, USA, and an electron backscatter diffraction (EBSD), AMETEK, Berwyn, PA, USA camera integrated with SEM were used to identify the phases and analyze the composition of the different phases. The analysis of phases using only EDS was conducted using a newly developed software (Octane elect plus V3.0, AMETEK, Berwyn, PA, USA) that estimates the different phases present in the area under investigation by comparing the prominent elements and their composition (atomic and weight). Areas with similar elements and composition are grouped as the same phase. This method does not provide the stoichiometric composition or name of the phase; rather, it just indicates the main elements in the phase and their atomic percentages. The phases are named after the most prominent elements identified in the phase. Therefore, in this work, we refer to the phases identified only by EDS as pseudo-phases. Pseudo-phase analysis using EDS required only ten minutes for each analysis.
On the other hand, phase identification using EBSD coupled with EDS is a more accurate method for identifying the phases. EBSD + EDS analysis can obtain information about composition and orientation. This information is verified against an inbuilt library of phases, and the appropriate phases are identified. This characterization process is more accurate than using only EDS, as it provides the stoichiometric composition and the name of the identified phase. However, since it is not a mature process, the identification of the phases is limited to the phases available in the inbuilt database. Each analysis using EBSD + EDS took around 30 min, which is considerably longer than the duration needed for analysis using only EDS. X-ray diffraction (XRD) (Malvern Panalytical, Almelo, The Netherlands) was used to identify the different stoichiometric phases and their relative amounts in the given sample provided by the inbuilt software (Highscore V2.0, Malvern Panalytical, Almelo, The Netherlands). The intensities of the diffraction peaks of a particular phase in a mixture of phases are indicative of the relative amount of that particular phase in the mixture [75]. The data gathered were then compared with each other and with the data simulated using FactSage to understand the differences in the phases identified.
To characterize the impact of the multicomponent alloy system on mechanical properties, the hardness of the alloys annealed at different temperatures was characterized using the Vickers hardness scale (Wilson Instruments, Norwood, MA, USA). The hardness of the multicomponent FeSi alloy was compared to that of a standard FeSi alloy, and inferences were drawn.

3. Results

3.1. Simulation of Alloy Cooling Behavior Using FactSage

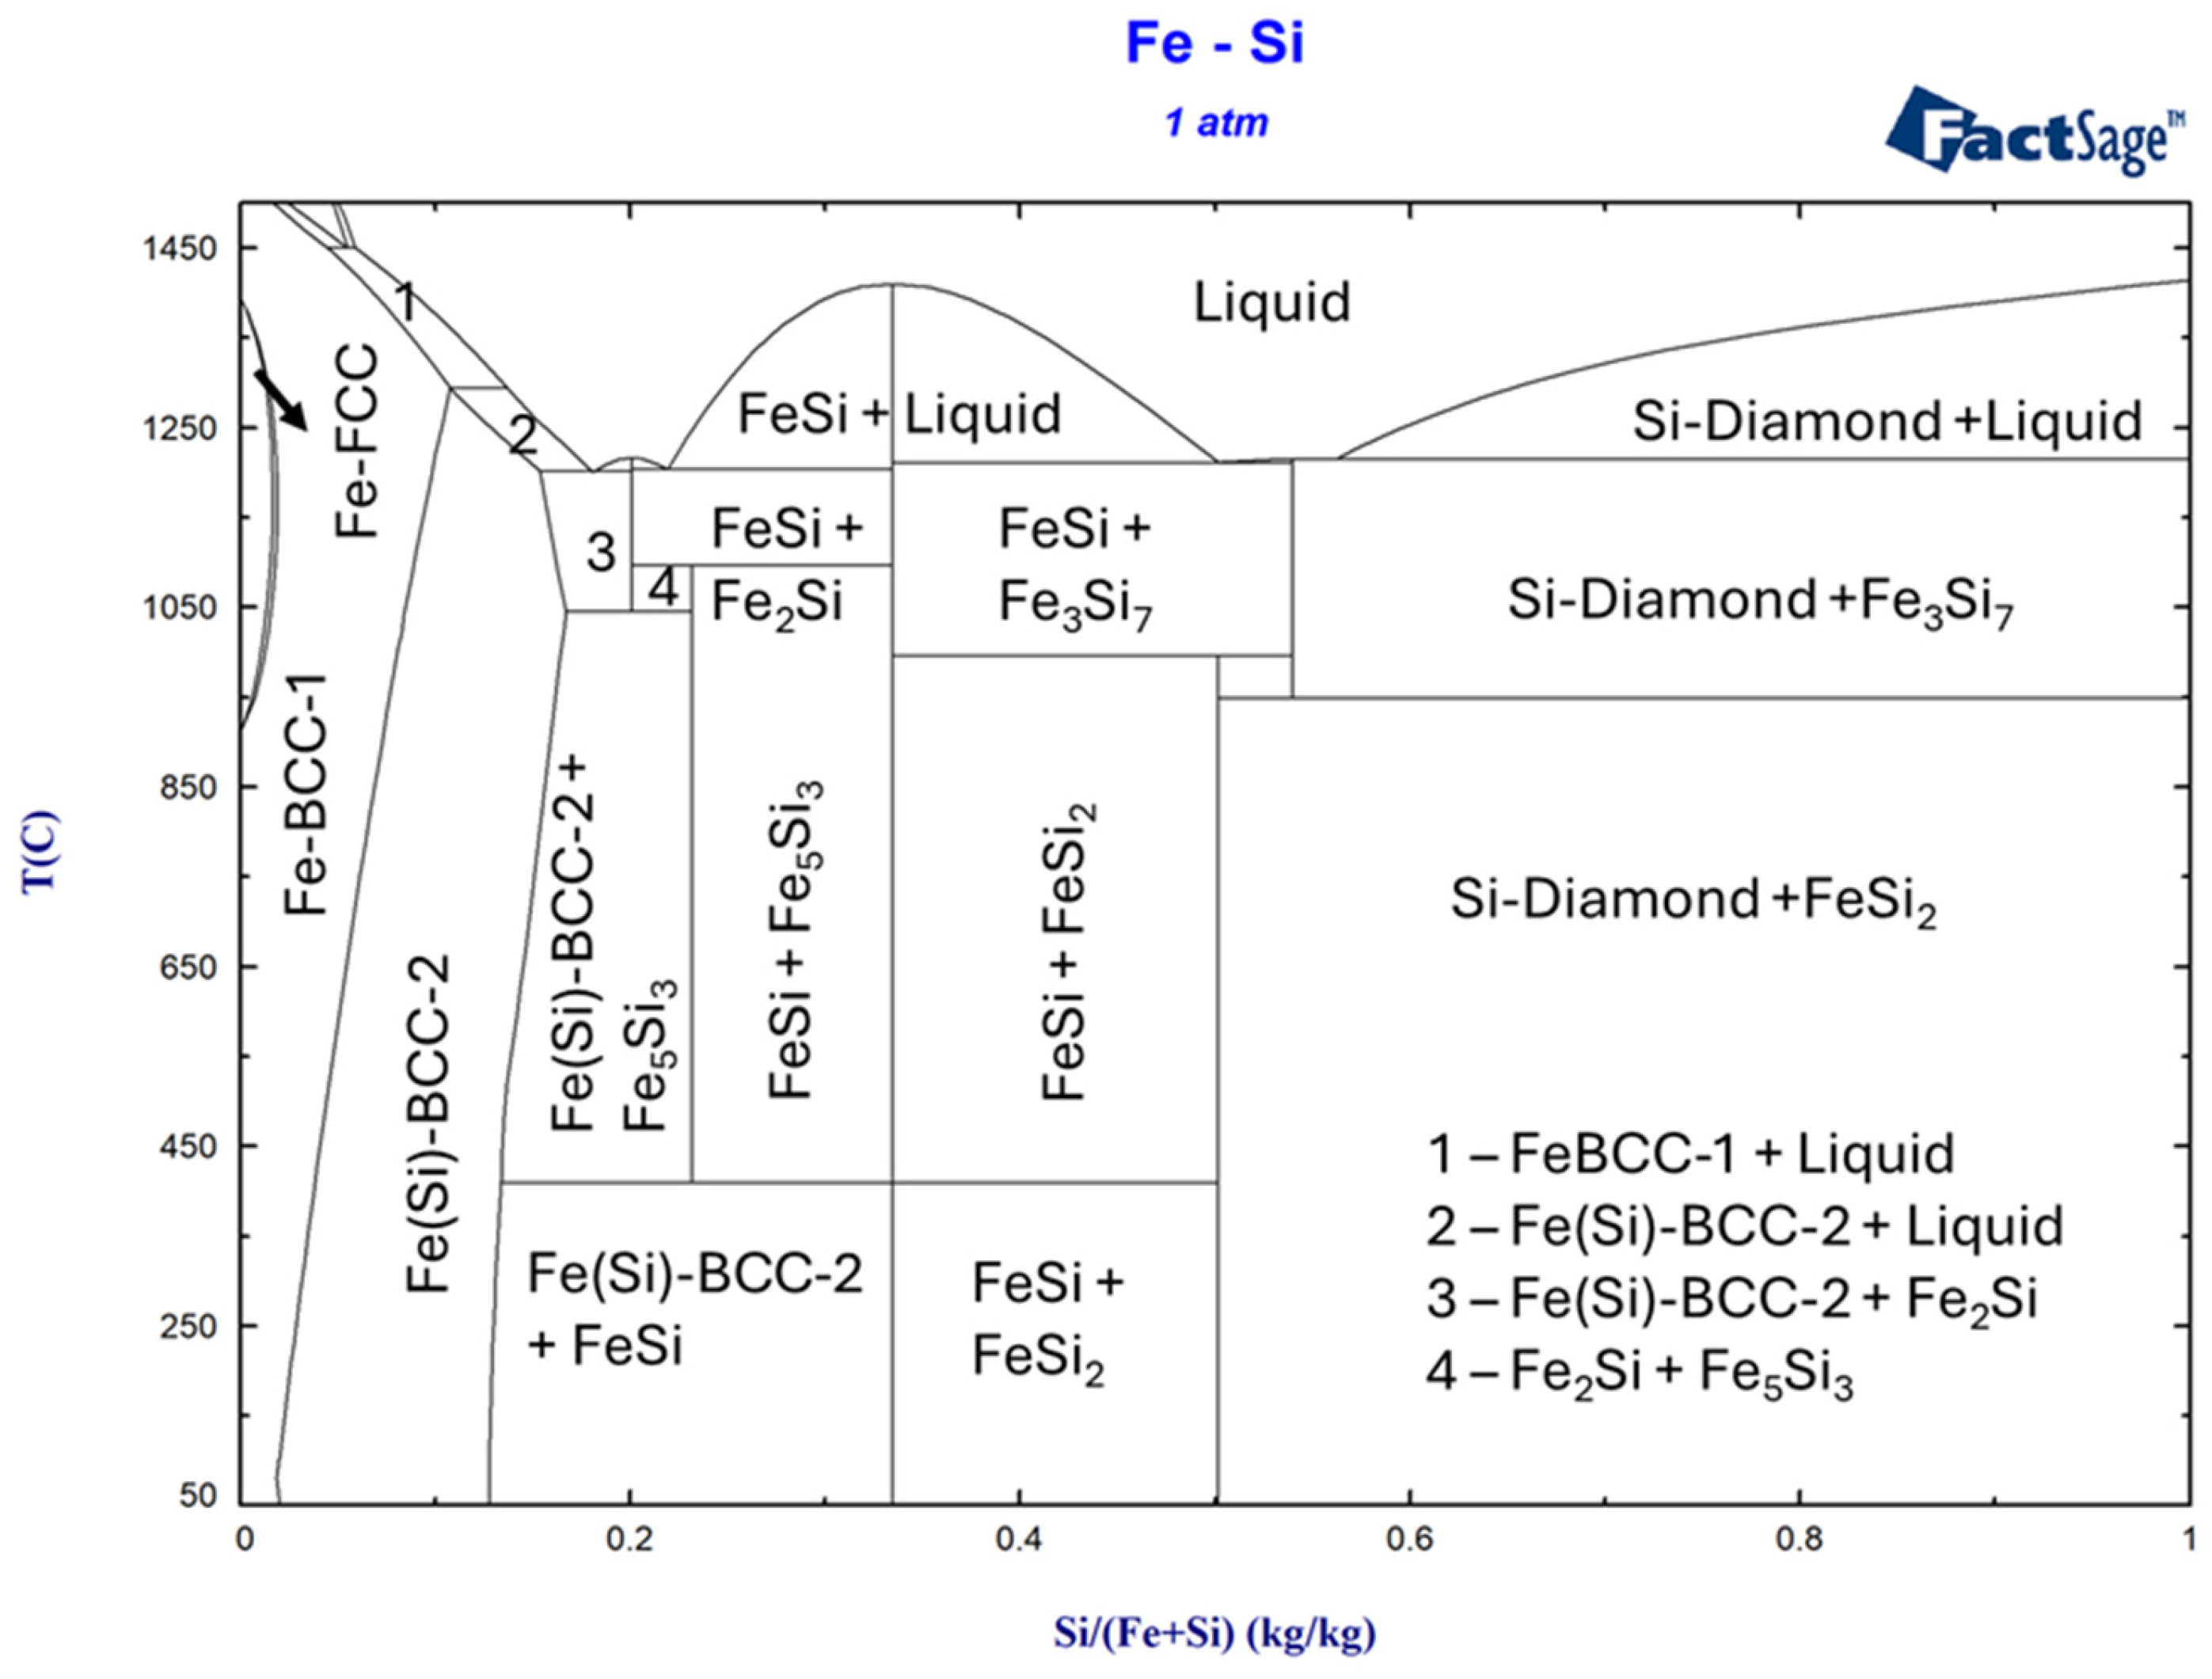
Figure 1 shows the phase diagram for the multicomponent alloys prepared in this work. The Si fraction is varied along the x-axis; however, the ratio of mass of Si/Fe used in this work is ≈0.82, which corresponds to FeSi45, where Si/(Fe + Si) = 45% (wt.).
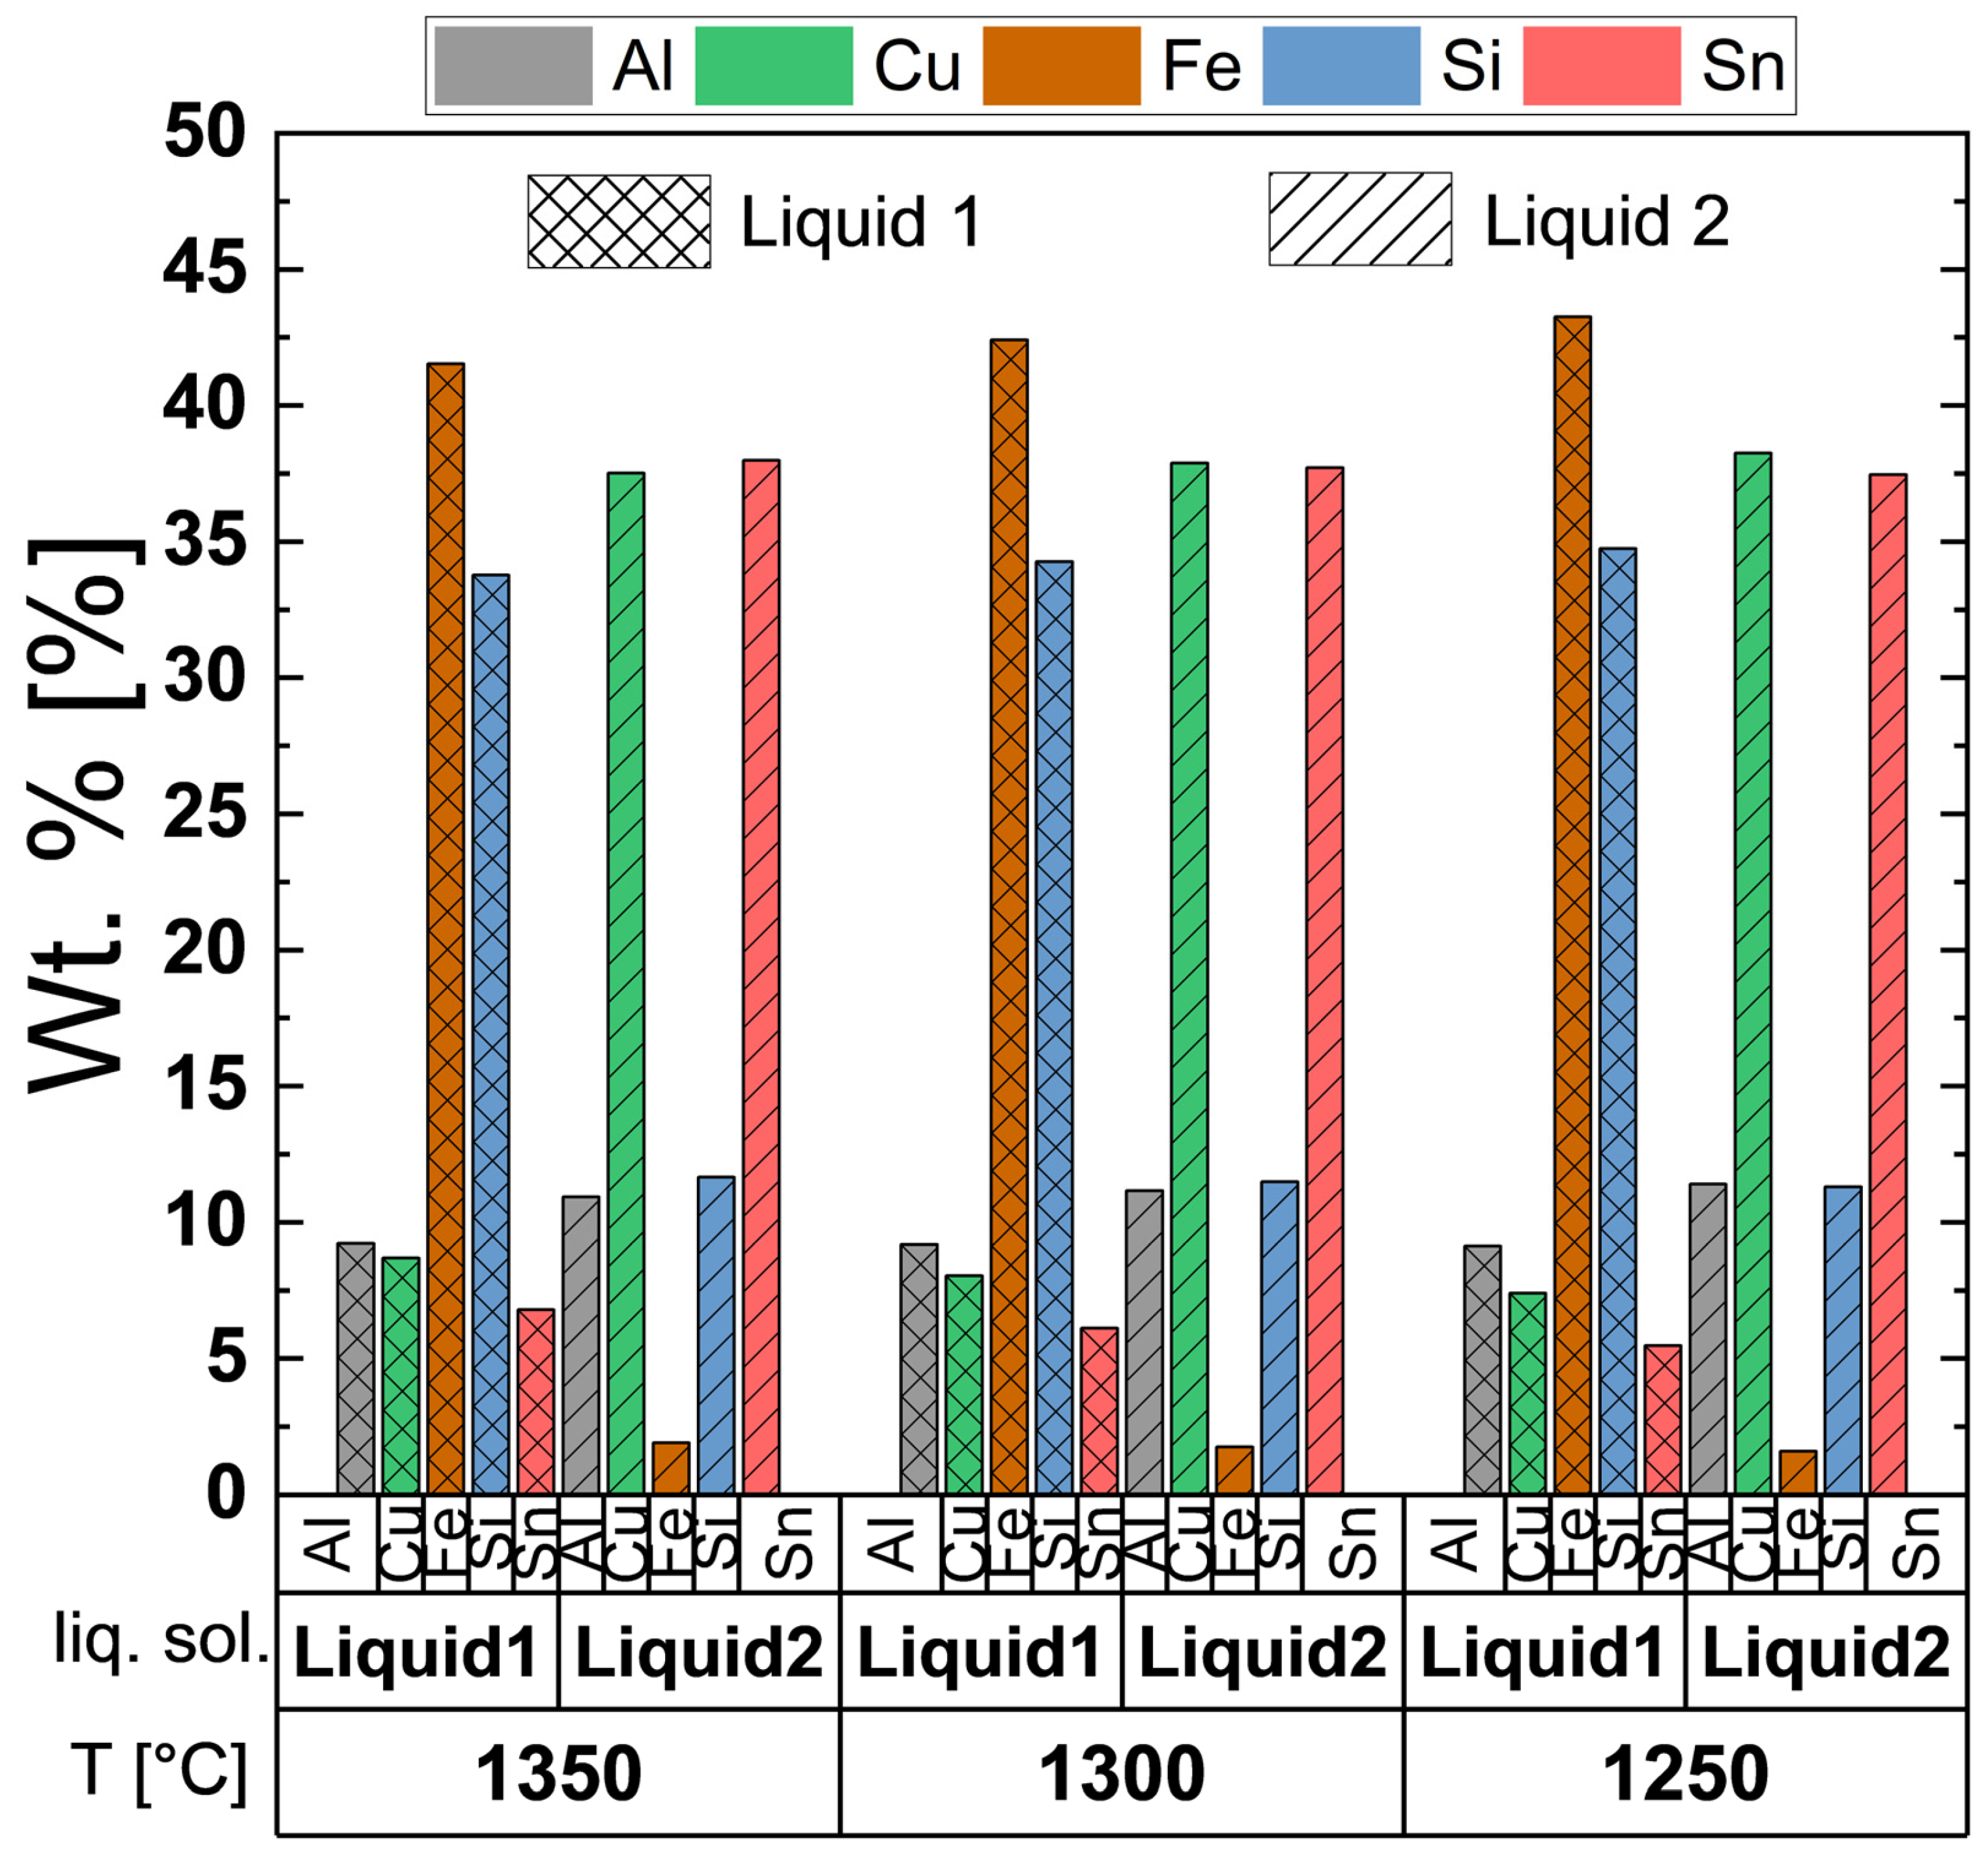
The cooling behavior of the multicomponent alloy presented in this work was simulated from a starting temperature of 1500 °C and cooled to a temperature of 50 °C, with a 50 °C step. The simulation was performed under isothermal and isobaric conditions (1 atmosphere). However, all temperatures at which any phase transition occurred were also recorded. The simulation began at 1500 °C, with all the constituent elements in the liquid phase. The alloy remained as a homogeneous liquid until 1393 °C. At this temperature, the software predicted the beginning of the separation of the homogeneous liquid into two immiscible liquids, one with Fe and Si as the leading components and the other comprising Cu and Sn as the major components. This is shown in the phase diagram as Liquid 1 (Fe-Si-dominant) and Liquid 2 (Cu-Sn-dominant). As the simulated alloy cools down, the fraction of Cu and Sn continues to increase in Liquid 2, while Liquid 1 becomes richer in Fe and Si. Figure 2 shows the simulated composition of the two hypothetical liquids from 1350 °C to 1250 °C in terms of wt.%.
At ~1220 °C, the first solid phase, FeSi appears in the simulated alloy. FeSi is a stable phase, which is expected to remain in the alloy throughout the cooling of the alloy. However, the amount of FeSi changes throughout the cooling process. The amount of FeSi in the alloy is expected to increase from 1200 °C to 1000 °C. As the alloy cools further, the Fe3Si7 crystals begin to precipitate at ~1090 °C. Fe3Si7 is a metastable phase that is stable only at higher temperatures. Fe3Si7, which normally has a tetragonal structure [76], also incorporates some Al in the form of Fe3Al7. However, the fraction of Fe3Al7 in Fe3Si7 is theorized to be present in extremely small amounts, around ~0.7% wt.–0.8% wt. At ~1042 °C, according to the simulation, only one solution remains, while the Fe-rich solution disappears, resulting in an increase in the amount of Fe3Si7 and FeSi. At this point, the remaining liquid solution comprises Cu and Sn, along with 99% wt. of the initial mass of Al, 6.6% wt. of the initial mass of Fe, and 27% of the initial mass of Si. As the alloy cools further, the amount of FeSi and Fe3Si7 increases at the expense of Fe and Si in the liquid state. At ~993 °C, Fe3Si7 undergoes a solid-state transition to FeSi2, which again is predicted to incorporate a small amount of Al in the form of FeAl2. As the alloy cools down further, the fraction of FeSi2 is expected to increase, while that of FeSi is expected to decrease. At ~842 °C, a new phase, Fe2SiAl2, begins to solidify out of the liquid solution. This phase is short-lived, and at ~789 °C, it disappears, leading to the appearance of a new phase, FeSiAl2, while the amount of FeSi increases by 65%. As cooling progresses, the amount of FeSiAl2 progressively increases, albeit slowly. At ~654 °C, Cu from the liquid solution begins to solidify into a BCC solid solution incorporating Al, Sn, Si, and extremely small amounts of Fe. The Cu-BCC solid solution is not completely stable and is expected to remain only until ~531 °C. The simulated change in the composition of the Cu-BCC solid solution from 654 °C to 531 °C in terms of the wt.% of the constituent elements is shown in Figure 3.
At 531 °C, the Cu-based BCC solid solution is no longer stable, and it transforms to Al9Cu11. The Sn incorporated in the BCC solid solution returns to the liquid solution. The amounts of FeSi2 and FeSi increase, while that of FeSiAl2 reduces marginally. As the alloy cools further, the remaining liquid becomes predominantly richer in Sn, with small amounts of Al and Cu, while Fe and Si are practically absent (their mass is expected to be ~10 micrograms). Finally, at ~231 °C, the remaining liquid is expected to solidify into an Sn-BCT solid solution [77,78,79], which is predominantly Sn. At 148 °C, Fe2SiAl2 undergoes a solid-state transformation to Al5Fe2Si2. Concomitantly, the amount of FeSi increases sharply, while that of FeSi2 decreases marginally. At ~75 °C, the system undergoes yet another solid-state phase transformation, in which Al9Cu11 transforms into Al2Cu3. Figure 4a shows the mass of some selected phases at different temperatures during the cooling of the alloy as simulated by FactSage. Figure 4b shows the same graph with an enlarged scale for improved readability.

3.2. Analysis of the Microstructure of the Standard FeSi45 Sample

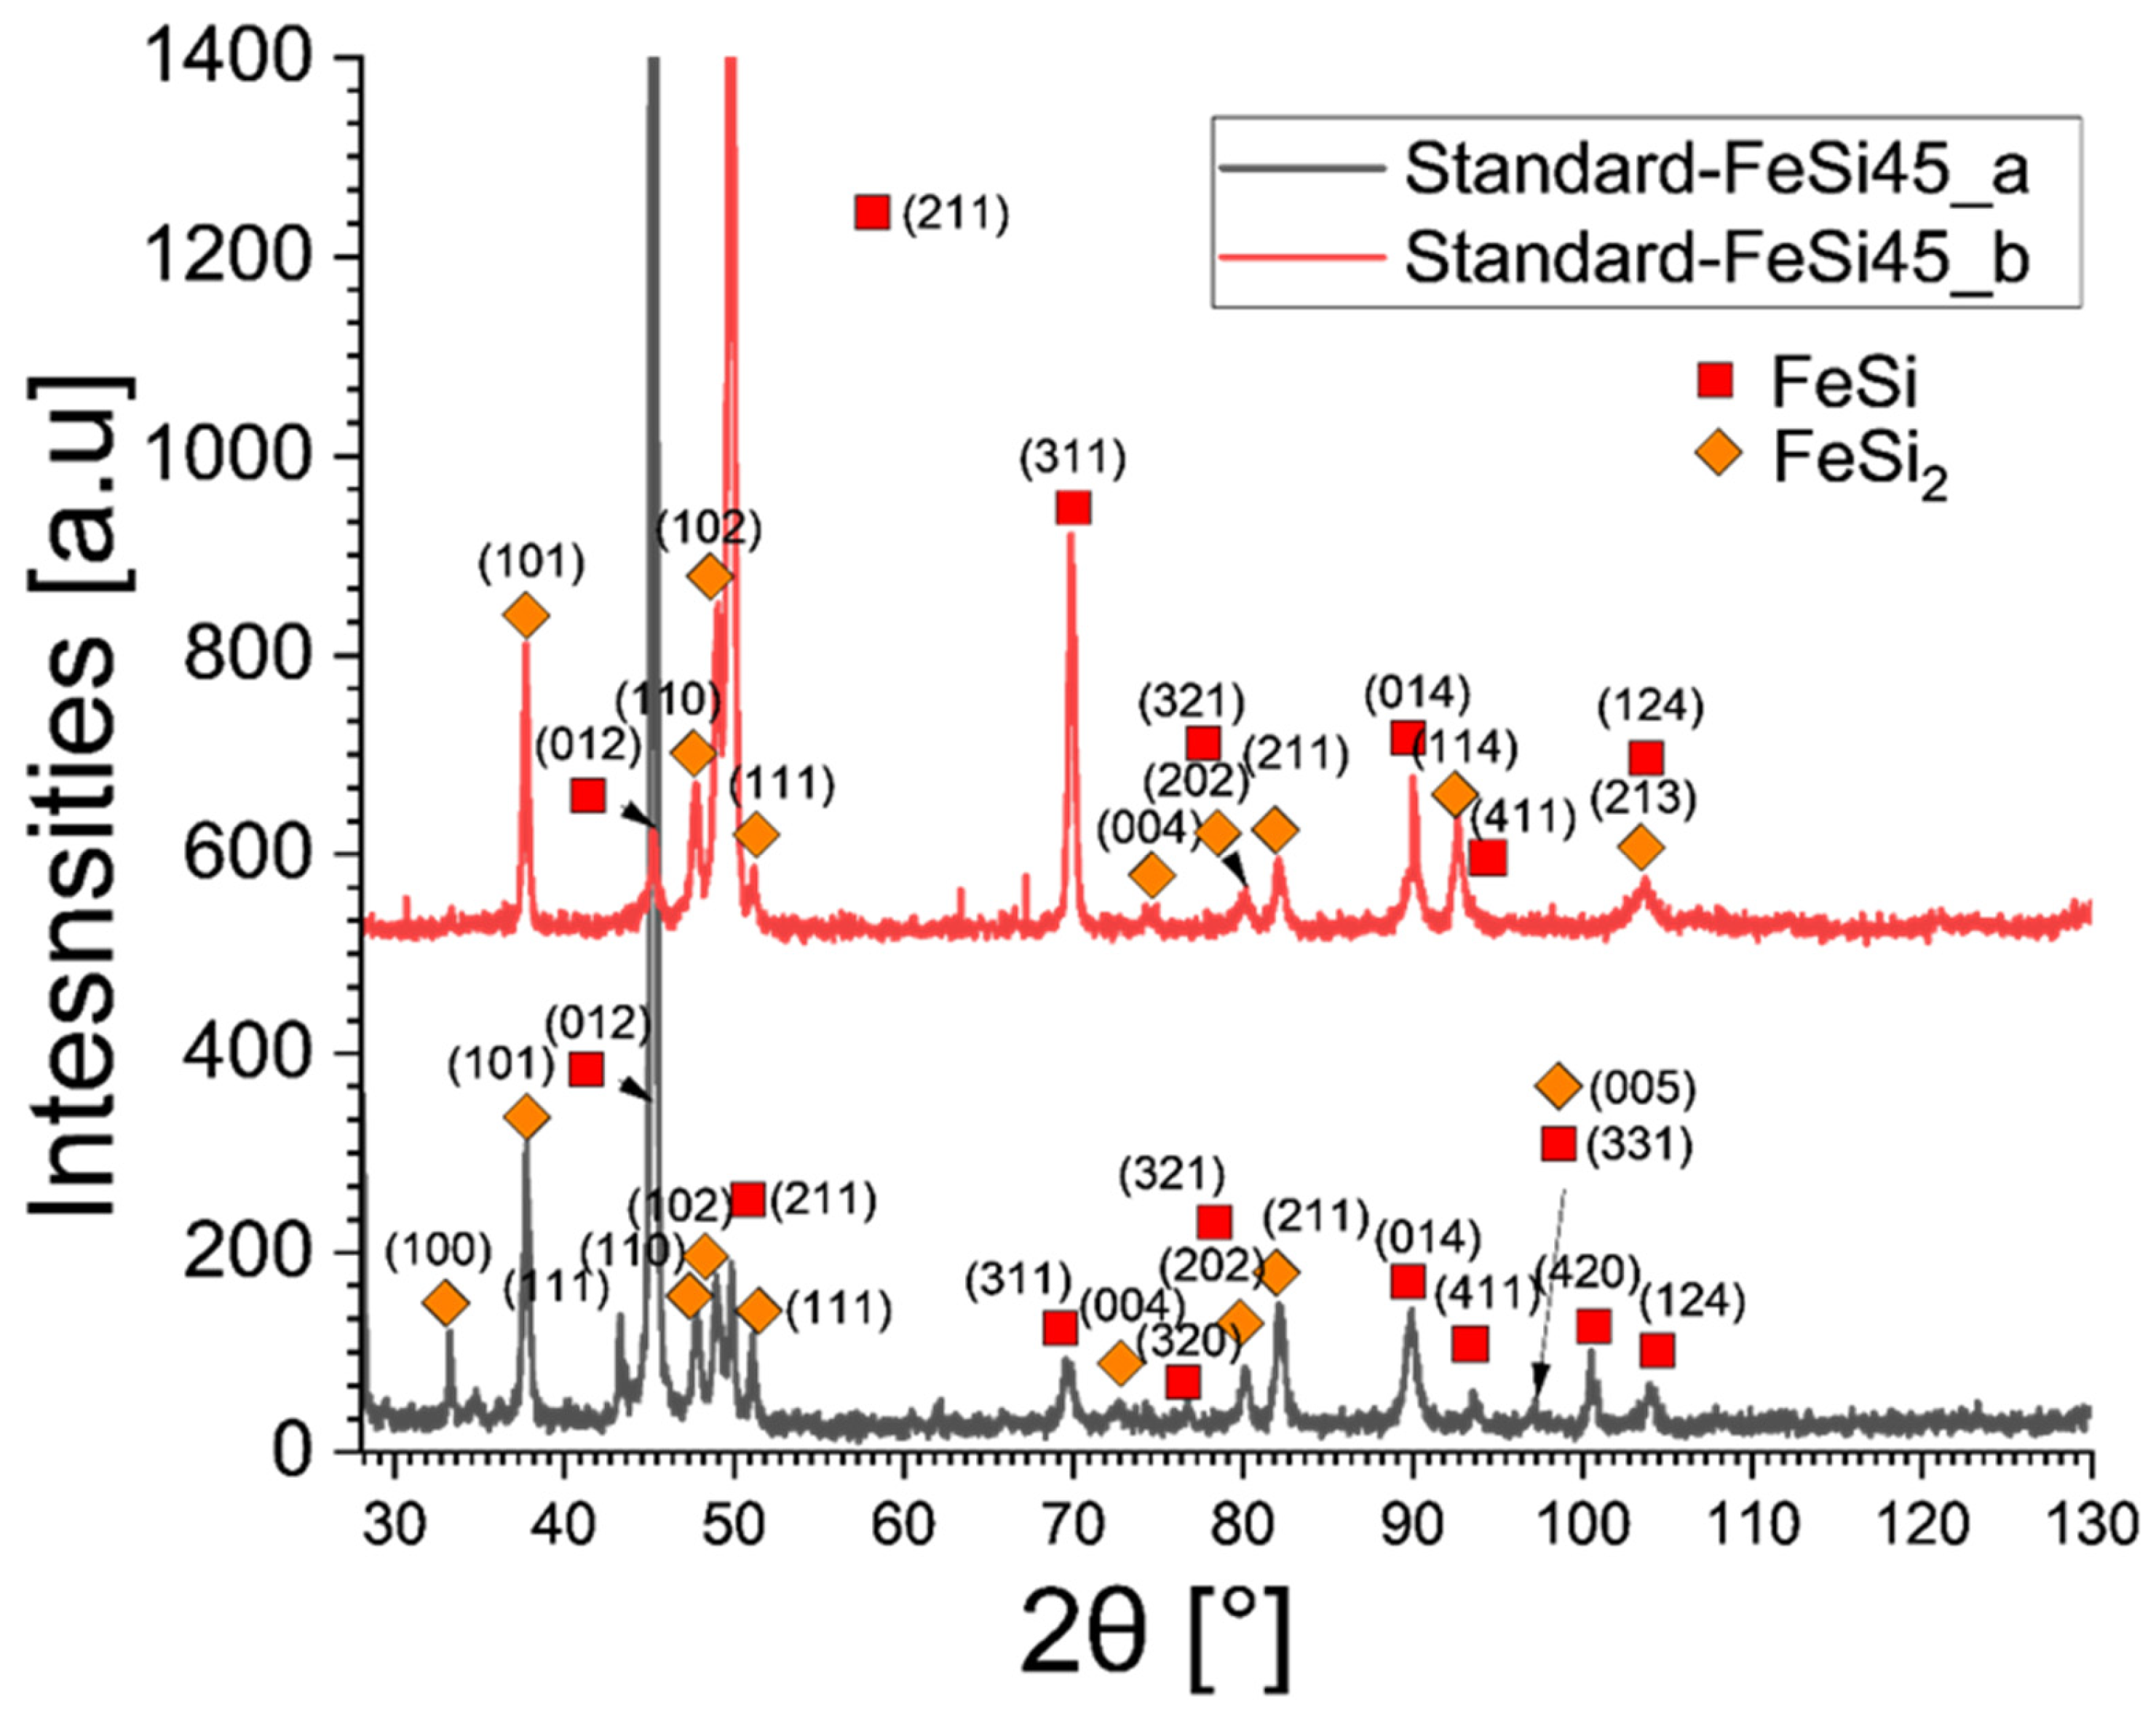
Figure 5 shows the microstructure along with the elemental maps obtained using EDS for the standard sample, annealed at 1000 °C for 24 h. In this sample, according to the FactSage simulations, only two phases are expected to form, FeSi and FeSi2, with their abundances calculated at ~30% and ~70% wt., respectively. The standard Fe-Si phase diagram charted using FactSage is provided in Appendix B as Figure A1. Figure 5a shows the region of the sample closer to the center, while Figure 5b shows the region of the sample closer to the edge. In the standard sample, only Fe and Si were detected. In the distribution maps, Fe-rich and Si-rich regions are observed. Si-rich regions appeared to form the matrix, while Si-rich regions appeared to form the grains. This is expected, as FeSi2 is expected to form a large portion of the sample. Using EDS analysis, the atomic percentages of Fe and Si were determined in the Fe-rich and Si-rich regions. For the Fe-rich regions, the atomic percentages of Fe and Si were determined to be 53.8% and 46.8%, respectively. This corresponds closely to the atomic ratio of FeSi. In the Si-rich regions, the percentages of Si and Fe were found to be 33% and 66%, which corresponds to FeSi2 composition. The samples were further analyzed using XRD for the phases present. The XRD plot of the sample is shown in Figure 6. FeSi and FeSi2 were confirmed in the sample. FeSi was calculated to be 29.3 ± 1.5%, while FeSi2 was determined to be 70.5 ± 2.3%.

3.3. Analysis of the Microstructure of the Sample Cooled Under Ambient Conditions

Figure 7 shows the microstructure along with the elemental and pseudo-phase distribution maps of the standard sample cooled under ambient conditions. Figure 7a shows the region closer to the center of the sample, while Figure 7b shows the region closer to the edge of the sample. The phase distribution maps obtained using EDS do not identify and differentiate the stoichiometric phases (e.g., FeSi and Fe2Si); however, they segregate the phases depending on the main alloying elements and their compositional differences in various regions of the microstructure. For the purpose of this manuscript and to avoid any confusion, we refer to the phases identified by EDS as pseudo-phases. It also estimates the mass fraction of the identified pseudo-phases in the analyzed region, which is shown alongside. The sample cooled from 1550 °C to ambient temperature in ~125 min; hence, the cooling behavior could be viewed as air-quenching. The microstructure exhibited dendrites of the Al-Cu-based phase distributed in a matrix composed primarily of Fe and Si. The Sn-based phase was found distributed throughout the microstructure, mostly in the regions closer to the Al-Cu-based dendrites. The Sn-based phase was found primarily near the Al-Cu dendrites. This could be explained by the cooling behavior simulated using FactSage. The Fe-Si-based phases (FeSi and FeSi2) begin to solidify first. The remaining liquid comprises almost all the non-ferrous metals and some Si. As the Al-Cu-based phase begins to solidify, Sn still in the liquid state is expelled from the solidifying regions. The Sn-based phase is expected to remain liquid longer; hence, as the surrounding metal begins to rapidly solidify, the liquid is pushed around and becomes trapped around the solidifying metal. Hence, almost everywhere in the microstructure, Sn was observed to be surrounded by Al-Cu regions. In some places in the microstructure, relatively large pools of Sn were observed (Figure 7(a-ii)), still surrounded by Al-Cu-Si regions along their boundaries. Multiple cracks were observed in the microstructure, which could be due to the induced mechanical stress on the alloy sample under the rapid cooling conditions. Almost all the cracks were observed in Fe-Si-rich regions, and no cracks were observed in Al-Cu regions. This shows that the Fe-Si-rich phases are more brittle than the Al-Cu phases formed in the alloy [80,81]. However, the presence of Al-Cu and Sn-based phases in the microstructure could impact the mechanical properties by blocking the propagation of cracks through the microstructure.

3.4. Analysis of Microstructure and Composition of Samples Annealed at 1000 °C

Table 4 shows the theoretical state of the alloy at 1000 °C as simulated using FactSage8.3. At 1000 °C, FeSi and Fe3(Si, Al)7 are the only solid phases formed. The remaining alloy is expected to remain as a liquid, composed almost entirely of Cu, Sn, and most of the Al, along with some Si.
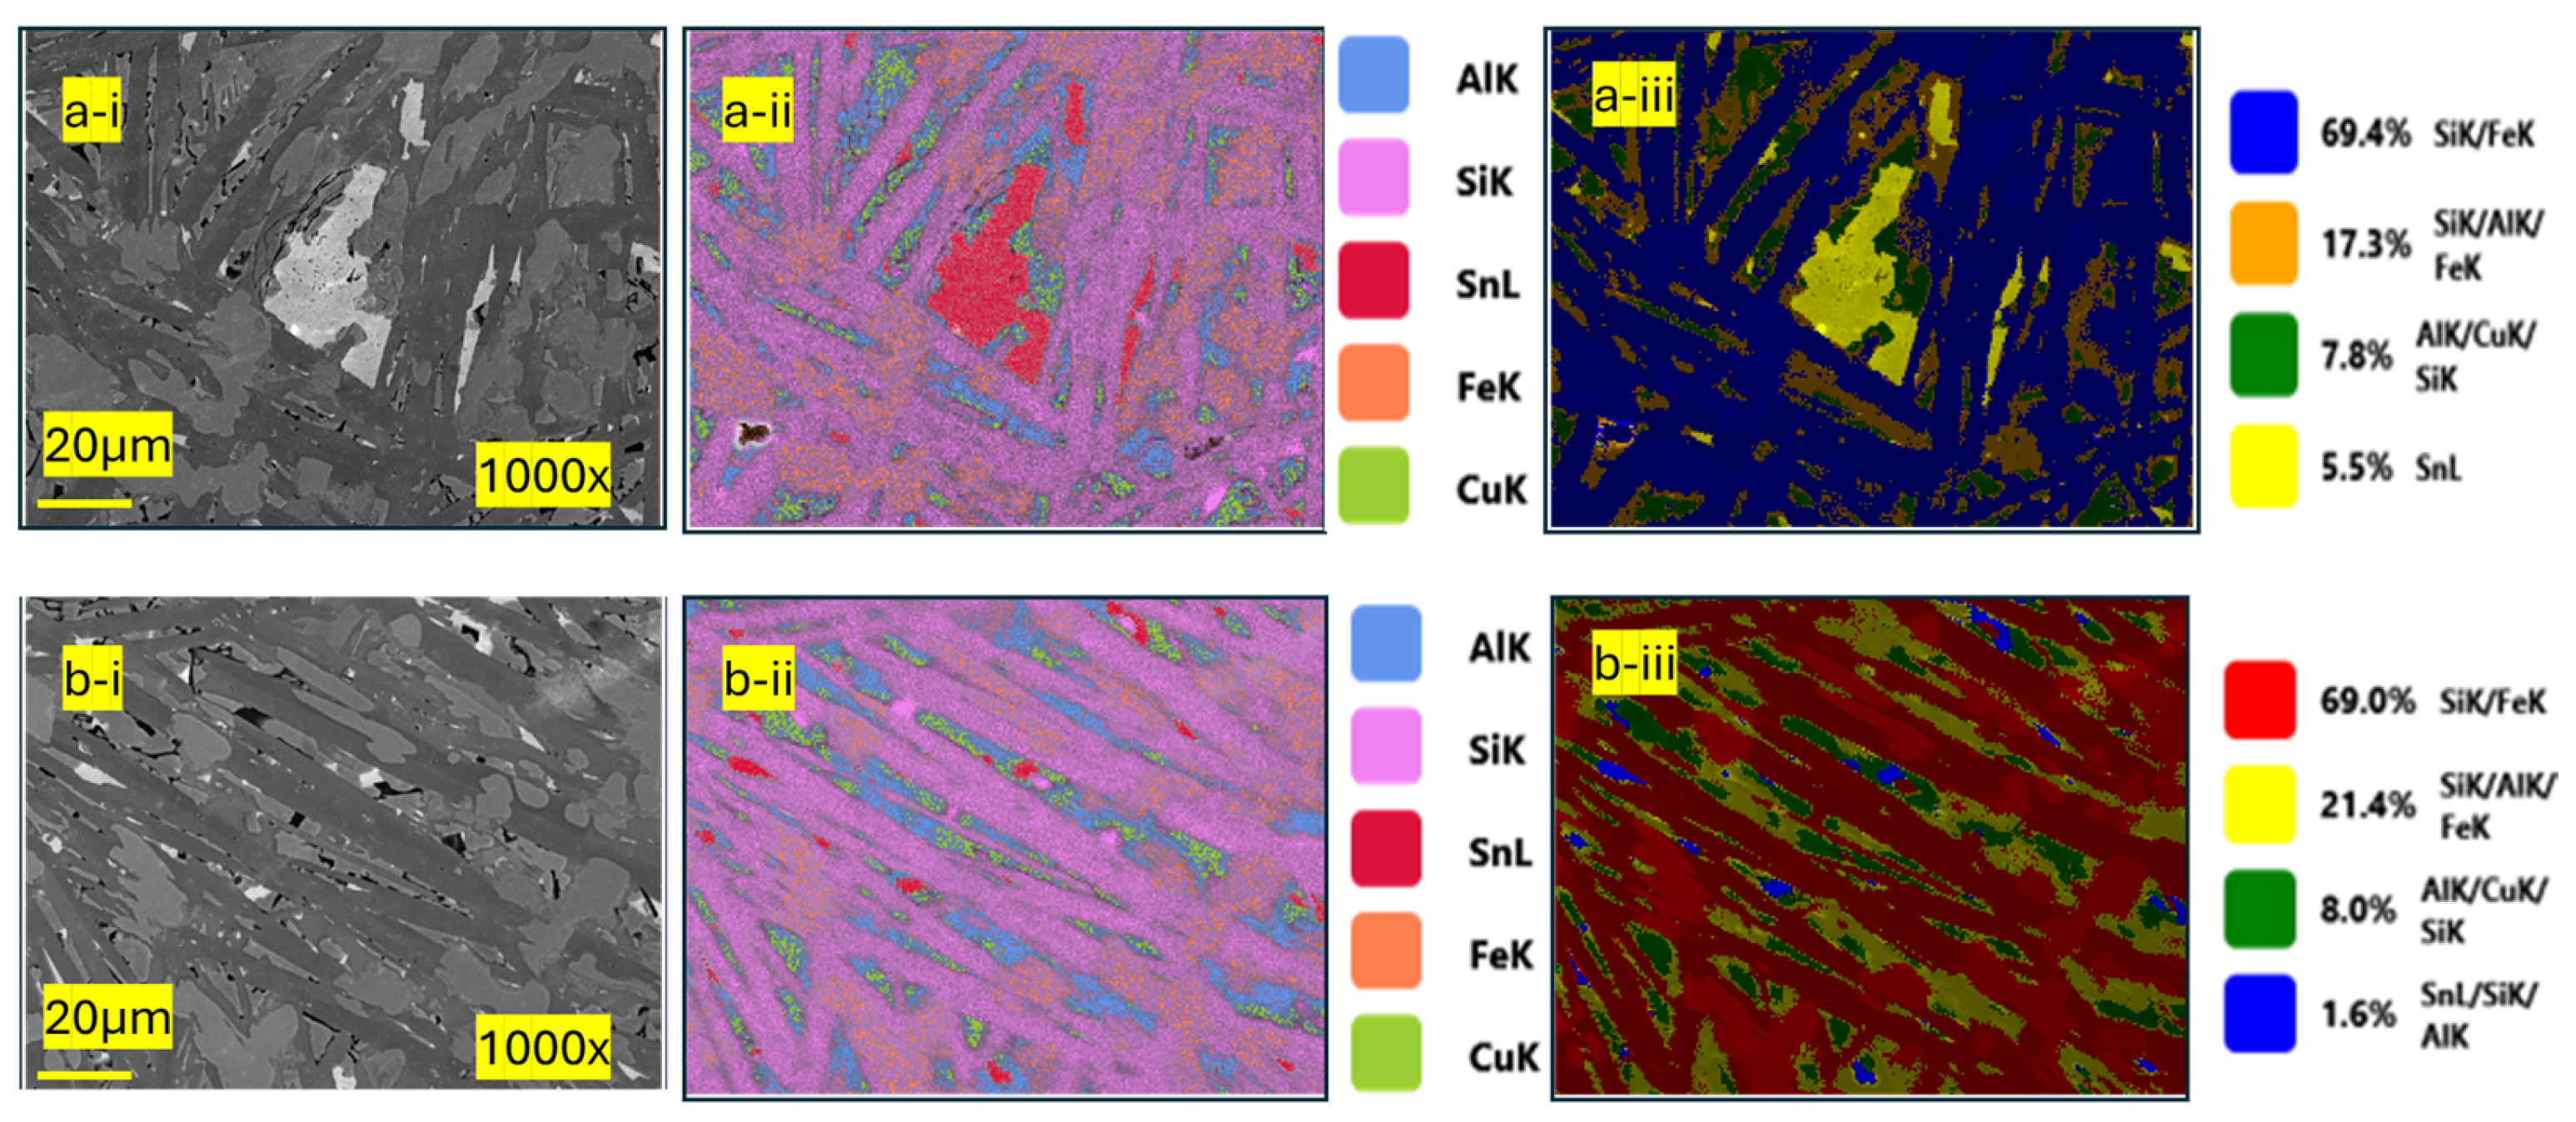
Figure 8a,b show the SEM images of two regions of the sample annealed at 1000 °C for 24 h and quenched immediately in water at ~1–2 °C. Figure 8a shows the region toward the edge of the sample, while Figure 8b shows the microstructure toward the center of the sample. It can be seen in Figure 8 that the grains in the regions closer to the edge of the sample appear more elongated than the grains in the region closer to the center of the sample. Figure 9 shows the elemental overlay maps and the pseudo-phase overlay maps as recognized by EDS. The elemental overlay maps combine all the elemental maps together, which makes it easier to see the mutually exclusive zones and coexisting zones for different elements. Table 5 shows the composition of the different pseudo-phases as identified by EDS measurements. The data presented here are the average of five such measurements. As can be seen in the images in Figure 8 and Figure 9, Fe and Si form most of the background of the microstructure. However, not all Si is combined with Fe. Certain areas in the microstructure show a strong presence of only Si, while in some regions, Fe is present in abundance. However, in some regions, Fe and Si are present together in similar amounts. This could be correlated with the theoretical simulation performed during FactSage. At 1000 °C, FeSi is expected to form the largest fraction of the solid alloy. This is consistent with the data shown in the pseudo-phase overlay maps (Figure 9(a-ii,b-ii)) where the Si/Fe pseudo-phase occupies the largest fraction of the identified phases in the microstructure. At this temperature, the simulations show that ~19 g of Si and ~5 g of Fe should be present in the liquid solution. This could explain the pockets of Si-rich regions observed in the sample. In Figure 9(a-i,b-i), these Si-rich regions are shown to be surrounded by mostly Al, Cu, and Sn.
Hence, this further strengthens the deduction that these regions of Si correspond to the Si in the liquid state, which rapidly solidified upon quenching. In both regions shown here and in the other images taken, Fe-Si formed the largest portion of the microstructure, with its fraction ranging between 45 and 60% wt., which agrees with the simulated results. The simulation suggests the presence of Fe3(Si, Al)7, forming ~21.7% wt. of the alloy at 1000 °C. The number of Al/Si/Fe pseudo-phases detected by EDS also agrees with these simulated results. In both the regions analyzed here, the solid phase comprising Fe, Si, and Al constituted 28–30% of the alloy. Al, Cu, and Sn are primarily absent from the Fe-rich regions, as can be seen in Figure 7(b-i) and Figure 9(a-i). This is not surprising, given the low solubilities of these elements in Fe [82,83,84]. Hence, as the alloy cools down rapidly, Al, Cu, and Sn are expected to be frozen in their liquid solution form. However, a segregation between Sn and Al-Cu is observed in all the microstructures analyzed. Almost all of the Cu was found alloyed with Al, and the Sn-rich areas were observed without Al and Cu. This corresponds to the final condition of the alloy as simulated using FactSage. Since Sn was observed with small portions of other elements in all the EDS analyses of this sample, it can be safely concluded that most of the Al and Cu separated from Sn during annealing or the cooling phase. Since the alloy samples were cooled rapidly from 1000 °C to ~10 °C within a few minutes, there are two possible ways that Al-Cu could have segregated from Sn. Al and Cu could have formed a homogenous solution at 1000 °C, which was immiscible with Sn, and hence remained separate during solidification. On the other hand, if this segregation occurred during solidification, it could also suggest that the segregation of Al and Cu from Sn occurred rapidly.
The atomic ratios of the Fe/Si pseudo-phase ranged from 1.1–1.2, while that of the Si/Fe pseudo-phase ranged between 1.9–2.1. This could indicate that the Fe-Si regions in the microstructure were a mixture of FeSi and FeSi2. The Al-Si-Fe pseudo-phase appeared to be a medium-entropy phase, with similar concentrations of Fe, Si, and Al. The Al-Cu phase had Al and Cu as the major constituents; however, the % atomic ratios were not close to 1, with Cu dominating the composition (~1.5 × Al). The Sn pseudo-phase primarily comprises Sn, with small amounts of other elements.
Figure 10 shows the microstructure of the region closer to the center of the sample captured using the EBSD camera, the phase distribution maps, and the inverse pole figure (IPF) of the analyzed region. EBSD in combination with EDS was also used to determine the phases in the sample annealed at 1000 °C. In almost all the samples analyzed, five phases were consistently identified against the internal reference in the software—FeSi, FeSi2, AlFeSi, AlCu, and Sn. The EBSD image in Figure 10 shows large grains of FeSi and FeSi2. FeSi2 also appears as long elongated grains, with AlFeSi interspersed. Most other phases appear as small-sized grains. It could be inferred that FeSi or FeSi2 formed early and grew quickly, while the other phases formed only during rapid quenching. In some large grains, several smaller grains of AlFeSi and AlCu were found embedded. The IPF shows that most of the large FeSi2 grains (blue color) solidified in a similar orientation. However, overall, the grains of the sample were randomly oriented, and no preferred growth direction could be determined. Different phases were identified in different regions of the sample. However, in all regions, FeSi, FeSi2, AlCu, and Sn phases were identified. Some of the other phases identified were FeSi, Fe3Al2Si3, and Cu3Sn. In all regions analyzed, FeSi and FeSi2 formed the largest grains of similar orientation, followed by FeSiAl, which formed the next-largest grains. FeSi2 is theoretically expected to appear at ~993 °C. The temperature difference (ΔT) is less than 1% of the absolute temperature (1000 °C). Hence, it is possible that FeSi2 could have been formed in some regions where the temperature was slightly lower, allowing for the formation of FeSi2. This agrees with the identification of the pseudo-phase, where the presence of both FeSi and FeSi2 could be predicted.

3.5. Analysis of Microstructure and Composition of Samples Annealed at 800 °C

The simulation of the solidification process under isothermal conditions of the alloy predicts the appearance of a short-lived phase, Fe2SiAl2, at ~840 °C, which then disappears at ~789 °C. Furthermore, Fe (Si, Al)2, another phase that appears at ~993 °C, is expected to be observed at 800 °C. At 800 °C, the simulated composition of the alloy is shown in Table 6.
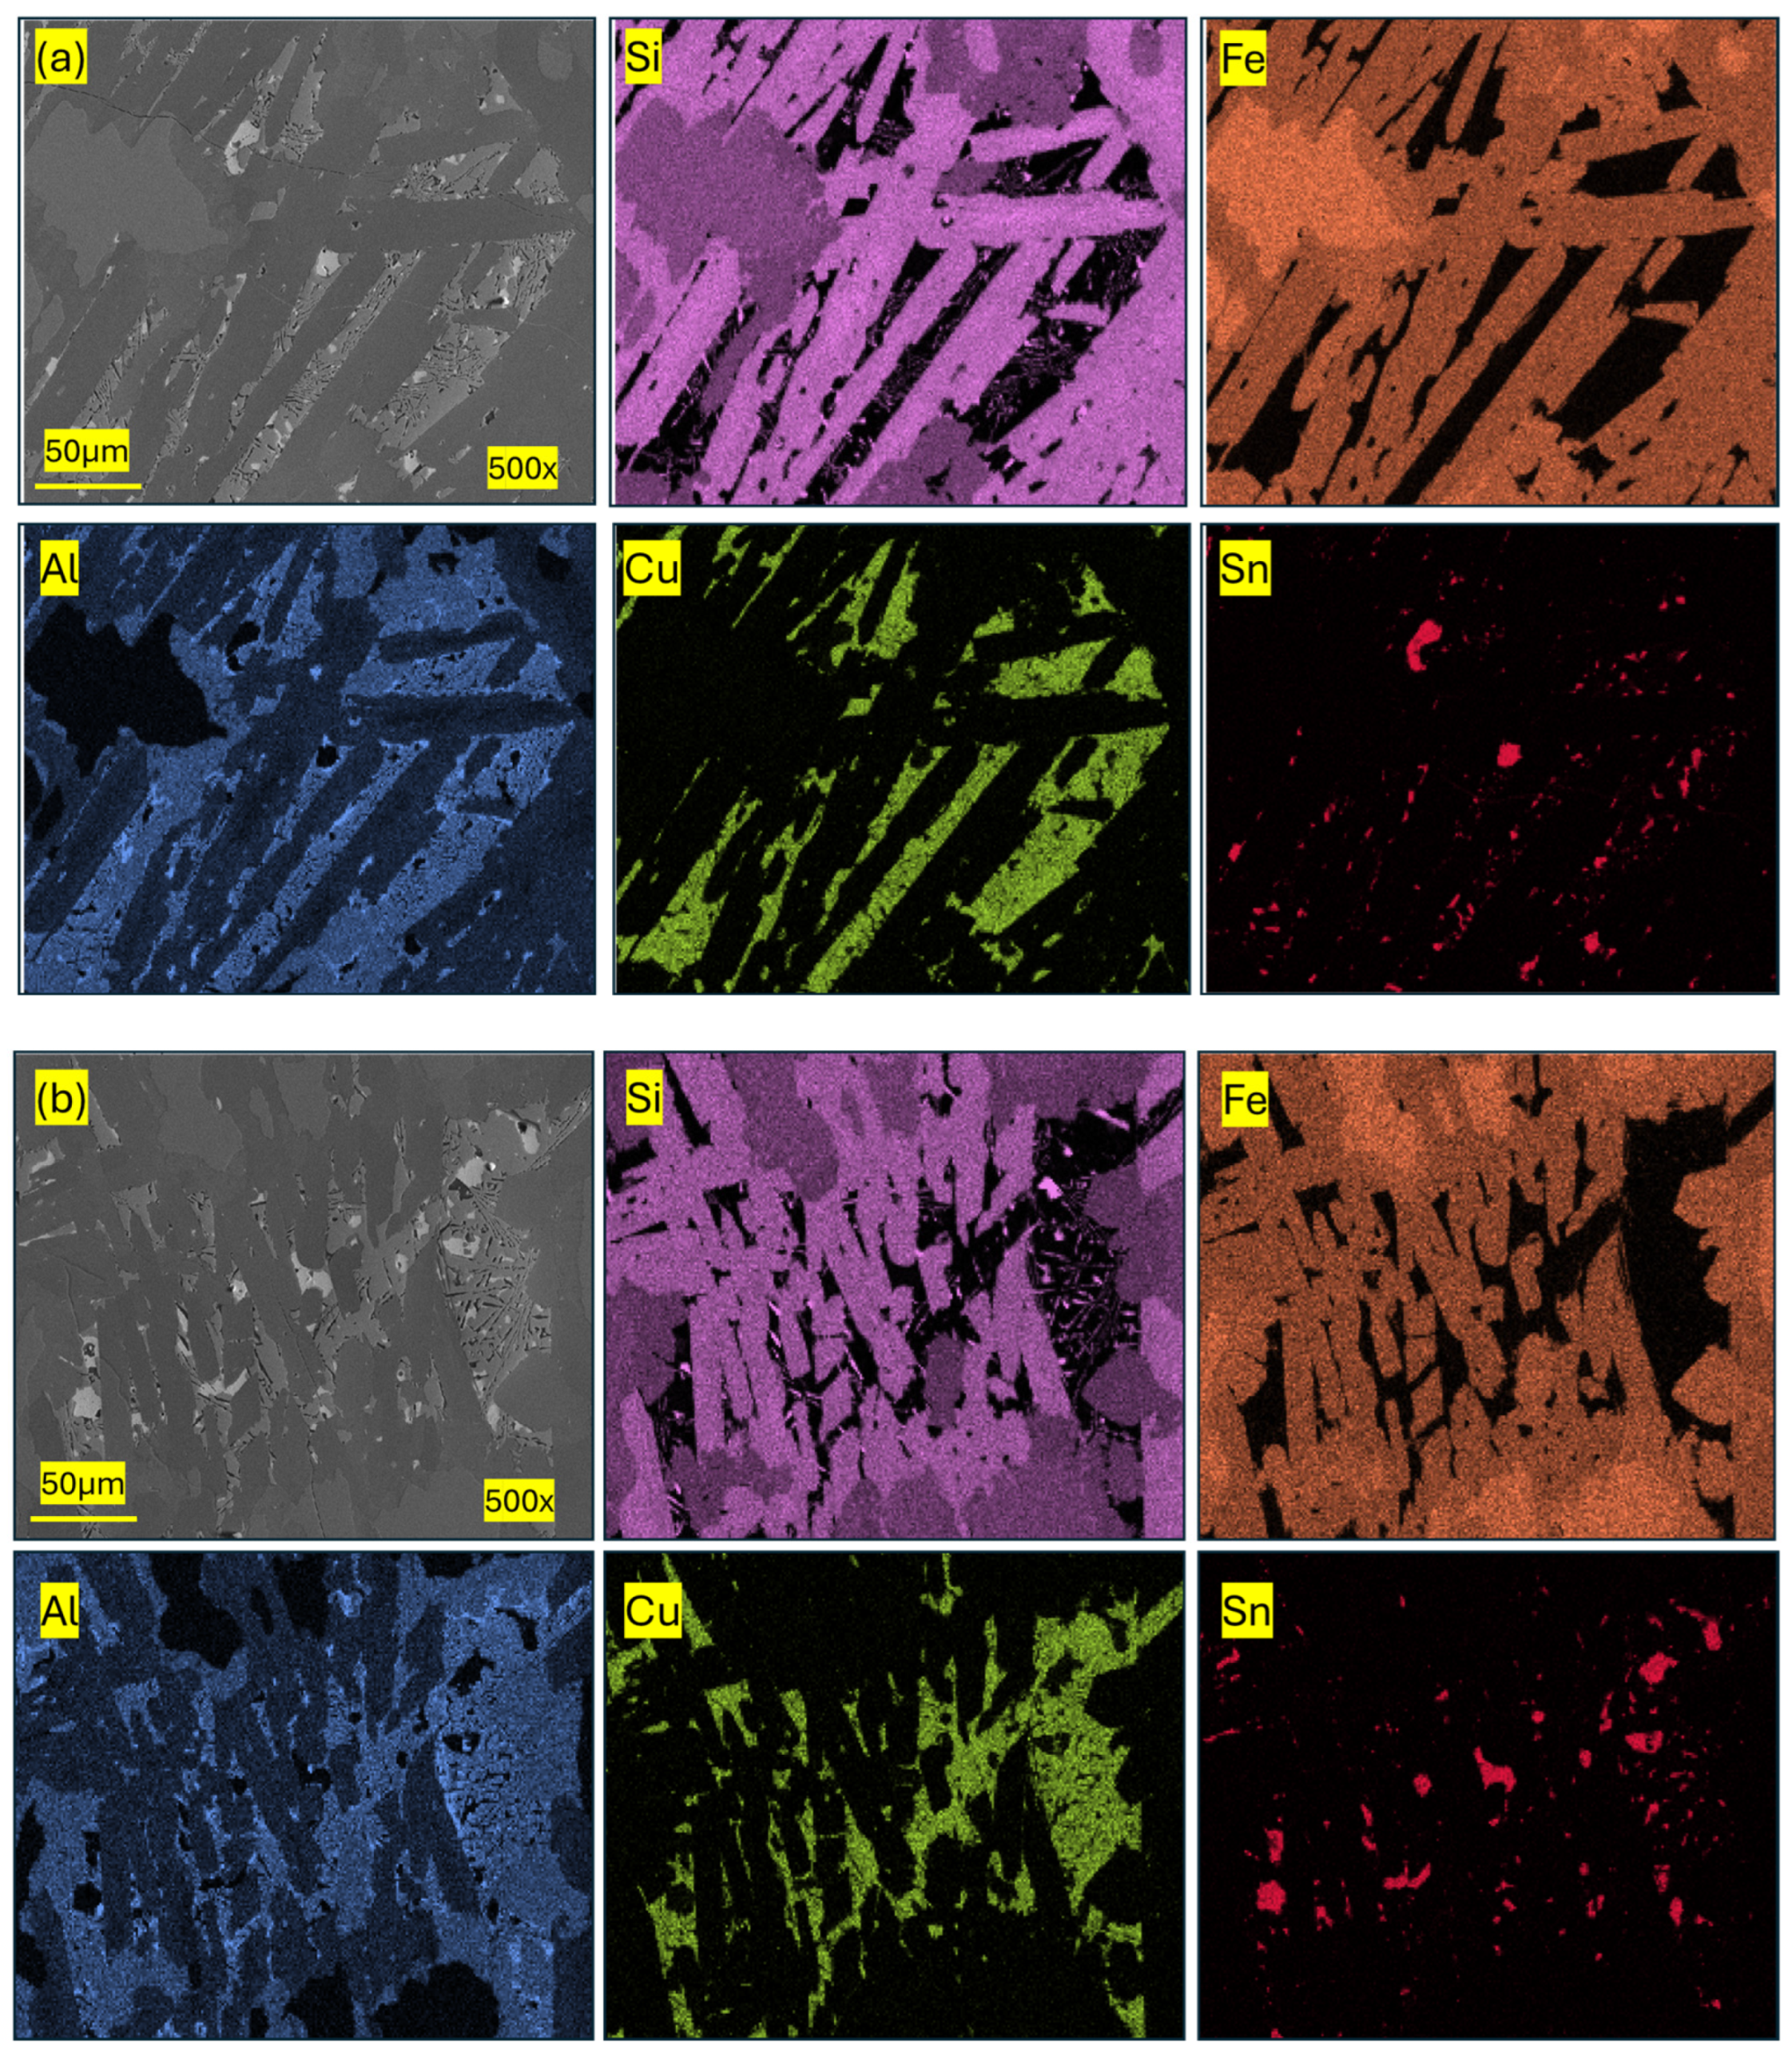
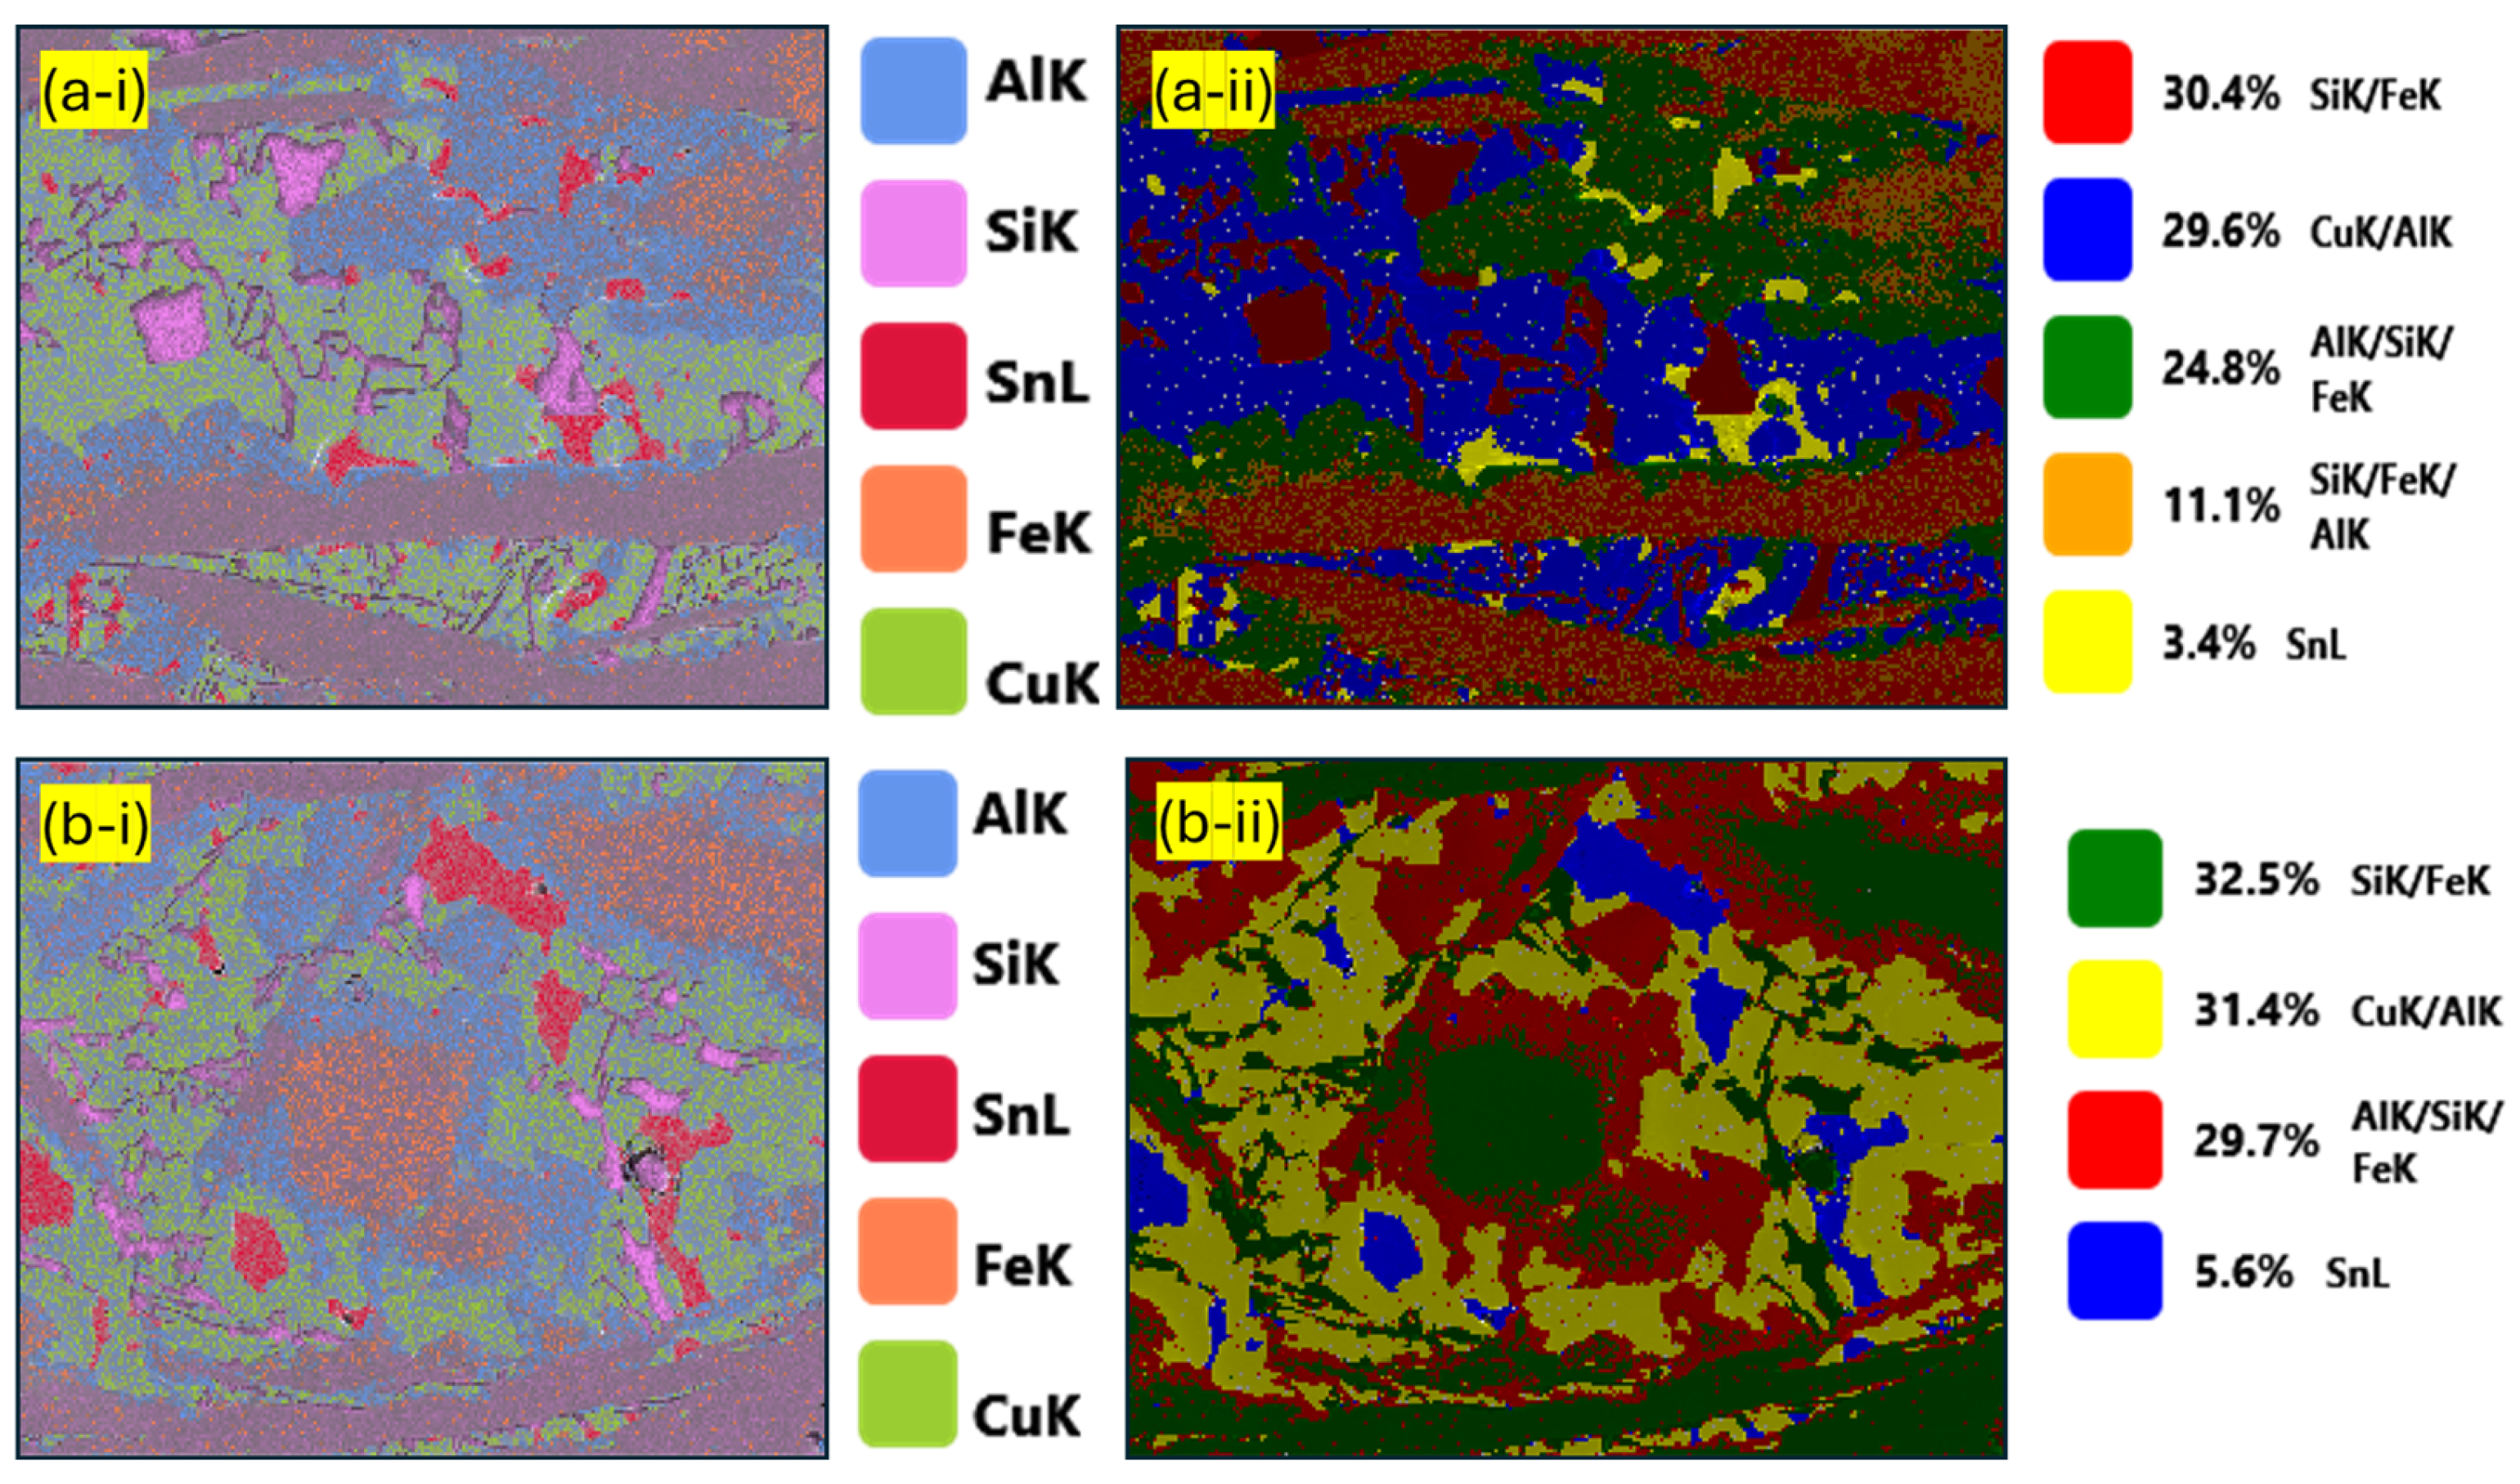
Figure 11 shows the SEM images and the corresponding EDS elemental maps of two regions of the sample annealed at 800 °C. Figure 11a shows the area closer to the edge, while Figure 11b shows the area toward the center of the sample. In this case, the grains were observed to be elongated throughout the microstructure. Figure 12 shows the elemental overlay maps and the pseudo-phase overlay maps as recognized by EDS. Figure 12(a-i,a-ii) represent the elemental overlay and the phase overlay maps, respectively, of the region shown in Figure 11a, while Figure 12(b-i,b-ii) correspond to the region shown in Figure 11b. Table 7 shows the different pseudo-phases identified by the EDS depending on the composition of the phases. In this sample, the composition identified by EDS did not match the theoretical composition as closely as for the sample annealed at 1000 °C. While the Fe/Si phase was determined, the percentage of Si atoms was neither equal to nor twice that of the Fe atoms (~1.5 times). This could be due to the coexistence of FeSi and FeSi2 phases, which could not be differentiated using EDS. In several regions analyzed, the atomic ratio of Si/Fe ranged between 0.9 and 2.2, resulting in a relatively large standard deviation in the content of Fe and Si in the Fe/Si pseudo-phase, as shown in Table 8. Similar results were also observed in the samples annealed at other temperatures. However, the Fe/Si phases constituted ~50% of the analyzed region. A pseudo-phase with Fe/Si/Al was also identified, where the atomic % of Al was mostly around half that of Si. Other pseudo-phases identified included Cu/Al, Si/Al/Cu, and Sn. The Al/Cu and Sn pseudo-phases were also observed in the sample annealed at 1000 °C. The Al/Cu pseudo-phase had a similar atomic composition to the pseudo-phase identified in the sample annealed at 1000 °C. However, the Sn pseudo-phase contained a considerably higher amount of Cu than that observed in the sample annealed at 1000 °C. This could be due to the Cu becoming trapped in the liquid during rapid solidification. When the alloy was quenched from 1000 °C, the liquid was more abundant (35% wt.), and hence there was a greater probability of Cu diffusing out. However, at 800 °C, the liquid phase was less abundant (25%) and could be surrounded by more solid grains, which prevented the rapid diffusion of Cu from the solidifying liquid.
The Si/Al/Cu pseudo-phase is an additional phase that does not appear in the theoretical simulation. This could have formed during rapid solidification during quenching. It can be seen that Al is associated with some portions of Fe-Si-rich regions. Furthermore, the Si/Al/Cu pseudo-phase is identified only within the regions of the Al-Cu pseudo-phase. We believe this occurred during the solidification of the remaining liquid portion of the alloy during rapid cooling. Solid Si would have been trapped within the solidifying Al-Cu-Sn liquid, as pure Si solidifies at a much higher temperature of ~1400 °C. This assumption is supported by the presence of small Si-rich regions in the Al-Cu-rich regions. In the microstructure of samples annealed at 800 °C, Sn is found distributed throughout the microstructure, closer to the Al-Cu regions. However, the Sn-rich regions were comparatively smaller than those observed in the samples annealed at 1000 °C.
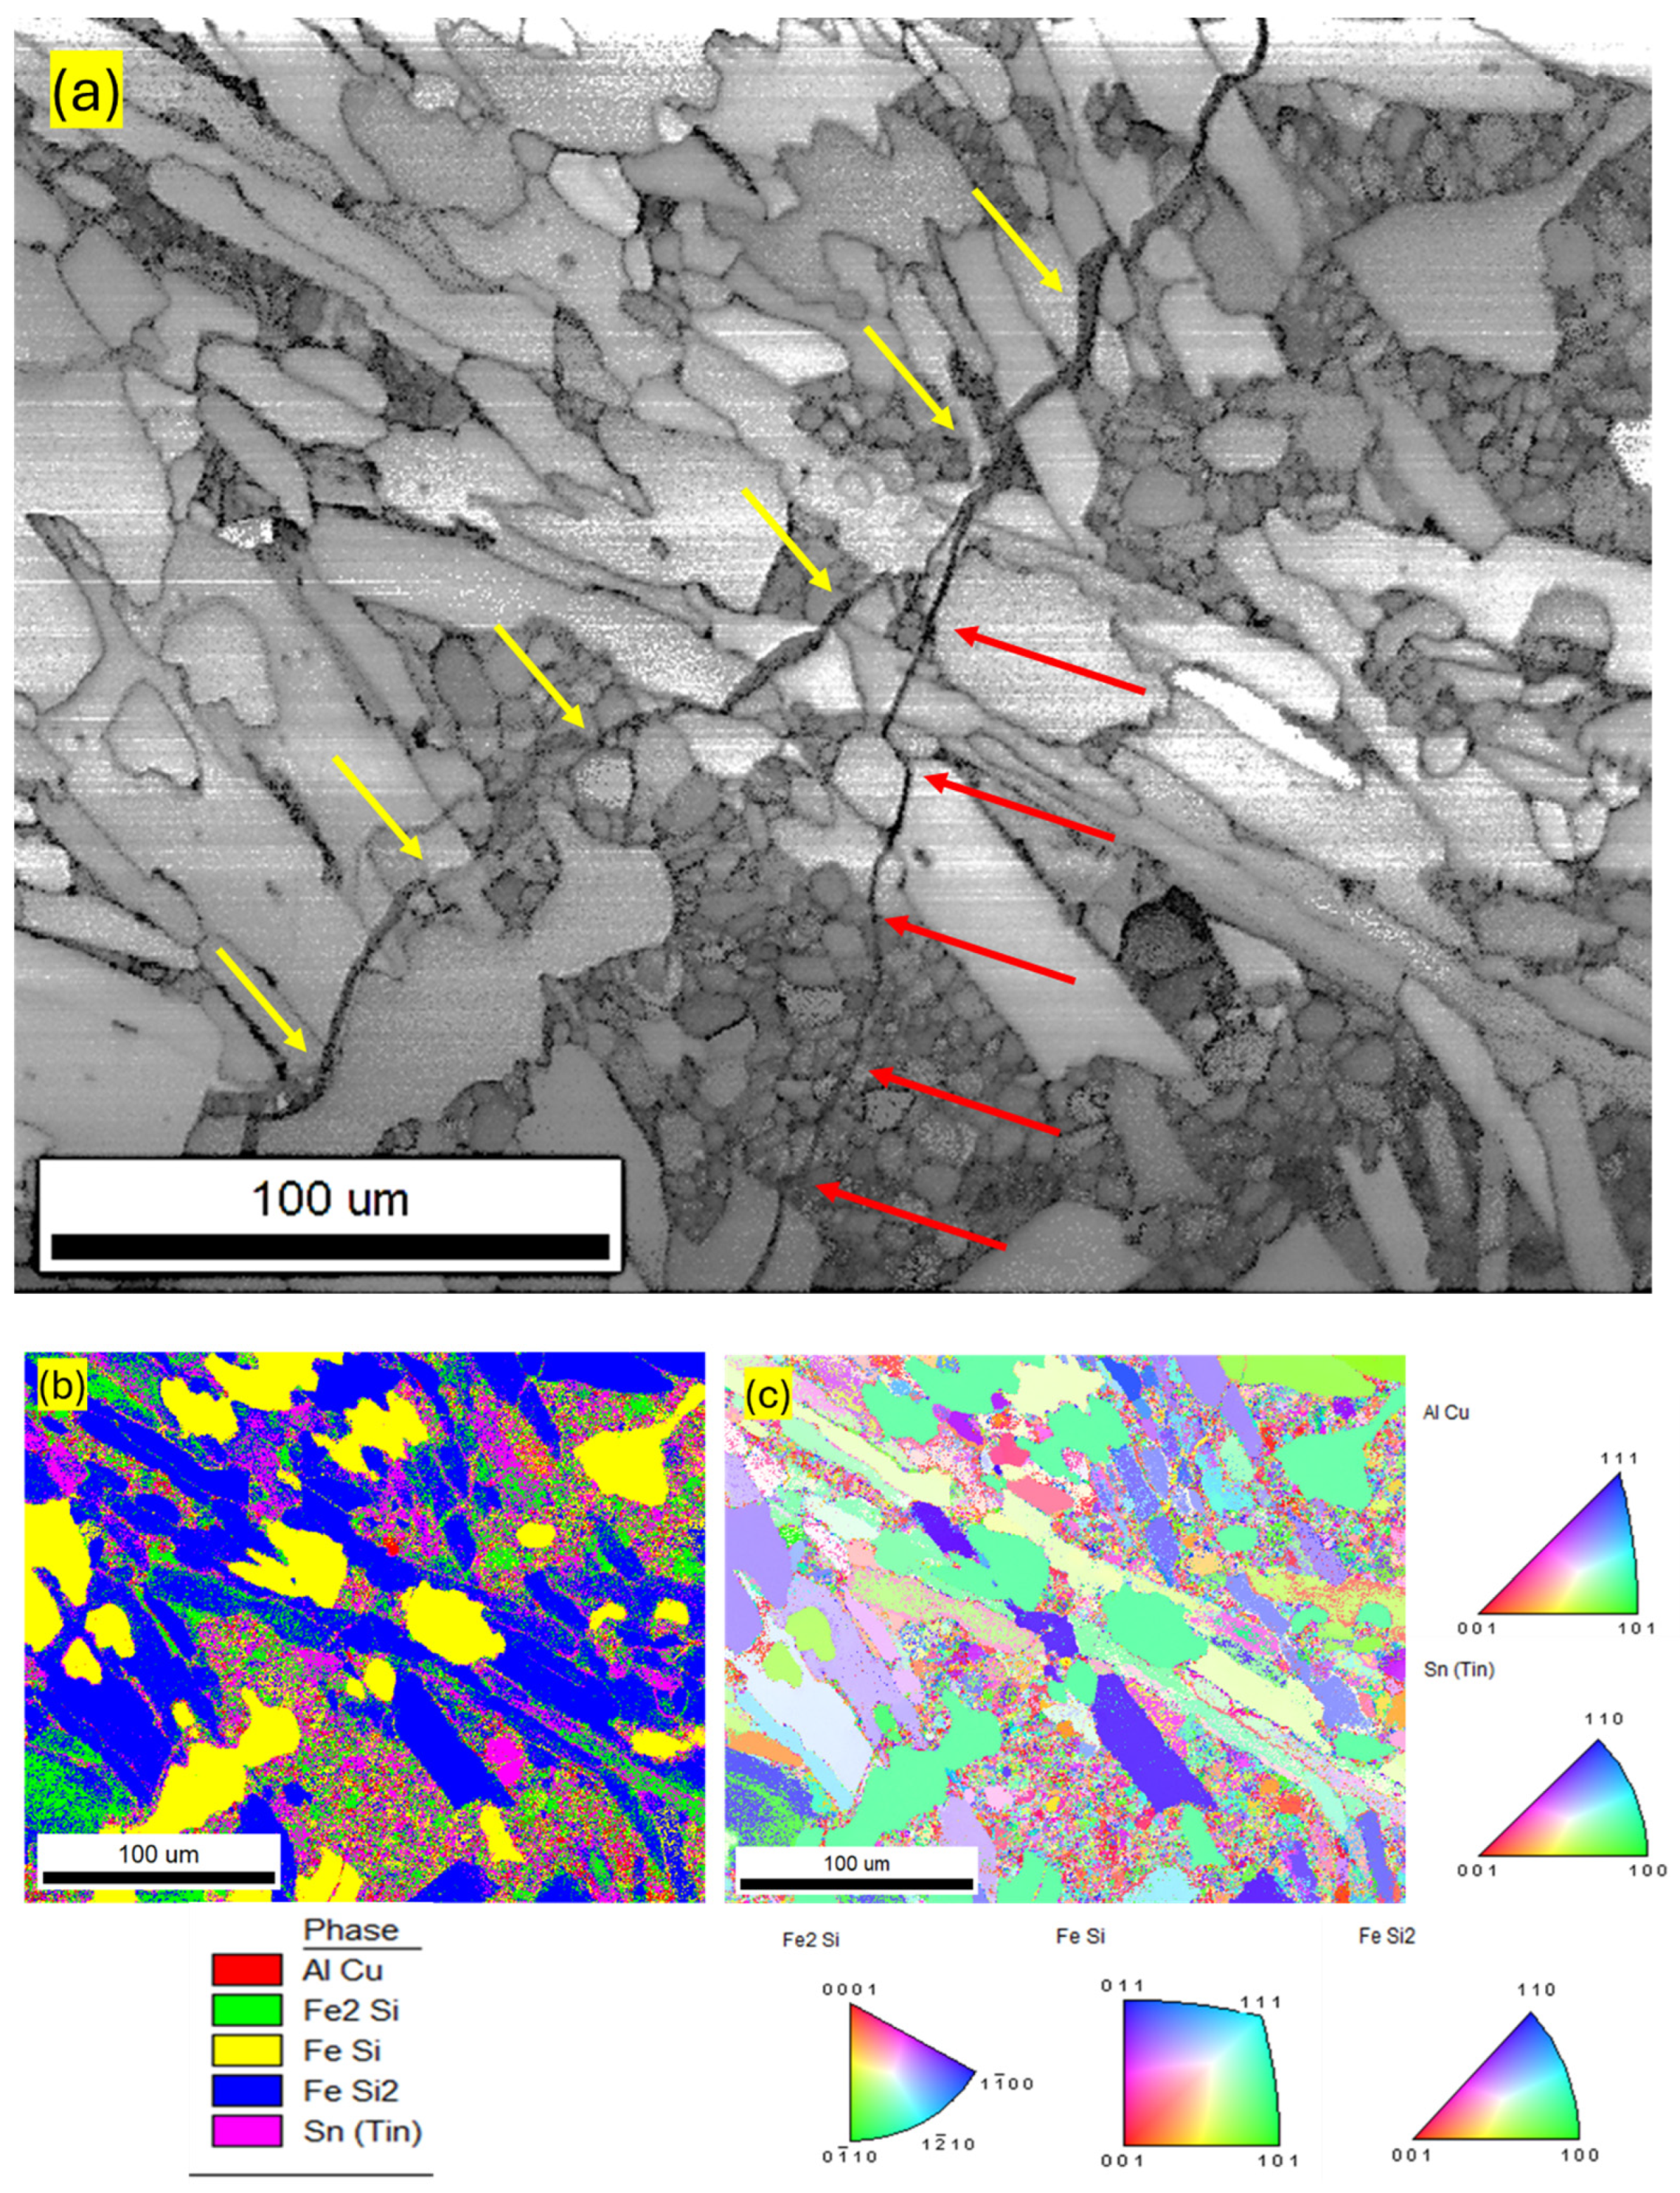
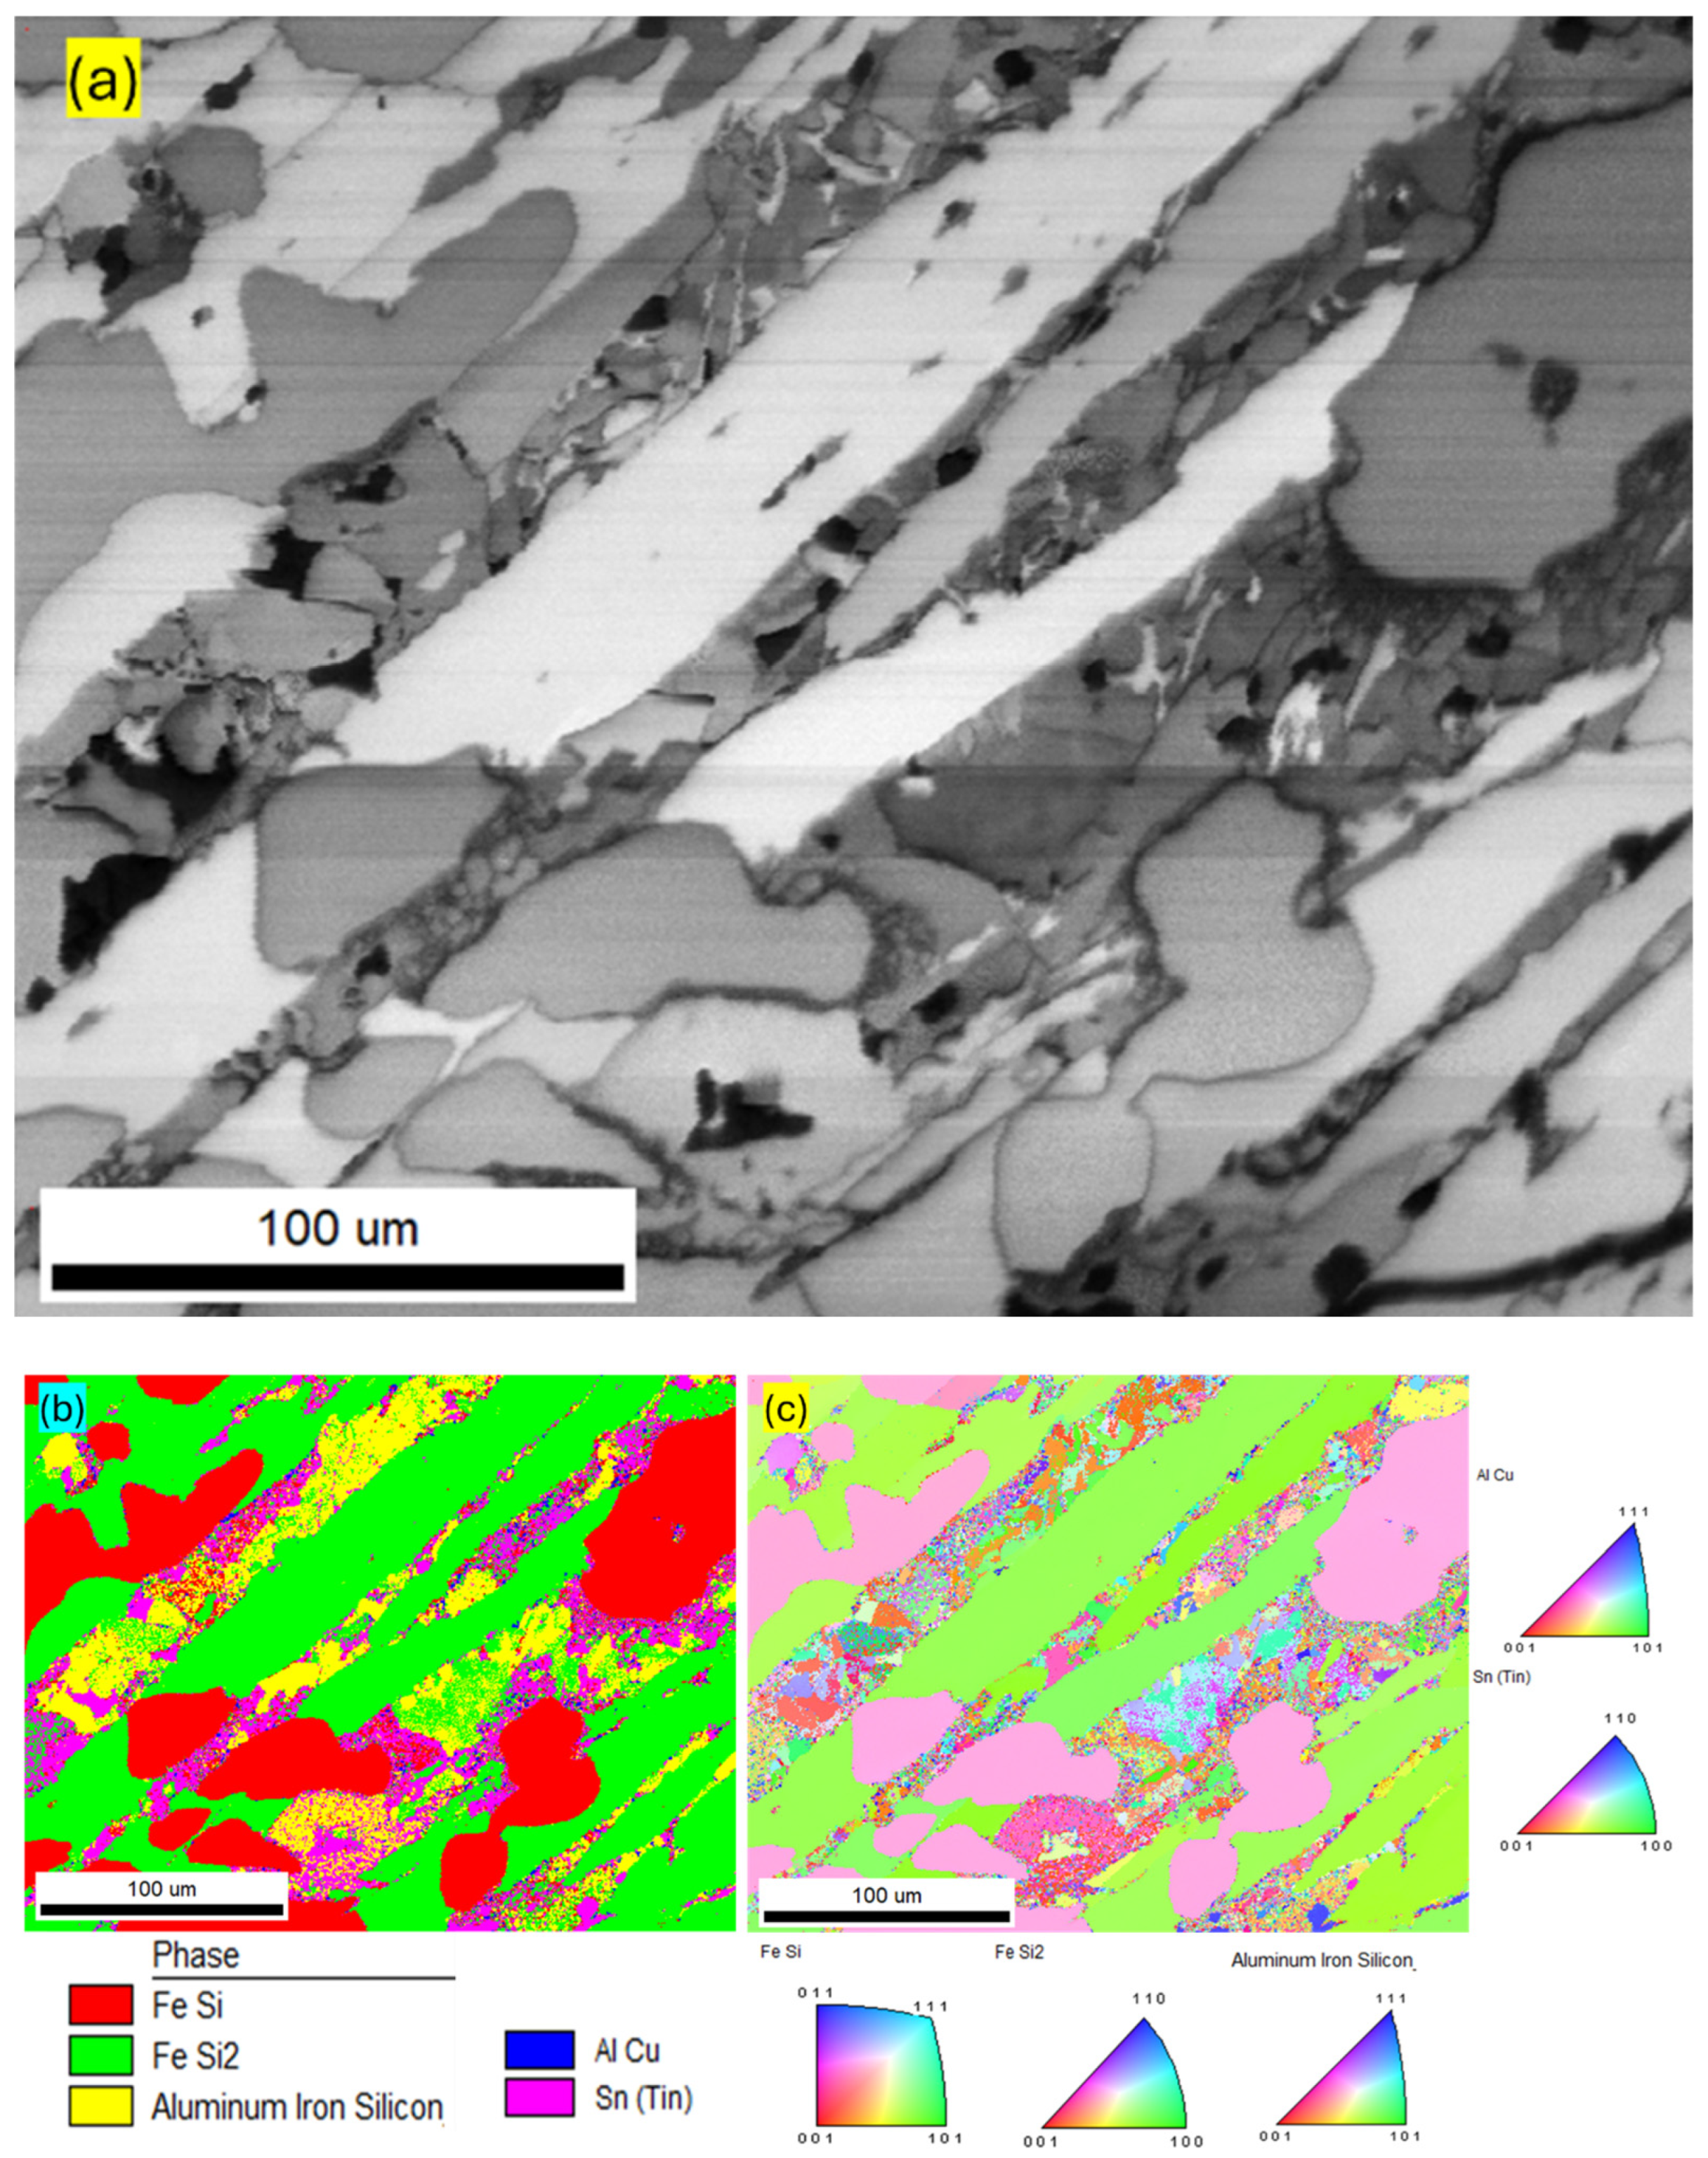
Figure 13a–c show the images of the grains, the phase map, and the IPM of an area toward the center of the sample annealed at 800 °C obtained using EBSD. The color codes of the different phases identified are also given below the images. Using EBSD, three different phases with Fe and Si were identified, as shown. Only FeSi grains show a preferred orientation, as all the FeSi crystals appear to have a similar orientation, while all other phases appear to be randomly oriented, with no preferred direction of crystal growth. FeSi and FeSi2 formed the largest grains in all the areas analyzed. The FeSi grains were more ovoidal and less elongated, while the FeSi2 grains were oblong and elongated. The different grains of FeSi2 and Fe2Si exhibited different orientations. The Fe2Si phase was found in close proximity to the AlCu and Sn phases. Theoretically, the phase formed should have been Fe2SiAl2; however, the specific phase was not available in the materials library. As in the case of the sample annealed at 1000 °C, AlCu and Sn formed small, randomly oriented grains. Interestingly, a crack was observed in this region of the sample. Two cracks were observed—a wider and longer crack that skirted the boundaries of the FeSi grains but passed through the FeSi2 grains (shown by yellow arrows in Figure 13a) and a shorter crack branching off from the longer crack (shown by red arrows in Figure 13a). The gap between the longer crack was filled with tiny crystals of AlCu and Sn. Hence, we deduce that the longer crack appeared during the initial phase of the cooling process, when the remaining Al, Cu, and Sn liquid could flow into the void created by the cracks. The shorter crack appeared during the later stage of the cooling process, when the liquid had partly or completely solidified and hence could not move to fill the vacant space. The shorter crack could also have appeared during the machining process. These cracks were only found in a small area of the sample, closer to the outer edge of the macroscopic sample.

3.6. Analysis of Microstructure and Composition of Samples Annealed at 590 °C

At 590 °C, the phases expected to be present in the simulated alloy are FeSi, FeSi2, FeSiAl2, a BCC solid solution comprising almost all the elements, and a liquid phase comprising Al, Cu, and Sn. The phase FeSiAl2 appears at ~789 °C as a result of solid-state transformation of the Fe2SiAl2 phase. FeSi2 is expected to contribute ~50% of the mass of the alloy, while Fe2SiAl2 and the BCC solid solution are each expected to constitute ~16%. The mass of the remaining solution, almost entirely made of the remaining Al, Cu, and Sn, contributes ~3.6% of the mass of the alloy at this stage. The mass of the phases and their respective fractions in the alloy, obtained with FactSage simulations, are shown in Table 8.
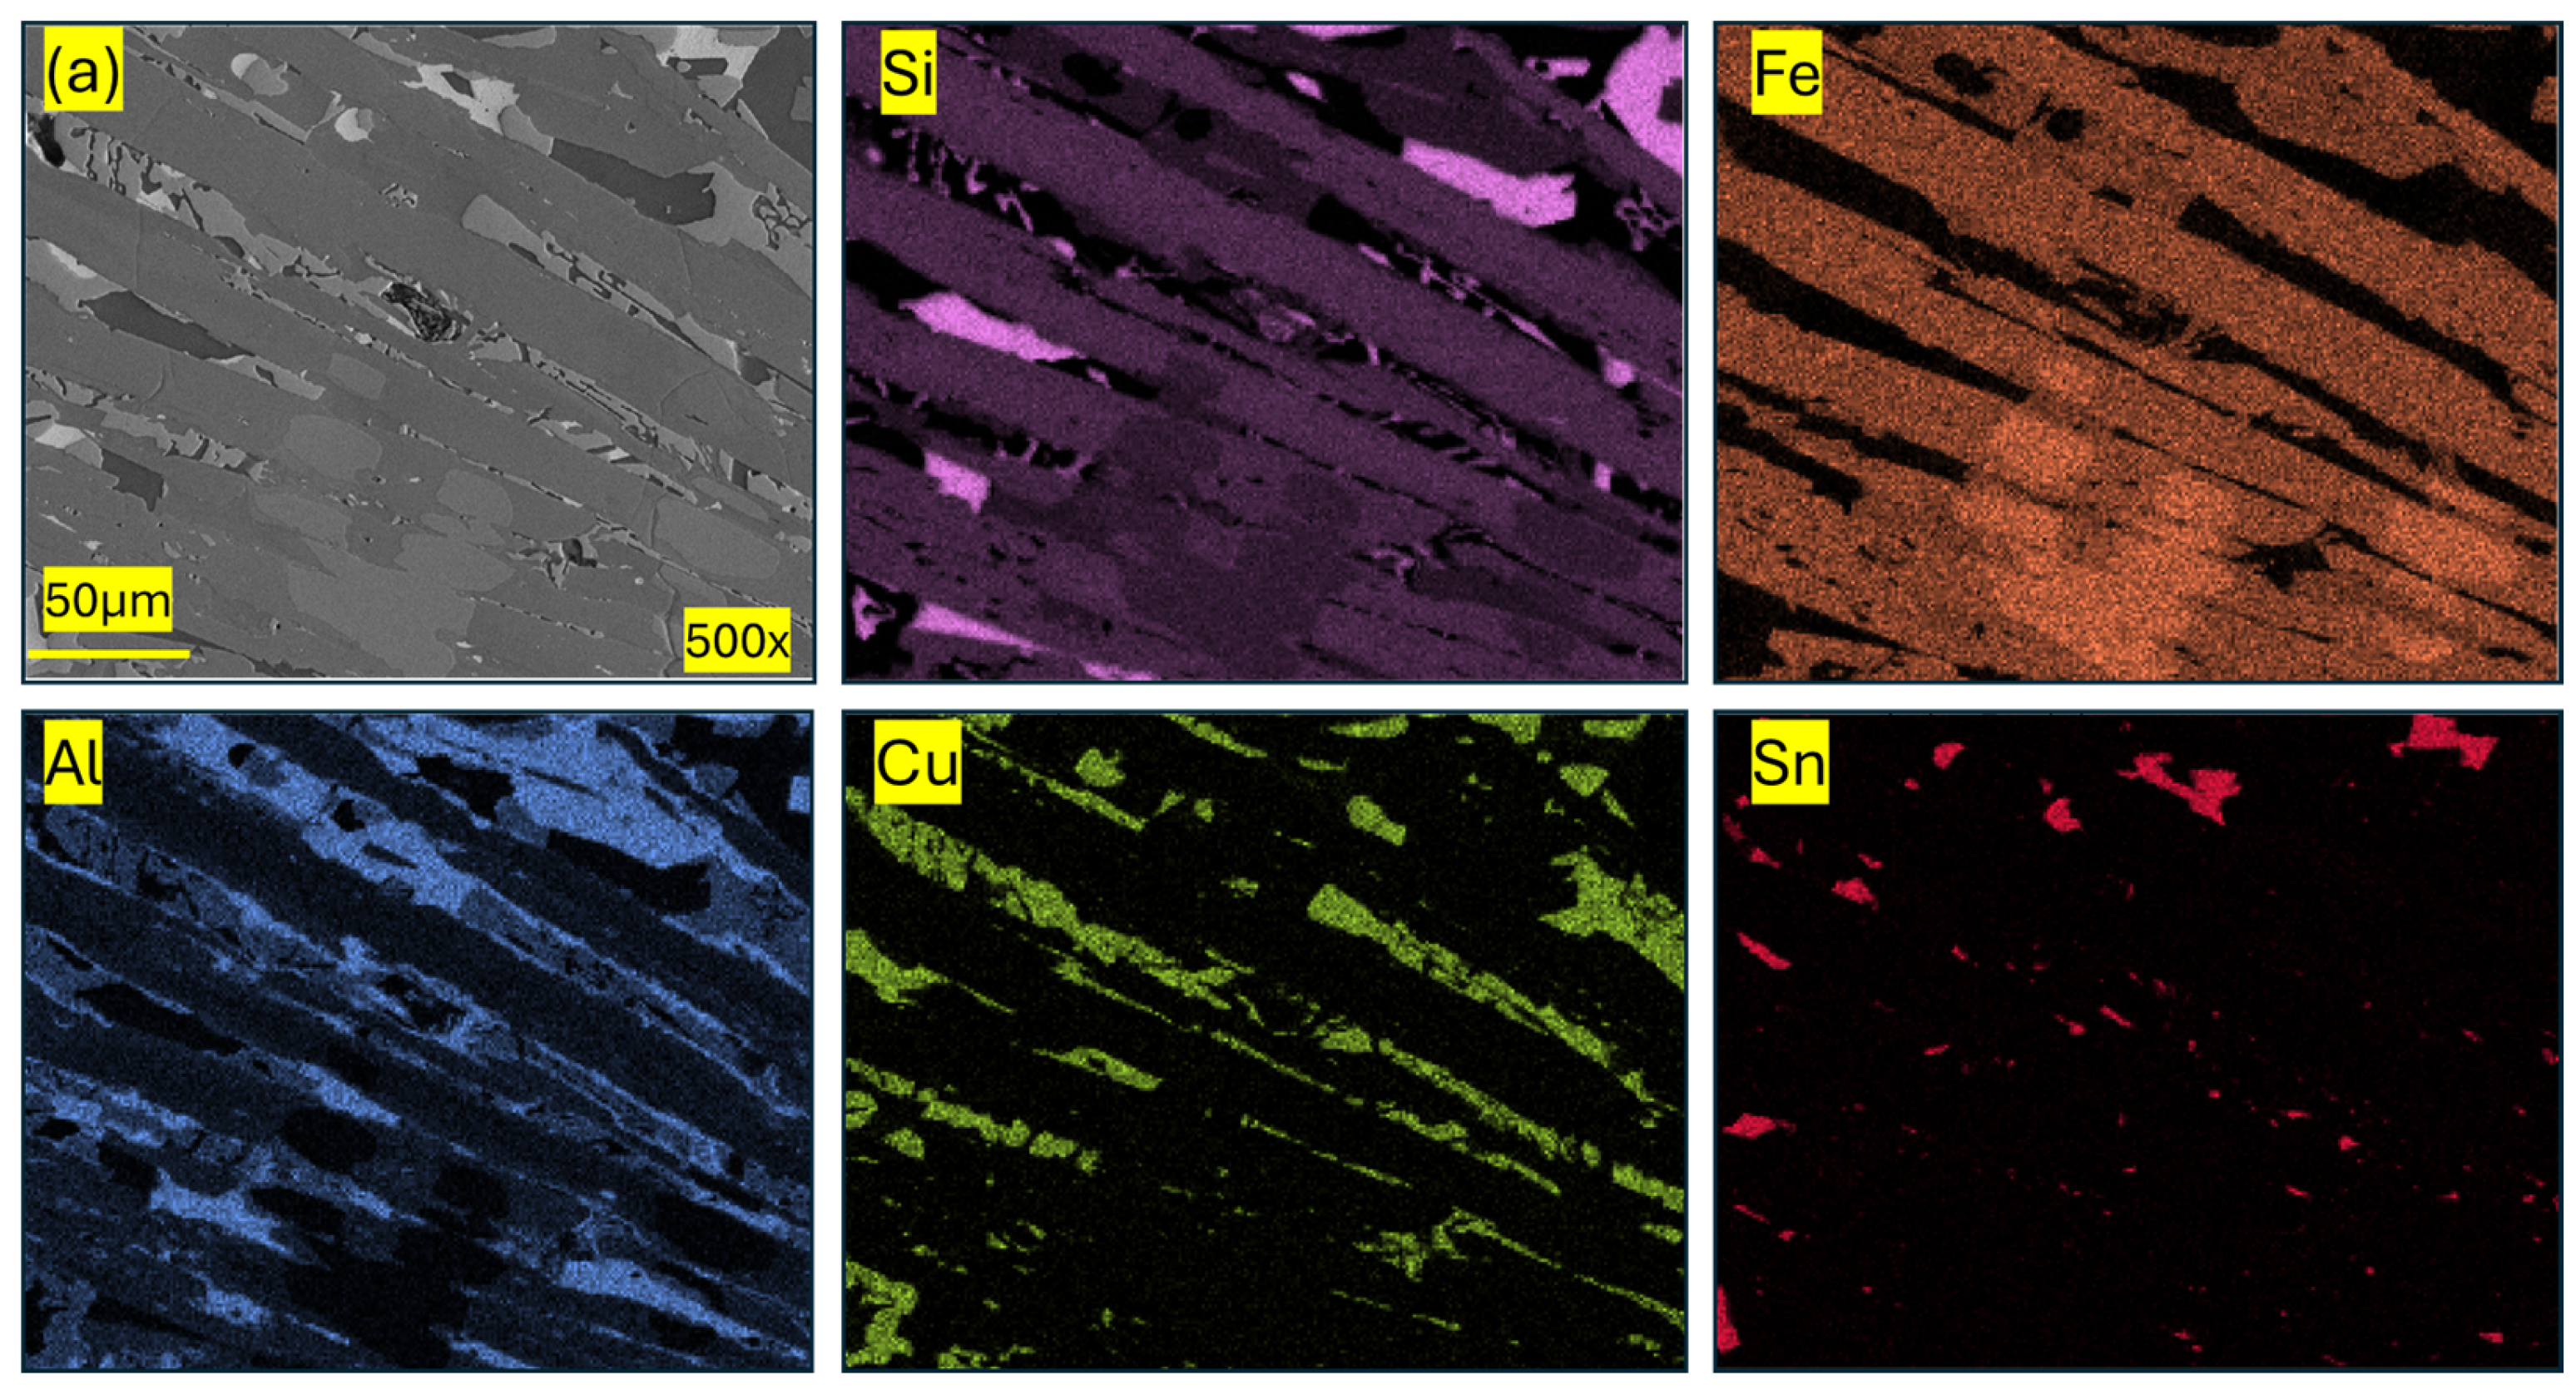
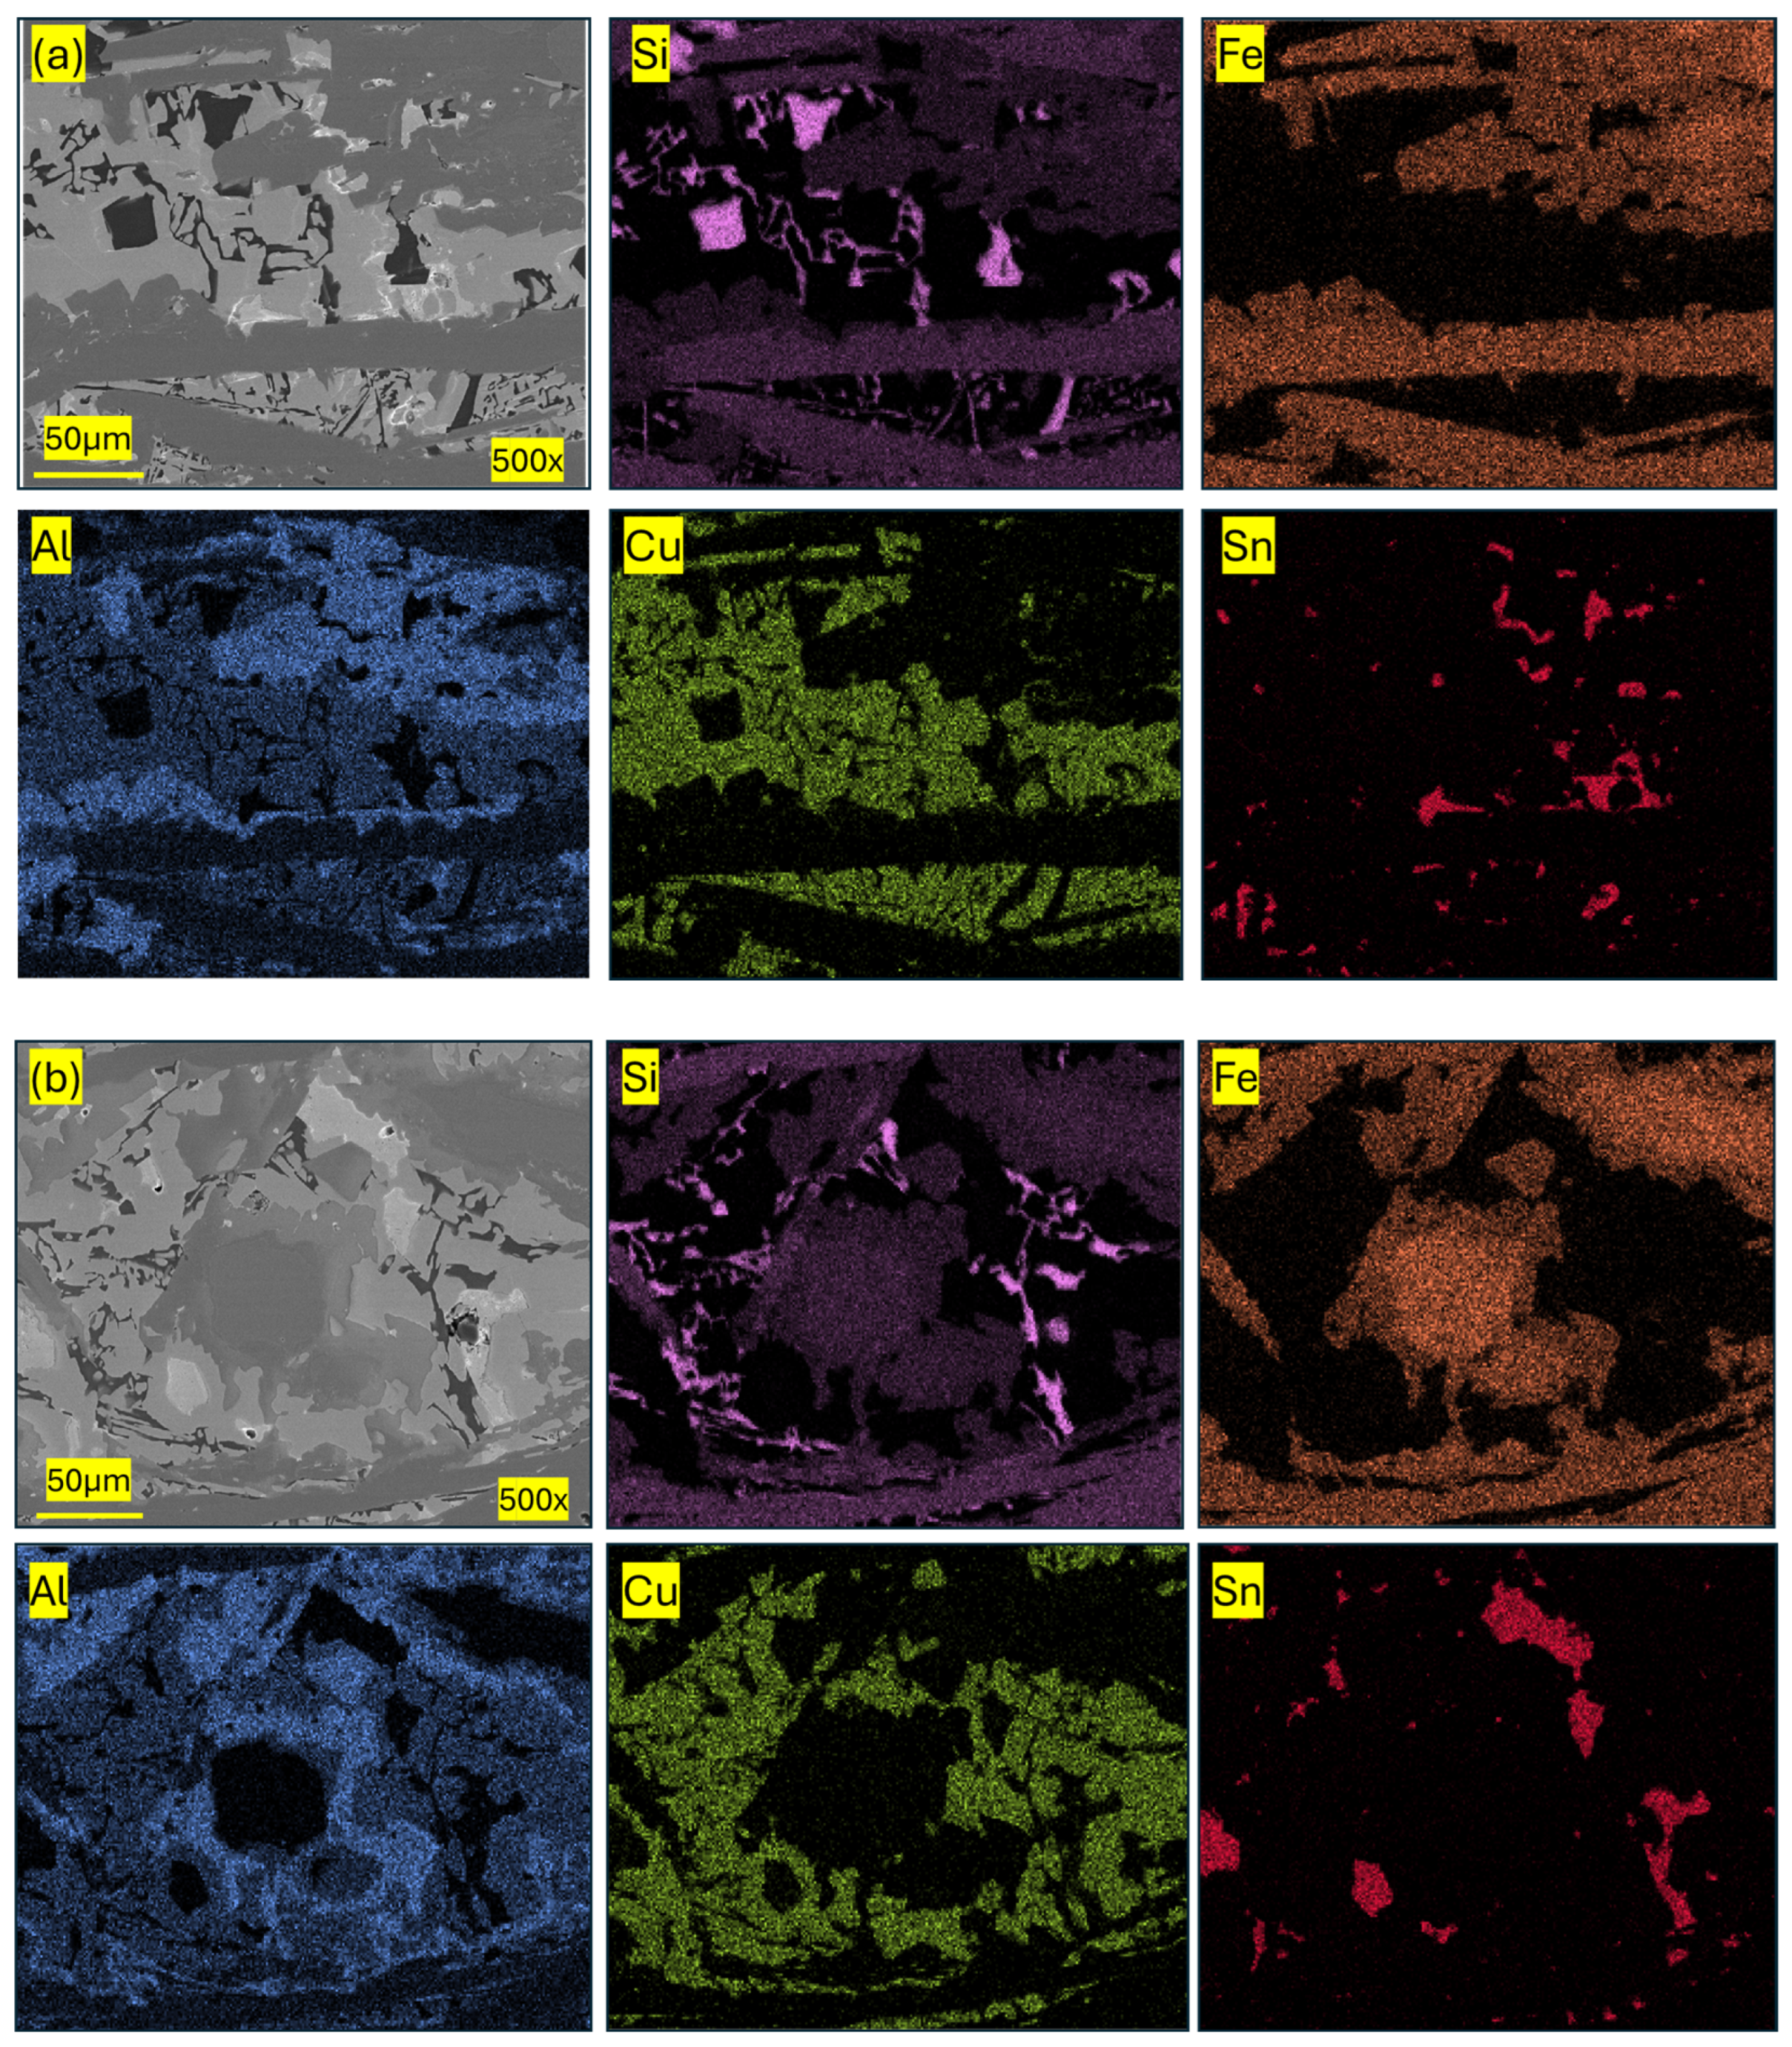
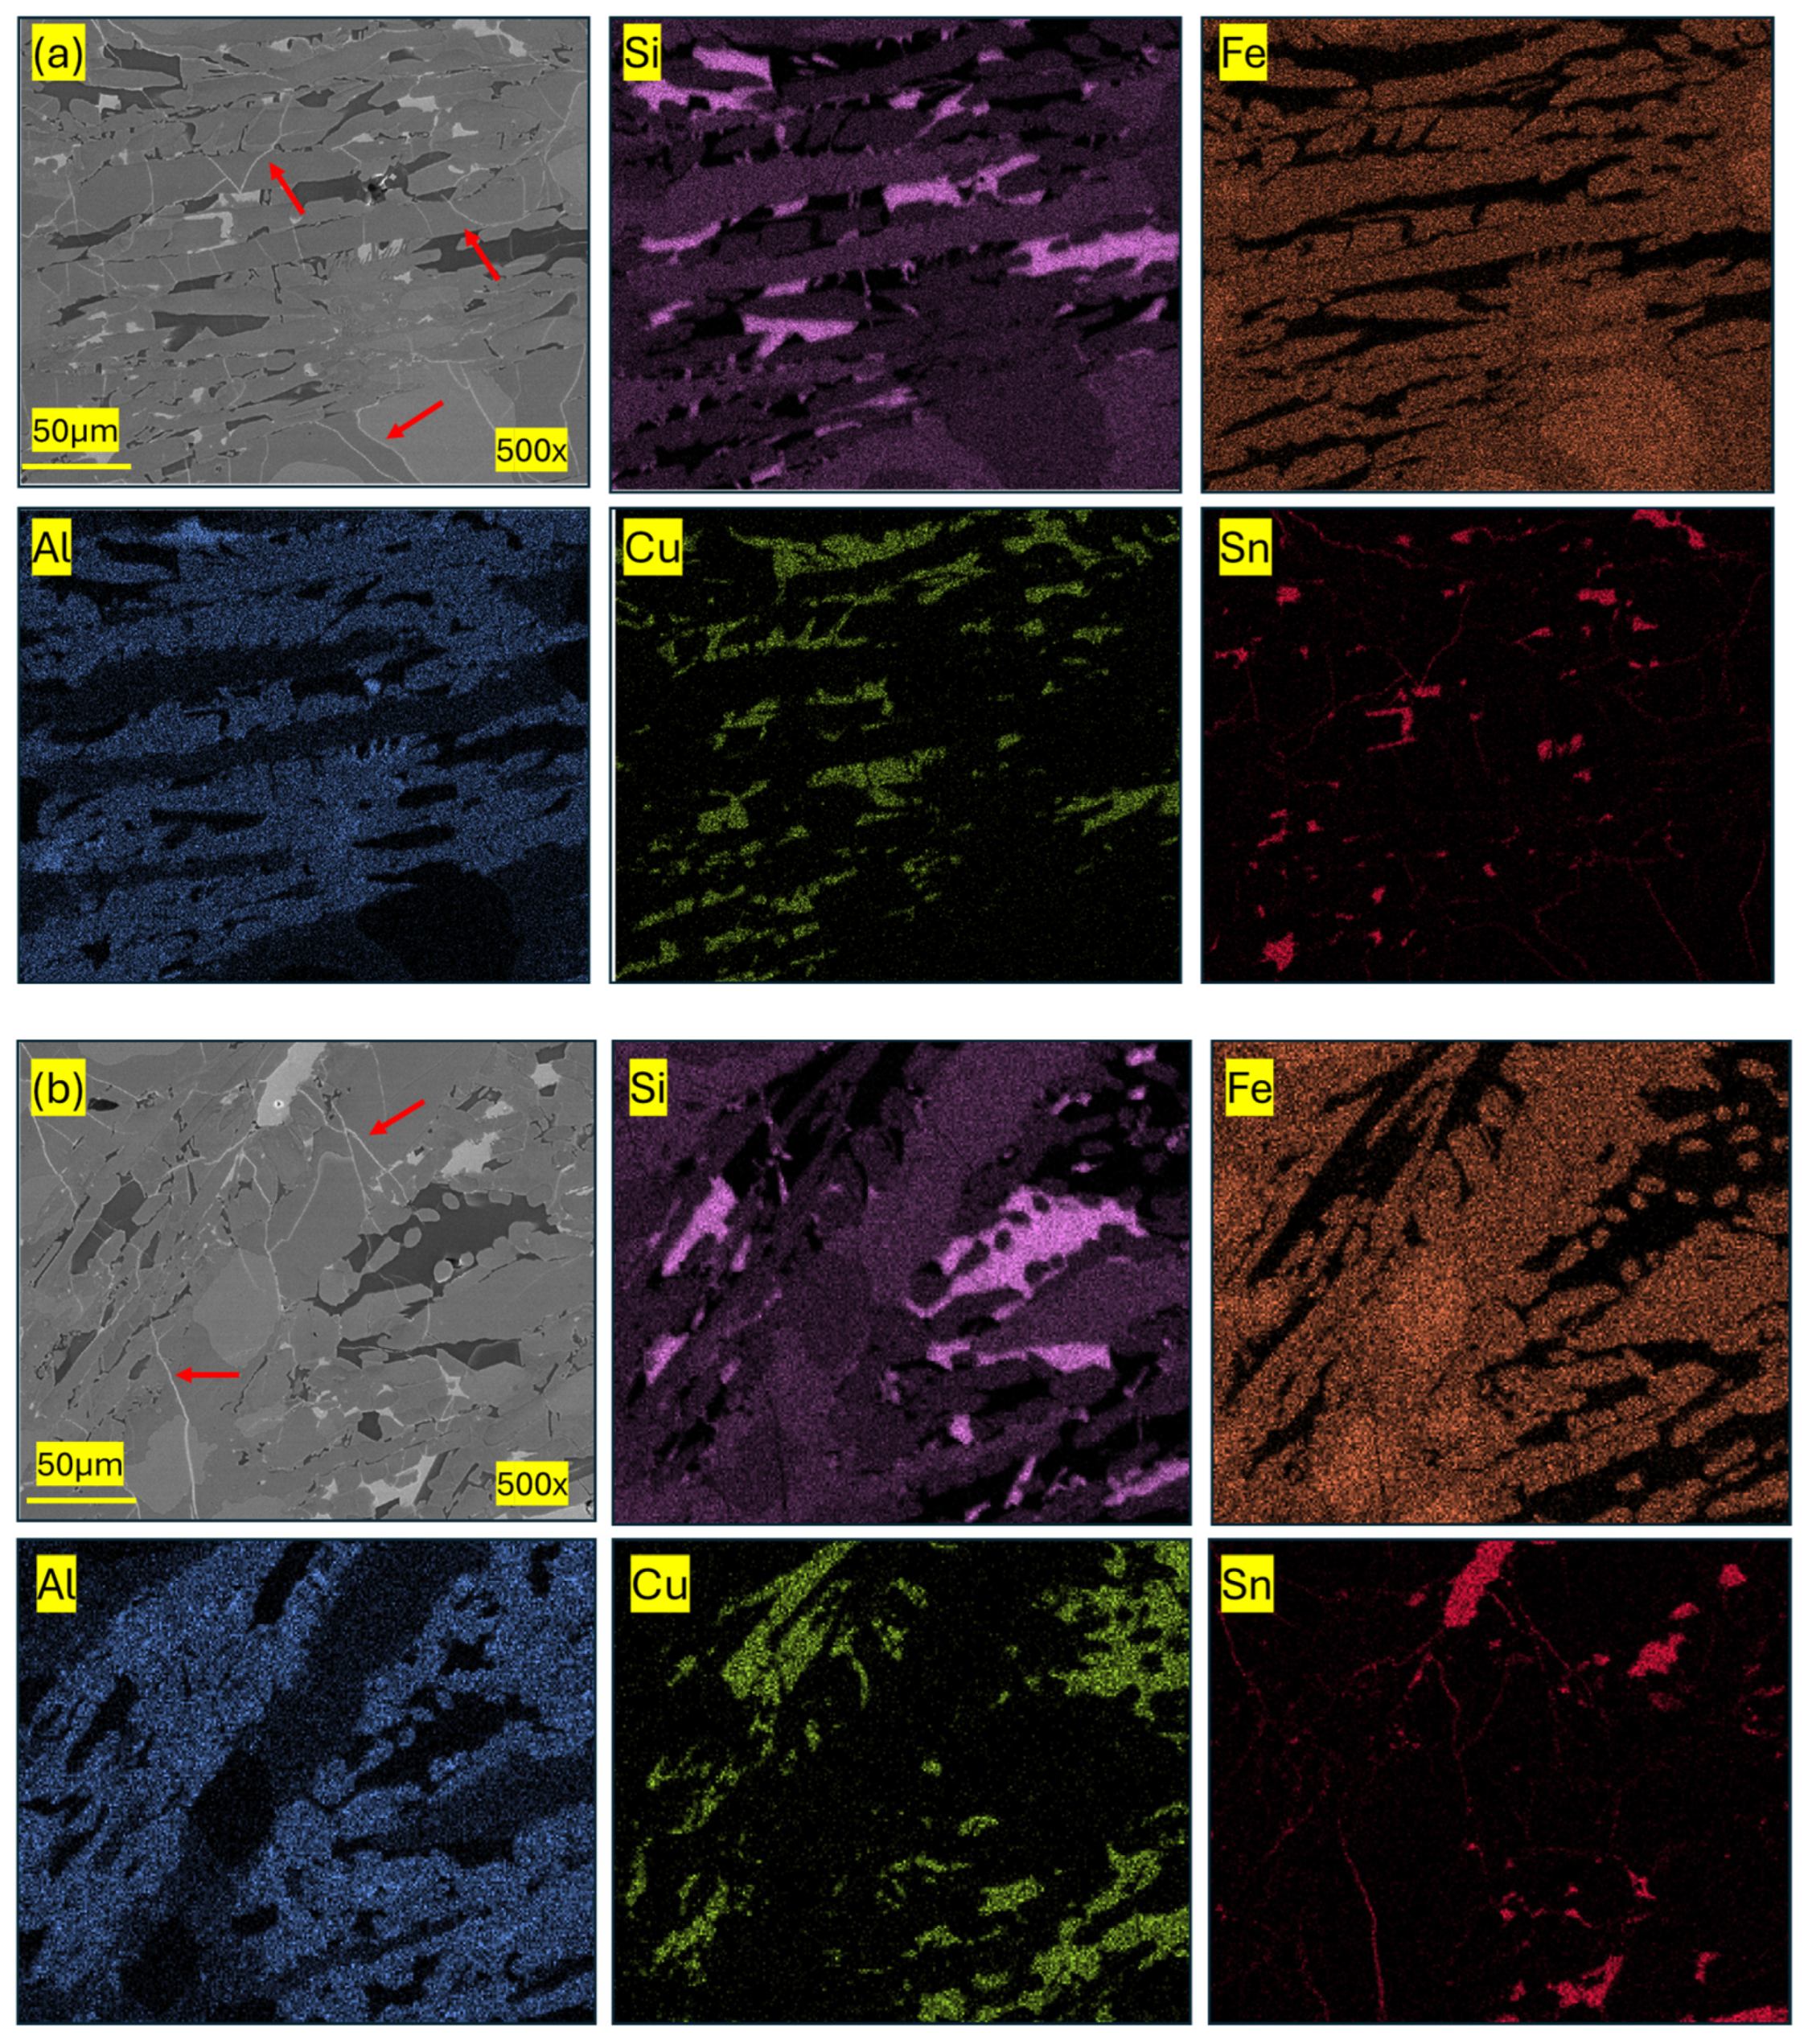
Figure 14 shows the SEM image and the corresponding distribution of the elements of two different regions in the sample annealed at 590 °C. Figure 14a shows the region near the edge of the sample, while Figure 14b shows the area near the center of the sample. In these images, it is observed that Si and Fe cover major portions of the area under observation. The remaining regions are mostly covered by Al and Cu, with small regions rich in Sn and Si distributed throughout the microstructure. Fe, Si, and Al can be seen together in the same regions, confirming the presence of a phase comprising these elements. Some small regions rich in Si were also observed in the areas rich in Al and Cu. For the sample annealed at 590 °C, all pseudo-phases were not identified in all the samples; hence, a larger number of images and maps had to be taken to obtain complete information. Figure 15 shows the elemental overlay maps for the two regions represented in Figure 14a,b. Si-rich regions were found next to Al-Cu-rich regions, with Sn-rich regions interspersed. The Fe-Si-rich regions form the smooth matrix of the sample. In these images, the Al, Cu, and Sn regions appear to be solidified into long needle-shaped regions. These regions were narrower toward the edge of the sample (Figure 14a) than those toward the center (Figure 14b).
Table 9 lists the different pseudo-phases observed and their compositions in atomic percentages, obtained with EDS measurements. FeSi and FeSi2 together contribute to the Fe/Si pseudo-phase. The BCC solid solution is clearly identified in the Sn/Si/Al/Cu pseudo-phase. The Si/Fe/Al pseudo-phase accounts for the FeSiAl2. In this sample, the liquid solution remaining appears to solidify into two different solid pseudo-phases, one with Si, Al, and Cu, along with a Sn-rich phase. This could be due to the rapid cooling of the molten alloy when placed inside the resistance furnace, which could have trapped Si along with Al and Cu. As the alloy cooled down, Al and Cu would start to solidify first, hence precipitating out of the liquid phase and combining with the already-solidified Si, forming Si/Al/Cu-rich regions, while the remaining Sn-rich solution solidified later.
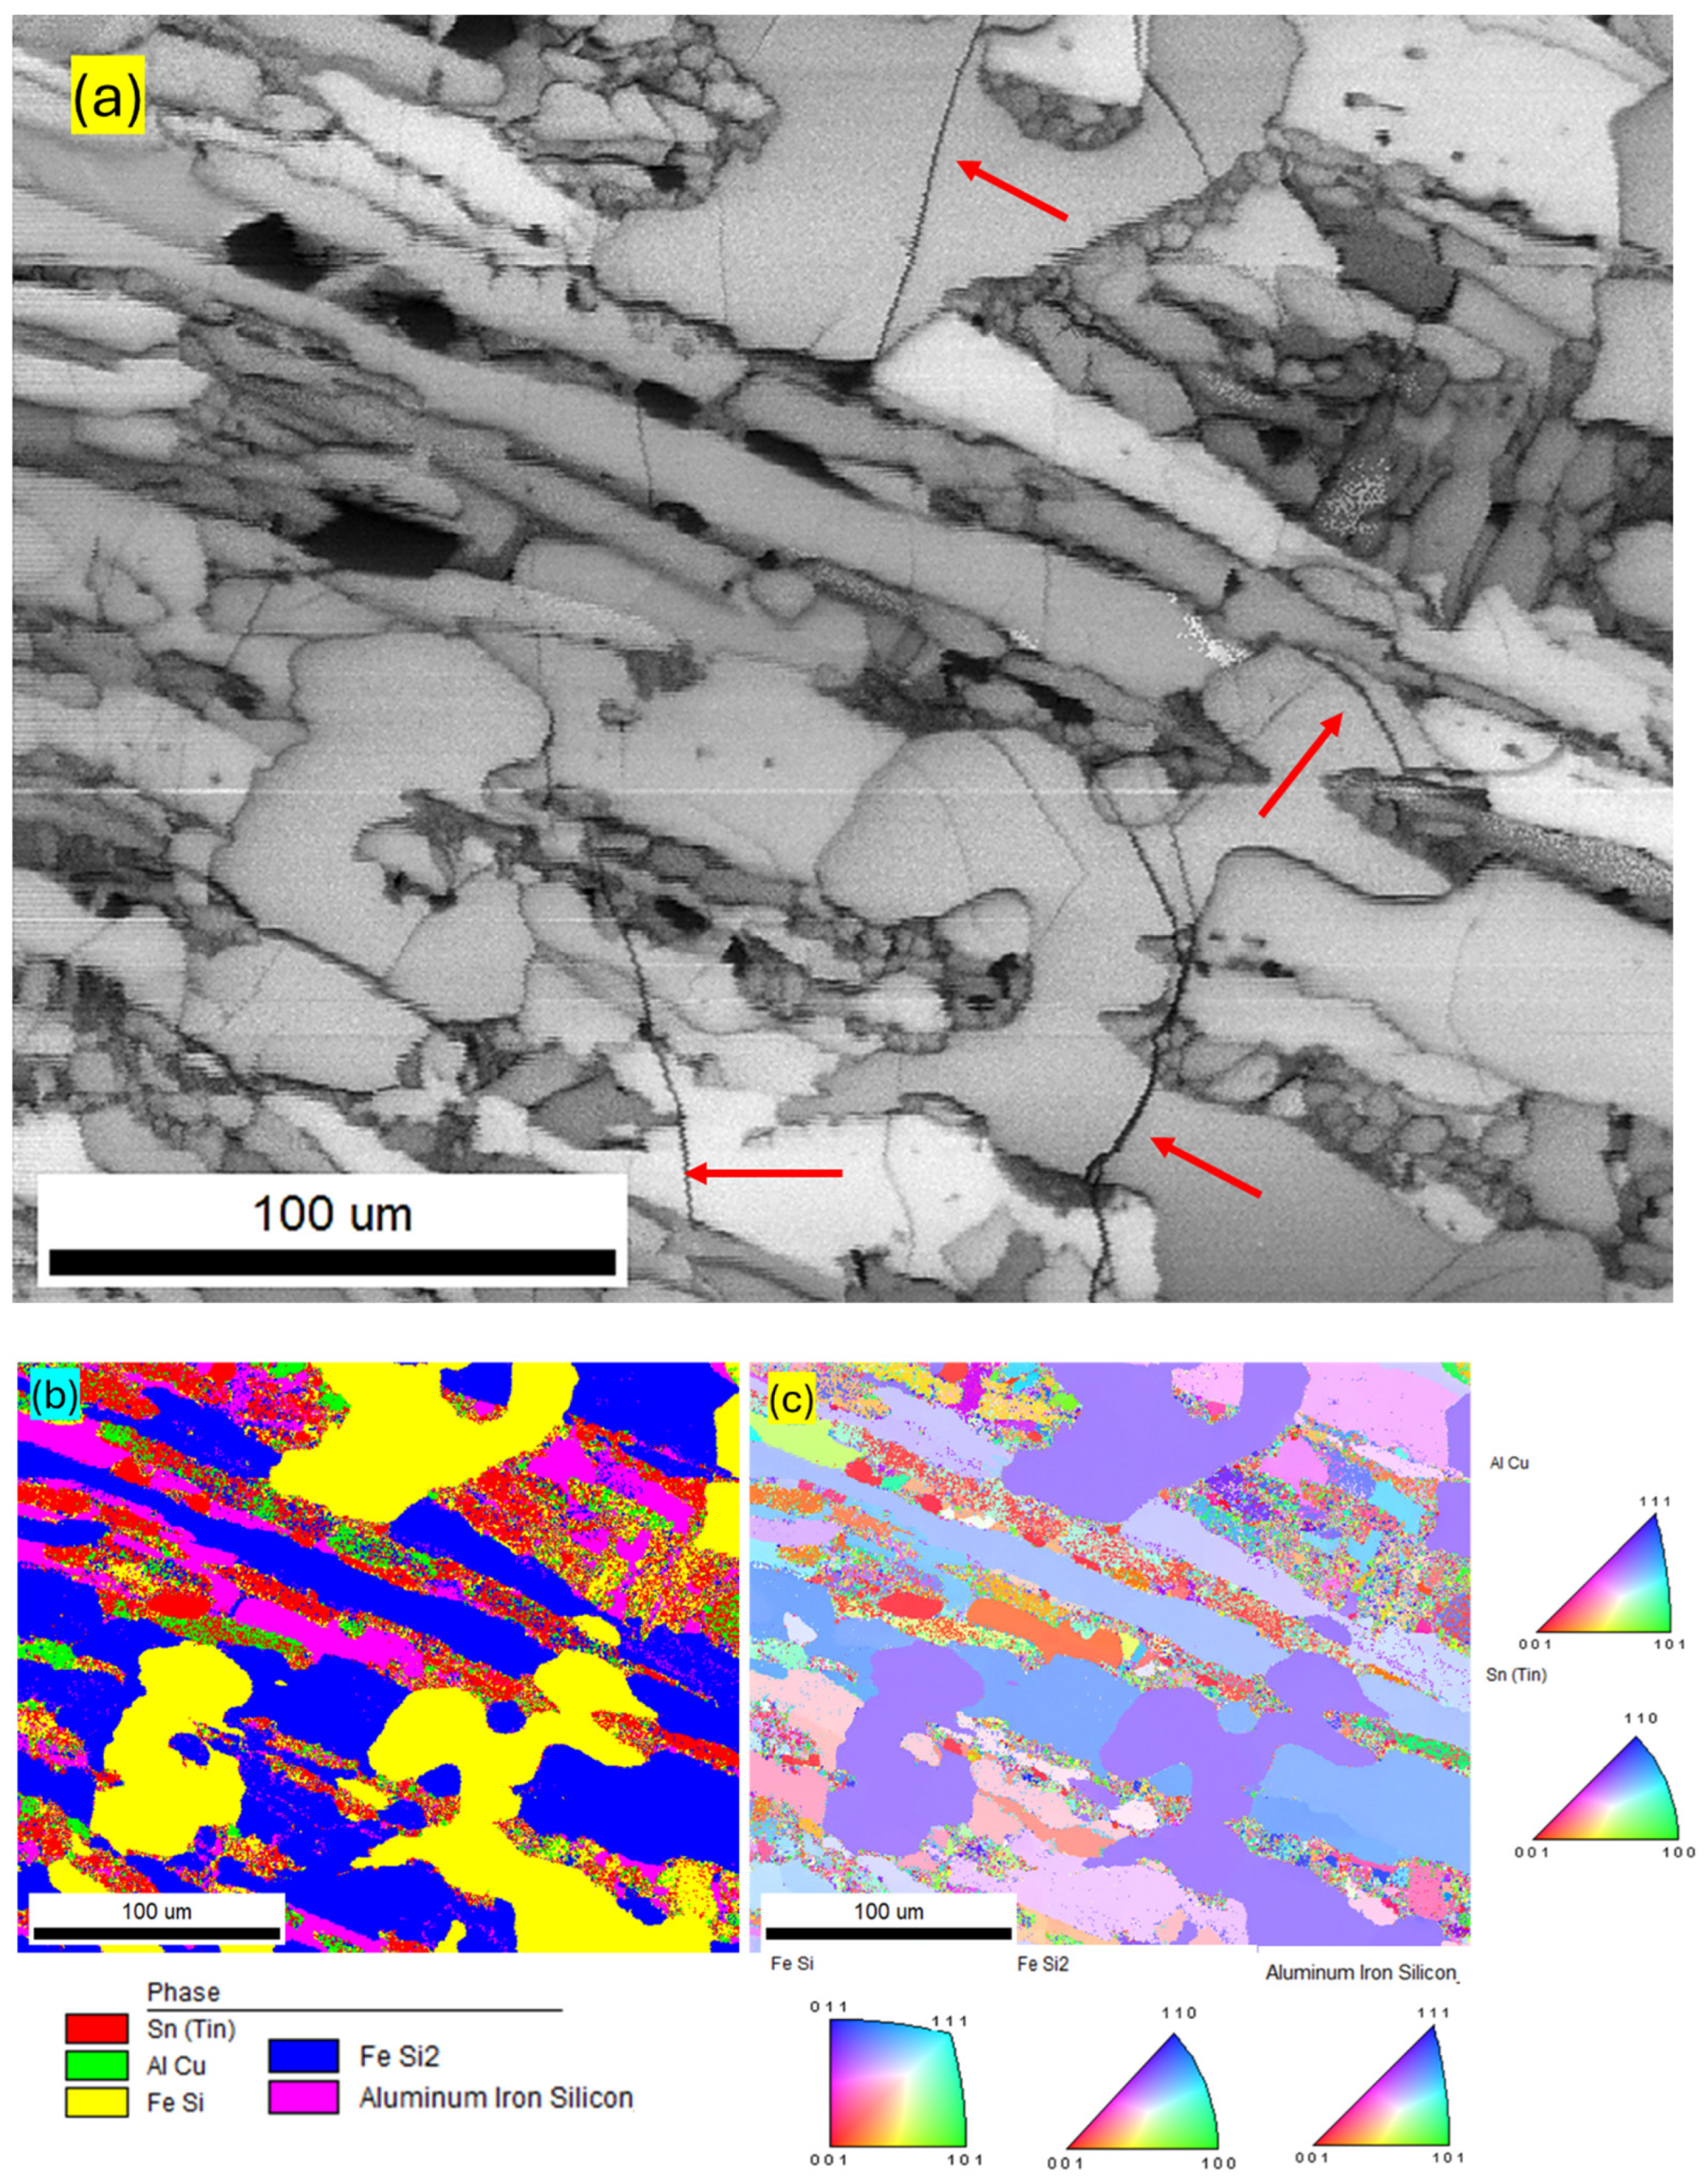
Figure 16 shows the EBSD image, the phase map, and the IPF map for a region toward the center of the sample annealed at 590 °C. Using EBSD, FeSi, FeSi2, AlFeSi, AlCu, and Sn phases were identified in most of the regions. In some regions, Fe3Al2Si3 and Cu3Sn (orthorhombic) were also identified by EBSD. The phase map shows FeSi2 covering most of the analyzed region, while small grains of FeSi are present along the larger grains. FeSi grains were slightly larger in some other regions analyzed, but the FeSi2 phase was always the most prominent phase. This agrees with the simulations in which FeSi2 is expected to contribute ~50% of the mass of the sample. In these samples as well, all FeSi grains exhibited similar crystal orientations, while the grains of FeSi2 were observed to be oriented in different directions. Grains of all other phases were also observed to be randomly oriented with no preferred growth direction. The Cu3Sn and Sn phases were always found around the grain boundaries of the AlFeSi phase and FeSi2 phase. This shows that grain growth occurred for FeSi2 and FeSi (not visible in this sample), followed by the AlFeSi phase; however, the other phases did not appear to grow, despite the longer annealing duration. Some small cracks were observed in these samples as well, mostly in the FeSi (Fe-rich) regions. Some of these cracks can be seen in Figure 16a (highlighted by red arrows in Figure 16a). The cracks appear to pass through the grains where Fe-Si-Al are present, while they terminate in the Si-rich regions. Since the gaps between the cracks are filled, they appear to have formed during the rapid cooling process from when the sample at a temperature of ~1450 °C was placed inside the resistance furnace maintained at a temperature of ~600 °C.

3.7. Analysis of Microstructure and Composition of Samples Annealed at 450 °C

The simulation of the cooling of the alloy shows that between 590 °C and 450 °C, the BCC solid solution disappears at ~530 °C, accompanied by the appearance of a new phase, Al9Cu11. The Sn from the BCC solid solution is expected to return to the liquid state in its entirety, and the entire mass of Sn is expected to remain liquid at this temperature, with extremely small amounts of Al and Cu, and nearly devoid of Fe and Si. The simulated state of the alloy at 450 °C is shown in Table 10. On comparing the data in Table 8 and Table 10, it can be seen that the amounts of FeSi, FeSi2, and FeSiAl2 are similar. The fraction of liquid in the alloy at this temperature increases primarily because all of the Sn is expected to be present in the liquid state.
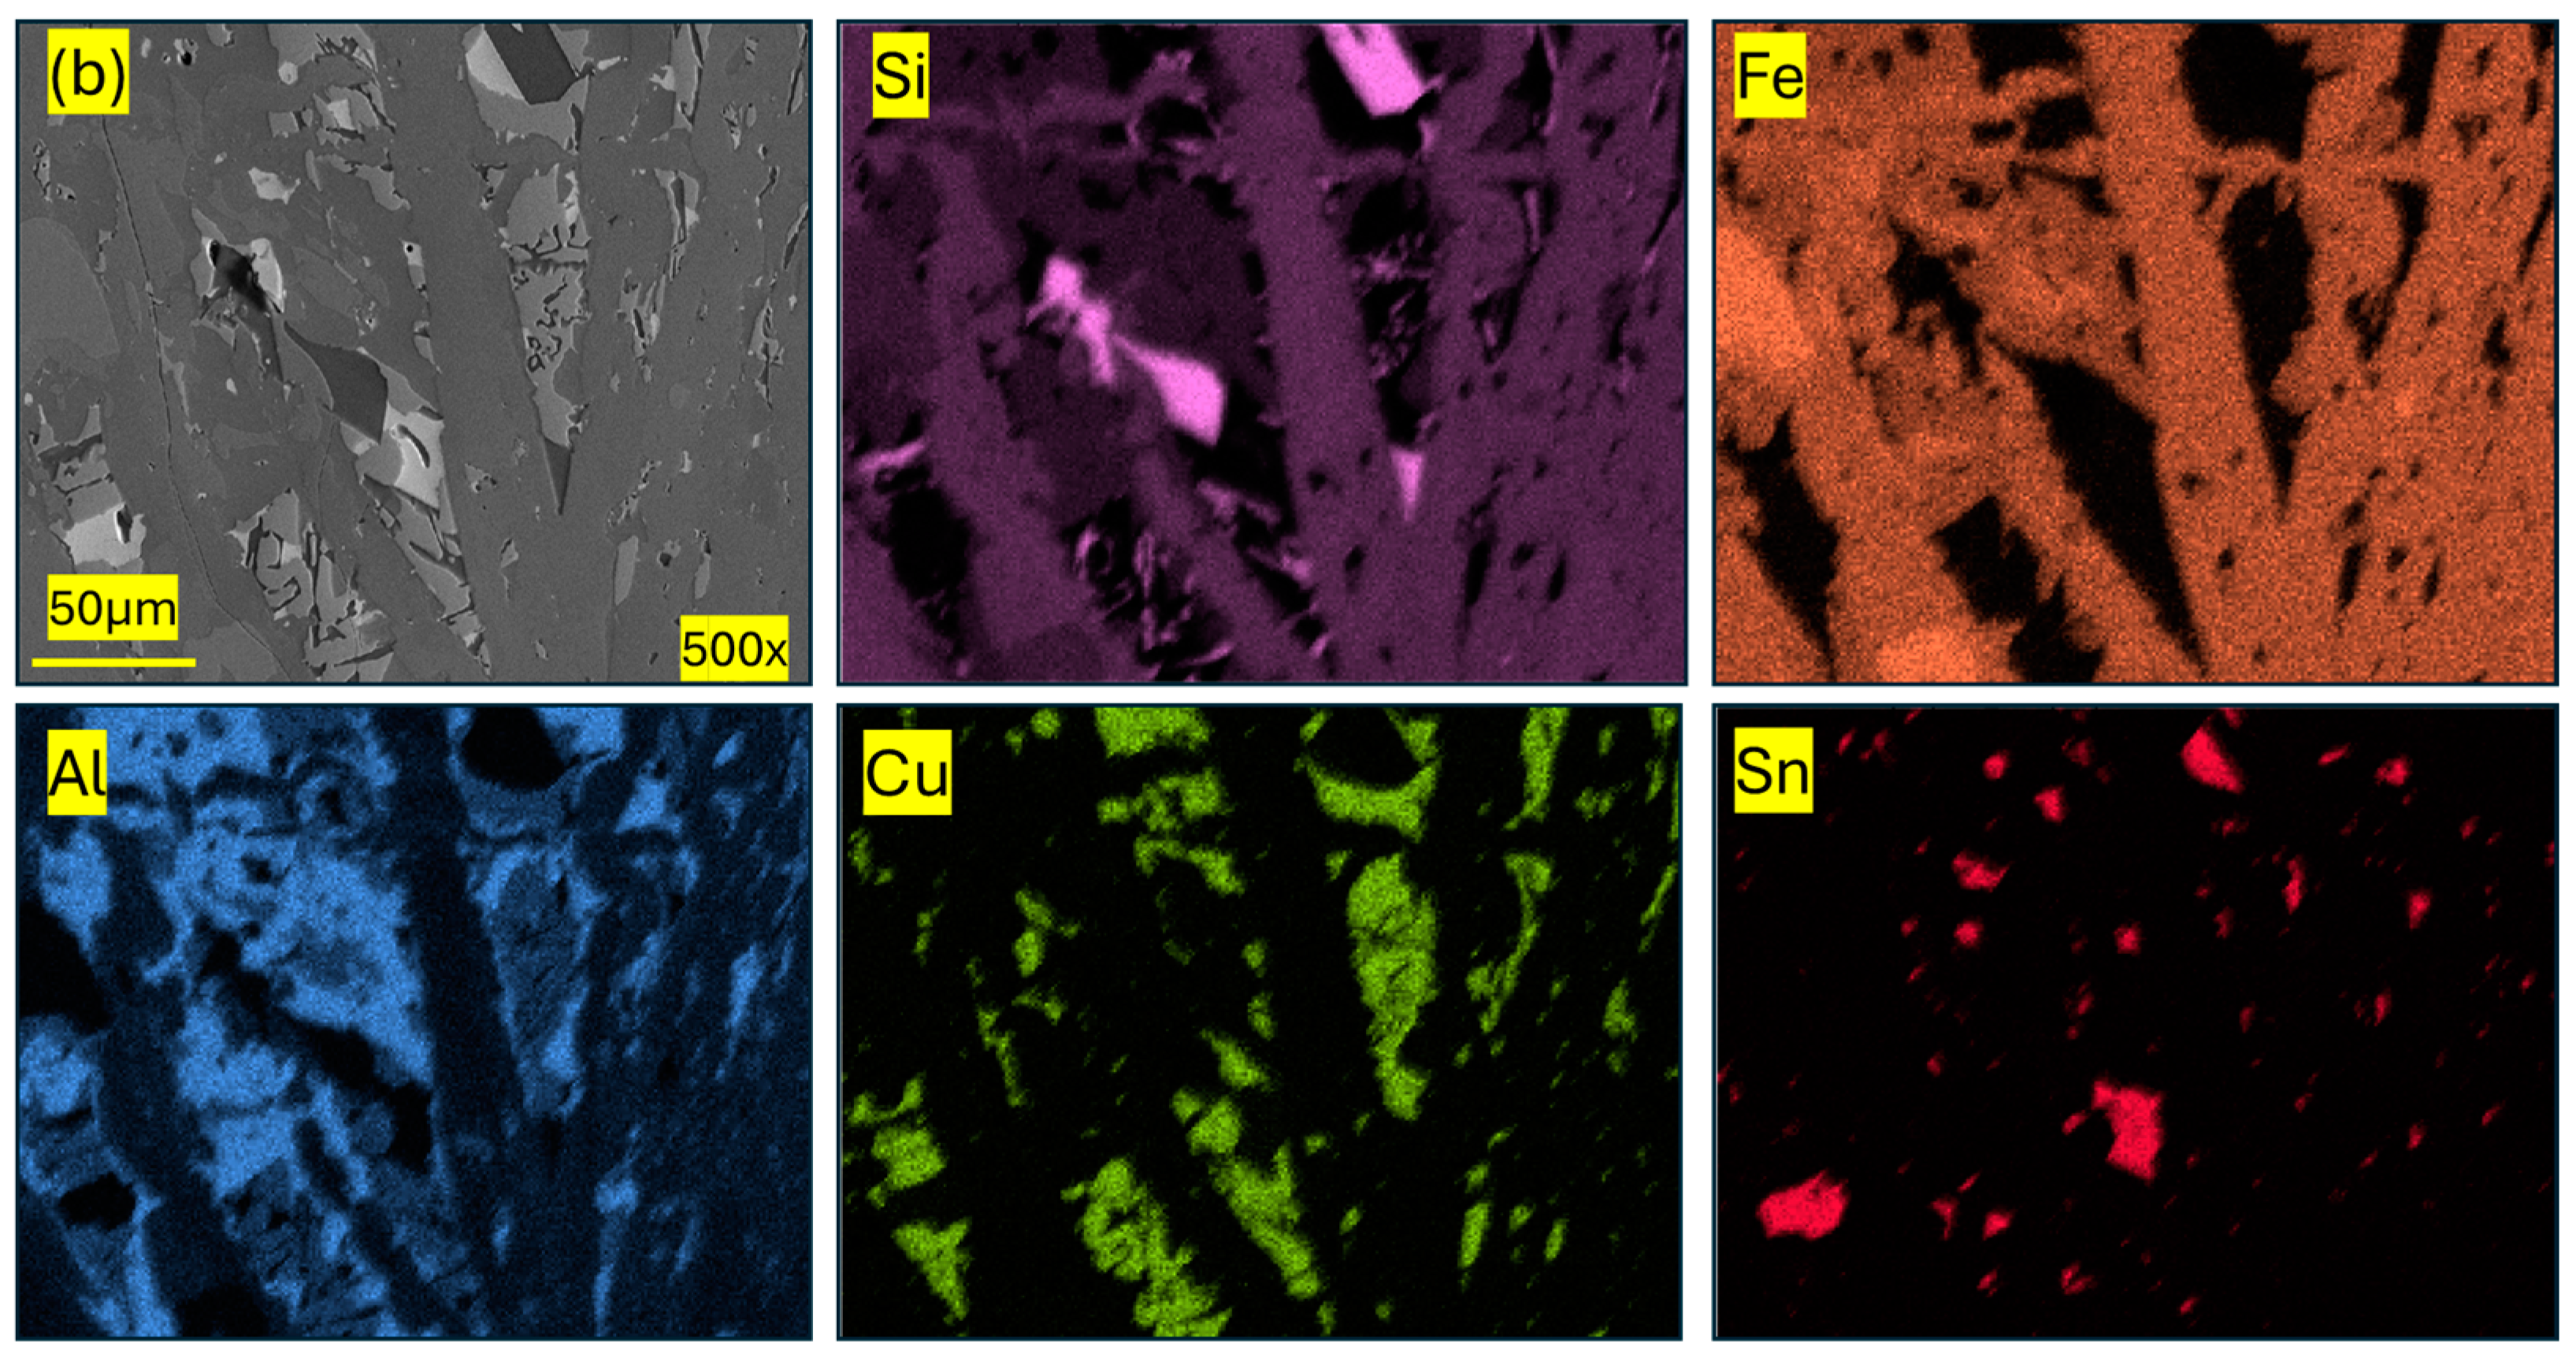
Figure 17a,b show the SEM images and the corresponding elemental distribution obtained using EDS for two different regions of the sample annealed at 450 °C. Figure 17a shows the region closer to the edge of the sample, while Figure 17b shows the region closer to the center of the sample. The microstructure appears quite uniform throughout the sample. The grains at the edge of the sample were found to be more elongated than the grains closer to the center of the sample. Fe-Si and Fe-Si-Al regions formed most of the matrix, with Si and Sn grains found throughout the sample.
Figure 18 shows the element overlay and phase overlay maps obtained using EDS, corresponding to the regions analyzed, as shown in Figure 17. Table 11 shows the pseudo-phases and their average compositions in terms of atomic percentage. For the sample annealed at 450 °C, four pseudo-phases were identified in almost all regions analyzed: Fe/Si, Fe/Si/Al, Al/Cu, and Sn. Since Fe/Si accounts for both FeSi and FeSi2, the pseudo-phases identified agree with the phases expected to be present in the sample based on the simulations shown in Table 10. In some regions, the EDS software identified two pseudo-phases containing Si, Fe, and Al depending on which element was identified to have a higher atomic percentage. However, the pseudo-phase Si/Fe/Al accounts for all the pseudo-phases identified comprising these three elements.
In Figure 18, it can be observed that the Si-rich grains were almost always surrounded by Al-Cu-rich regions and were not found in Fe-Si-rich regions as in the samples annealed at 1000 °C and 800 °C. This suggests that the Si-rich grains precipitated out of the Al-Cu-Si-Sn liquid as the alloy cooled down rapidly upon being placed inside the resistance furnace (~450 °C). Furthermore, Si grains were slightly larger toward the edge of the sample than at the center of the sample. This could be due to the slower diffusion of Si, especially at lower temperatures. During the solidification and cooling of the sample, the edge of the sample would have cooled faster, reaching lower temperatures more quickly. Hence, the Si precipitated in these regions would not have sufficient time to diffuse and combine with Al. However, toward the center of the sample, where the cooling would have been slower, the Si would have had more time to alloy with Al. For Sn grains, the opposite behavior was observed; they were smaller at the edge and larger at the center of the sample. This could be explained by the fact that the grain size of Sn depends on the time available for Sn to precipitate out of the solidifying solution. Since Sn forms a BCC phase with extremely small amounts of other elements, it is not consumed by reactions with other elements. Since the cooling would have been faster closer to the edge, the Sn precipitated as smaller grains closer to the edge. For this sample, it was also observed that the Sn pseudo-phase identified by EDS had a lower concentration of Cu than those identified in the samples annealed at higher temperatures. This could be due to the lower availability of Cu, as it combined with Al to form Al9Cu11.
Figure 19 shows the EBSD image, the phase map, and the IPF map for a region toward the center of the sample annealed at 450 °C. Since Al9Cu11 was not available in the phase library, AlCu was selected as the phase, and hence very small grains of AlCu phase were observed in the regions (Figure 19b). In these samples as well, the FeSi grains were observed to be non-elongated and had a preferred growth direction. The FeSi2 phase formed most of the matrix, and most grains were also similarly oriented. The majority of larger Sn grains also exhibited similar growth directions, as indicated by the closely related shades of the Sn grains in the IPF diagram shown in Figure 19c.
However, most of the Sn grains were still quite small and distributed close to the AlFeSi phase, while AlCu phase was observed along the grain boundaries. However, since two of the phases were not present in the EBSD phase library, significant conclusions could not be made from the EBSD analysis of the samples annealed at 450 °C.

3.8. Analysis of Microstructure and Composition of Samples Annealed at 200 °C

At 200 °C, the entire alloy exists in the solid phase. In the simulations, the Sn-rich liquid solidifies at ~230 °C into a BCC solid solution (confirmed using XRD), composed almost entirely of Sn (in the BCC phase instead of BCT, as predicted by the simulations). The other phases present at this temperature are FeSi, FeSi2, FeSiAl2, and Al9Cu11. Table 12 shows the phases present at 200 °C in the simulated alloy. The amount of different phases is expected to remain constant as the alloy cools down from 450 to 200 °C, except for the change in the phase of Sn from liquid to BCC solid.
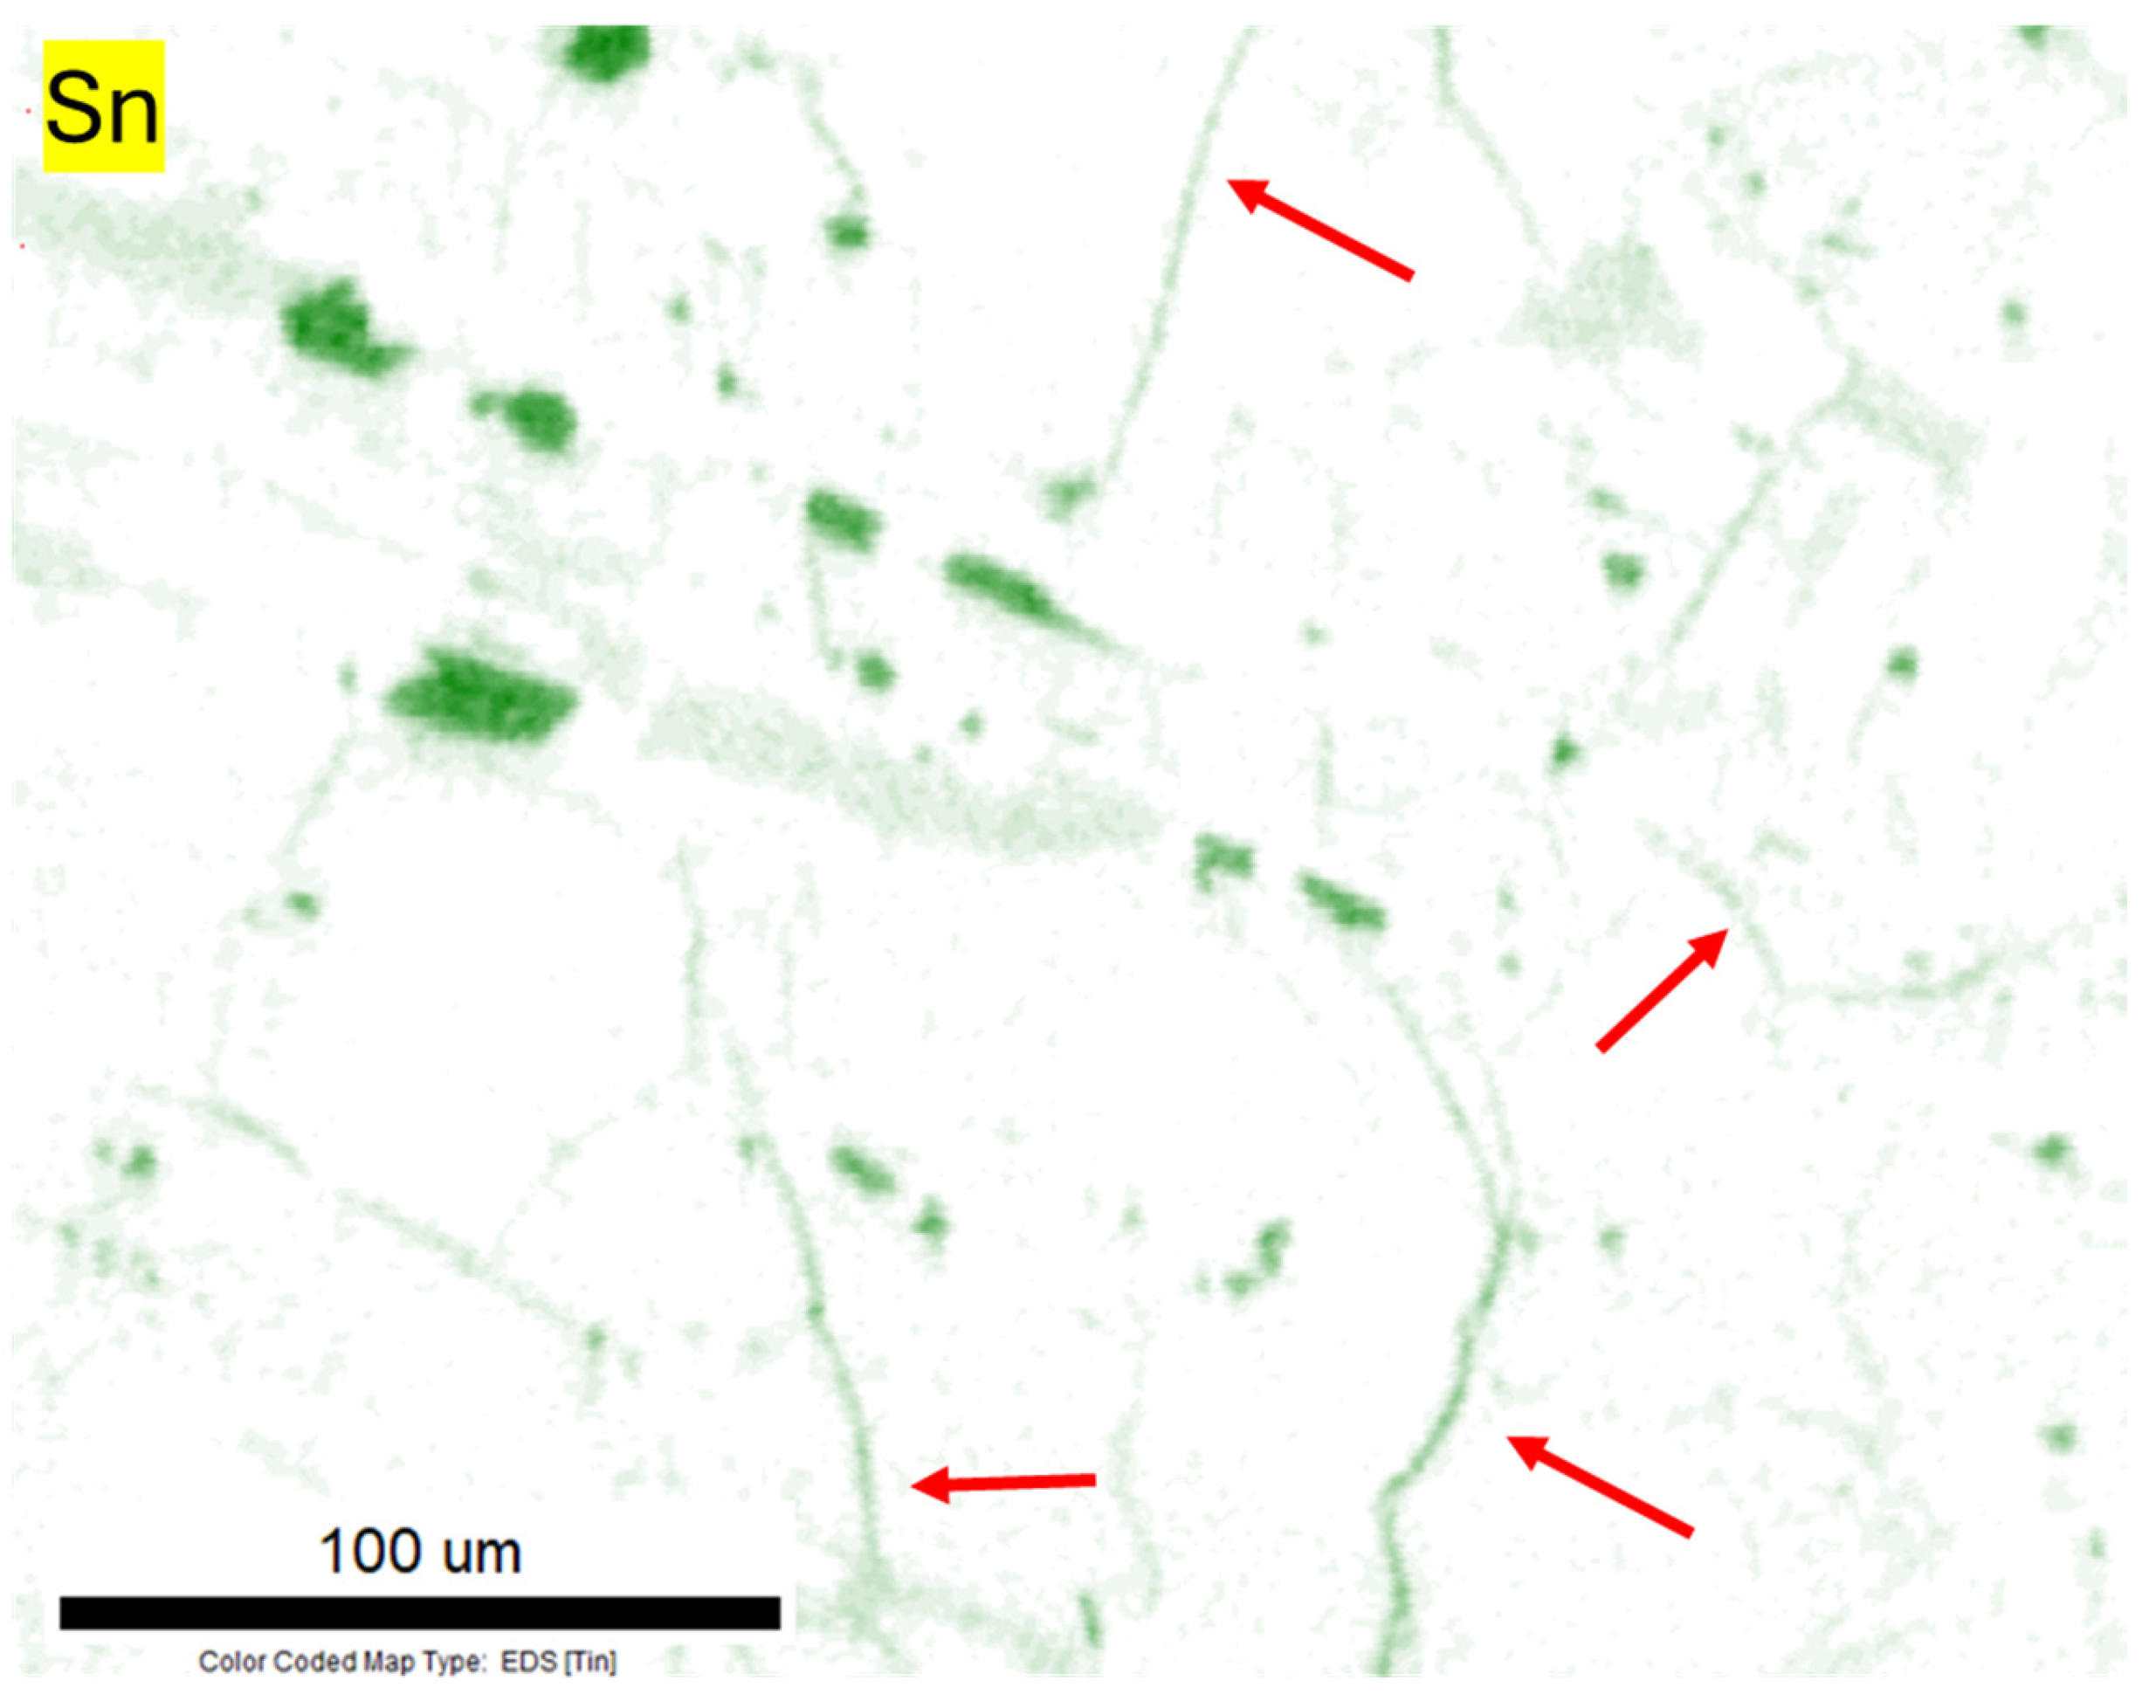
Figure 20 shows the SEM images and the corresponding elemental maps of two different areas of the sample annealed at 200 °C. Figure 20a shows the region closer to the edge of the sample, while Figure 20b presents the region closer to the center of the sample. Small areas rich in Si were found distributed throughout the microstructure, and they were similar in size. This could be due to the trapping of unreacted liquid Si caused by the rapid cooling of the alloy from ~1450 °C to the temperature of the resistance furnace (~200 °C). Despite the longer annealing duration, silicon diffusion at this temperature was perhaps not sufficient to combine with Al or Fe. The Si-Fe grains appear to be slender closer to the edge of the sample than at the center of the sample. However, throughout the microstructure, Fe-Si-Al-rich regions covered the majority of the sample. The AlCu grains were not observed to be as large as observed in the previous sample annealed at 450 °C. The Sn grains were observed to be larger toward the center of the sample than toward the edge. Additional thin veins of Sn were observed in the microstructure of these samples (highlighted by red arrows in Figure 20a,b), which were not observed in other samples. The Sn veins can be seen in the elemental maps (for Sn) in Figure 20a,b. These veins could be due to the formation of cracks during the rapid solidification and cooling when the alloy was removed from the induction furnace (at around 1400 °C) and placed inside the resistance furnace. Sn would have been in the liquid state for a longer duration than the surrounding phases and hence would have been able to flow into the cracks, forming the thin veins of Sn in the microstructure. For this sample as well, the Sn-rich regions toward the center were larger than those toward the edge. Figure 21 shows the elemental and phase overlay maps for regions (a) and (b), as shown in Figure 20. Table 13 shows the shows the pseudo-phases and their average compositions in terms of atomic percentage. It can be seen that the EDS could not identify the Fe/Si pseudo-phase in some regions, especially closer to the center of the sample. As we moved inward from the edge toward the areas closer to the center of the sample, the amount of Fe/Si pseudo-phase, as determined by EDS, decreased. However, this does not appear to actually be the case, as at this temperature, FeSi2 and FeSi together should contribute ~65% of the weight of the sample, according to the simulations. Furthermore, according to elemental maps in Figure 20b, regions are visible where Fe and Si dominate, while Al is relatively absent. The Sn and Al/Cu pseudo-phases are identified accurately in the EDS pseudo-phase maps.
Figure 22 shows the grains in the microstructure, the different phases identified, and the orientation of the grains as an IPF taken using EBSD for a region closer to the center of the sample. The cracks observed in these images (Figure 22a) (highlighted by red arrows) were also found to be filled with Sn (Figure A2, Appendix B, highlighted by red arrows). Hence, these cracks would have occurred during the cooling process, when Sn was still in the liquid state and able to flow into the cracks to fill them. The FeSi and FeSi2 phases were found as large grains. FeSiAl and Sn grains were also larger. Since the Al9Cu11 phase was not available in the library, the AlCu phase was selected, which was identified as small grains. All FeSi grains were found to have similar orientations. The FeSi2 grains preferred a similar growth direction; however, their orientations were more dissimilar than those observed for the FeSi grains. Most of the larger Sn and FeSiAl2 grains also had similar orientations; however, the smaller grains were randomly oriented, with no preferred direction for growth.

3.9. Analysis of Phases by XRD

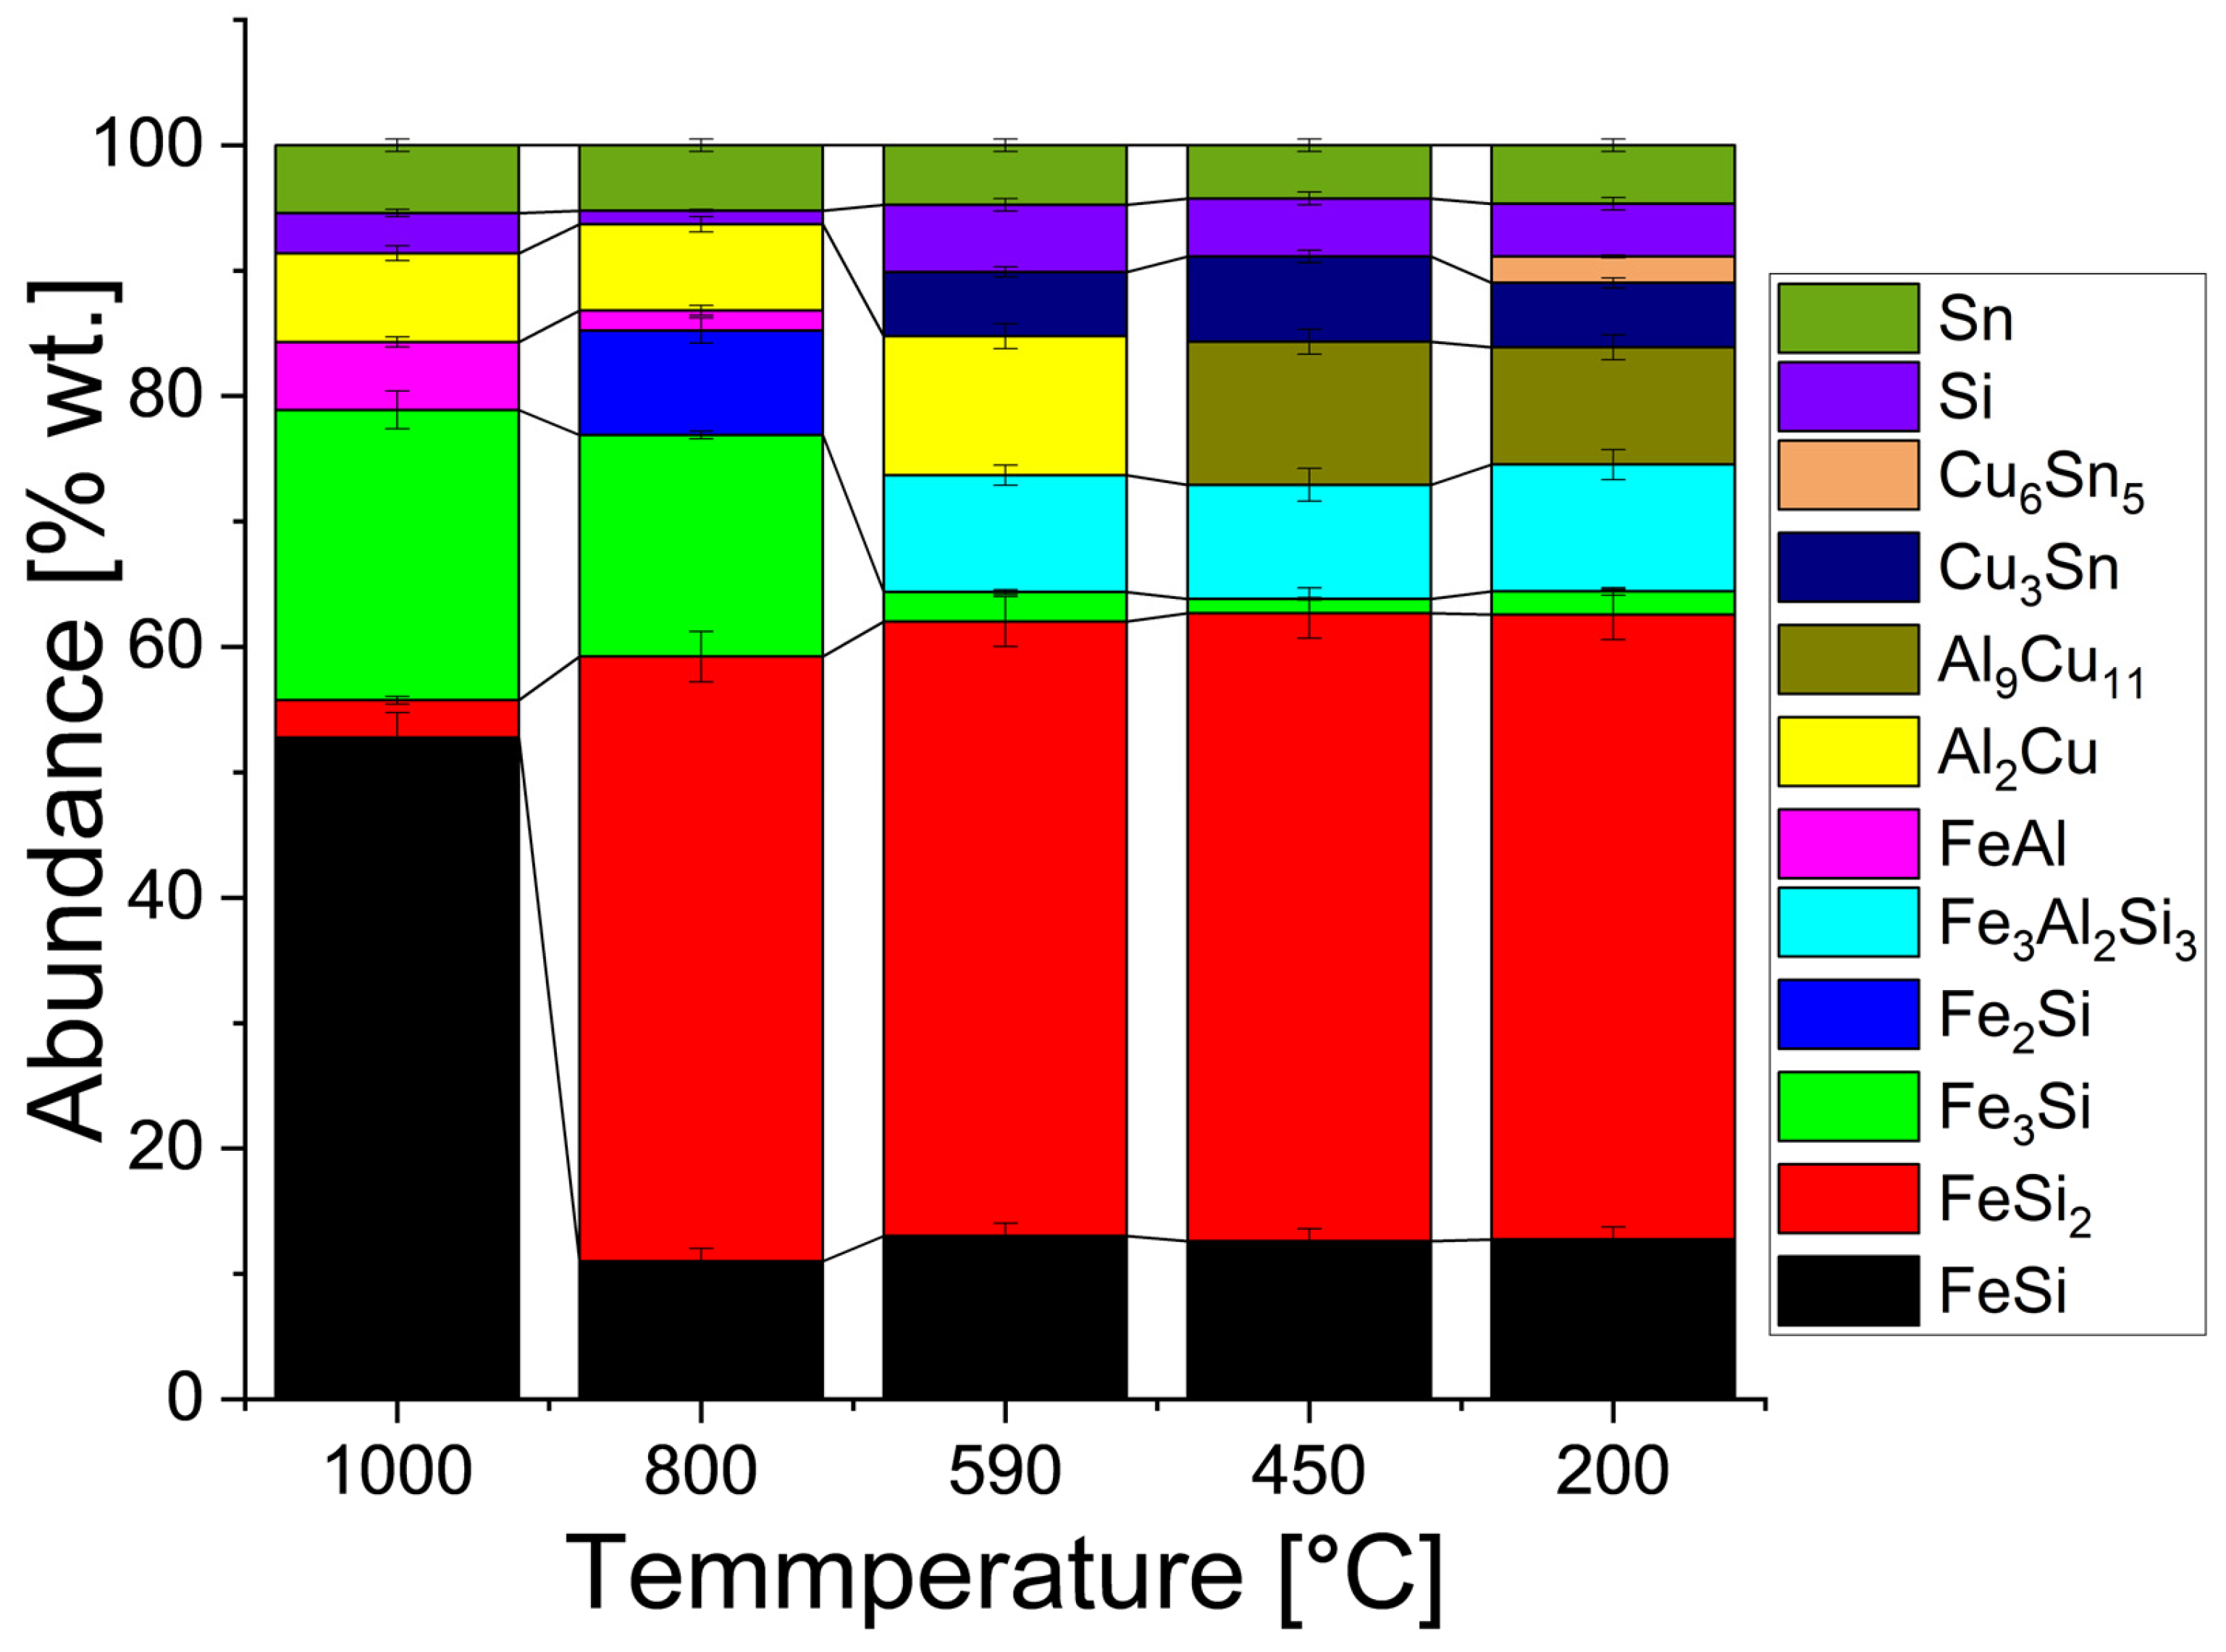
The final determination of the phases was carried out using XRD. To determine the phases using XRD, small pieces of the samples were crushed into powder using an iron mortar and pestle. The small pieces of the sample were obtained by cutting the large annealed sample using a circular saw and extracting three pieces from the center toward the edge. The samples were then analyzed using XRD to identify the phases present in the sample and their abundance in terms of % wt. Figure 23a,b show the XRD patterns obtained from the samples annealed at different temperatures, along with the phases identified. To improve readability, we split the phases identified into two sets: Figure 23a shows all the phases with Fe, and Figure 23b shows all the phases without Fe. Figure 24 shows the phases and their abundance in terms of wt.%. The same data are also presented in Table A1 and Table A2 in Appendix A, along with the error values for easier readability of the plot.
For the sample annealed at 1000 °C for 24 h, FeSi and Fe3Si were detected to contribute ~52.8 ± 2 and 23.1 ± 1.5% wt., respectively, to the alloy. Here, a deviation was observed from the theoretical simulation, as Fe3Si7 could not be identified accurately. Instead, we believe the formation of Fe3Si replaced the theoretical Fe3Si7 phase. A small portion of FeSi2 (3 ± 0.3% wt.) was also detected. Other phases detected were FeAl (5.4 ± 0.4% wt.), AlCu (7.1 ± 0.6% wt.), Si (3.2 ± 0.3% wt.), and Sn (5.4 ± 0.5% wt.). The AlCu and Sn phases were detected using EBSD (Figure 10), while pockets of Si-rich regions were observed in the elemental maps taken by EDS (Figure 8). The AlFeSi phase detected by EBSD was not detected using XRD in the three different test samples prepared from the sample annealed at 1000 °C. However, a FeAl phase contributing 5.4 ± 0.4% wt. to the sample was detected. The FeAl phase could have either formed during solidification from ~1450 °C to ~1050 °C or during cooling, above the melting point of Al [85,86,87]. The phases detected by XRD mostly agree with the simulations, the EDS measurements, and the phases detected by EBSD. It was observed that the amounts detected varied slightly from the simulations. This could either be due to insufficient annealing duration or local variation in the phase’s composition due to phase segregation. Furthermore, it can now be established that the liquid solution, upon cooling, forms two different phases—an AlCu phase and a Sn (BCC) phase. It can also be surmised that the separation and solidification of AlCu and Sn phases occur quickly, as the sample was cooled from a temperature of 1000 °C to less than 10 °C within a few minutes.
In the sample annealed at 800 °C for 36 h, FeSi2 was detected as the primary phase, accounting for 48.2% wt. of the sample. This is close to the simulated FeSi2 content of 50.8% wt. at this temperature. FeSi was found to contribute ~11% wt. of the sample, while Fe2Si was measured to contribute ~8.4% wt. The Fe2SiAl2 phase was not observed to have formed in the sample. The amount of Fe2SiAl2, as predicted by the simulations, is expected to be ~9%, and the amount of Fe2Si detected in the three measurements of this sample was quite close to the simulated value. Hence, the Fe2Si phase is considered to have formed instead of the Fe2SiAl2 phase suggested in the simulations. Other phases detected by XRD in this sample were Fe3Si, FeAl, Al2Cu, Si, and Sn. While Fe3Si is detected in this sample, its amount was reduced to 17.6 ± 0.3%. Theoretically, the Fe3Si phase is considered to be an energetically stable phase [88,89,90]. The reduction of Fe3Si could mean that the formation of Fe3Si is favored at higher temperatures (>900 °C). The amount of FeAl was reduced to ~1.6%, while that of Si was reduced to ~1%. The reduction in the amount of Si phase agrees with the EDS maps of the sample annealed at 800 °C, which show tiny specks of Si in the microstructure. In fact, the Si-rich regions in the EDS maps of the sample annealed at 800 °C are observed to be the smallest among all the samples. This could mean that annealing at 800 °C promotes the alloying of Si with Fe and probably Al. The amounts of Al2Cu and Sn remained almost unchanged from their respective quantities in the sample annealed at 1000 °C.
In the sample annealed at 590 °C for 48 h, the fraction of FeSi (~13% wt.) and FeSi2 (~49% wt.) detected agreed closely with their corresponding fractions predicted by the simulation (Table 8). The fraction of the Fe3Si phase decreased to ~2.5% wt. In this sample, a new phase, Fe3Al2Si3, was detected, which is a ternary, intermetallic phase [30,31,91,92]. The fraction of Fe3Al2Si3 was estimated to be ~9.5 ± 0.8% wt. The simulations predict the formation of a BCC solid solution with Sn, Cu, and Al as major components. However, using XRD, Al2Cu (~11% wt.) and Cu3Sn (~5% wt.) phases were detected. The Cu3Sn phase was also detected by EBSD. Hence, it can be surmised that, instead of the predicted Sn-Cu-Al-BCC solution, Al2Cu (tetragonal) and Cu3Sn (orthorhombic) phases were formed. The Si and Sn phases were also detected in these samples. The fraction of the Sn phase was observed to be slightly less (~4.5%) than that in the sample annealed at 1000 °C and 800 °C (~5.5%). This is expected, as some of the Sn would have been incorporated into the Cu3Sn phase. The percentage of the Si phase increased to ~5.3% wt. This appears consistent with the observations of the EDS maps of the sample, where comparatively larger portions of Si-rich areas could be observed (Figure 14 and Figure 15). This could be due to the rapid cooling of the sample when it was transferred from the induction furnace inside the resistance furnace. The Si-rich portions probably solidified when they were placed in the furnace at 590 °C, and no further reaction with Fe or Al occurred at this temperature.
The sample annealed at 450 °C for 60 h was marked by the detection of the Al9Cu11 phase by XRD, which was predicted in the simulations (Table 10). The fraction of Al9Cu11 was detected to be 11.4% using XRD, which agrees closely with the ~12.5% wt. predicted in the simulations. Since the Al2Cu phase was not detected, we believe the majority of the Al2Cu phase formed during the cooling of the alloy may have undergone a reaction to result in the Al9Cu11 phase. It is also possible that the Al2Cu phase could have been present in extremely small amounts, escaping detection using XRD. Nevertheless, the confirmation of the Al9Cu11 phase and the close agreement of its fraction with the simulated results confirm the formation of Al9Cu11 in the alloy. The FeSi2, FeSi, and Fe3Al2Si3 phases were also detected, and their proportions were 50.1%, 12.6%, and 9.1% wt., respectively. The fractions of FeSi2 and FeSi estimated using XRD agree closely with the simulated fractions of 51.2% and 13.4%, respectively (Table 10). Cu3Sn, Si, and Sn were other phases detected by XRD in the sample. Since Cu3Sn was also observed in the sample annealed at 590 °C, but not in the samples annealed at higher temperatures, it can be surmised that Cu3Sn forms in the alloy as it cools down to temperatures below 800 °C in the furnace but does not form (in sufficient quantity) during rapid quenching of the sample in water after annealing. In this sample, the increase in the fraction of Cu3Sn was accompanied by a decrease in the fraction of Sn, which suggests a reaction between solid Cu and liquid Sn at this temperature to form Cu3Sn. The detection of the Si phase in the sample agrees with the EDS maps of the sample shown in Figure 17 and Figure 18.
For the sample annealed at 200 °C for 72 h, a small proportion of a new phase, Cu6Sn5 (2.1 ± 0.1% wt.), was detected, which was accompanied by a small decrease in the proportion of the Cu3Sn phase. The Cu6Sn5 phase is expected to form at temperatures above 200 °C [93,94,95]. However, this phase was not predicted in the simulation. It could not be determined whether Cu6Sn5 grains crystallized from the liquid or appeared due to the solid-state transformation of the Cu3Sn phase. The proportions of FeSi, FeSi2, Fe3Si, Fe3Al2Si3, Sn, and Si remained similar to those observed in the sample annealed at 450 °C. Overall, the proportion of the phases determined by XRD in the sample agrees closely with the proportions predicted in the simulations.

3.10. Characterization of the Hardness of Samples Annealed at Different Temperatures

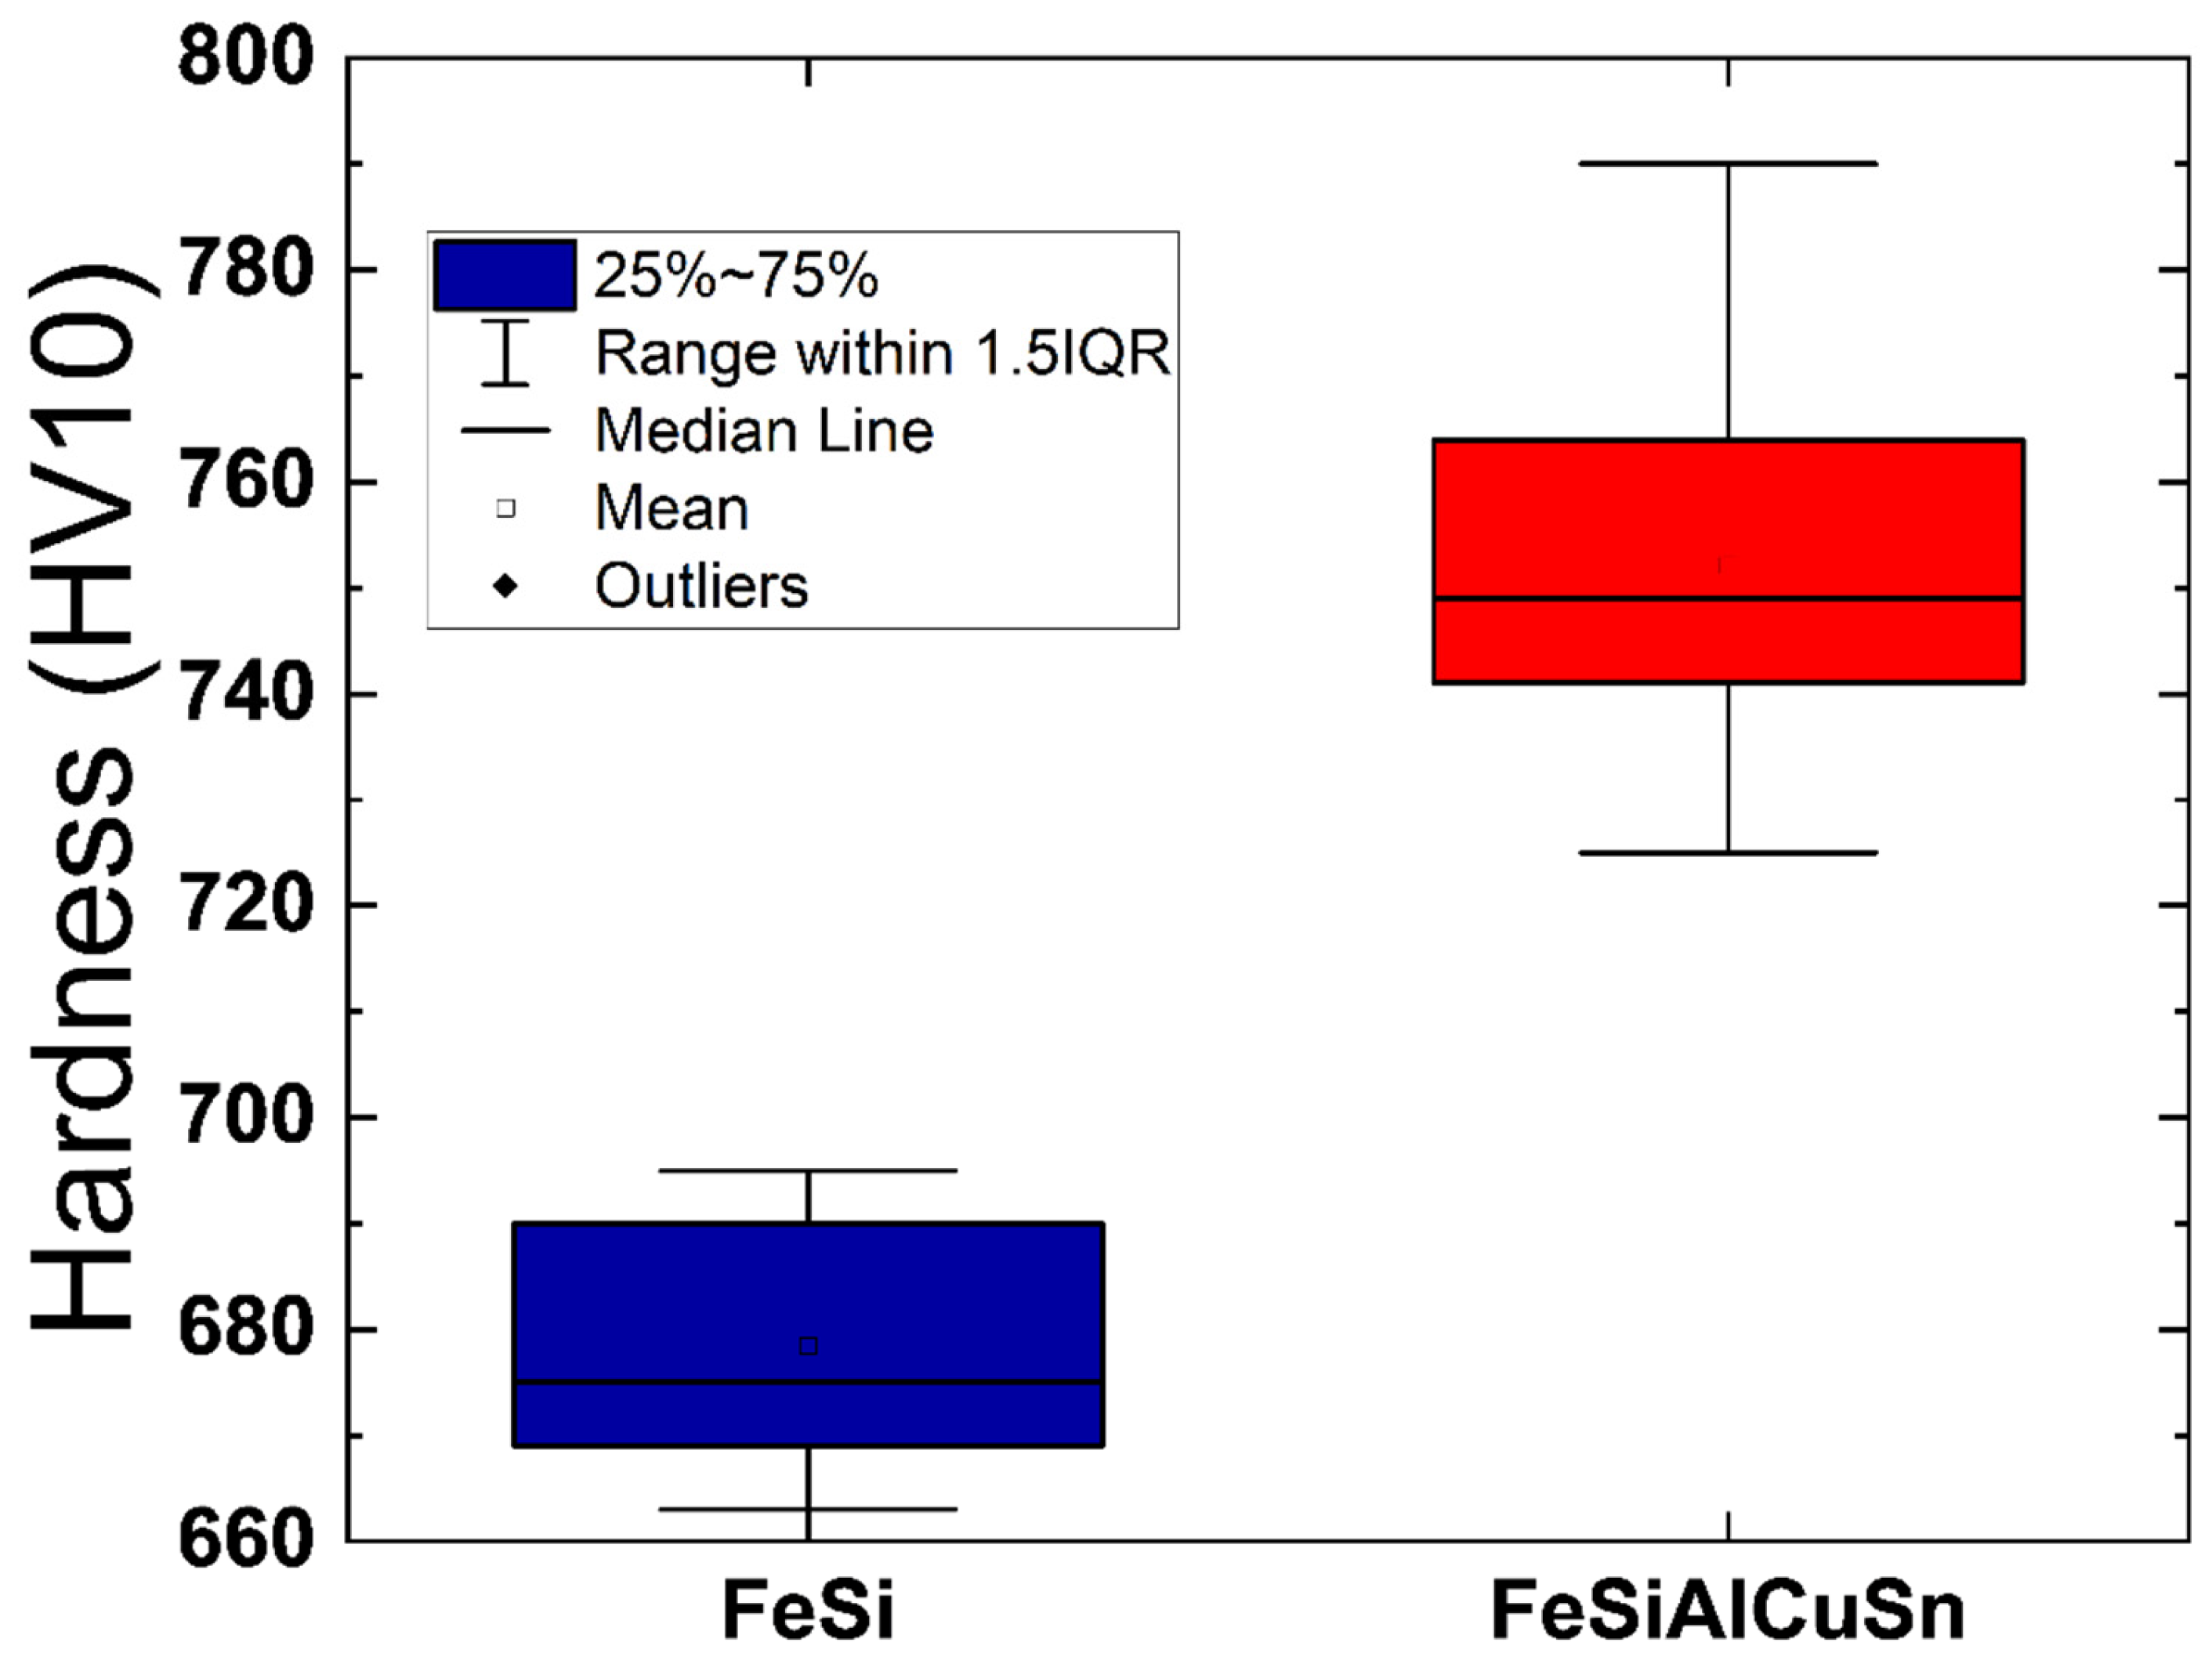
The hardness of FeSi alloys is an important characteristic, as it determines the ease with which the FeSi alloy can be crushed for further use. Appropriate hardness is needed to prevent excessive material loss during transportation and crushing. The hardness of the samples was measured using the Vickers scale for the samples annealed at different temperatures. Figure 25 shows the hardness of the multicomponent FeSiAlCuSn samples annealed at different temperatures in the form of a box plot. It was observed that the hardness of the samples decreased as they were annealed at lower temperatures. The hardness of the sample annealed at 1000 °C was found to reach ~800 (HV10), while that of the sample annealed at 200 °C was ~500 (HV10). This could be related to phases and their relative proportions in a given alloy, as well as the cooling process. At lower temperatures, we see slightly more abundance of softer phases of Al, Cu, and Sn. Additionally, the samples annealed at lower temperatures would have a lower amount of thermal stress when quenched. Since the fractions of FeSi and FeSi2 in the samples annealed below 1000 °C are similar (Figure 24), the measured hardness could be largely attributed to residual stress. Figure 26 shows the hardness of the multicomponent sample and the reference sample cooled under ambient conditions. The hardness of the reference sample annealed at 1000 °C and quenched afterward was found to be much lower (~690 HV10) than the multicomponent sample annealed at 1000 °C. The exact reason for this increase in hardness is not known. In high-entropy alloys, such an increase in hardness is attributed to various effects, such as the lattice distortion effect [56,96,97]. It is possible that the FeSi or FeSi2 phases may incorporate some Al, Cu, or Sn as additional alloying elements, which could cause the increased hardness of these prominent phases. Furthermore, the presence of small grains in the multicomponent sample could also impact the hardness of the sample. Since these samples were cooled under similar conditions, any differences in the microstructure could be attributed to the alloying elements, the resulting phases present in the sample, and any effects thereof. Further research is needed to understand the different phenomena that could contribute to the difference in the mechanical properties of such multicomponent alloys, which are not exactly high-entropy alloys.

4. Discussion

A multicomponent FeSiAlCuSn alloy was simulated using FactSage to understand the different phases and the transition temperatures. Multicomponent FeSiAlCuSn alloys were prepared and annealed at different temperatures depending on the simulation carried out using FactSage. The samples were analyzed using SEM, EDS, EBSD, and XRD. Phase identification using EBSD is not new and has been attempted previously [98,99]. However, phase identification using only EDS is relatively new and has recently caught the attention of researchers [63]. In this work, three different techniques were used to identify the phases: EDS phase determination software developed jointly with the software package supplier, EBSD coupled with EDS (standard commercial product), and XRD. Using only EDS, the determination of phases is not straightforward. EDS can be used to identify the major elements present in the phases, determined by a threshold limit. In this work, the threshold limit for an element to be identified as a major component of the phase was set at 10% atomic or weight. It may be possible to identify the phases using the atomic composition of the elements in a given phase. For example, in the FeSi phase, the composition of Fe and Si in terms of the atomic percentage would be similar, while in FeSi2, the atomic percentage of Si would be nearly twice that of Fe. While this process appears plausible in theory, the measurements often deviated from the stoichiometric ratios. Furthermore, phase identification could have been hampered by the presence of several other elements in smaller quantities. This shows the difficulty in the characterization and estimation of the intermetallic phases present in a multicomponent alloy using the simple EDS method. Phase identification using only EDS provides general information regarding the phases but does not provide the stoichiometric composition of the phases [100,101].
It was observed that phases could be identified with better accuracy using EBSD combined with EDS [102]. EBSD combined with EDS compares obtained data with that available in its library of phases to find a match for the phase. The phases obtained using EBSD mostly agreed with the simulated phases and the phases identified using XRD. Through this work, we further showed the successful identification of phases using EBSD coupled with EDS. The phase identification using EBSD was limited due to the limited number of phases in the reference directory of the software. The accuracy of the phase identified using this process is largely dependent on the quality of data present in its in-built library. Unlike XRD, this library is not standardized; hence, the phase identification using EBSD–EDS cannot be taken as definitive proof. Nevertheless, in this work, we added evidence to the examples available in the published literature that the EBSD can identify phases with good accuracy. With further expansion of the data library, this identification of phases can be improved. However, the standardization of the phase library using EBSD is crucial to its universal acceptance.
The simulation of the cooling of the multicomponent alloy was performed using FactSage 8.3 to predict the different phases and intermetallic phases expected under the isothermal cooling conditions. The state of the alloy was estimated at the prevailing temperatures from the simulation. For the alloys annealed at temperatures higher than 200 °C, the simulated alloys always comprise some liquid metal. The Al-Cu-Sn-rich liquid at these temperatures in the simulated alloy solidifies into an Al-Cu-based phase and Sn-based phase upon rapid quenching. Some phases predicted in the simulations could not be detected either by EBSD or XRD. Some of the phases, such as FeAl, AlCu, and FeSiAl, detected using EBSD and XRD but absent in the simulated phases (due to the state of the phase or the alloy at that temperature) could be attributed to the cocktail effect, which is observed in high-entropy alloys [56]. Overall, with the help of XRD, EBSD, EDS, and the simulations, several inferences can be drawn. It can be inferred that FeSi and FeSi2 form quickly upon solidification, as their fractions remain nearly constant for all samples annealed below 1000 °C. The rates of cooling inside the annealing furnace would be different for different temperatures; however, FeSi and FeSi2 remain similar for all samples. A summary of the phases identified using different methods is shown in Table 14. It can be seen that the phases simulated and the phases observed do not exactly agree. The difference between them increases as the annealing temperature decreases. The closest agreement was observed for the sample annealed at 1000 °C. In this case, FeSi and FeSi2 were detected by all three methods. The atomic ratio of Fe and Si obtained using only EDS closely corresponded to 1:1 and 1:2, which could be tied to the presence of the FeSi and FeSi2 phases. These phases were also identified using EBSD + EDS and XRD. The simulation predicts some portion of the alloy as a liquid at 1000 °C; however, it was obvious that upon quenching, the alloy solidifies completely. Hence, if the intermetallic compounds formed below 900 °C and low-temperature melting phases are excluded, the alloy annealed at 1000 °C exhibits the closest agreement between the three methods used to analyze the phases.
The hardness of the multicomponent FeSiAlCuSn samples annealed at different temperatures was also evaluated. The multicomponent alloy annealed at 1000 °C exhibited higher strength than the standard alloy that was annealed and quenched together. This suggests the presence of some characteristics of the HEAs. The cooling behavior of the FeSi alloys has been linked to their hardness and ease of disintegration [103]. It was interesting to observe that, despite having the same chemical composition, annealing at different temperatures could greatly influence the hardness of the alloy. The decrease in the hardness of the alloy annealed at a lower temperature could be attributed to the presence of larger grains of the softer phases. Other factors, such as the retained stress and overall grain size, could also impact the hardness. However, the difference in grain size could not be evaluated for the samples characterized in this study. It was noted in the EBSD images that the alloys annealed at lower temperature exhibited the presence of longer band-like grains, which were absent or less prominent in the alloys annealed at higher temperatures. However, the detailed analysis of different mechanical properties and determining the corresponding application of such a multicomponent alloy is beyond the scope of this work and left for future studies. Furthermore, the hardness of the formed intermetallic phases could be evaluated to understand the impact of the phases on the overall hardness of the sample. Such multicomponent FeSi alloys could be used as a source of microalloying elements. While this work considers a particular alloy with a fixed composition, the phases formed in ferrosilicon for different fractions of impurities could be different. However, this information could be used to develop special alloys using recycled ferrosilicon and scrap metals. The results presented in this work could also help researchers understand the advantages and limitations of the different methods in identifying the phases in an alloy.

5. Conclusions

In this work, we processed a novel multicomponent FeSiAlCuSn alloy and attempted to understand the formation of the different phases and the intermetallic compounds formed at different temperatures during the cooling of the alloy. We also tried to compare three different methods of phase identification. To the best of our knowledge, this is the first instance of processing such a multicomponent alloy with the composition presented in this work. Hence, the cooling of the alloy was first simulated using FactSage to predict the phases and intermetallic compounds formed during the solidification and cooling of the alloy. The alloys were prepared with the same composition as the simulated alloys and were annealed at different temperatures to allow for the phases predicted in the specific temperature zones to grow. After annealing, the alloys were quenched in ice-cold water to prevent any further phase transitions and to preserve the phases found at that temperature. The phases were analyzed using three different methods—only EDS, EBSD combined with EDS, and XRD. It was observed that using EDS, general information about the phases could be obtained, including the elements in the phases and the atomic composition of the phase. In some cases (e.g., FeSi or FeSi2), it was possible to determine the phase by calculating the atomic ratio of the constituent elements. Using EDS along with EBSD resulted in more accurate phase identification, as the measurements could be compared to an internal database to identify the phases. Finally, XRD was used to identify the phases and the intermetallic compounds. While most of the phases predicted by simulations could be identified using XRD and EBSD + EDS, some additional phases were also found that were not predicted in the simulation. These phases could have appeared during the rapid solidification of any liquid metal inside the alloy. Furthermore, differences in the predicted and identified phases could be attributed to the non-equilibrium cooling from the melting point of the alloy to the specific annealing temperature. The hardness of the samples was evaluated using the Vickers scale, and it was found that the hardness decreased with decreasing annealing temperature, despite all the alloys having the same chemical composition. This was attributed to differences in the phases, grain size, and residual stress in the samples. Future studies can focus on the characterization of the mechanical properties of such alloys and their applications in casting and surface coating applications.

Author Contributions

Conceptualization, P.P. and M.K. (Mirosław Karbowniczek); Data curation, P.P. and Ł.G.; Formal analysis, P.P.; Funding acquisition, P.P.; Investigation, P.P., F.K., M.K. (Mateusz Kopyściański) and Ł.G.; Methodology, P.P., F.K. and M.K. (Mateusz Kopyściański); Project administration, P.P.; Resources, P.P., Ł.G. and P.M.; Software, P.P. and P.M.; Supervision, P.P.; Validation, P.P. and M.K. (Mirosław Karbowniczek); Visualization, P.P., F.K. and Ł.G.; Writing—original draft, P.P.; Writing—review and editing, P.M. and M.K. (Mirosław Karbowniczek). All authors have read and agreed to the published version of the manuscript.

Funding

This research is part of the project No. 2022/45/P/ST5/02712, co-funded by the National Science Centre, Poland and the European Union Framework Programme for Research and Innovation Horizon 2020 under the Marie Skłodowska-Curie grant agreement No. 945339. For the purpose of Open Access, the author has applied a CC-BY public copyright license to any Author Accepted Manuscript (AAM) version arising from this submission.

Data Availability Statement

Any additional data required will be made available upon request.

Conflicts of Interest

The authors declare no conflicts of interest.

Appendix A

Table A1. Different phases (containing Fe) identified using XRD and their abundance, along with the errors (in parentheses) in the samples annealed at different temperatures.
Phases [Error]FeSiFeSi2Fe3SiFe2SiFeAlFe3Al2Si3
Annealing Temperature [°C]
100052.77 (±2)2.9 (±0.3)23.1 (±1.5) 5.41 (±0.4)
80011.01 (±1)48.2 (±2)17.7 (±0.3)8.34 (±1) 1.6 (±0.3)
59013.03 (±1)49.8 (±2)2.4 (±0.2) 9.3 (±0.8)
45012.6 (±1)50.1 (±2)1.1 (±0.1) 9.1 (±1.3)
20012.73 (±1)49.9 (±2)1.8 (±0.3) 10.1 (±1.2)
Table A2. Different phases (not containing Fe) identified using XRD and their abundance, along with the errors (in parentheses) in the samples annealed at different temperatures.
Phases [Error]Al2CuAl9Cu11Cu3SnCu6Sn5SiSn
Annealing Temperature [°C]
10007.08 (±0.6) 3.21 (±0.3)5.41 (±0.5)
8006.87 (±0.6) 1.09 (±0.1)5.22 (±0.5)
59011.09 (±1) 5.12 (±0.4) 5.35 (±0.5)4.77 (±0.5)
450 11.4 (±1)6.8 (±0.5) 4.63 (±0.5)4.25 (±0.5)
200 9.35 (±1)5.14 (±0.4)2.1 (±0.1)4.2 (±0.5)4.68 (±0.5)

Appendix B

Figure A1. Fe-Si binary phase system reproduced with the help of FactSage 8.3.
Metals 15 00479 g0a1
Figure A2. EDS map of Sn taken corresponding to the EBSD image (Figure 22) from the sample annealed at 200 °C.
Metals 15 00479 g0a2

References

  1. Hawezy, D. The influence of silicon content on physical properties of non-oriented silicon steel. Mater. Sci. Technol. 2017, 33, 1560–1569. [Google Scholar] [CrossRef]
  2. Selema, A.; Beretta, M.; Ibrahim, M.N.; Verwimp, J.; Rombouts, M.; Vleugels, J.; Kestens, L.A.I.; Sergeant, P. Material Engineering of 3D-Printed Silicon Steel Alloys for the Next Generation of Electrical Machines and Sustainable Electromobility. J. Magn. Magn. Mater. 2023, 584, 171106. [Google Scholar] [CrossRef]
  3. Haque, N.; Norgate, T. Estimation of greenhouse gas emissions from ferroalloy production using life cycle assessment with particular reference to Australia. J. Clean. Prod. 2013, 39, 220–230. [Google Scholar] [CrossRef]
  4. Sævarsdottir, G.; Kvande, H.; Magnusson, T. Greenhouse Gas Emissions from Silicon Production -Development of Carbon Footprint with Changing Energy Systems. SSRN Electron. J. 2021, 27–29. [Google Scholar] [CrossRef]
  5. Tangstad, M. Ferrosilicon and silicon technology. In Handbook of Ferroalloy; Elsevier: Amsterdam, The Netherlands, 2013; pp. 179–220. [Google Scholar] [CrossRef]
  6. Riva, L.; Surup, G.R.; Buø, T.V.; Nielsen, H.K. A study of densified biochar as carbon source in the silicon and ferrosilicon production. Energy 2019, 181, 985–996. [Google Scholar] [CrossRef]
  7. Blaesing, L.; Walnsch, A.; Hippmann, S.; Modrzynski, C.; Weidlich, C.; Pavón, S.; Bertau, M. Ferrosilicon Production from Silicon Wafer Breakage and Red Mud. ACS Sustain. Resour. Manag. 2024, 1, 404–416. [Google Scholar] [CrossRef]
  8. Wijk, O.; Brabie, V. The purity of ferrosilicon and its influence on inclusion cleanliness of steel. ISIJ Int. 1996, 36, S132–S135. [Google Scholar] [CrossRef]
  9. Wang, X.; Tian, X.; Chen, X.; Ren, L.; Geng, C. A review of end-of-life crystalline silicon solar photovoltaic panel recycling technology. Sol. Energy Mater. Sol. Cells 2022, 248, 111976. [Google Scholar] [CrossRef]
  10. Cui, J.; Zhang, L. Metallurgical recovery of metals from electronic waste: A review. J. Hazard. Mater. 2008, 158, 228–256. [Google Scholar] [CrossRef]
  11. Padhamnath, P.; Nalluri, S.; Kuśmierczyk, F.; Kopyściański, M.; Karbowniczek, J.; Leow, S.W.; Reindl, T. Electrohydraulic fragmentation processing enabling separation and recovery of all components in end-of-life silicon photovoltaic panels. Sol. Energy 2025, 289, 113329. [Google Scholar] [CrossRef]
  12. Su, P.; He, Y.; Feng, Y.; Wan, Q.; Li, T. Advancements in end-of-life crystalline silicon photovoltaic module recycling: Current state and future prospects. Sol. Energy Mater. Sol. Cells 2024, 277, 113109. [Google Scholar] [CrossRef]
  13. Yu, Y.; Bai, X.; Li, S.; Shi, J.; Wang, L.; Xi, F.; Ma, W.; Deng, R. Review of silicon recovery in the photovoltaic industry. Curr. Opin. Green Sustain. Chem. 2023, 44, 100870. [Google Scholar] [CrossRef]
  14. Heath, G.A.; Silverman, T.J.; Kempe, M.; Deceglie, M.; Ravikumar, D.; Remo, T.; Cui, H.; Sinha, P.; Libby, C.; Shaw, S.; et al. Research and development priorities for silicon photovoltaic module recycling to support a circular economy. Nat. Energy 2020, 5, 502–510. [Google Scholar] [CrossRef]
  15. Akhter, M.; Al Mansur, A.; Islam, M.I.; Lipu, M.S.H.; Karim, T.F.; Abdolrasol, M.G.M.; Alghamdi, T.A.H. Sustainable Strategies for Crystalline Solar Cell Recycling: A Review on Recycling Techniques, Companies, and Environmental Impact Analysis. Sustainability 2024, 16, 5785. [Google Scholar] [CrossRef]
  16. Palitzsch, W.; Loser, U. Integrated PV-recycling-more efficient, more effective. In Proceedings of the 2017 IEEE 44th Photovoltaic Specialist Conference (PVSC), Washington, DC, USA, 25–30 June 2017. [Google Scholar] [CrossRef]
  17. Draoua, A.D.; Martel, B.; Dubois, S.; Audoin, C.; Sérasset, M.; Fauveau, A.; Radhakrishnan, H.S.; Denafas, J.; Petreniene, L.; Severino, N. On the Fabrication of Solar Cells Based on Newly Produced Recycled Silicon Feedstocks From CABRISS-A Comparative Study Between Material Properties and Solar Cell Performances. In Proceedings of the EU PVSEC 2017-33rd European Photovoltaic Solar Energy Conference and Exhibition, Amsterdam, The Netherlands, 25–29 September 2017; pp. 483–487. [Google Scholar] [CrossRef]
  18. Jung, B.; Park, J.; Seo, D.; Park, N. Sustainable System for Raw-Metal Recovery from Crystalline Silicon Solar Panels: From Noble-Metal Extraction to Lead Removal. ACS Sustain. Chem. Eng. 2016, 4, 4079–4083. [Google Scholar] [CrossRef]
  19. Mao, D.; Yang, S.; Ma, L.; Ma, W.; Yu, Z.; Xi, F.; Yu, J. Overview of life cycle assessment of recycling end-of-life photovoltaic panels: A case study of crystalline silicon photovoltaic panels. J. Clean. Prod. 2024, 434, 140320. [Google Scholar] [CrossRef]
  20. Okoroigwe, F.C.; Okoroigwe, E.C.; Ajayi, O.O.; Agbo, S.N.; Chukwuma, J.N. Photovoltaic Modules Waste Management: Ethical Issues for Developing Nations. Energy Technol. 2020, 8, 2000543. [Google Scholar] [CrossRef]
  21. Mahmoudi, S.; Huda, N.; Behnia, M. Environmental impacts and economic feasibility of end of life photovoltaic panels in Australia: A comprehensive assessment. J. Clean. Prod. 2020, 260, 120996. [Google Scholar] [CrossRef]
  22. Nain, P.; Kumar, A. Metal dissolution from end-of-life solar photovoltaics in real landfill leachate versus synthetic solutions: One-year study. Waste Manag. 2020, 114, 351–361. [Google Scholar] [CrossRef]
  23. Rajarao, R.; Farzana, R.; Sahajwalla, V. Transforming waste printed circuit boards and compact discs for the synthesis of valuable ferrosilicon alloy. J. Sustain. Metall. 2018, 4, 461–469. [Google Scholar] [CrossRef]
  24. Aryanto, D.; Sudiro, T. Preparation of ferrosilicon-aluminium coating using a mechanical alloying technique: Study of thermal annealing on their structural characteristics. Surf. Coat. Technol. 2018, 337, 35–43. [Google Scholar] [CrossRef]
  25. Tomé-Torquemada, S.; Glaser, B.; Hildal, K.; Sichen, D. Experimental Study on the Activities of Al and Ca in Ferrosilicon. Metall. Mater. Trans. B 2017, 48, 3251–3258. [Google Scholar] [CrossRef]
  26. Baisanov, S.O.; Tolokonnikova, V.V.; Narikbayeva, G.I.; Korsukova, I.Y.; Vorobkalo, N.R. Development of Theoretical Basis for Low-Percentage Ferrotitanium Production Technology with Using Ferrosilicon Aluminium. High. Temp. 2022, 60, 775–780. [Google Scholar] [CrossRef]
  27. Dumay, C.; Chatillon, C.; Allibert, M. Mass spectrométrie determination of activity coefficients of dilute aluminium and calcium in liquid silicon and ferrosilicon alloys. J. De Chim. Phys. 1997, 94, 971–977. [Google Scholar] [CrossRef]
  28. Alaerts, L.; De Beeck, J.P.O.; Hoste, J. Simultaneous determination of silicon and aluminium in ferrosilicon by instrumental neutron activation analysis with the aid of an 227Ac-Be isotopic neutron source. Anal. Chim. Acta 1974, 70, 253–263. [Google Scholar] [CrossRef]
  29. Xu, J.; Wang, K.; Wang, Y.; Qu, Z.; Tu, X. Effects of ferrosilicon alloy, Si content of steel, and slag basicity on compositions of inclusions during ladle furnace refining of Al-killed steel. J. Iron Steel Res. Int. 2020, 27, 1011–1017. [Google Scholar] [CrossRef]
  30. Gui, Z.; Liang, W.; Zhang, Y. Enhancing ductility of the Al-Si coating on hot stamping steel by controlling the Fe-Al phase transformation during austenitization. Sci. China Technol. Sci. 2014, 57, 1785–1793. [Google Scholar] [CrossRef]
  31. Novák, P.; Nová, K.; Vanka, T.; Průša, F. High-temperature behaviour of new Fe-Al-Si alloy produced by powder metallurgy. Manuf. Technol. 2018, 18, 299–302. [Google Scholar] [CrossRef]
  32. Wolski, K.; Le Caer, G.; Delcroix, P.; Fillit, R.; Thevenot, F.; Le Coze, J. Influence of milling conditions on the FeAl intermetallic formation by mechanical alloying. Mater. Sci. Eng. A 1996, 207, 97–104. [Google Scholar] [CrossRef]
  33. Zhou, T.D.; Zhou, P.H.; Liang, D.F.; Deng, L.J. Structure and electromagnetic characteristics of flaky FeSiAl powders made by melt-quenching. J. Alloys. Compd. 2009, 484, 545–549. [Google Scholar] [CrossRef]
  34. Ni, J.L.; Duan, F.; Feng, S.J.; Hu, F.; Kan, X.C.; Liu, X.S. High performance of FeSiAl/hBN soft magnetic composites. J. Alloys Compd. 2022, 897, 163191. [Google Scholar] [CrossRef]
  35. Li, H.; Bai, G.; Zhao, R.; Yang, H.; Lu, Z.; Cheng, M.; Su, R.; Bandaru, S.; Zhang, Y.; Liu, X. High-performance FeSiAl soft magnetic composites achieved by confined solid-state reaction. Acta Mater. 2023, 255, 119102. [Google Scholar] [CrossRef]
  36. Zhou, L.; Yan, J.; Huang, J.; Wang, H.; Wang, X.; Wang, Z. Dielectric and microwave absorption properties of FeSiAl/Al2O3 composites containing FeSiAl particles of different sizes. Ceram. Int. 2021, 47, 7831–7836. [Google Scholar] [CrossRef]
  37. Morris, D.G.; Muñoz-Morris, M.A. A re-examination of the pinning mechanisms responsible for the stress anomaly in FeAl intermetallics. Intermetallics 2010, 18, 1279–1284. [Google Scholar] [CrossRef]
  38. Li, W.; Cai, H.; Kang, Y.; Ying, Y.; Yu, J.; Zheng, J.; Qiao, L.; Jiang, Y.; Che, S. High permeability and low loss bioinspired soft magnetic composites with nacre-like structure for high frequency applications. Acta Mater. 2019, 167, 267–274. [Google Scholar] [CrossRef]
  39. Shkolnik, V.S.; Zharmenov, A.A.; Tolymbekov, M.Z.; Baisanov, S.O.; Chekimbaev, A.F. Prospects of production complex aluminum silicon alloy. In Proceedings of the 13th International Ferroalloys Congress: Efficient Technologies in Ferroalloy Industry, Almaty, Kazakhstan, 9–12 June 2013; p. 311. [Google Scholar]
  40. Shevko, V.M.; Amanov, D.D.; Karataeva, G.E.; Aitkulov, D.K. Complex ferroalloy obtaining from silicon-and aluminum–containing silica clay. Kompleks. Ispolz. Miner. Syra Complex. Use Miner. Resour. 2016, 4, 39–45. [Google Scholar]
  41. Domain, C.; Becquart, C.S. Ab initio calculations of defects in Fe and dilute Fe-Cu alloys. Phys. Rev. B 2001, 65, 024103. [Google Scholar] [CrossRef]
  42. Kimura, Y.; Takaki, S. Phase transformation mechanism of Fe-Cu alloys. ISIJ Int. 1997, 37, 290–295. [Google Scholar] [CrossRef]
  43. Eckert, J.; Holzer, J.C.; Johnson, W.L. Thermal stability and grain growth behavior of mechanically alloyed nanocrystalline Fe-Cu alloys. J. Appl. Phys. 1993, 73, 131–141. [Google Scholar] [CrossRef]
  44. Jiang, J.Z.; Gente, C.; Bormann, R. Mechanical alloying in the Fe–Cu system. Mater. Sci. Eng. A 1998, 242, 268–277. [Google Scholar] [CrossRef]
  45. Chen, Y.Z.; Liu, F.; Yang, G.C.; Xu, X.Q.; Zhou, Y.H. Rapid solidification of bulk undercooled hypoperitectic Fe–Cu alloy. J. Alloys Compd. 2007, 427, L1–L5. [Google Scholar] [CrossRef]
  46. Munitz, A. Liquid separation effects in Fe− Cu alloys solidified under different cooling rates. Metall. Trans. B 1987, 18, 565–575. [Google Scholar] [CrossRef]
  47. Chen, Q.; Jin, Z. The Fe-Cu system: A thermodynamic evaluation. Metall. Mater. Trans. A 1995, 26, 417–426. [Google Scholar] [CrossRef]
  48. Imai, N.; Tanaka, T.; Yuki, T.; Iida, T.; Morita, Z. Equilibrium distribution of Sn between solid and liquid phases in Fe-Sn and Fe-C-Sn alloys. Tetsu-to-Hagane 1991, 77, 224–230. [Google Scholar] [CrossRef]
  49. Fayyazi, B.; Skokov, K.P.; Faske, T.; Opahle, I.; Duerrschnabel, M.; Helbig, T.; Soldatov, I.; Rohrmann, U.; Molina-Luna, L.; Gueth, K. Experimental and computational analysis of binary Fe-Sn ferromagnetic compounds. Acta Mater. 2019, 180, 126–140. [Google Scholar] [CrossRef]
  50. Dorofeev, G.A.; Elsukov, E.P. Thermodynamic modeling of mechanical alloying in the Fe–Sn system. Inorg. Mater. 2000, 36, 1228–1234. [Google Scholar] [CrossRef]
  51. Van Beek, J.A.; Stolk, S.A.; van Loo, F.J.J. Multiphase diffusion in the systems Fe-Sn and Si-Sn. Int. J. Mater. Res. 1982, 73, 439–444. [Google Scholar] [CrossRef]
  52. Yelsukov, E.P.; Konygin, G.N.; Voronina, E.V.; Korolyov, A.V.; Ulyanov, A.I.; Godovikov, S.K.; Zagainov, A.V. Magnetic behaviour of high Si (Sn) concentration nanocrystalline Fe–Si and Fe–Sn alloys obtained by mechanical grinding. J. Magn. Magn. Mater. 2000, 214, 258–268. [Google Scholar] [CrossRef]
  53. Arita, M.; Ohyama, M.; Goto, K.S. Someno, Measurements of Activity, Solubility, and Diffusivity in α and γ Fe-Sn Alloys between 1183 and 1680 K. Int. J. Mater. Res. 1981, 72, 244–250. [Google Scholar] [CrossRef]
  54. Giefers, H.; Nicol, M. High pressure X-ray diffraction study of all Fe–Sn intermetallic compounds and one Fe–Sn solid solution. J. Alloys Compd. 2006, 422, 132–144. [Google Scholar] [CrossRef]
  55. Padhamnath, P.; Ślęzak, M.; Karbowniczek, M. Disposing End of Life PV Modules–Reusing, Recycling and Upcycling. In Proceedings of the EU PVSEC 2023, EUPVSEC, Lisbon, Portugal, 18–22 September 2023; pp. 001–008. [Google Scholar] [CrossRef]
  56. Yeh, J.-W. Physical metallurgy of high-entropy alloys. JOM 2015, 67, 2254–2261. [Google Scholar] [CrossRef]
  57. Wang, Y.; Li, G.; Qi, H.; Zhang, W.; Chen, R.; Su, R.; Yu, B.; Qu, Y. Effect of non-metallic silicon content on the microstructure and corrosion behaviour of AlCoCrFeNi high-entropy alloys. Mater. Chem. Phys. 2024, 315, 128974. [Google Scholar] [CrossRef]
  58. Sohrabi, M.J.; Kalhor, A.; Mirzadeh, H.; Rodak, K.; Kim, H.S. Tailoring the strengthening mechanisms of high-entropy alloys toward excellent strength-ductility synergy by metalloid silicon alloying: A review. Prog. Mater. Sci. 2024, 101295. [Google Scholar] [CrossRef]
  59. Lee, H.; Sharma, A.; Ahn, B. Exploring strengthening mechanism of FeCoNiAl high-entropy alloy by non-metallic silicon addition produced via powder metallurgy. J. Alloys Compd. 2023, 947, 169545. [Google Scholar] [CrossRef]
  60. Nowell, M.M.; Wright, S.I. Phase differentiation via combined EBSD and XEDS. J. Microsc. 2004, 213, 296–305. [Google Scholar] [CrossRef]
  61. Bordín, S.F.; Limandri, S.; Ranalli, J.M.; Castellano, G. EBSD spatial resolution for detecting sigma phase in steels. Ultramicroscopy 2016, 171, 177–185. [Google Scholar] [CrossRef]
  62. Brodusch, N.; Gauvin, R. Phase differentiation based on x-ray energy spectrum correlation with an energy dispersive spectrometer (EDS). Ultramicroscopy 2022, 238, 113534. [Google Scholar] [CrossRef]
  63. Beniwal, D.; Shivam, V.; Palasyuk, O.; Kramer, M.J.; Phanikumar, G.; Ray, P.K. EDS-PhaSe: Phase segmentation and analysis from EDS elemental map images using markers of elemental segregation. Metallogr. Microstruct. Anal. 2023, 12, 924–933. [Google Scholar] [CrossRef]
  64. Parish, C.M. Cluster analysis of combined EDS and EBSD data to solve ambiguous phase identifications. Microsc. Microanal. 2022, 28, 371–382. [Google Scholar] [CrossRef]
  65. Ram, F.; Wright, S.; Singh, S.; De Graef, M. Error analysis of the crystal orientations obtained by the dictionary approach to EBSD indexing. Ultramicroscopy 2017, 181, 17–26. [Google Scholar] [CrossRef]
  66. Chen, Y.H.; Park, S.U.; Wei, D.; Newstadt, G.; Jackson, M.A.; Simmons, J.P.; De Graef, M.; Hero, A.O. A dictionary approach to electron backscatter diffraction indexing. Microsc. Microanal. 2015, 21, 739–752. [Google Scholar] [CrossRef] [PubMed]
  67. Brewick, P.T.; Wright, S.I.; Rowenhorst, D.J. NLPAR: Non-local smoothing for enhanced EBSD pattern indexing. Ultramicroscopy 2019, 200, 50–61. [Google Scholar] [CrossRef] [PubMed]
  68. Griesser, S.; Bernhard, C.; Dippenaar, R. Effect of nucleation undercooling on the kinetics and mechanism of the peritectic phase transition in steel. Acta Mater. 2014, 81, 111–120. [Google Scholar] [CrossRef]
  69. Herlach, D.M.; Gao, J.; Holland-Moritz, D.; Volkmann, T. Nucleation and phase-selection in undercooled melts. Mater. Sci. Eng. A 2004, 375, 9–15. [Google Scholar] [CrossRef]
  70. Perepezko, J.H.; Wilde, G. Melt undercooling and nucleation kinetics. Curr. Opin. Solid. State Mater. Sci. 2016, 20, 3–12. [Google Scholar] [CrossRef]
  71. Avrami, M. Kinetics of phase change. I General theory. J. Chem. Phys. 1939, 7, 1103–1112. [Google Scholar] [CrossRef]
  72. Avrami, M. Kinetics of phase change. II transformation-time relations for random distribution of nuclei. J. Chem. Phys. 1940, 8, 212–224. [Google Scholar] [CrossRef]
  73. Van der Zwaag, S. Kinetics of phase transformations in steels. In Phase Transformations in Steels; Elsevier: Amsterdam, The Netherlands, 2012; pp. 126–156. [Google Scholar]
  74. Smith, R.F.; Eggert, J.H.; Swift, D.C.; Wang, J.; Duffy, T.S.; Braun, D.G.; Rudd, R.E.; Reisman, D.B.; Davis, J.-P.; Knudson, M.D. Time-dependence of the alpha to epsilon phase transformation in iron. J. Appl. Phys. 2013, 114. [Google Scholar] [CrossRef]
  75. Madsen, I.C.; Scarlett, N.V.Y. Quantitative phase analysis. In Powder Diffraction: Theory and Practice; Royal Society of Chemistry: London, UK, 2008; pp. 298–331. [Google Scholar] [CrossRef]
  76. Gouttebroze, S.; Marthinsen, A.; Kroka, B.; Götz, A.; Ott, E. Modelling of major phases formation during solidification of Ferro-Silicon-Magnesium. IOP Conf. Ser. Mater. Sci. Eng. 2023, 128, 012052. [Google Scholar] [CrossRef]
  77. Degtyareva, O.; Degtyareva, V.F.; Porsch, F.; Holzapfel, W.B. Phase transitions under high pressure inbinary Sn alloys (with In, Hg and Ga). J. Phys. Condens. Matter. 2001, 14, 389. [Google Scholar] [CrossRef]
  78. Cheong, B.H.; Chang, K.-J. First-principles study of the structural properties of Sn under pressure. Phys. Rev. B 1991, 44, 4103. [Google Scholar] [CrossRef] [PubMed]
  79. Sim, K.; Lee, J. Phase stability of Ag–Sn alloy nanoparticles. J. Alloys Compd. 2014, 590, 140–146. [Google Scholar] [CrossRef]
  80. Milekhine, V.; Onsøien, M.I.; Solberg, J.K.; Skaland, T. Mechanical properties of FeSi (ε), FeSi2 (ζα) and Mg2Si. Intermetallics 2002, 10, 743–750. [Google Scholar] [CrossRef]
  81. Wu, J.; Chong, X.; Jiang, Y.; Feng, J. Stability, electronic structure, mechanical and thermodynamic properties of Fe-Si binary compounds. J. Alloys Compd. 2017, 693, 859–870. [Google Scholar] [CrossRef]
  82. Costa, B.F.O.; Le Caër, G.; de Campos, N.A. On the Role of Tin Solubility in the Precipitation of the Sigma-Phase in Fe–Cr–Sn Alloys. Phys. Status Solidi (A) 1997, 164, 687–697. [Google Scholar] [CrossRef]
  83. Hood, G.M. The diffusion of iron in aluminium. Philos. Mag. A J. Theor. Exp. Appl. Phys. 1970, 21, 305–328. [Google Scholar] [CrossRef]
  84. Salje, G.; Feller-Kniepmeier, M. The diffusion and solubility of copper in iron. J. Appl. Phys. 1977, 48, 1833–1839. [Google Scholar] [CrossRef]
  85. Novák, P.; Michalcová, A.; Marek, I.; Mudrová, M.; Saksl, K.; Bednarčík, J.; Zikmund, P.; Vojtěch, D. On the formation of intermetallics in Fe–Al system–An in situ XRD study. Intermetallics 2013, 32, 127–136. [Google Scholar] [CrossRef]
  86. Godlewska, E.; Szczepanik, S.; Mania, R.; Krawiarz, J.; Kozinski, S. FeAl materials from intermetallic powders. Intermetallics 2003, 11, 307–312. [Google Scholar] [CrossRef]
  87. Maitra, T.; Gupta, S.P. Intermetallic compound formation in Fe–Al–Si ternary system: Part II. Mater. Charact. 2002, 49, 293–311. [Google Scholar] [CrossRef]
  88. Ohnuma, I.; Abe, S.; Shimenouchi, S.; Omori, T.; Kainuma, R.; Ishida, K. Experimental and thermodynamic studies of the Fe–Si binary system. ISIJ Int. 2012, 52, 540–548. [Google Scholar] [CrossRef]
  89. Dézsi, I.; Fetzer, C.; Szűcs, I.; Dekoster, J.; Vantomme, A.; Caymax, M. Stable and metastable iron silicide phases on Si (1 0 0). Surf. Sci. 2005, 599, 122–127. [Google Scholar] [CrossRef]
  90. Ma, R.; Xie, Q.; Huang, J.; Yan, W.Y.; Guo, X.T. Theoretical study on the electronic structures and magnetism of Fe3Si intermetallic compound. J. Alloys Compd. 2013, 552, 324–328. [Google Scholar] [CrossRef]
  91. Novák, P.; Lamchaouri, A.; Nová, K.; Průša, F. Fe-Al-Si coatings for the Protection of Steel Against High-temperature Oxidation. Manuf. Technol. 2019, 19, 660–663. [Google Scholar] [CrossRef]
  92. Kang, S.; Han, K.; Kim, K.; Kang, Y.; Son, K.; Kim, D. Formation behavior of an intermetallic compound layer during the hot dip aluminizing of cast iron. ISIJ Int. 2012, 52, 1342–1347. [Google Scholar] [CrossRef]
  93. Zou, H.F.; Yang, H.J.; Zhang, Z.F. Morphologies, orientation relationships and evolution of Cu6Sn5 grains formed between molten Sn and Cu single crystals. Acta Mater. 2008, 56, 2649–2662. [Google Scholar] [CrossRef]
  94. Leineweber, A.; Wieser, C.; Hügel, W. Cu6Sn5 intermetallic: Reconciling composition and crystal structure. Scr. Mater. 2020, 183, 66–70. [Google Scholar] [CrossRef]
  95. Mu, D.K.; McDonald, S.D.; Read, J.; Huang, H.; Nogita, K. Critical properties of Cu6Sn5 in electronic devices: Recent progress and a review. Curr. Opin. Solid. State Mater. Sci. 2016, 20, 55–76. [Google Scholar] [CrossRef]
  96. Nutor, R.K.; Cao, Q.; Wang, X.; Zhang, D.; Fang, Y.; Zhang, Y.; Jiang, J.-Z. Phase selection, lattice distortions, and mechanical properties in high-entropy alloys. Adv. Eng. Mater. 2020, 22, 2000466. [Google Scholar] [CrossRef]
  97. Chang, C.-C.; Hsiao, Y.-T.; Chen, Y.-L.; Tsai, C.-Y.; Lee, Y.-J.; Ko, P.-H.; Chang, S.-Y. Lattice distortion or cocktail effect dominates the performance of Tantalum-based high-entropy nitride coatings. Appl. Surf. Sci. 2022, 577, 151894. [Google Scholar] [CrossRef]
  98. Michael, J.R. Phase identification using electron backscatter diffraction in the scanning electron microscope. In Electron Backscatter Diffraction in Materials Science; Springer: New York, NY, USA, 2000; pp. 75–89. [Google Scholar]
  99. El-Dasher, B.; Deal, A. Application of electron backscatter diffraction to phase identification. Electron Backscatter Diffr. Mater. Sci. 2009, 81–95. [Google Scholar]
  100. Münch, B.; Martin, L.H.J.; Leemann, A. Segmentation of elemental EDS maps by means of multiple clustering combined with phase identification. J. Microsc. 2015, 260, 411–426. [Google Scholar] [CrossRef] [PubMed]
  101. Miler, M.; Mirtič, B. Accuracy and precision of EDS analysis for identification of metal-bearing minerals in polished and rough particle samples. Geologija 2013, 56, 5–17. [Google Scholar] [CrossRef]
  102. Chen, C.-L.; Thomson, R.C. The combined use of EBSD and EDX analyses for the identification of complex intermetallic phases in multicomponent Al–Si piston alloys. J. Alloys Compd. 2010, 490, 293–300. [Google Scholar] [CrossRef]
  103. Wu, T.H.; Wang, H. The Effect of Solidification Behavior of FeSi75 Alloy on Its Disintegration. In Proceedings of the of the Silicon for the Chemical & Solar Industry XVI 2022, Online, 14–16 June 2022. [Google Scholar]
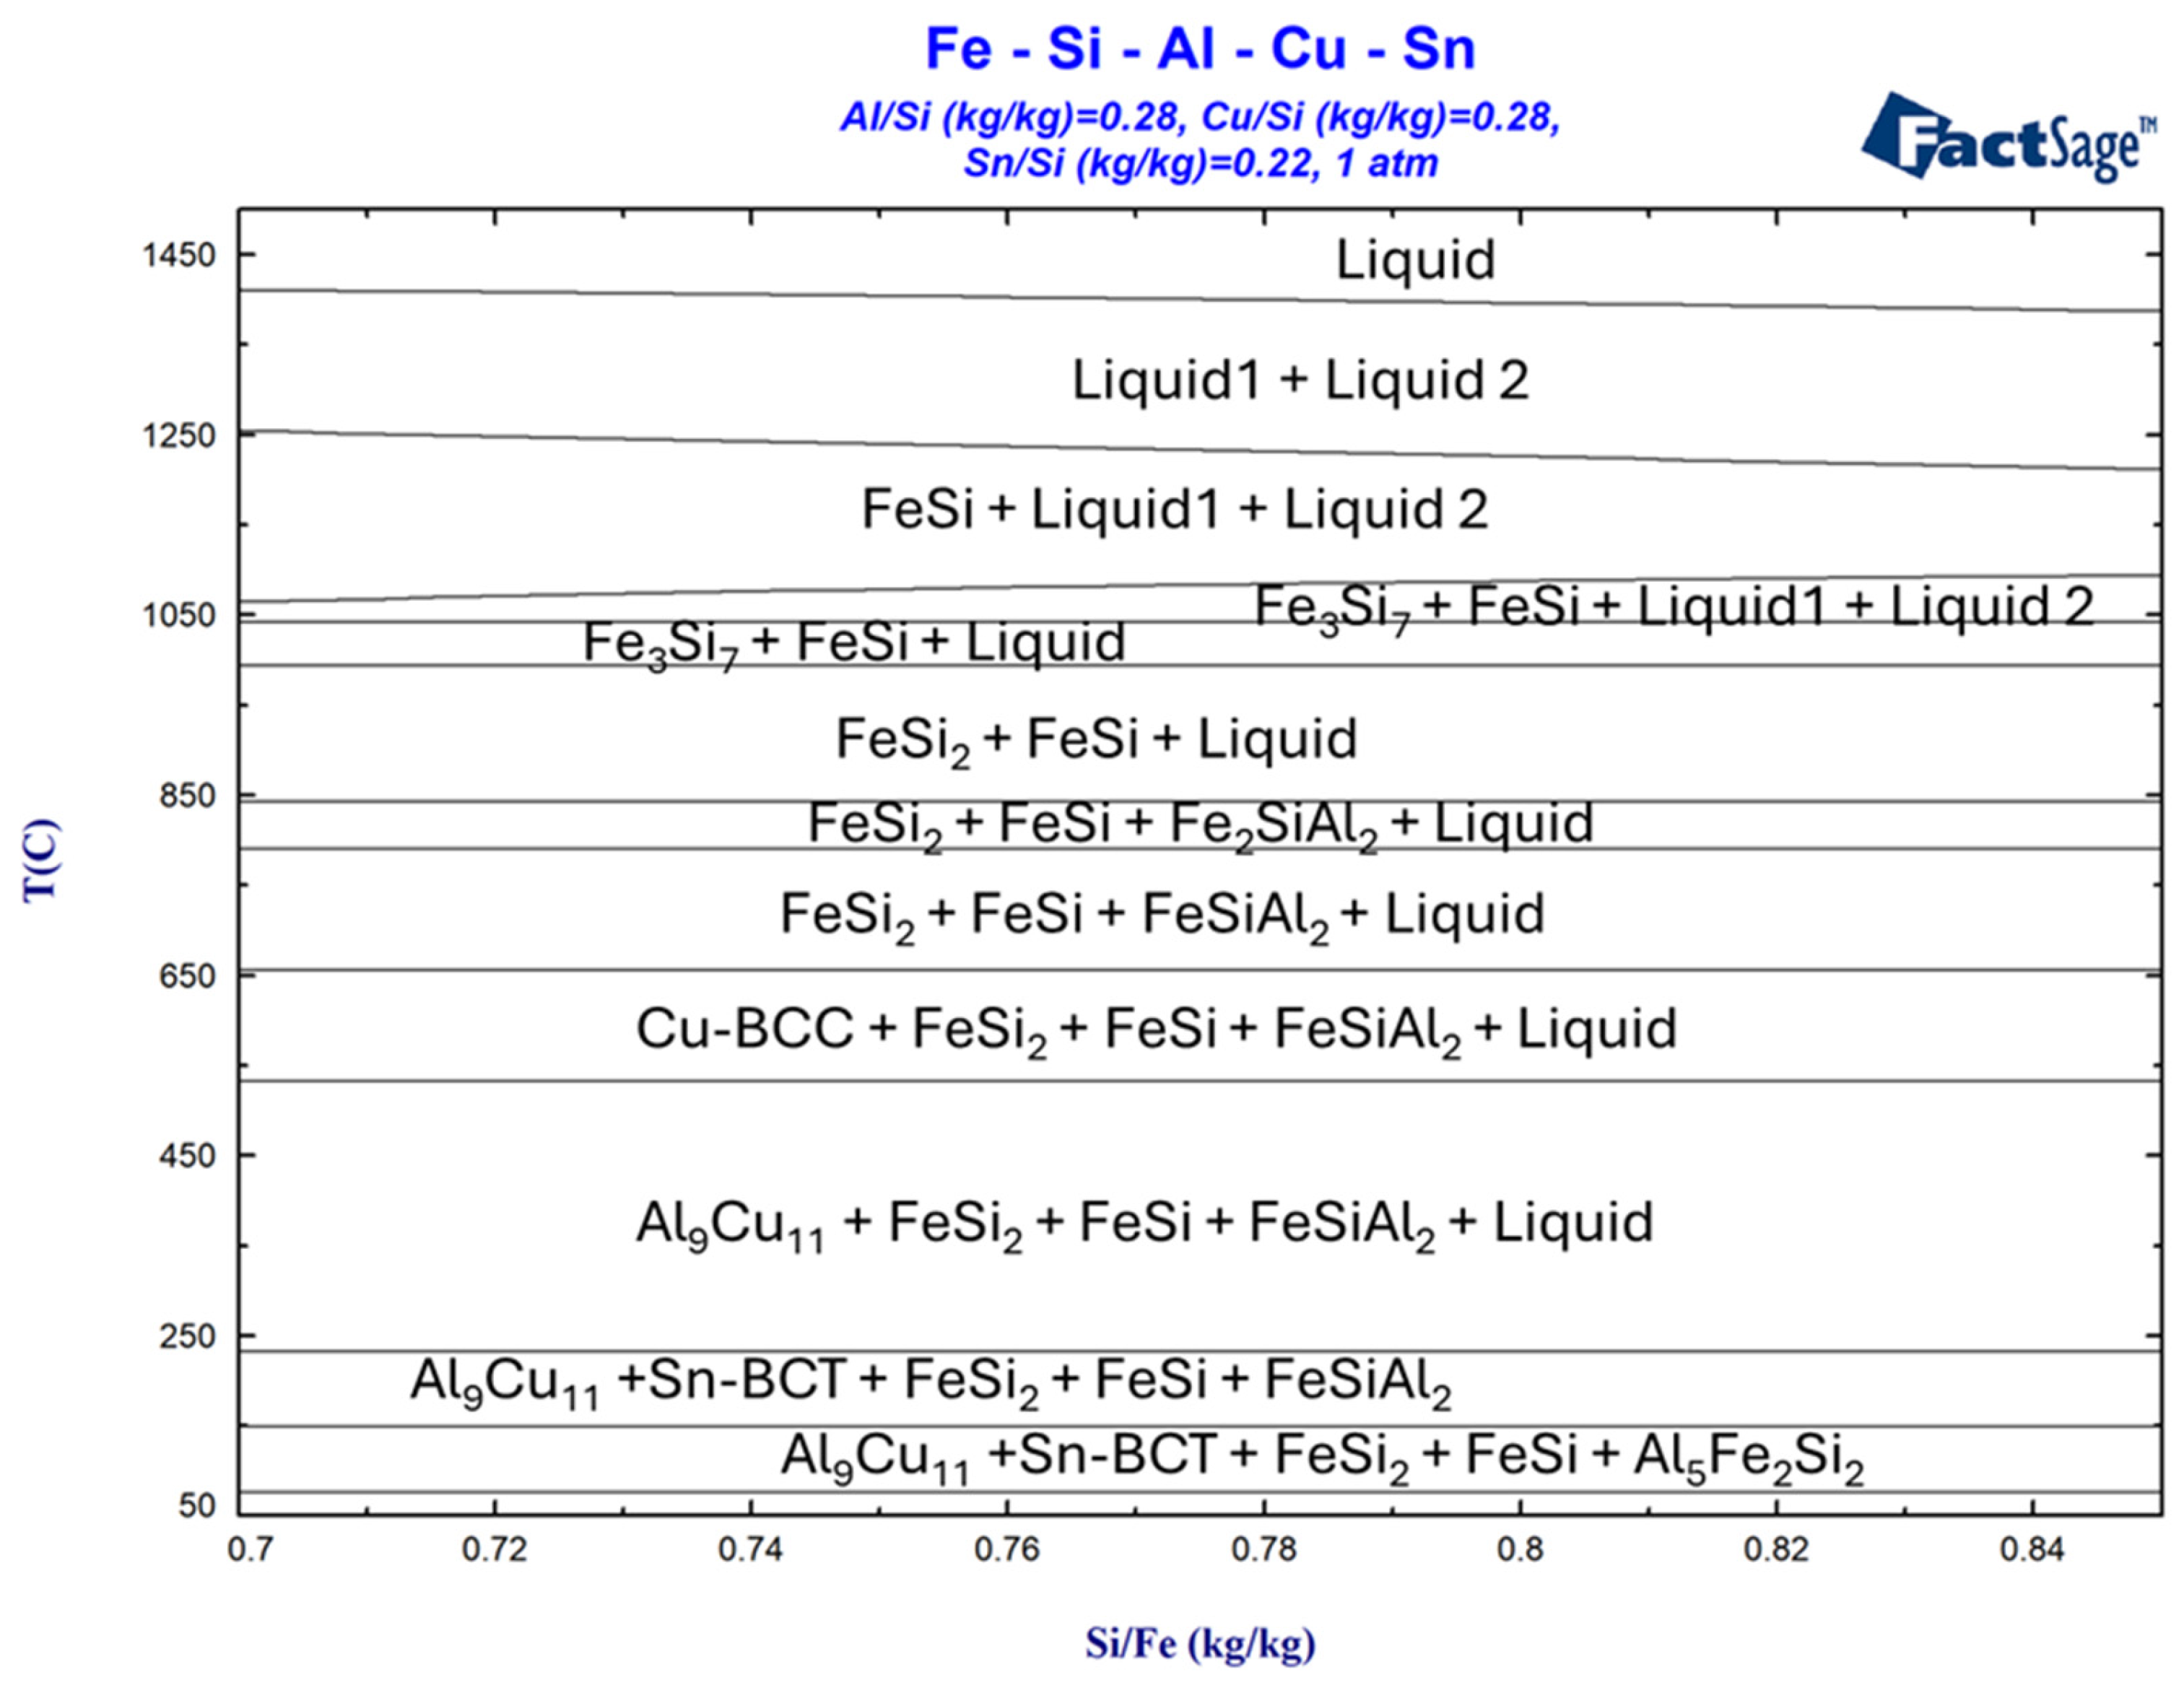
Figure 1. Phase diagram simulated with the help of FactSage showing the different phases formed during the cooling of FeSiAlCuSn high-entropy alloys. In Liquid 1, Fe-Si is the major component, while in Liquid 2, Cu-Sn is dominant.
Metals 15 00479 g001
Figure 2. Bar plot showing the individual components (in wt.%) in the simulated Liquid 1 and Liquid 2 (immiscible) at different temperatures: 1350, 1300, and 1250 °C.
Metals 15 00479 g002
Figure 3. Bar plot showing the change in the elemental composition in terms of wt.%. of the Cu-based BCC solution from 650 °C to 531 °C.
Metals 15 00479 g003
Figure 4. (a) Plot showing the wt.% of some selected solid phases in the multicomponent FeSiAlCuSn alloy as it cools down. (b) Same plot zoomed in for improved readability of data shown at lower temperatures.
Metals 15 00479 g004
Figure 5. SEM image showing the microstructure of two different areas near the (a) center (magnification-500×) and (b) edge (magnification-300×) of the standard sample annealed at 1000 °C, along with the corresponding EDS maps showing the distribution of the constituent elements (Si and Fe).
Metals 15 00479 g005
Figure 6. XRD plot of the standard FeSi45 sample taken from two different regions (a) near the center and (b) near the edge.
Metals 15 00479 g006
Figure 7. SEM images showing the (i) microstructure (SEM) and (ii) elemental and (iii) pseudo-phase composition maps (EDS) at two different locations (a,b) of the FeSiAlCuSn alloy cooled in ambient air (magnification: 1000×).
Metals 15 00479 g007
Figure 8. SEM images (magnification: 500×) showing the microstructure of two different areas near the (a) edge and (b) center of the sample annealed at 1000 °C, along with the corresponding EDS maps showing the distribution of the constituent elements.
Metals 15 00479 g008
Figure 9. EDS maps showing the (i) elemental overlay maps and (ii) phase overlay maps for the SEM regions (a) edge and (b) center, as shown in Figure 8 (magnification: 500×).
Metals 15 00479 g009aMetals 15 00479 g009b
Figure 10. (a) EBSD image, (b) phase distribution map, and (c) inverse pole map of a region closer to the center of the sample annealed at 1000 °C using EBSD integrated with SEM–EDS.
Metals 15 00479 g010
Figure 11. SEM image (magnification: 500×) showing the microstructure of two different areas near the (a) edge and (b) center of the sample annealed at 800 °C, along with the corresponding EDS maps showing the distribution of the constituent elements.
Metals 15 00479 g011
Figure 12. EDS maps showing the (i) elemental overlay maps and (ii) phase overlay maps for the SEM regions near the (a) edge and (b) center of the sample as shown in Figure 11a and Figure 11b respectively (magnification: 500×).
Metals 15 00479 g012aMetals 15 00479 g012b
Figure 13. (a) EBSD image, (b) phase distribution map, and (c) inverse pole map of a region closer to the center of the sample annealed at 800 °C using EBSD integrated with SEM–EDS.
Metals 15 00479 g013
Figure 14. SEM image (magnification: 500×) showing the microstructure of two different areas near the (a) edge and (b) center of the sample annealed at 590 °C, along with the corresponding EDS maps showing the distribution of the constituent elements.
Metals 15 00479 g014aMetals 15 00479 g014b
Figure 15. EDS maps showing the elemental overlay maps for the SEM regions near the (a) edge and (b) center of the sample, corresponding to the regions shown in Figure 14a and Figure 14b respectively (magnification: 500×).
Metals 15 00479 g015
Figure 16. (a) EBSD image, (b) phase distribution map, and (c) inverse pole map of a region close to the center of the sample annealed at 590 °C using EBSD integrated with the SEM–EDS.
Metals 15 00479 g016aMetals 15 00479 g016b
Figure 17. SEM image (magnification: 500×) showing the microstructure of two different areas near the (a) edge and (b) center of the sample annealed at 450 °C, along with the corresponding EDS maps showing the distribution of the constituent elements.
Metals 15 00479 g017
Figure 18. EDS maps showing the (i) elemental overlay maps and (ii) phase overlay maps for the SEM regions near the (a) edge and (b) center of the sample shown in Figure 17a and Figure 17b, respectively (magnification: 500×).
Metals 15 00479 g018
Figure 19. (a) EBSD image, (b) phase distribution map, and (c) inverse pole map of a region close to the center of the sample annealed at 450 °C using EBSD integrated with SEM–EDS.
Metals 15 00479 g019
Figure 20. SEM image (magnification-500×) showing the microstructure of two different areas near the (a) edge and (b) center of the sample annealed at 200 °C along with the corresponding EDS maps showing the distribution of the constituent elements.
Metals 15 00479 g020
Figure 21. EDS maps showing the (i) elemental overlay maps and (ii) phase overlay maps of two different areas near the (a) edge and (b) center of the sample for the SEM regions shown in Figure 20a and Figure 20b, respectively (magnification: 500×).
Metals 15 00479 g021aMetals 15 00479 g021b
Figure 22. (a) EBSD image, (b) phase distribution map, and (c) inverse pole map of a region close to the center of the sample annealed at 200 °C using EBSD integrated with SEM–EDS.
Metals 15 00479 g022
Figure 23. XRD pattern of the powder of the FeSiAlCuSn multicomponent sample annealed at different temperatures. The image is separated into two parts: (a) shows phases with Fe, and (b) shows phases without Fe for improved readability.
Metals 15 00479 g023
Figure 24. Stacked column chart showing the different phases and their abundance (in % wt.) in the FeSiAlCuSn multicomponent alloy annealed at different temperatures.
Metals 15 00479 g024
Figure 25. Hardness of the multicomponent FeSiAlCuSn samples annealed at different temperatures.
Metals 15 00479 g025
Figure 26. Hardness of the multicomponent FeSiAlCuSn samples and the reference FeSi sample cooled in ambient conditions.
Metals 15 00479 g026
Table 1. Composition of the alloy prepared in this work.
Component (E)Wt. [g]E/Total [%]E/Si [%]
Fe11040.7122.2
Si9033.31
Al259.327.8
Cu259.327.8
Sn207.422.2
Table 2. Dimensions and weight of the graphite and alumina crucibles used in the experiments.
Crucible TypeHeight [mm]Inner Diameter [mm]Thickness [mm]Weight as Received [g]Weight After Baking [g]
Graphite10055251082 ± 3871 ± 1.3
Alumina80482.5120 ± 1.5119 ± 0.2
Table 3. Sample ID, annealing temperatures, and annealing durations for the different samples prepared in this work.
Sample-IDAnnealing Temp [°C]Annealing Time [hours]
FeSi-1000100024
FeSi-80080036
FeSi-59059048
FeSi-45045060
FeSi-20020072
Table 4. Theoretical composition of the multicomponent alloy at 1000 °C as simulated by FactSage. The estimated mass of the phases and the mass percentages are also provided.
PhasesMass [g]Mass [%]
FeSi116.443.1
Fe3(Si, Al)758.721.7
Solution (liquid) (Al+Cu+Fe+Si+Sn)94.935.2
Table 5. Elemental composition of the pseudo-phases in % atomic as identified using EDS measurements for the sample annealed at 1000 °C.
Pseudo-PhaseFe [% at.]Si [% at.]Al [% at.]Cu [% at.]Sn [% at.]
Si/Fe38.9 ± 11.648.3 ± 9.68.3 ± 5.43.5 ± 1.30.9 ± 0.1
Al/Si/Fe25.5 ± 0.835.4 ± 7.630.7 ± 7.16.9 ± 0.81.9 ± 0.7
Al/Cu3.6 ± 0.16.3 ± 0.136.5 ± 0.752.3 ± 1.11.2 ± 0.5
Sn7.1 ± 2.16.7 ± 1.33.2 ± 1.24.9 ± 2.277.8 ± 1.8
Table 6. Theoretical composition of the multicomponent alloy at 800 °C as simulated by FactSage. The estimated mass of the phases and the mass percentages are also provided.
PhasesMass [g]Mass [%]
FeSi40.715.1
FeSi2137.250.8
Fe2SiAl223.68.7
Solution (liquid) (Al+Cu+Fe+Si+Sn)68.525.4
Table 7. Elemental composition of the pseudo-phases in % atomic (at.) as identified using EDS measurements for the sample annealed at 800 °C.
Pseudo-PhaseFe [% at.]Si [% at.]Al [% at.]Cu [% at.]Sn [% at.]
Si/Fe37.9 ± 7.653 ± 8.67.2 ± 0.11.6 ± 0.50.3 ± 0.2
Si/Fe/Al44.6 ± 3.235.7 ± 1.616.3 ± 2.32.5 ± 0.70.9 ± 0.1
Cu/Al2.7 ± 0.13.4 ± 0.634.7 ± 0.557.8 ± 1.41.4 ± 0.2
Si/Al/Cu5 ± 0.927.3 ± 0.925.5 ± 0.840.2 ± 1.32 ± 0.7
Sn4.4 ± 0.35.9 ± 0.77.2 ± 0.414.1 ± 1.768.3 ± 1.1
Table 8. Theoretical composition of the multicomponent alloy at 590 °C as simulated by FactSage. The estimated mass of the phases and the mass percentages are also provided.
PhasesMass [g]Mass [%]
FeSi36.913.7
FeSi2136.150.4
FeSiAl243.316.1
Al-Cu-Si-Sn (BCC) solid solution43.916.2
Solution (liquid) (Al+Cu+Fe+Si+Sn)9.83.6
Table 9. Elemental composition of the pseudo-phases in % atomic (at.) as identified using EDS measurements for the sample annealed at 590 °C.
Pseudo-PhaseFe [% at.]Si [% at.]Al [% at.]Cu [% at.]Sn [% at.]
Si/Fe35.4 ± 7.255.1 ± 8.77.7 ± 1.21.5 ± 0.50.3 ± 0.2
Si/Fe/Al23.8 ± 2.938.6 ± 5.627.4 ± 6.59 ± 3.11.6 ± 0.3
Si/Al/Cu7.1 ± 2.117.5 ± 2.220.5 ± 1.553.2 ± 2.11.6 ± 0.7
Sn/Si/Al/Cu8 ± 0.614.6 ± 3.713.9 ± 3.312.5 ± 1.348.7 ± 8.4
Sn4.4 ± 0.35.9 ± 0.77.2 ± 0.414.1 ± 1.768.3 ± 1.1
Table 10. Theoretical composition of the multicomponent alloy at 450 °C as simulated by FactSage. The estimated mass of the phases and the mass percentages are also provided.
PhasesMass [g]Mass [%]
FeSi36.313.4
FeSi2138.451.3
FeSiAl241.615.4
Al9Cu1133.412.4
Solution (liquid) (primarily Sn)20.27.5
Table 11. Elemental composition of the pseudo-phases in % atomic (at.) as identified using EDS measurements for the sample annealed at 450 °C.
Pseudo-PhaseFe [% at.]Si [% at.]Al [% at.]Cu [% at.]Sn [% at.]
Si/Fe31.3 ± 7.856.9 ± 6.17.7 ± 0.23.7 ± 1.90.4 ± 0.1
Si/Fe/Al25.8 ± 0.535.3 ± 8.335. ± 9.12.9 ± 1.10.6 ± 0.1
Al/Cu3.9 ± 2.52.6 ± 0.136.5 ± 0.555.9 ± 2.41.2 ± 0.1
Sn3.4 ± 0.51.9 ± 0.44.2 ± 0.94.3 ± 1.886.5 ± 0.4
Table 12. Theoretical composition of the multicomponent alloy at 200 °C as simulated by FactSage. The estimated mass of the phases and the mass percentages are also provided.
PhasesMass [g]Mass [%]
FeSi36.313.5
FeSi2138.351.3
FeSiAl241.715.3
Al9Cu1133.712.5
Sn-BCC207.4
Table 13. Elemental composition of the pseudo-phases in % atomic (at.) as identified using EDS measurements for the sample annealed at 200 °C.
Pseudo-PhaseFe [% at.]Si [% at.]Al [% at.]Cu [% at.]Sn [% at.]
Si/Fe28.6 ± 5.960.9 ± 6.95.9 ± 0.82.6 ± 0.70.3 ± 0.1
Si/Fe/Al28.9 ± 2.856.4 ± 2.111.8 ± 1.51.9 ± 0.30.8 ± 0.1
Al/Cu5.1 ± 1.86.7 ± 1.730.1 ± 8.256.6 ± 7.61.7 ± 0.9
Sn2.1 ± 0.42.4 ± 0.56.1 ± 0.96.7 ± 0.982.6 ± 2.6
Table 14. Phases identified in the multicomponent samples annealed at different temperatures.
TemperaturePhases
SimulationEDSEBSDXRD
1000FeSiFe/SiFeSiFeSi
Fe3Si7Si/Fe/AlFeSi2FeSi2
(FeSiAlCuSn) solutionAl/CuAlFeSiFe3Si
SnAlCuFeAl
SnAlCu
Si
Sn
800FeSiSi/FeFeSiFeSi
FeSi2Si/Fe/AlFeSi2FeSi2
Fe2SiAl2Cu/AlFe2SiFe3Si
(FeSiAlCuSn) solutionSi/Al/CuAlCuFe2Si
SnSnFeAl
AlCu
Si
Sn
590FeSiSi/FeFeSiFeSi
FeSi2Si/Fe/AlFeSi2FeSi2
FeSiAl2Si/Al/CuAlFeSiFe3Si
Al-Cu-Si-Sn (BCC) solid solutionSn/Si/Al/CuCu3SnFe3Al2Si3
(FeSiAlCuSn) solutionSnAlCuAl2Cu
SnCu3Sn
Si
Sn
450FeSiSi/FeFeSiFeSi
FeSi2Si/Fe/AlFeSi2FeSi2
FeSiAl2Al/CuAlFeSiFe3Si
Al9Cu11SnAlCuFe3Al2Si3
Sn solution SnAl9Cu11
Cu3Sn
Si
Sn
200FeSiSi/FeFeSiFeSi
FeSi2Si/Fe/AlFeSi2FeSi2
FeSiAl2Al/CuAlFeSiFe3Si
Al9Cu11SnAlCuFe3Al2Si3
Sn-BCC SnAl9Cu11
Cu3Sn
Cu6Sn5
Si
Sn
Disclaimer/Publisher’s Note: The statements, opinions and data contained in all publications are solely those of the individual author(s) and contributor(s) and not of MDPI and/or the editor(s). MDPI and/or the editor(s) disclaim responsibility for any injury to people or property resulting from any ideas, methods, instructions or products referred to in the content.