Article

Hot Deformation Behavior and Processing Maps of Vapor-Phase-Grown Carbon Nanofiber Reinforced 7075Al Composites

1
State Key Laboratory of Metastable Materials Science and Technology, Yanshan University, Qinhuangdao 066004, China
2
Hebei Key Lab for Optimizing Metal Product Technology and Performanced Technology, Yanshan University, Qinhuangdao 066004, China
3
Tangshan Gotion Battery Co., Ltd., Tangshan 063000, China
4
Department of Materials Science and Engineering, Kyushu Institute of Technology, Kitakyushu 8048550, Japan
5
Institute of Energy Resources, Hebei Academy of Sciences, Shijiazhuang 050051, China
*
Authors to whom correspondence should be addressed.
Metals 2024, 14(11), 1245; https://doi.org/10.3390/met14111245
Submission received: 1 October 2024 / Revised: 27 October 2024 / Accepted: 30 October 2024 / Published: 1 November 2024
(This article belongs to the Special Issue Numerical and Experimental Advances in Metal Processing)

Abstract

:
The present study prepared 7075Al composites reinforced with vapor-phase-grown carbon nanofibers (VGCNFs) using the spark plasma sintering (SPS) method. Constitutive equations of the composites were calculated, and thermal processing maps were constructed by performing thermal compression tests on the VGCNF/7075Al composites at deformation temperatures ranging from 300 to 450 °C and strain rates from 0.01 to 1 s−1. This study analyzed the microstructural evolution of the VGCNF/7075Al composites during the thermomechanical processing. The experimental results demonstrated that dynamic recrystallization (DRX) primarily governed the softening mechanism of VGCNF/7075Al composites during thermomechanical processing. At high strain rates, a combination of dynamic recovery (DRV) and DRX contributed to the softening behavior. The incorporation of VGCNFs results in higher dislocation density and a larger orientation deviation within the 7075Al matrix during the thermomechanical deformation process, providing stored energy that facilitated DRX. The activation energy for deformation of VGCNF/7075Al composites was 175.98 kJ/mol. The constitutive equation of the flow stress showed that a hyperbolic sinusoidal form could effectively describe the relationship between flow stress, strain, strain rate, and temperature of VGCNF/7075Al composites. The optimal thermomechanical deformation parameters for VGCNF/7075Al composites were 400–450 °C and 0.01–0.1 s−1 when the strain ranged from 0.05 to 0.15. For strains between 0.25 and 0.35, the optimal thermomechanical parameters were 380–430 °C and 0.01–1 s−1.

1. Introduction

As industry advances rapidly, lightweight materials have become a major focus in the aerospace and automotive sectors [1]. The ultrahigh-strength aluminum alloy 7075Al is widely used as a matrix for metal matrix composites due to its excellent processability, wear resistance, and corrosion resistance [2]. Composites with 7075Al as the matrix further enhance wear resistance, reduce the coefficient of thermal expansion, and maintain the high strength of the matrix. Currently, automotive brake disks, engine pistons, gearboxes, etc., primarily use these composites [3].
Shaping composites at room temperature is challenging due to reinforcement agglomeration and interfacial bonding [4]. High-temperature plastic processing not only enables the formation of parts with specific shapes but also improves mechanical properties and uniform reinforcement distribution [5]. Therefore, composites are typically processed at high temperatures [6]. The thermomechanical deformation conditions exert a significant influence on the thermal processing performance of composites, directly impacting product quality and yield rates [4,7]. Moreover, the microstructure evolution during thermomechanical processing of composites becomes notably more complex than that of pure aluminum alloys, owing to the addition of reinforcements. Hence, it is imperative to thoroughly investigate the deformation mechanisms and microstructure evolution of composites at high temperature through both theoretical research and practical engineering applications.
During the thermomechanical processing of composite materials, determining the flow stress under specified processing conditions is essential to assessing the suitability of selected parameters [8]. However, the variation in flow stress often exhibits considerable complexity [9]. The true stress–strain curve provides discrete data on the stress–strain relationship without offering additional experimental data. The high-temperature constitutive equation serves to quantitatively describe the relationship among flow stress, strain rate, deformation temperature, and strain [10]. Thus, establishing precise constitutive equations is critical for effectively guiding the practical processing and production of composites [7,11].
The deformation behavior at high temperature has an impact on the overall mechanical properties because it influences the microstructural changes in the material [12]. During thermal processing, materials must avoid the formation of various defects, where macro-defects can stem micro-defects or accumulate over time. Therefore, controlling the evolution of material microstructure during thermomechanical processing is critically important [13,14]. The development of thermal processing maps enables accurate prediction of material microstructure evolution under various deformation conditions, effectively preventing defects during thermal processing [15]. Therefore, utilizing thermal processing maps allows for optimization of material thermomechanical deformation processes, facilitating precise regulation of the material microstructure and enhancing overall thermal processing performance [1,8,11].
Current research on the deformation mechanism and thermal processing properties of composites prepared by SPS is limited, particularly regarding the influence of reinforcements on microstructure during thermomechanical processing. The present study focused on VGCNF/7075Al composites fabricated via SPS, examining the microstructural evolution of composites during thermomechanical processing and investigating the effect of VGCNFs on the high-temperature flow behavior of the composite. The true stress–strain curves of the composites were obtained through thermal compression testing at various strain rates and deformation temperatures. Constitutive equations for the composites were developed, and thermal processing maps were generated, providing a reference for setting reasonable thermal processing parameters for the materials.

2. Materials and Methods

The raw materials used in the present study were 7075Al alloy powder with a diameter of 1 to 10 μm from Beijing Xing-Rong Science and Technology Co., Ltd. (Beijing, China) and VGCNFs from Showa Denko Packaging Co., Ltd. in Tokyo, Japan. The diameters of the VGCNFs were between 150 and 200 nm and the lengths ranged from 100 to 200 μm. Figure 1a,b depict the morphology of these materials.
Initially, VGCNFs were introduced in an ethanol solution. Then, they were subjected to ultrasonic dispersion at a frequency of 45 Hz for 30 min. Subsequently, 7075Al powder was added to the solution of VGCNF and ethanol. Afterwards, this mixture was homogeneously stirred using ultrasonic-assisted mechanical stirring at 200 rpm for 30 min. Finally, the mixed solution was ball-milled in a tank using 10 mm-diameter alumina balls with a ball-to-powder ratio of 5:1 for a time interval of 18 h at a rotational speed of 80 rpm. After ball milling, the composite powder was dried to completely volatilize the ethanol, resulting in the mixed VGCNF/7075Al composite powder.
The composite powder was loaded into a rectangular graphite die measuring 65 mm × 15 mm × 12 mm. Sintering of this powder was carried out using an SPS-LABOX-650F machine (Sinter Land Inc., Nagaoka, Japan) at a sintering temperature of 550 °C under a pressure of 50 MPa.
Room temperature compression tests were conducted on a WDW-50E computer-controlled universal testing machine, with a compression rate of 0.001 s−1. To ensure the accuracy and repeatability of the experimental results, each set of compression tests was repeated three times. Additionally, the specimen size used for room temperature compression tests was consistent with that used in hot compression tests.
The thermal compression testing was conducted using a Thermecmaster-Z thermal simulation machine (Fuji Radio Machinery Co., Ltd., Tsurujima, Japan). The variations in testing temperatures were monitored using platinum-rhodium thermocouple wires soldered to the sides of the samples. The samples were cylindrical with dimensions of Ø6 mm × 9 mm. The thermal compression testing in the present study was performed at deformation temperatures of 300, 350, 400, and 450 °C, and at strain rates of 0.01, 0.1, and 1 s−1. Figure 1c schematically illustrates the thermal compression process and sample observation position.
Microstructural examination was conducted using a Thermo Fisher (Waltham, MA, USA) Verios G4 UC scanning electron microscope (SEM) equipped with an Oxford-Symmetry electron backscatter diffraction (EBSD) probe. The tests were performed at an acceleration voltage of 20 kV and a tilt angle of 70. The working distance was 18.5 mm, and the scanning step size was 0.4 μm.The AZtecCrystal Version 2.1 analysis software package was used for analyzing the EBSD patterns. A “clean-up” post-processing (clean up level 5) took place in one step for the unindexed pixels. The low-angle grain boundaries (LAGBs) and high-angle grain boundaries (HAGBs) were demarcated using misorientation angles of 2–10° and >10° [5]. EBSD samples were prepared using electrolytic polishing at a voltage of 20 V with a holding time of 70 s.

3. Results and Discussion

3.1. Effect of VGCNF on Mechanical Properties and Microstructure of Composites

Figure 2a illustrates the stress–strain curves obtained from compression tests of composite materials containing various volume fractions of VGCNF. The comparison of yield strength (σ0.2) of composites with different VGCNF volume fractions are shown in Figure 2b. As can be seen from Figure 2a,b, the yield strength of the composite material first increases and then decreases with the increase in VGCNF volume fraction. The yield strength of pure 7075Al is 249 MPa; when the VGCNF volume fraction is increased to 1%, the material’s yield strength reaches a maximum of 273 MPa. However, when the VGCNF volume fraction is increased to 5%, its yield strength is reduced by 6.8% compared to pure 7075Al, possibly due to the high content of VGCNF tending to aggregate at grain boundaries, leading to stress concentration and increasing the tendency for brittle fracture. When the VGCNF volume fraction is further increased to 10%, the yield strength of the composite significantly decreases, with the σ0.2 value being only 200 MPa.
Figure 3 presents the Kinematic Average Misorientation (KAM) maps of composite materials with different volume fractions of VGCNF. It is observed that VGCNF is primarily distributed near the grain boundaries and plays the role of pinning grain boundaries. The KAM values in the regions surrounding VGCNF are found to be larger than other regions in the composites. The KAM value is directly proportional to the dislocation density [16]; the higher the KAM value, the greater the dislocation density [16]. Comparative analysis reveals that the distribution of the reinforcement and dislocations is relatively uniform in the 1% VGCNF/7075Al composite material. However, when the volume fraction of the reinforcing phase increases to 5% and 10%, significant agglomeration of the reinforcement occurs. On one hand, due to the action of van der Waals forces, nanofibers are attracted to each other, which hinders their uniform distribution within the material. Additionally, an increase in the content of the reinforcement leads to a decrease in the flowability of the metal, causing the reinforcement to tend to form larger aggregates. Consequently, in 7075Al-based composite materials with a higher VGCNF content, this aggregation phenomenon is particularly evident. These large agglomerates not only weaken the interfacial bonding strength but also promote the formation of microcracks around them when the material is subjected to stress, thereby adversely affecting the overall performance of the composite material.
The uniformly dispersed VGCNFs within the material matrix exert a pinning effect on dislocations and grain boundaries, as well as having a role in load transfer, which contributes to the enhancement of the material’s tensile strength. However, an increase in the amount of VGCNFs leads to their aggregation, consequently resulting in a degradation of the composite material’s properties. Consequently, the performance of composite materials with a high-volume fraction of VGCNF is inferior to that of the 1% VGCNF/7075Al composite material. Since the mechanical properties and microstructure uniformity of 1%VGCNF/7075Al composites are better than those of composites with high VGCNF content, all subsequent discussions and analyses will focus on the 1%VGCNF/7075Al composite material as the research object.
For comparison, the yield strength is calculated using a composite material mixing criterion [17], and the corresponding formula is shown as follows:
σ = σ f V f + σ m V m
where σf is the strength of VGCNF, Vf is the volume fraction of VGCNF, σm is the yield strength of the matrix, and Vm is the volume fraction of VGCNF. In this study, the yield strength of VGCNF is taken as 3100 MPa. Through calculation, the values obtained by the composite criterion are all greater than the measured values. This is because the formula only reflects the most ideal state and does not account for factors such as the distortion of VGCNF, irregular arrangement, dispersion of the reinforcement, and the state of the matrix organization, which affect the performance.

3.2. High Temperature Flow Behavior of VGCNF/7075Al

Figure 4 illustrates the true stress–strain curves of VGCNF/7075Al composites derived at various strain rates and deformation temperatures. Initially, during the thermomechanical deformation process, the flow stress exhibited a linear increase with strain, highlighting a notable work-hardening effect. This stage was characterized by the generation of numerous dislocations due to the external force applied during the deformation process at a high temperature. The accumulation of these dislocations progressively impeded further dislocation movement, thereby causing a gradual increase in stress. Following the stress peak, the rate at which stress increased with strain decelerated, which was attributed to the annihilation and rearrangement of dislocations. The composite’s deformation storage energy increased as strain continued to advance. Once the deformation storage energy reached a critical threshold, dynamic softening commenced.
During deformation at high temperatures, there is a continual competition between dynamic softening and work-hardening, resulting in dynamic fluctuations in the stress–strain curve after the stress peak. At strain rates of 0.01 and 0.1 s−1, the dynamic softening mechanism predominated when the stress reached its peak, causing the flow stress to gradually decrease with increasing strain before stabilizing. This behavior is characterized by a true stress–strain curve typical of DRX. At a strain rate of 1 s−1, the stress did not exhibit a decreasing trend with increasing strain after reaching the peak. The true stress–strain curve displayed characteristics of dynamic recovery. This indicated that dynamic softening and work-hardening were in a state of dynamic equilibrium, resulting in a relatively flat true stress–strain curve after the stress reached its peak.

3.3. Constitutive Model and Hot Deformation Activation Energy of VGCNF/7075Al Composites

Currently, for describing the deformation behavior at a high temperature of metallic materials and metal matrix composites, it is common to employ empirical functions based on Arrhenius-type equations to model the relationship between strain rate, peak stress, and deformation temperature [18,19]:
ε ˙ = A F σ exp Q R T
where ε ˙ represents the strain rate, A denotes the structure factor, σ designates the peak stress, Q stands for the thermal deformation activation energy, R marks the molar gas constant, and T is the absolute temperature. F(σ) is a function that represents stress, with expressions provided for both high and low stress levels [20,21]:
F σ = σ n α σ < 0.8
F σ = exp β σ α σ > 1.2
F σ = sinh α σ n All   conditions
where n represents the stress index, α denotes the temperature coefficient stress level parameter (MPa−1), and β is the material parameter. α, β, and n are independent of temperature. They are mutually related as α = β/n.
Zener and Hollomon [22] have proposed a temperature-compensated strain rate factor Z to characterize the relationship between temperature, strain rate, and flow stress during deformation across all stress levels:
Z = ε ˙ exp Q R T = A sinh α σ n
Then, the flow stress, σ, could be expressed as a function of the Zener–Hollomon parameter, Z:
σ = 1 α Z A n + Z A 2 N + 1
Substituting Equations (3) and (4) into Equation (2), two equations were derived to calculate parameters α, β, and n.
ε ˙ = A 1 σ n exp Q R T α σ < 0.8
ε ˙ = A 2 exp β σ exp Q R T α σ > 1.2
Assuming the thermal deformation activation energy is independent of temperature and taking logarithms of both sides of Equations (8) and (9) yields:
ln ε ˙ = ln A 1 + nln σ Q R T
ln ε ˙ = ln A 2 + β σ Q R T
The stress values of VGCNF/7075Al composites at different deformation temperatures were used in Equations (10) and (11) to plot the relationship between flow stress and strain rate. The ln ε ˙ -σ and ln ε ˙ -lnσ curves are depicted in Figure 5a and Figure 5b, respectively. Linear fitting using the principles of least squares was applied to these curves. The slope of the ln ε ˙ -σ was denoted as β, while the slope of the ln ε ˙ -lnσ was designated as n. The stress level parameter α of the VGCNF/7075Al composite was calculated to be 0.0161 based on α = β/n1 [23]. Substituting the stress function (4), which applies under all conditions, into Equation (2) yielded:
ε ˙ = A [ s i n h ( α σ ) ] n e x p ( Q R T )
Taking logarithms of both sides of Equation (12) yielded:
ln ε ˙ = ln A Q R T + n ln sinh α σ
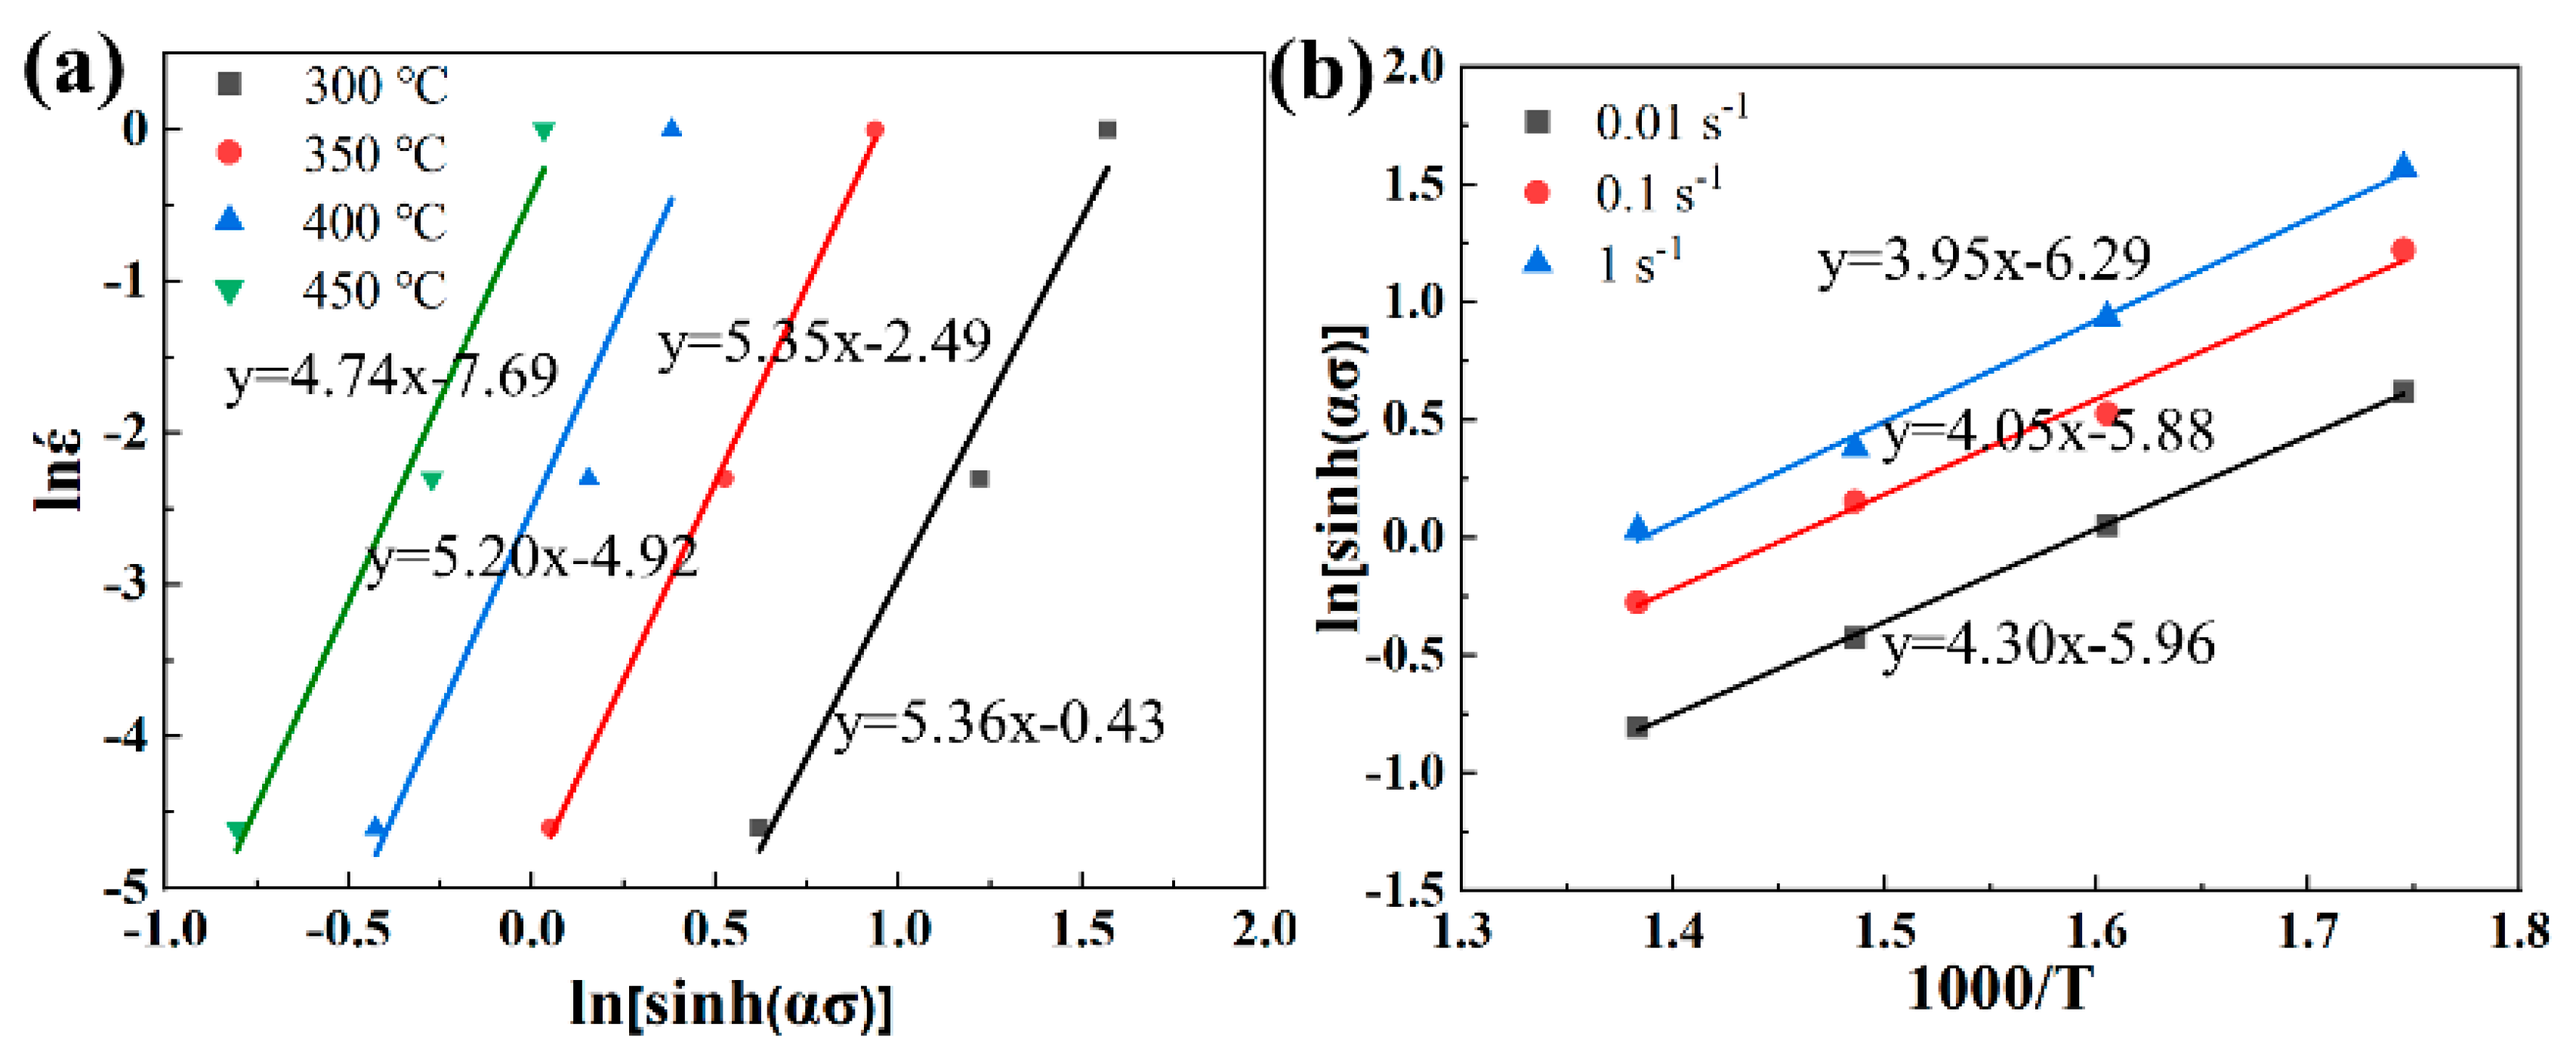
The ln ε ˙ - ln [ sin h α σ ] relationships were plotted as shown in Figure 6a. The slope obtained from the linear fit represented n. Equation (13) could be rewritten as:
ln sinh α σ = A + B 1000 T
where A =   ln ε ˙ ln A / n and B = Q / 1000 nR .
The variation in peak stress with deformation temperature for VGCNF/7075Al composites at different strain rates was substituted into Equation (14). The ln sin h α σ − 1000/T relationships were plotted, as depicted in Figure 6b, and the slope of the fitted curve, denoted as B′, was determined. Finally, the activation energy for deformation of VGCNF/7075Al composites was calculated to be 175.98 kJ/mol, which is higher than that of the 7075Al alloy, as shown in Table 1. The addition of VGCNF increased the activation energy of the composite material by 32.80%, enhancing its resistance to deformation. Furthermore, compared to other composite materials, the thermal activation energy of the VGCNF/7075Al composite material is at a mid-to-high level.
Taking the logarithm of both sides of Equation (6) simultaneously gave:
ln Z = ln ε ˙ + Q R T = ln A + n ln sinh α σ
The value of lnZ could be determined by substituting strain rate, ε ˙ , thermal activation energy, Q, and deformation temperature, T, into Equation (15). This provided the lnZ-ln[sinh(ασ)] relationships, as depicted in Figure 7. The slope of the linear fit to these relationships represented the stress index, n, while the intercept corresponded to lnA.
The constitutive equations for the VGCNF/7075Al composites were derived by substituting the values of each parameter into Equations (7) and (12) as follows:
ε ˙ = 3.56 × 10 12 sinh ( 0.0161 ) σ 5.14 exp 175980 / R T
σ = 1 0.0161 ln Z 3.56 × 10 14 1 5.14 + Z 3.56 × 10 14 2 5.14 + 1 1 2

3.4. Hot Processing Map of VGCNF/7075Al Composites

Dynamic material modeling (DMM) was used to establish a material’s steady state for reliable processing, enabling macroscopic characterization of flow and fracture toughness of under thermal processing conditions [27]. In the DMM model, energy calculations included the energy J, which accounted for microstructure evolution during plastic deformation, and the energy G, which represented the energy consumed due to the visco-plastic heat generated by plastic deformation. These calculations relied on simplified constitutive equations, where the flow stress was depended solely on the strain rate.
During thermomechanical processing, the energies P, G, and J, generated by the power source, were related by the following equation:
P = G + J = σ ε ˙ = 0 ε ˙ σ d ε ˙ + 0 σ ε ˙ d σ
where the relationship between G and J could be expressed by the following equation [28]:
J G = ε ˙ d σ σ d ε ˙ = ln σ ln ε ˙ = m
where m represents the strain rate sensitivity coefficient. There is no energy dissipation when m < 0. The material is in a steady state when 0 < m < 1. The system is in a linear dissipation state and the dissipation coefficient reaches its maximum value Jmax when m = 1. The system is in a high-energy state when m > 1. The dynamic structural equation for m is as follows [29]:
σ = K ε ˙ m
The strain rate sensitivity coefficient, m, is a critical mechanical parameter for evaluating the superplasticity of a material, indicating the sensitivity of the material’s flow stress to the strain rate during plastic deformation [29,30]. Coefficient m is related to J as follows:
J = P G = σ ε ˙ 0 ε ˙ K ε ˙ m d ε ˙ = m m + 1 σ ε ˙
Under the ideal linear dissipative state condition (m = 1), Jmax is:
J max = J m = 1 = 1 2 σ ε ˙
The proportionality between the energy dissipated for the microstructure evolution during the material-forming process and the linearly dissipated energy is characterized by the power dissipation efficiency, η, expressed as follows [31]:
η = J J max = 2 m m + 1
When η is higher, the material is more likely to deform. The power dissipation diagram is typically plotted for different deformation temperatures, strain rates, and strain levels. It allows for the analysis of the microstructural deformation mechanisms occurring during the plastic deformation of the material. It helps to identify the stable zone, unstable zone, and optimal processing zone.
Researchers in the field have proposed many stability determination criteria. Among these, the Prasad destabilization criterion is widely adopted and takes the following form [31,32]:
ξ ε ˙ = ln m m + 1 ln ε ˙ + m
where ξ( ε ˙ ) is the destabilization parameter. The region where ξ( ε ˙ ) < 0 is considered the destabilization zone, while the region where ξ( ε ˙ ) > 0 is considered the safety zone.
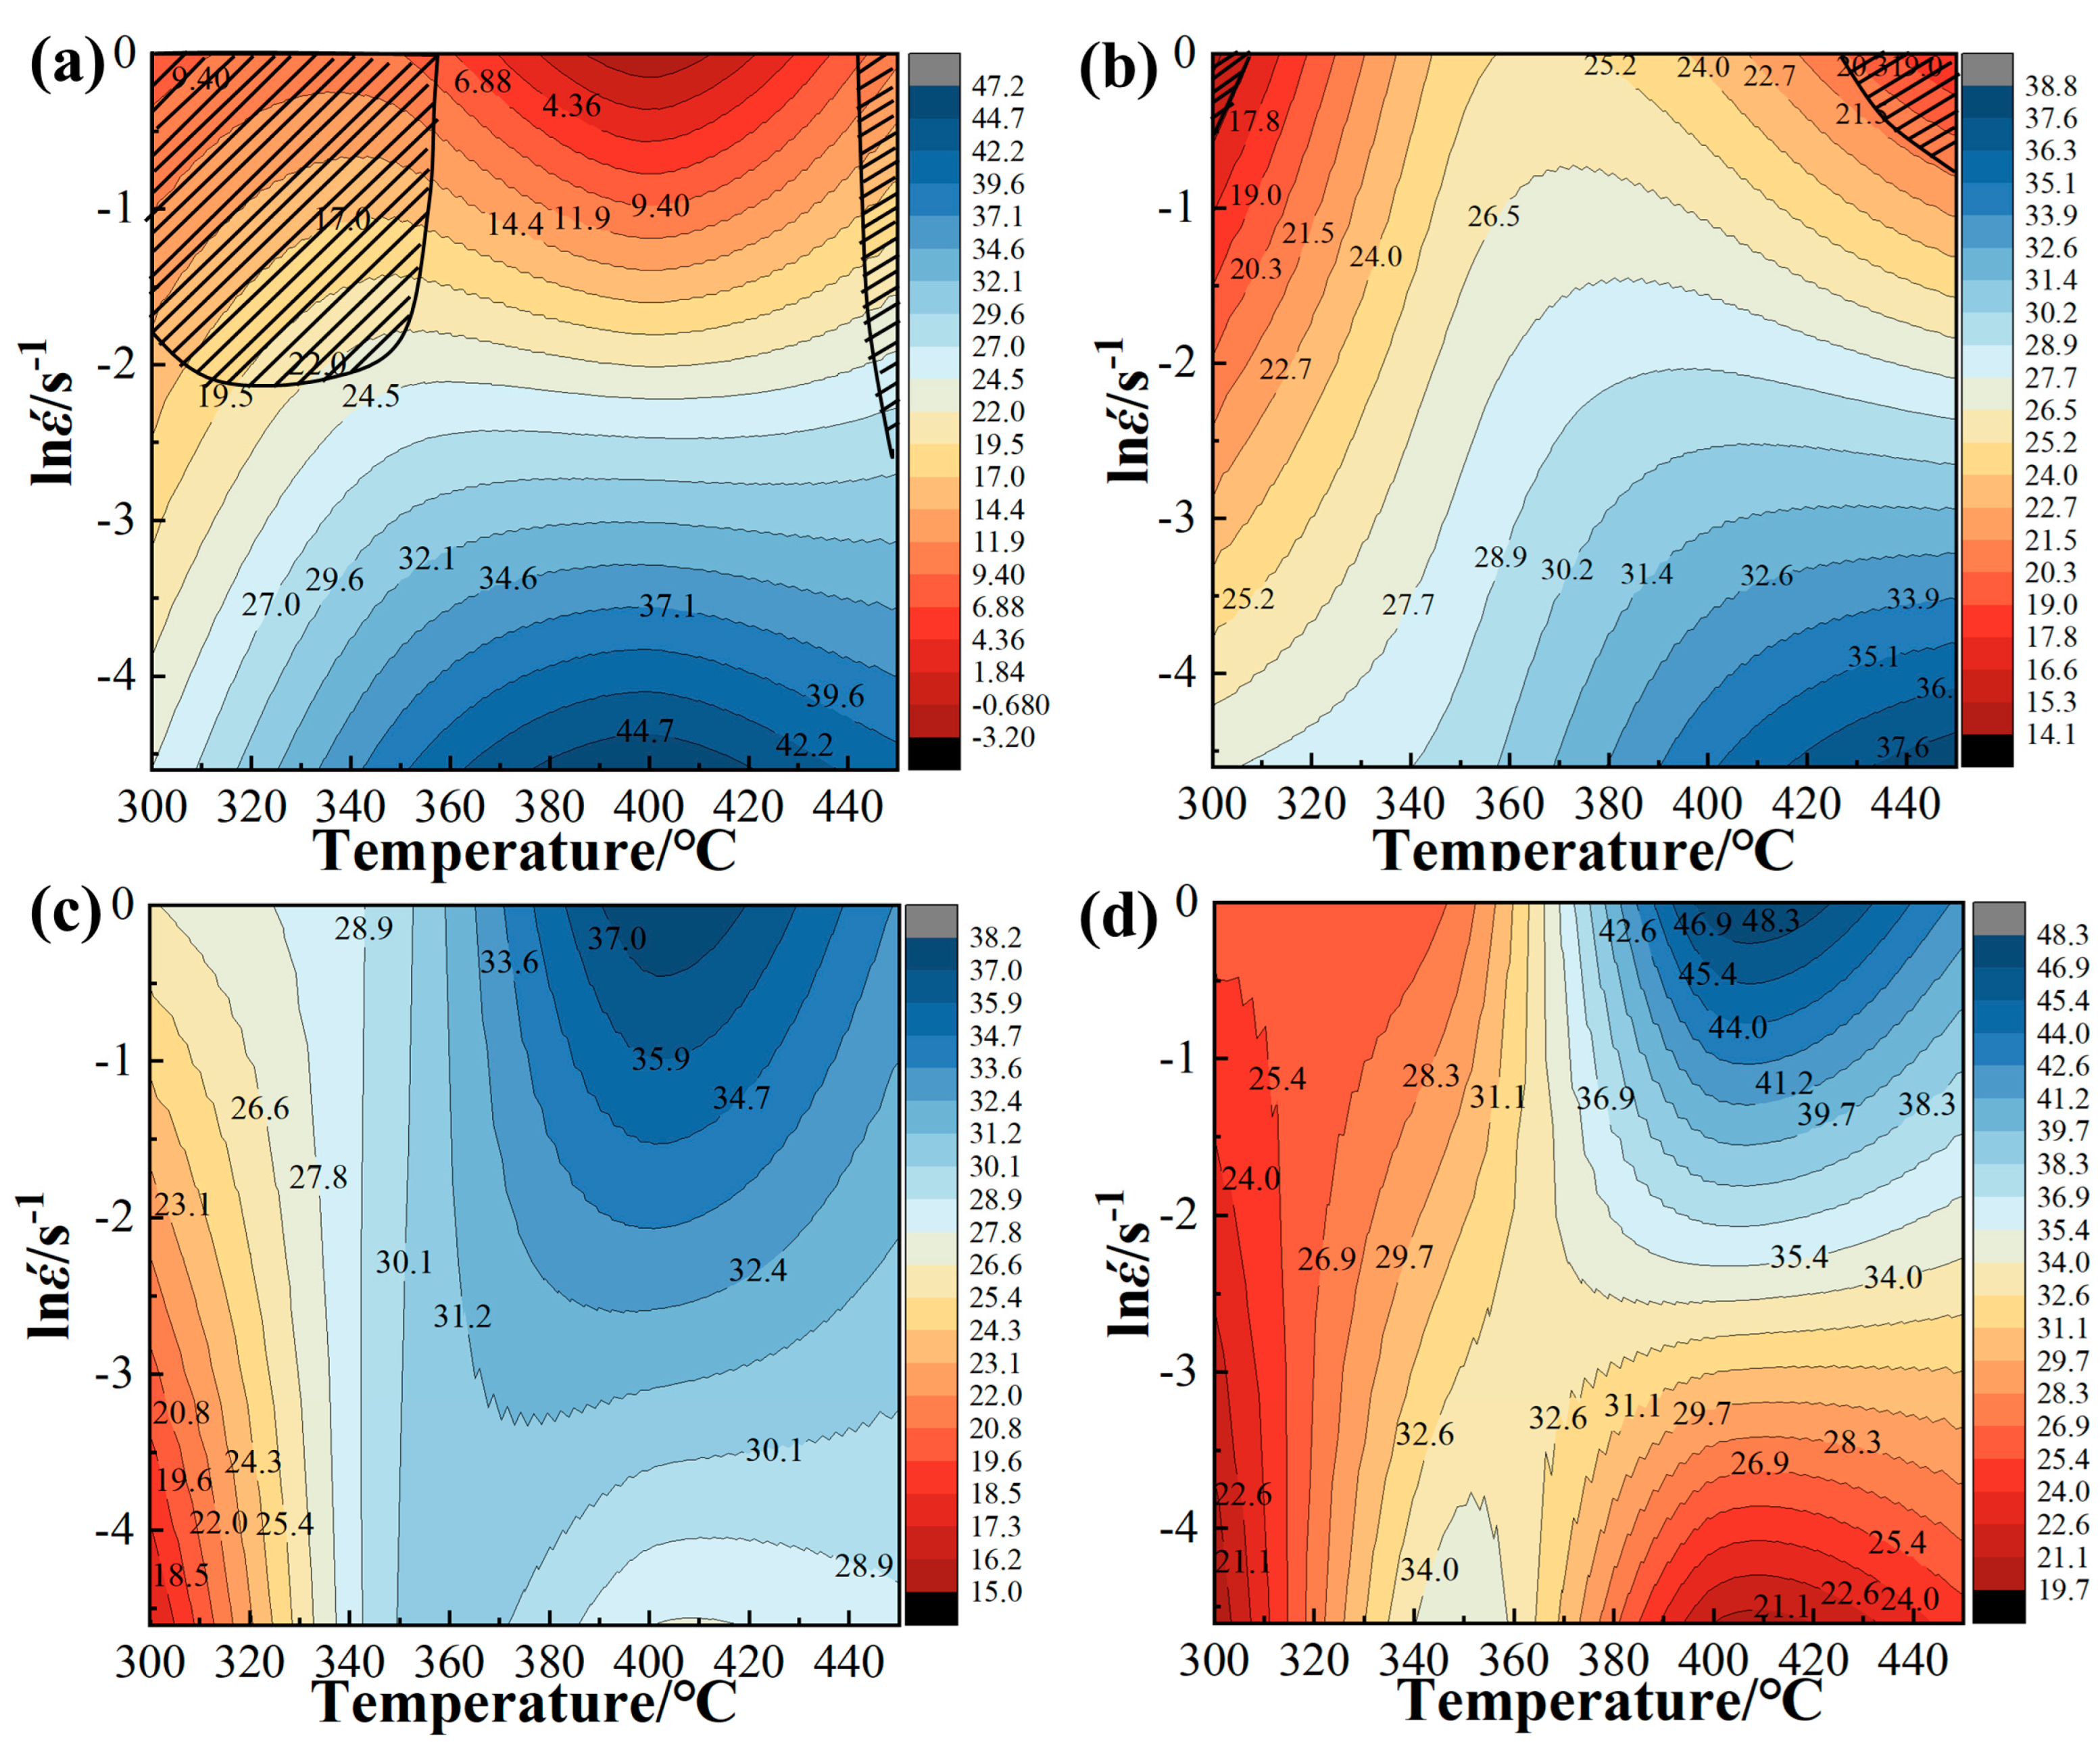
The construction of the thermal processing map relies on the power dissipation efficiency η and the instability criterion ξ( ε ˙ ) corresponding to each deformation condition. From Equations (23) and (24), it is evident that the calculation of both η and ξ( ε ˙ )depended on m. Therefore, the key to constructing the thermal processing maps was in solving m. The method of differences was employed to determine m at intermediate strains (0.05, 0.15, 0.25, and 0.35) based on peak stresses and strain rates at various deformation temperatures. This allowed for the calculation of η and ξ. Figure 8 illustrates the thermal processing maps of the VGCNF/7075Al composite, with the shaded area representing the destabilized region and the contour values indicating the power dissipation efficiency.
As depicted in Figure 8, the peak region of power dissipation efficiency shifted as the strain increased gradually from 0.05 to 0.35. The power dissipation efficiency of VGCNF/7075Al composites was relatively low in the destabilization zone and higher in the safe zone. Within the safe zone, the power dissipation efficiency increased progressively with higher deformation temperatures.
When the strain was 0.05, the VGCNF/7075Al’s power dissipation efficiency was highest in the high-temperature, low-strain-rate region. The destabilization zone was primarily concentrated in the high-strain-rate regions at 300–350 °C and 430–450 °C. As the strain increased to 0.15, the area of the destabilization zone significantly decreased compared to the 0.05 strain. By the time the strain reached 0.25, the destabilization zone disappeared entirely, whereas the region of high-power dissipation efficiency shifted gradually from the high-temperature, low-strain-rate zone to the high-temperature, high-strain-rate zone. The region of high-power dissipation efficiency at 0.35 strain was similar to that at 0.25 strain, with both concentrated in the high-strain-rate zone ranging from 380 to 430 °C. Therefore, the shift in the power dissipation efficiency zone in VGCNF/7075Al composites primarily occurred between 0.15 and 0.25 strains.
The best thermomechanical deformation parameters for VGCNF/7075Al composites were found by choosing high power dissipation efficiency values that were within the safety zone [30]. They were as follows: For strains ranging from 0.05 to 0.15, the recommended conditions were between 400 and 450 °C at strain rates of 0.01 to 0.1 s−1. When strains were between 0.25 and 0.35, the optimal parameters were between 380 and 430 °C at strain rates ranging from 0.01 to 1 s−1.

3.5. Microstructure Evolution of VGCNF/7075Al Composites During Thermomechanical Eformation

The deformation mechanisms represented by different regions in the thermal processing diagrams vary according to the corresponding deformation conditions. In the safe region, the predominant deformation mechanisms include DRV, DRX, and superplastic deformation [32]. Therefore, after determining the theoretical deformation safety and instability zones for VGCNF/7075Al composites from thermal processing diagrams, it was essential to validate these findings through microstructural examination.
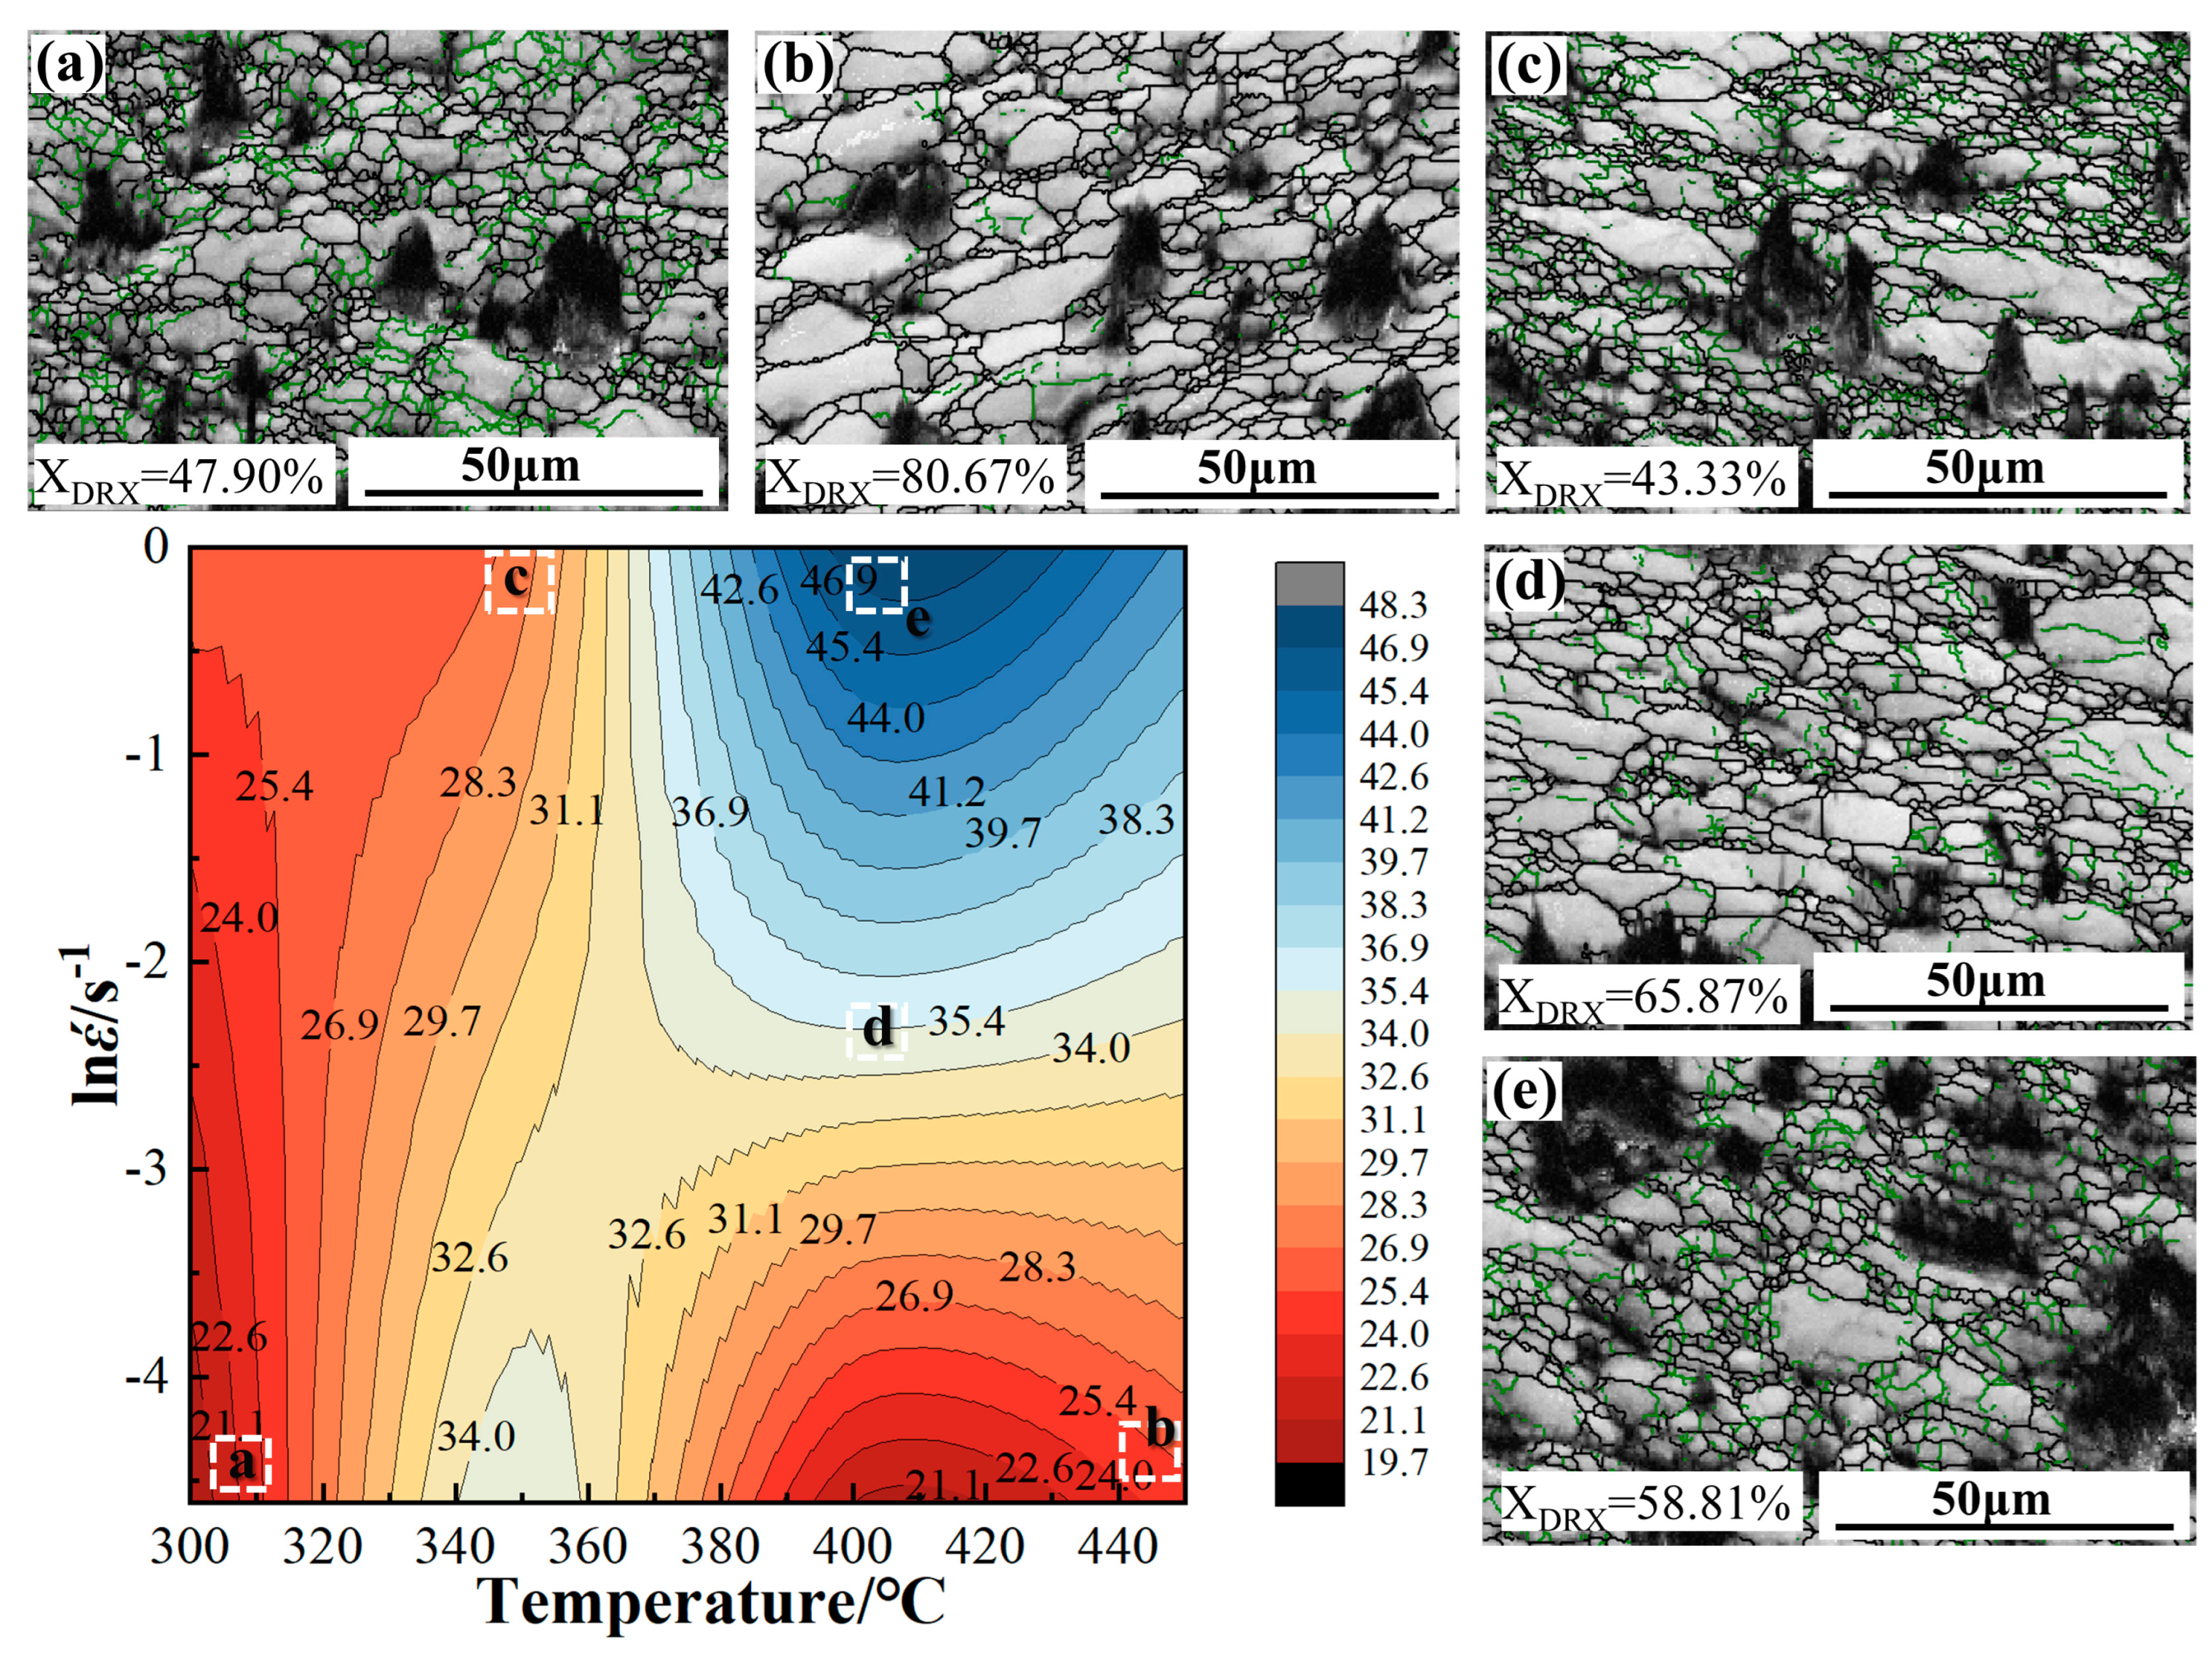
To explore the evolution of microstructures across various power dissipation efficiency zones, observations were conducted on the microstructure under different power dissipation efficiency regions, and the DRX volume fraction (XDRX) was statistically analyzed, as depicted in Figure 9. In the figure, the green line represents LAGBs, while the black line denotes high-angle grain boundaries HAGBs. The XDRX was statistically determined using grain orientation spread (GOS) maps, as illustrated in Figure 10. In this analysis, a GOS angle of 2° served as the threshold value to differentiate between DRX grains from deformed grains [33,34].
Figure 9 illustrates the microstructure of VGCNF/7075Al composites across different power dissipation efficiency regions, labeled as regions a to e. These regions showed a sequential increase in power dissipation efficiency values, with the maximum efficiency reaching 48.30%.
Regions a (300 °C/0.01 s−1) and b (450 °C/0.01 s−1) fell within the low power dissipation region. The power dissipation efficiency for region a was measured at 21.0%. In these regions, the original microstructure of the VGCNF/7075Al composites was visibly transformed into numerous fine equiaxed grains without strain(see Figure 10a), indicating the occurrence of DRX under these specific deformation conditions [35]. Here, the new grains form as a result of the increase in sub-boundary misorientation brought about by continuous accumulation of the dislocations introduced by the deformation [36]. Region b exhibited a slightly higher power dissipation efficiency of 24.0%. It was indicated that DRX grains increased in size with higher deformation temperature at the same strain rate. Specifically, XDRX in region b was found to be 68.4% higher than in region a. The high XDRX in the low-power dissipation region indicated that the incorporation of VGCNFs promoted DRX behavior in the composites, enabling DRX even at relatively low power dissipation efficiencies. In the low power dissipation region (21.0–24.0%), the softening mechanism of VGCNF/7075Al composites was predominantly governed by DRX.
Region c (350 °C/1 s−1) exhibited a power dissipation efficiency of 28.0%, placing it within the medium power dissipation region. Under these deformation conditions, the microstructure exhibited elongated grains, with numerous fine equiaxed crystals dispersed around the deformed grains and VGCNFs. The absence of LAGB within most equiaxed grains indicates that LAGB in these regions has been converted to HAGB by subgrain rotation [36,37]. XDRX was the lowest at 43.3% compared to other deformation conditions. Additionally, a high density of LAGBs was observed under this deformation condition. The combination of a higher strain rate and a lower deformation temperature in this condition resulted in reduced thermal activation energy and atomic diffusion energy, which in turn limited the plastic flow ability of the alloy matrix [38]. This limitation hindered coordinated deformation at the interface between VGCNFs and the 7075Al matrix, ultimately leading to stress concentration and the aggregation of numerous LAGBs. Combined with the flow stress curves in Figure 4, it can be inferred that the softening mechanism in the medium power dissipation region involved a combination of DRV and DRX, with DRV playing a predominant role.
Regions d (400 °C/0.01 s−1) and e (400 °C/1 s−1) were categorized within the high-power dissipation region (35.0–48.0%). Upon comparing these regions, it was observed that the density of LAGBs decreased gradually with decreasing strain rate at the same deformation temperature. Additionally, the DRX grain size increased noticeably at lower strain rates compared to higher strain rates under these conditions. This phenomenon arose because high temperatures and low strain rates provided ample thermal energy and sufficient time for dislocations and atoms to migrate, gradually transforming LAGBs into HAGBs. Additionally, the lower strain rate allowed for more extensive growth of DRX grains, facilitating more complete DRX.
Figure 10a–e show the GOS maps of different power dissipation regions, with LAGBs marked by white lines and HAGBs marked by black lines. The blue grains in the figure represented recrystallized grains, primarily distributed around the VGCNFs and deformed grain boundaries. Additionally, some large grains with high GOS value around the VGCNFs contained a high density of LAGBs, as highlighted in the white boxes in Figure 10a–e. This indicated that adding VGCNFs resulted in a higher dislocation density and a greater orientation deviation of the 7075Al matrix during thermomechanical deformation. The increased dislocation density in the regions around VGCNFs served as stored energy to drive DRX. Consequently, DRX occurred preferentially around the VGCNFs.

4. Conclusions

The present study used SPS to prepare VGCNF/7075Al composites. Thermal compression testing was conducted on these composites under various deformation conditions. From these tests, the constitutive equations and thermal processing maps for the VGCNF/7075Al composites were developed. The specific conclusions are as follows:
(1)
The high-temperature flow behavior of VGCNF/7075Al could be described by a hyperbolic sine function with a characteristic stress constitutive equation:
ε ˙ = 3.56 × 10 12 sinh ( 0.0161 ) σ 5.14 exp 175980 / R T
The activation energy for deformation of VGCNF/7075Al composites was 175.98 kJ/mol.
(2)
A dynamic material model was used to make the processing maps for VGCNF/7075Al composites. These maps showed two main flow destabilization zones at strains of 0.05, 0.15, 0.25, and 0.35. These zones were primarily found in the low-temperature, high-strain-rate region and the high-temperature, high-strain-rate region at strains of 0.05–0.15. As the strain increased, the area of the destabilization zone decreased.
(3)
At a strain of 0.35, VGCNF/7075Al composites achieved a maximum power dissipation efficiency of 48.30%. Following the principle of selecting high power dissipation efficiency within the safety zone, the optimal thermomechanical deformation parameters for strains of 0.05 to 0.15 were 400–450 °C and 0.01–0.1 s−1. For strains of 0.25 to 0.35, the optimal thermomechanical deformation parameters were 380–430 °C and 0.01–1 s−1.
(4)
The flow stress in VGCNF/7075Al composites decreased with increasing deformation temperature and increased with increasing strain rate. During thermomechanical deformation, these composites demonstrated clear, dynamic softening characteristics. The primary softening mechanism was attributed to DRX, while DRV and DRX contributed together at high strain rates.
(5)
Incorporating VGCNFs into the composites promoted DRX. The addition of VGCNFs resulted in higher dislocation densities and greater orientation deviations in the matrix during deformation. These higher dislocation densities in the deformation zones near VGCNFs served as stored energy that drove DRX process.

Author Contributions

Conceptualization, Z.X. and S.M.; data curation, M.Z., J.W. and C.T.; formal analysis, Z.X. and J.G.; funding acquisition, Z.X.; investigation, M.Z.; methodology, M.Z. and Z.X.; project administration, Z.X. and J.Y.; software, J.W. and C.T.; supervision, C.T., J.G. and J.Y.; resources, J.Y.; validation, S.M.; visualization, J.W. and J.Y.; writing—original draft, M.Z.; writing—review and editing, Z.X. All authors have read and agreed to the published version of the manuscript.

Funding

This work was supported by the Natural Science Foundation of Hebei Province under Grant No. E2020203158, Hebei Province Department of Human Resources and Social Security under Grant No. E2020100006, Hebei Province Innovation Ability Promotion Project under Grant No. 22567609H, Central Government-Guided Local Science and Technology Development Fund Project under Grant No. 246Z1026G, Ministry of Education’s “Chunhui Program” Collaborative Research Project under Grant No. HZKY20220244, and the Science and Technology Plan Project of Hebei Academy of Sciences under Grant No. 24704.

Data Availability Statement

The original contributions presented in this study are included in the article. Further inquiries can be directed to the corresponding authors.

Conflicts of Interest

Author Junhua Wu was employed by the company Tangshan Gotion Battery Co., Ltd. The remaining authors declare that the research was conducted in the absence of any commercial or financial relationships that could be construed as a potential conflict of interest.

References

  1. Xia, Y.; Kuang, Z.; Sun, Y.; Zhu, P.; Ju, B.; Chen, G.; Yang, W.; Wu, G. Hot Deformation Behavior of Recycled-Be/2024Al Composites Prepared by Pressure Infiltration Method. J. Mater. Res. Technol. 2024, 32, 2780–2791. [Google Scholar] [CrossRef]
  2. Samal, P.; Vundavilli, P.R.; Meher, A.; Mahapatra, M.M. Recent Progress in Aluminum Metal Matrix Composites: A Review on Processing, Mechanical and Wear Properties. J. Manuf. Process. 2020, 59, 131–152. [Google Scholar] [CrossRef]
  3. Dursun, T.; Soutis, C. Recent Developments in Advanced Aircraft Aluminium Alloys. Mater. Des. 2014, 56, 862–871. [Google Scholar] [CrossRef]
  4. El-Sabbagh, A.; Soliman, M.; Taha, M.; Palkowski, H. Hot Rolling Behaviour of Stir-Cast Al 6061 and Al 6082 Alloys—SiC Fine Particulates Reinforced Composites. J. Mater. Process. Technol. 2012, 212, 497–508. [Google Scholar] [CrossRef]
  5. Xie, K.; Cai, B.; Zhang, G.; Shi, Y.; Li, M.; Huang, H.; Huang, J.; Zhou, W.; Liu, Z. High-Strength Al Matrix Composites Reinforced with Uniformly Dispersed Nanodiamonds. J. Alloys Compd. 2022, 898, 162917. [Google Scholar] [CrossRef]
  6. Sahoo, B.N.; Panigrahi, S.K. Deformation Behavior and Processing Map Development of AZ91 Mg Alloy with and without Addition of Hybrid In-Situ TiC+TiB2 Reinforcement. J. Alloys Compd. 2019, 776, 865–882. [Google Scholar] [CrossRef]
  7. Wang, Z.; Zhang, Q.; Fu, L.; Shao, P.; Zhou, Y.; Zhu, P.; Su, H.; Wu, G. Hot Deformation Behavior and Microstructure Evolution of Flaky Ti3AlC2 Particles Reinforced Pure Al Composite. J. Alloys Compd. 2022, 927, 167118. [Google Scholar] [CrossRef]
  8. Ma, Z.; Zhou, M.; Li, H.; Jing, K.; Zhang, J.; Tian, B.; Zhang, Y.; Li, X.; Hu, H.; Volinsky, A.A. Effects of Y2O3 on the Hot Deformation Behavior and Microstructure Evolution of Al2O3-Cu/35Cr3TiB2 Electrical Contact Composites. Mater. Charact. 2024, 215, 114120. [Google Scholar] [CrossRef]
  9. Qin, J.; Zhang, Z.; Chen, X.-G. Hot Deformation and Processing Maps of Al-15%B4C Composites Containing Sc and Zr. J. Mater. Eng. Perform 2017, 26, 1673–1684. [Google Scholar] [CrossRef]
  10. Cai, J.; Wang, K.; Zhai, P.; Li, F.; Yang, J. A Modified Johnson-Cook Constitutive Equation to Predict Hot Deformation Behavior of Ti-6Al-4V Alloy. J. Mater. Eng. Perform. 2014, 24, 32–44. Available online: https://link.springer.com/article/10.1007/s11665-014-1243-x (accessed on 30 April 2024). [CrossRef]
  11. Jiang, M.; Wu, Y.; Nie, J.; Chen, Y.; Fan, Y.; Liu, X.; Zhao, Y. Revealing the Ultra-High High-Temperature Compressive Mechanical Properties and Deformation Mechanism of a Heterostructured AlNp/Al Nanocomposite. Mater. Sci. Eng. A 2023, 878, 145199. [Google Scholar] [CrossRef]
  12. Ma, K.; Liu, Z.Y.; Zhang, X.X.; Xiao, B.L.; Ma, Z.Y. Hot Deformation Behavior and Microstructure Evolution of Carbon Nanotube/7055Al Composite. J. Alloys Compd. 2021, 854, 157275. [Google Scholar] [CrossRef]
  13. Li, B.; Pan, Q.; Zhang, Z.; Li, C. Characterization of Flow Behavior and Microstructural Evolution of Al–Zn–Mg–Sc–Zr Alloy Using Processing Maps. Mater. Sci. Eng. A 2012, 556, 844–848. [Google Scholar] [CrossRef]
  14. Lakshmi, A.A.; Rao, C.S.; Gangadhar, J.; Srinivasu, C.; Singh, S.K. Review of Processing Maps and Development of Qualitative Processing Maps. Mater. Today Proc. 2017, 4, 946–956. [Google Scholar] [CrossRef]
  15. Prasad, Y.V.R.K. Processing Maps: A Status Report. J. Mater. Eng. Perform. 2003, 12, 638–645. [Google Scholar] [CrossRef]
  16. Chen, X.-M.; Lin, Y.C.; Wen, D.-X.; Zhang, J.-L.; He, M. Dynamic Recrystallization Behavior of a Typical Nickel-Based Superalloy during Hot Deformation. Mater. Des. 2014, 57, 568–577. [Google Scholar] [CrossRef]
  17. Jamir, M.R.M.; Majid, M.S.A.; Khasri, A. 8—Natural Lightweight Hybrid Composites for Aircraft Structural Applications. In Sustainable Composites for Aerospace Applications; Jawaid, M., Thariq, M., Eds.; Woodhead Publishing Series in Composites Science and Engineering; Woodhead Publishing: Cambridge, UK, 2018; pp. 155–170. ISBN 978-0-08-102131-6. [Google Scholar]
  18. McQueen, H.J.; Ryan, N.D. Constitutive Analysis in Hot Working. Mater. Sci. Eng. A 2002, 322, 43–63. [Google Scholar] [CrossRef]
  19. Li, H.; Wang, H.; Zeng, M.; Liang, X.; Liu, H. Forming Behavior and Workability of 6061/B4CP Composite during Hot Deformation. Compos. Sci. Technol. 2011, 71, 925–930. [Google Scholar] [CrossRef]
  20. Gourdet, S.; Montheillet, F. An Experimental Study of the Recrystallization Mechanism during Hot Deformation of Aluminium. Mater. Sci. Eng. A 2000, 283, 274–288. [Google Scholar] [CrossRef]
  21. Cerri, E.; Spigarelli, S.; Evangelista, E.; Cavaliere, P. Hot Deformation and Processing Maps of a Particulate-Reinforced 6061 + 20% Al2O3 Composite. Mater. Sci. Eng. A 2002, 324, 157–161. [Google Scholar] [CrossRef]
  22. Chen, Z.; Sun, G.A.; Wu, Y.; Mathon, M.H.; Borbely, A.; Chen, D.; Ji, G.; Wang, M.L.; Zhong, S.Y.; Wang, H.W. Multi-Scale Study of Microstructure Evolution in Hot Extruded Nano-Sized TiB2 Particle Reinforced Aluminum Composites. Mater. Des. 2017, 116, 577–590. [Google Scholar] [CrossRef]
  23. Sun, Z.; Li, Y.; Zhang, K.; Li, X.; Ma, M.; Shi, G.; Yuan, J.; Zhang, H. Microstructure and Hot Deformation Behavior of the Mg–8 Wt.% Sn–1.5 Wt.% Al Alloy. Materials 2021, 14, 2050. [Google Scholar] [CrossRef]
  24. Liu, M.; Shan, Z.; Li, X.; Zang, Y. Hot Tensile Deformation Behavior and Microstructure Evolution of 7075 Aluminum Alloy Sheet. J. Mater. Res. Technol. 2023, 24, 724–736. [Google Scholar] [CrossRef]
  25. Wang, H.; Zhang, H.; Cui, Z.; Chen, Z.; Chen, D. Compressive Response and Microstructural Evolution of In-Situ TiB2 Particle-Reinforced 7075 Aluminum Matrix Composite. Trans. Nonferrous Met. Soc. China 2021, 31, 1235–1248. [Google Scholar] [CrossRef]
  26. Huang, C.C.; Qi, L.; Chen, J.; Guan, R.; Ojo, O.A.; Wang, Z.G. Effect of TiC Nanoparticles on the Hot Deformation Behavior of AA7075 Aluminum Alloy. Mater. Charact. 2021, 181, 111508. [Google Scholar] [CrossRef]
  27. Che, B.; Lu, L.; Kang, W.; Luo, J.; Ma, M.; Liu, L. Hot Deformation Behavior and Processing Map of a New Type Mg-6Zn-1Gd-1Er Alloy. J. Alloys Compd. 2021, 862, 158700. [Google Scholar] [CrossRef]
  28. Cavaliere, P.; Cerri, E.; Leo, P. Hot Deformation and Processing Maps of a Particulate Reinforced 2618/Al2O3/20p Metal Matrix Composite. Compos. Sci. Technol. 2004, 64, 1287–1291. [Google Scholar] [CrossRef]
  29. Wu, Y.; Zhang, M.; Xie, X.; Dong, J.; Lin, F.; Zhao, S. Hot Deformation Characteristics and Processing Map Analysis of a New Designed Nickel-Based Alloy for 700 °C A-USC Power Plant. J. Alloys Compd. 2016, 656, 119–131. [Google Scholar] [CrossRef]
  30. Li, Y.-L.; Wang, W.-X.; Zhou, J.; Chen, H.-S. Hot Deformation Behaviors and Processing Maps of B4C/Al6061 Neutron Absorber Composites. Mater. Charact. 2017, 124, 107–116. [Google Scholar] [CrossRef]
  31. Prasad, Y.V.R.K.; Gegel, H.L.; Doraivelu, S.M.; Malas, J.C.; Morgan, J.T.; Lark, K.A.; Barker, D.R. Modeling of Dynamic Material Behavior in Hot Deformation: Forging of Ti-6242. Metall. Mater. Trans. A 1984, 15, 1883–1892. [Google Scholar] [CrossRef]
  32. Shao, J.C.; Xiao, B.L.; Wang, Q.Z.; Ma, Z.Y.; Liu, Y.; Yang, K. Constitutive Flow Behavior and Hot Workability of Powder Metallurgy Processed 20 Vol.%SiCP/2024Al Composite. Mater. Sci. Eng. A 2010, 527, 7865–7872. [Google Scholar] [CrossRef]
  33. Field, D.P.; Bradford, L.T.; Nowell, M.M.; Lillo, T.M. The Role of Annealing Twins during Recrystallization of Cu. Acta Mater. 2007, 55, 4233–4241. [Google Scholar] [CrossRef]
  34. Choi, H.-N.; Choi, J.-W.; Kang, H.; Fujii, H.; Lee, S.-J. Effect of Stacking-Fault Energy on Dynamic Recrystallization, Textural Evolution, and Strengthening Mechanism of Fe−Mn Based Twinning-Induced Plasticity (TWIP) Steels during Friction-Stir Welding. J. Adv. Join. Process. 2024, 10, 100236. [Google Scholar] [CrossRef]
  35. Huang, K.; Logé, R.E. A Review of Dynamic Recrystallization Phenomena in Metallic Materials. Mater. Des. 2016, 111, 548–574. [Google Scholar] [CrossRef]
  36. Sakai, T.; Belyakov, A.; Kaibyshev, R.; Miura, H.; Jonas, J.J. Dynamic and Post-Dynamic Recrystallization under Hot, Cold and Severe Plastic Deformation Conditions. Prog. Mater. Sci. 2014, 60, 130–207. [Google Scholar] [CrossRef]
  37. Mandal, S.; Bhaduri, A.K.; Subramanya Sarma, V. A Study on Microstructural Evolution and Dynamic Recrystallization During Isothermal Deformation of a Ti-Modified Austenitic Stainless Steel. Met. Mater Trans. A 2011, 42, 1062–1072. [Google Scholar] [CrossRef]
  38. Shiming, H.; Jingpei, X.; Aiqin, W.; Wenyan, W.; Jiwen, L. Hot Deformation Behavior and Processing Map of SiCp/2024Al Composite. Rare Met. Mater. Eng. 2014, 43, 2912–2916. [Google Scholar] [CrossRef]
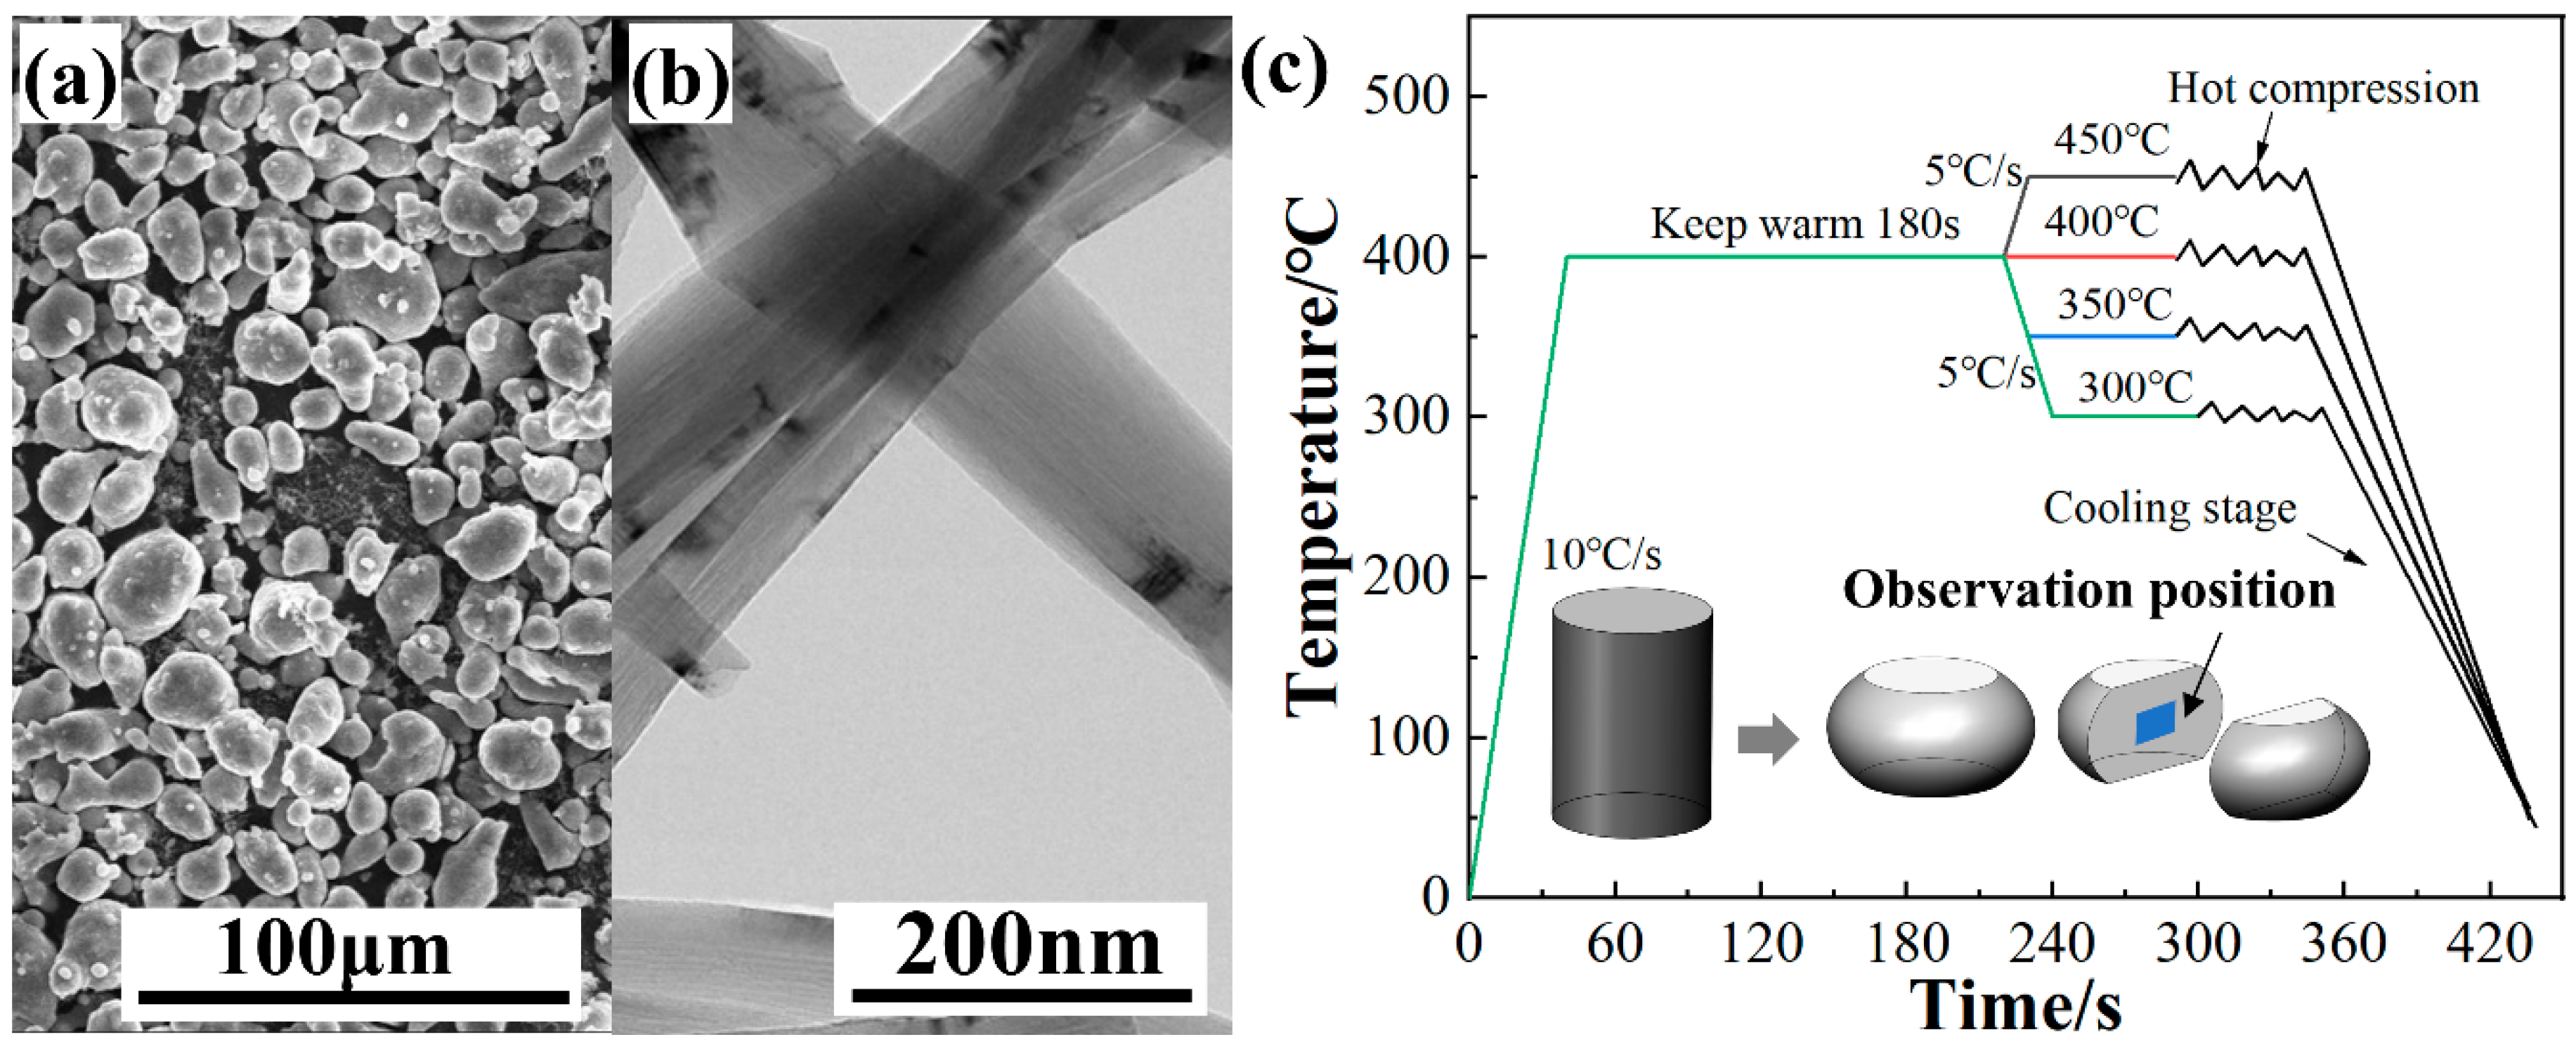
Figure 1. Microstructure of (a) 7075Al powder and (b) VGCNFs; (c) schematic presentation of thermal compression process.
Metals 14 01245 g001
Figure 2. (a) Compressive stress–strain curves of composites with different VGCNF volume fractions. (b) Comparison of yield strength of composites with different VGCNF volume fractions.
Metals 14 01245 g002
Figure 3. KAM maps of VGCNF/7075Al composite with different volume fractions of VGCNF: (a) Pure 7075Al; (b) 1%; (c) 5%; (d) 10%.
Metals 14 01245 g003
Figure 4. True stress–strain curves of VGCNF/7075Al composites obtained at different deformation temperatures (300–450 °C) and different strain rates: (a) 0.01 s−1; (b) 0.1 s−1; (c) 1 s−1.
Metals 14 01245 g004
Figure 5. (a) ln ε ˙ -σ relationships and (b) ln ε ˙ -lnσ relationships for VGCNF/7075Al composites.
Metals 14 01245 g005
Figure 6. (a) ln ε ˙ -ln[sinh(ασ)] relationships and (b) ln[sinh(ασ)]-1000/T relationships for VGCNF/7075Al composites.
Metals 14 01245 g006
Figure 7. lnZ-ln[sinh(ασ)] relationship for VGCNF/7075Al composites.
Metals 14 01245 g007
Figure 8. Thermal processing maps of VGCNF/7075Al composites at different strains: (a) 0.05, (b) 0.15, (c) 0.25, and (d) 0.35.
Metals 14 01245 g008
Figure 9. Microstructure of VGCNF/7075Al composites in different power dissipation regions: (a) 300 °C/0.01 s−1, (b) 450 °C/0.01 s−1, (c) 350 °C/1 s−1, (d) 400 °C/0.1 s−1, and (e) 400 °C/1 s−1.
Metals 14 01245 g009
Figure 10. GOS maps of VGCNF/7075Al under different deformation conditions: (a) 300 °C/0.01s−1, (b) 450 °C/0.01 s−1, (c) 350 °C/1 s−1, (d) 400 °C/0.1 s−1, (e) 400 °C/1 s−1; (f) statistical plot of the percentage of LAGBs and HAGBs under different deformation conditions.
Metals 14 01245 g010
Table 1. Comparison of thermal activation energy of aluminum alloys and composites.
MaterialsThermal Activation Energy (kJ/mol)
VGCNF/7075Al175.98
7075Al [24]132.52
In situ TiB2/7075Al [25]139.97
TiC/7075Al [26]190.37
Disclaimer/Publisher’s Note: The statements, opinions and data contained in all publications are solely those of the individual author(s) and contributor(s) and not of MDPI and/or the editor(s). MDPI and/or the editor(s) disclaim responsibility for any injury to people or property resulting from any ideas, methods, instructions or products referred to in the content.