Article

Design of New Energy-Absorbing Lattice Cell Configuration by Dynamic Topology Optimization

by
Yongxin Li
1,
Qinghua Li
1,
Xingxing He
1,†,
Shenshan Li
2 and
Yongle Wang
1,*
1
Hebei Heavy Intelligent Manufacturing Equipment Technology Innovation Center, School of Mechanical Engineering, Yanshan University, Qinhuangdao 066000, China
2
School of Mechanical Engineering, School of Shijiazhuang Tiedao University, Shijiazhuang 050043, China
*
Author to whom correspondence should be addressed.
Current address: XCMG Special Construction Machinery Co., Ltd., Xuzhou 221000, China.
Metals 2024, 14(12), 1348; https://doi.org/10.3390/met14121348
Submission received: 8 October 2024 / Revised: 6 November 2024 / Accepted: 21 November 2024 / Published: 27 November 2024

Abstract

:
In this study, we focus on the new energy-absorbing lattice cell configuration designed by topology optimization. To address the difficulty involved in the quantitative description of densification in periodic lattice plastic deformation, in this study, we propose characterizing the plastic densification state of a porous structure with the maximum ratio of two adjacent equivalent plastic moduli in the nonlinear static analysis process. Then, dynamic topology optimization is carried out with the maximization of the absorbed energy as the objective and the densification strain as the constraint to obtain the new topological configuration of the energy-absorbing lattice cell. Finally, additive manufacturing and quasistatic testing of the new energy-absorbing lattice structure and body-centered cubic and face-centered cubic lattice structure is conducted. The results show that, under the same conditions, the strain energy absorbed by the energy-absorbing lattice is approximately 3.5 times that absorbed by the body-centered cubic structure and 2.8 times that absorbed by the face-centered lattice structure with a low impact speed of 5 m/s.

1. Introduction

The three-dimensional (3D) lattice structure of interest is composed of rods, plates, or other microelements that are repeatedly arranged with periodic cubic cells. Under the same quality conditions, an elaborated lattice structure has a lighter weight and higher specific stiffness, specific strength, and specific energy absorption than solid structured and disordered microstructured metal foams. Many researchers have studied classic 3D configurations, such as the body-centered cubic (BCC) lattice [1], face-centered cubic (FCC) lattice [2], and kagome lattices [3] as modeled in Figure 1. Using metal additive manufacturing technology (selective laser melting and direct energy deposition) to print engineering structures with any type of geometric contours can form lattice structures with functionality, such as heat conductibility, noise reduction, and energy-absorbing properties. An energy-absorbing lattice is a special lattice structure that can absorb a large amount of collision energy under impact and collision load. Both the anticollision parts of a car and the docking mechanism of a space probe require a highly efficient energy-absorbing structure to absorb ineffective collision energy.
Some researchers found the current Kelvin cell [4] and double gyroid lattices [5] exhibited a superior specific energy absorption capability. With the focus being placed on innovative cell configurations for the energy absorption function, the biomimetic approach was utilized to design a lattice configuration that absorbs energy, drawing inspiration from the lotus root [6], sea urchin [7], honeycomb structures, and beetle elytra [8]. The classical cell configuration can be enhanced and extended by incorporating and hybridization, resulting in a platform with increased stress capabilities [9,10]. The topology optimization method can, additionally, utilize the force transfer path as the cell’s skeleton, thereby achieving a more precise support configuration [11,12]. Self-similar nesting strategy [13] was also adopted to obtain new design inspiration.
In topology optimization, material distribution is optimized in a designated area according to specific loads, constraint conditions, and performance indicators to obtain a novel configuration. Structure topology optimization incorporates dynamic effects and nonlinear properties during collisions, resulting in high computational costs. Due to the non-differentiability caused by the dynamics and nonlinearity, researchers can use only a heuristic algorithm [14] or numerical equivalence method to obtain a solution. The equivalent static load method (ESLM), firstly proposed by Park et al., is an efficient method for dynamic topology optimization. Later, [15] then Lee [16] conducted a nonlinear dynamic topology optimization study based on equivalent static load and considered material, geometry, and contact nonlinearity in numerical examples; however, the stress–strain nonlinearity was not actually considered. In a previous study [17], we proposed the use of equivalent moduli at adjacent moments to measure the degree of material nonlinearity to calculate and modify the equivalent static load. The idea of using the nonlinear equivalent load for static topology optimization solves the problem of material nonlinearity from the material constitutive perspective.
When the configuration of a lattice cell is to be designed, Maconachie [18] discovered that the lattice possesses outstanding energy absorption capacity because its stress–strain curve exhibits an evident stress plateau duration (as depicted in the effective energy-absorbing zone in Figure 2). After the stress reaches the first peak, the stress decreases slightly due to the fracturing of some rods and then exhibits a long stress plateau, ending when the lattice rods contact each other and the stress experiences a sharp rise due to densification. The densification strain point at the end of the stress plateau duration is the constraint condition of the optimization iteration in dynamic topology optimization.
Therefore, the densification strain needs to be accurately defined. Researchers tried to describe it with experiment parameters [19], the difference value between the rod diameter and the lattice height [20], and the relative density ratio [21]. These calculation approaches for densification strain are founded upon the symmetric rod lattice of the identified structure or determined via the experimental data concerning the compression of the lattice. However, in the optimization process of lattice cell configuration, the porosity and cell configuration of the porous structure change with the addition or deletion of cells. So, they are inaccurate. Therefore, a geometry-independent method of defining densification strain is required during the updating iteration of the topology optimization model.
To address the problems mentioned above, on the basis of the pre-proposed material improvement, we propose characterizing the plastic densification state of a porous structure by the maximum ratio of two adjacent equivalent plastic moduli during the process of nonlinear static analysis. By reference to the nonlinear topology method based on bidirectional evolutionary structural optimization (BESO) proposed by Xie [22], we developed a topology optimization program for an energy absorption structure under dynamic load and designed a new lattice configuration.
Based on the idea mentioned above, Section 1 introduces the theory of classic equivalent static load. In Section 2, the characterization parameters at the moment of densification are provided. With these parameters, dynamic topology optimization is performed to obtain a new energy-absorbing lattice configuration. Section 3 compares the compressive energy absorption capacities of different lattice configurations by experiments.

2. Topology Optimization of Energy-Absorbing Lattice Cell

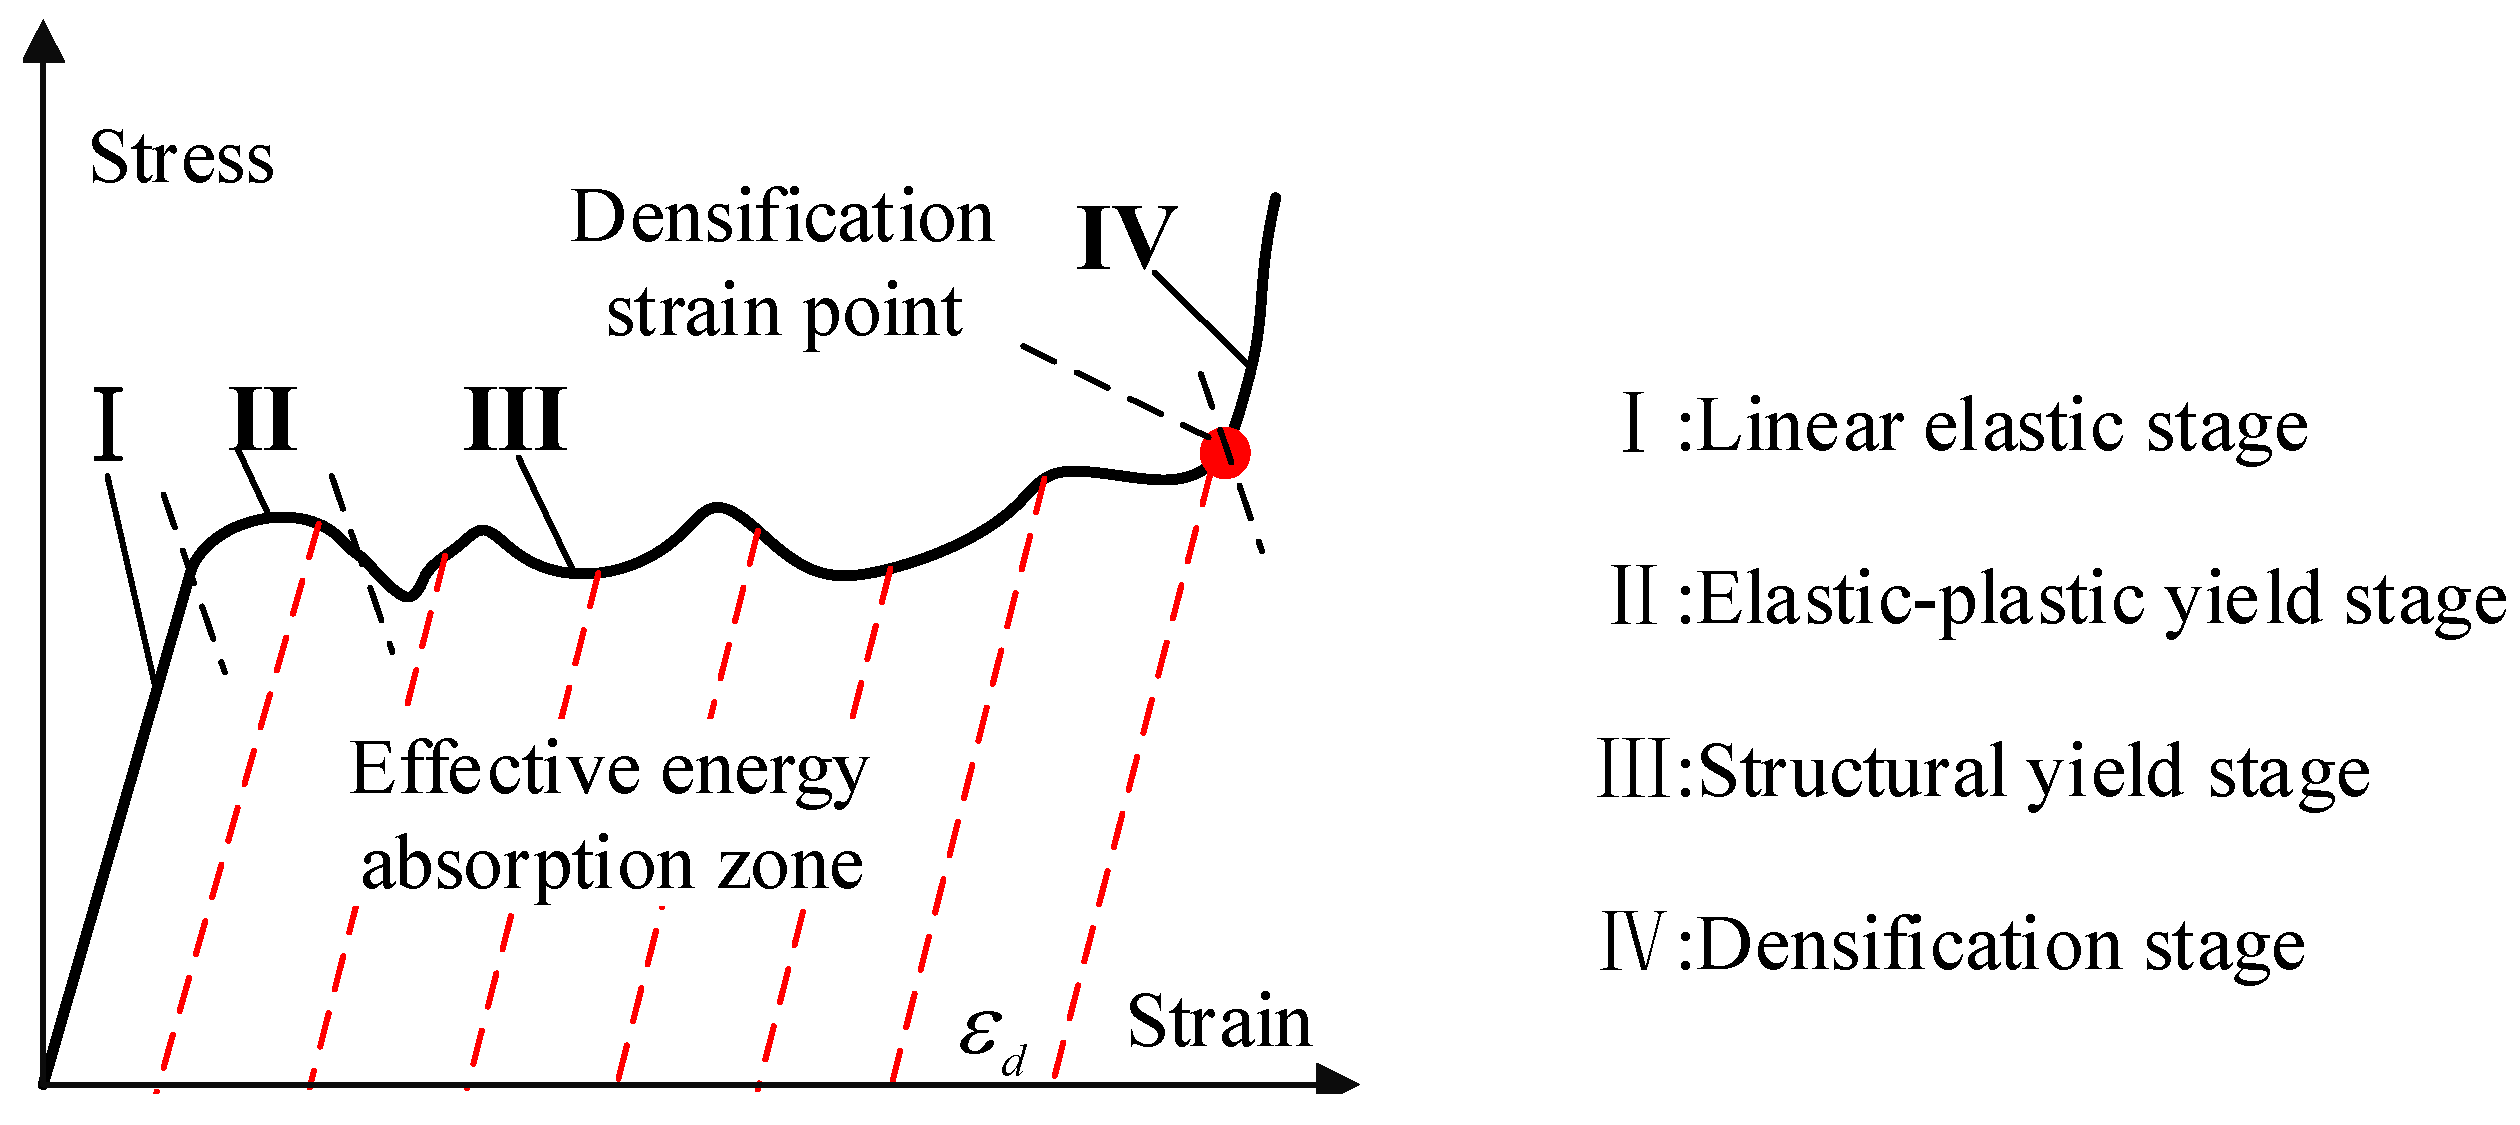
2.1. Definition of Densification Strain

The deformation process of the lattice structure under quasistatic compression can be divided into four stages, as shown in Figure 2. The first stage is the linear elastic stage, where the stress–strain of the lattice structure before yielding is linear. This is followed by the elastic–plastic yielding stage, which has both elastic and plastic strains. The next stage is yielding. Following structural yielding, the stress plateau emerges in the structure owing to the occurrence of a plastic hinge (with the rod rotating around the center point) when the stress is concentrated near the point. The final stage is densification, where the lattice is densified as the lattice rods are in contact with each other. At this time, the densification strain begins. The stress rises sharply, and the structure loses its energy-absorbing abilities. For the energy absorption process of the lattice, densification represents the final stage. Therefore, by defining the occurrence of densification, we can identify the termination condition of the topology optimization.
Since the equivalent plastic modulus of a porous structure changes during the compression process and the equivalent plastic modulus after structural densification is higher than the stress plateau, the occurrence of structural densification can be identified. The static nonlinear finite element analysis involves step-by-step iteration. In this process, the stress and strain values of adjacent load substeps are extracted to calculate the equivalent plastic modulus. The equivalent plastic moduli of the 3D structure in the plastic deformation stage in the x-, y-, and z-directions are shown in Equation (1):
E x * ( t ) = [ Δ σ x ( t ) μ ( Δ σ y ( t ) + Δ σ z ( t ) ) ] / Δ ε x ( t ) E y * ( t ) = [ Δ σ y ( t ) μ ( Δ σ z ( t ) + Δ σ x ( t ) ) ] / Δ ε y ( t ) E z * ( t ) = [ Δ σ z ( t ) μ ( Δ σ x ( t ) + Δ σ y ( t ) ) ] / Δ ε z ( t )
where E z * t is the equivalent plastic modulus in the z-direction from t to t − 1; Δ σ x ( t ) , Δ σ y ( t ) , and Δ σ z ( t ) are the stress component increments in the x-, y-, and z-directions from t to t − 1; and μ is Poisson’s ratio.
We calculate the equivalent plastic moduli between adjacent time points according to Equation (1) and then calculate the ratio of the adjacent equivalent plastic moduli. For example, in the z-direction, Equation (2) applies:
α z ( i ) = E z * t / E z * t     1
where E z * t is the equivalent plastic modulus in the z-direction from t to t − 1. When α x t ,   α y t ,   a n d   α z ( t ) reach the maximum values, the structure is closest to the densification state at the t-th substep. During the ESLM-based topology optimization, the static working condition at the i-th time point is used for static topology optimization.
The specific energy absorption of the structure (energy absorption per element mass) is an important criterion for judging the energy absorption capacity of the lattice. With the same volume, the structure has a sufficient energy capacity for use in engineering applications such as an automobile energy absorption box that absorbs energy through plastic deformation.

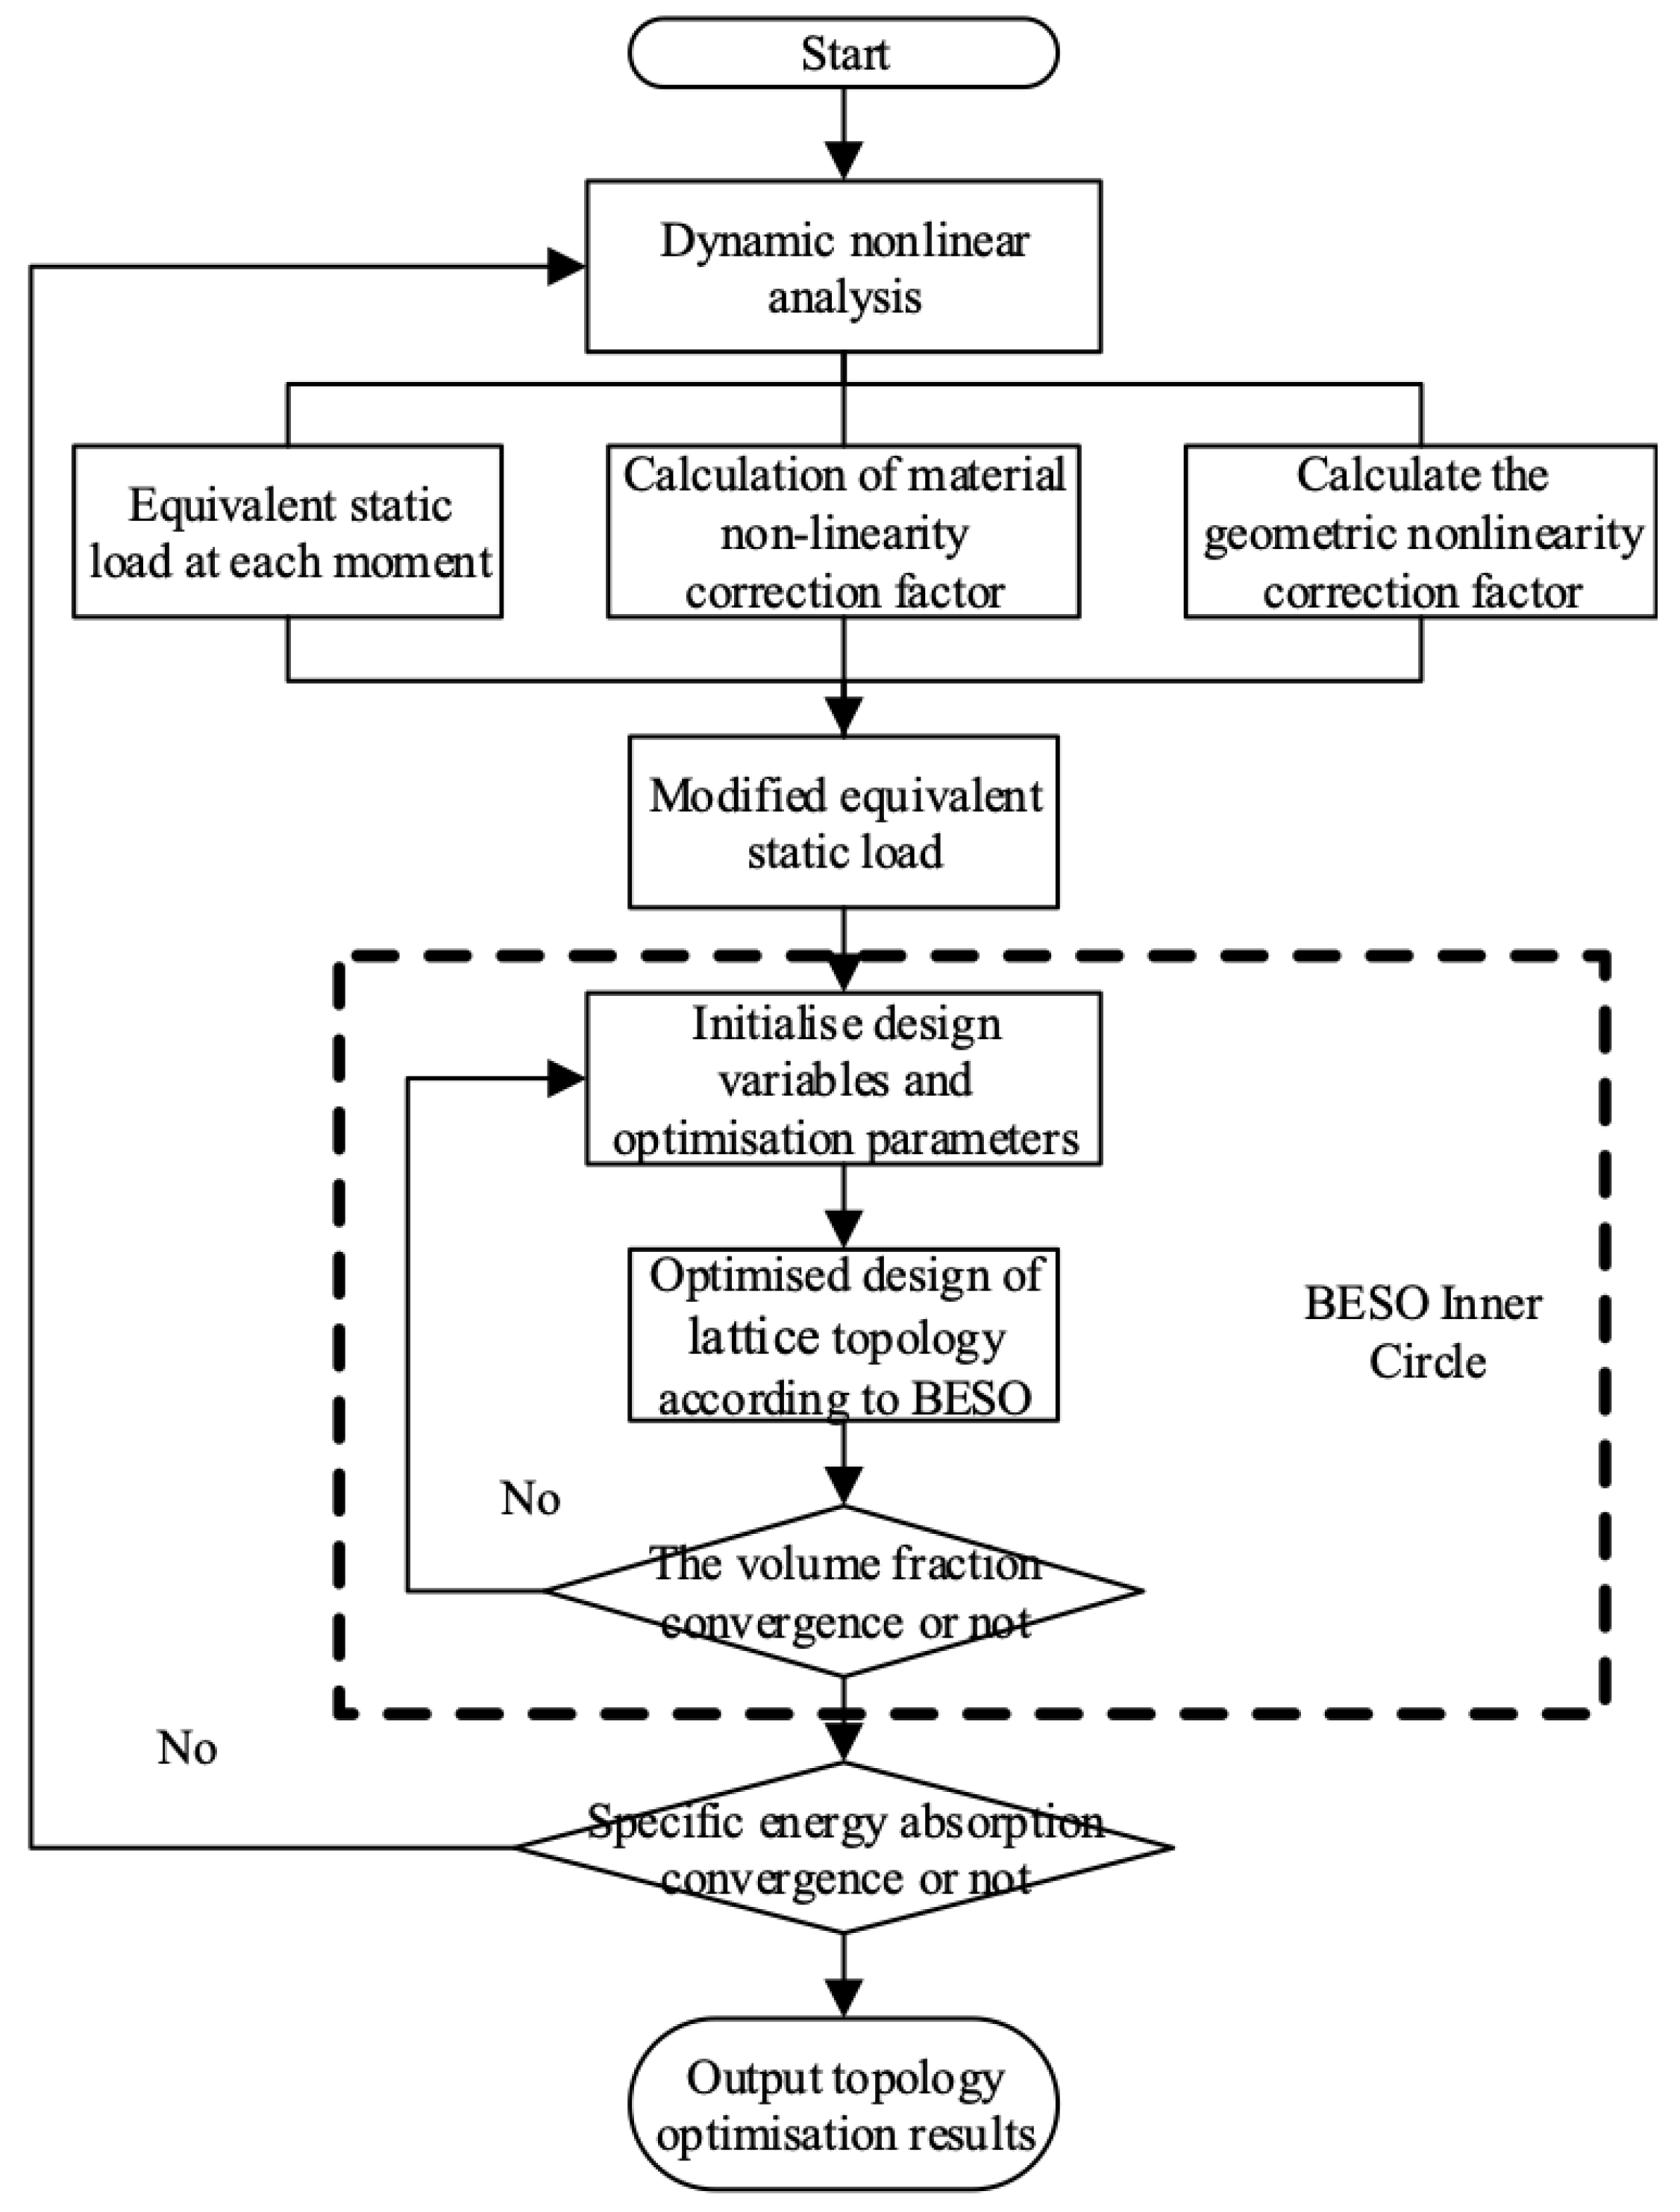
2.2. Algorithm Implementation on BESO

The implementation process of improved ESLM in this paper consists primarily of two parts: the inner loop and the outer loop, as illustrated in Figure 3.
The outer loop comprises the nonlinear dynamic analysis and calculation of the equivalent static load. Considering the error between the equivalent static load and the dynamic analysis, a nonlinear correction is performed on the material and geometry of the equivalent static load to ensure convergence within the external cycle, which is determined by achieving a specific energy absorption convergence target. The inner loop involves static topology optimization based on BESO theory, where the design variable for topology optimization is whether or not a finite element exists, aiming to minimize deformation energy while adhering to volume fraction constraints. The relationship between these two loops lies in executing the inner cycle once the corrected equivalent static load values are obtained from the outer cycle then re-entering into another iteration of the outer cycle when volume fraction constraint conditions are satisfied. The calculation of specific energy absorption occurs during each iteration until it reaches its maximum value, and topology optimization results are recorded.
The BESO method is employed in this study to achieve a precise and dependable topology configuration within the inner loop, ensuring clear and reliable results. To maximize the absorbed energy, based on the BESO structural optimization algorithm, the topology design variables are discretized (0 and 1), and a mathematical model of topology optimization is established with the objective of maximizing energy absorption under volume constraints, as shown in Equation (3).
f i n d : x i = [ x 1 , x 2 , , x n ] m a x : f ( x ) = E e p / M s . t . : i = 1 m x i v i f V 0 x i = 0.001   o r   1
where n represents the number of elements in the design area, xi is the design variable, and xi = 1 or 0.001, based on whether there are elements or not. In particular, a soft kill option is used in the BESO method. Instead of directly deleting elements, the material properties are decreased to 0.001; in this case, it is convenient to add or delete elements. Eep denotes the energy absorption of the structure; M is the mass; vi is the element volume; f represents the volume fraction; and V signifies the initial total volume.
Before updating the design variables, it is necessary to determine whether the volume fraction of the next iteration will increase or decrease based on the constraint function. The target volume of each iteration is determined by the evolution rate (ER), and the evolution rate (ER) is added or subtracted from the target volume of the previous iteration until the volume constraint V* is met. The target volume ( V k + 1 ) for the next iteration is calculated by the Equation (4). When the target volume equals the value V* of the volume constraint, the target volume no longer decreases.
V k + 1 = V k ± V k E R , ( k = 1,2 , 3 )
The maximum rate of volume addition ARmax needs to be prescribed in the design domain, where AR is calculated by the ratio of the expected number of elements added to the total number of elements during the current iteration process. If A R A R m a x , the expected increase is directly updated. The sensitivity of deleted elements is sorted from high to low, making the volume addition rate at this point equal to the prescribed maximum volume addition rate, which is A R = A R m a x . By multiplying ARmax with the total number of elements, we can determine the number m converted from vacant to solid elements.
α d e l t h is the sensitivity threshold for deleting the elements, and can be determined by removing the volume fraction at this node. For a solid element, if α i α d e l t h is met, it will be removed. For a vacant element (x = 0.001), if the condition α i α a d d t h is met, it will be added (x = 1). It is worth noting that the maximum volume addition rate ARmax is to suppress the addition of too many elements during each iteration process, which can not only achieve BESO addition and deletion of elements but also facilitate iteration convergence.

3. Cellular Configuration Optimization of Energy-Absorbing Lattice

The topology configuration of the energy absorption lattice is optimized with the modified ESLM. The initial model for cubic lattice cell topology optimization is established, as shown in Figure 4. The length is 10 mm, the width is 10 mm, and the height is 12 mm. The rigid body moves at 5 m/s on the top the cube.
In particular, the initial optimization model is divided into a design domain and non-design domain. The non-design domain is where the loads and constraints are located. The design domain is shown in gray in Figure 4. The Johnson–Cook model is used as the material model of the cell, as shown in Table 1. The initial parameters of optimization are set as follows: volume constraint V* = 0.4, evolution rate ER = 0.02, AR = 0.05, filter radius r = 3, inner loop convergence τ = 0.1%, and outer loop convergence τ = 0.5%.
As the smallest element of the lattice structure, cells have a regular shape that is convenient for their regular arrangement. Therefore, the lattice cell configuration is mostly symmetrical, with a regular cubic structure. To obtain a symmetrical lattice cell configuration, symmetry constraints are imposed on the cell optimization model in topology optimization. The first outer loop topology optimization starts with a volume of fraction 1. When the iterative volume constraint is 0.4, the next outer loop regards the result of the previous topology optimization as the optimized finite element mode to conduct dynamic nonlinear analysis for the new model. In the inner loop, the volume constraint of the optimization model is kept at 0.4. The optimization results obtained after multiple outer loops are shown in Figure 5. And axonometric view of the final result is shown in Figure 6. Because the side view profile of the new configuration is similar to that of the letter H, we call it the H-shaped cubic cell.
The optimization results are appropriately enlarged and simplified, the middle cross-shaped thin-walled structure is retained as Figure 7a, the wall thickness of the structure is reduced in order to ensure the porosity of the lattice structure in Figure 7b, the flying wing-like structure at the upper and lower ends is simplified into eight oblique symmetrical pillars as per Figure 7c, and in this way and the energy-absorbing lattice cell configuration is established, as shown in Figure 7d.
The size parameter is available: side length of cell h2, height of thin wall h1, internal dimensions a1, a2, and a3, and pillar width L1, as shown in Table 1. The section size of the rod can be determined through parameters L1 and a1, and the thickness and outline dimensions of the thin-walled structure in the middle can be obtained through a2, a3, and h1. The angle of the slanted pillars of the H-shaped cubic cell structure is shown in Figure 7d, and is 60.5°. The lattice cell volume can be calculated with the geometric dimensions of the lattice cell. The porosity of the lattice cell Plattice is shown in Equation (5):
P l a t i c e = 1 { [ 2 2 L 1 ( a 3 a 1 ) 4 L 1 2 ] ( h 2 h 1 ) + h 1 ( a 3 2 L 1 2 2 a 1 a 2 + a 1 2 )
where V0 is the volume of the cube with the side length of cell h2.

4. Quasistatic Compression Test of Lattice Configuration

To verify the mechanical properties of the energy-absorbing structure, the specific energy absorption and average impact force need to considered [23]. The specific energy absorption reflects the energy absorbed per element mass. A higher value is beneficial for the weight reduction in the energy absorption, as seen in Equation (6). The average impact force F m embodies the energy absorption per element displacement, which ensures that the energy-absorbing structure can buffer and absorb energy effectively within the safe collapse distance, as shown in Equation (7):
S E A = E e p / M
F m = E e p / U m a x
where Eep is the internal energy and Umax the maximum collapse displacement.
First, the elastoplastic energy absorption performance of the new lattice cell and that of the classic lattice configuration are compared through simulation analysis. BCC and FCC lattices and the new H-shaped cubic lattice are established with a size of 2 × 2 × 2. The model used in nonlinear dynamic collision analysis is shown in Figure 8. The three types of lattices have the same porosity and mass. The rigid body replaces the collision object, and has a mass of 16 kg, velocity of 5 m/s, and cell size of 5 mm. The collision is an instantaneous process. With the same collision energy and same mass, the three lattice structures all experience large deformation and large strain.
According to the simulation analysis results, when the collapse displacement of the lattice structure is about 6.5 mm, the three lattices are densified. The displacement and strain energy values during the impact process of the three lattices are shown in Figure 9. It can be seen that the strain energy of the new H-shaped cubic lattice increases rapidly with increasing collapse displacement and reaches the peak at the end of the collision. The strain energies of the FCC lattice and BCC lattice are similar with increasing displacement, though that of the BCC lattice is slightly higher and slower to increase than that of the new energy-absorbing lattice. The H-shaped cubic lattice shows significantly larger energy absorption capacity than the other two lattice configurations. Under the same impact load, the energy absorption per element mass of the H-shaped cubic lattice is much higher than that of the classic BCC and FCC lattice configurations: approximately 3.2 times that of the BCC lattice and 2.7 times that of the FCC lattice.
Additive manufacturing enables complex parts to be processed [24]. Test specimens for the three kinds of lattice structures were manufactured using selective laser melting technology, as shown in Figure 10. The printing material was 316L stainless steel powder. In the experiment mentioned in this study, an INSTRON testing machine was used to perform static compression experiments for the three lattice specimens.
The additive manufacturing of the three-dimensional lattice is carried out in the test of lattice performance. The process parameters of selective laser melting printing are selected and set as laser power of 160 W, scanning speed of 556 mm/s, and volume energy density of 80 J/mm3.
The three types of printed lattice structure are now listed. The length of the square cross-section of the rod of the H-shaped lattice is 0.7 mm, the square length is 0.7 mm, and the wall thickness is 0.5 mm; the cross-section of the BCC lattice has a diameter of 0.9 mm and the vertical angle direction is 45°; and the diameter of the cross-section of the FCC lattice is 0.75 mm and the angle with the vertical direction is 45°. When we designed the diameter and angle, we referred to our previous design results to ensure that the rod diameter was greater than 0.7 mm.
The strain energy of the lattice structure corresponding to the displacement during the compression process is calculated according to the output stress-displacement curve. With a speed of 5 mm/min, the compression displacement is 6.5 mm. The compression process of the specimens is shown in Table 2. During the compression process of the BCC and FCC lattices, the rods mainly rotate around the nodes until the rods contact each other. The energy-absorbing lattice is deformed in two stages: the rods deform around nodes, and then the thin-walled structure continues to be compressed to generate a large strain after the rods contact each other.
Information about the force and displacement of each specimen is collected in the experiment, as shown in Figure 11a. The three lattice structures are densified when the compression displacement is approximately 6.5 mm. It can be seen from the displacement-force curve that the stiffness of the H-shaped cubic structure designed in this study is apparently higher than those of BCC and FCC lattice cells with the same porosity, especially when the thin-walled structures are in contact with each other and deformed (approximately 4 mm). The displacement-strain energy curves of the three lattice structures are shown in Figure 11b and show the same trends for the three types in the simulation analysis and similar strain energies. The lower the energy absorption efficiency, the stronger the energy absorption capacity. As shown in Figure 11c,d, the H-shaped lattice structure has the strongest energy absorption capacity. The H-shaped cubic lattice configuration proposed in this article has the highest energy absorption capacity. With the experimental results, the energy absorption per element mass and that per element collapse displacement of each lattice structure are calculated, as shown in Figure 12. The BCC and FCC lattice configurations absorb roughly equal amounts of energy. Under the same compression displacement, the energy absorption per element mass of the H-shaped cubic lattice is significantly higher than that of the classic BCC and FCC lattice configurations: approximately 3.5 times that of the BCC lattice and 2.8 times that of the FCC lattice.

5. Conclusions

(1)
It was proposed to determine the occurrence of densification in the analysis process by establishing the ratio of the adjacent equivalent plastic moduli for the calculation of the effective energy absorption of the topological structure during the optimization iteration. A dynamic topology optimization program was also developed.
(2)
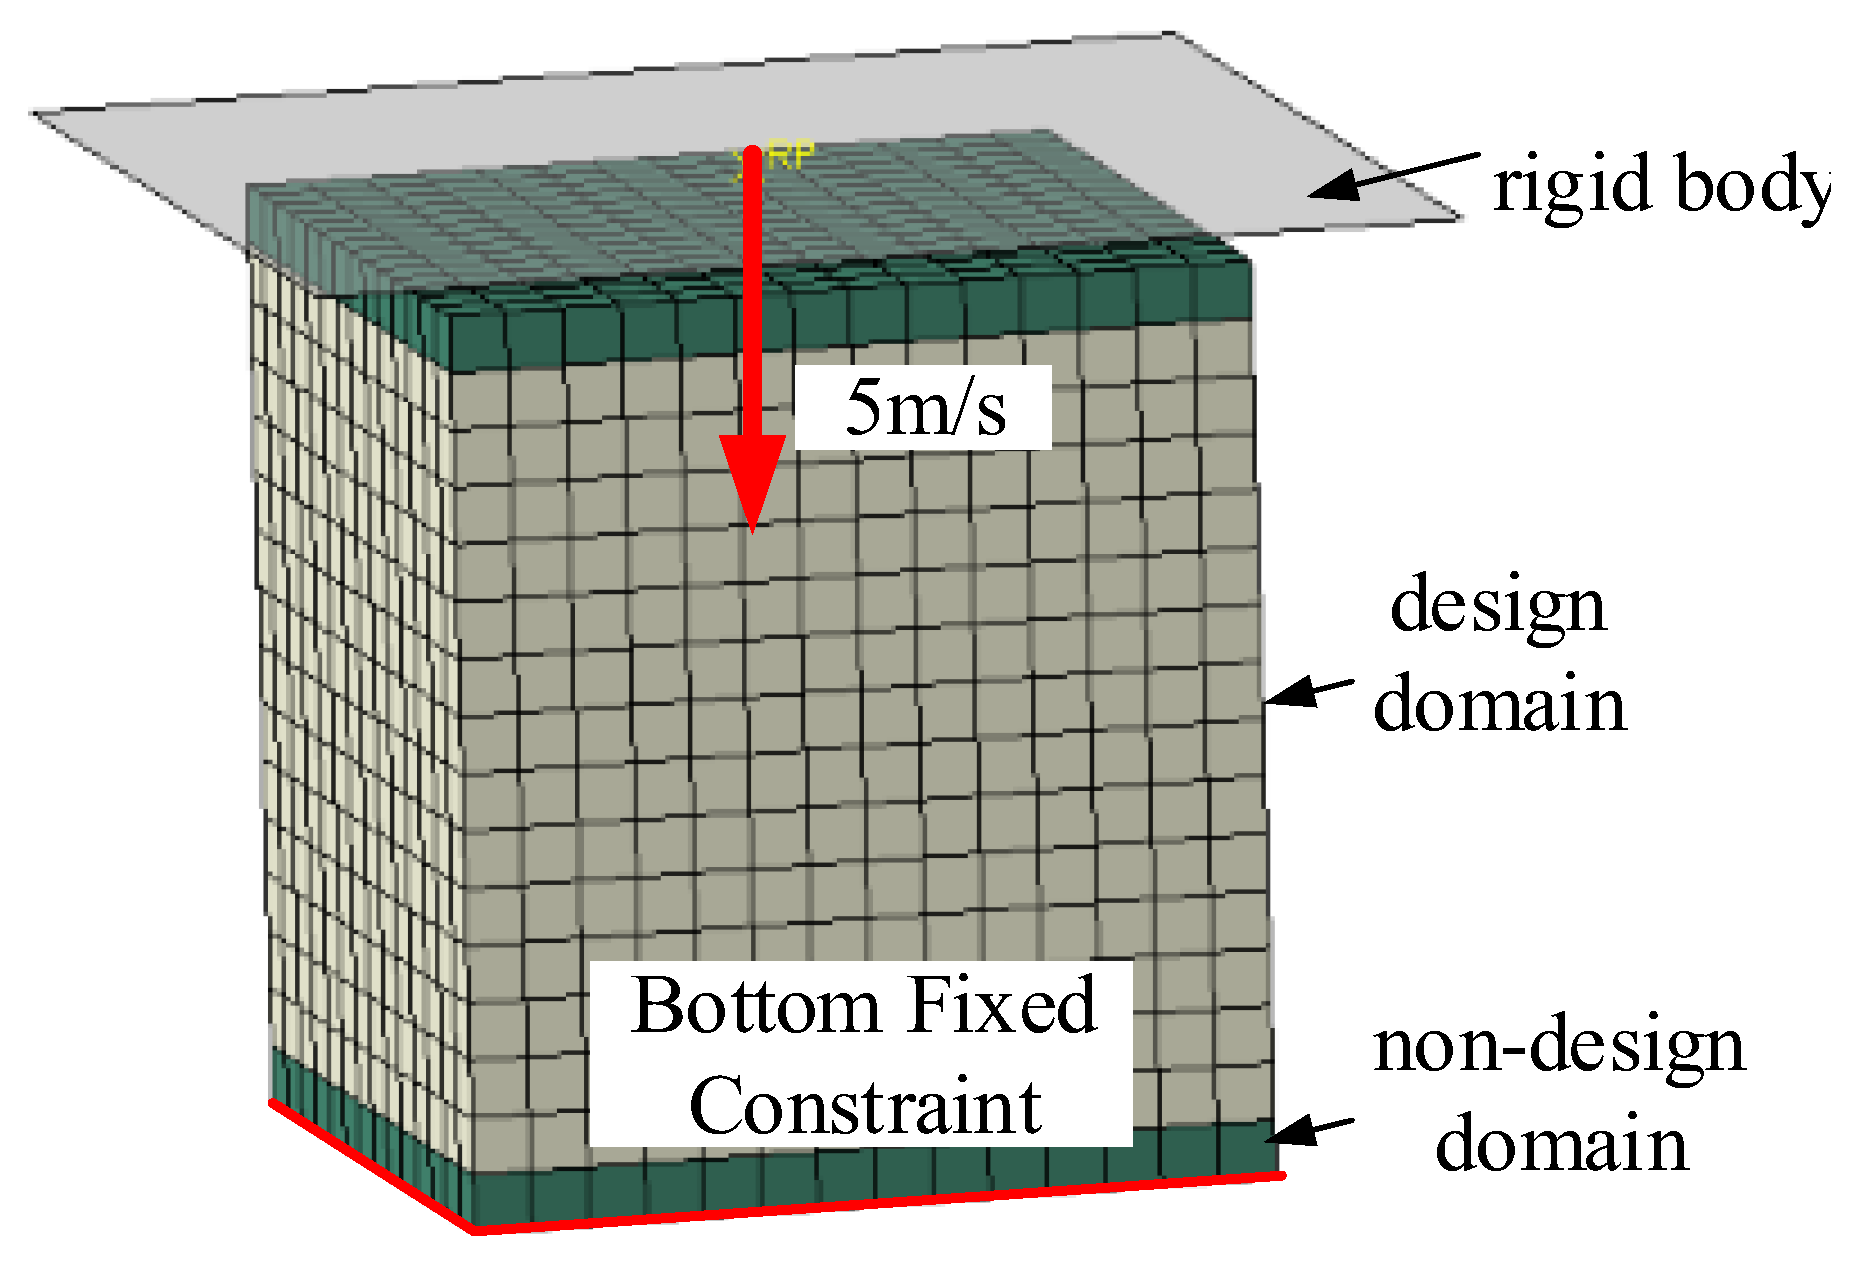
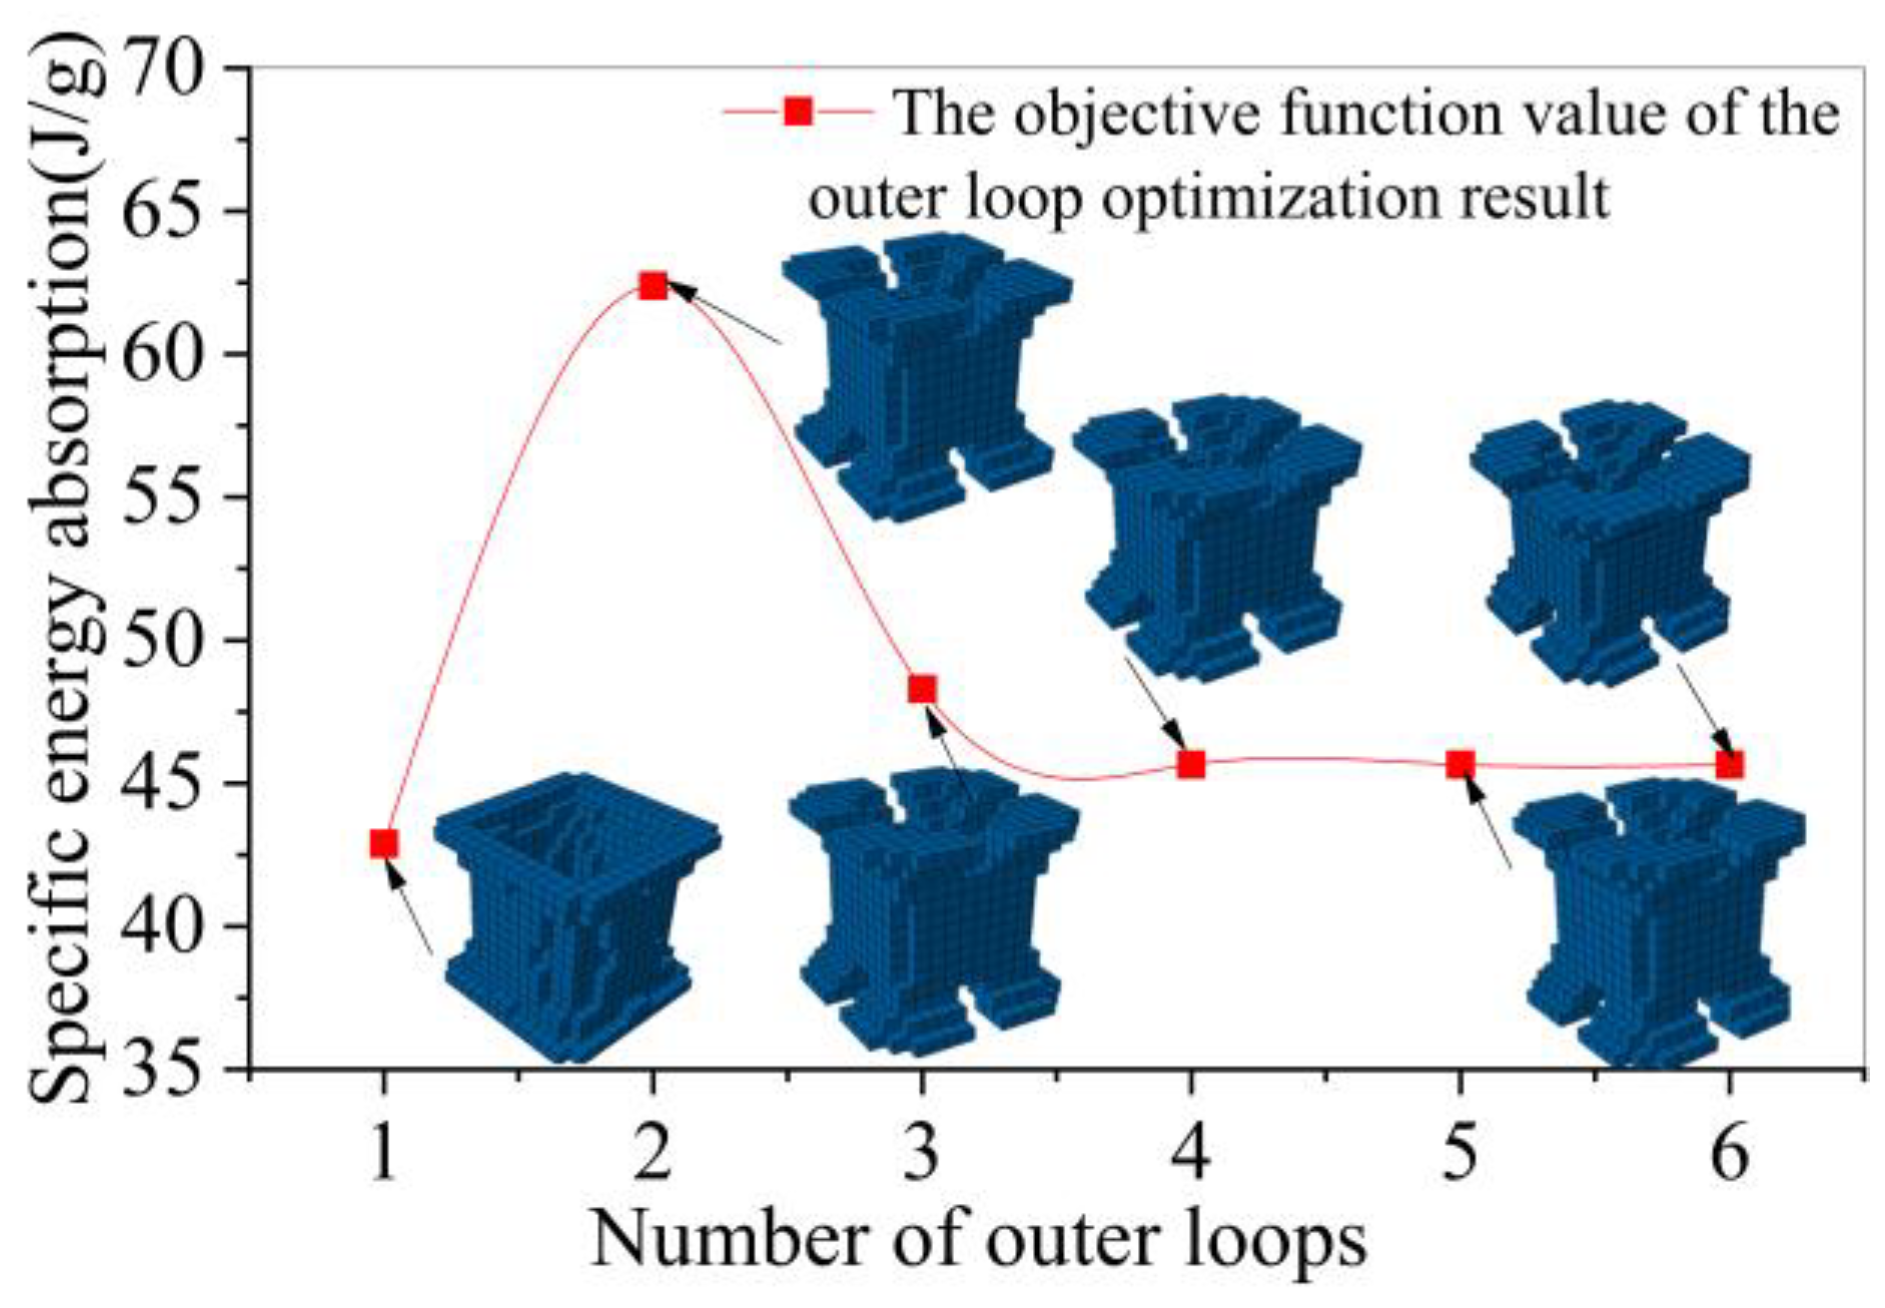
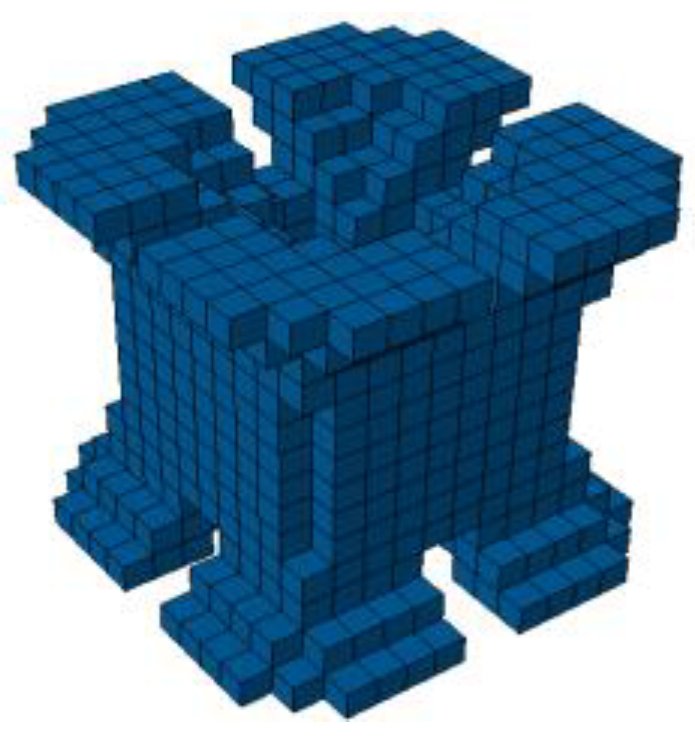
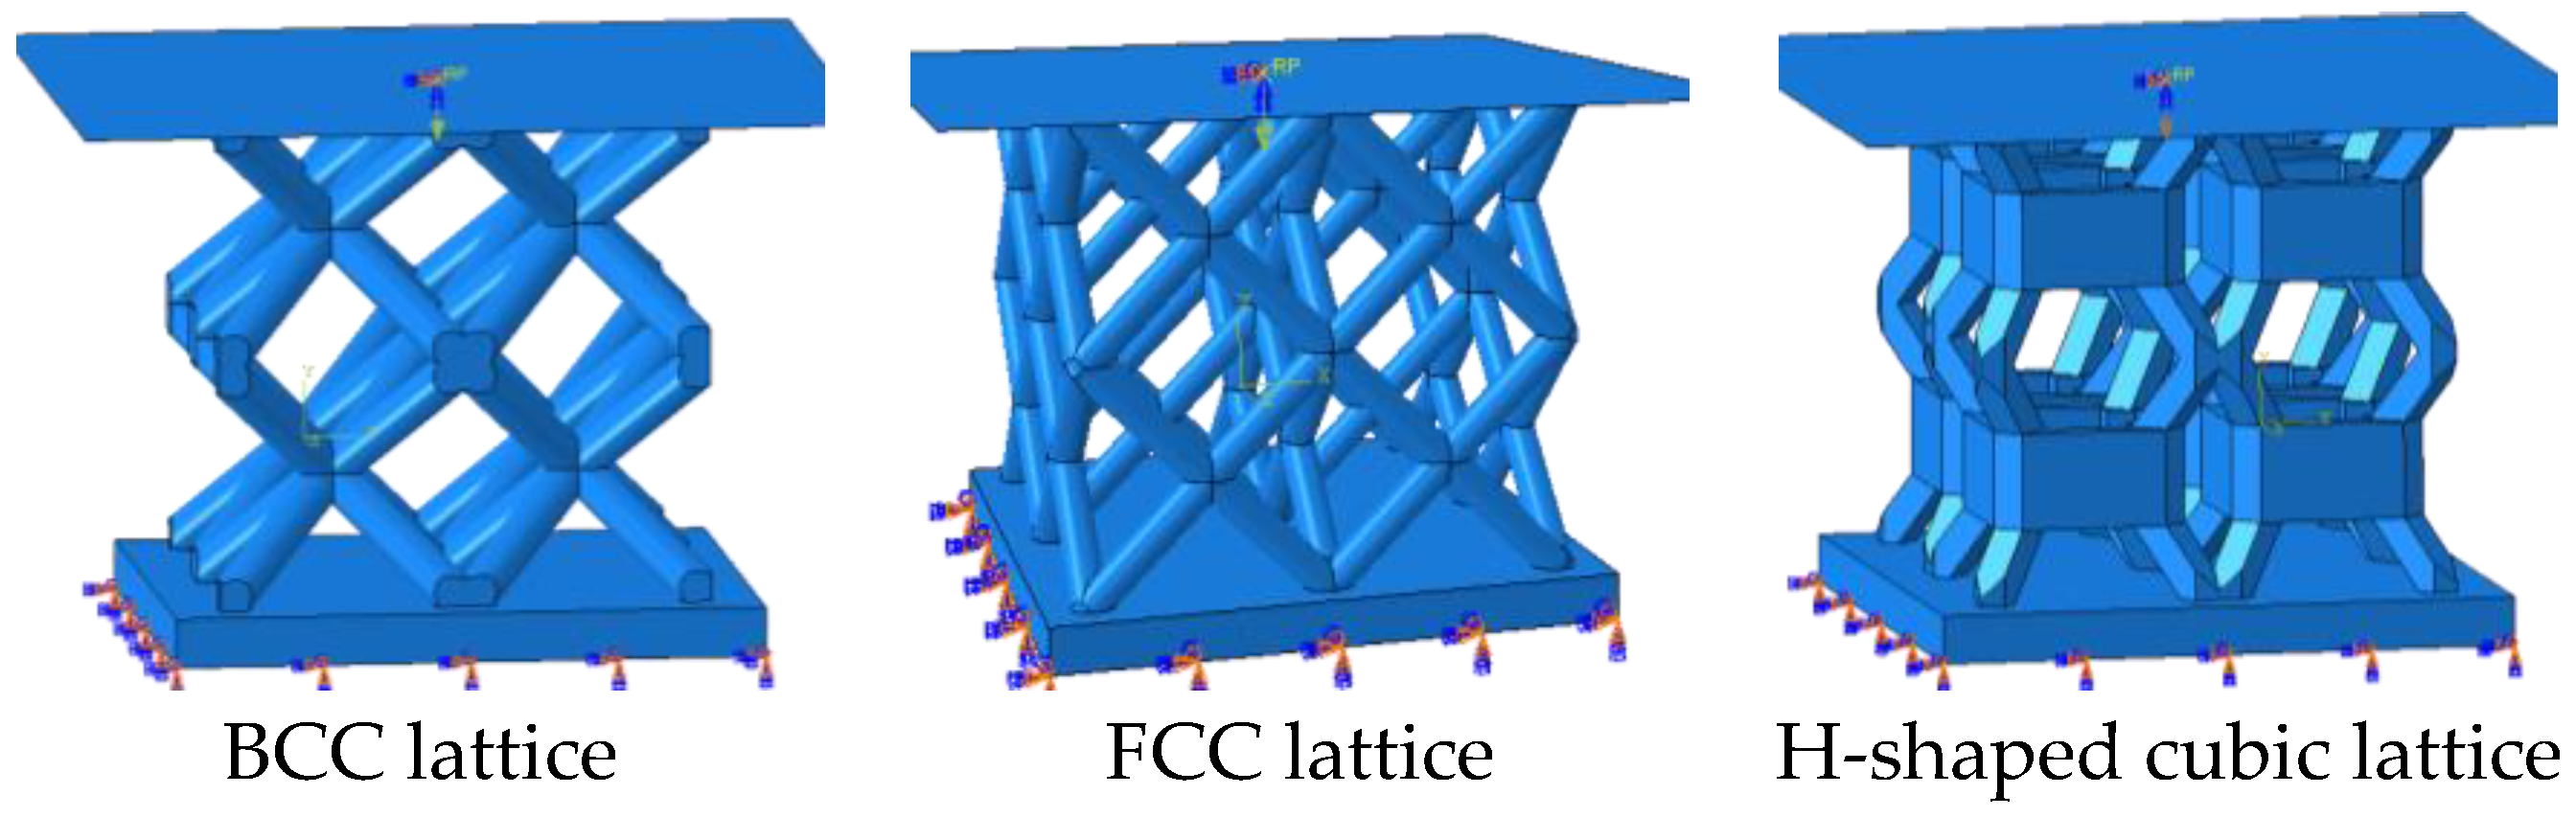
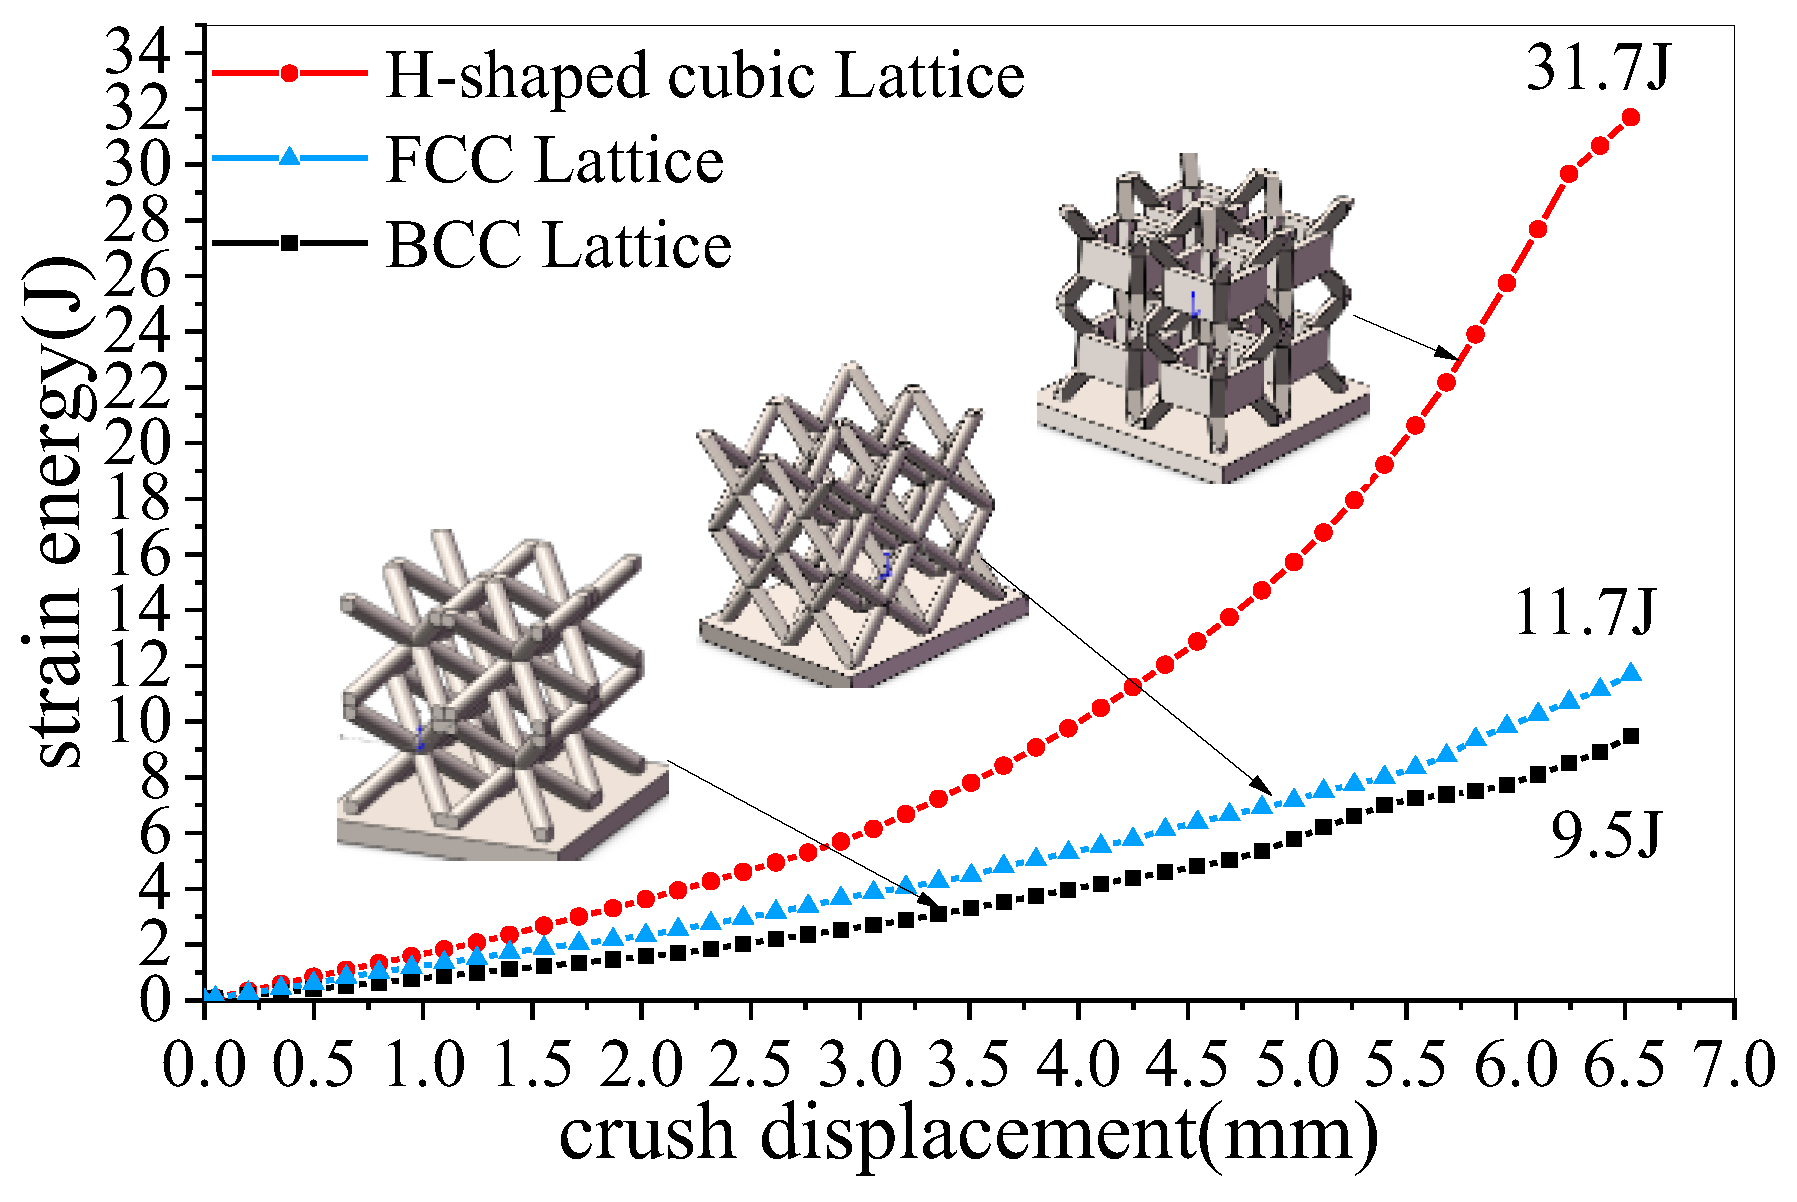
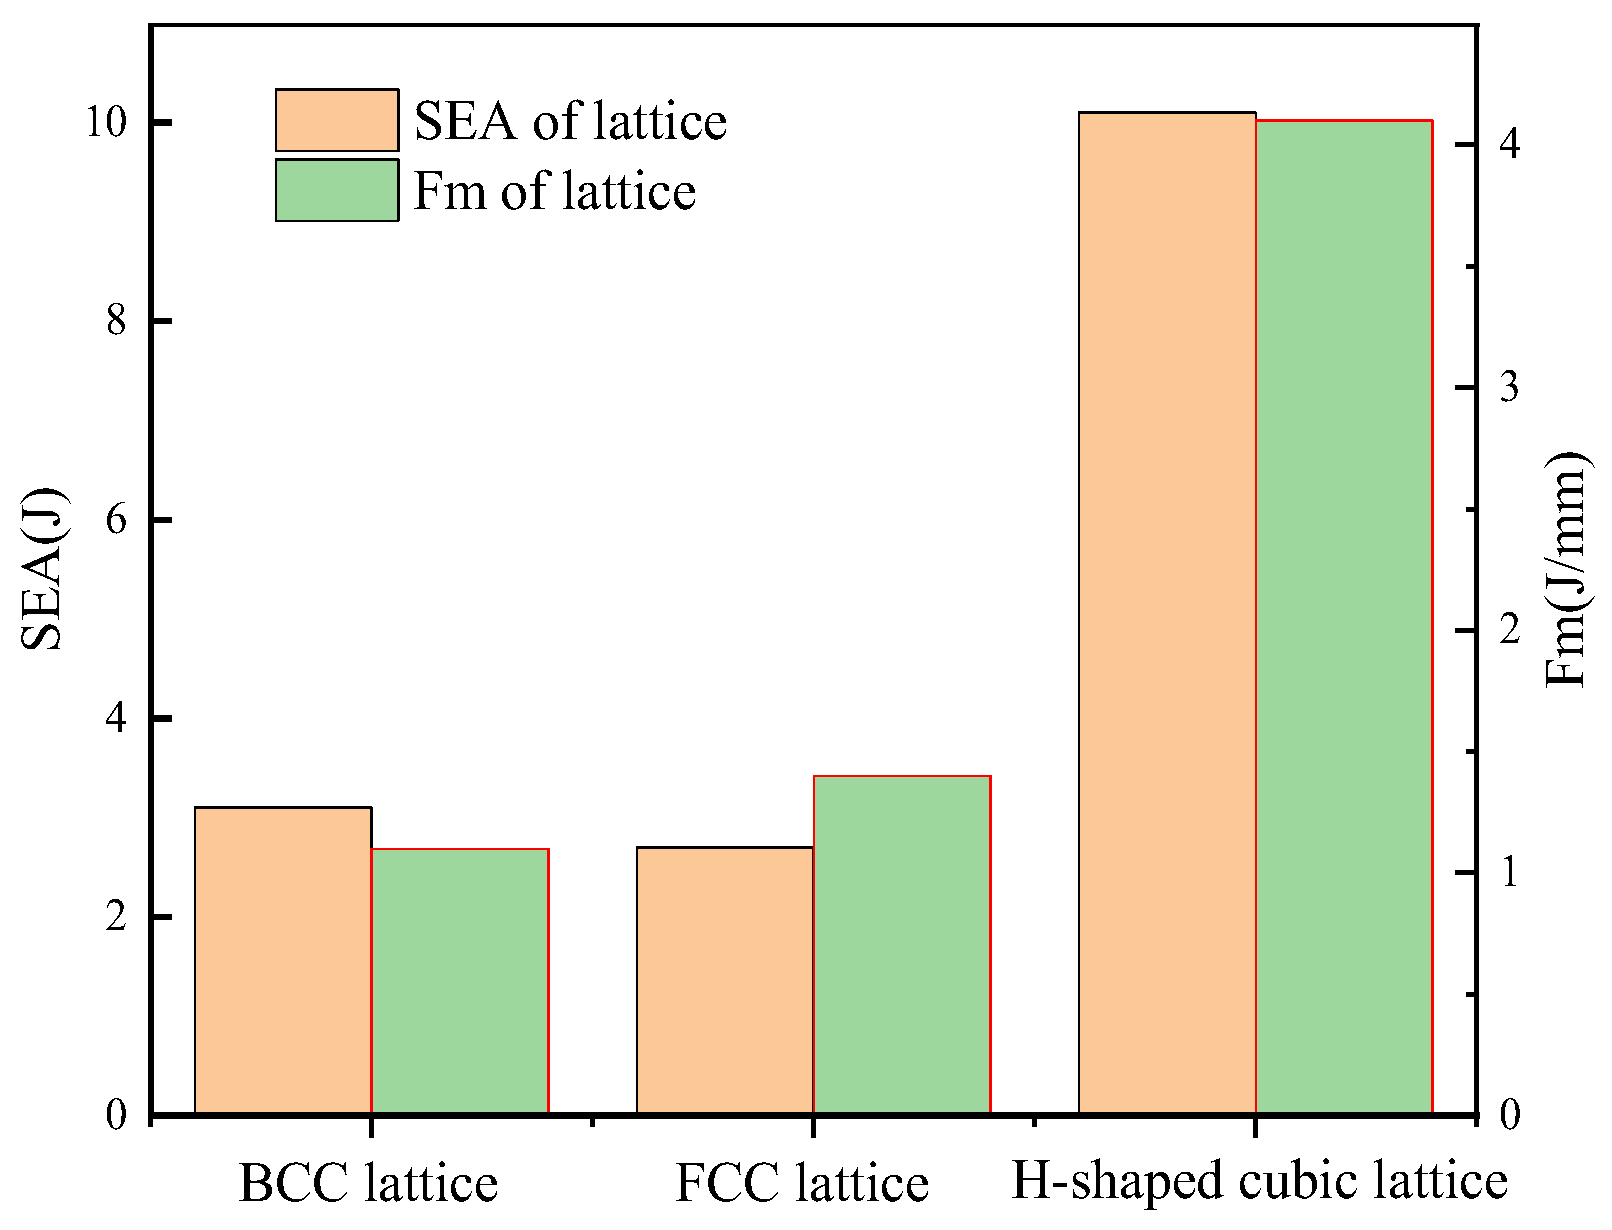
A new energy-absorbing lattice cell configuration consisting of a pillar structure and a middle thin-walled structure was obtained by dynamic topology optimization. Moreover, additive manufacturing of the specimens was realized by selective laser melting. The energy absorption performance of the new energy-absorbing lattice and BCC and FCC lattice configurations is experimentally analyzed and compared. The results show that the absorbed energy of the new energy-absorbing lattice is approximately three times those of BCC and FCC lattice configurations with the same mass and the same collapse displacement at the low impact speed of 5 m/s.

Author Contributions

Conceptualization, Y.L. and S.L.; Methodology, X.H.; Manufacturing and testing, Q.L.; Writing review and editing, Y.W. All authors have read and agreed to the published version of the manuscript.

Funding

This research was funded by [the S&T Program of Hebei, China] grant number [No. 246Z2205G].

Data Availability Statement

Data is unavailable due to the project requirement of confidentiality.

Conflicts of Interest

The authors declare no conflict of interest.

References

  1. Liu, Y.; Dong, Z.; Liang, J.; Ge, J. Determination of the strength of a multilayer BCC lattice structure with face sheets. Int. J. Mech. Sci. 2019, 152, 568–575. [Google Scholar] [CrossRef]
  2. Gorban, V.F.; Firstov, S.A.; Krapivka, M.O. The Influence of Different Factors on Physicomechanical Properties of High Entropy Alloys with fcc Lattice. Mater. Sci. 2024, 59, 145–151. [Google Scholar] [CrossRef]
  3. Wei, K.; Yang, Q.D.; Ling, B.; Xie, H.; Qu, Z.; Fang, D.N. Mechanical Responses of Titanium 3d Kagome Lattice Structure Manufactured by Selective Laser Melting. Extrem. Mech. Lett. 2018, 23, 41–48. [Google Scholar] [CrossRef]
  4. Habib, F.; Iovenitti, P.; Masood, S.; Nikzad, M.; Ruan, D. Design and evaluation of 3D printed polymeric cellular materials for dynamic energy absorption. Int. J. Adv. Manuf. Technol. 2019, 103, 2347–2361. [Google Scholar] [CrossRef]
  5. Maskery, I.; Aboulkhair, N.T.; Aremu, A.O.; Tuck, C.J.; Ashcroft, I.A. Compressive failure modes and energy absorption in additively manufactured double gyroid lattice. Addit. Manuf. 2017, 16, 24–29. [Google Scholar] [CrossRef]
  6. Xu, P.; Guo, W.N.; Yang, L.Y.; Yang, C.X.; Ruan, D.; Xu, J.; Yao, S. Crashworthiness analysis of the biomimetic lotus root lattice structure. Int. J. Mech. Sci. 2024, 263, 108774. [Google Scholar] [CrossRef]
  7. Kumar, A.; Verma, S.; Jeng, J.Y. Supportless Lattice Structures for Energy Absorption Fabricated by Fused Deposition Modeling. 3d Print. Addit. Manuf. 2020, 7, 85–96. [Google Scholar] [CrossRef]
  8. Yu, Z.; Xin, R.; Xu, Z.; Sha, L.; Chen, L.; Zhu, Y.; Liang, P.; Zhang, Z.; Liu, Z.; Cao, Q. Shock-Resistant and Energy-Absorbing Properties of Bionic NiTi Lattice Structure Manufactured by SLM. J. Bionic Eng. 2022, 19, 1684–1698. [Google Scholar] [CrossRef]
  9. Zhang, W.Z.; Yin, H.F.; Wu, Y.C.; Jin, Q.; Wu, L.; Wen, G.; Liu, J.; Wu, X. A novel auxetic 3D lattice structure for enhancing energy absorption. Compos. Struct. 2023, 326, 117620. [Google Scholar] [CrossRef]
  10. Zhang, P.; Biligetu; Qi, D.; Xue, R.; Liu, K.; Huang, Z.; Wu, W.; Li, Y. Mechanical design and energy absorption of 3D novel hybrid lattice metamaterials. Sci. China Technol. Sci. 2021, 64, 2220–2228. [Google Scholar] [CrossRef]
  11. Wang, X.; Qin, R.X.; Chen, B.Z. Mechanical properties and energy absorption capability of a topology-optimized lattice structure manufactured via selective laser melting under axial and offset loading. Proc. Inst. Mech. Eng. Part C-J. Mech. Eng. Sci. 2022, 236, 10221–10236. [Google Scholar] [CrossRef]
  12. Cheng, F.T.; Zhao, Q.H.; Mao, Z.B.; Wang, F.J. Mechanical Response of Gradient Lattice Structures Based on Topology Optimization. Adv. Eng. Mater. 2024, 26, 8. [Google Scholar] [CrossRef]
  13. Chen, L.; Chen, T.; Feng, S.; Cui, C.Y.; Cui, X.G.; Lu, J.Z. Self-similar nesting strategy enables lattices achieve dual energy-absorbing plateaus. Int. J. Mech. Sci. 2024, 276, 109445. [Google Scholar] [CrossRef]
  14. Afrousheh, M.; Marzbanrad, J.; Göhlich, D. Topology Optimization of Energy Absorbers under Crashworthiness Using Modified Hybrid Cellular Automata (MHCA) Algorithm. Struct. Multidiscip. Optim. 2019, 60, 1021–1034. [Google Scholar] [CrossRef]
  15. Jang, H.H.; Lee, H.A.; Lee, J.Y.; Park, G.J. Dynamic Response Topology Optimization in the Time Domain Using Equivalent Static Loads. AIAA J. 2012, 50, 226–234. [Google Scholar] [CrossRef]
  16. Lee, H.A.; Park, G.J. Nonlinear Dynamic Response Topology Optimization Using the Equivalent Static Loads Method. Comput. Methods Appl. Mech. Eng. 2015, 283, 956–970. [Google Scholar] [CrossRef]
  17. Li, Y.X.; He, X.X.; Li, K.L.; Yang, Q.W. Nonlinear Dynamic Topology Optimization Based on Equivalent Static Load Method. Chin. J. Comput. Mech. 2020, 38, 377–383. [Google Scholar]
  18. Maconachie, T.; Leary, M.; Lozanovski, B.; Zhang, X.; Qian, M.; Faruque, O.; Brandt, M. SLM lattice structures: Properties, performance, applications and challenges. Mater. Des. 2019, 183, 108137. [Google Scholar] [CrossRef]
  19. Zhao, X. Kagome Lattice Sandwich Structure Design and Compression Energy Absorption Research. Master’s Thesis, Changchun University of Technology, ChangChun, China, 2021. [Google Scholar]
  20. Zhang, H.R.; Zhou, H.; Zhou, Z.X.; Zeng, H.; Zhang, X.; Yang, J.; Lei, H.; Han, F. Energy Absorption Diagram Characteristic of Metallic Self-Supporting 3D Lattices Fabricated by Additive Manufacturing and Design Method of Energy Absorption Structure. Int. J. Solids Struct. 2021, 226–227, 111082. [Google Scholar] [CrossRef]
  21. Maskery, I.; Aboulkhair, N.T.; Aremu, A.O.; Tuck, C.J.; Ashcroft, I.A.; Wildman, R.D.; Hague, R.J. A Mechanical Property Evaluation of Graded Density Al-Si10-Mg Lattice Structures Manufactured by Selective Laser Melting. Mater. Sci. Eng. 2016, 670, 264–274. [Google Scholar] [CrossRef]
  22. Xie, Y.M.; Felicetti, P.; Tang, J.W.; Burry, M.C. Form finding for complex structures using evolutionary structural optimization method. Des. Stud. 2005, 26, 55–72. [Google Scholar] [CrossRef]
  23. Baroutaji, A.; Sajjia, M.; Olabi, A.G. On the Crashworthiness Performance of Thin-Walled Energy Absorbers: Recent Advances and Future Developments. Thin-Walled Struct. 2017, 118, 137–163. [Google Scholar] [CrossRef]
  24. Li, Y.X.; Guo, C.C.; Li, K.L.; Yu, T. Filling Lightweight Research on Pyramid Lattice with Small Slenderness Ratio Fabricated by SLM. J. Mech. Eng. 2021, 57, 132–138. [Google Scholar]
Figure 1. Different lattice configurations.
Metals 14 01348 g001
Figure 2. Stress–strain curve of lattice during compression.
Metals 14 01348 g002
Figure 3. General flow chart of nonlinear dynamic topology optimization based on the modified ESLM.
Metals 14 01348 g003
Figure 4. Finite element optimization model of a lattice cell.
Metals 14 01348 g004
Figure 5. Objective function variation with the outer loop number.
Metals 14 01348 g005
Figure 6. Axonometric view of optimization results.
Metals 14 01348 g006
Figure 7. Cellular configuration evolution of energy-absorbing lattice. (a) Top view of middle cross-shaped thin-walled structure; (b) front view of the middle cross-shaped thin-walled structure; (c) the flying wing-like structure; and (d) parameterized structure of energy-absorbing lattice cell.
Metals 14 01348 g007
Figure 8. Collision analysis model for different lattice configurations.
Metals 14 01348 g008
Figure 9. Strain energy curves of the three lattices in simulation.
Metals 14 01348 g009
Figure 10. Specimens for the three configurations of lattice.
Metals 14 01348 g010
Figure 11. Quasistatic experimental results for the three configurations of lattice structure. (a) Force-displacement curves, (b) experimental and simulated strain energy-displacement curves , (c) mean stress-strain curves and (d) energy absorption efficiency- mean strain curves.
Metals 14 01348 g011
Figure 12. Energy absorption performance of the three lattice specimens.
Metals 14 01348 g012
Table 1. Size of H-shaped cubic cell structure.
L 1 L 2 h 1 h 2 a 1 a 2 a 3
0.7 mm0.865 mm2 mm1.8 mm3 mm4 mm
Table 2. Experimental compression process of lattice specimens.
Displacement2 mm4 mm6.5 mm
BCC LatticeMetals 14 01348 i001Metals 14 01348 i002Metals 14 01348 i003
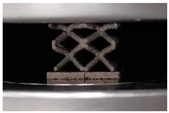
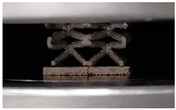
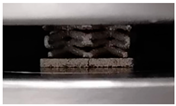
H-shaped cubic Lattice
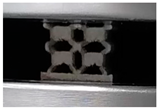
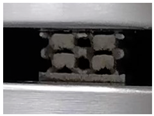
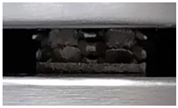
Metals 14 01348 i004Metals 14 01348 i005Metals 14 01348 i006
FCC Lattice Metals 14 01348 i007Metals 14 01348 i008Metals 14 01348 i009
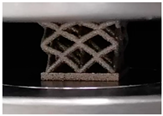
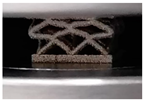
Disclaimer/Publisher’s Note: The statements, opinions and data contained in all publications are solely those of the individual author(s) and contributor(s) and not of MDPI and/or the editor(s). MDPI and/or the editor(s) disclaim responsibility for any injury to people or property resulting from any ideas, methods, instructions or products referred to in the content.

