Article

Inclusion-Based Model: Calculating Tooth Root Bending Strength Considering Steel Cleanliness

Laboratory for Machine Tools and Production Engineering (WZL), RWTH Aachen University, Steinbachstraße 19, 52074 Aachen, Germany
*
Author to whom correspondence should be addressed.
Metals 2024, 14(12), 1349; https://doi.org/10.3390/met14121349
Submission received: 29 August 2024 / Revised: 23 November 2024 / Accepted: 25 November 2024 / Published: 27 November 2024

Abstract

:
Current gear design guidelines and standards have given little or no consideration to the increase in strength that can be achieved by using ultra-clean steels. In order to fully exploit the potential of ultra-clean steels, it is therefore necessary to use higher-quality calculation methods that combine FEM stress calculations with local strength calculations. Therefore, the aim of this paper is to extend the inclusion-based model to allow for the calculation of the tooth root bending strength of gears with different steel cleanliness. For this purpose, a material analysis of 20MnCr5 with three different degrees of cleanliness is carried out and the respective material defect distribution is determined. In order to be able to represent the determined material defect distributions of the different cleanliness grades in the inclusion-based model, the model is extended accordingly, and a sensitivity analysis is carried out on the influence of the material defect distribution functions on the tooth root bending strength calculation. Finally, the model is applied to a pulsator test to verify the applicability of the model. The results of the verification show that the calculation of the mean bending strength of gears in pulsator investigations is generally possible with the extended inclusion-based model. The inclusion-based model thus offers the potential to improve the statistical significance of pulsator test results by supplementing the limited number of practical test points with the virtual test points of the inclusion-based model.

1. Introduction

With the increasing electrification of powertrains and new areas of applications for gearboxes, the demands on transmissions and gearboxes are constantly increasing. As a result, gear manufacturers and designers are under increasing pressure to meet these requirements.
To meet the increasing demands for higher power density, high-performance gears are being shot-peened and superfinished. Shot peening introduces high residual compressive stresses into the surface of the gear, which generally results in a higher load capacity [1]. Subsequent superfinishing restores the surface condition in order to avoid load capacity-reducing effects caused by damage to the surface. Another option for increasing the load capacity is the use of highly clean steels, which have a higher load capacity than conventional steels due to their improved cleanliness [2,3].
Current gear design guidelines and standards have given little or no consideration to increasing load capacity through the use of high-clean steels, so the potential to increase power density remains untapped when gears are designed to these specifications [4,5,6]. However, with the help of more sophisticated calculation methods, which can calculate the local stresses in the gear mesh and also take into account the material-specific influencing factors, it is possible to exploit unused potential in the gear design [7,8,9].
Sufficient load capacity of the tooth flank and root is a basic requirement for a gear design because, in the worst case, gear damage can lead to total failure of the entire application. For this reason, thorough knowledge of the load capacity of the materials used and the stresses occurring in the application is of utmost importance.

2. State of the Art

2.1. Influence of Steel Cleanliness on Fatigue Strength

The demand for smaller and lighter gearboxes means that in addition to optimising gear geometry, there is a need for more durable materials. As a result, steel manufacturers are developing new melting processes and further optimising existing manufacturing processes to meet the demand for higher-strength materials [10].
Different experimental studies show that the fatigue strength of steel is related to the size of the defects present [3]. A study by Kamjou et al. shows that larger defects in the material lead to a reduction in fatigue strength [3]. The increase in fatigue strength due to the increased cleanliness of the steel was confirmed by fatigue tests on notched specimens in rotating bending tests (RBTs for short). The fatigue strength values determined for a steel with improved cleanliness (bearing quality steel, BQ) were approximately 20% higher than the conventional reference steel [3].
As the rotating bending test is a test method on standard specimens, the applicability of the results to the actual application is limited. For this reason, Trippe et al. investigated the influence of steel cleanliness on tooth root bending strength using standardised type C test gears on the pulsator test rig [10]. The tooth root of the gears investigated was not ground during hard finishing and no further post-treatments such as shot peening or superfinishing were carried out to improve the tooth root properties. The results confirm the findings of the rotating bending test, as an improvement in steel cleanliness over the conventional reference material also resulted in an increase in fatigue strength in the pulsator test rig. However, a further increase in steel cleanliness from the BQ material to the IQ material (isotropic quality steel) did not result in a further increase in tooth root bending strength at a failure probability of PA = 50% but in a reduced test scatter. This observation can be explained by the fact that other causes of damage, such as surface roughness, become more important as a result of the reduction in defect size [10].
By improving surface roughness and introducing compressive residual stresses near the surface, damage initiation near the surface can be shifted to the interior of the component [11]. Accordingly, a further improvement in material cleanliness can be expected to result in an additional increase in tooth root bending strength, as the degree of cleanliness of the material has a significant influence on the occurrence of defect-induced cracks in the interior of the component and thus also on the tooth root bending strength [9,12]. Investigations of tooth root bending strength in the very high cycle fatigue (VHFC) and ultra-high cycle fatigue (UHCF) range also show that the assumption of pronounced fatigue strength cannot be assumed for all materials or production chains. The research results show that tooth root fractures can also occur at high numbers of load cycles due to defect-induced cracks inside the component [9,12].

2.2. Calculation Procedure for Determining Tooth Root Bending Strength

The standard procedure for calculating the tooth root bending strength of gears is to use standardised methods such as ISO 6336-3 or AGMA 908-B89 [6,13]. As these standardised calculation methods are analytical methods based on conventions and abstractions, a comparatively fast calculation of the tooth flank load capacity and the tooth root bending strength is possible [14]. The calculation of the root bending strength is based on the bending beam theory, as the root is mainly subjected to mechanical stress [6,13]. In addition, the various factors influencing the root bending strength are taken into account in the standardised calculation methods by means of influencing factors [6,13]. The result of the standardised strength calculations are safety factors, which are formed by comparing the strength of the material and the stress that occurs [13]. The calculated safety factors can then be used to assess the load capacity of the gearing under consideration.
The consideration of local strength is only possible to a limited extent with the standardised calculation methods due to the conventions and abstractions used. For this reason, methods that are more sophisticated have been developed. These methods enable the calculation of the tooth root bending strength based on a local strength analysis [7,9]. To calculate the local stress state in all three spatial directions and at different material depths, both general FEM programmes and tooth contact analyses, which have been specially developed for calculating the stresses occurring in the tooth mesh, are used [14]. By comparing the local stresses and the local strength values, it is possible to calculate the local probability of survival [14]. The inclusion-based model is a local tooth root bending strength calculation model developed by Henser, which combines the calculation of the tooth root stresses occurring in the tooth mesh by means of a tooth contact analysis combined with the approach of the defect-based component failure according to Murakami [8,15]. The simulation sequence of this calculation method is shown in Figure 1.
Based on the input variables, such as the local stress conditions in the tooth root, the hardening depth profile, the residual stress depth profile and the material quality in the form of a corresponding defect distribution, and the number of defects, the defects are generated in the material model with the aid of a defect generator (see Figure 1) [8]. The local strength at all defects is then determined according to the Murakami approach (see Figure 1), taking into account the local stresses [15]. If the stresses at the generated defects exceed the local strength, this will result in a tooth root fracture and the torque in the tooth contact analysis will be reduced for the next test according to the staircase method [8,16].

3. Objective and Approach

The state of the art shows that the steel cleanliness of the gear material has a significant influence on the achievable load capacity of the gear, so that in some cases the load capacity of a gear can be increased considerably in a simple manner by changing the choice of material. Current design guidelines and standards give little or no consideration to the increase in load capacity that can be achieved by using high-clean steels. As a result, when gears are designed according to these specifications, the increased load capacity of high-clean steels cannot be fully utilised and the potential for increasing power density remains untapped [6,13,17]. With more sophisticated calculation methods, which take into account both local stresses in the tooth mesh and material-specific factors, it is possible to predict the influence of steel cleanliness on tooth root bending strength, so that unused potential can be utilised in gear design.
The inclusion-based model allows for the calculation of the tooth root bending strength of gears as a function of the defect distribution in the gear material [8]. Only materials with a Weibull defect distribution can be modelled with the current defect model. Therefore, the objective of this research paper is to analyse the defect distribution in a material with different degrees of cleanliness and to extend and apply the existing inclusion-based model to calculate the tooth root bending strength of gears with different steel cleanliness. To achieve this goal, the first step is to analyse the defects in gears of 20MnCr5 with different degrees of cleanliness. The defect analysis should provide information on whether the Weibull distribution, which is already implemented in the inclusion-based model, is suitable for all the degrees of cleanliness investigated in this article or whether another distribution function would be more appropriate. After completing the defect analysis, the appropriate distribution functions are implemented into the existing inclusion-based model and the influence of the distribution function on the calculated tooth root bending strength is analysed. In addition, the inclusion-based model is applied to a test and the results are compared with existing test results.

4. Test Gears

The gear geometry under consideration is presented below. The gears were metallurgically analysed and a defect analysis of 20MnCr5 in three grades of different degrees of cleanliness was carried out using unetched micrographs. The 20MnCr5 steel used in the study was manufactured by Ovako in three purity grades, namely standard, BQ, and IQ (cf. Kamjou et al. regarding categorisation and production) [3].

4.1. Macro and Micro Geometry

The test gear set considered is a standard test gear, as shown in Figure 2. The standard test gear set is a spur gear with a module of mn = 4.5 mm and is designed for a centre distance of a = 91.5 mm. The tooth width of the pinion and gear is identical to b1 = b2 = 14 mm. The pinion of the test gear has z1 = 16 teeth, and the wheel has z2 = 24 teeth. In addition, micro geometry modifications such as lead crowning and tip relief are applied to both gears (see Figure 2).
As the manufacturing chain of the gears was identical for all three analysed steel grades of the material 20MnCr5, the measured residual stress depth curves and hardness depth curves are similar (see Figure 2). The manufacturing scatter and the existing measurement inaccuracies can explain the slight deviations in the hardness depth curves and in the residual stress depth curves between the three variants. The residual stress depth curves in Figure 2 show tangential and axial residual compressive stresses of σES,tan ≈ −750 MPa and σES,ax ≈ −520 MPa directly at the surface for all three variants. As the measurements were carried out in the area of the ground tooth flank and the high residual compressive stresses only occurred directly on the surfaces up to an edge distance of y < 25 μm, these can be attributed to the mechanical stress during hard–fine machining according to the current state of knowledge.

4.2. Material Analysis and Defect Distribution

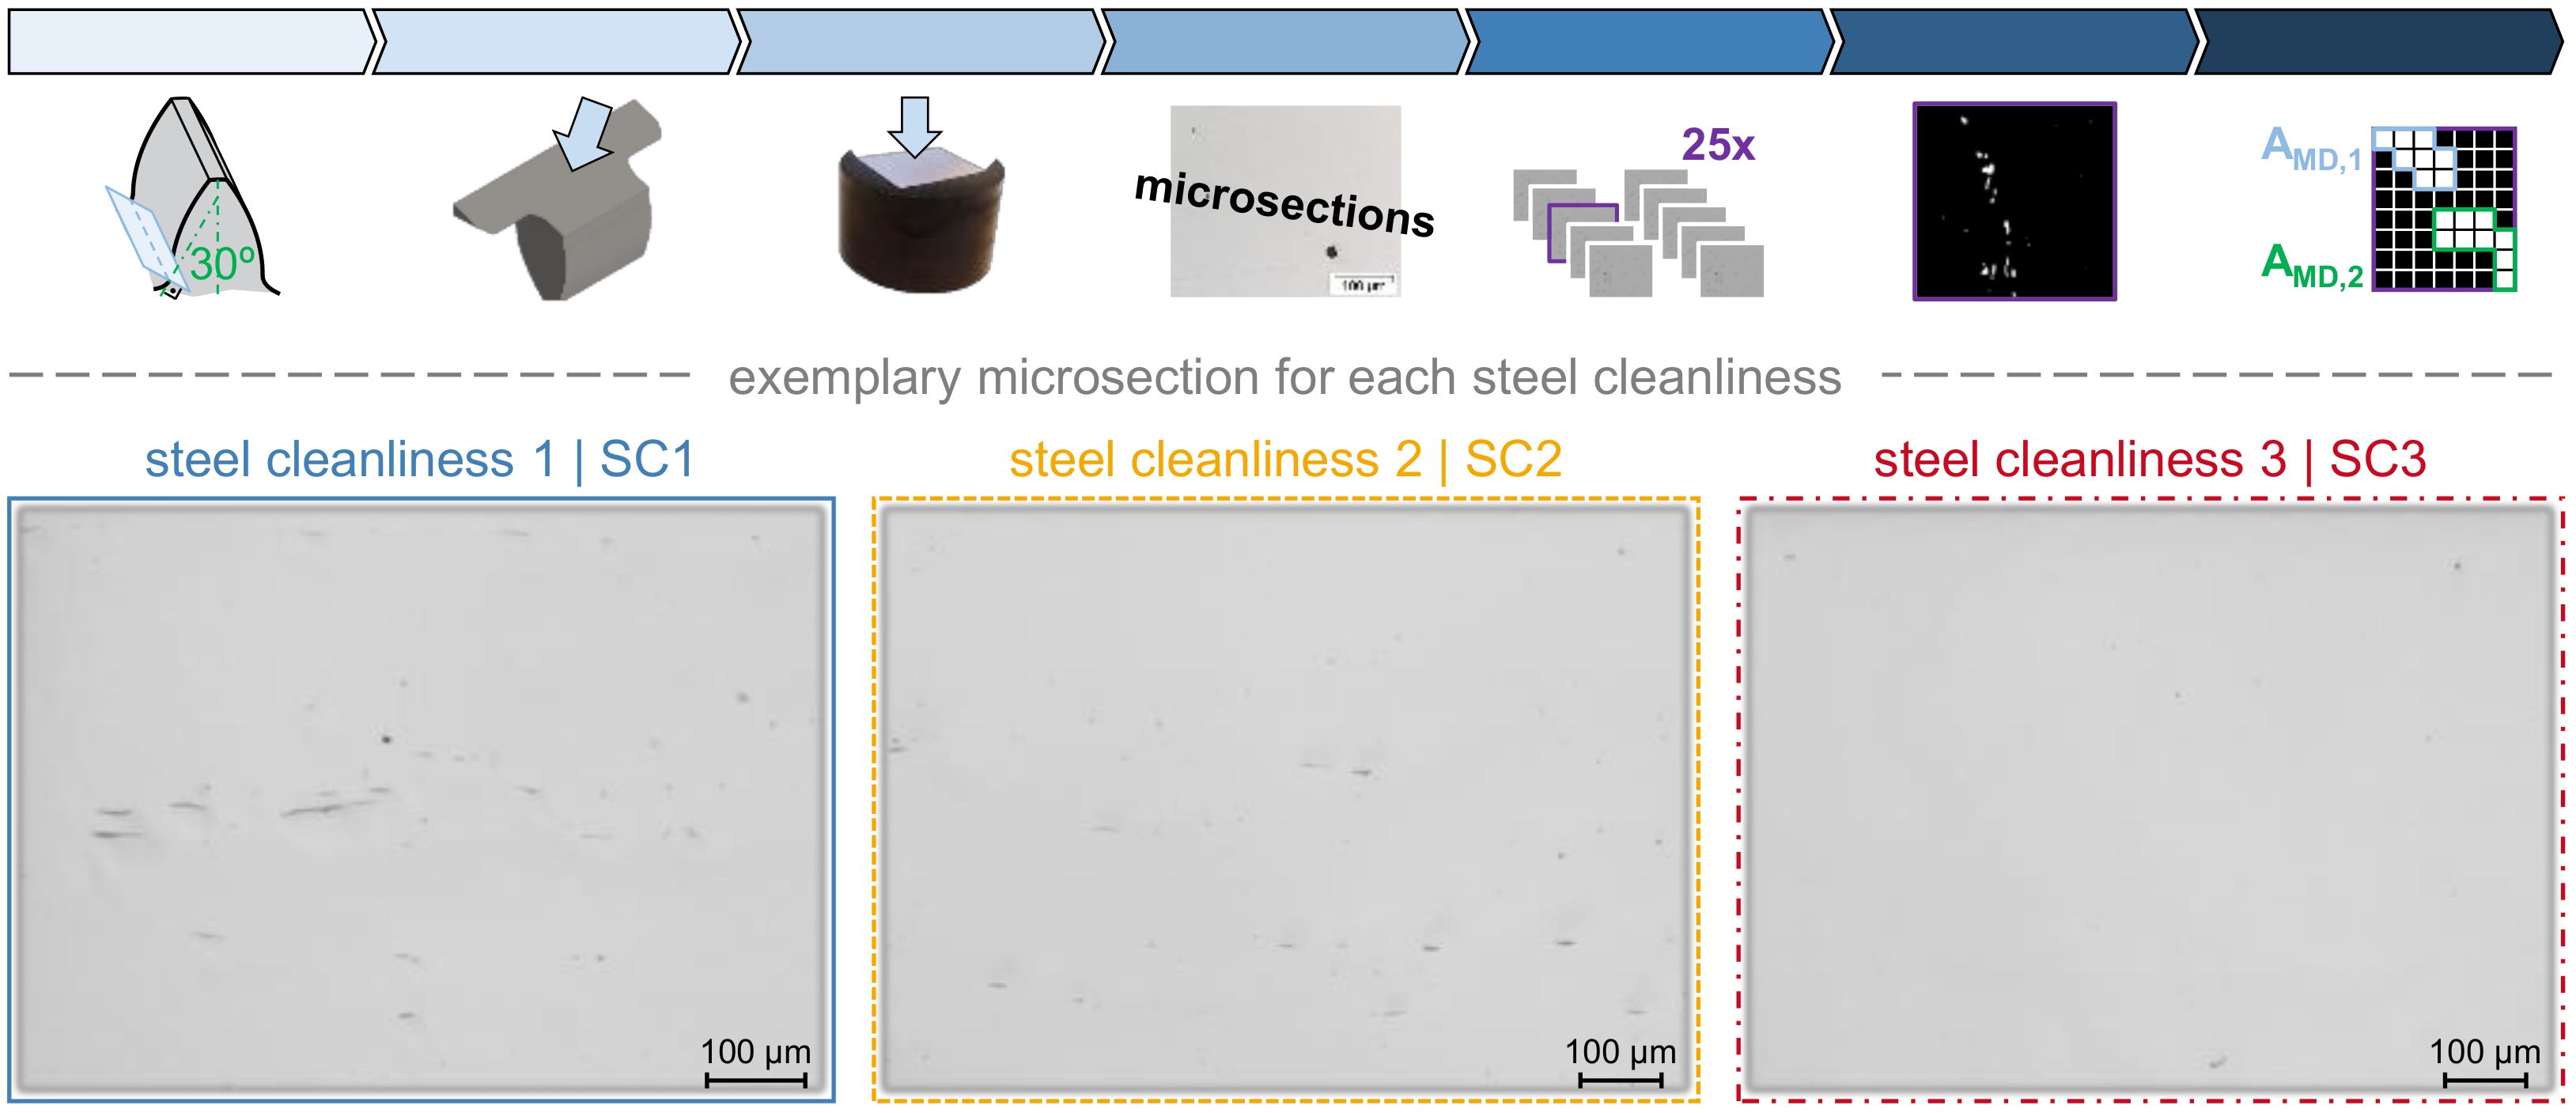
In order to determine the defect distribution in the three different cleanliness steel grades, the gears must first be subjected to a metallurgical analysis, hereafter referred to as a material analysis. The material analysis begins with separating the gears into tooth segments and cutting them perpendicular to the 30° tangent in the tooth root (see procedure in Figure 3—upper section). The position and direction of the cut perpendicular to the 30° tangent is of great importance, as the material analysis should be carried out in the most stressed material volume orthogonal to the principal stress [9,18,19]. A deviation from this cutting plane can lead to a defect distribution that does not match the defect distribution in the critical area, as the defect distribution of a continuous casting material is not constant over the diameter [9]. After cutting at the 30° tangent, the top of the tooth was embedded, the cut surface was polished, and unetched microsections were taken using a digital microscope (type VHX-S660E of Keyance, Osaka, Japan). The lower part of Figure 3 shows an exemplary microsection image for each steel cleanliness variant. Each discontinuity in the basic structure is considered a defect. For the micrographs shown in Figure 3, any black areas therefore represent a defect. The microsections were analysed separately according to the procedure of Brecher et al. [20] and the maximum defect size of each image was determined taking into account the specifications of Murakami et al. [19,20]. A total of 25 microsections were recorded for each variant. The subsequent analysis of the defect distribution is based on these 25 maximum defects determined for each variant.
To analyse the defect distribution, it is advisable to first obtain an overview using probability plots, also known as p-p plots. This is performed by first sorting the detected defects by size and then assigning a probability Femp to each value using an empirical distribution function (see Equation (1)). The defect sizes are then entered into the probability plot of the respective distribution function with the empirical probabilities determined, and the respective best fit line of each variant is plotted using the maximum likelihood method [21].
Femp (xi) = (i − 0.5)/n
As shown in Figure 4, the empirical defect distributions of the three steel grades of cleanliness were first checked for conformity with Weibull, normal, and log-normal distributions. The evaluation criterion for this check is the deviation between the measured values and the corresponding best fit line in the probability plot. If the deviation is sufficiently small, it can be assumed that the defect distribution can be described sufficiently well by the distribution function of the corresponding probability plot. The deviations in the probability range of F(√area) ≤ 10% and F(√area) ≥ 90% should be considered particularly closely, as the deviations for unsuitable distribution functions are usually particularly clear in these ranges (see Figure 4) [22].
Of the three distribution functions examined, the Weibull distribution appears to be the most suitable for describing the defect distribution of steel cleanliness 1 (SC1), as the deviations between the empirical distribution and the best fit line in the Weibull probability plot are the smallest. For steel cleanliness 2 (SC2), the normal distribution appears to be as suitable as the Weibull distribution to describe the defect distribution. Only in the probability plot of the logarithmic normal distribution do the measured values of SC2 deviate from the best fit line in the upper probability region. Furthermore, none of the three distribution functions considered are capable of describing the defect distribution of steel cleanliness 3 (SC3), as none of the probability plots show a good fit between the linear best fit line and the empirical defect distribution. Other two-parameter distribution functions, such as the logistic or log-logistic distribution, also failed to describe the defect sizes of SC3 with sufficient accuracy, so a three-parameter distribution function is used below. The general extreme value distribution (GEV) was chosen as the three-parameter distribution function because previous work has been able to describe the defect distribution in material analysis with a high degree of accuracy [23]. In addition to the usual location and scale parameters used in most two-parametric distribution functions, the GEV additionally uses a shape parameter, which allows the GEV to describe a wider range of measurement data than two-parametric distribution functions.
In addition to the graphical evaluation of the error distributions using probability plots, so-called statistical goodness-of-fit tests can also be used to check the assumed probability distribution [21]. The advantage of statistical goodness-of-fit tests is that the decision as to whether the random variable under investigation follows the assumed distribution function is made on the basis of defined test statistics and limits [21]. In the following, the Kolmogorov–Smirnov goodness-of-fit test (see Figure 5) is used to check the accuracy of the determined defect sizes for all three steel variants using the four selected distribution functions (Weibull, normal, log-normal, and GEV) [21]. The first step is to formulate the H0 and H1 hypotheses, which are as follows:
H0. 
The data follow the assumed F0-distribution.
H1. 
The data do not follow the assumed F0-distribution.
The test statistic is then calculated for each variant using the formula shown in Figure 5. The test statistic corresponds to the maximum distance between the empirical defect distribution and the cumulative probability density function of the assumed distribution (see Figure 5). The critical value of the test statistic is taken from appropriate tables based on the amount of measured data and the selected significance level [21]. Based on a comparison of the calculated test statistic value with the determined critical value, a final assessment is made as to whether the H0 hypothesis can be accepted or whether a decision must be made in favour of the H1 hypothesis (see Figure 5).
The results of the Kolmogrov–Smirnov goodness-of-fit test show that all four distribution functions investigated can be considered suitable for the defect distribution of steel cleanliness 1 and 2 (see Figure 5). Only for steel cleanliness 3 is the H0 hypothesis rejected for the Weibull and normal distributions, so that only the GEV and log-normal distributions can be considered suitable for describing the defect distribution for cleanliness 3. However, a closer look at the plots in Figure 5 shows that the log-normal distribution deviates significantly from the empirical distribution in some cases. This is particularly significant for steel cleanliness 1 and 2, as the deviations occur in the upper probability range and can therefore lead to an overestimation of the defect size. Since particularly large defects have a negative effect on the achievable load capacity, the use of the logarithmic defect distribution to describe the actual defect distribution for the steel cleanliness variants investigated is probably inappropriate. The acceptance of the H0 hypothesis for the logarithmic distribution in the Kolmogrov–Smirnov fitting test can be explained by the characteristics of the test, which gives particular weight to the central probability range and does not take a sufficient account of deviations occurring in the marginal ranges [21]. A possible alternative is the modified Anderson–Darling test [24], which has a sharper significance compared to the Kolmogrov–Smirnov [21] fitting test, with a sufficient number of measured values and being particularly suitable for applications where an edge area, for example, the area of large defects, is of greater interest [21,24]. However, the modified Anderson–Darling test was not used due to the small number of defects available in the upper edge area.

5. Expansion of the Inclusion-Based Model

The previous section has shown that the use of the Weibull distribution alone is not sufficient to describe the defect distribution of different grades of steel cleanliness. For example, it is not possible to adequately describe the defect distribution of steel cleanliness 3 using the Weibull distribution. Therefore, the implementation of additional distribution functions in the inclusion-based model is necessary to more accurately represent the defect distribution of different materials and grades of steel cleanliness.

5.1. Implementation of Additional Distribution Functions

The inclusion-based model is based on a random-based defect generator which allows for the simulation of the defect distribution in the tooth root area using input parameters describing the defect distribution and the defect reference count. For this purpose, the defect generator generates a corresponding number of defects according to the input parameters taking the material volume of the tooth root into account. The position and size of each individual defect is determined by a random number generated for each defect and is used in the model to calculate the local strength (see Figure 6) [8].
In its current state, the inclusion-based model can only generate defects based on the Weibull distribution function using the inverse distribution function of the Weibull distribution (see Figure 6). The scale parameter T and the shape parameter k are specified as user inputs and should be determined based on a material analysis of the gears under investigation. The corresponding defect size can then be calculated directly from the generated random number (see Figure 6). In order to consider additional distributions, it is necessary to implement a case differentiation that allows the defect size to be calculated according to the desired distribution. For the calculation extension, similar to the Weibull distribution (WBD), the respective inverse distribution function or the relationships of the respective distribution function are used (see Equations (2)–(4)). Equation (2) represents the probability density function of the normal distribution (ND), Equation (3) represents the probability density function of the log-normal distribution (LND), and Equation (4) represents the inverse cumulative distribution function of the general extreme value distribution (GEV). As can be seen from these equations, for the GEV (see Equation (4)), the defect size can be calculated directly from the generated random numbers, taking into account the case differentiation. However, for the normal and log-normal distributions, an iterative determination of the defect size is required, since defect size √area is used as an input for the error function in both distribution functions (see Equations (2) and (3)).
F r a n d o m = 0.5 · 1 + e r f a r e a μ 2 σ
F r a n d o m = 0.5 · 1 + e r f l n a r e a μ 2 · σ
a r e a = μ σ · ln ln F r a n d o m             for   ξ = 0   and   F 0,1 μ + σ ξ · ln F r a n d o m ξ 1   for   ξ > 0   and   F 0,1 or   ξ < 0   and   F 0,1

5.2. Sensitivity Analysis of Defect Distribution Functions

In order to verify the model extension described and implemented in the previous section, a sensitivity analysis is carried out on the influence of the defect distribution function on the tooth root bending strength calculated using the extended inclusion-based model. The sensitivity analysis is carried out on the standard test gear presented in Section 4.1. The sensitivity analysis takes into account both the residual stress and hardening depth curves shown in Figure 3 and the values determined in the material analysis for the location, scale, and shape parameters of the respective distribution functions of all three grades of steel cleanliness. Table 1 gives an overview of the values of the individual parameters used in the sensitivity analysis, as determined by the material analysis performed.
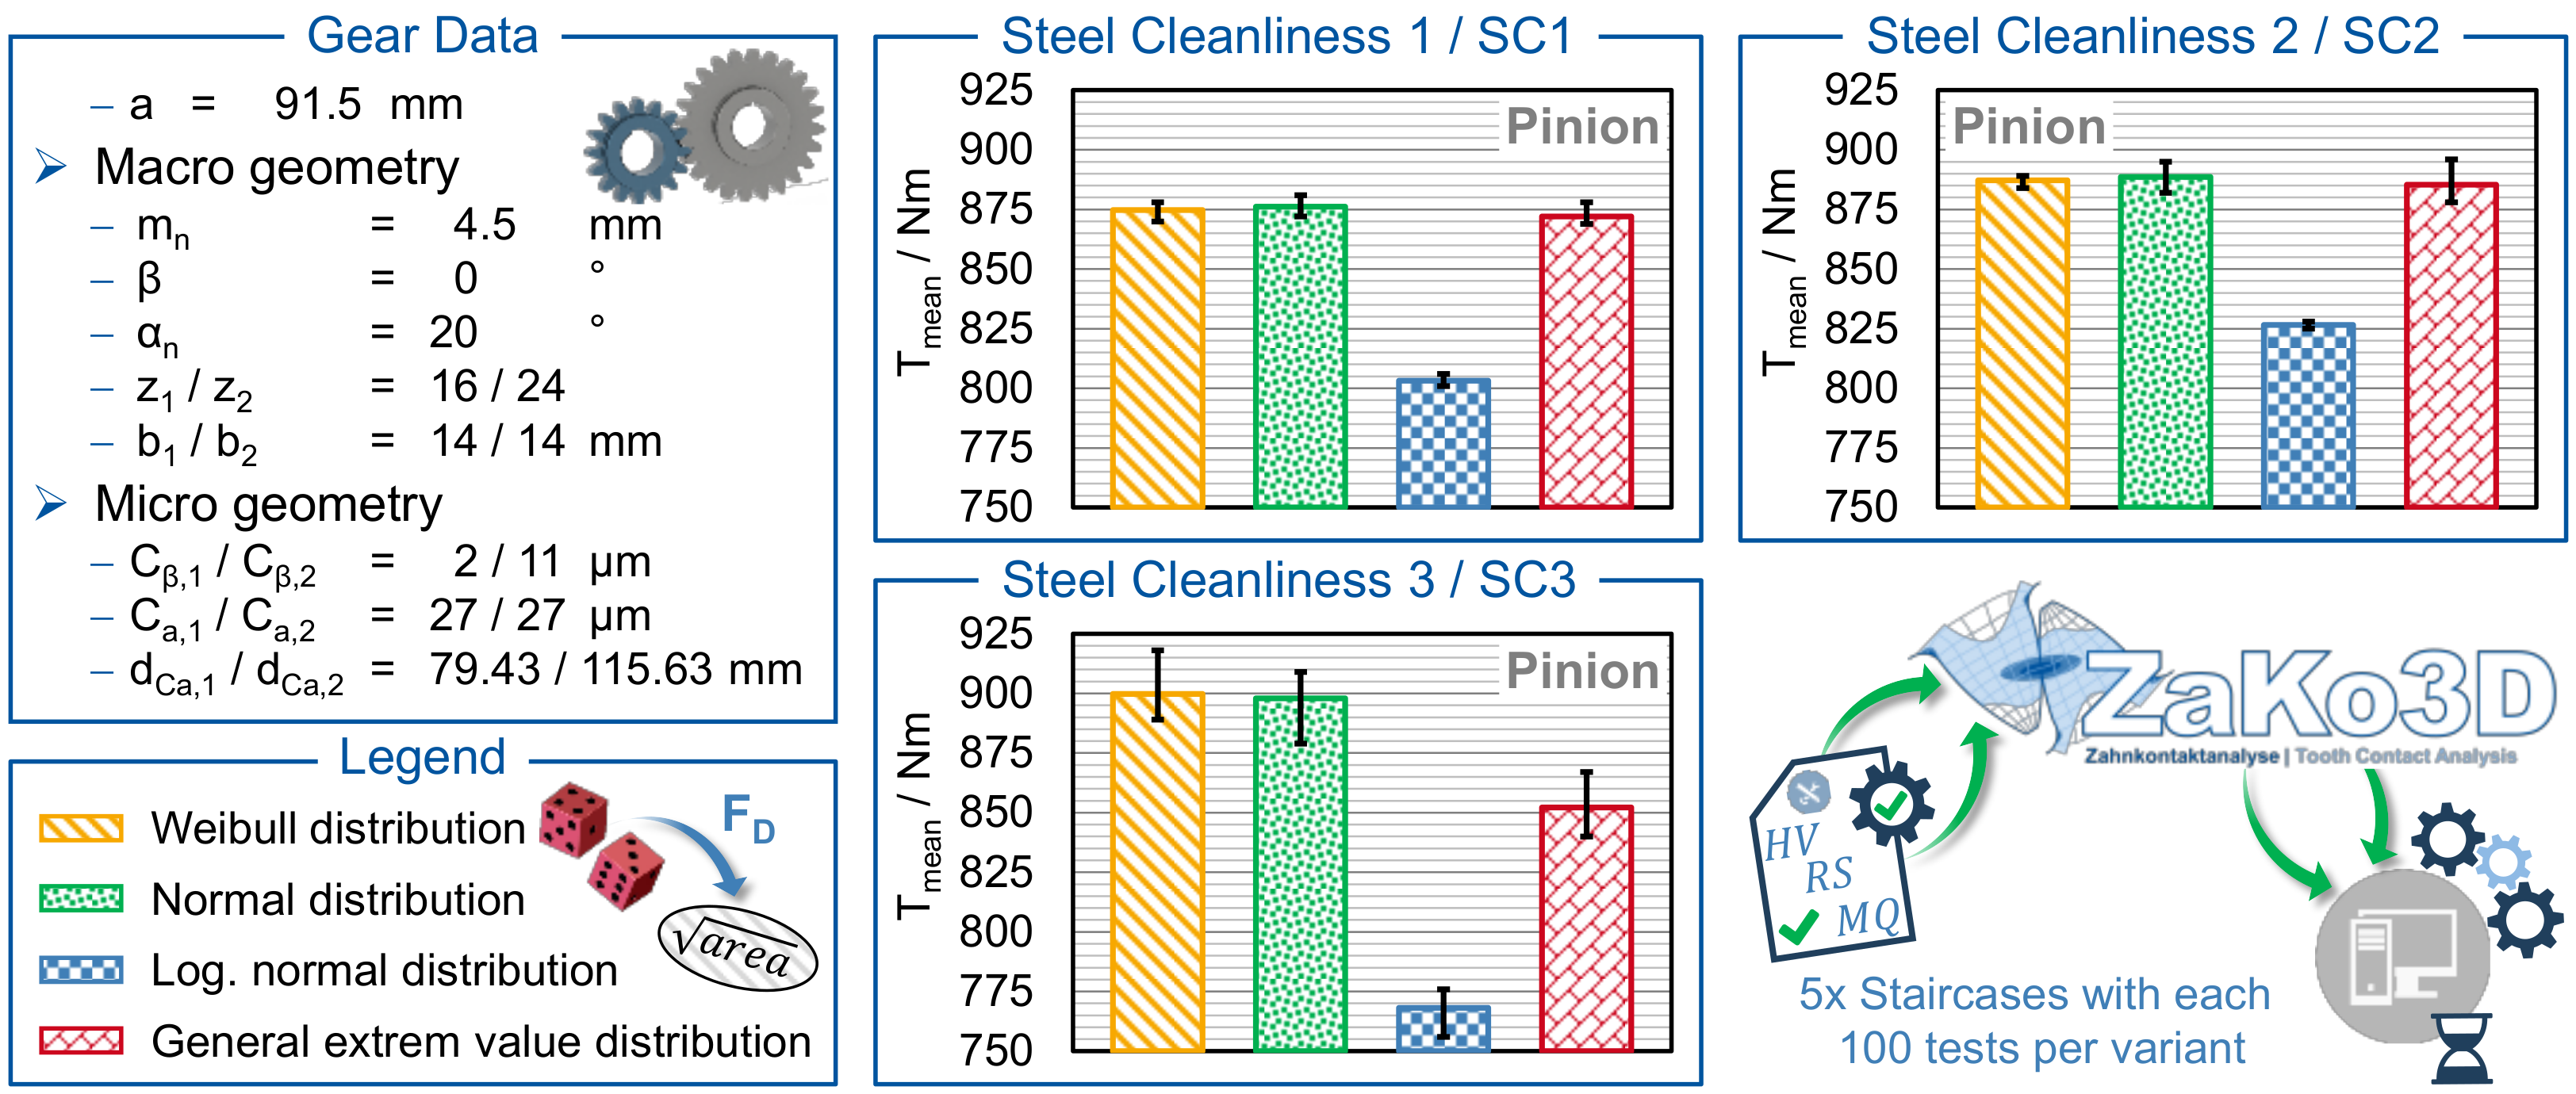
A total of five complete staircase steps with ntest = 100 tests each were simulated for each variant in order to take into account the scatter of the calculated total mean torque in addition to the mean torque of each complete staircase. The results of the tooth root bending strength calculations carried out using the extended inclusion-based model are shown in Figure 7.
When the Weibull, normal, and general extreme value distributions are used, the mean torque is almost identical for steel cleanliness 1. It is only when the log-normal distribution is used that a significant reduction in tooth root bending strength can be seen compared to the other defect distributions for steel cleanliness 1. This reduction can be attributed to the problem of mapping the defect distribution in the area of large defects, i.e., the deviations between the empirical and log-normal distribution, as described in Section 4.2 (see Figure 4). The results for steel cleanliness 2 show a similar pattern, as the choice of distribution function used (Weibull, normal, and GEV) has no discernible effect on the tooth root bending strength calculation for these variants either. All three distribution functions mentioned are capable of modelling the defect distribution with sufficient accuracy (see Figure 4). The situation is different for steel cleanliness 3, where the tooth root bending strength determined by the GEV distribution deviates from the Weibull and normal distributions. However, as the material analysis carried out has shown, the GEV distribution is the only one that can represent the defect distribution of steel grade 3 with sufficient accuracy. On the basis of current knowledge, it can be assumed that the average achievable mean torque is closer to the calculated range of the GEV variant than to the values of the other three distribution functions. At the same time, the distribution function of the GEV distribution only approaches the limit F(√area) = 1 at √area > 130 μm, which means that a bias of the results due to large defects is possible. Such a bias could also explain the calculated difference in tooth root bending strength between steel cleanliness 2 and 3, since no deterioration in tooth root bending strength is expected with an improvement in steel cleanliness, as shown by the results in Figure 7. By extending the material analysis, the parameters of the defect distributions can be determined more accurately so that the calculation method can also reflect the real conditions more accurately. Overall, the results are in line with the expectations from the material analysis (see Figure 4 and Figure 5) and confirm the need to extend the inclusion-based model with additional distribution functions to be used for other materials and cleanliness levels.

6. Application of Expanded Inclusion-Based Model

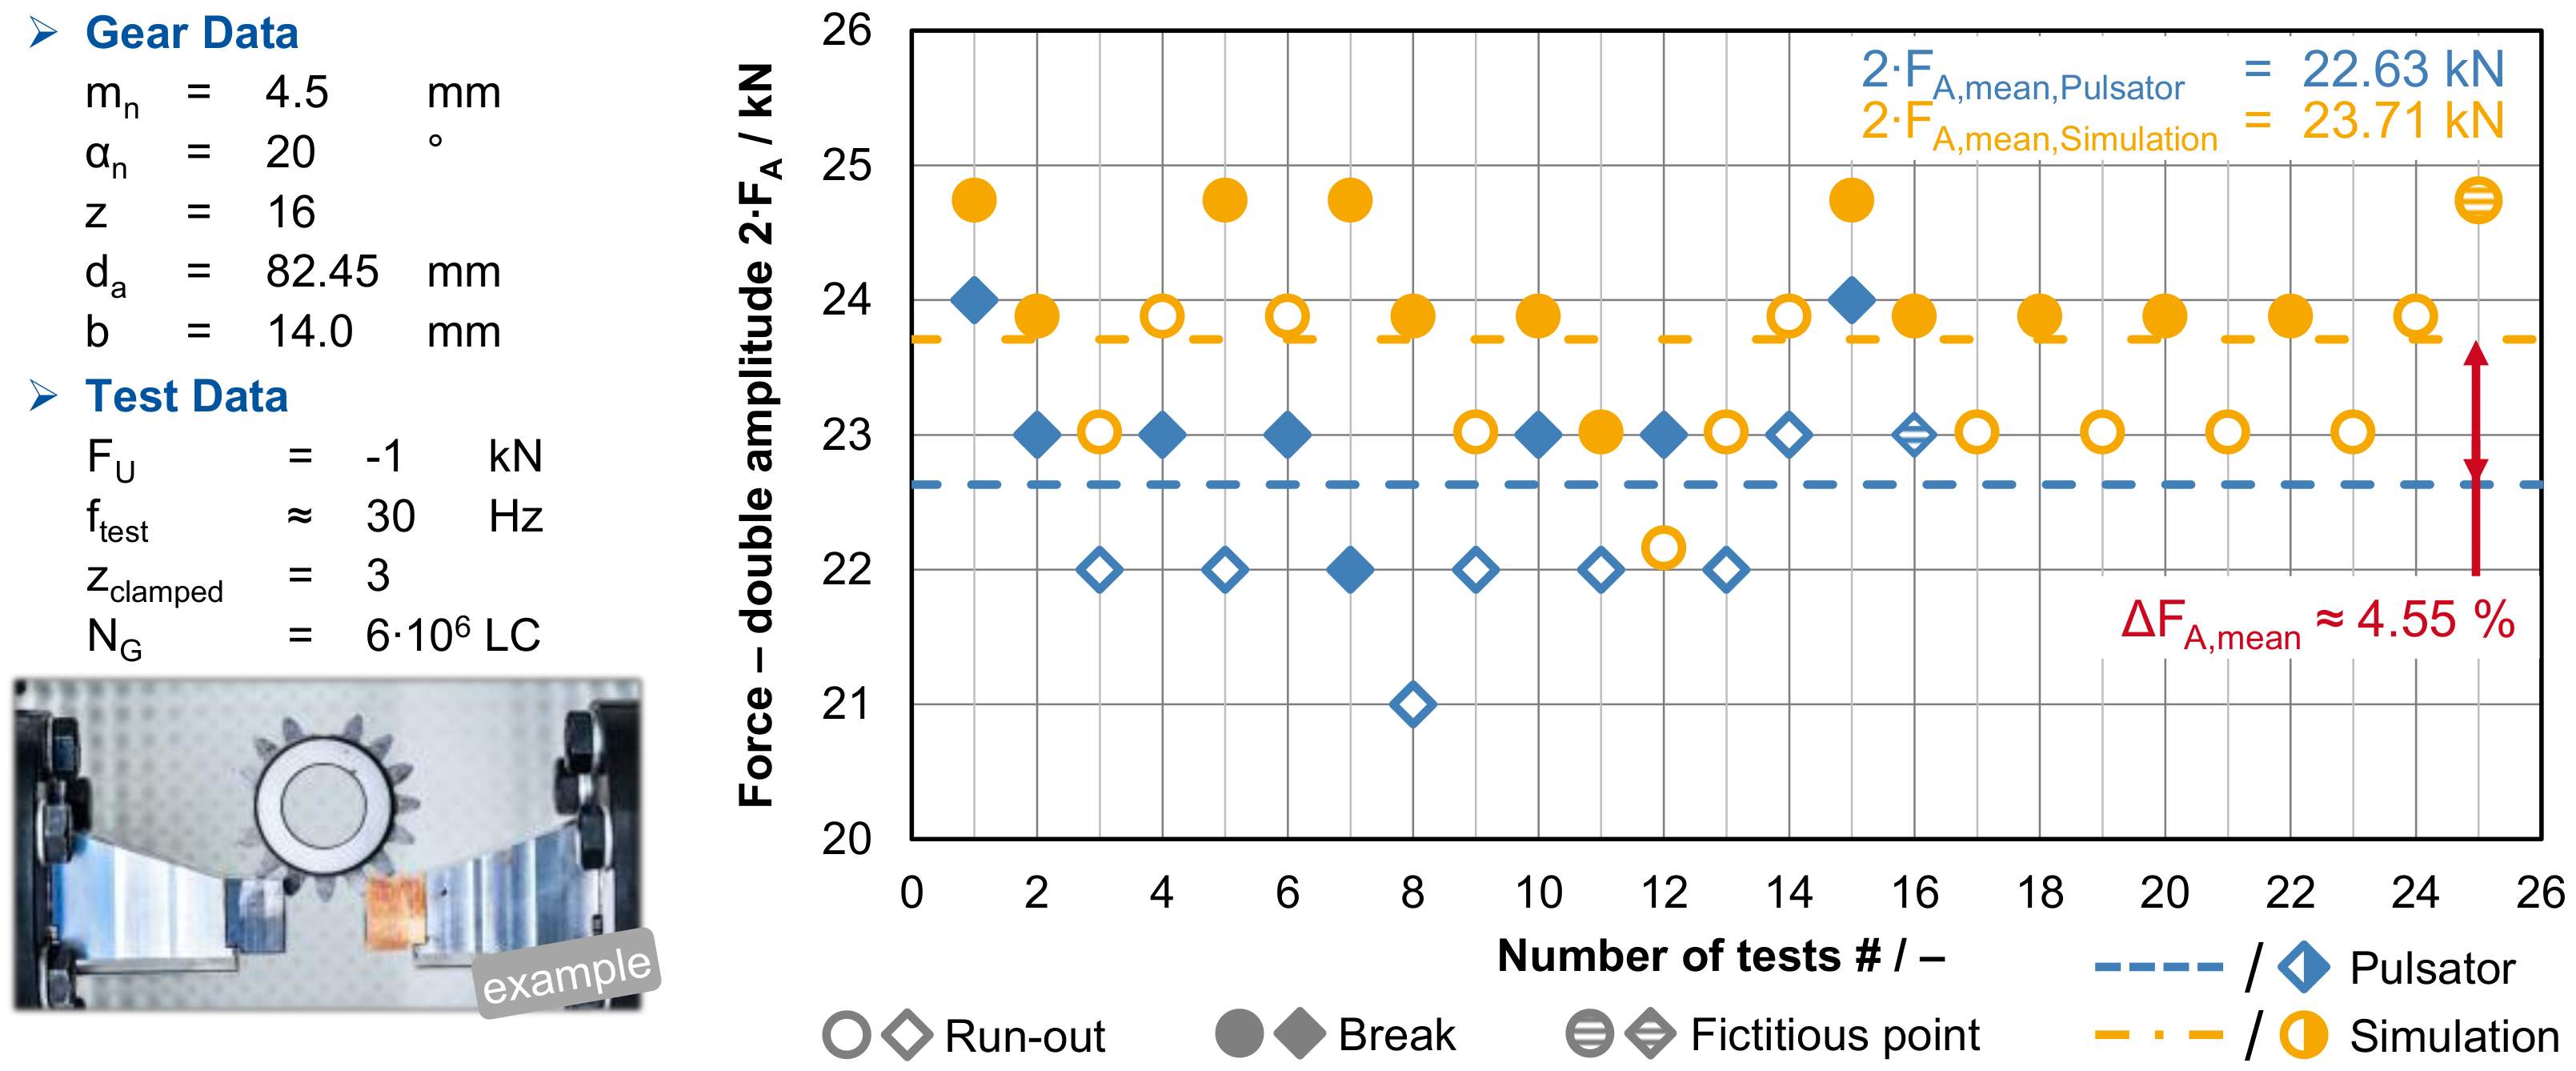
In addition to using the inclusion-based model for real applications and gears in the running test, it is also possible to use the model to calculate the tooth root bending strength of gears in a pulsator test after making a few adjustments. The number of defects generated by the defect generator must be reduced accordingly from the total number of teeth of the gear under consideration to only two teeth, since in the pulsator test, unlike the running test, only two teeth are tested simultaneously (see Figure 8).
The pulsator results shown in Figure 8 were carried out by Trippe et al. on a standard 20MnCr5 test gear of conventional cleanliness [10]. A clamping force of FU = 1 kN was used in the pulsator to fix the test gears during testing [10]. The tests were performed with three teeth clamped and a test frequency of approximately fTest ≈ 30 Hz [10]. Using the Hück staircase method, a tooth root bending strength of 2∙FA,mean,pulsator = 22.63 kN was determined for a limiting number of load cycles of NG = 6 × 10⁶ load cycles and a failure probability of PA = 50% [10,16].
The results of the load capacity simulation carried out using the inclusion-based model adapted to the pulsator show a tooth root load capacity of 2∙FA,mean,simulation = 22.63 kN, which is approximately FA,mean = 4.55% higher than the tooth root load capacity in the pulsator determined by Trippe et al. [10]. The difference between the two values is due to a number of influences, which are briefly explained below.
The inclusion-based model is designed to simulate a running test; therefore, the clamping force in the real pulsator test cannot be taken into account when calculating the tooth root bending strength. The average stresses in the local strength calculation are lower than those in the pulsator test, resulting in an increase in tooth root bending strength. Furthermore, the maximum stress in the simulation model is determined on the basis of all the rolling positions of a running test and not on the basis of the actual contact conditions in the pulsator, which would be equivalent to considering only a single rolling position (the contact line in the pulsator). In the specific application case, the consideration of the single rolling position would result in a reduction in the stresses in the local strength calculation and thus an increase in the tooth root bending strength determined. Furthermore, the inclusion-based model is currently only capable of performing the local strength calculation based on the strain energy hypothesis or the normal stress hypothesis. However, in ISO 6336-3, the root load bending strength is calculated using the tangential stresses in the tooth height direction [13]. As the values of the tangential stresses in the tooth root are generally greater than those of the equivalent stresses, a reduction in the calculated tooth root bending strength is to be expected when the local strength is calculated using the tangential stresses that occur. In addition, the defect distribution parameters used were determined on a different batch of material, so variations in local material strength due to different material qualities cannot be ruled out.

7. Summary and Conclusions

The inclusion-based model allows for the tooth root bending strength of gears to be calculated as a function of the defect distribution of the material and is therefore also suitable for calculating the tooth root bending strength of ultra-clean steels. The previous inclusion-based model could only represent materials whose defect distribution follows a Weibull distribution. Therefore, it was first investigated whether the defect distributions of different grades of steel cleanliness could be represented by a Weibull distribution. However, a material analysis on different grades of steel cleanliness has shown that the defect distribution can vary greatly and cannot be represented with sufficient accuracy by a Weibull distribution. Another two parametric distribution functions (normal and log-normal) were also unable to accurately describe the defect distribution of all the degrees of cleanliness considered. For this reason, the general extreme value distribution was used, as it is a three-parametric distribution function. This provides an additional degree of freedom to map the defect distribution. The additional degree of freedom allowed for an improvement in the quality of the defect distribution mapping in high-clean steels.
The existing inclusion-based model was then extended by implementing the considered distribution functions (normal, log-normal, and general extreme value) so that a wider range of defect distributions could be considered in the model. The subsequent sensitivity analysis showed that variations of up to ΔTmean = 17% in the calculated root bending strength can result from a change in the distribution function used to map the material defects. This means that the mapping quality of the defect distribution has a direct influence on the calculated strength values. As it is the area of large defects that has the greatest influence on the calculation, a very good mapping quality in this area is of great importance. Probability plots are suitable for assessing the mapping quality but require some experience in their application and interpretation. An alternative could be the Anderson–Darling test, which gives greater weight to the area of larger defects when evaluating mapping quality and is easy to apply.
The results of the subsequent verification of the inclusion-based model based on pulsator results show that the calculation of the mean bending strength of gears in pulsator investigations is generally possible with the extended inclusion-based model. Despite the small number of micrographs (25 pcs) used to determine the defect distribution parameters, the deviation in the mean bending strength between the pulsator tests and the calculation was ΔFA,mean < 5%. The inclusion-based model thus offers the potential to improve the statistical significance of pulsator test results by supplementing the limited number of practical test points with the virtual test points of the inclusion-based model.

Author Contributions

Conceptualization, C.E. and D.M.; methodology, C.E. and D.M.; investigation, C.E. and D.M.; project administration; C.E.; resources, C.W. and C.B.; writing—original draft preparation, C.E.; writing—review and editing, D.M., C.W. and C.B.; supervision, C.W. and C.B. All authors have read and agreed to the published version of the manuscript.

Funding

This research received no external funding.

Data Availability Statement

The original contributions presented in the study are included in the article, further inquiries can be directed to the corresponding author.

Conflicts of Interest

The authors declare no conflicts of interest.

References

  1. Kratzer, D.; Koller, P.; Tobie, T.; Stahl, K. Investigation of the effects of surface roughness and shot peening on the tooth root bending strength of case-carburized gears. J. Mech. Sci. Technol. 2022, 36, 731–740. [Google Scholar] [CrossRef]
  2. Hellenbrand, G.; Steinbacher, M.; Brecher, C.; Fechte-Heinen, R. Turbohochtemperaturstahl: FVV Nr. 1386|Zwischenbericht (ZB). In Proceedings of the FVV Transfer + Networking Event March 2023, Würzburg, Germany, 30 March 2023; FVV e.V.: Frankfurt am Main, Germany, 2023; pp. 614–645. [Google Scholar]
  3. Kamjou, L.; Ölund, P.; Claesson, E.; Fagerlund, J.; Wicks, G.; Wennmo, M.; Hansson, H. Innovative Steel Design and Gear Machining of Advanced Engineering Steel. Gear Technol. 2016, 33, 82–87. [Google Scholar]
  4. ISO 6336-1; Calculation of Load Capacity of Spur and Helical Gears—Part 1: Basic Principles, Introduction and General Influence Factors, 3rd ed. ISO Copyright Office: Geneva, Switzerland, 2019.
  5. ISO 6336-5; Calculation of Load Capacity of Spur and Helical Gears—Part 5: Strength and Quality of Materials, 3rd ed. ISO Copyright Office: Geneva, Switzerland, 2016.
  6. AGMA 908-B89; Geometry Factors for Determining the Pitting Resistance and Bending Strength of Spur, Helical and Herringbone Gear Teeth. American Gear Manufacturers Association: Alexandria, VA, USA, 1989.
  7. Hertter, T. Rechnerischer Festigkeitsnachweis der Ermüdungstragfähigkeit Vergüteter und Einsatzgehärteter Stirnräder. Ph.D. Thesis, TU München, München, Germany, 2003. [Google Scholar]
  8. Henser, J. Berechnung der Zahnfußtragfähigkeit von Beveloidverzahnungen. Ph.D. Thesis, RWTH Aachen University, Aachen, Germany, 2015. [Google Scholar]
  9. Fuchs, D. Einfluss Mikroskopischer Fehlstellen auf die Zahnfußtragfähigkeit. Ph.D. Thesis, TU München, München, Germany, 2023. [Google Scholar]
  10. Trippe, M.; Löpenhaus, C.; Brecher, C.; Kamjou, L.; Löthman, E. Tooth Root Testing of Steels with High Cleanliness. Gear Solut. 2020, 18, 29–36. [Google Scholar]
  11. Bretl, N.; Schurer, S.; Tobie, T.; Stahl, K.; Höhn, B.-R. Investigations on Tooth Root Bending Strength of Case Hardened Gears in the Range of High Cycle Fatigue. Therm. Process. 2014, 3, 52–59. [Google Scholar]
  12. Fuchs, D.; Schurer, S.; Tobie, T.; Stahl, K. On the determination of the bending fatigue strength in and above the very high cycle fatigue regim of shot-peened gears. Forsch. Ingenieurwesen 2022, 86, 81–92. [Google Scholar] [CrossRef]
  13. ISO 6336-3; Calculation of Load Capacity of Spur and Helical Gears—Part 3: Calculation of Tooth Bending Strength, 3rd ed. ISO copyright Office: Geneva, Switzerland, 2019.
  14. Klocke, F.; Brecher, C. Zahnrad-und Getriebetechnik: Auslegung—Herstellung—Untersuchung—Simulation, 2nd ed.; Carl Hanser: München, Germany, 2024; ISBN 978-3-446-46975-4. [Google Scholar]
  15. Murakami, Y. Metal Fatigue: Effects of Small Defects and Nonmetallic Inclusions, 2nd ed.; Elsevier Ltd.: London, UK, 2019. [Google Scholar]
  16. Hück, M. Auswertung von Stichproben normalverteilter, quantitativer Merkmalsgrößen. Mater. Und Werkst. 1994, 25, 20–29. [Google Scholar] [CrossRef]
  17. Schurer, S. Einfluss Nichtmetallischer Einschlüsse in Hochreinen Werkstoffen auf die Zahnfußtragfähigkeit. Ph.D. Thesis, TU München, München, Germany, 2016. [Google Scholar]
  18. Fuchs, D.; Tobie, T.; Stahl, K. Challenges in determination of microscopic degree of cleanliness in ultra-clean gear steels. J. Iron Steel Res. Int. 2022, 29, 1583–1600. [Google Scholar] [CrossRef]
  19. Murakami, Y.; Toriyama, T.; Coudert, E.M. Instructions for a New Method of Inclusion Rating and Correlations with Fatigue Limit. J. Test. Eval. 1994, 22, 318–326. [Google Scholar] [CrossRef]
  20. Brecher, C.; Löpenhaus, C.; Pollaschek, J. Automated Defect Size Determination for Gear Tooth Root Bending Strength Simulation. WIT Trans. Eng. Sci. 2017, 116, 87–97. [Google Scholar]
  21. Hedderich, J.; Sachs, L. Angewandte Statistik: Methodensammlung mit R, 17th ed.; Springer Spektrum: Berlin, Germany, 2020. [Google Scholar]
  22. Zenner, H.; Mauch, H. (Eds.) Statistische Methoden zur Beurteilung von Bauteillebensdauer und Zuverlässigkeit und ihre Beispielhafte Anwendung auf Zahnräder; Research Association for Drive Technology: Frankfurt am Main, Germany, 1999. [Google Scholar]
  23. Goergen, F. Analogieversuch zur Erzeugung von Zahnflankenbrüchen an Stirnrädern. Ph.D. Thesis, RWTH Aachen University, Aachen, Germany, 2023. [Google Scholar]
  24. Ahmad, M.I.; Sinclair, C.D.; Spurr, B.D. Assessment of Flood Frequency Models Using Empirical Distribution Function Statistics. Water Resour. Res. 1988, 24, 1323–1328. [Google Scholar] [CrossRef]
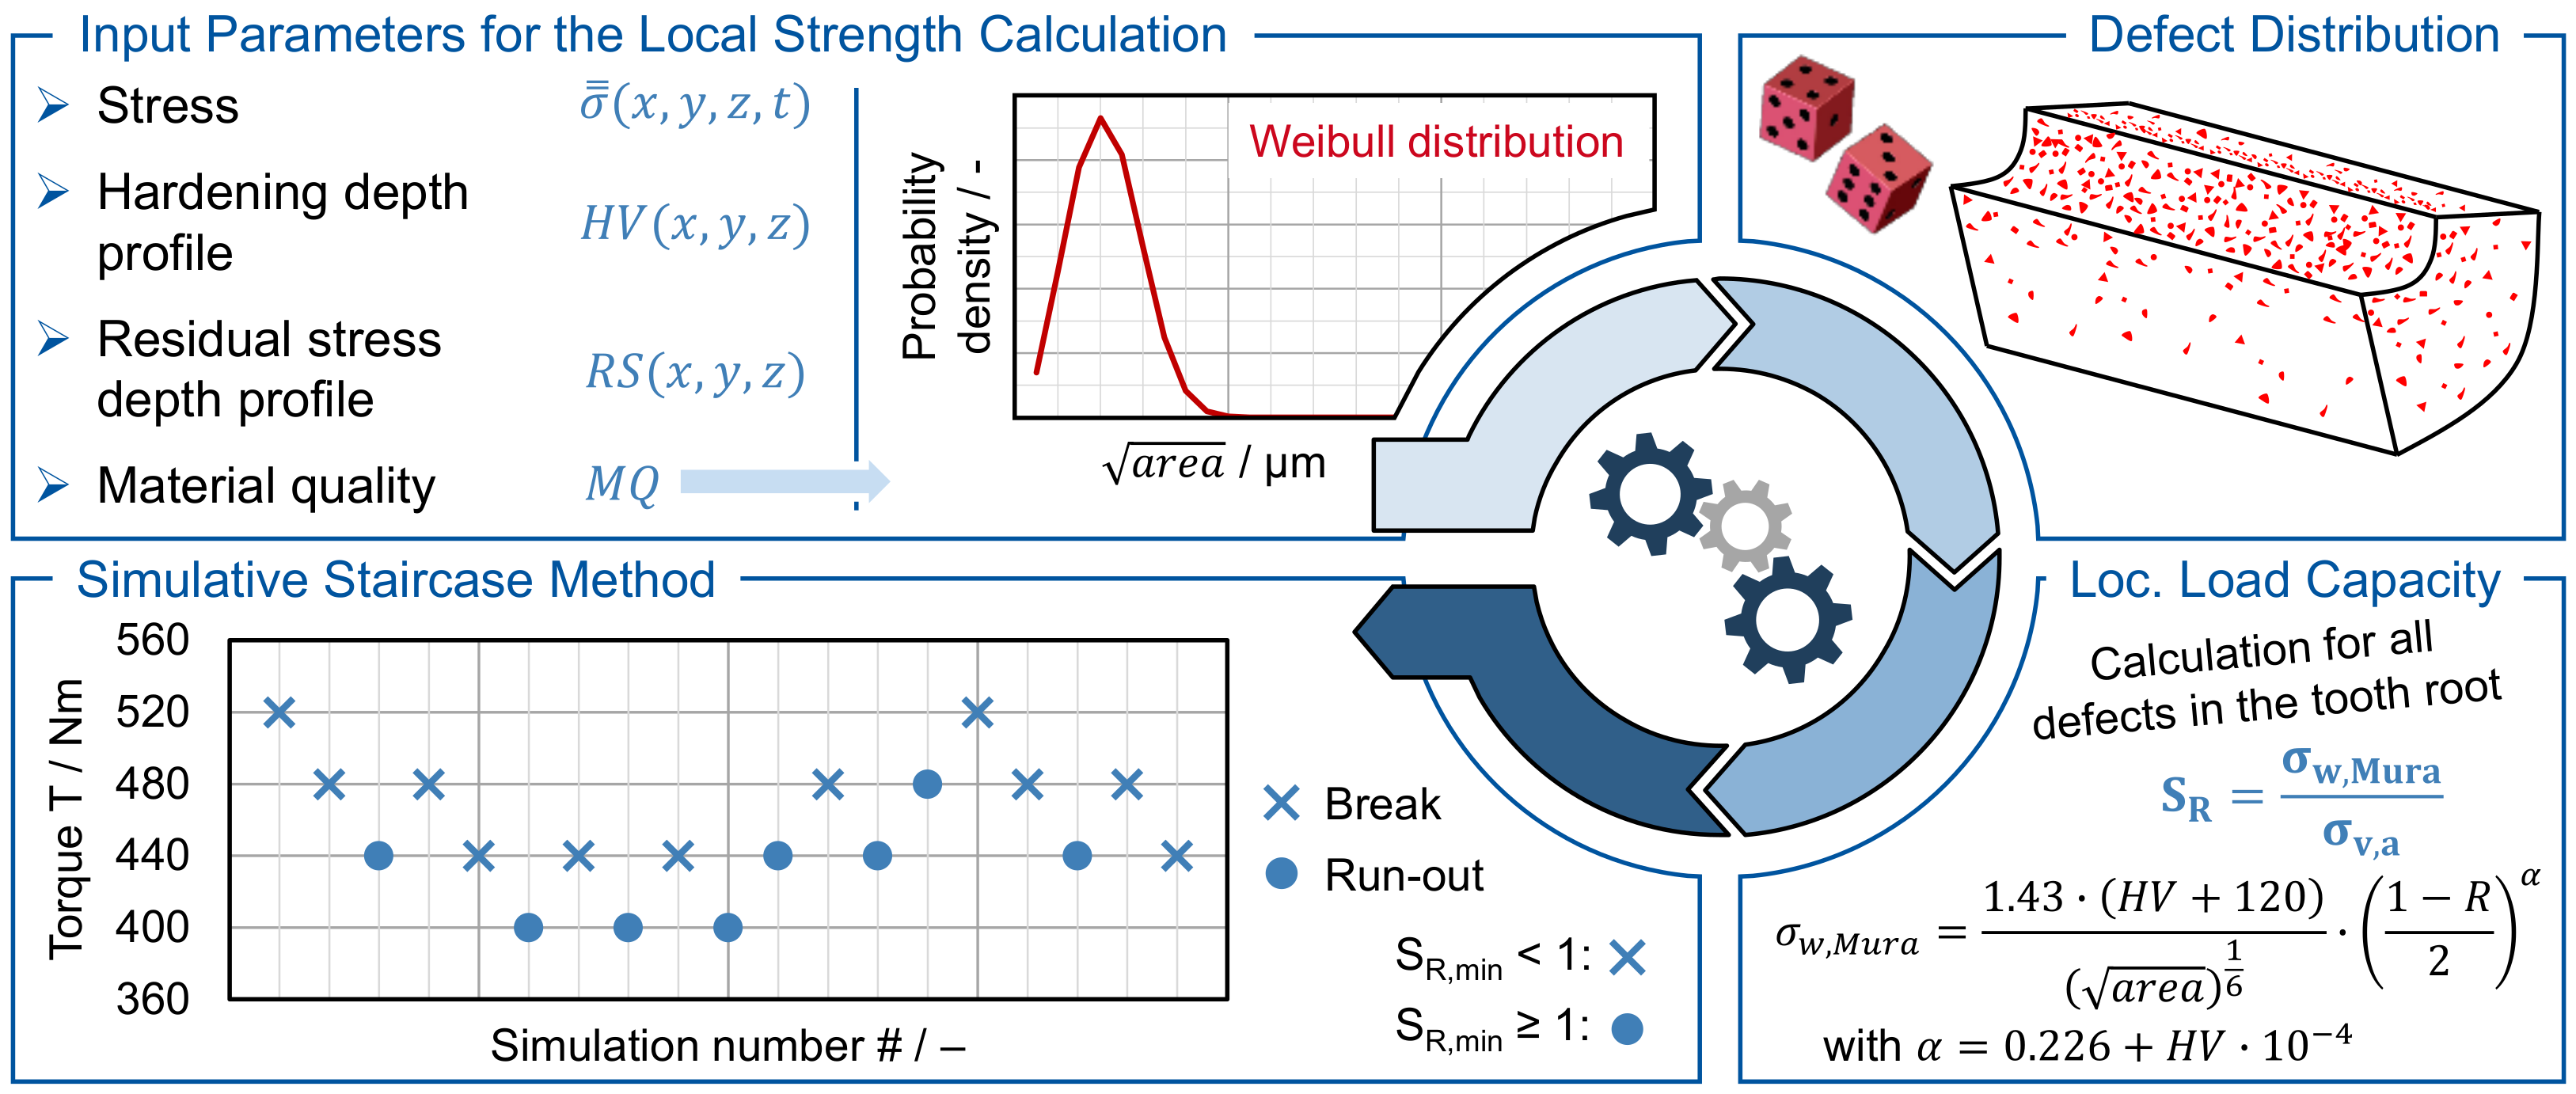
Figure 1. Simulation process of the inclusion-based model according to Henser. (Procedure adapted from Ref. [8]).
Metals 14 01349 g001
Figure 2. Characterisation of test gears.
Metals 14 01349 g002
Figure 3. Material analysis—procedure and exemplary microsections.
Metals 14 01349 g003
Figure 4. Material defect distribution for 20MnCr5 of different grades of cleanliness.
Metals 14 01349 g004
Figure 5. Checking the goodness-of-fit for all considered distribution functions.
Metals 14 01349 g005
Figure 6. Model adaption to account for different defect distributions.
Metals 14 01349 g006
Figure 7. The influence of the material defect distribution on the tooth root bending strength calculation in the running test.
Metals 14 01349 g007
Figure 8. Tooth root bending strength comparison between pulsator and simulation: 20MnCr5 of conventional cleanliness. (Pulsator results adapted from Ref. [10]).
Metals 14 01349 g008
Table 1. An overview of the parameters used for the sensitivity analysis.
ParametersSC1SC2SC3
Defect reference countND,refDefect reference count acc. To [HENS15; BREC17]0.0210.00110.0005
Weibull
distribution (WBD)
TScale parameter47.6532.1217.82
kShape parameter2.484.951.45
Normal
distribution (ND)
μLocation parameter42.2329.4615.90
σScale parameter18.406.9513.55
Log-normal
distribution (LND)
μLocation parameter3.653.352.58
σScale parameter0.470.260.54
General extreme value
distribution (GEV)
μLocation parameter34.4127.289.97
σScale parameter14.967.032.73
ξShape parameter−0.06−0.350.75
Disclaimer/Publisher’s Note: The statements, opinions and data contained in all publications are solely those of the individual author(s) and contributor(s) and not of MDPI and/or the editor(s). MDPI and/or the editor(s) disclaim responsibility for any injury to people or property resulting from any ideas, methods, instructions or products referred to in the content.