Article

Welding Pores Evolution in the Detector Bottom-Locking Structure Fabricated Using the Hybrid Pulsed Arc–Laser Method

1
CNNC 404 Limited, Lanzhou 735100, China
2
School of Materials Science and Engineering, Lanzhou University of Technology, Lanzhou 730050, China
3
Zhejiang Key Laboratory of Advanced Solid State Energy Storage Technology and Applications, Taizhou Institute of Zhejiang University, Taizhou 318000, China
*
Authors to whom correspondence should be addressed.
Metals 2024, 14(12), 1469; https://doi.org/10.3390/met14121469
Submission received: 14 November 2024 / Revised: 19 December 2024 / Accepted: 20 December 2024 / Published: 23 December 2024

Abstract

:
The welding of the bottom-locking structure in a detector receptacle plays an essential role in ensuring the safety of nuclear equipment. A pulsed TIG–laser hybrid welding method is proposed to address the problem of welding pores in locking structural parts. The effects of the pulse frequency on the escape of porosity and of porosity on the mechanical properties of the hybrid welding joint were investigated. The results were compared to those of direct current (0 Hz), showing that the pulse frequency affects the stability of the arc. With an increase in pulse frequency, the grain size of the fusion zone gradually decreases, and the flow in the middle area of the molten pool increases. This subjects bubbles in the molten pool to a thrust force, which causes the bubbles to escape to the surface of the molten pool. Compared with 0 Hz, the tensile strength of the joint increased by 67%. This provides a new solution for obtaining reliable welded joints for the bottom-locking structure of detector storage tanks.

1. Introduction

The lock bottom structural components of storage tanks in reactor detectors need to serve various complex roles, such as a high material performance and service life [1,2]. These lock bottom structures are composed of an upper butt plate and a bottom pad, which determine the form of the overall structure via butt + lap hybrid welding. Moreover, these structures commonly use 316L stainless steel because of its excellent corrosion resistance [3] and high-temperature performance; furthermore, 316L stainless steel is also widely used in nuclear industry detectors, environmental testing equipment, oil and gas industry detectors, and other fields [4,5,6].
Currently, for the welding of 316L stainless steel structural parts, researchers mainly use arc welding (including Tungsten Inert Gas Welding (GTAW) and Gas Metal Arc Welding (GMAW)) and high-energy beam welding (such as laser welding and electron beam welding). Although GTAW can obtain joints with excellent mechanical properties, its low efficiency increases product costs [7]. GMAW has received widespread attention due to its high efficiency, but the performance of the joint is inferior when welding thick plates [8]. High-energy beam welding has unique advantages in thick-plate welding [9,10]. However, electron beam welding is limited to a vacuum environment, and the workpiece size and processing costs are subject to certain restrictions [11]. Although laser welding is not limited by size, it is prone to defects, such as pores and cracks, due to its rapid cooling rate and large thermal gradient [12,13,14]. Laser–arc hybrid welding technology not only combines the advantages of both but also effectively improves the mechanical properties of the weld, so it has attracted widespread attention from scholars [15,16].
However, welding pores are inevitably produced during laser–arc hybrid welding. Porosity reduces the mechanical properties of the joint and increases the risk of workpiece failure [15,17,18]. Zhan et al. [19] used laser–MIG hybrid welding to weld 6.9 mm 5A06 aluminum alloy plates. It was found that the pores in the joint are mainly concentrated in the upper area of the welded joint. The pores cause the joint to soften, significantly influencing its microhardness. M. Mazar et al. [20] studied the effects of laser–arc hybrid welding (HLAW) process parameters on the defects of high-strength steel (AHSS) joints. The results show that the pores in the joint cause the weld fracture to mainly present as a brittle fracture. Adjusting the process parameters can effectively avoid pore formation and improve the mechanical properties of the joint. To avoid pore defects, Cui et al. [21] used laser–arc hybrid welding on high-nitrogen steel (HNS) and found that the welding heat input had a greater influence on weld porosity. The porosity in the weld can be further controlled by adjusting the process parameters. Chen et al. [22] studied the effects of laser–arc hybrid welding on the weld morphology and porosity of AA2219 aluminum alloy; it was found that these characteristics are related to the gravity–laser angle (β), which affects the keyhole stability and molten pool characteristics. Su et al. [23] reported that as the diameter and frequency of the oscillating laser increased, the lock hole morphology and droplet transfer gradually stabilized, the flow within the molten pool further increased, and the porosity gradually reduced.
At present, the detection of pores after welding mainly relies on nondestructive testing technology (X-ray, ultrasonic, and penetration testing) [24]. Although these methods can effectively evaluate pore defects, they can only be evaluated after welding is completed, and they cannot achieve real-time monitoring. To study the formation mechanism of pores and their influencing factors, researchers have adopted numerical simulation technology to carry out relevant research [25]. Zhang et al. [26] used numerical simulations to determine the cyclic behavior of locking holes in the quasi-steady-state stage, which proved that full-penetration laser welding can effectively suppress porosity. Wang et al. [27] investigated oscillatory welding with different paths and found that the reduction in porosity in the fusion zone was related to the weld shape and the reduction in the weld depth-to-width ratio caused by the oscillation of the heat source. Shi et al. [28] studied and discussed the molten pool dynamics of oscillating laser–arc hybrid welding (O-LAHW). Their results showed that beam vibration can reduce heat accumulation and suppress spatter and pores. Huang et al. [29] investigated how the welding current influences the critical nucleation radius by establishing two bubble nucleation models.
However, few studies have reported the formation mechanism of pores in the hybrid welding process. Therefore, it is crucial to investigate the formation mechanism of pulsed laser–TIG hybrid pores to provide a reliable solution for the welding of reactors’ structural components.
This article focuses on the key technology of welding 316L stainless steel lock bottom structural parts of storage tanks in reactor detectors and the effects of the arc pulse frequency on pore overflow in laser–pulse TIG hybrid welding. This study reveals the impact of pulse frequency on the fluidity of the molten pool and discusses the influence of pores on the mechanical properties of composite welded joints. The research results provide an important theoretical basis and technical guidance for optimizing the welding process of 316L stainless steel lock bottom structural parts. In the future, the solution to suppress welding porosity will be further explored to obtain welding joints with excellent performance.

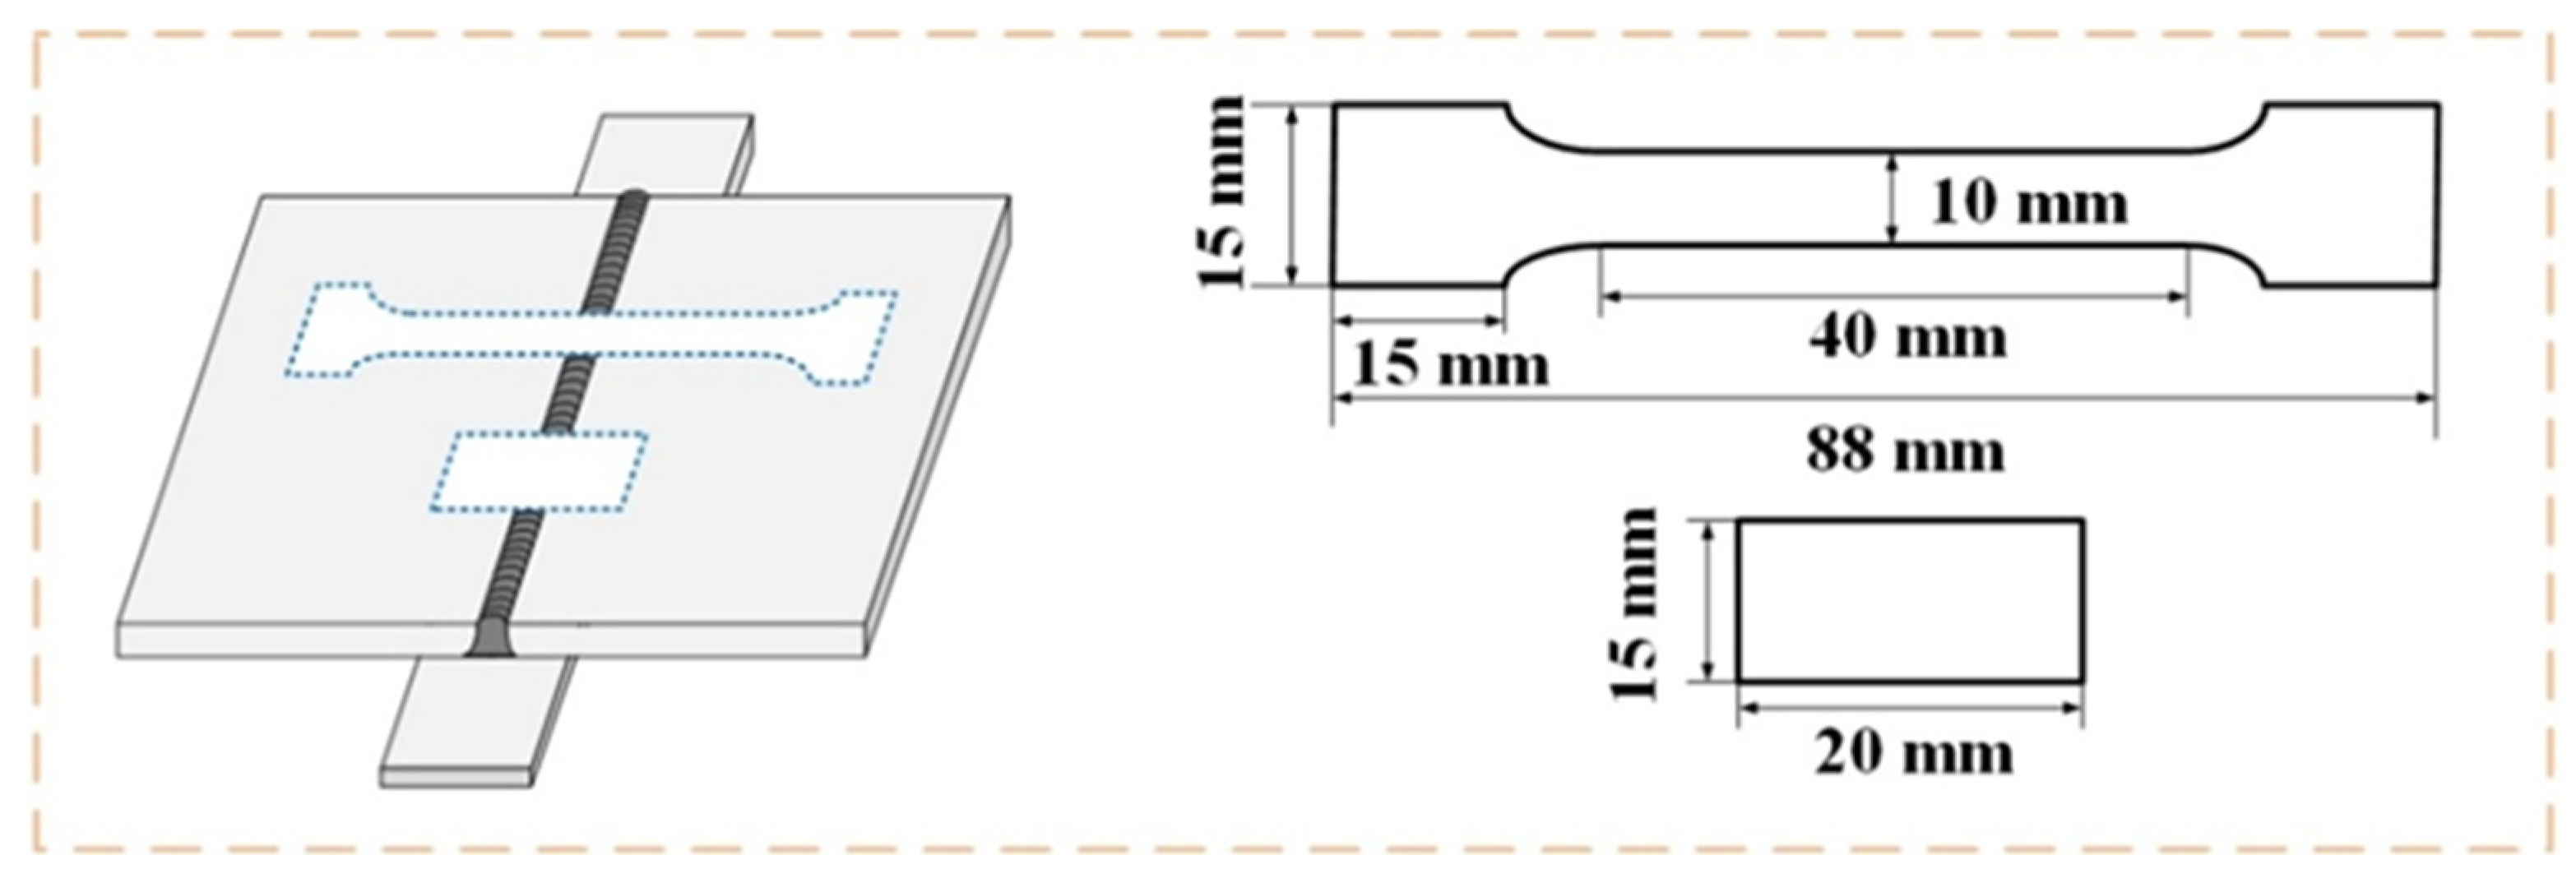
2. Experimental System and Materials

The experimental system of this study is shown in Figure 1a. The HS-CM-3000-C-G2 continuous fiber laser produced by Han’s Laser Technology Industry Group Co., Ltd. (Guangzhou, China) and the YC200-BL3 DC TIG welder produced by Panasonic Welding Systems Co., Ltd. (Tangshan, China) were used. The laser beam wavelength was 1080 nm, and the fiber core was 0.1 mm. The positional relationship between the laser and the arc is shown in Figure 1b. The angle between the tungsten electrode and the substrate was 60°(θ1), and the tungsten tip was at a distance of 5 mm (H1) from the substrate. To protect the equipment from being damaged by the reflection of the laser beam, the laser axis was clamped to the vertical line at 15°(θ2). The laser beam was out of focus at a distance of +2 mm (f), and the tip of the tungsten electrode was 3 mm (D1) from the laser beam.
As shown in Figure 1c, 316L stainless steel was used as the substrate. The plate consists of two butt plates and a bottom pad plate. The dimensions of the butt plates are 100 mm × 50 mm × 3 mm, and those of the bottom pad plate are 120 mm × 15 mm × 2 mm. Table 1 and Table 2 show the chemical composition and the physical and mechanical properties of the 316L stainless steel, respectively.
Based on pre-experimental verification and the weld seam’s macroscopic morphology, four arc groups of pulse frequencies were selected for the experiment: 0 Hz, 50 Hz, 250 Hz, and 500 Hz. Direct current (0 Hz) was used as the control group. To avoid weld oxidation, argon with a purity of 99.9% was used as the shielding gas. The shielding gas flow rate and other parameters remained unchanged, as shown in Table 3. To avoid surface contamination before the test, the surface of the base material was mechanically polished and cleaned with alcohol and acetone solutions.
After the welding process, the specimens were mechanically processed, and samples for metallographic and tensile testing were prepared, as illustrated in Figure 2. The metallographic samples were mechanically ground and polished and then etched with etchant (a mixture of 30 mL of concentrated nitric acid and 10 mL of concentrated hydrochloric acid). The joint cross-section, microstructure, and fracture morphology were analyzed via optical microscopy and scanning electron microscopy. A hardness testing device was used with a load of 200 g and a dwell time of 15 s. Meanwhile, the tensile properties were measured utilizing a universal testing apparatus at a loading rate of 1.0 mm/min. In this experiment, the hardness and tensile strength of the specimens were measured three times to verify the accuracy and repeatability of the data.

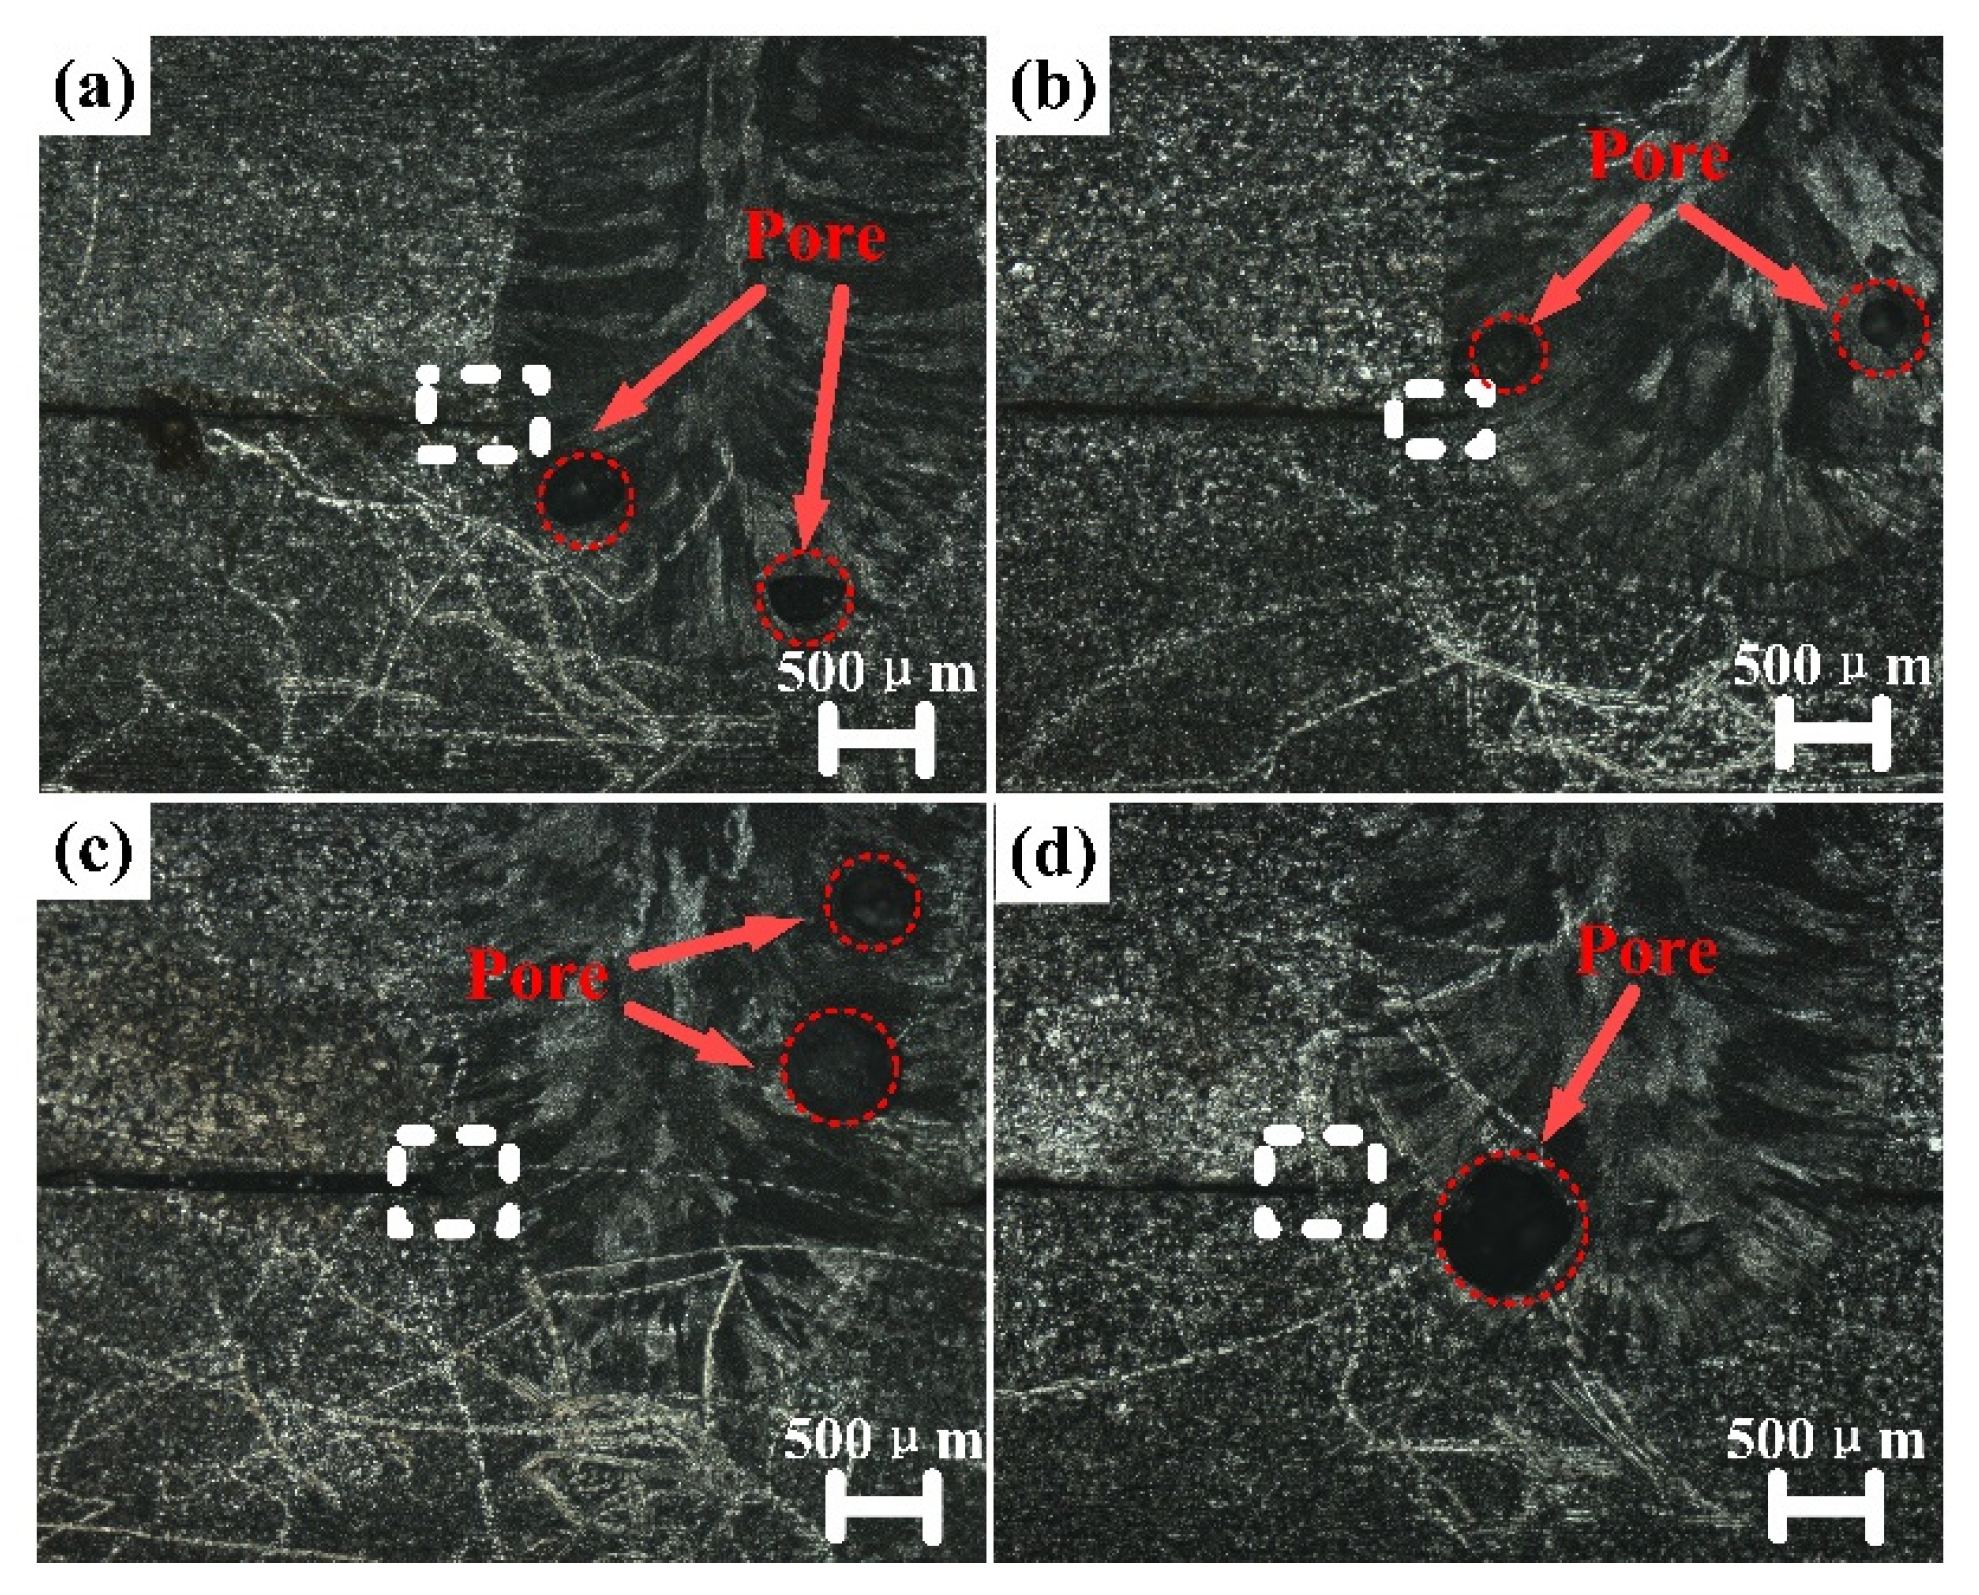
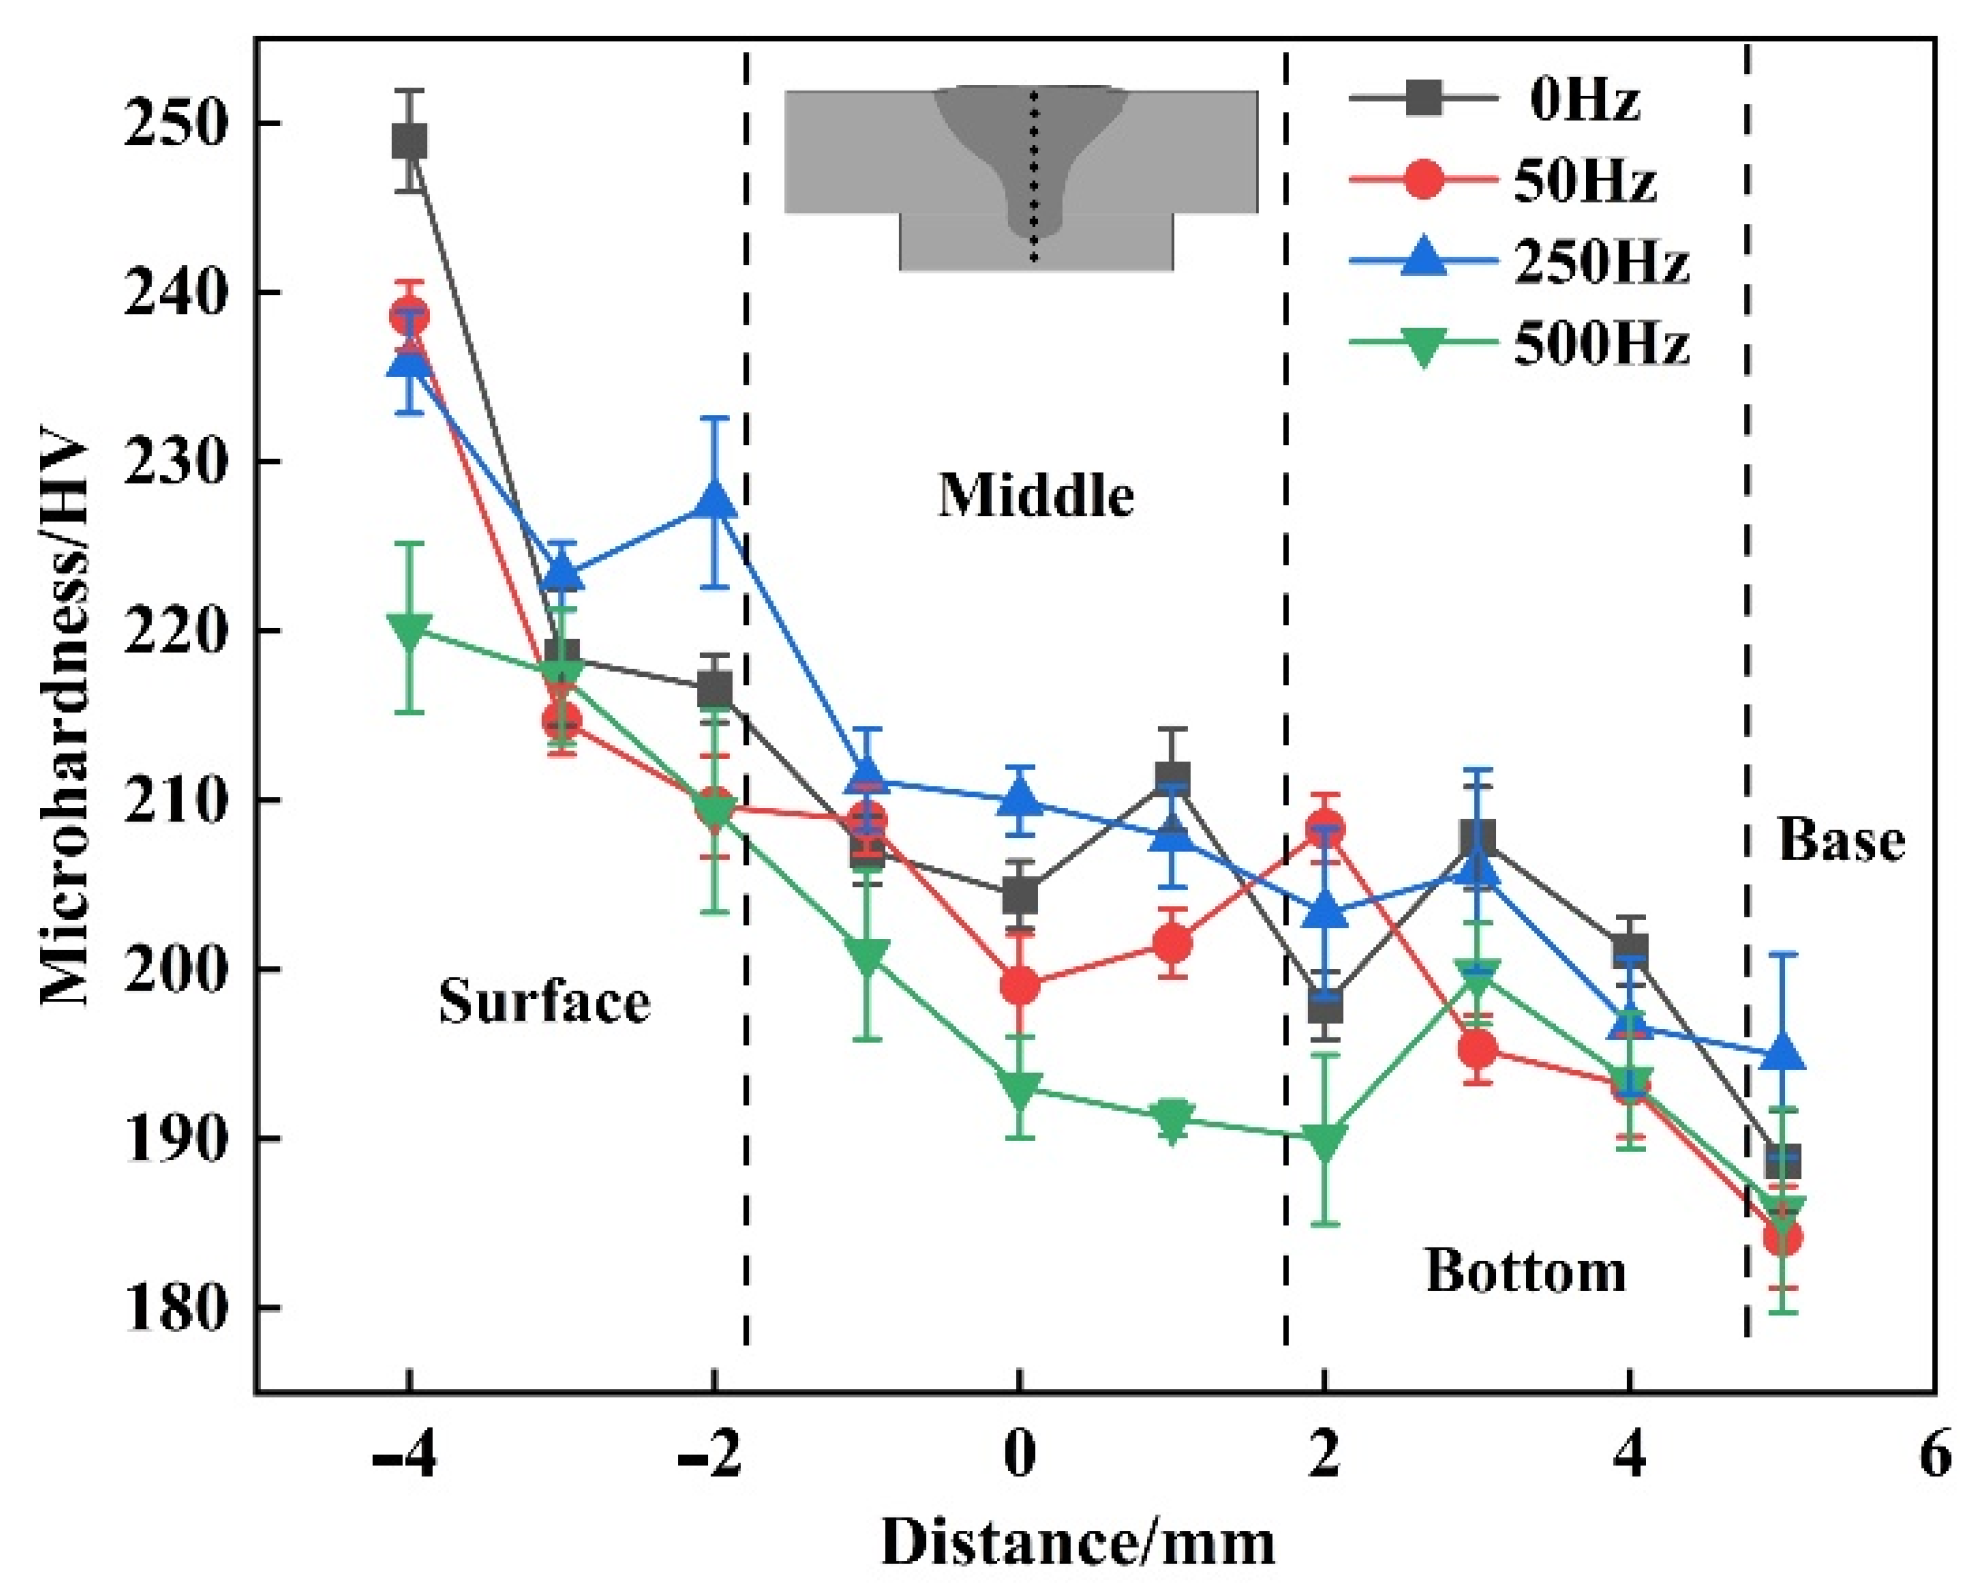
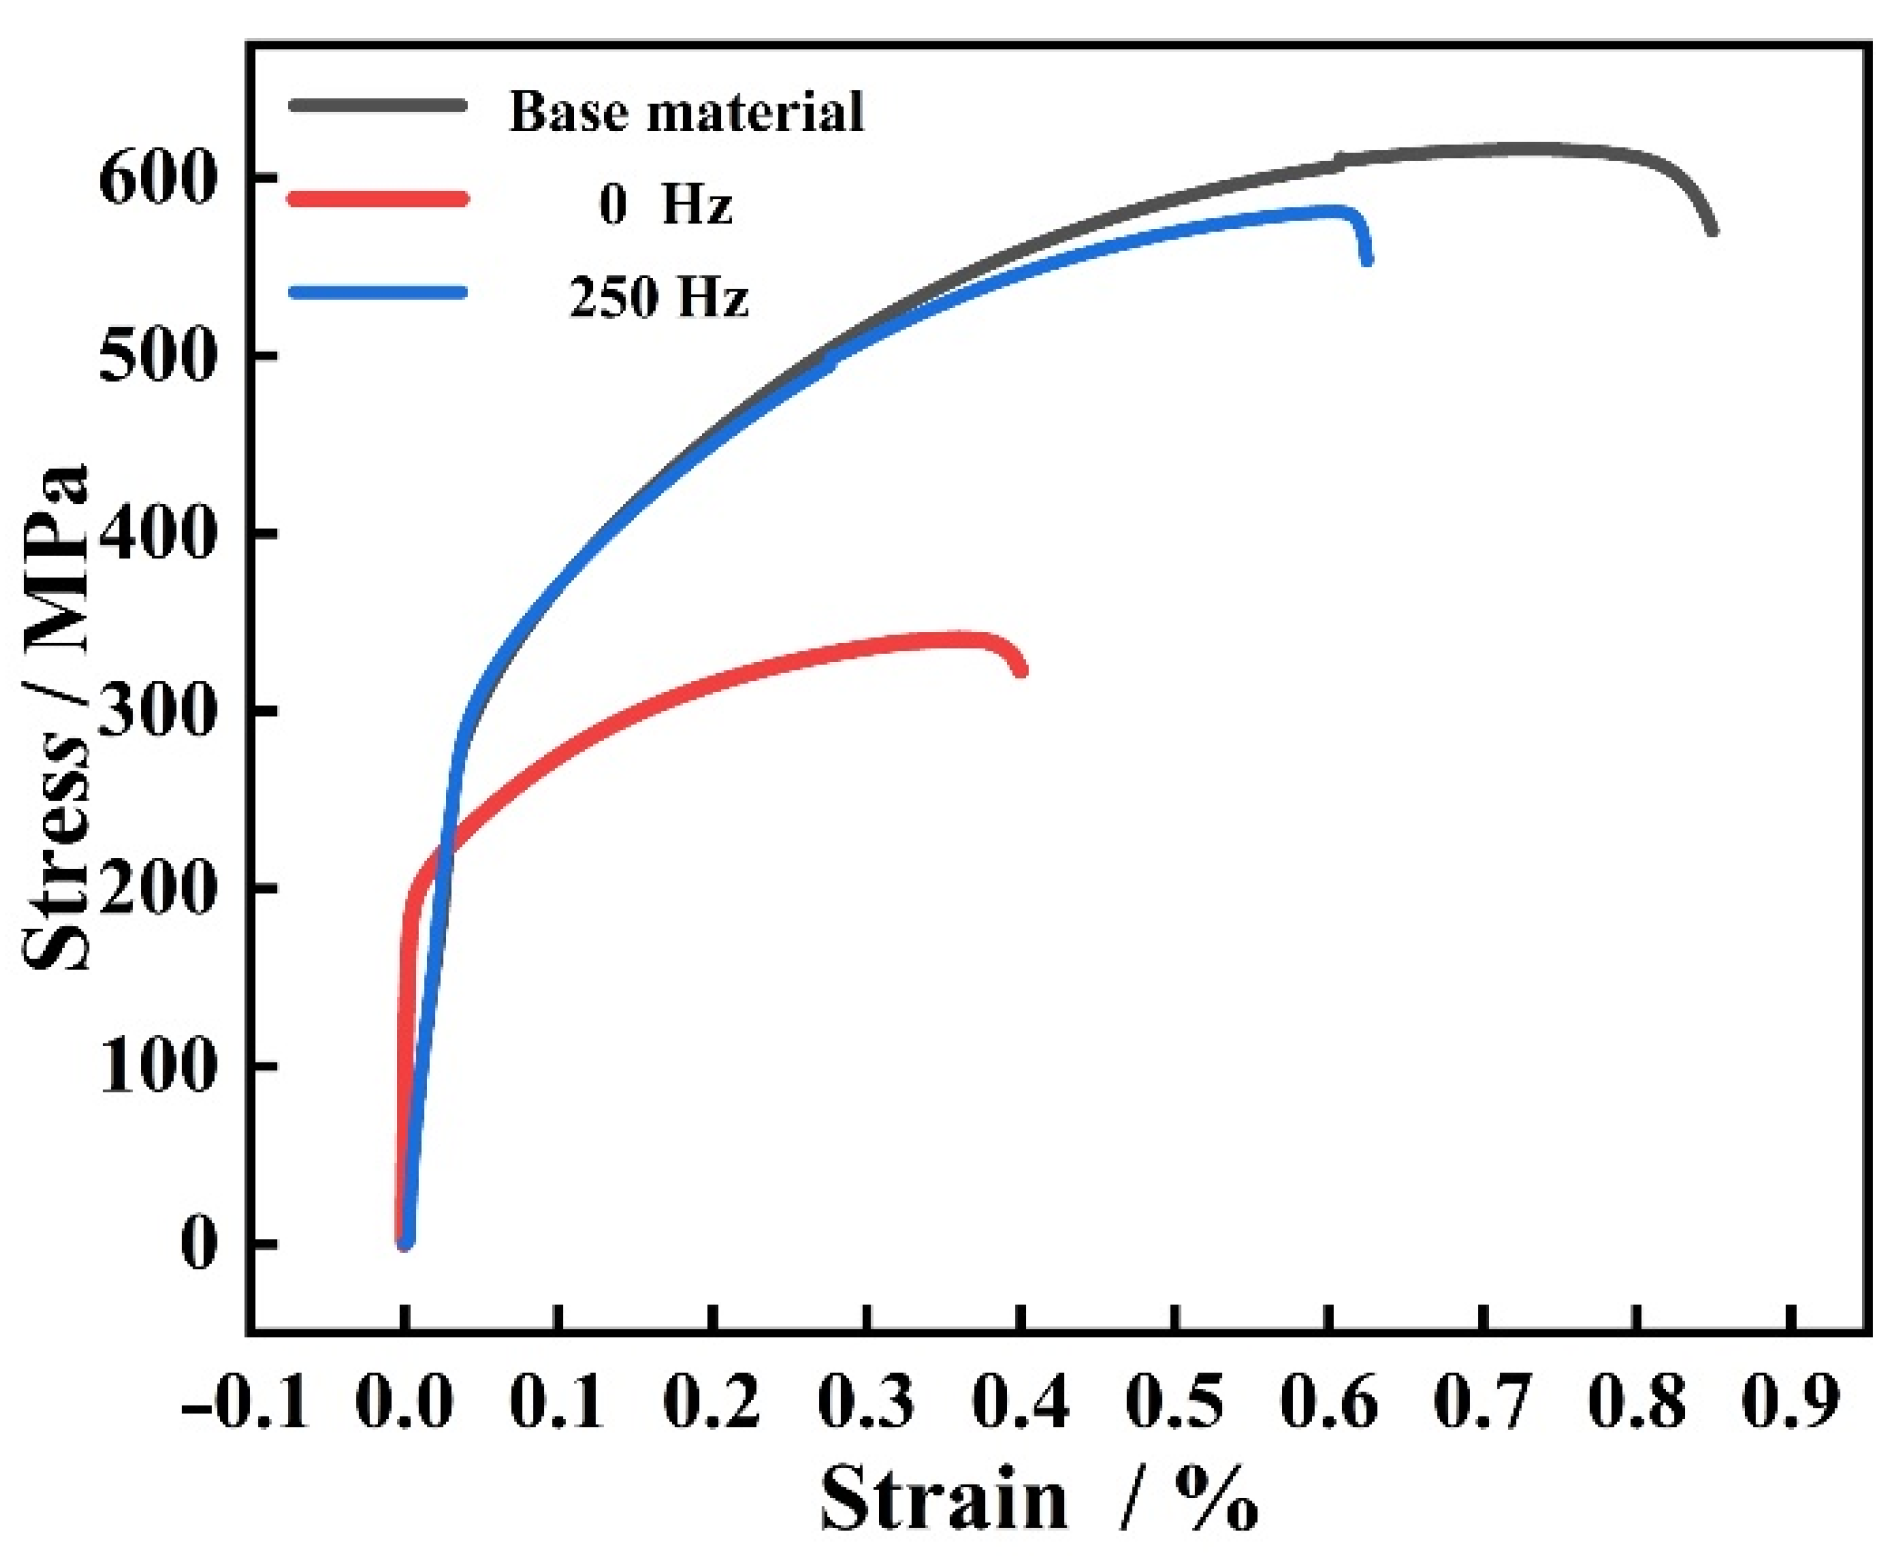
3. Experimental Results

Figure 3 shows high-speed camera images of one cycle of the laser–TIG hybrid process under different pulse frequencies. Figure 3a shows the arc and the molten pool when the frequency is 50 Hz. When the pulsed arc is at its base value, the molten pool is influenced solely by the laser heat source, it oscillates at t + 2 ms, which results in spattering, and it has lower stability. When the pulsed arc is at its peak (t + 10 ms), the molten pool is influenced by both the laser and the arc, and no obvious spattering is generated. At t + 10 ms, the pulsed arc is at its peak stage, the molten pool is influenced by the laser and the arc, the attraction effect of the laser on the arc prompts the front end of the arc to approach the laser heat source, there is no obvious spattering, and the stability of the molten pool is improved. Figure 3b,c show high-speed camera images with frequencies of 250 Hz and 500 Hz, respectively. Comparing them to images with a frequency of 50 Hz, we observe that the column area of the arc becomes thinner, indicating that the stiffness of the arc increased. Also, the energy of the arc is more centralized, which reduces the phenomenon of arc deflection [31]. However, a frequency that is too high hurts the stability of the arc, as shown in Figure 3c. For example, at t + 2 ms, this high frequency leads to the “necking” phenomenon in the arc column region, which reduces arc stability. This frequency leads to spattering at t + 4 ms, and the stability of the molten pool is affected [31,32].
A cross-section of the weld at 0 Hz is shown in Figure 4. The shape of the weld appears like an ‘inverted bell jar’, with a narrower fusion zone at the bottom (the laser melting zone). The upper region near the surface is more affected by the arc, showing the arc welding shape, and the entire shape exhibits characteristics of a hybrid heat source that combines both laser and arc technologies. This is consistent with earlier research findings of Acherjee and Tani et al. [15,33].
To investigate the effect of pulse frequency on the macroscopic morphology of the weld, the melt width (W1) at the surface of the weld, the melt width (W2) at the bottom of the weld, and the depth of the weld (D) were investigated with different pulse frequencies, as shown in Figure 5. With an increase in pulse frequency, W1 shows an increasing trend and then a decreasing one; the maximum melt width occurs when the frequency is 50 Hz. The bottom melt width W2 is largest at 250 Hz, measuring 1.62 mm. This melt width at the bottom influences the mechanical properties of the joint [34,35]. The melt depth of the weld increases with pulse frequency, but the variation is not significant. The overall width of the weld (W1 + W2) shows an increasing trend, so the fusion zone area gradually increases with the pulse frequency.
Figure 6 shows the cross-sectional morphology of the joint at different pulse frequencies. The fusion zone shows porosity defects, and with an increase in pulse frequency, as shown in Figure 6a–c, the location of the porosity gradually ascends from the base of the molten pool, while the size of the porosity decreases. This is because the increase in pulse frequency improves the stability of the arc, and the flow of the molten pool is further enhanced. The pores that form at the bottom of the molten pool are affected by the pool’s flow. The pores gradually rise during solidification, and with a better flow, the pores overflow to the top of the molten pool, which in turn creates the tendency for the positions of the pores to rise gradually [20]. However, a high frequency leads to arc instability, resulting in oscillation within the melt pool. This subsequently impacts the overflow of pores to the top of the melt pool, and the instability of the melt pool results in larger pores that appear and fail to overflow in time [36], as shown in Figure 6d. The formation of these pores is primarily associated with the flow of the melt pool before solidification, which will be discussed later.
To further investigate how varying pulse frequencies influence the microstructure, the microstructure within both the fusion zone and the heat-affected zone is investigated at different frequencies. Figure 7a–d show enlarged views of the fusion line (the white box area) in Figure 6. In the figure, with the increase in the pulse frequency, the microstructure of the fusion zone changes from columnar crystals to slat-like dendritic crystals, and the grain size of the heat-affected zone also decreases gradually. This is due to the introduction of the pulsed arc, resulting in a faster alternation of heat and cold in the molten pool, which improves the cooling rate and inhibits the growth of the grains [37,38].
The hardness distribution of the joint cross-section is shown in Figure 8. The hardness of the upper surface area of the weld in the joint is the highest. Along the depth direction of the weld, the hardness value shows a decreasing trend.
The tensile properties of the specimens were analyzed, as shown in Figure 9. For all joint fractures, the joint’s ultimate tensile strength measured at 0 Hz was 348 MPa, which is a 43% decrease in strength compared to the parent material (616 MPa). When the frequency is 250 Hz, the ultimate tensile strength of the joint is 581 MPa, which is close to that of the base material. The ultimate tensile strength is strongly affected by porosity [39].
The fracture morphology is shown in Figure 10. Pore defects appear in the fracture morphology of the joint. At 0 Hz, the number of pores is dense (Figure 10c), and larger pores appear. When the pulse frequency is 250 Hz, not only does the number of pores decrease (Figure 10b), but the pores are mainly smaller. Compared with the joint fracture, the fracture of the parent material is mainly composed of smaller ligament nests (Figure 10d). When the frequency is 250 Hz, the size of the ligament nest in the fracture of the joint increases significantly (Figure 10e), and plastic deformation is further enhanced. At 0 Hz (Figure 10c), the ligament nest area appears to be involved, which will affect the mechanical properties of the joint [38].

4. Analysis and Discussion

The flow state at different positions inside of the melt pool may impact the formation and overflow of pores. In this study, to further elaborate on the relationship between the flow of the molten pool and the evolution of porosity, a three-dimensional thermal physical model was established to simulate the temperature field and the flow field of the molten pool under different pulse frequencies.

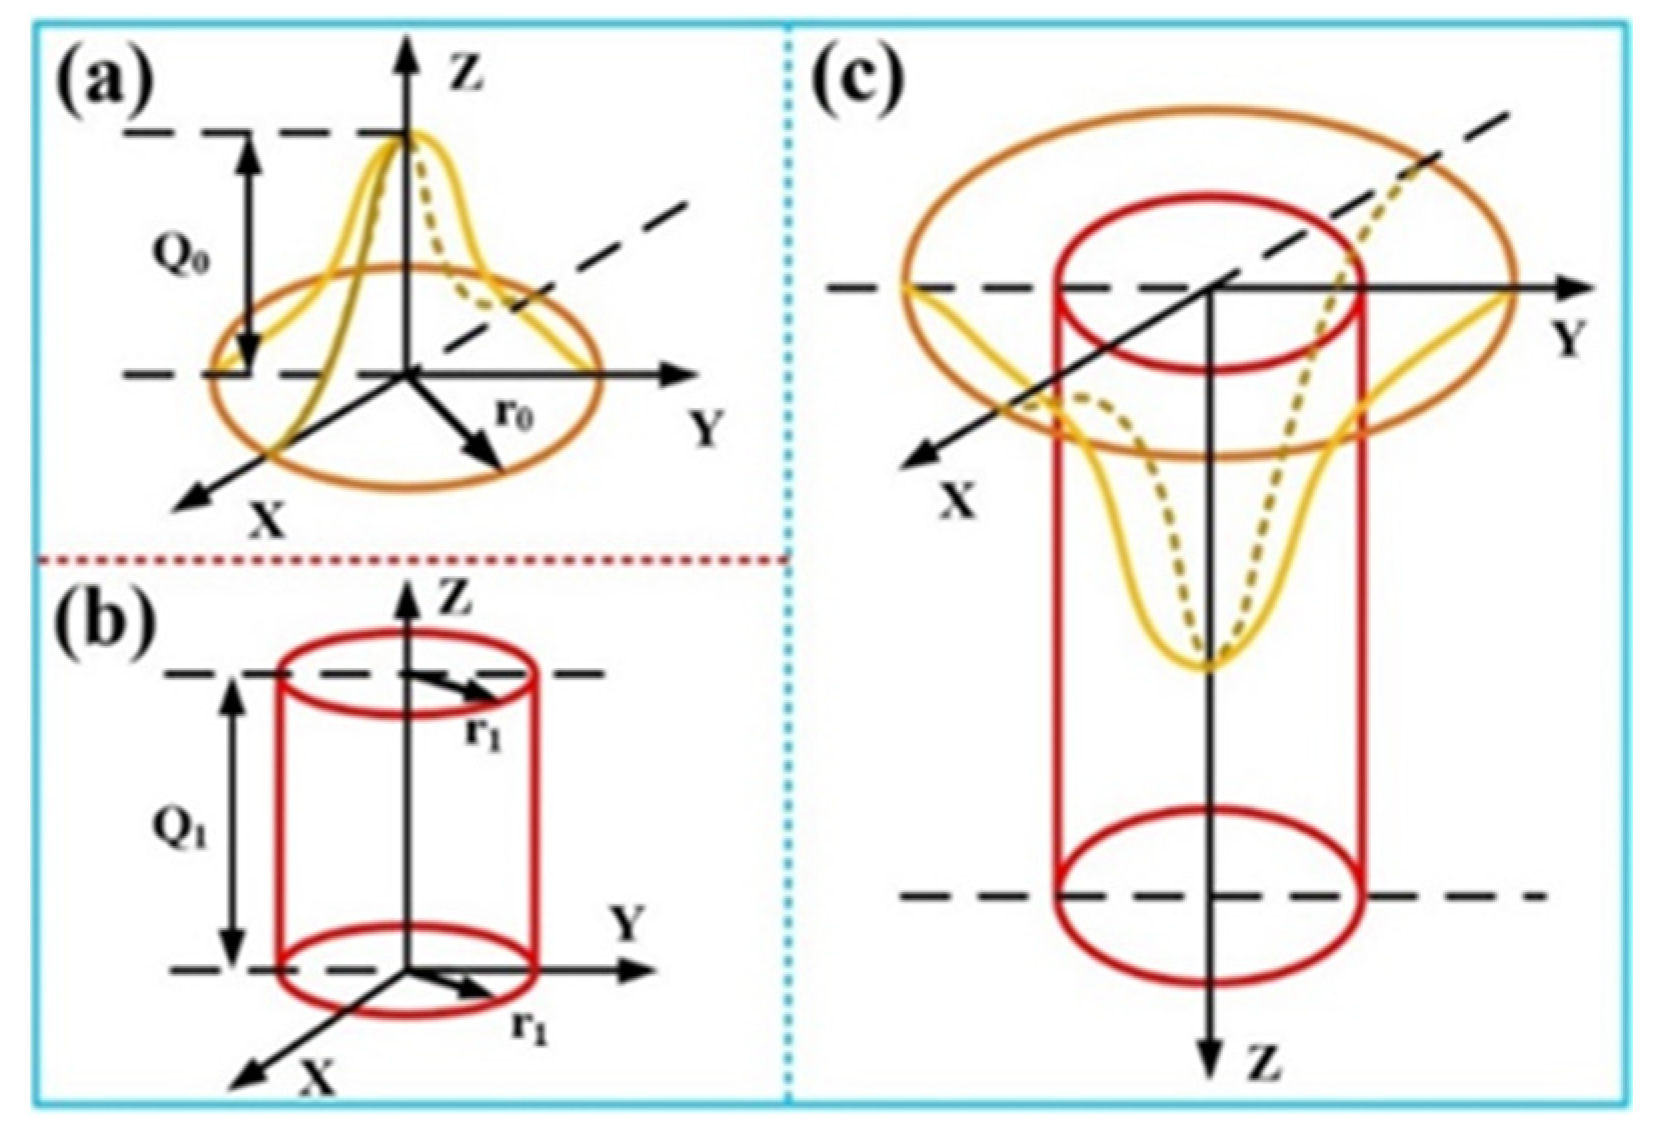
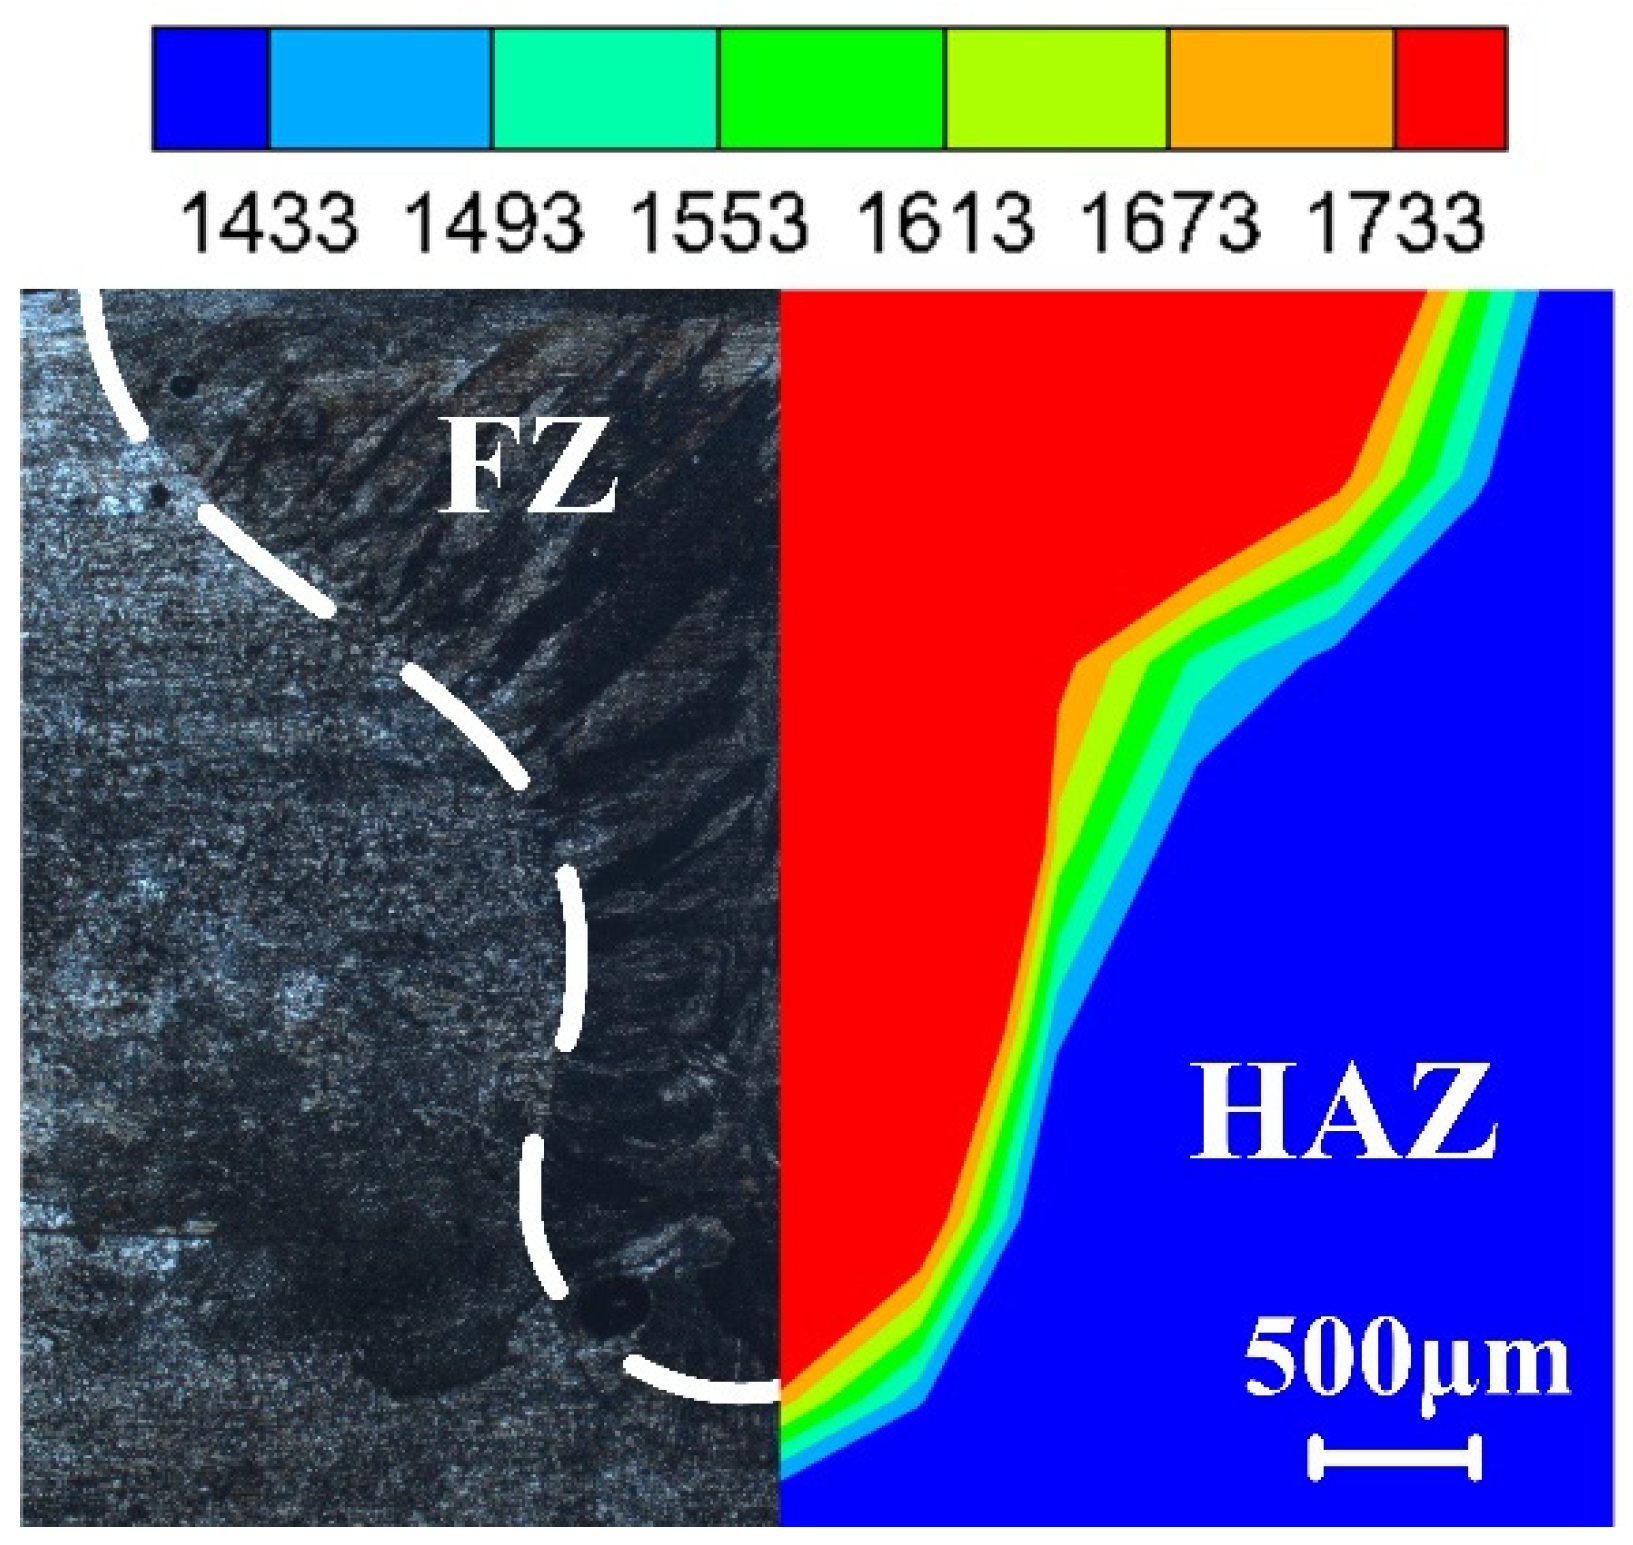
4.1. Numerical Simulation

A three-dimensional symmetry model was established, as shown in Figure 11. The model is divided by a hexahedral grid, in which the cell grid size is 0.5 mm × 0.5 mm × 0.5 mm. The weld region was refined to further improve the computational accuracy, and a total of 133,740 grid cells formed after grid division.
The welding process takes into account heat conduction, heat convection, and heat radiation [40], and to simplify the model calculation, further assumptions are made for the model: the metal is a compressible fluid in the melting process, the role of airflow shear is ignored, and only the heat dissipation of the solid to the environment is considered [41]. Because the welding pool is affected by the laser and arc heat sources, a combined heat source “Gaussian surface heat source + cylinder heat source” model is applied, as shown in Figure 12.
The pulsed laser–TIG welding heat source is formulated as follows [42]:
q a r c = 6 η U I π σ b 2 exp 3 r 2 σ b 2
where σ b is the effective distribution radius of the arc heat flow density, defined as the radial distance when the heat flow density decays to 0.05 times the maximum value; U is the welding voltage; I is the welding current; and η denotes the effective power coefficient.
For the nail-shaped cross-section produced by the laser, a cylindrical heat flow distribution was used to simulate this heat source. The laser heat source formula is as follows [43]:
q L = A P π R 2 H
where P denotes laser power, R denotes the spot radius (cylinder radius), r denotes the location of the heat source, H denotes the depth of the heat source (cylinder height), and A indicates laser utilization.
The total heat source equation is [42,43]
q = q a r c + q L
The calculation of the weld pool takes into account the physical parameters of the material; Table 4 lists the parameters of the heat source and the physical parameters of the material.

4.2. Discussion and Analysis

The model is calibrated by comparing it with experimental results. The calculated temperature field results of the weld cross-section at 0 Hz are shown in Figure 13. The shape of the weld fusion zone is formed with a solid-phase line temperature of 1693 K, and the shape of the weld is in the shape of an “inverted bell”, which exhibits the properties of both the laser and arc heat sources.
The experimental and calculated melt width (W1) at the surface of the weld, the melt width (W2) at the bottom of the weld, and the melt depth (D) were compared and analyzed, as shown in Figure 14. The simulation errors of the upper weld width, the weld depth, and the lower weld did not exceed ±0.15 mm, ±0.04 mm, or ±0.06 mm, respectively. The calculated results align well with the experimental results.
Figure 15 shows the flow field of the molten pool at different pulse frequencies. Influenced by the surface tension gradient, the flow of the molten pool shows the flow from the middle to the surroundings. With the increase in pulse frequency, the overall flow speed of the molten pool increases, which is favorable for the overflow of pores. In the meantime, both the fluidity of the molten pool and the flow direction in the middle region (yellow circle) change, which leads to the molten pool disorder phenomenon. The fluidity of the bottom of the molten pool (yellow circle) is affected, and the driving force on the pores at the bottom of the molten pool decreases, which inhibits the escape of the pores [38,44].
Figure 16 shows a schematic of the effects on the flowability of the molten pool at different pulse frequencies. As shown in Figure 16a, in direct current, the molten pool is affected by surface tension and presents a flow direction from the middle to both sides (black arrow). With the introduction of pulse frequency, when the arc is at its base value, the molten pool appears to flow back near the surface in the region of arc action (white arrow), and the molten pool fluidity is improved, as shown in Figure 16b. When the pulse frequency is further increased, as shown in Figure 16c, the flow of the molten pool in the arc action region is further improved, which then affects the flow in the deep laser action region. The improvement in the flow of the molten pool at the bottom of the laser action region contributes to the overflow of bubbles at the bottom of the molten pool [14]. However, when the frequency is increased to 500 Hz, as shown in Figure 16d, the larger pulse frequency makes the heat input more uniform [38,44], the temperature fluctuation of the melt pool decreases, and the molten pool flow in the arc region improves with it. However, there is some disorder in the middle region. The upward flow of the molten pool in the laser region (green arrow) is limited by the larger flow rate in the arc region (white arrow), which hinders the upward flow in the middle region of the molten pool and leads to the disturbance in the middle region, where bubbles are subjected to an unstable flow field that inhibits them from overflowing upward [45].
Figure 17 shows a schematic of the laser–TIG hybrid welding molten pool. The hybrid heat source acts on the liquid metal at both ends of the molten pool’s downward flow. After reaching the bottom of the molten pool, the heat is subjected to the reaction force of the solid–liquid interface on the molten pool and flows back toward the surface. Under the action of the laser, bubbles are formed at the bottom of the molten pool, affected by the liquid metal in the molten pool, with certain changes in force [46].
The forces on the bubbles in the molten pool are shown in Figure 18. The bubbles themselves are affected by gravity, and under the action of the liquid metal, they are subject to buoyancy, the thrust generated by the flow of the molten pool, and the liquid metal’s viscous force [47]. Among them, gravity and the viscous force act as hindering forces to inhibit the overflow of pores, bubble buoyancy promotes the overflow of bubbles to the molten pool’s surface, and the thrust force generated by the flow of the melt pool is mainly affected by the fluidity of the melt pool, which acts differently on the bubbles in different flow modes [20]. As shown in the figure, Bubble 1 is located at the bottom of the melt pool. Then, primarily because of the laser heat source, the bubble is thrust upward, and, combined with the buoyancy force, the bubble continues moving upward (toward the melt pool surface). When the bubble is located in position 2, the pulsed arc subjects the bubble to diagonal upward thrust; when the thrust is larger, the pores move toward the middle of the melt pool area. When the bubble reaches position 3, due to the arc, the liquid flow above the bubble obstructs the bubble. When the liquid flow above the bubble is large, bubbles gather here to form a larger bubble. Because of the turbulence of the flow field, the bubbles cannot overflow to the molten pool surface in time, forming larger pores in the middle area of the molten pool.

5. Conclusions

The microstructure and mechanical properties of laser–TIG hybrid welded joints at different pulse frequencies were studied, and the effect of TIG pulse frequency on pore escape was analyzed. The following conclusions were drawn:
  • As the pulse frequency increases, the stability of the arc improves, and the arc energy becomes more concentrated. At the same time, too high a frequency adversely affects the stability of the arc, and the stability of the arc decreases, affecting the stability of the molten pool.
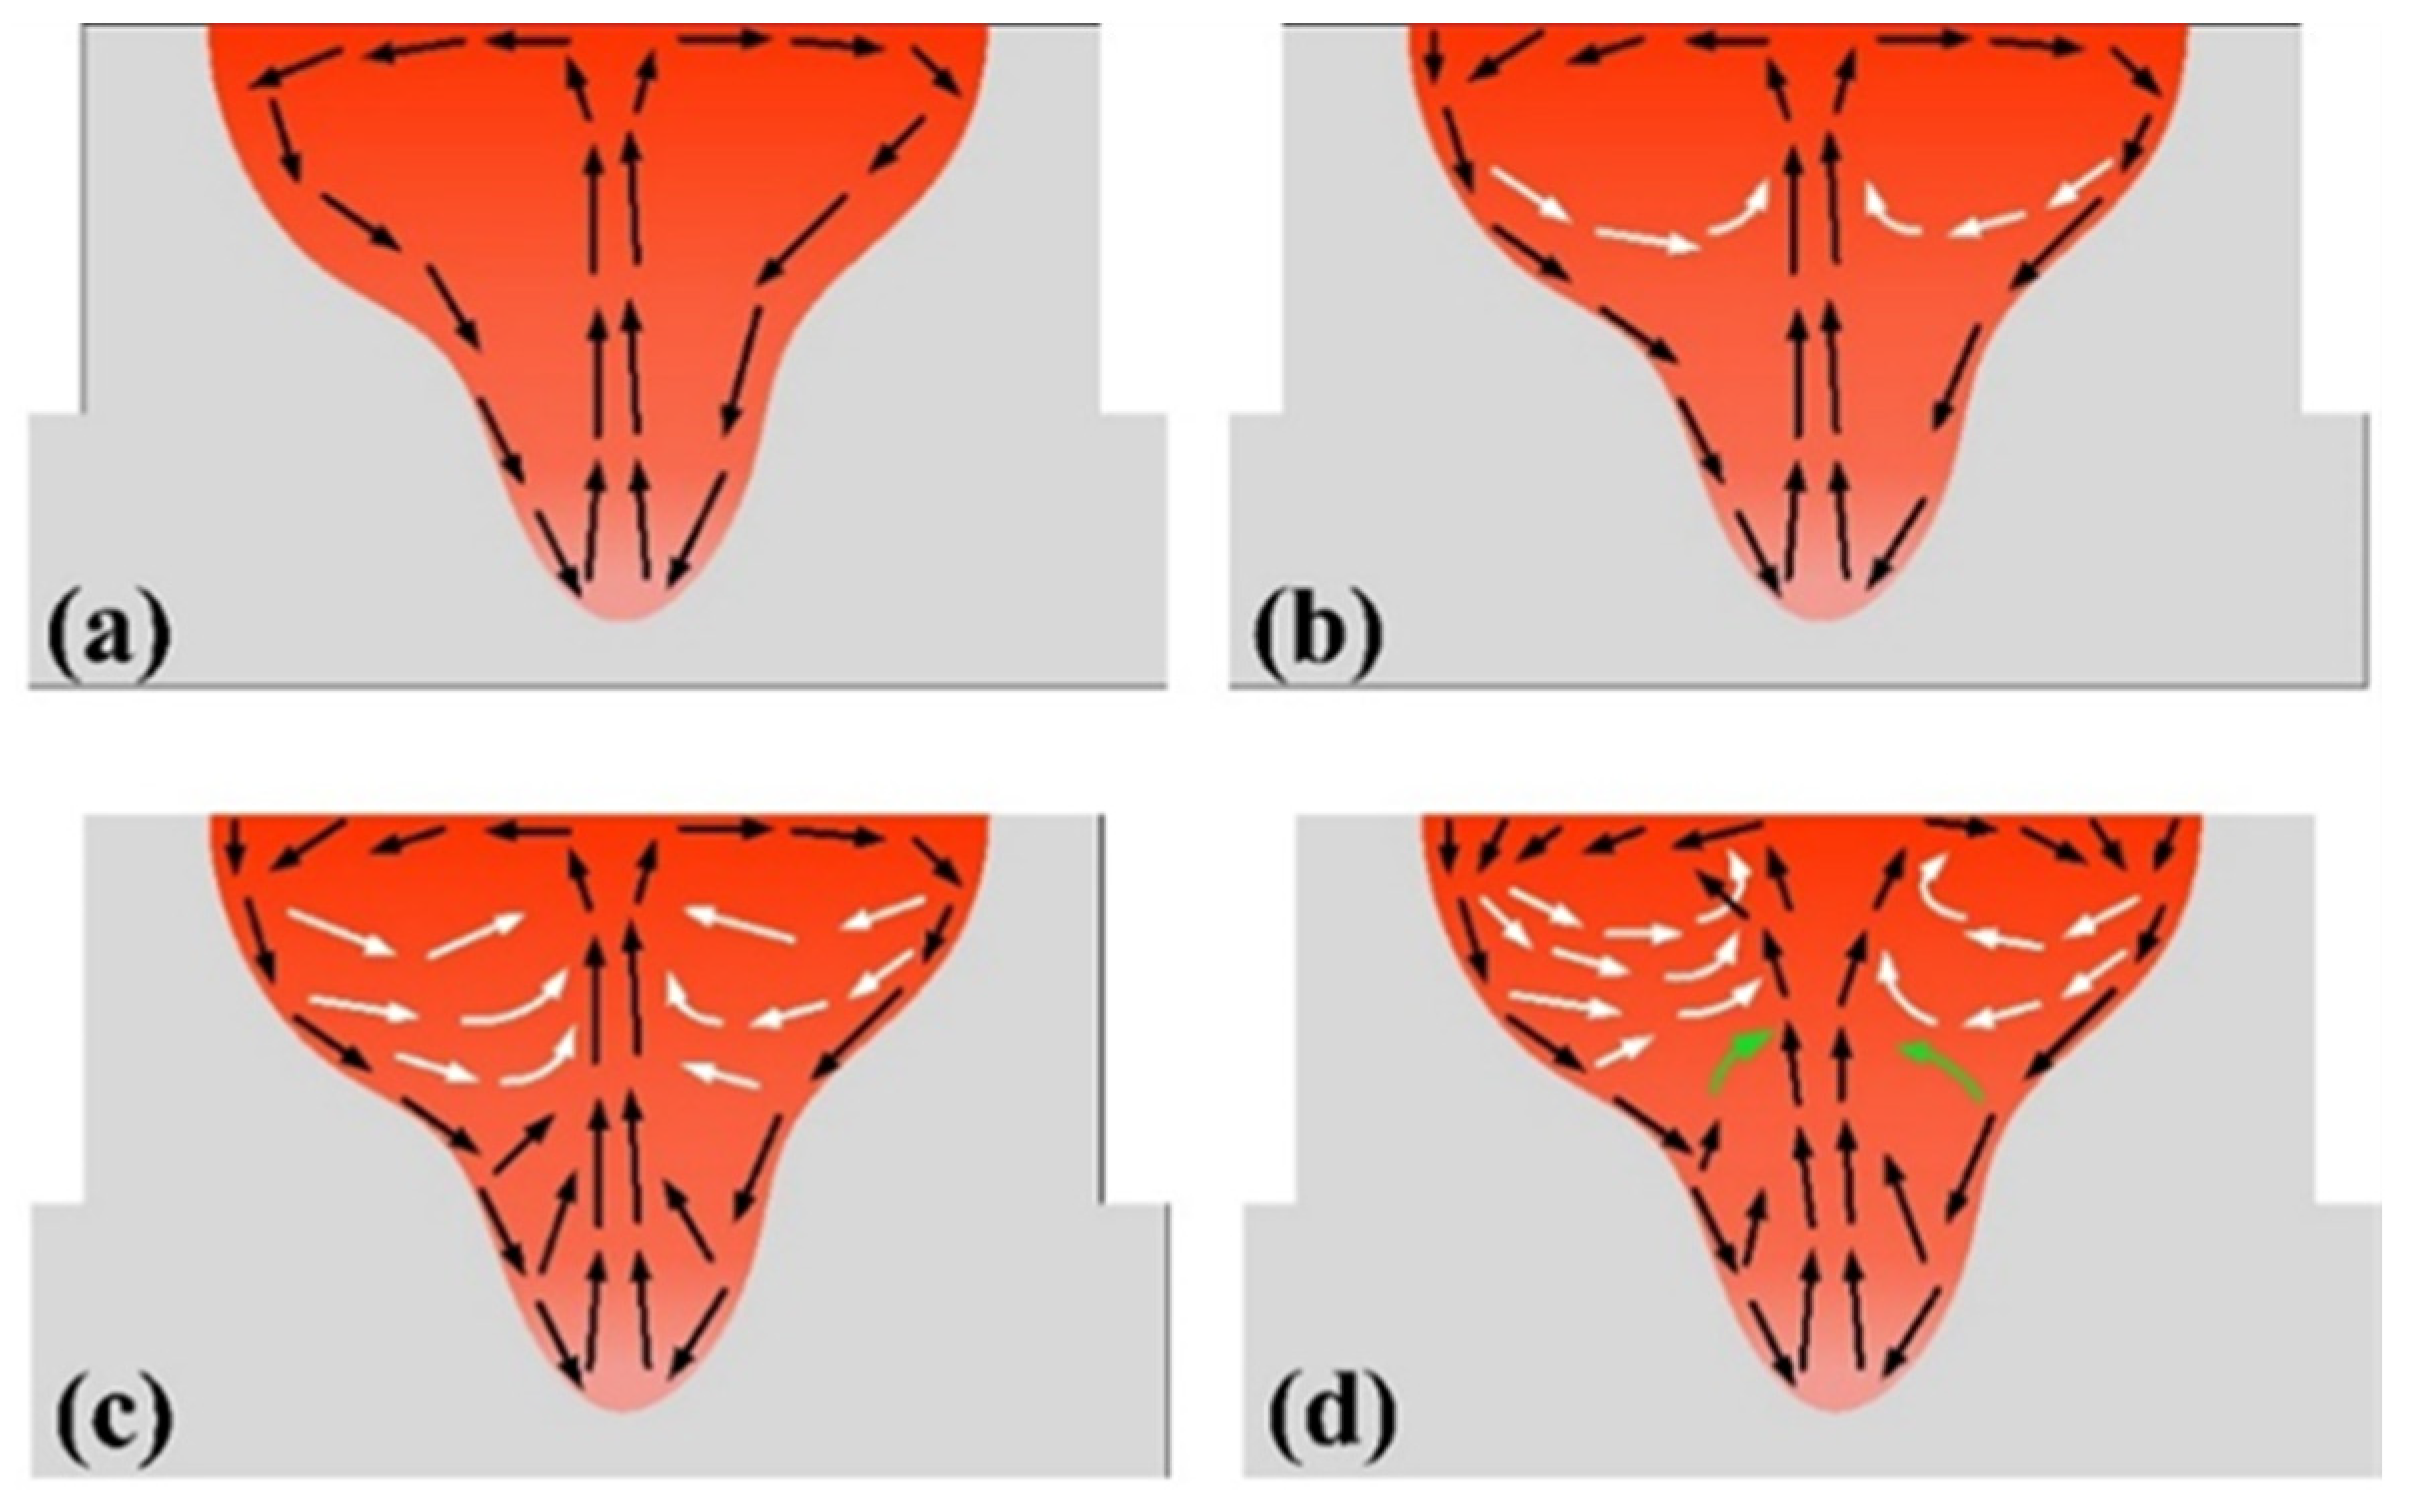
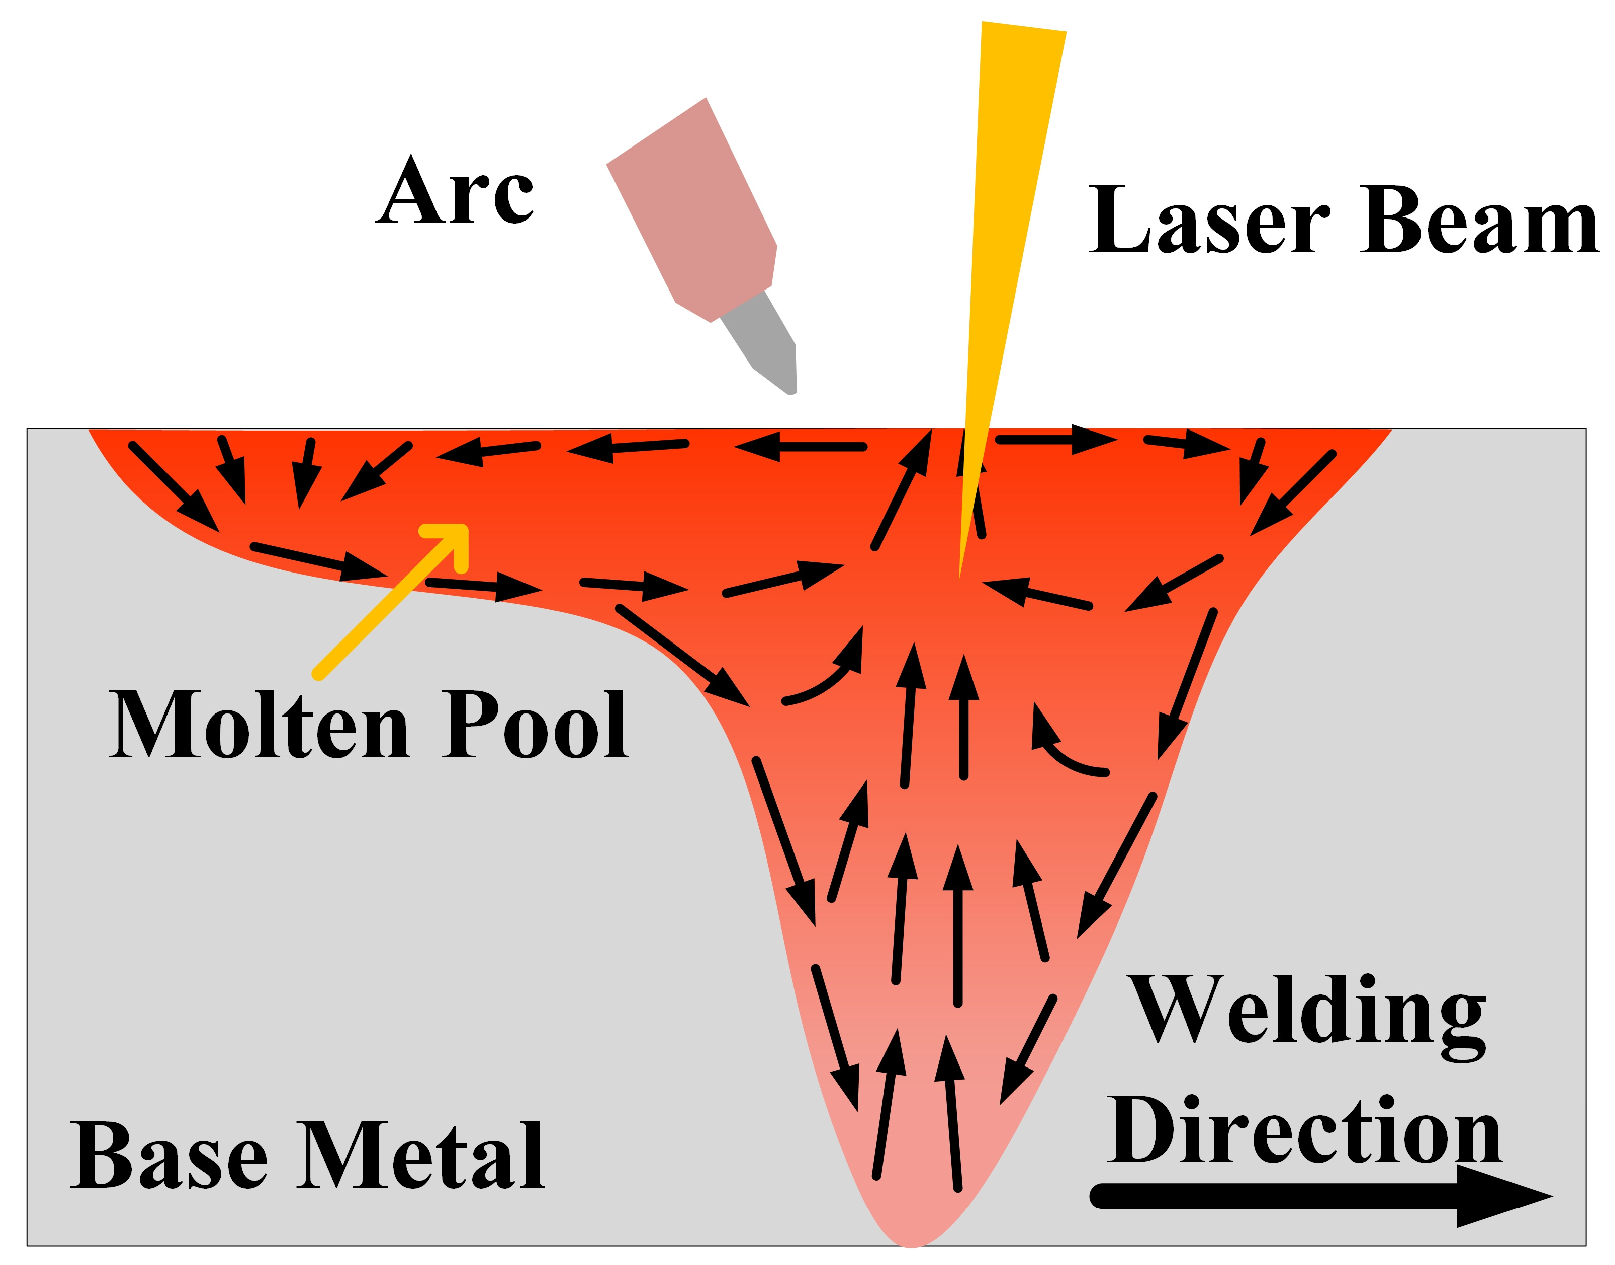
  • As the pulse frequency increases, the flow of the molten pool gradually increases with the pulse frequency, which improves the cooling rate of the molten pool and inhibits the growth of the grains, which plays a role in refining the grains.
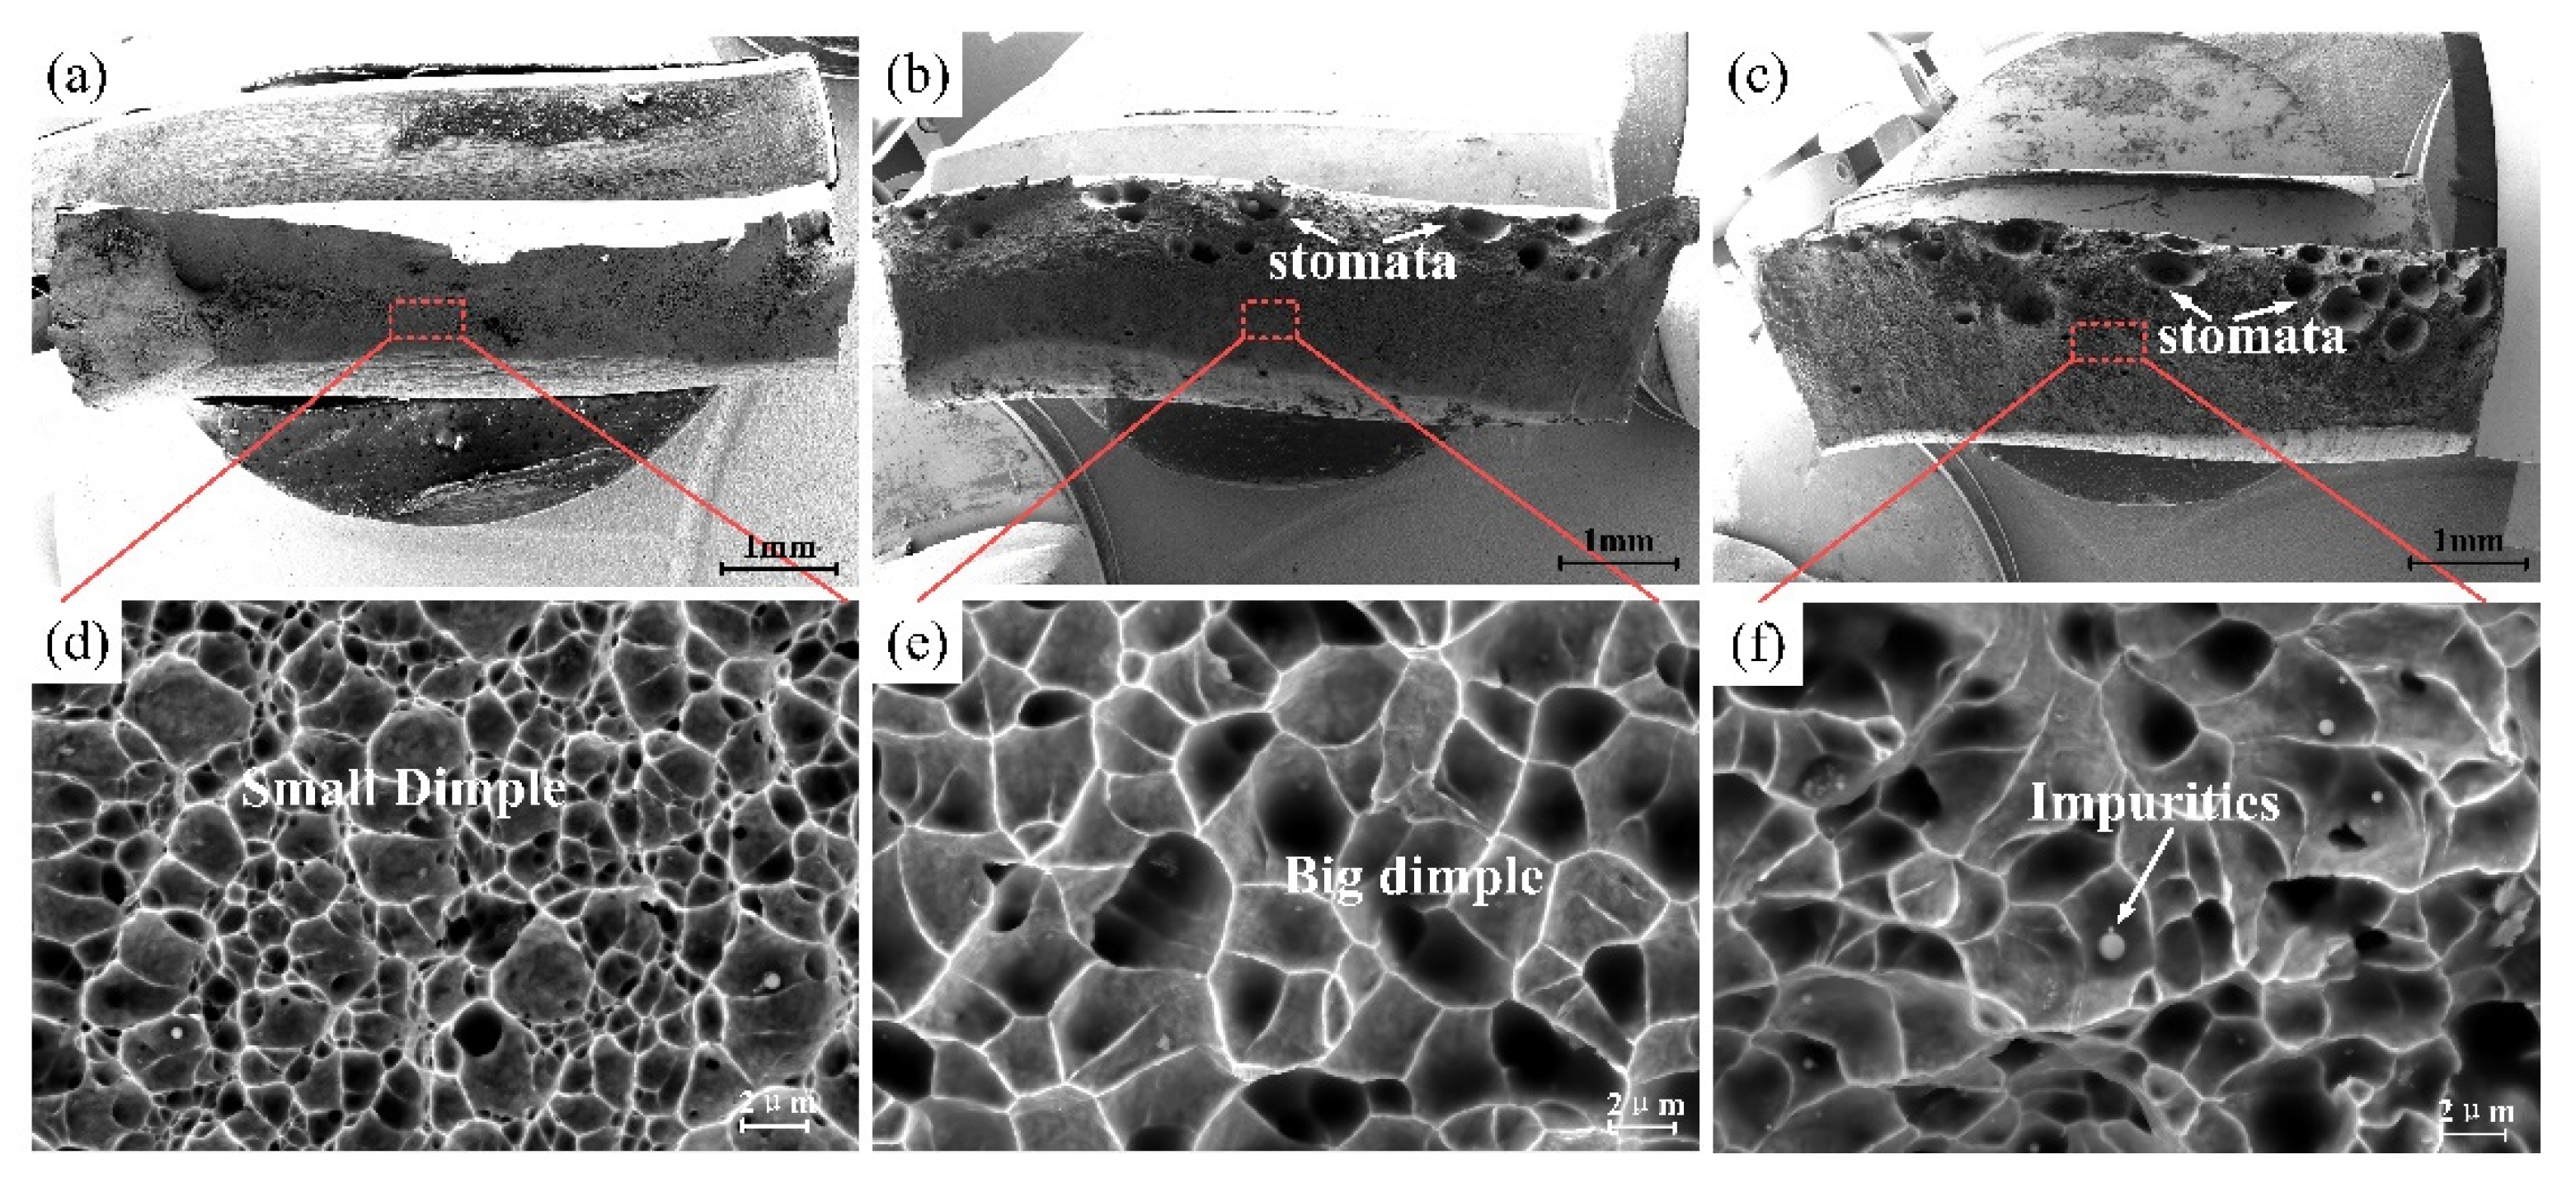
  • With the increase in pulse frequency, the number of pores in the joint decreases, and the tensile strength of the joint increases by 67% compared with 0 Hz, which effectively improves the tensile strength of the joint. The ultimate tensile strength gradually approaches that of the parent material. The dimple size in the joint fracture increases, and the plastic deformation is further enhanced.
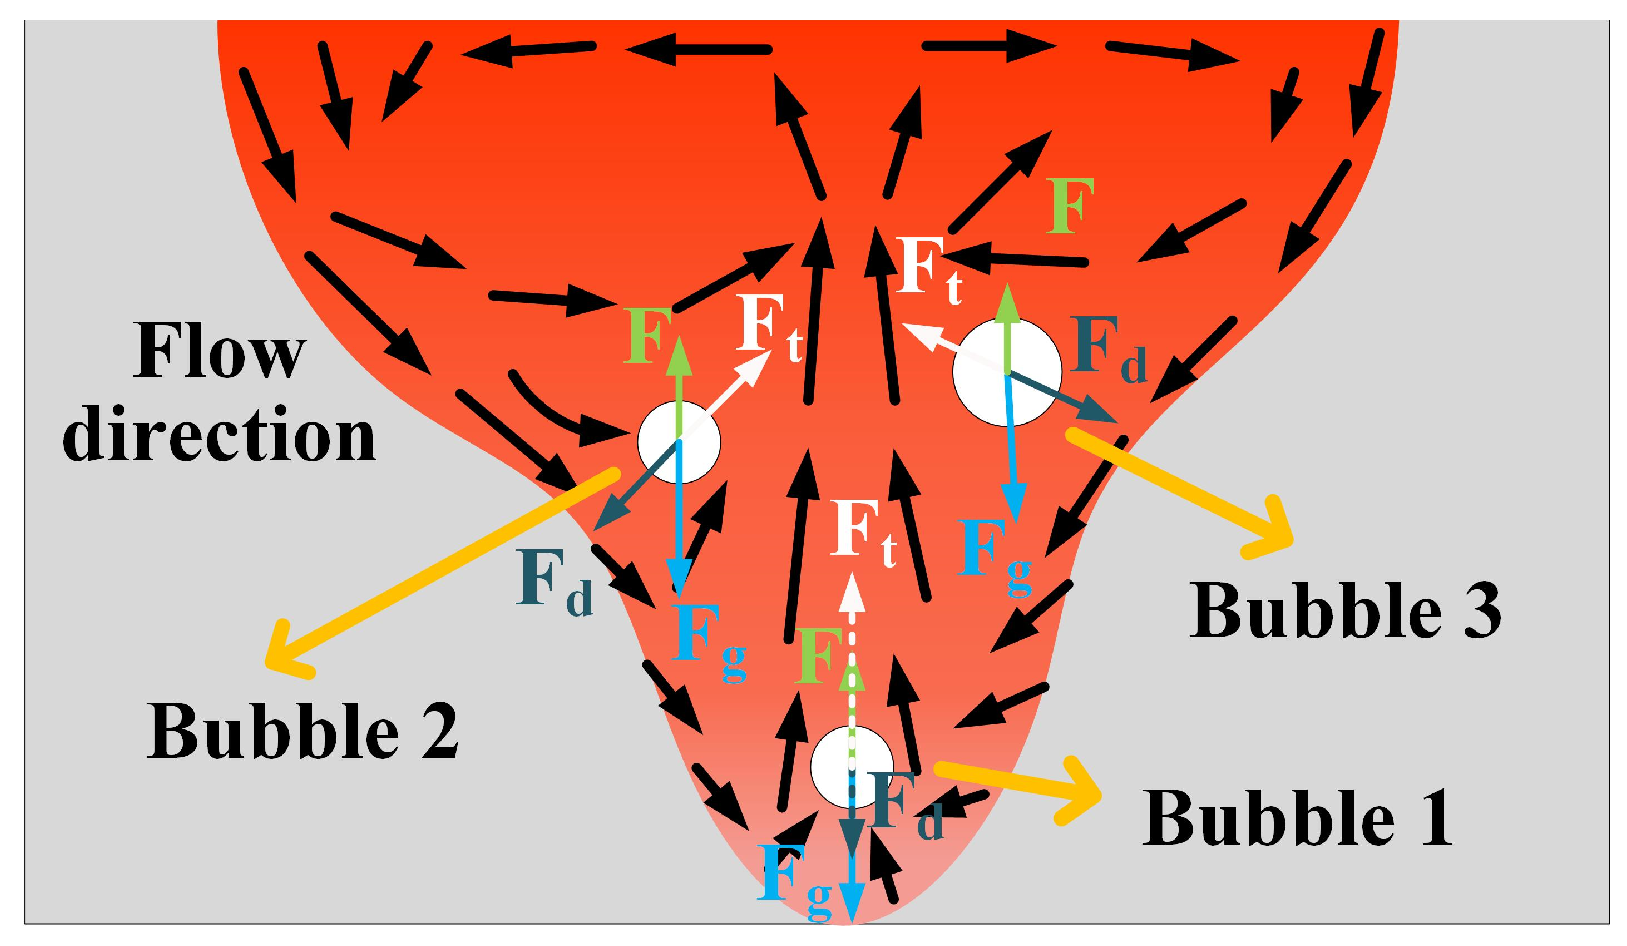
  • Pulse frequency has a significant effect on the escape of pores. As the pulse frequency increases, the flow of the middle region of the melt pool increases, resulting in greater thrust forces acting on the bubbles present in the melt pool and facilitating the escape of bubbles to the surface.

Author Contributions

Y.Y.: conceptualization; data curation; software; writing—original draft; J.X.: data curation; resources; software; visualization; X.Y.: conceptualization; project administration; validation; writing—review and editing; L.G.: data curation; formal analysis; visualization; T.Z.: data curation; project administration; D.F.: formal analysis; project administration; resources; software; writing—original draft. All authors have read and agreed to the published version of the manuscript.

Funding

This study was supported by the Gansu Provincial Department of Science and Technology, the Natural Fund Project of Gansu Province, Gansu Province School–Enterprise Joint Project (UHF Pulsed TIG–Laser Hybrid Welding Isotope Heat Source Shell Welder Process and Numerical Sim-ulation, No: 22JR5RA782), and the Independent Innovation Scientific Research Project (Isotope Battery Development Project) of China National Nuclear Corporation (CNNC) 404 Ltd.

Data Availability Statement

The original contributions presented in this study are included in the article. Further inquiries can be directed to the corresponding authors.

Conflicts of Interest

Authors Yonglong Yu, Liang Guo, Tongyu Zhu were employed by the company CNNC 404 Limited. The remaining authors declare that the research was conducted in the absence of any commercial or financial relationships that could be construed as a potential conflict of interest.

References

  1. Baldev, R.; Mudali, U.K.; Vijayalakshmi, M.; Mathew, M.; Bhaduri, A.; Chellapandi, P.; Venugopal, S.; Sundar, C.; Rao, B.; Venkatraman, B. Development of stainless steels in nuclear industry: With emphasis on sodium cooled fast spectrum reactors history, technology and foresight. Adv. Mater. Res. 2013, 794, 3–25. [Google Scholar] [CrossRef]
  2. Alekseev, I.; Belov, V.; Brudanin, V.; Danilov, M.; Egorov, V.; Filosofov, D.; Fomina, M.; Hons, Z.; Kazartsev, S.; Kobyakin, A.; et al. DANSS: Detector of the reactor Anti Neutrino based on Solid Scintillator. J. Instrum. 2016, 11, P11011. [Google Scholar] [CrossRef]
  3. Dhaiveegan, P.; Elangovan, N.; Nishimura, T.; Rajendran, N. Corrosion behavior of 316L and 304 stainless steels exposed to industrial-marine-urban environment: Field study. RSC Adv. 2016, 6, 47314–47324. [Google Scholar] [CrossRef]
  4. D’andrea, D. Additive manufacturing of AISI 316L stainless steel: A review. Metals 2023, 13, 1370. [Google Scholar] [CrossRef]
  5. Vukkum, V.B.; Gupta, R.K. Review on corrosion performance of laser powder-bed fusion printed 316L stainless steel: Effect of processing parameters, manufacturing defects, post-processing, feedstock, and microstructure. Mater. Des. 2022, 221, 110874. [Google Scholar] [CrossRef]
  6. Sghaier, T.A.M.; Sahlaoui, H.; Mabrouki, T.; Sallem, H.; Rech, J. Selective laser melting of stainless-steel: A review of process, microstructure, mechanical properties and post-processing treatments. Int. J. Mater. Form. 2023, 16, 41. [Google Scholar] [CrossRef]
  7. Ghumman, K.Z.; Ali, S.; Khan, N.B.; Khan, M.I.; Ali, H.T.; Ashurov, M. Optimization of TIG welding parameters for enhanced mechanical properties in AISI 316L stainless steel welds. Int. J. Adv. Manuf. Technol. 2024, 1–13. [Google Scholar] [CrossRef]
  8. Ghosh, N.; Pal, P.K.; Nandi, G. Parametric optimization of MIG welding on 316L austenitic stainless steel by Taguchi method. Arch. Mater. Sci. Eng. 2016, 79, 27–36. [Google Scholar] [CrossRef]
  9. Ragavendran, M.; Vasudevan, M. Laser and hybrid laser welding of type 316L (N) austenitic stainless steel plates. Mater. Manuf. Process. 2020, 35, 922–934. [Google Scholar] [CrossRef]
  10. Kumar, H.; Somireddy, A.; Gururaj, K. A review on critical aspects of 316ln austenitic stainless steel weldability. Int. J. Mater. Sci. Appl. 2012, 1, 1–7. [Google Scholar] [CrossRef]
  11. Segura, I.; Mireles, J.; Bermudez, D.; Terrazas, C.; Murr, L.; Li, K.; Injeti, V.; Misra, R.; Wicker, R. Characterization and mechanical properties of cladded stainless steel 316L with nuclear applications fabricated using electron beam melting. J. Nucl. Mater. 2018, 507, 164–176. [Google Scholar] [CrossRef]
  12. Li, G.; Lu, X.; Zhu, X.; Huang, J.; Liu, L.; Wu, Y. The interface microstructure, mechanical properties and corrosion resistance of dissimilar joints during multipass laser welding for nuclear power plants. Opt. Laser Technol. 2018, 101, 479–490. [Google Scholar] [CrossRef]
  13. Hong, K.M.; Shin, Y.C. Prospects of laser welding technology in the automotive industry: A review. J. Mater. Process. Technol. 2017, 245, 46–69. [Google Scholar] [CrossRef]
  14. Li, Y.; Li, Y.; Feng, Y.; Zhang, Y.; Li, S.; Zhang, X.; Wang, B.; Yang, M. Investigation on the Morphology and Formation Mechanism of Porosity in Different Heat Source Regions of Nickel-Based Alloy Laser Hybrid Welding. J. Mater. Eng. Perform. 2024, 33, 6432–6441. [Google Scholar] [CrossRef]
  15. Acherjee, B. Hybrid laser arc welding: State-of-art review. Opt. Laser Technol. 2018, 99, 60–71. [Google Scholar] [CrossRef]
  16. Zhang, Z.; Wang, Q.; Li, Z.; Wang, X.; Song, G. Research on 316 stainless steel low-power pulsed laser-induced arc additive manufacturing by different deposition routes. Weld. Int. 2022, 36, 679–692. [Google Scholar] [CrossRef]
  17. Rizvi, S.A.; Ali, W. Welding defects, Causes and their Remedies: A Review. Indian Weld. J. 2020, 53, 42–47. [Google Scholar] [CrossRef]
  18. Górka, J.; Stano, S. Microstructure and properties of hybrid laser arc welded joints (laser beam-MAG) in thermo-mechanical control processed S700MC steel. Metals 2018, 8, 132. [Google Scholar] [CrossRef]
  19. Zhan, X.; Zhao, Y.; Liu, Z.; Gao, Q.; Bu, H. Microstructure and porosity characteristics of 5A06 aluminum alloy joints using laser-MIG hybrid welding. J. Manuf. Process. 2018, 35, 437–445. [Google Scholar] [CrossRef]
  20. Atabaki, M.M.; Ma, J.; Liu, W.; Kovacevic, R. Pore formation and its mitigation during hybrid laser/arc welding of advanced high strength steel. Mater. Des. 2015, 67, 509–521. [Google Scholar] [CrossRef]
  21. Cui, B.; Liu, S.; Zhang, F.; Luo, T.; Feng, M. Effect of welding heat input on pores in laser-arc hybrid welding of high nitrogen steel. Int. J. Adv. Manuf. Technol. 2022, 119, 421–434. [Google Scholar] [CrossRef]
  22. Chen, C.; Shen, Y.; Gao, M.; Zeng, X. Influence of welding angle on the weld morphology and porosity in laser-arc hybrid welding of AA2219 aluminum alloy. Weld. World 2020, 64, 37–45. [Google Scholar] [CrossRef]
  23. Su, R.; Li, H.; Chen, H.; Wang, H.; Wang, W.; Wang, D.; Guo, J. Stability analysis and porosity inhibition mechanism of oscillating laser-arc hybrid welding process for medium-thick plate TC4 titanium alloy. Opt. Laser Technol. 2024, 174, 110569. [Google Scholar] [CrossRef]
  24. Gupta, M.; Khan, M.A.; Butola, R.; Singari, R.M. Advances in applications of Non-Destructive Testing (NDT): A review. Adv. Mater. Process. Technol. 2022, 8, 2286–2307. [Google Scholar] [CrossRef]
  25. Kik, T.; Górka, J. Numerical simulations of laser and hybrid S700MC T-joint welding. Materials 2019, 12, 516. [Google Scholar] [CrossRef]
  26. Zhang, R.; Tang, X.; Xu, L.; Lu, F.; Cui, H. Study of molten pool dynamics and porosity formation mechanism in full penetration fiber laser welding of Al-alloy. Int. J. Heat Mass Transf. 2020, 148, 119089. [Google Scholar] [CrossRef]
  27. Wang, Z.; Oliveira, J.; Zeng, Z.; Bu, X.; Peng, B.; Shao, X. Laser beam oscillating welding of 5A06 aluminum alloys: Microstructure, porosity and mechanical properties. Opt. Laser Technol. 2019, 111, 58–65. [Google Scholar] [CrossRef]
  28. Shi, L.; Jiang, L.; Gao, M. Numerical research on melt pool dynamics of oscillating laser-arc hybrid welding. Int. J. Heat Mass Transf. 2022, 185, 122421. [Google Scholar] [CrossRef]
  29. Huang, Y.; Hou, S.; Sun, T.; Yang, L.; Li, S.; Chen, S. An improved model of porosity formation during pulsed GTA welding of aluminum alloys. Mater. Sci. Eng. B 2018, 238, 122–129. [Google Scholar] [CrossRef]
  30. Ghosh, N.; Pal, P.K.; Nandi, G. Parametric optimization of MIG welding on 316L austenitic stainless steel by grey-based Taguchi method. Procedia Technol. 2016, 25, 1038–1048. [Google Scholar] [CrossRef]
  31. Gui, H.; Zhang, K.; Li, D.; Li, Z. Effect of relative position in low-power pulsed-laser–tungsten-inert-gas hybrid welding on laser-arc interaction. J. Manuf. Process. 2018, 36, 426–433. [Google Scholar] [CrossRef]
  32. Shi, J.P.; Zhou, Y.B.; Liu, L.M. Application of pulsed laser-TIG hybrid heat source in root welding of thick plate titanium alloys. Appl. Sci. 2017, 7, 527. [Google Scholar] [CrossRef]
  33. Tani, G.; Campana, G.; Fortunato, A.; Ascari, A. The influence of shielding gas in hybrid LASER–MIG welding. Appl. Surf. Sci. 2007, 253, 8050–8053. [Google Scholar] [CrossRef]
  34. Li, Y.; Jiang, P.; Li, Y.; Mi, G.; Geng, S. Microstructure evolution and mechanical properties in the depth direction of ultra-high power laser-arc hybrid weld joint of 316L stainless steel. Opt. Laser Technol. 2023, 160, 109093. [Google Scholar] [CrossRef]
  35. Zhang, C.; Li, G.; Gao, M.; Zeng, X.Y. Microstructure and mechanical properties of narrow gap laser-arc hybrid welded 40 mm thick mild steel. Materials 2017, 10, 106. [Google Scholar] [CrossRef]
  36. Yang, S.; Yang, L.; Wang, D.; Zhang, F.; Liu, C.; Huang, G. Effect of welding stability on process porosity in laser arc hybrid welding of dissimilar steel. Optik 2022, 271, 170165. [Google Scholar] [CrossRef]
  37. Sriba, A.; Vogt, J.B.; Amara, S.E. Microstructure, micro-hardness and impact toughness of welded austenitic stainless steel 316L. Trans. Indian Inst. Met. 2018, 71, 2303–2314. [Google Scholar] [CrossRef]
  38. Xie, L.; Shi, W.; Wu, T.; Gong, M.; Cai, D.; Han, S.; He, K. Effect of Hybrid Laser Arc Welding on the Microstructure and Mechanical and Fracture Properties of 316L Sheet Welded Joints. Metals 2022, 12, 2181. [Google Scholar] [CrossRef]
  39. Wu, M.; Luo, Z.; Li, Y.; Liu, L.; Ao, S. Effect of heat source parameters on weld formation and defects of oscillating laser-TIG hybrid welding in horizontal position. J. Manuf. Process. 2022, 83, 512–521. [Google Scholar] [CrossRef]
  40. Gao, Z.; Jiang, P.; Mi, G.; Cao, L.; Liu, W. Investigation on the weld bead profile transformation with the keyhole and molten pool dynamic behavior simulation in high power laser welding. Int. J. Heat Mass Transf. 2018, 116, 1304–1313. [Google Scholar] [CrossRef]
  41. Kik, T. Computational techniques in numerical simulations of arc and laser welding processes. Materials 2020, 13, 608. [Google Scholar] [CrossRef] [PubMed]
  42. Ma, C.; Li, Y.; Cheng, L.; Zhao, Y.; Wang, J.; Zhan, X. Numerical analysis of gravity-induced coupling dynamics of keyhole and molten pool in laser welding. Int. J. Therm. Sci. 2024, 201, 108987. [Google Scholar] [CrossRef]
  43. Huang, J.; Pan, W.; Chen, J.; Shao, Y.; Yang, M.; Zhang, Y. The transient behaviours of free surface in a fully penetrated weld pool in gas tungsten arc welding. J. Manuf. Process. 2018, 36, 405–416. [Google Scholar] [CrossRef]
  44. Yan, T.; Zhan, X.; Gao, Q.; Wang, F.; Ling, W. Influence of laser power on molten pool flow field of laser-MIG hybrid welded Invar alloy. Opt. Laser Technol. 2021, 133, 106539. [Google Scholar] [CrossRef]
  45. Li, J.; Jiang, P.; Geng, S.; Xiong, J. Numerical and experimental study on keyhole dynamics and pore formation mechanisms during adjustable-ring-mode laser welding of medium-thick aluminum alloy. Int. J. Heat Mass Transf. 2023, 214, 124443. [Google Scholar] [CrossRef]
  46. Berger, P.; Hügel, H.; Graf, T. Understanding pore formation in laser beam welding. Phys. Procedia 2011, 12, 241–247. [Google Scholar] [CrossRef]
  47. Huang, J.L.; Warnken, N.; Gebelin, J.-C.; Strangwood, M.; Reed, R.C. On the mechanism of porosity formation during welding of titanium alloys. Acta Mater. 2012, 60, 3215–3225. [Google Scholar] [CrossRef]
Figure 1. (a) Schematic of the laser–TIG hybrid welding system; (b) schematic of the positional relationship between the laser and the arc; (c) dimensions of the butt plate and the bottom pad plate.
Metals 14 01469 g001
Figure 2. Schematic of metallographic and tensile specimens.
Metals 14 01469 g002
Figure 3. High-speed photographic images at different pulse frequencies: (a) 50 Hz; (b) 250 Hz; (c) 500 Hz.
Metals 14 01469 g003
Figure 4. Cross-sectional morphology of welded joints.
Metals 14 01469 g004
Figure 5. Cross-section of the joint at different pulse frequencies.
Metals 14 01469 g005
Figure 6. Cross-sectional histomorphology of joints at different pulse frequencies: (a) 0 Hz; (b) 50 Hz; (c) 250 Hz; (d) 500 Hz.
Metals 14 01469 g006
Figure 7. The enlarged views of the fusion line (the white box area) in Figure 6: (a) 0 Hz; (b) 50 Hz; (c) 250 Hz; (d) 500 Hz.
Metals 14 01469 g007
Figure 8. Hardness distribution of joints at different pulse frequencies.
Metals 14 01469 g008
Figure 9. Stress–strain curve of the joint.
Metals 14 01469 g009
Figure 10. SEM fracture microstructure: (a) base material; (b) joint (250 Hz); (c) joint (0 Hz); (d) 5000× magnification (base material); (e) 5000× magnification (250 Hz); (f) 5000× magnification (250 Hz).
Metals 14 01469 g010
Figure 11. Three-dimensional model.
Metals 14 01469 g011
Figure 12. Heat source model: (a) Gaussian surface heat source; (b) cylinder heat source; (c) combined heat source.
Metals 14 01469 g012
Figure 13. Simulation results of the weld cross-section.
Metals 14 01469 g013
Figure 14. Comparison score of joint cross-section morphology.
Metals 14 01469 g014
Figure 15. Flow field of the molten pool at different pulse frequencies: (a) 0 Hz; (b) 250 Hz.
Metals 14 01469 g015
Figure 16. Schematic of flow field at different pulse frequencies: (a) 0 Hz; (b) 50 Hz; (c) 250 Hz; (d) 500 Hz.
Metals 14 01469 g016
Figure 17. Schematic of laser–TIG hybrid weld pool.
Metals 14 01469 g017
Figure 18. Schematic of the bubble forces.
Metals 14 01469 g018
Table 1. Chemical composition of 316L stainless steel (wt%) [30].
MaterialsCSiMnPSNiCrMoFe
316L0.0150.521.110.0220.001112.1117.112.10Bal.
Table 2. Physical and mechanical properties of 316L steel.
MaterialMelting Point
(°C)
Thermal Conductivity
(W/m·K)
Density
(g/cm3)
Tensile Strength
σb/(MPa)
316L170016.37.98616
Table 3. Pulsed laser–TIG hybrid welding process parameters for 316L stainless steel.
NumberLaser
Power
(P/W)
DC
Current
(I/A)
Pulse
Frequency (f/Hz)
Peak
Current
(Ia/A)
Base
Value Current
(Ib/A)
Duty
Cycle
(δ/%)
Welding
Speed
(V/mm/min)
Protective
Gas Flow
(Q/L/min)
1#1800600--10030015
2#1800-5090305030015
3#1800-25090305030015
4#1800-50090305030015
Table 4. Heat source parameters.
ParameterSymbolValue
Arc effective power factor η 0.9
Spot radius (mm)R0.4
Cylinder heat source depth (mm)H3.2
Laser utilizationA0.5
Ambient temperature (K)Ta300
Liquid-phase line temperature (K)TL1733
Vaporization temperature (K)Tv5000
Solid-phase line (K)Ts1693
Latent heat of fusion (KJ/Kg)Hf300
Coefficient of thermal expansion (1/K)α10−4
Stefan–Boltzmann15.67 × 10−8
Disclaimer/Publisher’s Note: The statements, opinions and data contained in all publications are solely those of the individual author(s) and contributor(s) and not of MDPI and/or the editor(s). MDPI and/or the editor(s) disclaim responsibility for any injury to people or property resulting from any ideas, methods, instructions or products referred to in the content.

