Article

Design and Application of a Miniature Pneumatic Bellows Loading Device for In-Situ Tensile Testing inside the Scanning Electron Microscope

Fatigue and Fracture Mechanics & Knowledge-Driven Design, VTT Technical Research Centre of Finland Ltd., P.O. Box 1000, FI-02044 VTT Espoo, Finland
*
Author to whom correspondence should be addressed.
These authors contributed equally to this work.
Metals 2024, 14(2), 154; https://doi.org/10.3390/met14020154
Submission received: 27 November 2023 / Revised: 12 January 2024 / Accepted: 18 January 2024 / Published: 26 January 2024

Abstract

:
A miniature pneumatic bellows device was designed for in-situ testing inside the scanning electron microscope. The device uses a pneumatic actuator to load the specimen and displacement is directly monitored with a linear variable differential transformer sensor. Its application allowed the direct monitoring of microstructural and defect evolution in materials at the micro scale. The data produced by this testing device, in combination with measurements from micro digital image correlation, were successfully used to model the crystal plasticity of a martensitic/bainitic steel at the microstructural length scale.

1. Introduction

Modern energy production systems, such as those in Generation IV nuclear reactors and fusion reactors, have greatly influenced the demand for developing advanced materials which can withstand extreme service conditions, as well as accurate testing techniques for verifying the strict requirements set on their properties under those conditions [1,2,3]. Material selection for modern designs requires detailed information on a range of material parameters from microstructural characteristics to corrosion resistance, fracture toughness, oxide film formation, and the impact of irradiation on their mechanical properties [4,5].
To acquire the data necessary to define these design parameters in different environments, it is essential to also consider what is required of the material testing systems. There is a wide range of possibilities for material testing, such as tensile testing [6], hardness measuring [7], stress corrosion cracking [8], low and high cycle fatigue [9,10], creep [11,12], and many variants with combined effect of environmental parameters [13]. The results of these tests must be accurate for their application in nuclear design, and often custom solutions must be designed to allow tests of standard and miniature dimensions under complex loading conditions and hostile environmental factors [14,15].
For that reason, a novel class of multifunctional high precision pneumatically driven testing systems has been developed to achieve the requirements for testing materials for nuclear applications. An overview of this flexible concept, the wide spectrum of tests it can carry out, and results from different tests can be found in reference [16]. Pneumatic bellows loading devices have been successfully utilized for mechanical testing in several different purposes and scenarios: in nuclear power plant simulated water environments, such as three-point bending tests of pre-cracked samples in Boiling Water Reactor (BWR) [17] and tensile tests in Pressurized Water Reactor (PWR) environments [15]; in Super Critical Water (SCW) [18,19], on-site nuclear reactor in-pile tensile testing [20] and creep testing [12,21]; tensile testing in liquid lead [22]; and segmented expanded cone-mandrel tests [23]. One of the latest applications of this concept is a compact tensile testing device that can be mounted inside the scanning electron microscope (SEM) for in-situ testing with monitoring of material microstructural evolution.
A pneumatically controlled device has several advantages compared to a hydraulic or stepper motor-controlled device, which is the reasoning for choosing this technology for this specific application. One advantage is that the apparatus in which the specimen is mounted and tested does not need to be in proximity with the pneumatic servo-controlled pressure control circuit, and good control accuracy can still be retained. Furthermore, the pneumatic force control system does not cause vibration in the force output, which is advantageous when carrying out measurements at the micro length scale. The lack of moving parts in the pressure interface also improves accuracy, as there are no extra separate seals in the pressure limit. Furthermore, these devices can also consistently apply extremely low deformation rates that enable super slow strain rate testing [15] and are straightforward to apply for testing in hostile environmental conditions [23].
In pursuance of relevant microstructural evolution data during deformation and the testing of micro components, different systems to enable in-situ mechanical testing inside the SEM have been proposed by works in the literature [24,25,26,27]. Zhu and Espinosa [24] proposed a system that consists of an actuator and a load sensor that is capable of testing nanostructures in both SEM and TEM. Ma et al. [25] built a system based on servomotors and reducers that was able to carry out quasi-static tests while also keeping the specimen centered. Wang et al. [26] designed a micro-electromechanical system which used piezoresistive sensors for measuring both force and displacement. Min and Park [27] proposed a bidirectional testing system which uses piezo actuators to apply load, and displacement sensors to measure the elongation of the specimen and load by measuring the change in length of springs in the system. Nevertheless, there is still room for the development of such systems, which are greatly dependent on the goal they are meant to achieve, and on the device and environment which they are planned for.
The design of a pneumatic system for in-situ tensile testing in the SEM at high magnifications must take into account that the system must be small-scale to fit inside the microscope chamber, have precise power control, and the capacity to apply load to a specimen by the control of pressurized gas. In addition, considering that the environment inside a SEM requires a vacuum as a working environment, a specific calibration system is required to properly measure the load which is calculated using the pressure inside the pneumatic loading unit.
To make the most out of in-situ testing carried out inside the SEM, it is fundamental for the most amount of microstructural and crystallographic information to be extracted from the investigated material throughout the test. In general, SEM imaging provides good microstructural and topographical data that allows for the grain structure and carbide distribution to be analyzed, while Electron Backscattered Diffraction (EBSD) can provide a thorough crystallographic description of the microstructure, which is significant for understanding material state and estimate material defect quantity and distribution. Furthermore, the application of image analysis techniques, such as Digital Image Correlation (DIC), can also be applied to the SEM images to measure full-field displacements and strains on a microstructural scale [28,29,30]. Such analyses are robust and versatile, being able to obtain quantitative data that are essential to improve our understanding of complex material phenomena such as banding, damage initiation and strain partitioning [31,32,33]. The initial microstructural data can be used as inputs for crystal plasticity modelling approaches and the subsequent crystallographic information and full-field strain data of the loaded states can be used as validation [32,33,34]. The combination of mechanical testing, microstructural characterization, and modelling optimization plays a key role in furthering our understanding in phenomena which are on a micro and nanoscale.
This paper describes the development of a miniature pneumatic bellows loading device used to carry out in-situ tensile testing inside a SEM, as well as a cassette loading system which allow safe specimen mounting and that keeps them loaded for ex-situ characterization. The paper also details how this system can be utilized for acquiring relevant microstructural data during mechanical testing, for measuring displacement and strain distribution at a grain level, and the importance of such data for the validation of crystal plasticity modelling in the microstructural length scale.

2. Design and Implementation of the Miniature Pneumatic Bellows Loading Device for SEM In-Situ Testing

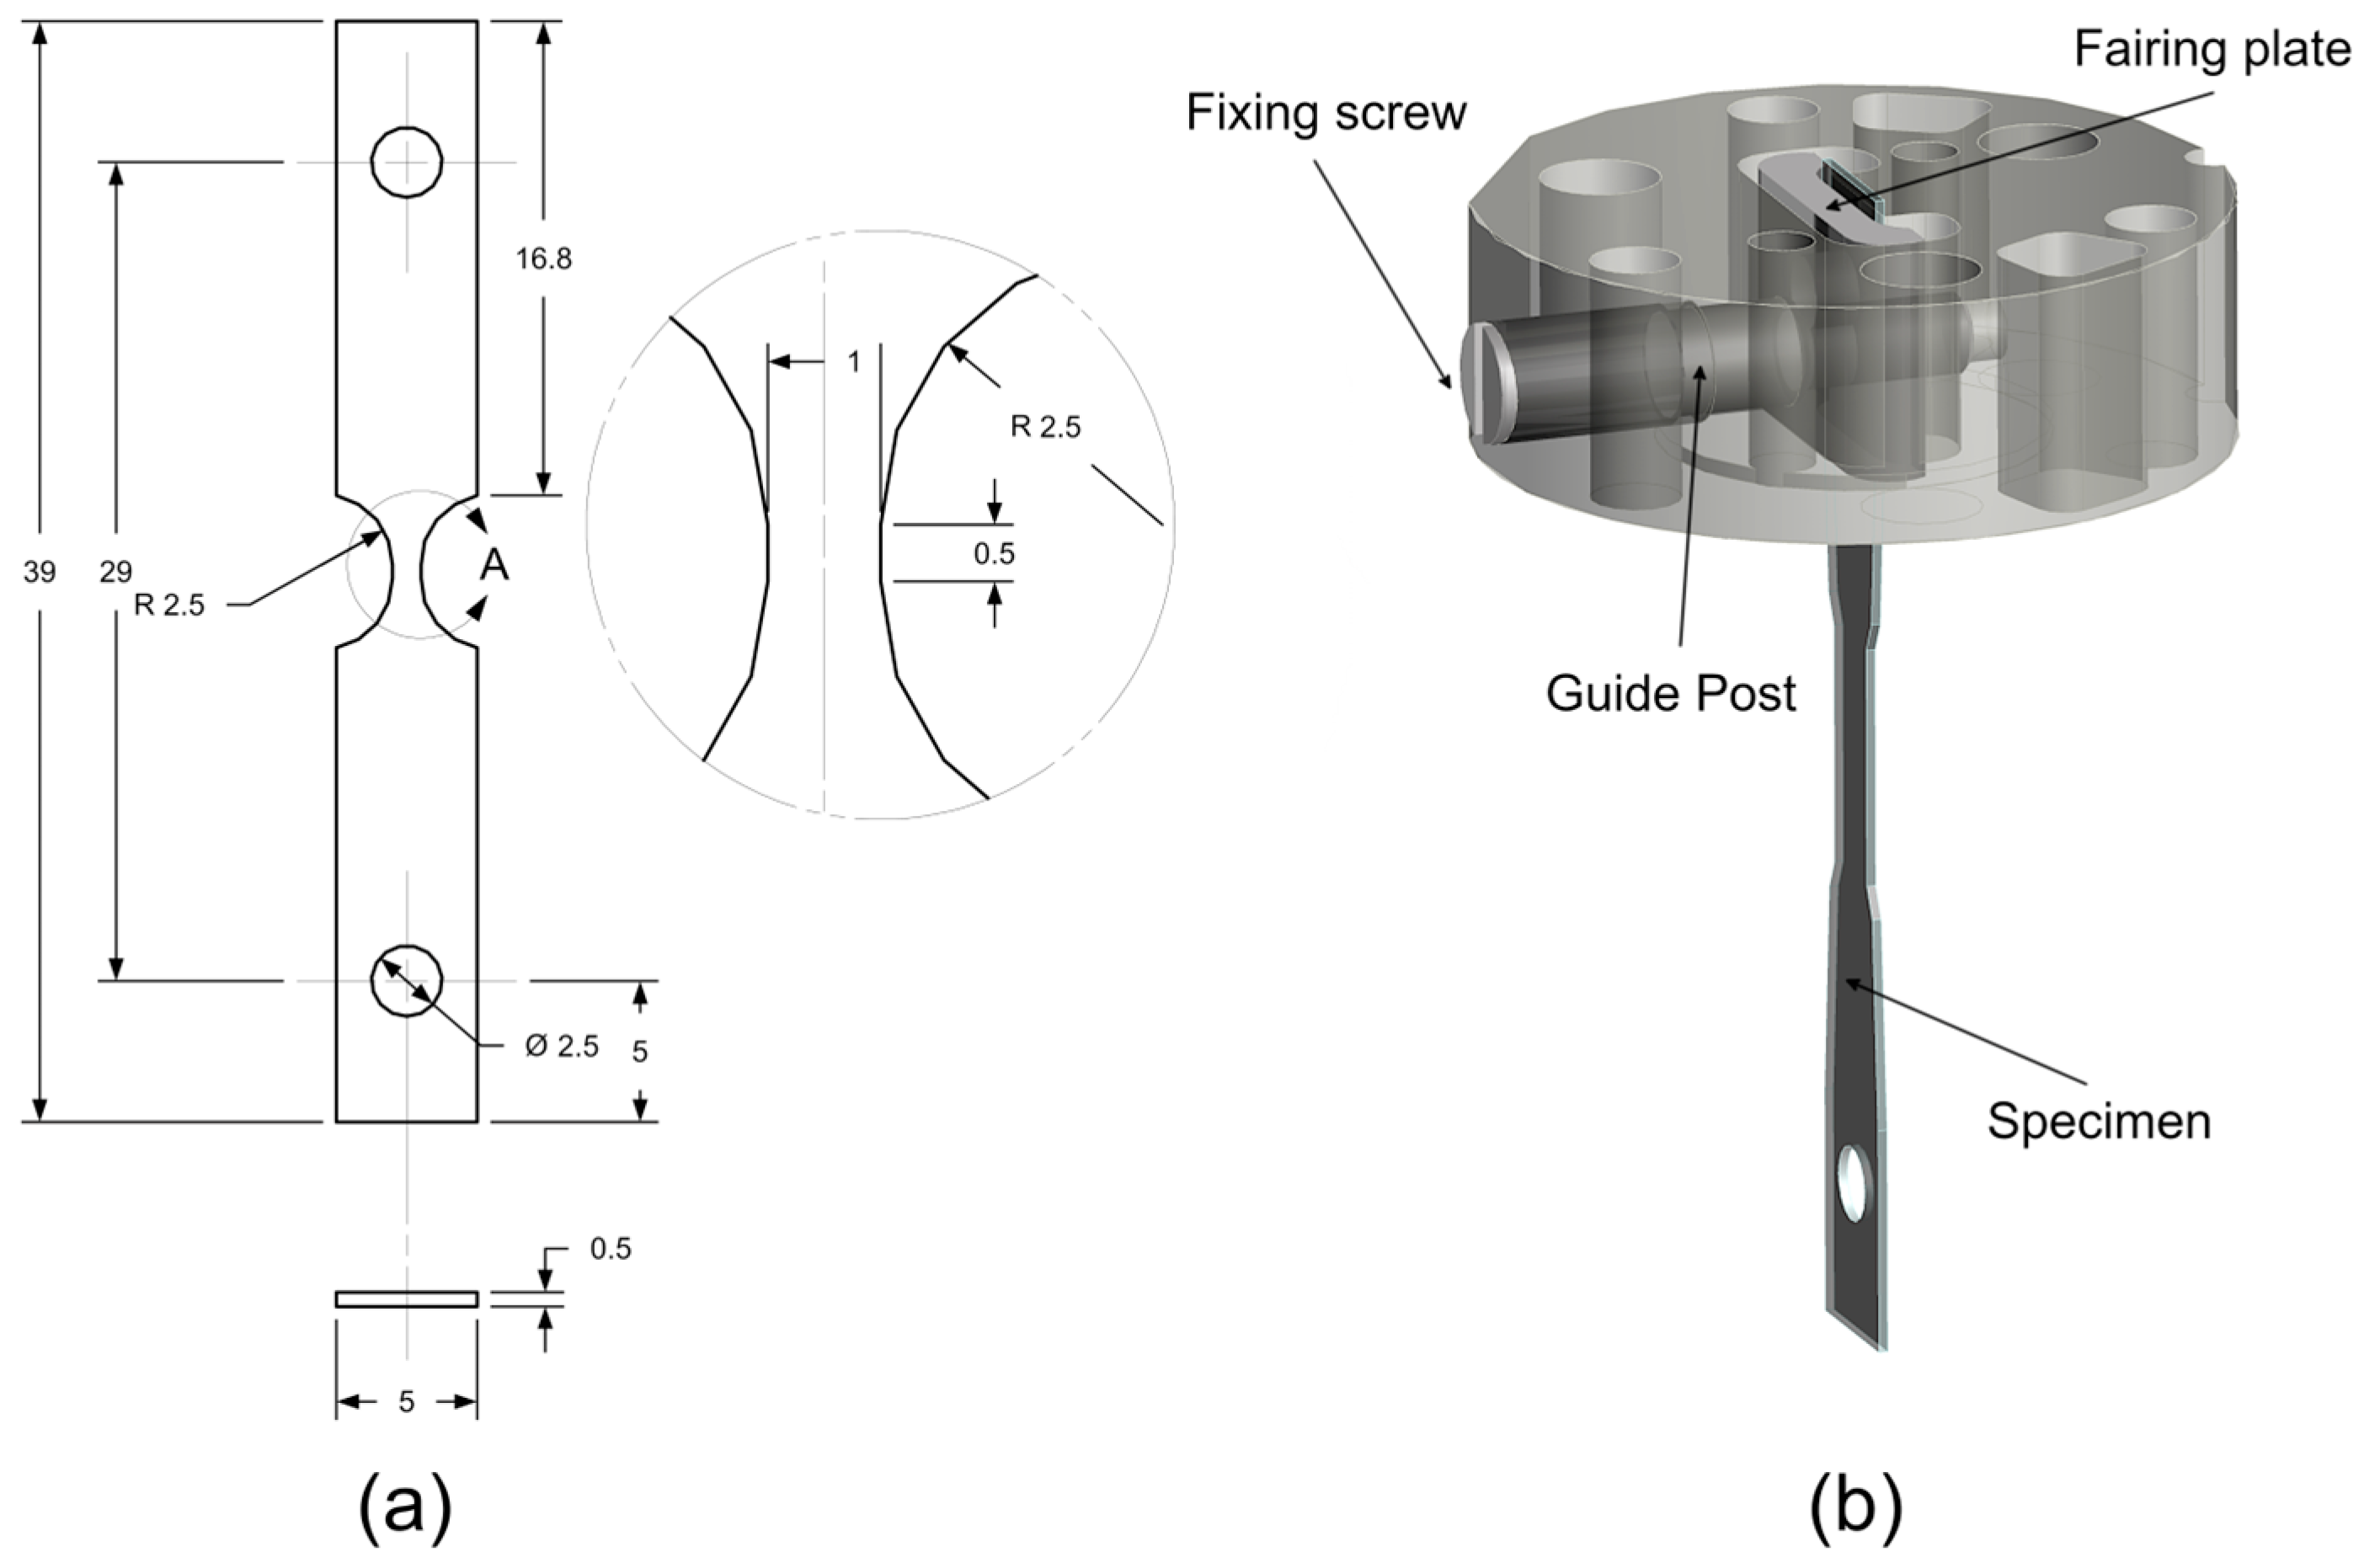
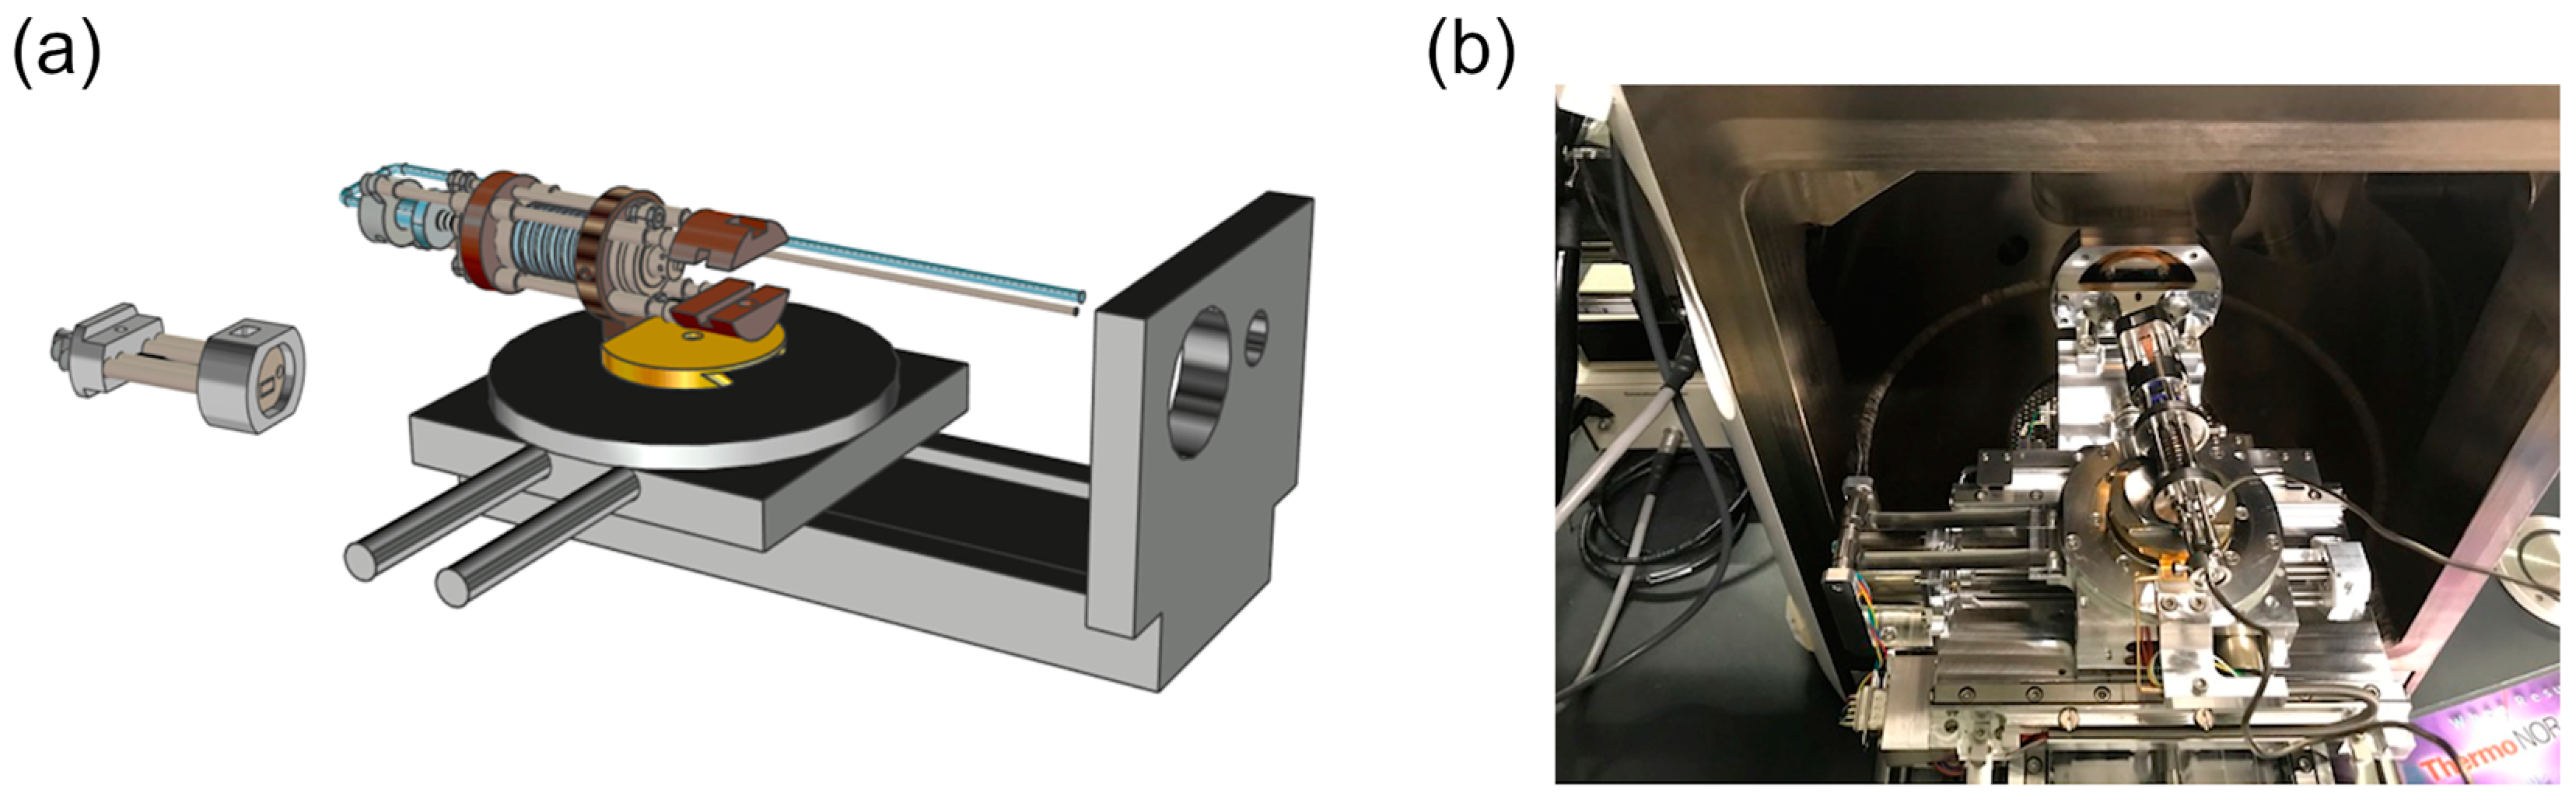
2.1. Development of the Load Frame

A modified in-reactor tensile loading frame was initially used as a first prototype for the efforts of miniaturizing the device for application inside the microscope [20]. The model and dimensions of the load frame used for the miniature loading frame for testing in the SEM is shown in Figure 1. It was built using three supporting posts which work as an alignment system that is suitable to the SEM space limitations. The design of the load frame was made so that it would be symmetrical, while ensuring no flexibility throughout the attachment points of the specimen and the pneumatic loading system. The mechanical clearance of the system mobile components, such as the columns of the specimen holder through the alignment holes, is of roughly ±0.01 mm. The maximum diameter and length of the device are 25 mm and 125 mm, respectively [20].

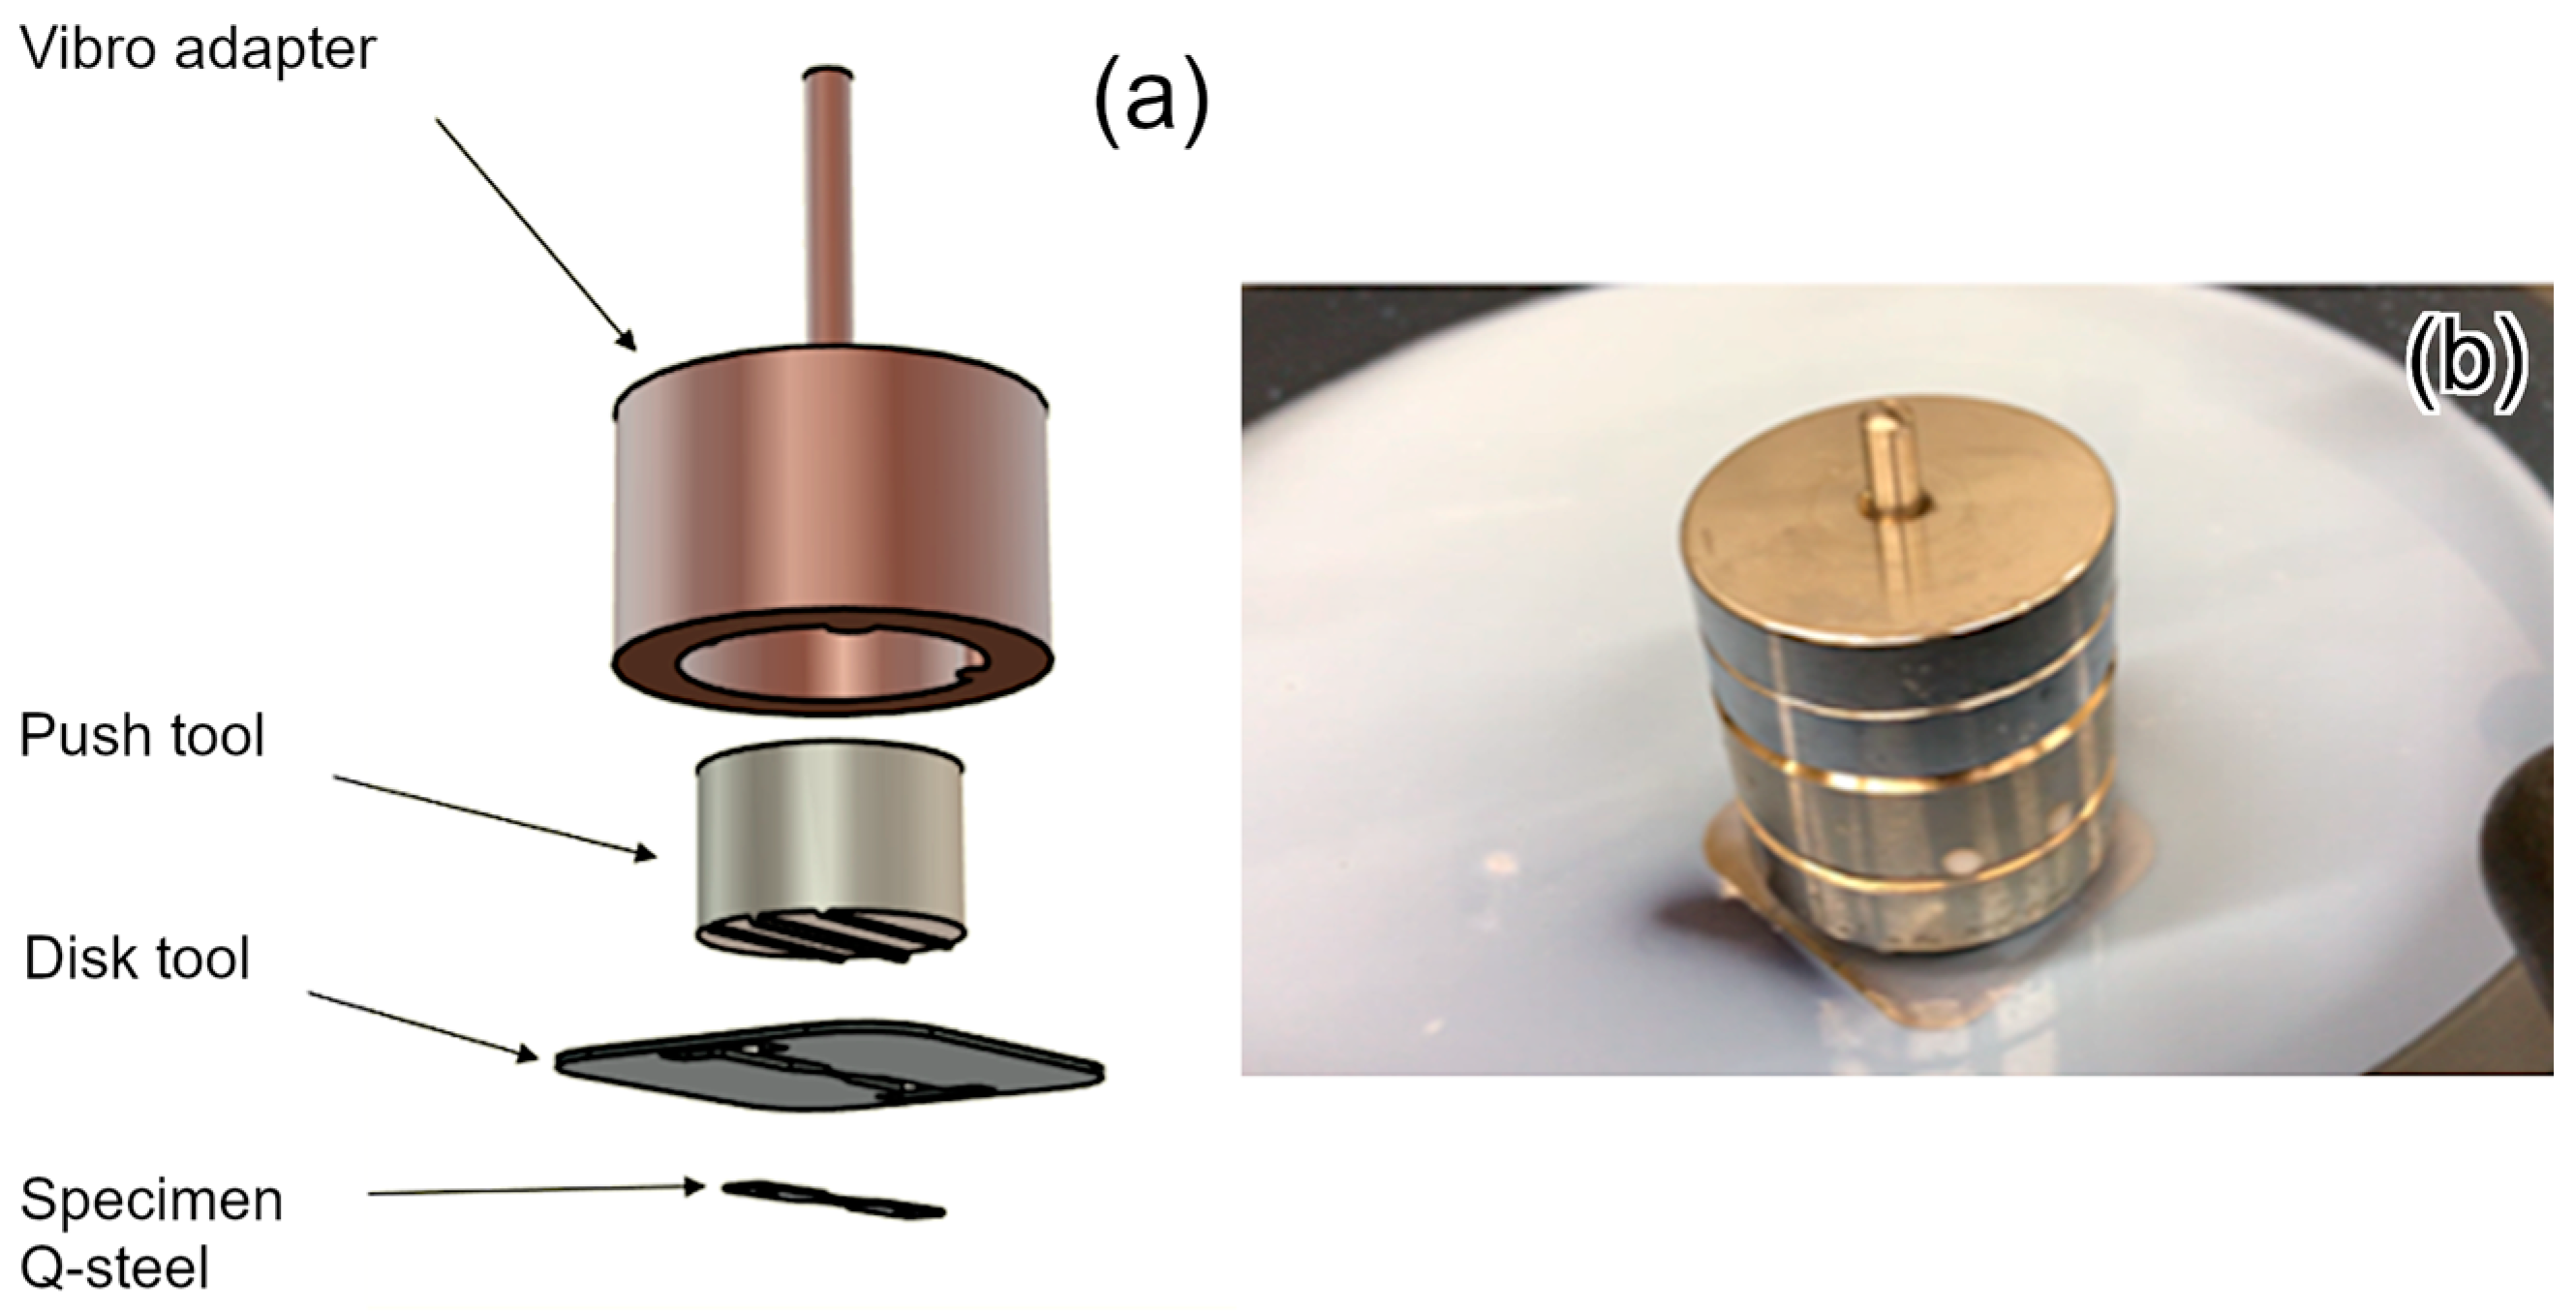
2.2. Fastening System of the Thin Tensile Specimen to the Testing Device

The design and nominal dimensions of the miniature tensile specimen used in this system, as well as the fastening system to fix the specimen to the device are shown in Figure 2. The specimen fastening system was designed to have proper specimen alignment, no bending of the specimen during fastening, simplicity to correct the specimen position and ease of use. The fastening system comprises fairing plates, fixing screws, guide posts, and carrier pins. The concept limits specimen warping during installation in the system by using fairing plates. The rotation range of this plate was designed so that it can only rotate a few tens of micrometers with the initial turns of the fixing screw. Therefore, once the fairing plate is in contact with the miniature tensile specimen, it can only have forward movement, which ensures that no bending component is applied to the specimen by the fixing screw. The specimen and system were designed so that a carrier pin can be used to obtain the proper vertical alignment between these components, as depicted in Figure 2.

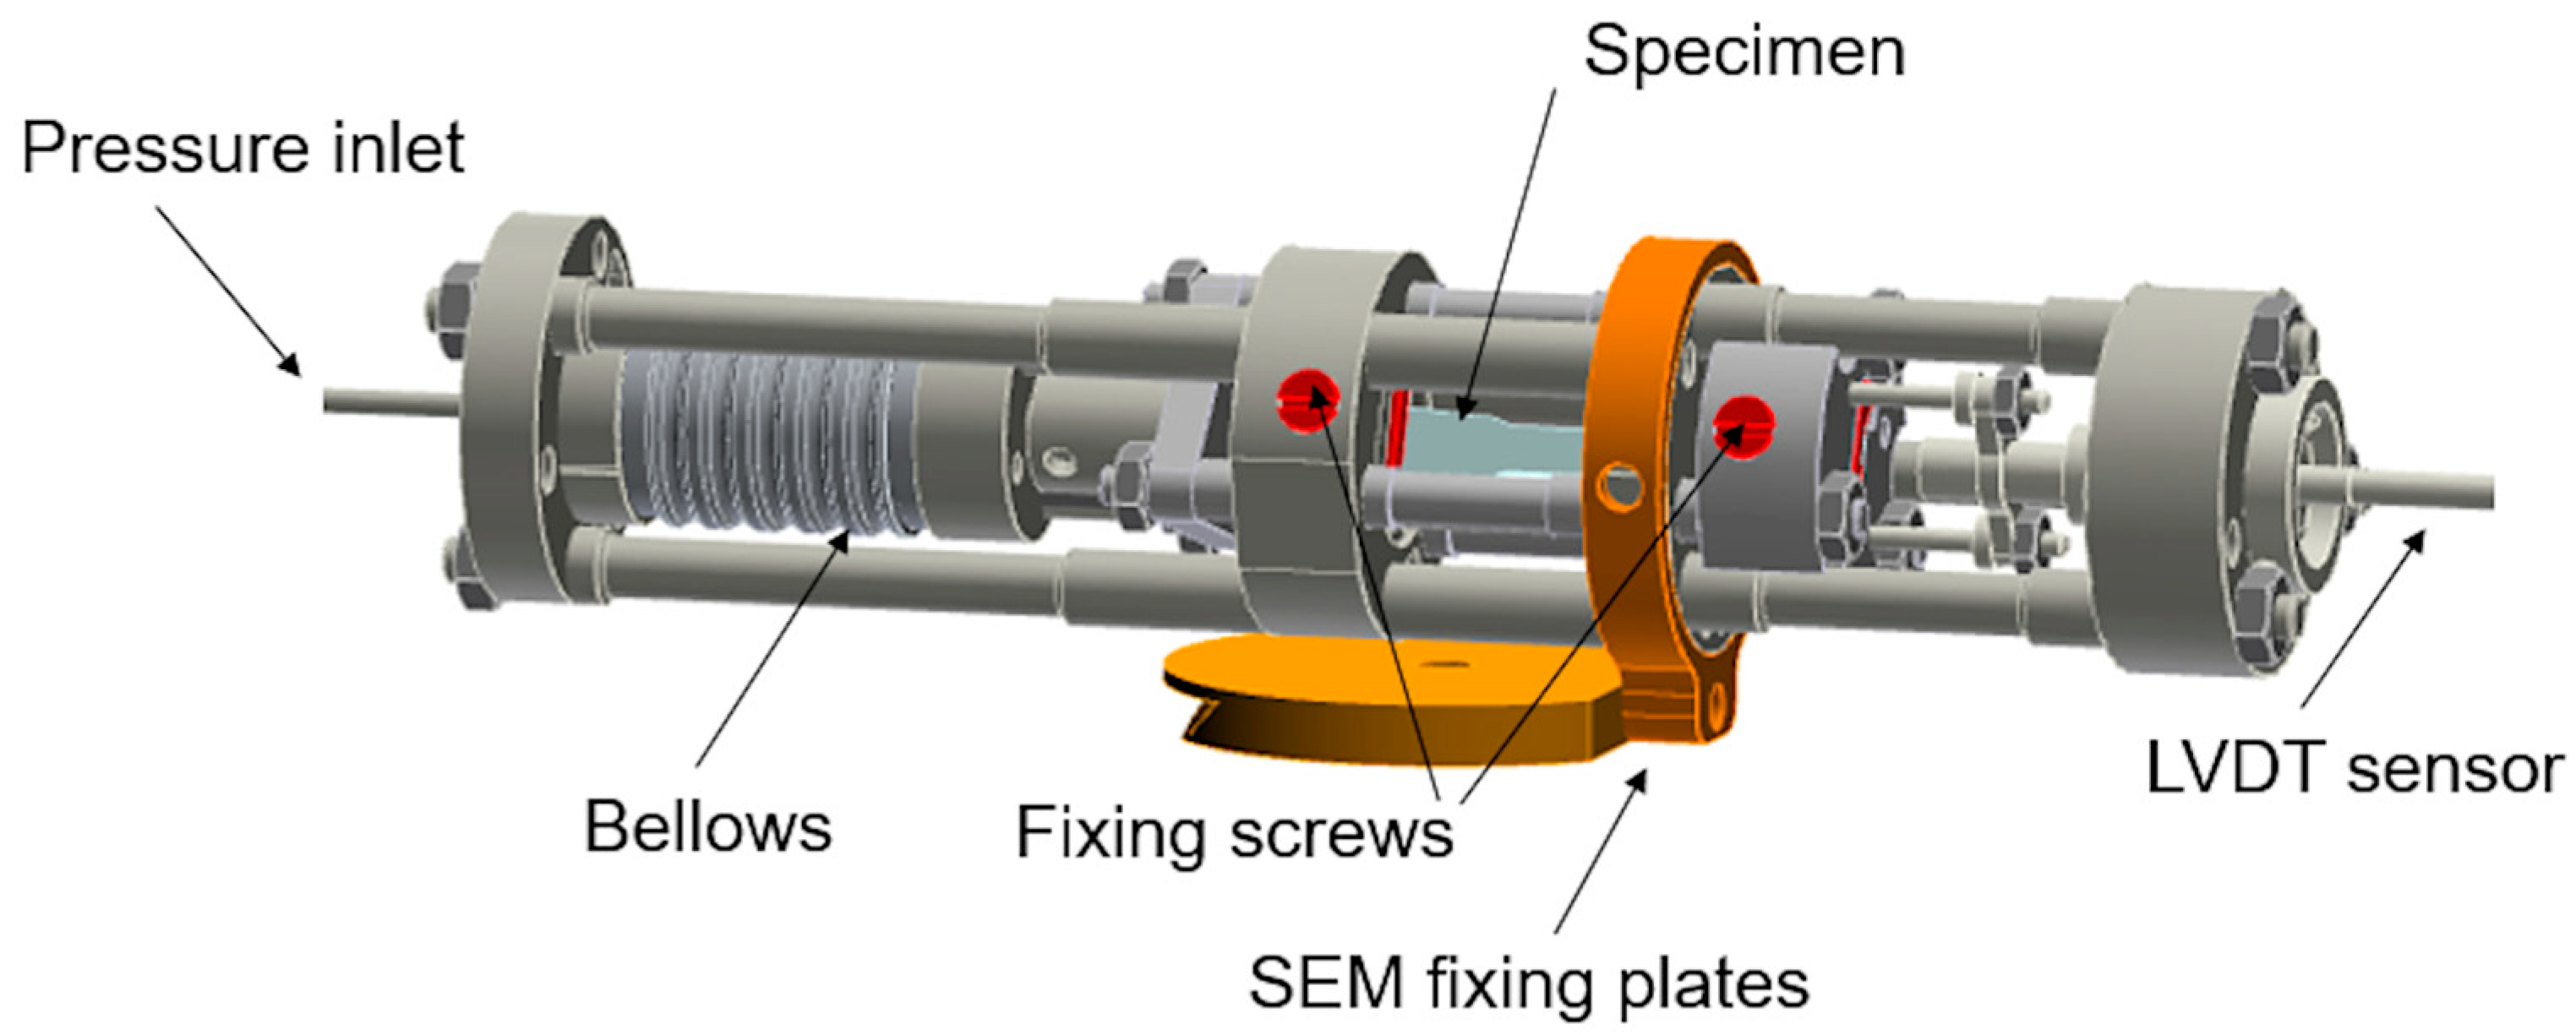
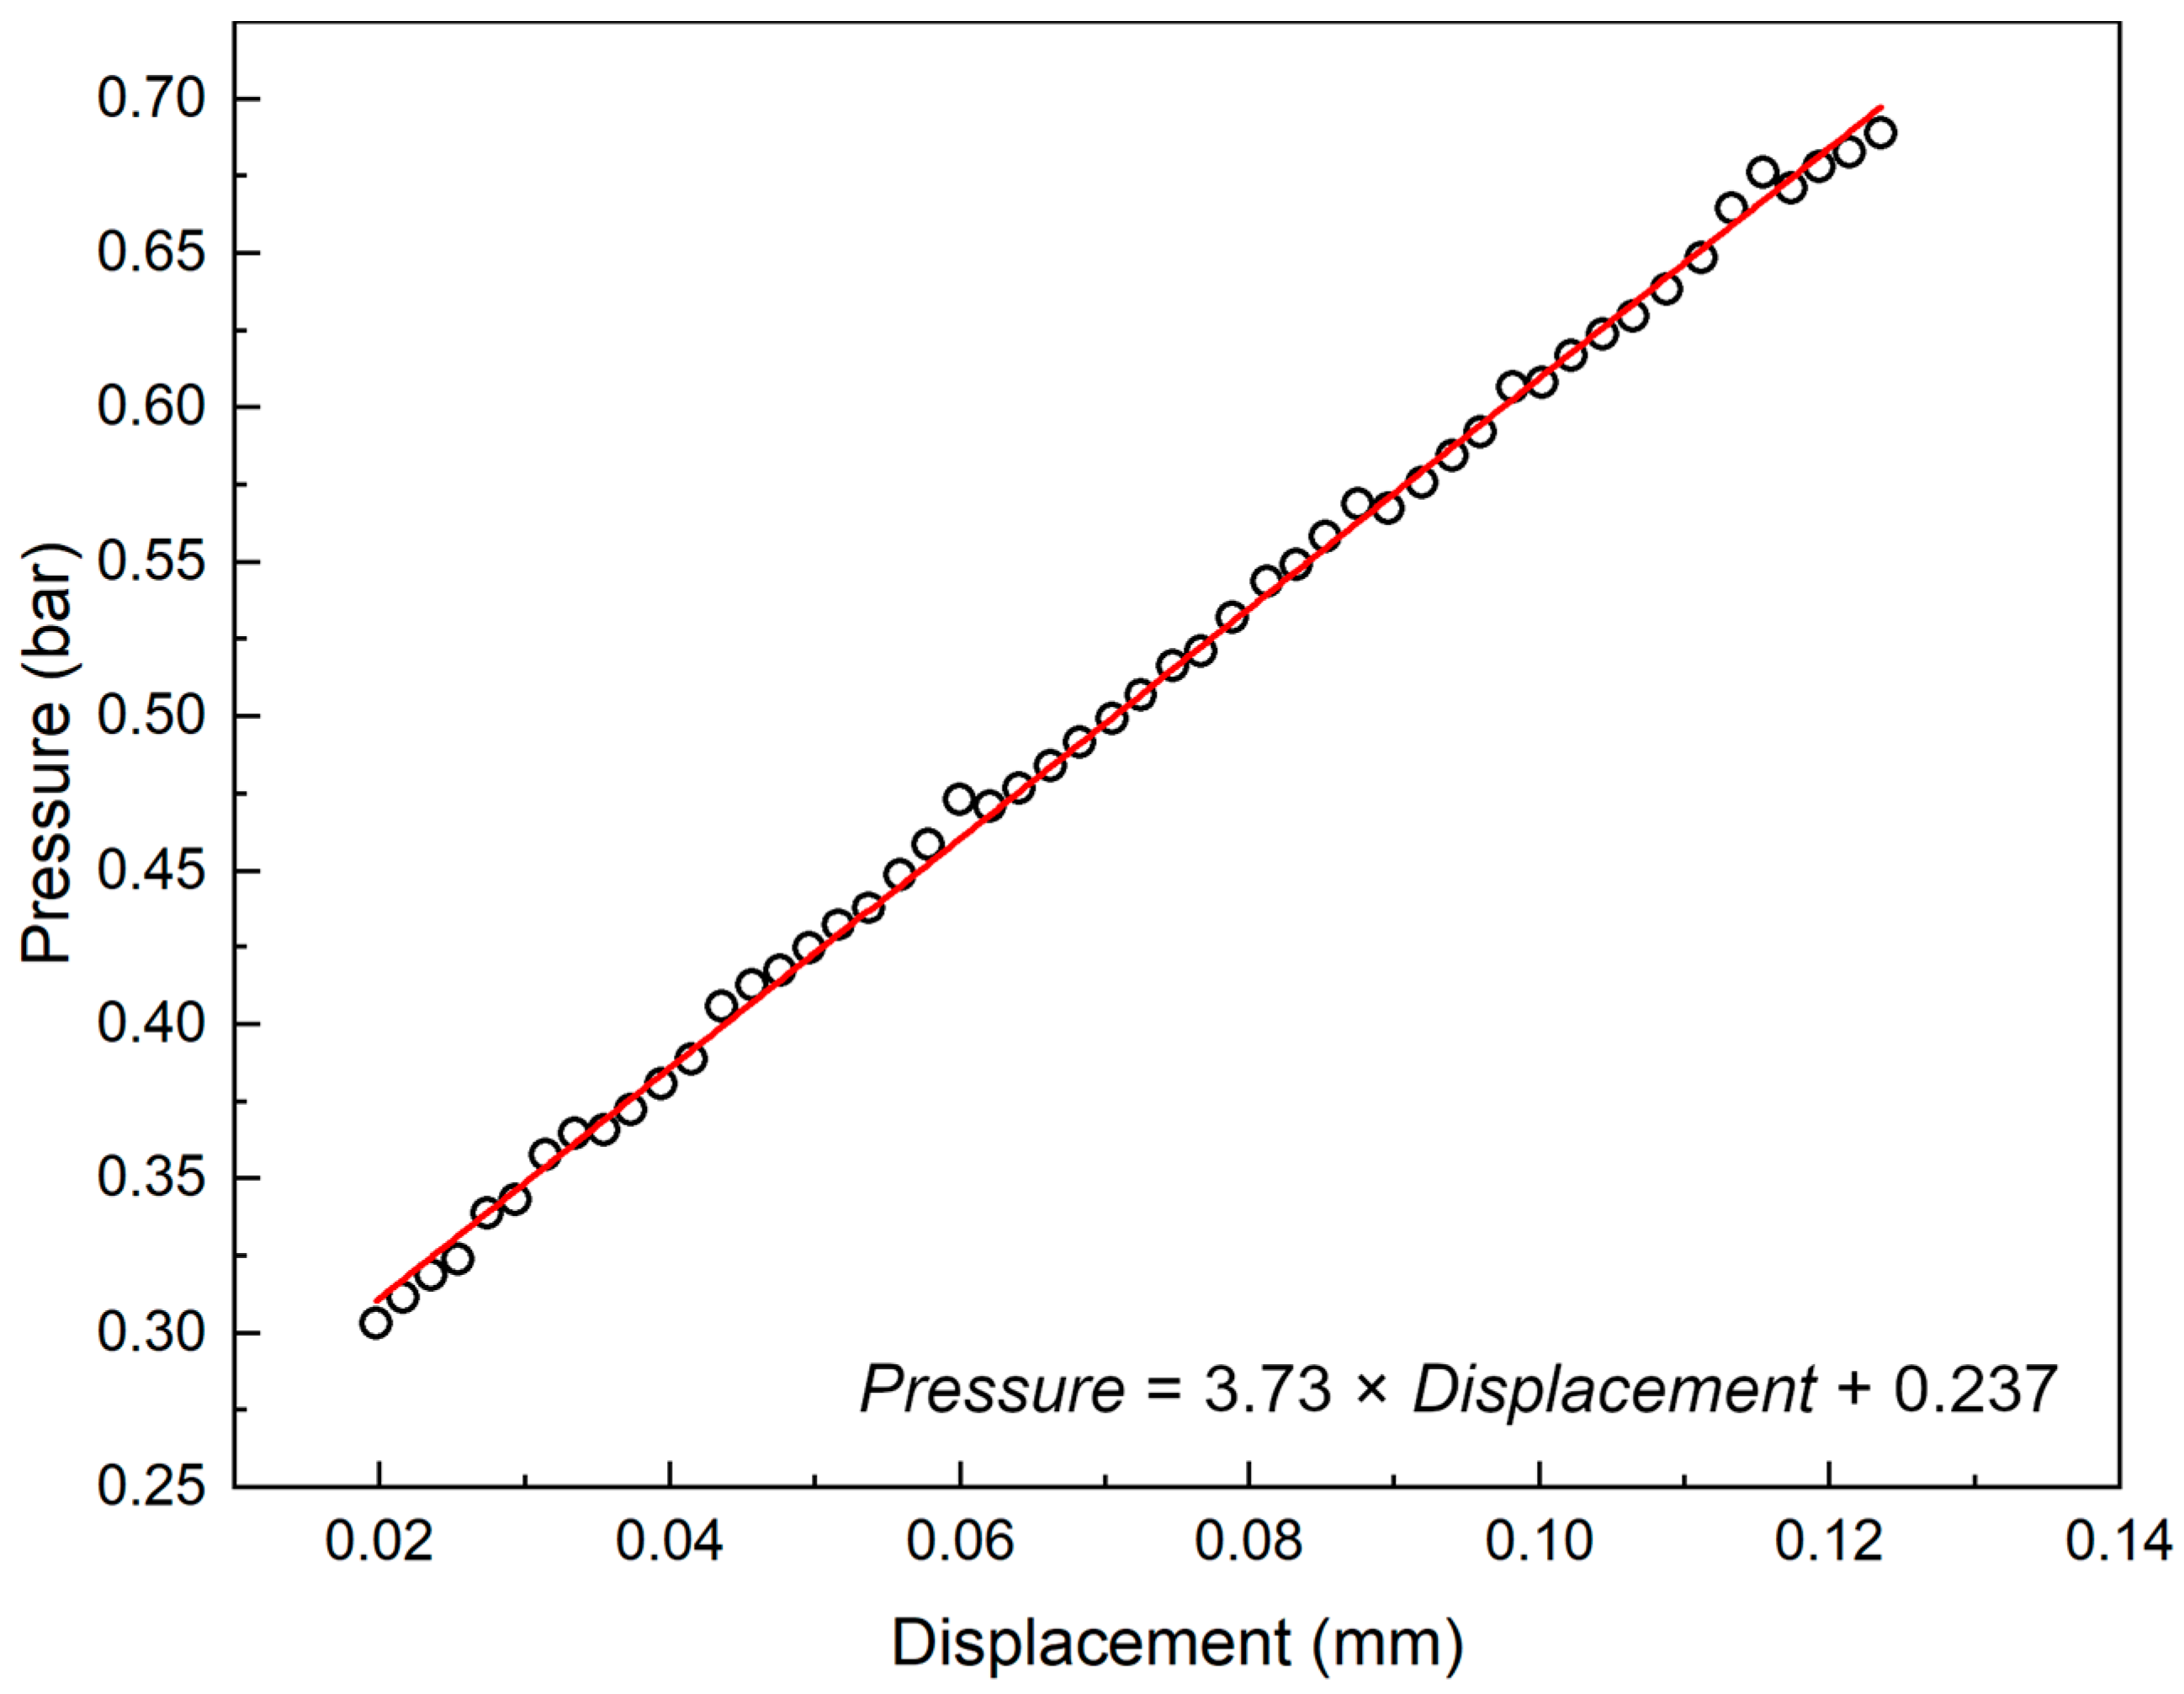
2.3. Pneumatically Driven Testing Device and Calibration of the Loading Unit

The fundamental concept behind the working of the pneumatically testing device is its load applying ability by controlling the pressurized gas inside the metal bellows. A servo-controlled pressure regulation system controls the pressure inlet that leads the gas to the bellows. The load applied by the device can be calculated by utilizing the metal bellows internal pressure and its cross-sectional area. The system for fixing the device to the SEM is designed so that the device can be rotated, as shown in Figure 3.
To accurately measure the relationship between gas pressure in the bellows and applied load, a calibration procedure was carried out. The exact same load frame, mobile parts, and loading system were used inside a calibration system. The calibration of the device was carried out at room temperature in a gaseous environment inside a calibration frame, as depicted by Figure 4. The load frame posts connected to the bellows were transported to another location and then reassembled inside the calibration system. This system comprised a main calibration frame, a Linear Variable Differential Transformer (LVDT) sensor, and a load sensor. The calibration process consisted of two separate procedures and was performed using a CuCrZr specimen to find the bellows effective cross sectional area and stiffness. The first calibration is used to define the self-stiffness of the bellows, which already includes the friction losses of the moving parts in the system. In the second calibration, the effective cross-sectional area is measured. These can then be used to calculate the applied force considering the inherent stiffness and friction in the system. According to its results, the stiffness of the bellows was of 3.76 bar/mm and its effective cross section of 106 mm2. An example plot of the raw data obtained in a load-pressure calibration is shown in Figure 5. According to these results and the loading unit stiffness measurement, a precise calibration was obtained for load applied in the system as a function of pressure inside the bellows.
The comparison between the load as quantified by the calibration system load cell during the calibration procedure and the calculated load is shown in Figure 6. The maximum load measured by the load sensor during the calibration was of 210.9 N while the calculated load was of 212.1 N, which means that the deviation of the calculated load was of roughly 0.5%. The deviation of between both measured load and load obtained from the pressure calibration in the tested displacement extent (0–1.3 mm) was approximately ±1%. The largest deviation of the calculated load occurred at the onset of the calibration procedure and is related to compliance early on during the calibration. The compliance of the calibration system and sliding fit of the mobile parts marginally impact the results of the procedure, but to such a small extent that the calibration was still considered accurate.
In the final design of the device, the highest pressure within the pneumatic loading unit ranged from 3 to 7 MPa and displacements of 1.2 mm were achievable. These were considered appropriate to reach the largest load level required for the designed specimen geometry during the tensile testing inside the SEM.

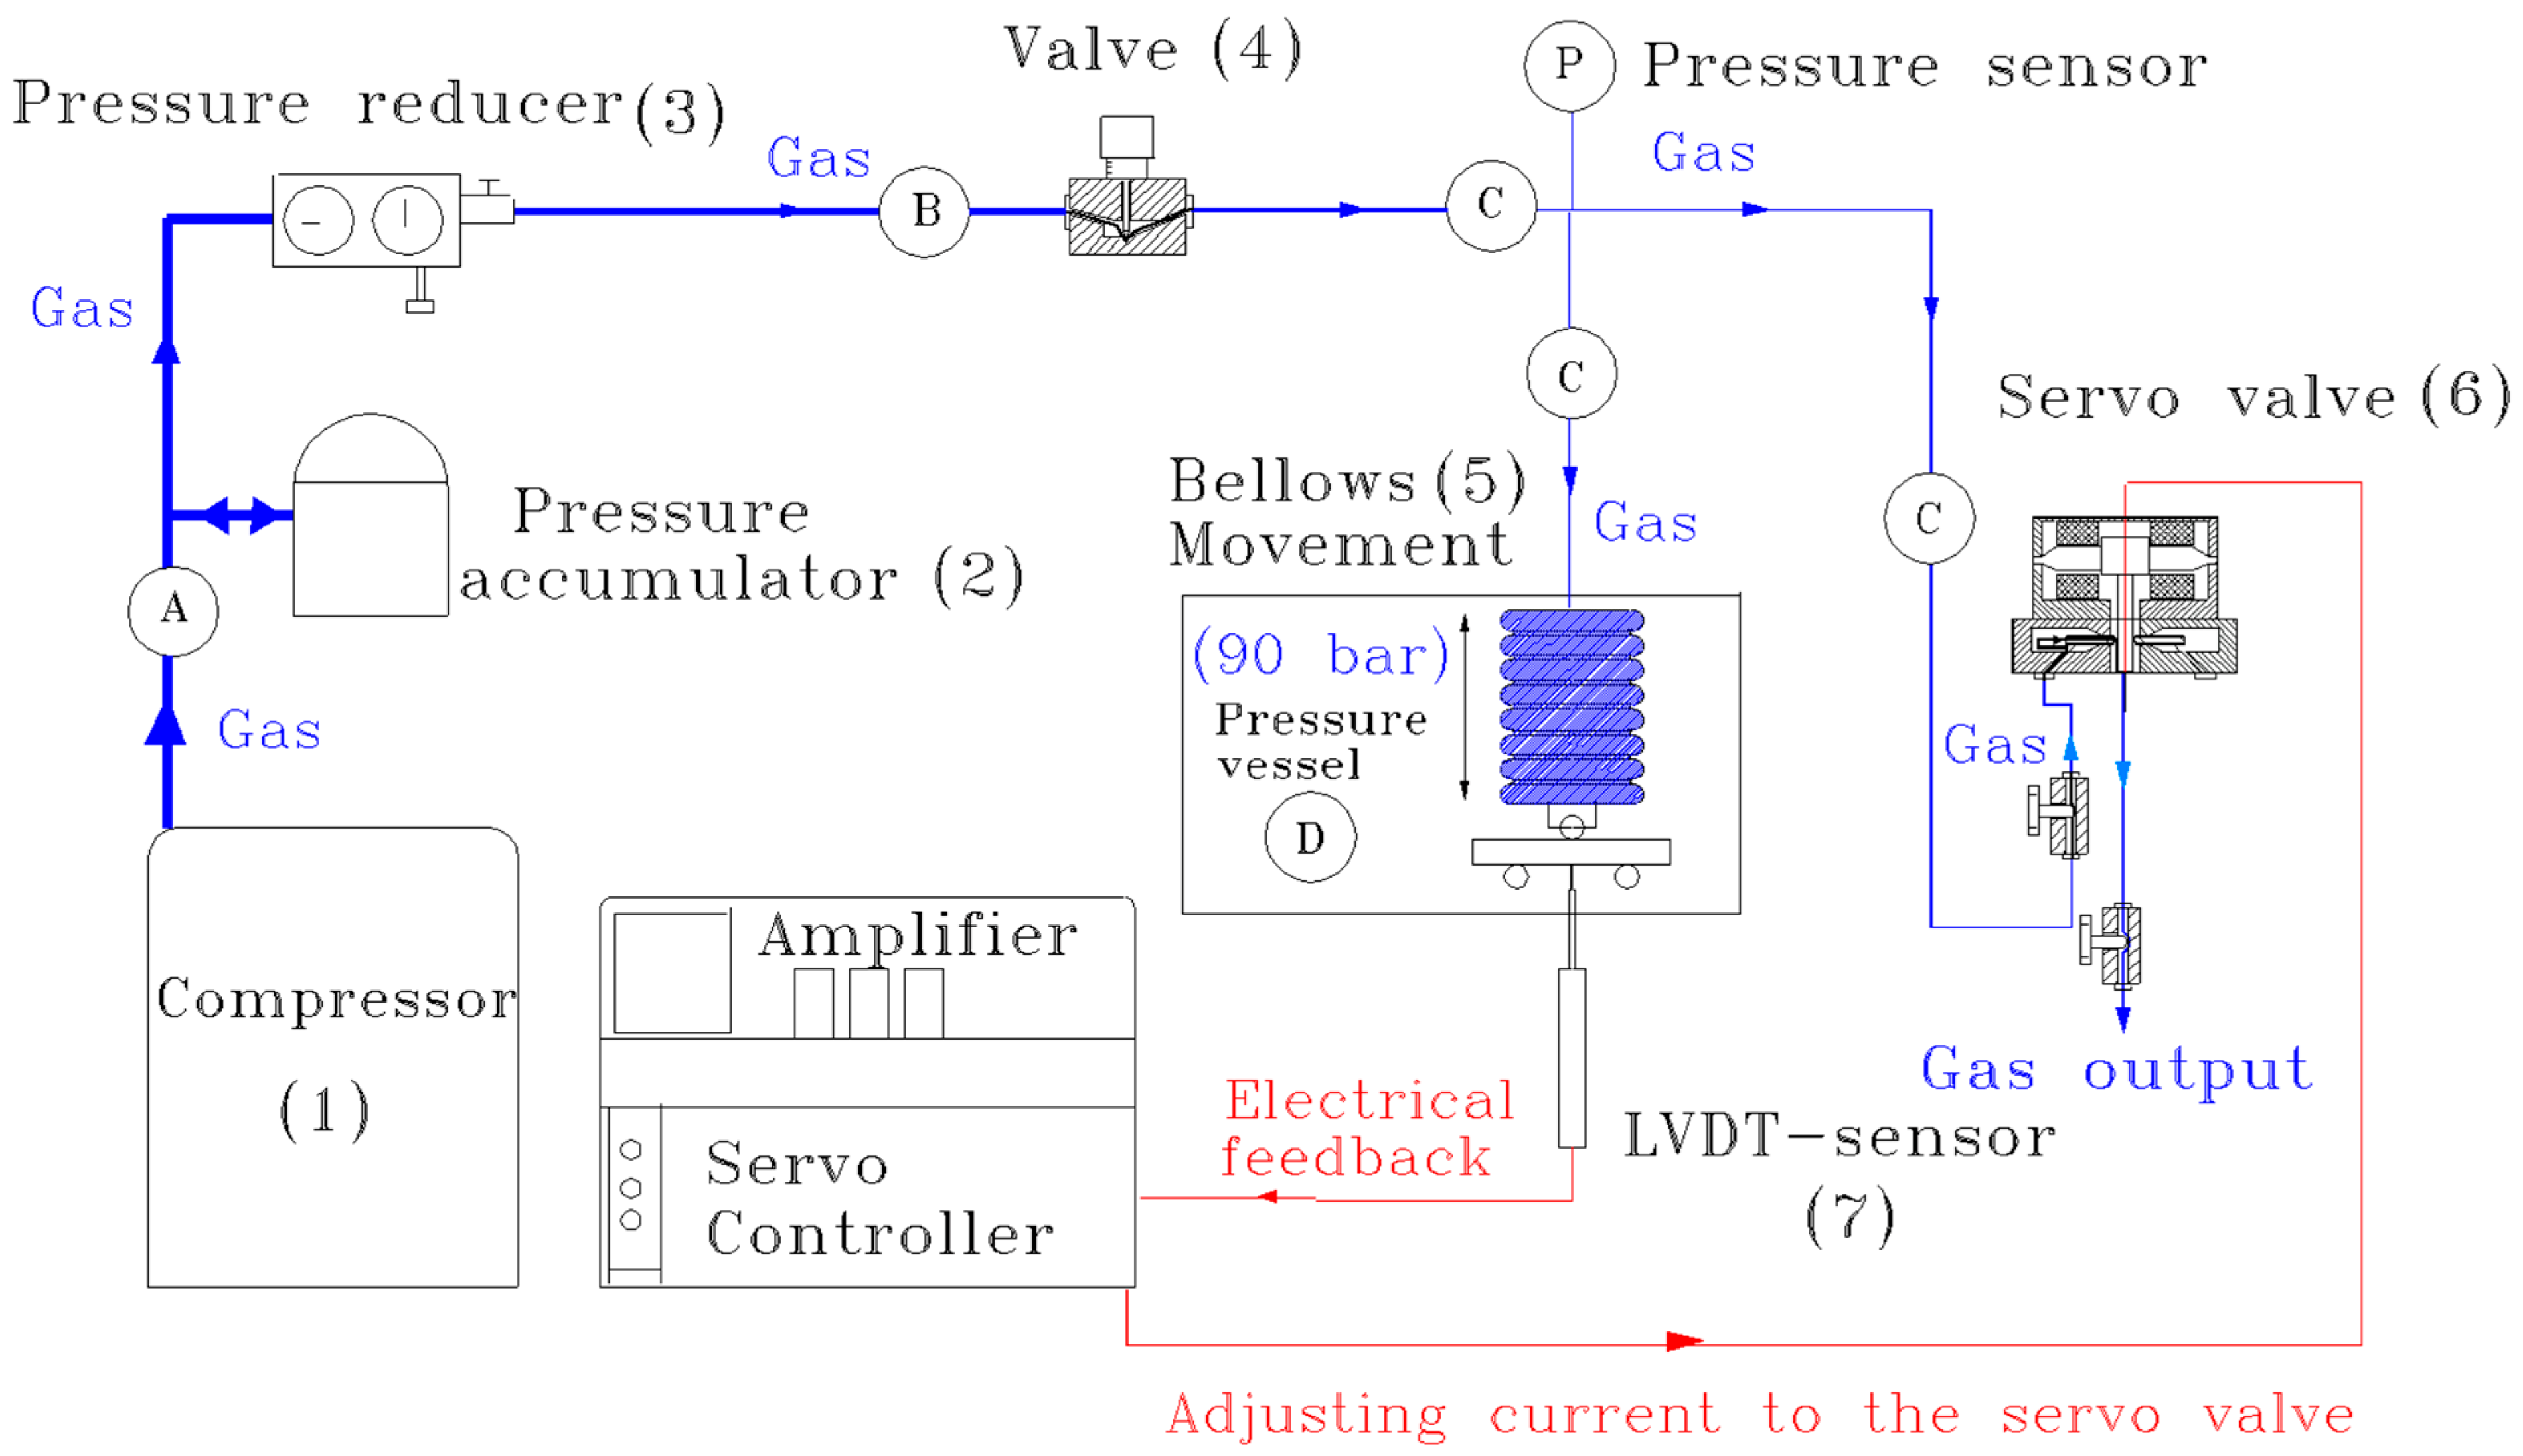
2.4. Design and Operation of the Pneumatically Driven Pressure Regulation System

The fundamental components and functioning of the pneumatically driven regulation system used to control the movement of the bellows are depicted in Figure 7. The pressure regulation system comprises four different pressure interfaces as shown in Figure 7. At the pressure interface (A), the gas pressure required for servo valve (6) is supplied by a fully automatic high-pressure compressor (1), which produces a working pressure level of 20 MPa. The pressure range at the pressure interface (A) in a tensile test is within 17.5–20 MPa.
The gas is led from the pressure accumulator (2) to a pressure reducer (3) and then further across a flow valve (4) via piping that are 6 mm in diameter. The interface pressure (B) is dependent on where the test is carried out and specimen geometry, and it is adjustable via the pressure reducer (3). According to the manufacturer, the highest pressure handled by the servo valves is of 20 MPa.
The gas is then directed from valve (4) to the bellows (5) and then to the servo valve (6) (pressure interface (C)). The gas pressure from the servo valve is released from the pressure interface (C). The appropriate initial pressure necessary for distinct tests conditions are achievable (pressure interface (C)) with precise control of pressure regulator (3) and the flow valve (4).
The pressure adjustment of the metal bellows (5) and the pressure interface (C) depends on an uninterrupted gas flow across both the flowing valve (4) and the servo valve (6). The adjustable pressure for the pressure interface (C) is achieved with an electronically controlled valve (6) together with the mechanical flow control valve (4). A two-way pressure regulating system can be established with such pressure interface circuit. The servo valve (6) can be used to adjust the gas flow to the required pressure level in the bellows (5). Ultimately, the load which is applied to the tensile specimen is in direct proportion to pressure in the bellows (5) (pressure interface (C)). A LVDT-sensor (7) is responsible for measuring the displacement in the system and relaying a feedback signal to the servo controller. The servo controller then examines this feedback to a pre-set user defined signal and controls the servo valve to regulate the gas flow if there is a difference between the feedback and pre-set signal, as described in detail in [16].

2.5. Schematic View of the Test System

The pneumatic control equipment was mounted onto a moving rack for transportability and ease-of-use, and an overview of the system and its mounting inside the stage of a Zeiss Ultra Plus SEM (Zeiss, Oberkochen, Germany) is shown in Figure 8. The programmable logic for the control and monitoring of the system was created using Codesys programming. A new type of lead-trough for the SEM vacuum chamber had to be designed and manufactured, so that the pressure piping and for the LVDT sensor cable could be connected to the in-situ tensile testing device inside the SEM. The lead-through performed well and made it possible to operate the device while maintaining the vacuum in the SEM chamber.

3. Experimental Results and Applications

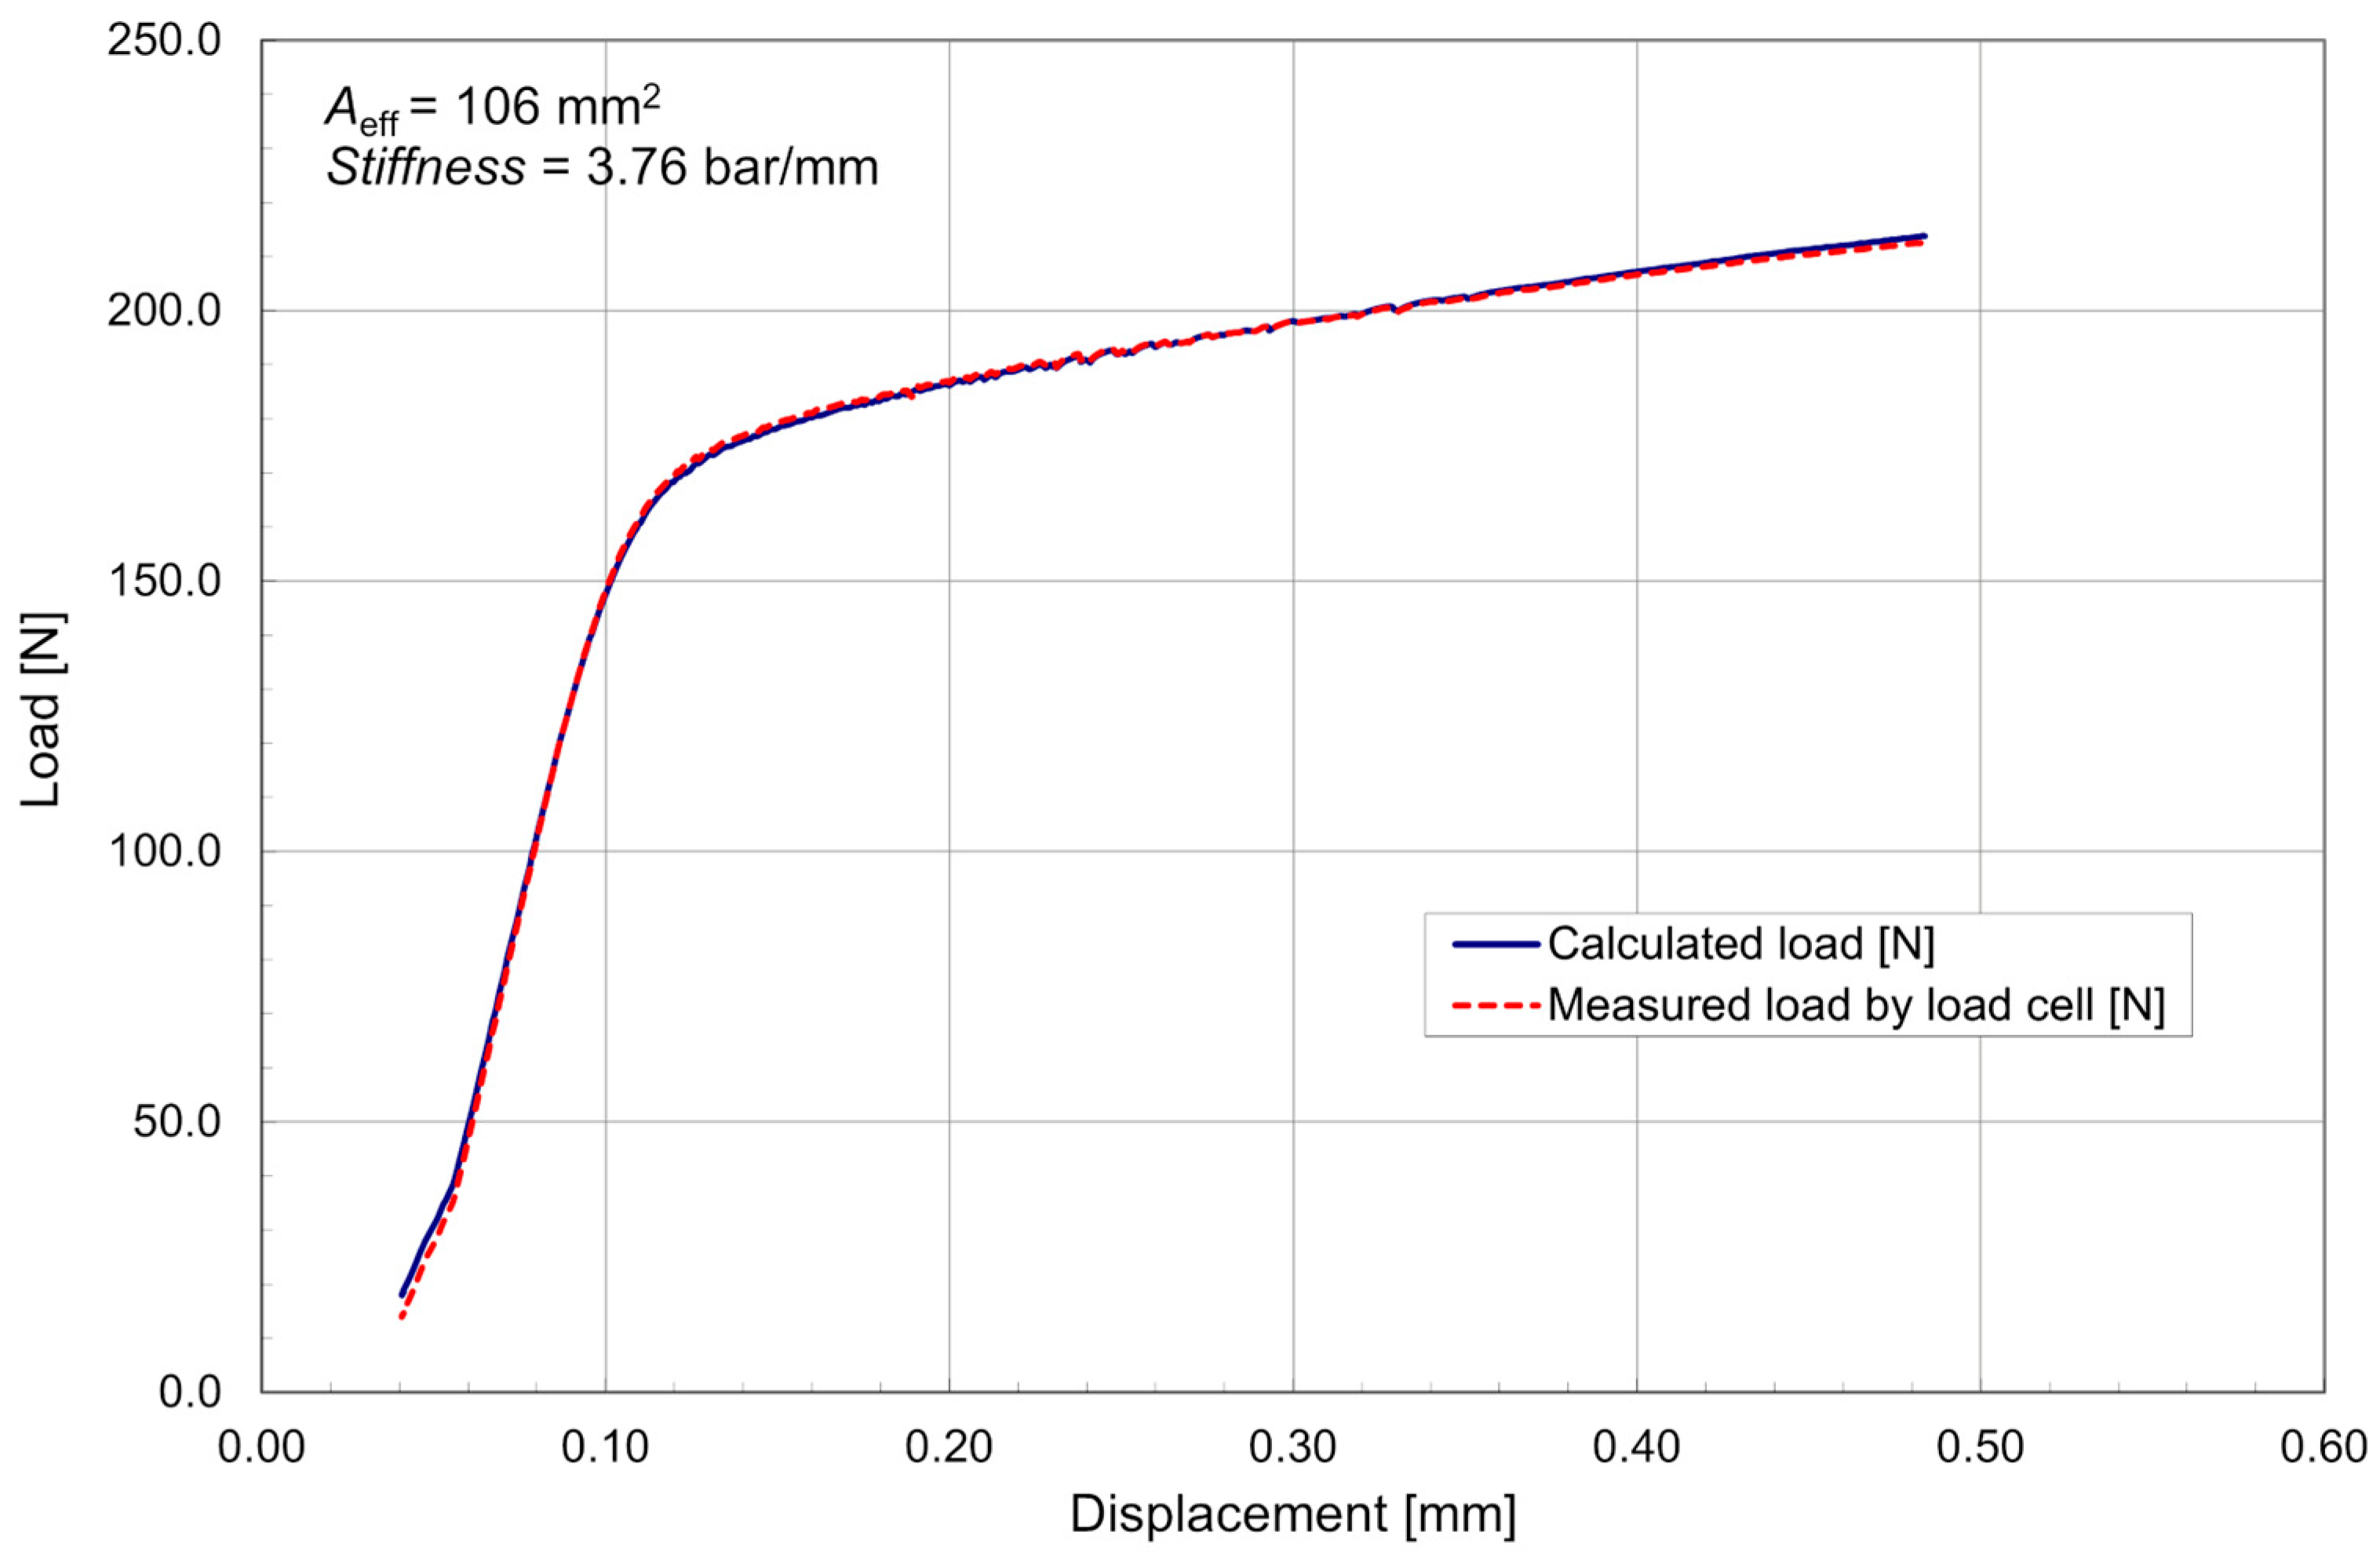
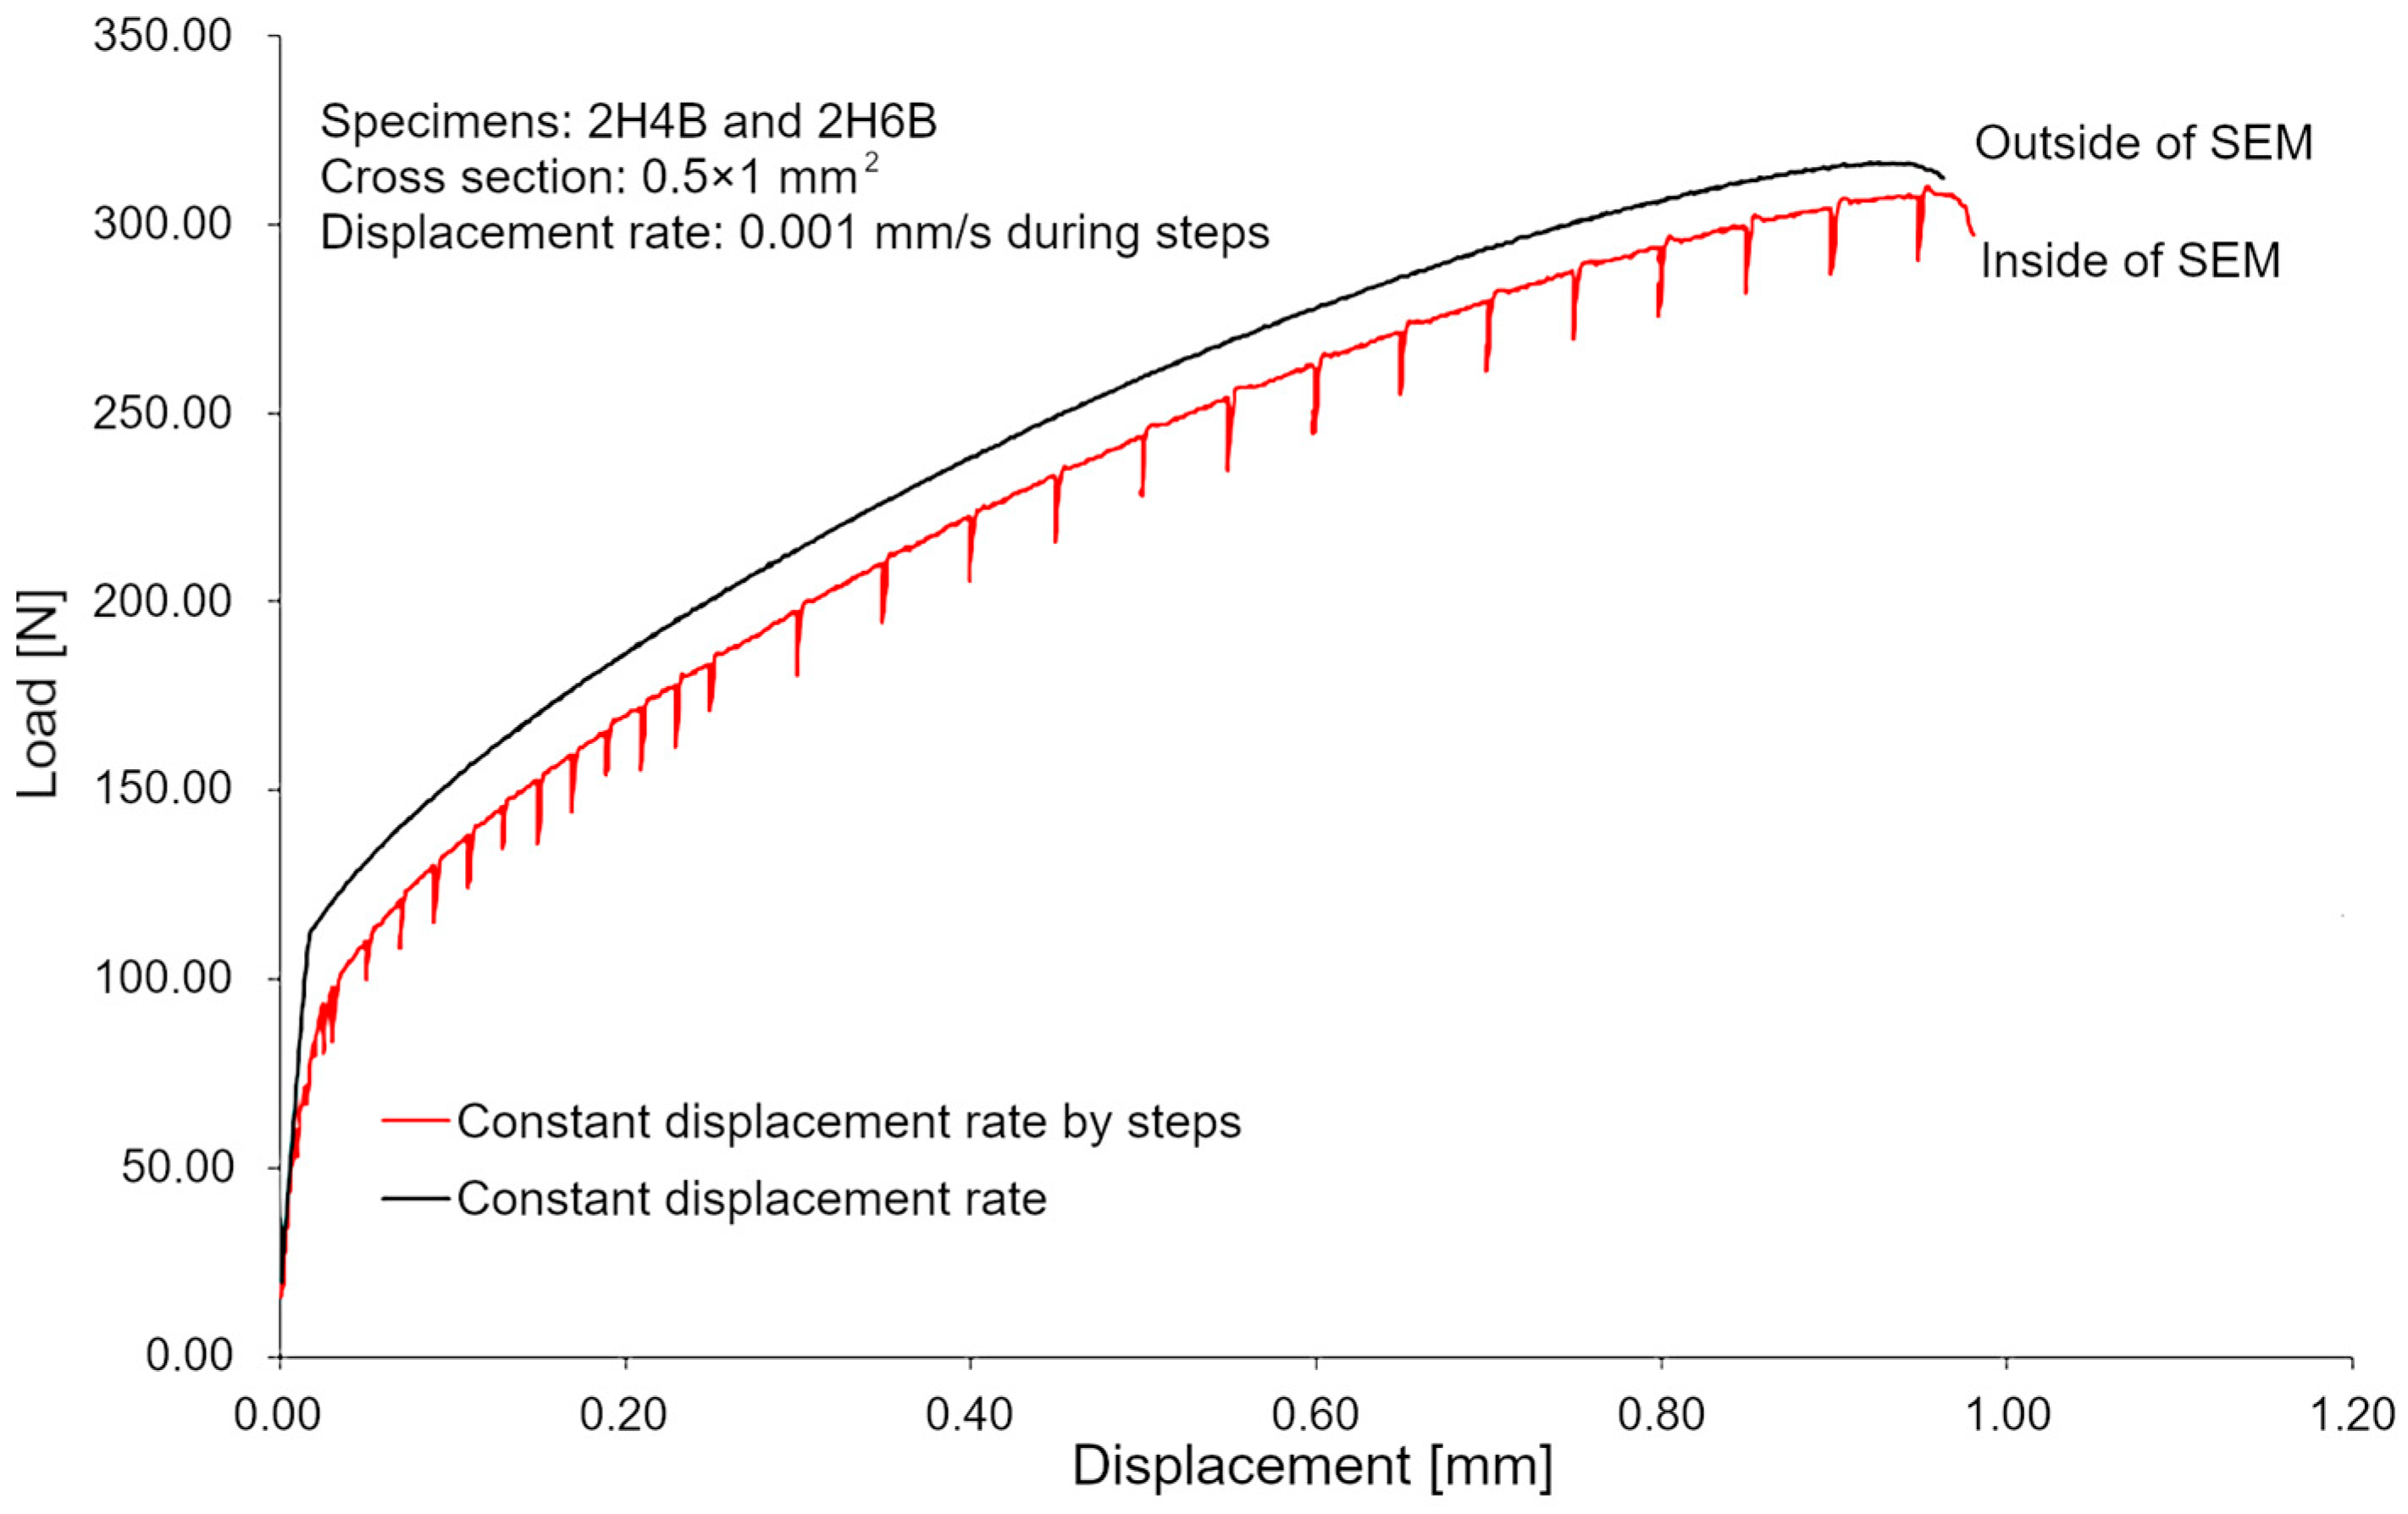
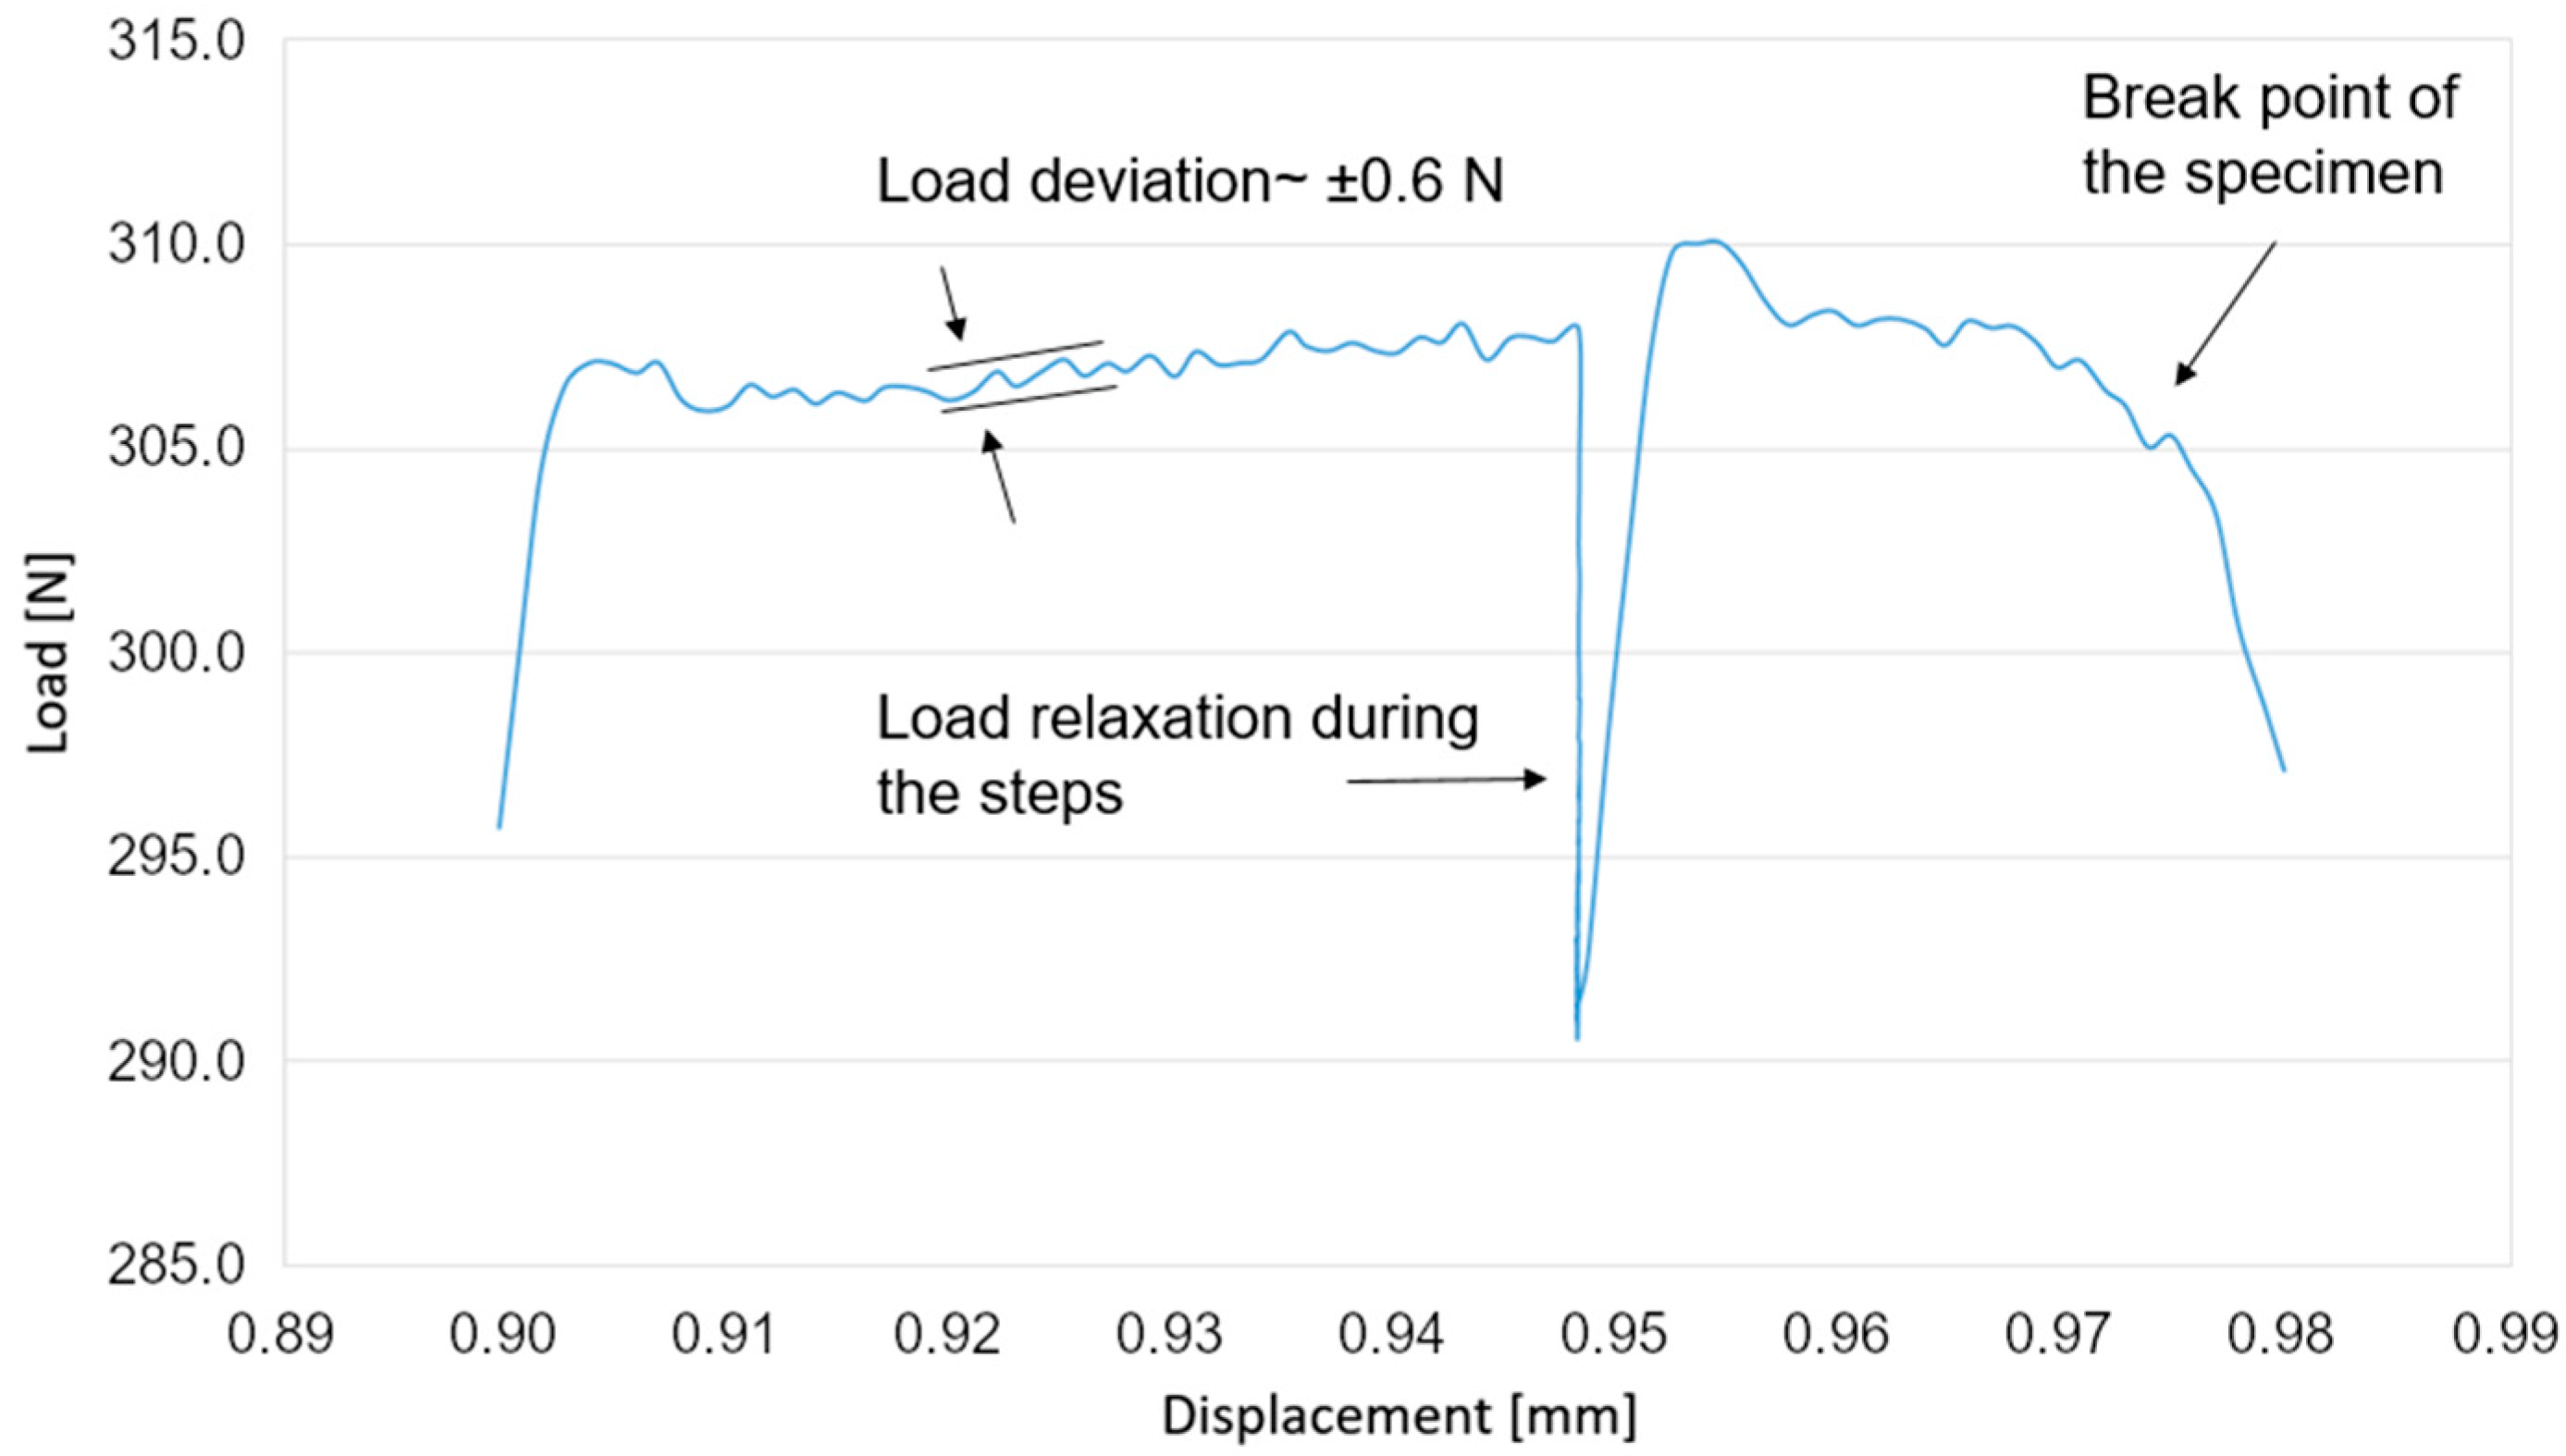
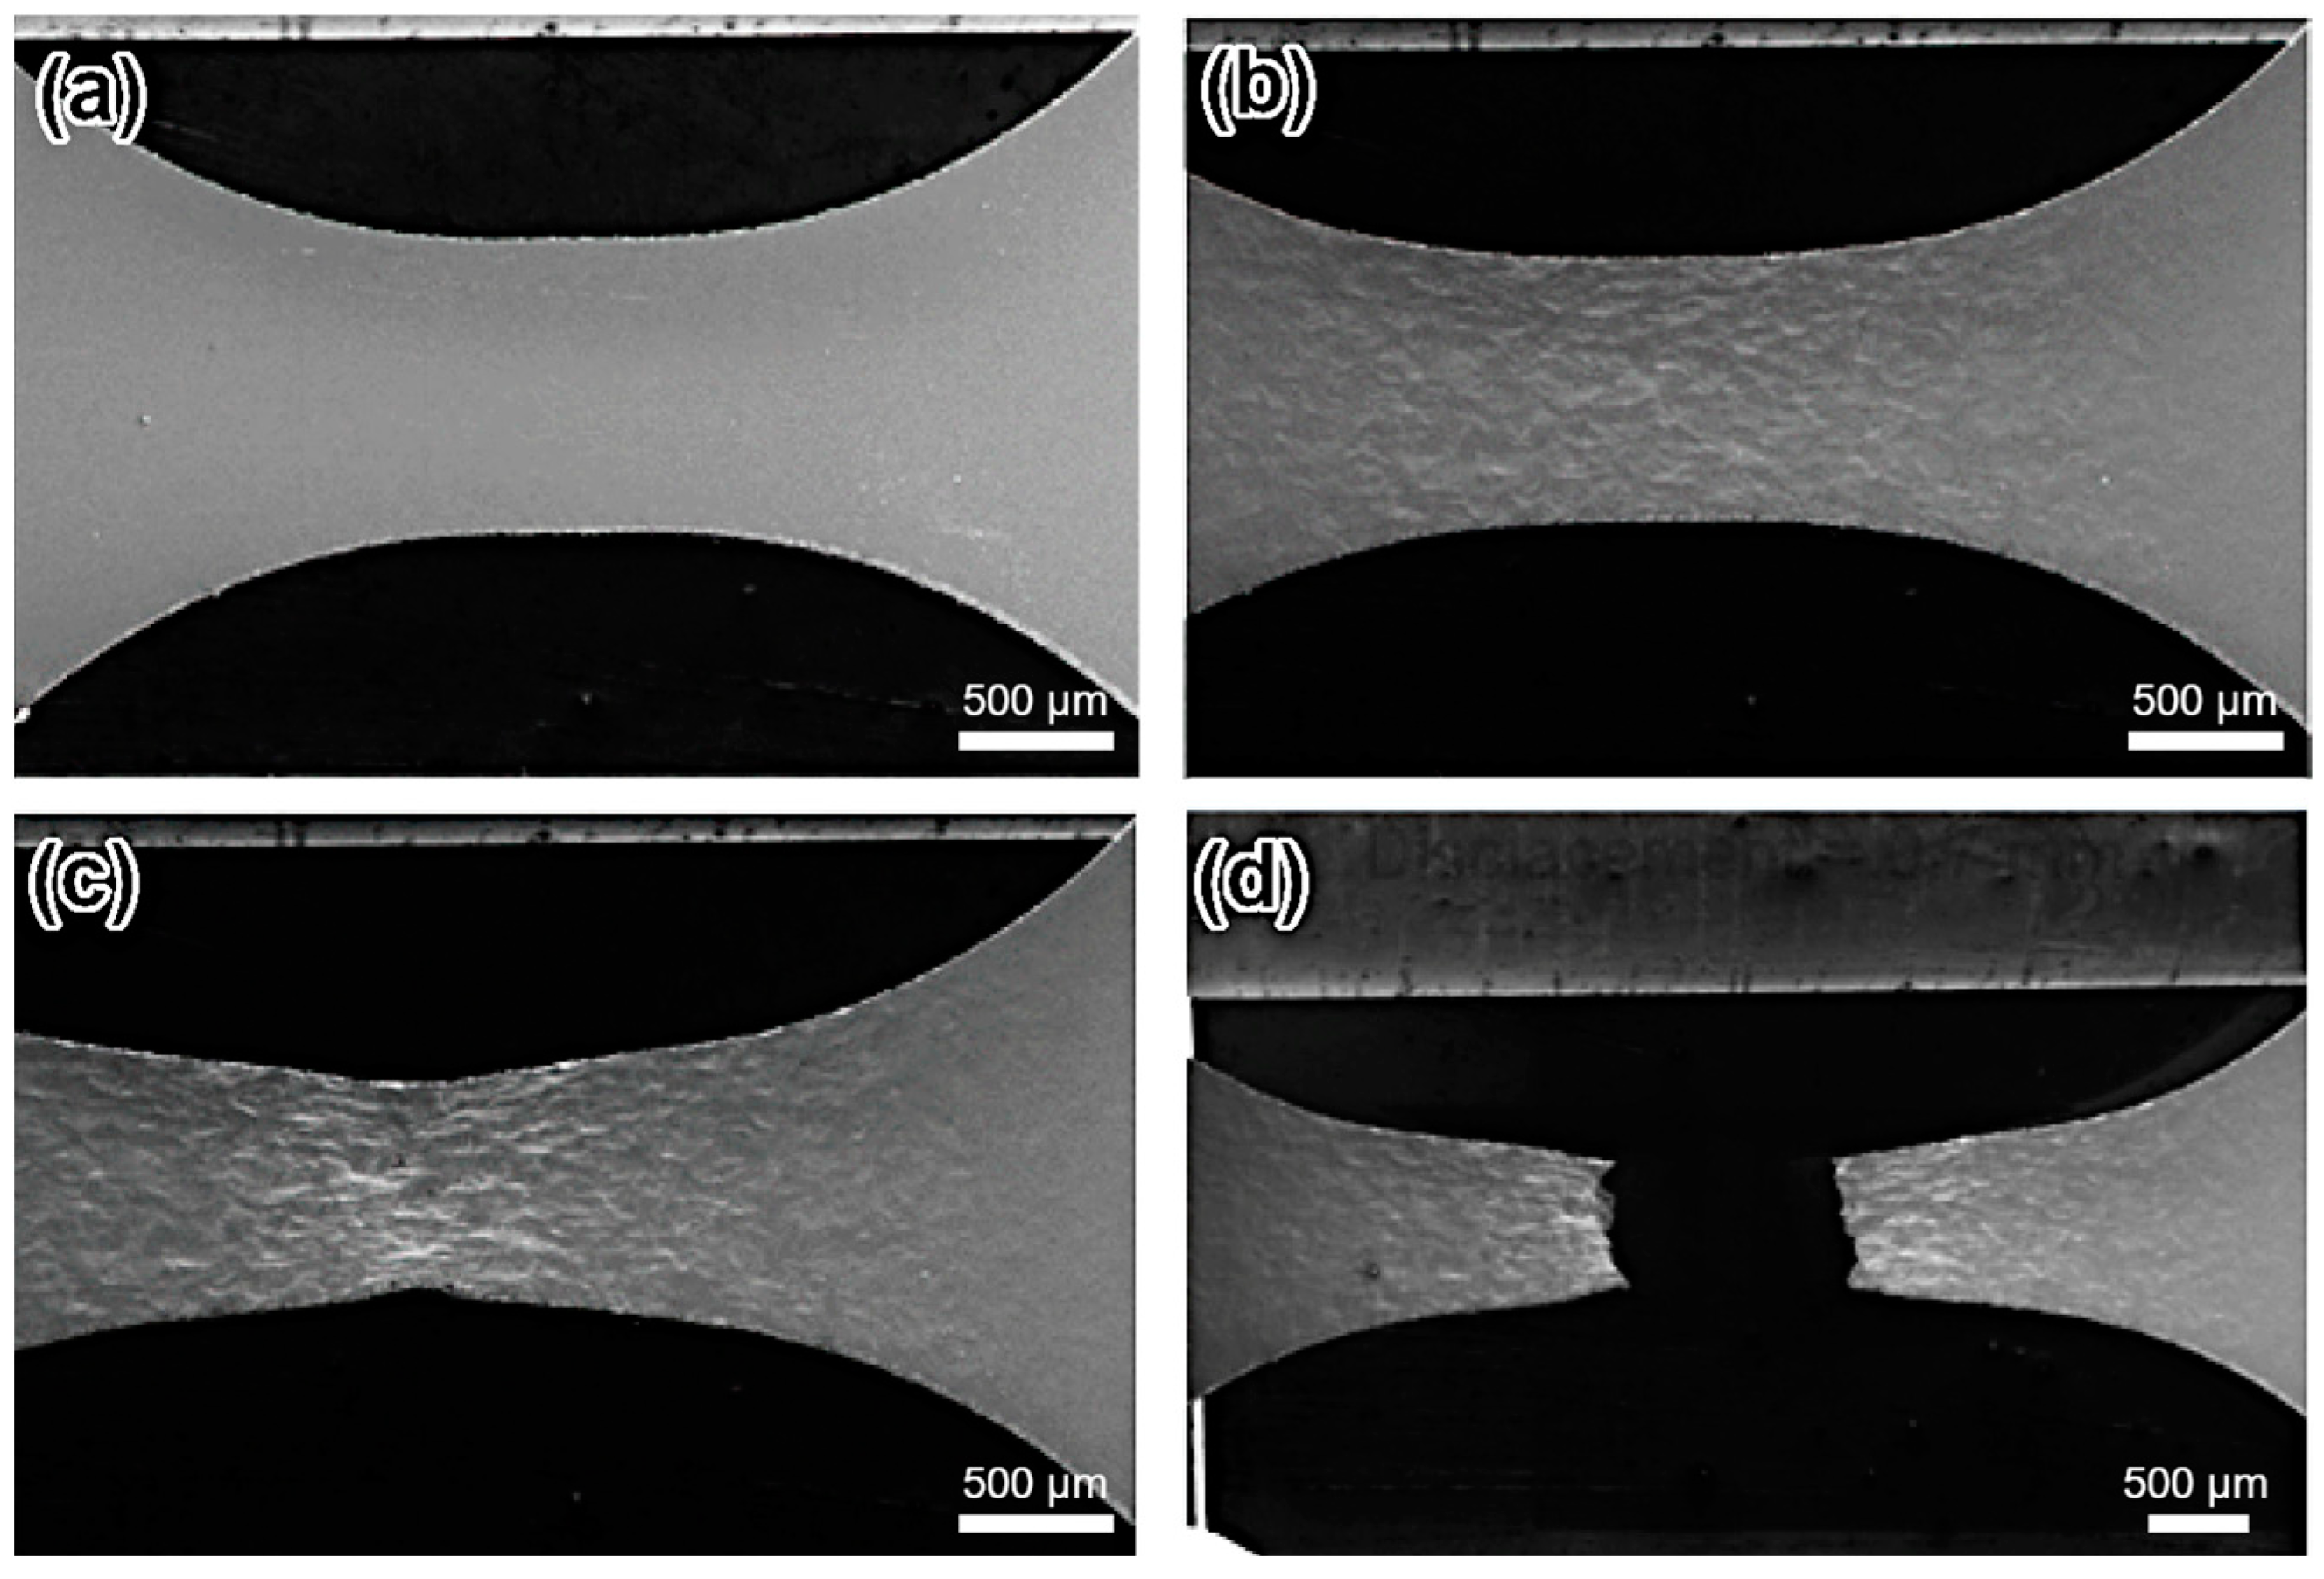
3.1. Performance Assessment of the Device

The performance of the newly developed equipment was evaluated using six tests with printed high entropy alloys, a quench and tempered martensitic (QT) steel, and a JRQ reactor pressure vessel (RPV) steel. These tests were performed in different conditions and used to determine its functionality, accuracy, and capability of working inside the SEM. The miniature specimens manufactured for this work were made using Electro Discharge Machining (EDM). The specimens used for the initial tests and calibration were not polished and had a surface roughness Ra of 1.6 μm. A polishing procedure was developed for the final specimens tested in the SEM, which is described in Section 3.2. The first test was performed outside the SEM at a constant displacement rate of 0.001 mm/s. The second test was carried out inside the SEM device at a 0.001 mm/s displacement rate and with the holding times of approximately 100 s. After each holding period, SEM images were taken from the gauge length of the specimen. The third test was carried out with an annealed specimen and smaller displacement steps of 10 µm, and the fourth test was carried with a more resistant QT steel and displacement steps 50 µm. The fifth and sixth tests were carried out with RPV steel, one under a stereo optical microscope to investigate the strain distribution in the specimen geometry, and the other inside the SEM for obtaining high magnification images of the microstructural evolution. Table 1 summarizes the different displacement steps used for the different displacement ranges during the second test. The load-displacement results of the first and second tests are shown in Figure 9. The load difference between the two curves is plausibly related to the difference in the thicknesses of the two initial specimens which were polished separately with the newly developed system and had different final thicknesses. Another factor that affected material behavior is that one of the tests was carried out with continuous loading, while the other in steps with 100 s holding times, which lead to some relaxation between deformation steps.
The load of the last two loading steps in response to displacement in the second tensile test is shown in Figure 10. The loading relaxation between the steps and beginning of necking in the specimen are marked with arrows. The magnitude of the load relaxation increases with load and reached a maximum of roughly 15 N in the last step prior to fracture. The precision of the load signal was evaluated by measuring its fluctuation during the tests and was of roughly ±0.6 N in the vicinity of maximum load.
A non-polished specimen was used in the first test and SEM images were taken after each loading step with different magnifications. The last image was taken after the onset of necking, when load began to drop, as shown in Figure 10. The specimen surface showed large cracks after the onset of necking as it is shown on Figure 11.
A polished specimen was used for the third test and 10 µm steps were used, as shown in the load-displacement curve in Figure 12. The material chosen for this test was purposefully more ductile so that more images could be taken after the maximum load level. The test was continued until complete failure of the specimen, as depicted by Figure 13.
A QT steel specimen with considerably higher mechanical resistance with a 50 µm displacement step was used for the fourth test, whose force-displacement plot is shown in Figure 14. The change in the topography of the microstructure with plastic deformation is clearly observable in the last series of images at higher displacements.

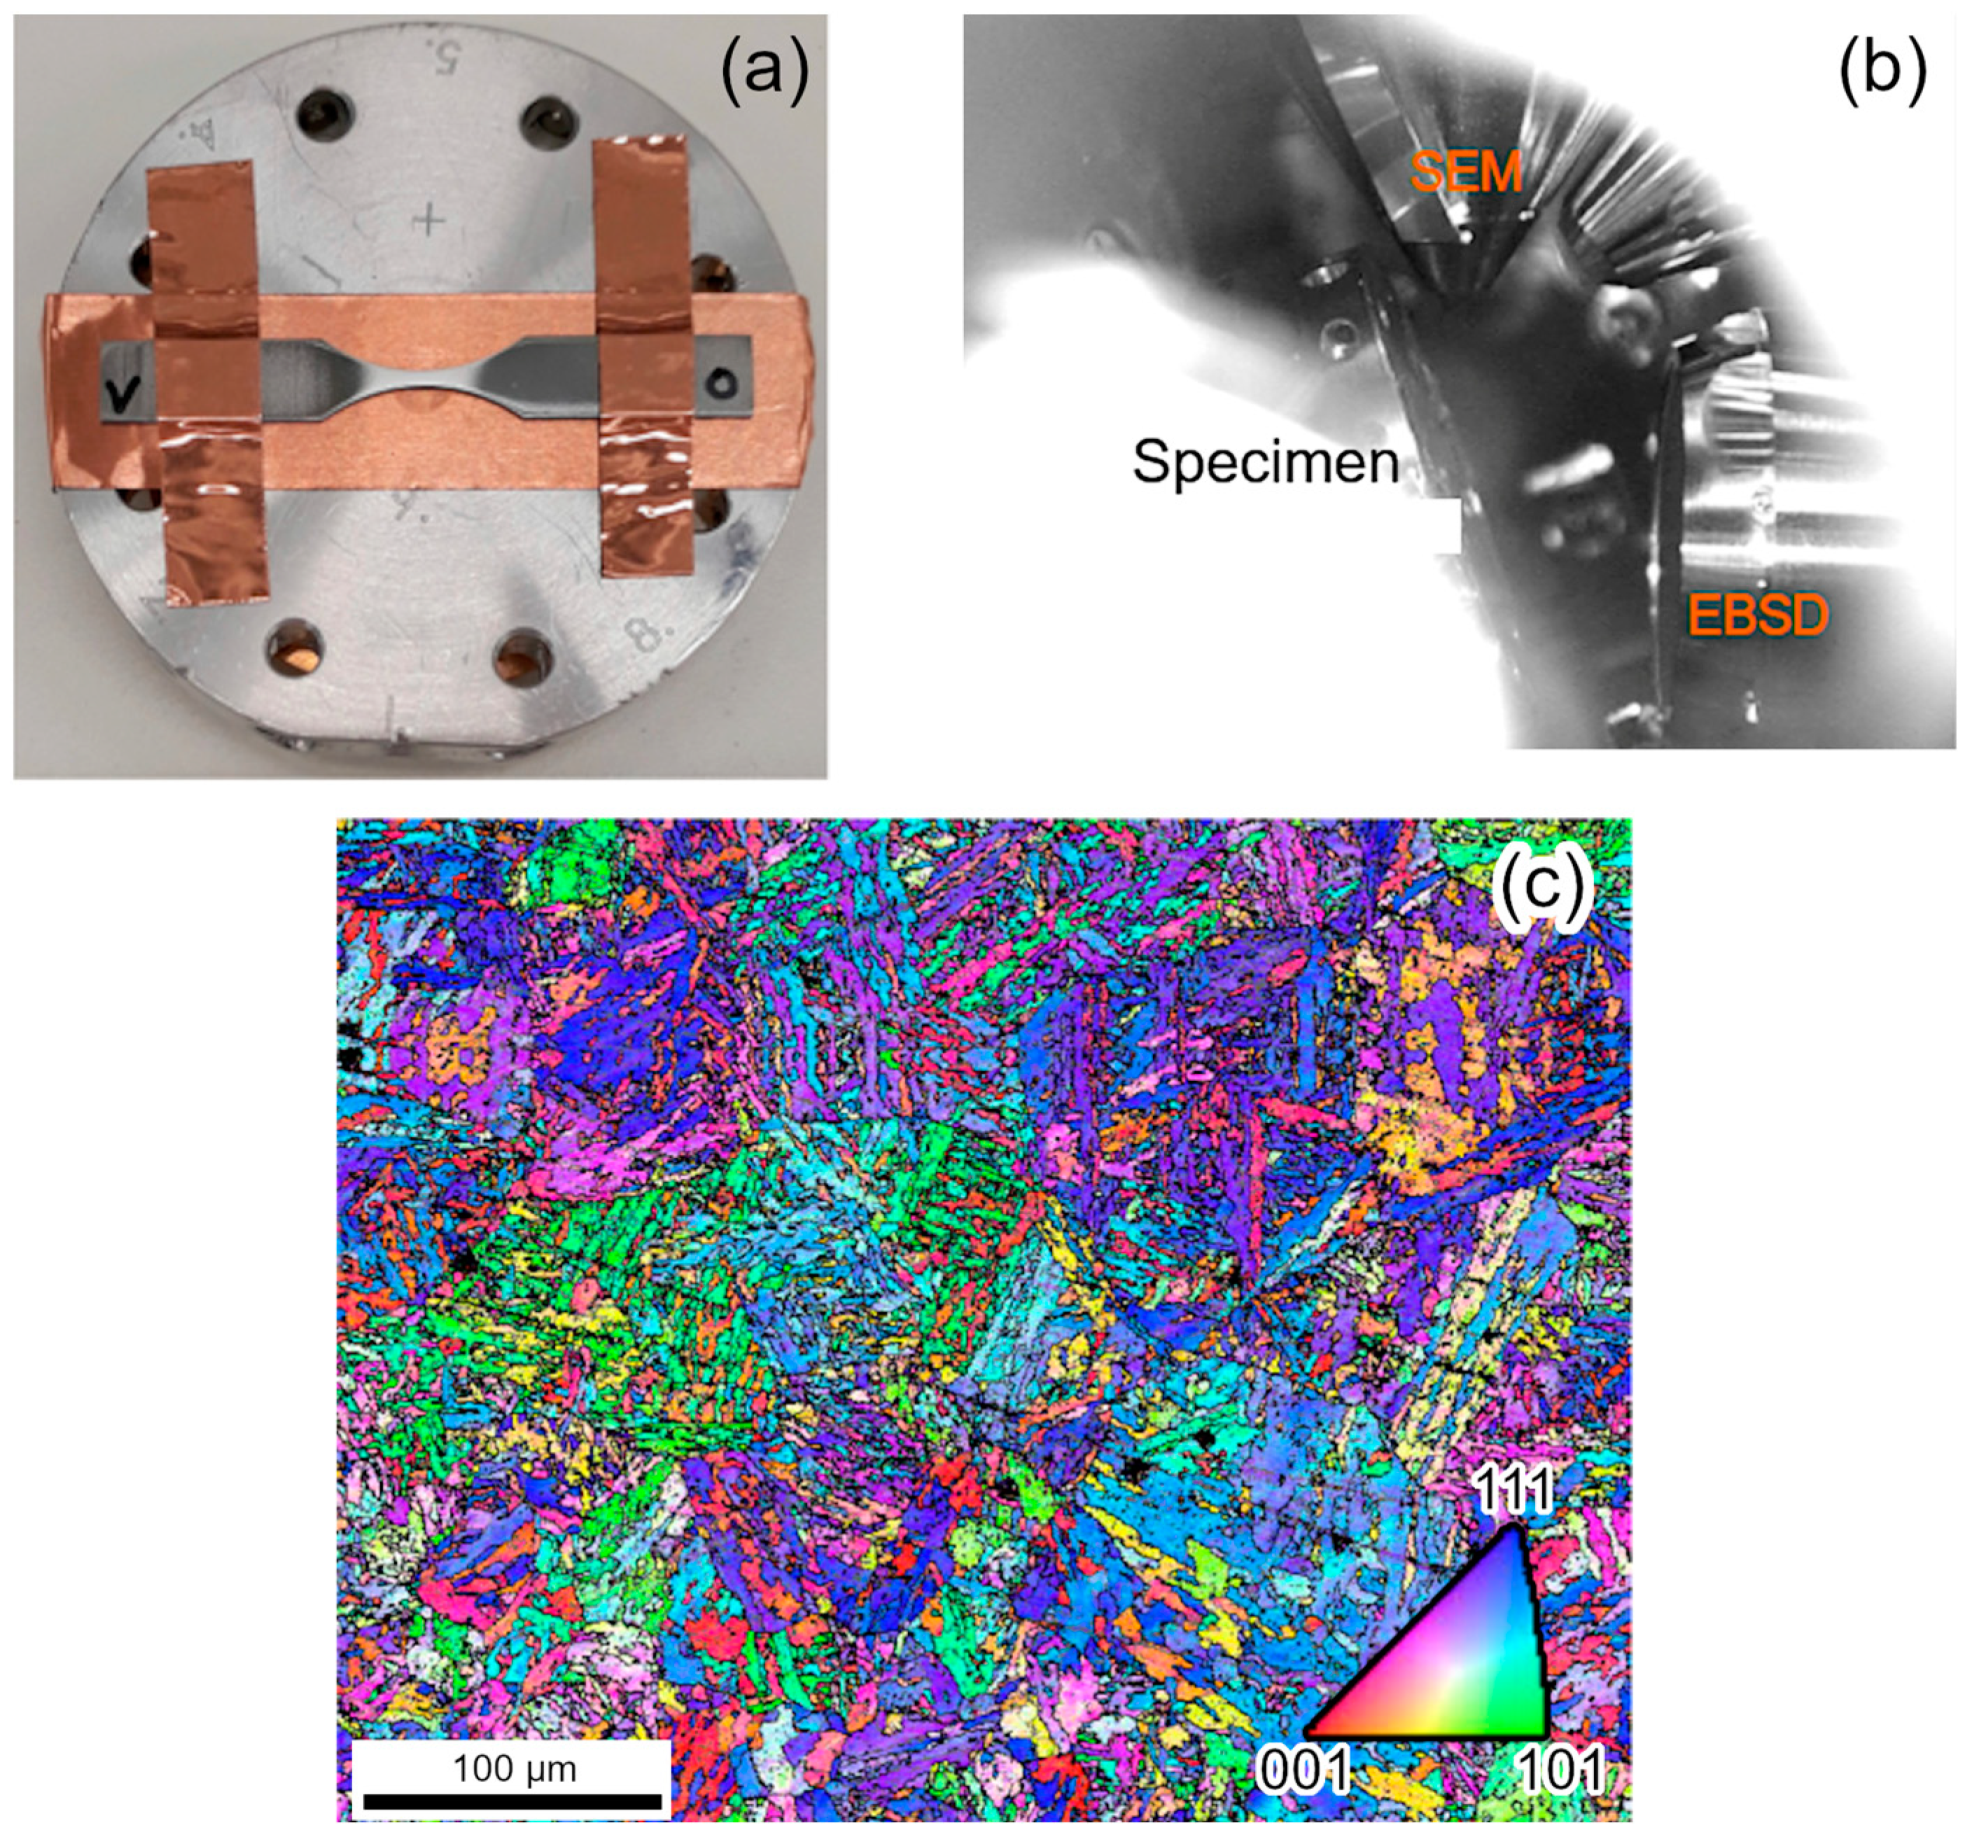
3.2. Specimen Preparation and Complementary Imaging Techniques

To fully explore the application of the described in-situ testing device, it is fundamental that the specimens are prepared so that not only the material can be visualized but that both crystallographic data and clear monitoring of microstructural features are possible. For this reason, it was important for specimens to be well polished so that EBSD could be used to map the gauge length of the specimen and allow a quantitative microstructural analysis of the material. The polishing of particularly thin specimens was found to be complex and traditional techniques would often end up damaging the specimens. These challenges were overcome by designing a new type of polishing adapter for a VibroMet 2 vibratory polisher (Buehler, Lake Bluff, IL, USA), as shown in Figure 15. With the custom adapter for the small tensile specimens and a 60 nm suspension in the vibratory polisher, the surface quality after polishing was adequate for EBSD data acquisition. An example of a mounted specimen for EBSD, its positioning inside the SEM for EBSD analysis, and an inverse pole figure map of a thin tensile specimen is shown in the Figure 16.

3.3. Cassette System for Loading Specimens

The first prototype device worked well inside the SEM and fit the requirements of being small, having precise power control and the ability to load a specimen using pressurized gas. Load and displacement were considered accurate during the strain controlled tensile tests. However, the design of the device made it challenging to mount a specimen without scratching its surface. As a result, the following device was designed so that the specimen can be fixated to the loading frame using a removable cassette as depicted by Figure 17. This system made attaching the specimen to the in-situ testing device considerably easier and allows EBSD scans to be performed ex-situ with the specimen still attached to the cassette in the same conditions and load as during testing.

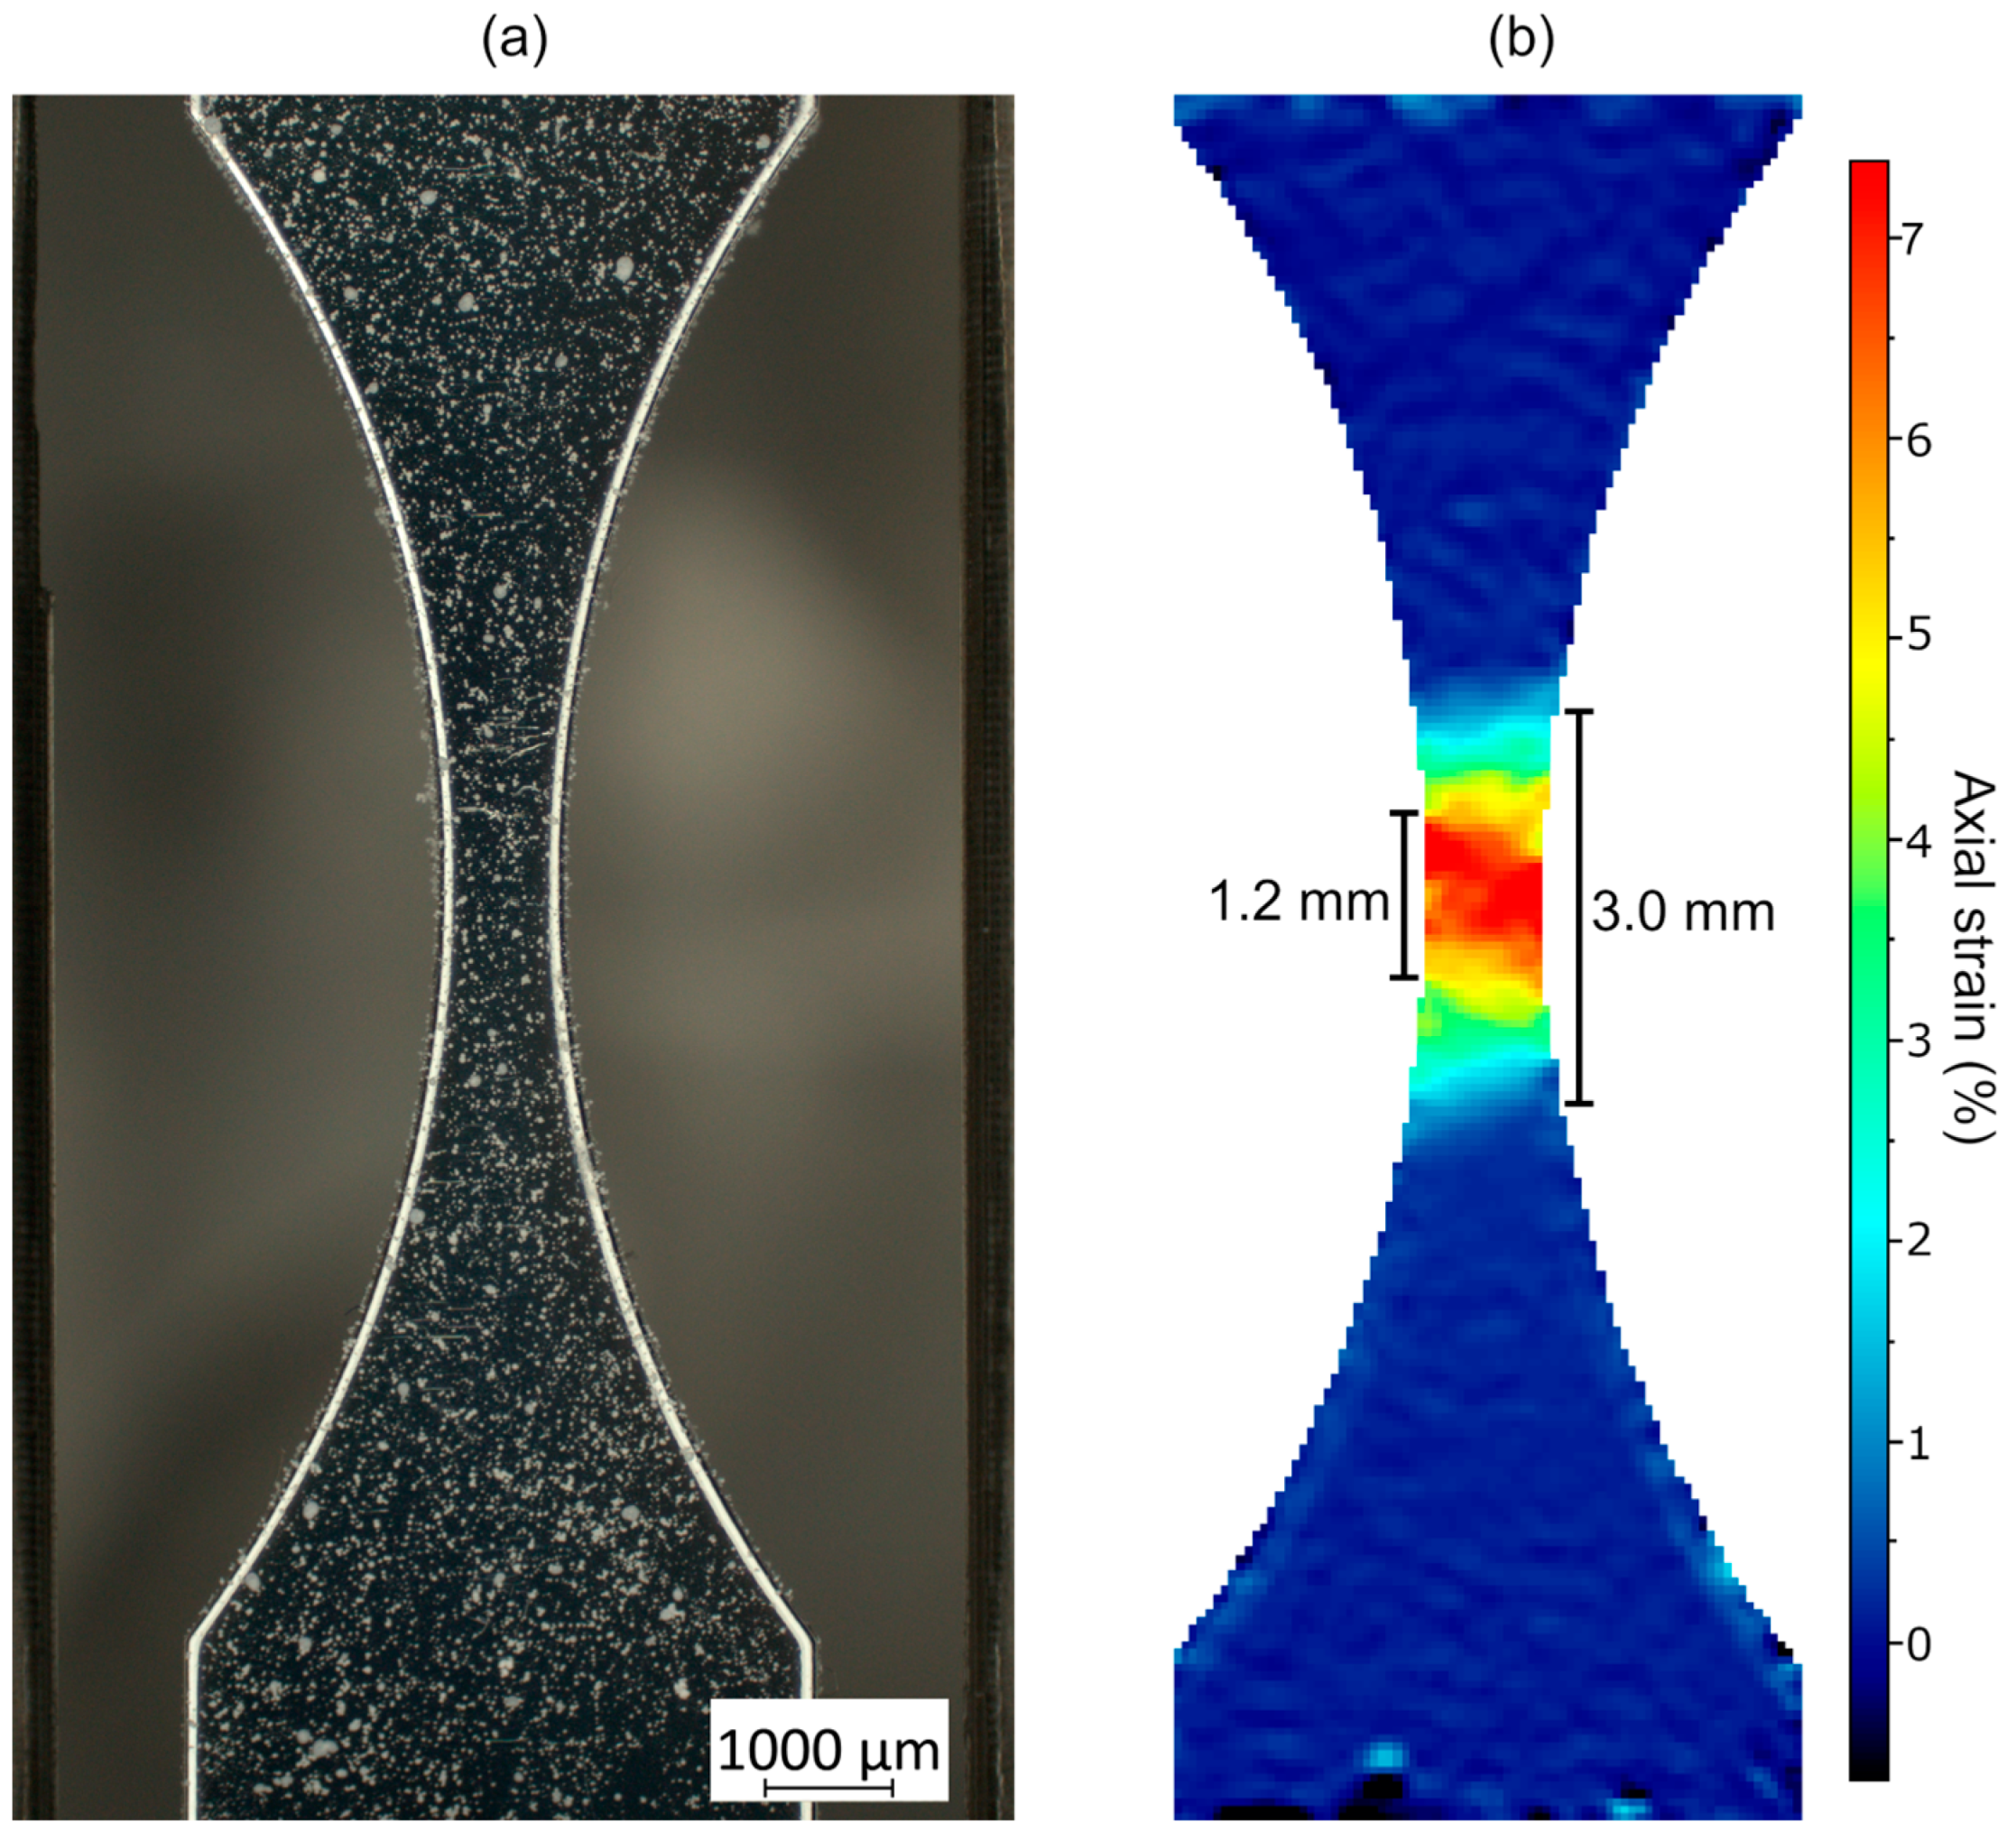
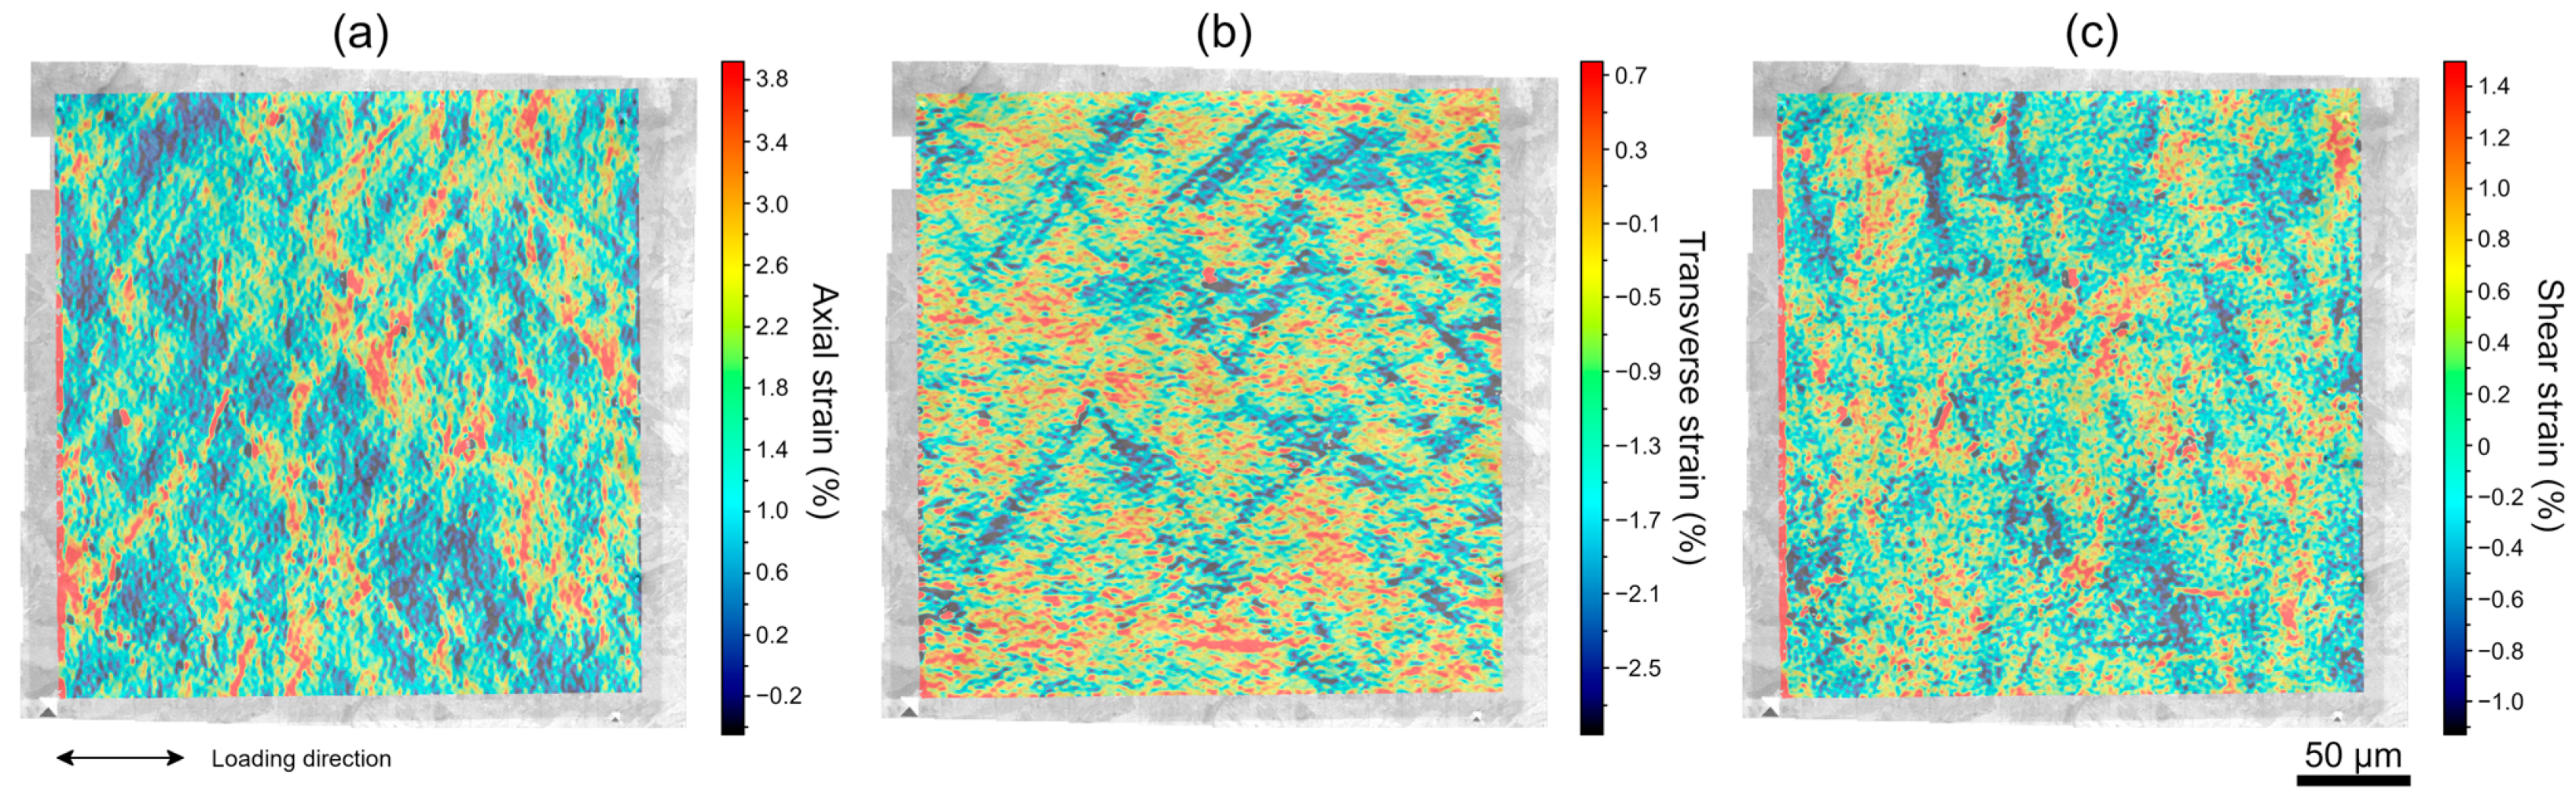
3.4. Full-Field Displacement Measurements Using Micro Digital Image Correlation

To better understand the strain distribution during testing in the geometry designed for use with the testing system, an in-situ test with a RPV steel (JRQ) specimen was carried out under a Zeiss Axio Zoom v16 stereo microscope (Zeiss, Oberkochen, Germany). The specimen was carefully patterned for DIC with fine spray painting. The main parameters of this DIC analysis can be summarized as the following: image resolution, 2464 by 2056 pixels; scale factor, 5.5 μm/pixel; subset size, 45 pixels; step size, 11 pixels; pattern feature size, 6 ± 2 pixels. Figure 18 shows an image of the patterned specimen prior to testing and a map of the axial strain distribution showing how the area in which uniform deformation occurred was measured. Plastic deformation occurred uniformly roughly in a 1.2 mm region in the central portion of the specimen, although deformation was still observed to a smaller degree in a 3 mm region. Strains are understandably lower in the region outside the 1.2 mm due to its increasing cross-section.
The strain distribution observed in DIC was used to define different lengths for virtual extensometers which were used to evaluate what would be the calculated engineering strain for those given gauge lengths. Virtual extensometers with a length of 1 mm, 1.2 mm, and 3 mm, as well as a 0.25 mm2 virtual strain gauge were used to measure the strain during the test. The resulting engineering stress-strain plots is shown in Figure 19. The aim of this analysis was to evaluate what would be the correct gauge length to be used with this specimen geometry to obtain comparable results to results from standard tests, obtained from more traditional testing methods that use standard specimens and extensometers. The strain gauge clearly captures well the strain localization from the midsection of the specimen, but strain understandably becomes much larger than that which would be measured by an extensometer once necking starts. The 3 mm virtual extensometer underestimates strain from the onset of the test, as it contains large portions of the specimen with bigger cross-sectional areas which deform much less than the region where most deformation is taking place. Both 1 mm and 1.2 mm led to similar results, as both are within the region where mostly only uniform deformation occurred in the specimen. Ultimately, the 1.2 mm virtual extensometer was chosen as being the best choice among these to extract engineering stress-strain curves from these tests. It is noteworthy that once strain starts to localize, a single value representation of strain does not fully convey what occurs during deformation and full-field approaches would then be more appropriate to describe the complex material behavior.
Although focusing on singular points of interest, such as triple grain boundary junctions and larger defects, is also useful in understanding the role those play in material behavior, one of the objectives of the current work was to enable the characterization of the strain evolution during deformation at a grain level over large areas. The reasoning behind this choice is that the data obtained from these analyses can be essential for validating and improving crystal plasticity models at a microstructural scale. To achieve a large image of the material microstructure and minimize issues, several small images need to be taken at very high magnification in a grid like manner so that they can be stitched and merged afterwards. SEM images of RPV steel were taken with 10% overlap to enable identification of common features between images and stitching. A workflow to automate grid imaging in the SEM and to merge the high-resolution images was created to ensure accuracy and repeatability of this process. The stitching procedure was carried out using the Grid/Collection stitching function of Fiji [35,36]. The resulting image from the automated imaging, positioning, and stitching from a RPV steel microstructure is shown in Figure 20.
A second in-situ test with RPV steel was carried out inside the SEM for investigating the strain evolution in this material at a microstructural level. The fine carbide distribution and other microstructural features of the material were used as a natural pattern for tracking the displacements within the microstructure during in-situ testing with micro DIC. An area of 250 μm by 250 μm was demarcated using microindentation to enable the accurate analysis of the same area with SEM and EBSD at different deformation steps. A grid of 9 by 10 images was taken to cover the entirety of demarcated area before the test and after each strain increment, which resulted in images of roughly 27,000 by 27,000 pixels after merging. DIC analysis was carried out with the stitched images, and it is noteworthy that this was a very computationally intensive and time-consuming procedure due to the very high resolution of the images. The feasibility assessment and optimization of the DIC parameters were initially completed using a small portion of the images, prior to running it for the whole analysis area. The main parameters of this DIC analysis can be summarized as the following: image resolution, 27,975 by 27,419 pixels; scale factor, 11 nm/pixel; subset size, 149 pixels; step size, 50 pixels. Sufficient correlation between the images was achieved in the whole analysis area. The obtained displacement fields were continuous and had reasonable magnitude and very few outliers. Figure 21 shows the x and y displacement maps obtained at the point in which the specimen was deformed to a global engineering strain of 1.4%.
Once the x and y displacement fields were calculated, strain maps were obtained from analyzing the gradients in the displacement field. The full-field maps of axial strain (ɛxx), transverse strain (ɛyy), and shear strain (ɛxy) at a global strain of roughly 1.4% are shown in Figure 22. The analysis shows that, although the specimen is overall axially deformed in 1.4%, the strain distribution does not occur uniformly throughout the microstructure. These full-field maps are effective tools for investigating microstructural phenomena in in-situ tests and can be valuable for the optimization and validation of crystal plasticity modelling approaches, as it will be shown in the next subsection.

3.5. Crystal Plasticity Modelling at Micron Scale

A crystal plasticity model was developed to analyze the deformation behavior of the selected RPV steel. The model is based on finite strain formalism with a multiplicative decomposition of the deformation gradient with F _ = F E _ · F P _ , where F E _ and F P _ are the elastic and plastic parts, respectively. A total of 24 dislocation slip systems of type [110]<111> and [112]<111> were used to describe plastic deformation in the BCC material. Non-Schmid effects were not applied in the present study [37]. The main components of the model are presented in this subsection.
This model contains certain simplifications over the model proposed in [38]. For example, the flow rate is presented only with its thermally activated part, assuming to capture both dislocation drag and frictional behavior in the same flow rule. The model does not contain strain gradient extension [39], which could be used to study local scale defects, such as inclusions and carbides with a very small size. This was chosen due to the analysis being focused on the polycrystal behavior of the material in the scope of the current work. The slip rate ( γ ˙ ) of a slip system s is defined with a thermally activated dislocation flow rule:
γ ˙ s = H   ρ m b s l s c s   e x p F k T   1 τ s τ c s τ 0 s p q s i g n ( τ s )
where H is the attack frequency, ρ m is the mobile dislocation density (set to constant) in the flow rule, b s is the length of Burgers vector, l s c is the the minimum length of screw segment, F is activation energy, k is the Boltzmann constant, T is the temperature, τ s is the resolved shear stress on a slip system, τ c s is the slip resistance, τ 0 s is the lattice friction, and p and q are the energy profile parameters. The slip resistance can be written as a sum of different hardening contributions:
τ c s = τ H P + μ b s s = 1 N s a e f f s ρ s + a c a r b ρ c a r b
where τ H P = μ μ 300 K K d is the Hall-Petch effect with a coefficient K and the average grain size d . The effective dislocation interaction matrix is denoted by a e f f s and dislocation density of a slip system is ρ s . Since the material contains carbides, the carbide related interaction coefficient is denoted by a c a r b and the carbide defect density is defined by ρ c a r b = C c a r b D c a r b with C c a r b being the number density of carbides and the average size of the carbides D c a r b . The effective dislocation interaction coefficient a e f f s evolves with the existing dislocation density to reach saturation more easily, following ref. [38], and can be described as
a e f f s = 0.2 + 0.8 l n ( 0.35 b s ρ o b s ) l n ( 0.35 b s ρ r e f ) 2 a c o n s t s
where ρ r e f is the reference dislocation density, and a c o n s t s are the constant interaction matrix coefficient defining different dislocation interactions. In the present model, only collinear and self/latent interactions are distinguished with two coefficient values in total for simplicity. The dislocation density evolution is defined by:
ρ ˙ s = | γ ˙ s | b s 1 d + α s λ s ρ o b s K o b s y ρ s
where α s = 1 ρ o b s s a e f f s ρ s + a c a r b ρ c a r b is the average obstacle strength, λ s is the obstacle spacing defined below, and K o b s is a dislocation multiplication parameter. Total defect is defined as ρ o b s s = ρ s + ρ c a r b . The dislocation annihilation process is controlled with an annihilation distance y . The mean spacing for obstacles, λ s 1 , can be defined as follows:
λ s 1 = m i n ( ρ o b s ; μ b s τ e f f s ρ o b s s )
where effective stress is defined by τ e f f s = τ s τ c , which is always positive when the slip resistance of a slip system is exceeded. Otherwise, dislocation slip is not allowed, and the dislocation density evolution rate is set to zero, since the slip rate is also zero. The average length of screw dislocation is computed as follows:
l s c s = m a x { λ s α s μ b s τ e f f s ; l s c m i n }
Once those have been defined, the plastic velocity gradient can be defined as follows:
L ˙ p _ = s = 1 N s γ ˙ s N _ s
where N _ s is the orientation tensor for a slip system s, and N s is the number of slip systems.
The model parameters were determined using tensile experimental test data that included experiments carried out at 288 °C with standard cylindrical tensile specimens with gauge length and diameter of 36 mm and 6 mm, as well as a small-scale sample tested in the system described in this work at room temperature. A summary of the model parameters is shown in Table 2. The experimental and model predicted stress-strain plots of the RPV steel at room temperature and 288 °C are shown in Figure 23a. The curve at the higher temperature (288 °C) is an averaged curve of three experiments. The model shows a good agreement with respect to the stress-strain behavior of the material in the described temperatures. In both cases, the yield behavior is well captured and the strain hardening response follows the saturation behavior of the material even up to peak stress. The deformation analysis is mainly limited to small strains in the present context, therefore non uniform deformation and necking has not been considered in this work. The initial EBSD data of the RPV steel specimen tested inside the SEM was used to model the microstructural evolution of the material in roughly the same area analyzed by micro DIC in Figure 22. In total, 48,278 quadratic reduced integration brick elements were used with a nominal edge length of 1.19 microns. Kinematic uniform boundary conditions were used, i.e., left side of the domain is set with U1 = 0, deformation is applied on the right side of the domain, bottom edge is bounded with U2 = 0, and multi-point-constraint is used for the top edge/surface to retain horizontal planarity during deformation. The back side of the domain is set U3 = 0 and the front surface is free to deform (extruded 3D mesh with one element thickness).

4. Summary

A miniature pneumatic bellows loading device was developed and successfully applied for in-situ testing of small tensile specimens inside the SEM. The lack of vibrational parts in the pneumatic system worked properly within the SEM and valuable images were obtained during testing. A custom tool was designed for vibratory polishing of the thin tensile specimen, which allowed for higher quality polished surfaces to be obtained and EBSD measurements to be carried out for quantitative microstructural analysis of the specimens. A removable cassette system was designed to permit easier specimen mounting and ex-situ EBSD mapping of the specimen under the same conditions as during the tests. Initial tests were made using printed high entropy alloy and QT steel specimens.
During the tests, the overall measured load noise level was of ±0.6 N and displacement accuracy smaller than 0.5 μm. This permitted an accurate examination of the interaction between the applied force to the material and its microstructural response. The in-situ tests were performed in a displacement control at a speed of 0.0007 mm/s and displacement steps from 5 to 50 μm. SEM images were taken at different magnifications after each step to monitor the evolution of the specimen throughout deformation.
The strain distribution in a RPV steel specimen was investigated under a stereo microscope, and micro DIC at high magnification was used to measure the displacements and strains in the microstructure during testing. A crystal plasticity model was developed for the RPV steel, and both its mechanical and microstructural results were consistent with the experimental data. The developed testing device is effective for testing inside the SEM, and if coupled with image analysis and modeling approaches, can be used to further our understanding of material behavior at the micro scale.
Future efforts are planned towards investigating localized plasticity in different types of materials under relevant engineering conditions. It is still essential to develop and apply appropriate micro-patterning techniques for obtaining higher spatial resolution measurements of displacement and strain. The model results obtained in this work could be used to aid definition of length-scale parameters related to strain gradient methods, for example micromorphic strain gradient models. The magnitude and diffusivity of the strains measured by DIC can be used to define the magnitude and finite thickness of slip localization regions controlled by the micromorphic regularization [40]. Furthermore, in the future, similar arrangements could be used for crack growth experiments with in-situ monitoring of the crack tip and propagation, which would be beneficial in the validation process of a chosen damage enriched crystal plasticity model.

Author Contributions

Conceptualization, P.M., G.C.S., M.L., and A.R.; data curation, A.R. and G.C.S.; formal analysis, G.C.S., M.L., and A.R.; investigation, P.M., G.C.S., M.L., and A.R.; methodology, P.M., G.C.S., M.L., and A.R.; software, P.M., G.C.S., and M.L.; visualization, G.C.S. and A.R.; writing—original draft, P.M., G.C.S., M.L., and A.R.; writing—review and editing, G.C.S. All authors have read and agreed to the published version of the manuscript.

Funding

Guilherme Soares and Matti Lindroos have received funding from the Euratom research and training program 2019–2020 under grant agreement No. 900018 (ENTENTE project). The authors acknowledge the support of the Academy of Finland via the HEADFORE project, Grant No. 333226.

Data Availability Statement

The data can be made available upon reasonable request to the corresponding author.

Acknowledgments

The authors would like to acknowledge Zaiqing Que for providing experimental data used in the calibration of the crystal plasticity model.

Conflicts of Interest

Pekka Moilanen, Guilherme Corrêa Soares, and Matti Lindroos are employed by the company VTT Technical Research Centre of Finland Ltd. Andrew Roiko was previously employed by the same company. The authors declare that the research was conducted in the absence of any commercial or financial relationships that could be construed as a potential conflict of interest.

References

  1. Murty, K.L.; Charit, I. Structural materials for Gen-IV nuclear reactors: Challenges and opportunities. J. Nucl. Mater. 2008, 383, 189–195. [Google Scholar] [CrossRef]
  2. Yvon, P.; Carré, F. Structural materials challenges for advanced reactor systems. J. Nucl. Mater. 2009, 385, 217–222. [Google Scholar] [CrossRef]
  3. Konings, R.; Stoller, R.E. Comprehensive Nuclear Materials; Elsevier: Amsterdam, The Netherlands, 2020. [Google Scholar]
  4. Natesan, K.; Majumdar, S.; Shankar, P.; Shah, V. Preliminary Materials Selection Issues for the Next Generation Nuclear Plant Reactor Pressure Vessel; Argonne National Laboratory: Argonne, IL, USA, 2007. [Google Scholar]
  5. Lister, D.; Cook, W. Nuclear plant materials and corrosion. In The Essential CANDU, a Textbook on the CANDU Nuclear Power Plant Technology; University Network of Excellence in Nuclear Engineering (UNENE): Hamilton, ON, Canada, 2014; pp. 1–54. [Google Scholar]
  6. Zheng, P.; Chen, R.; Liu, H.; Chen, J.; Zhang, Z.; Liu, X.; Shen, Y. On the standards and practices for miniaturized tensile test—A review. Fusion Eng. Des. 2020, 161, 112006. [Google Scholar] [CrossRef]
  7. Krumwiede, D.; Yamamoto, T.; Saleh, T.; Maloy, S.; Odette, G.; Hosemann, P. Direct comparison of nanoindentation and tensile test results on reactor-irradiated materials. J. Nucl. Mater. 2018, 504, 135–143. [Google Scholar] [CrossRef]
  8. Aly, O.; Neto, M. Stress corrosion cracking. In Developments in Corrosion Protection; IntechOpen: London, UK, 2014; pp. 65–79. [Google Scholar]
  9. Jang, C.; Jang, H.; Hong, J.; Cho, H.; Kim, T.; Lee, J. Environmental fatigue of metallic materials in nuclear power plants–a review of Korean test programs. Nucl. Eng. Technol. 2013, 45, 929–940. [Google Scholar] [CrossRef]
  10. Huang, J.; Yeh, J.; Jeng, S.; Chen, C.; Kuo, R. High-cycle fatigue behavior of type 316L stainless steel. Mater. Trans. 2006, 47, 409–417. [Google Scholar] [CrossRef]
  11. Kim, B.; Rempe, J.; Knudson, D.; Condie, K.; Sencer, B. In-situ creep testing capability for the advanced test reactor. Nucl. Technol. 2012, 179, 412–428. [Google Scholar] [CrossRef]
  12. Kim, B.; Rempe, J.; Knudson, D.; Condie, K.; Sencer, B. In-Situ Creep Testing Capability Development for Advanced Test Reactor; No. INL/EXT-10-17779; Idaho National Laboratory: Idaho Falls, ID, USA, 2010. [Google Scholar]
  13. Zinkle, S.; Tanigawa, H.; Wirth, B. Radiation and thermomechanical degradation effects in reactor structural alloys. In Structural Alloys for Nuclear Energy Applications; Elsevier: Amsterdam, The Netherlands, 2019; pp. 210–263. [Google Scholar]
  14. Hosemann, P.; Shin, C.; Kiener, D. Small scale mechanical testing of irradiated materials. J. Mater. Res. 2015, 30, 1231–1245. [Google Scholar] [CrossRef]
  15. Ehrnstén, U.; Saukkonen, T.; Karlsen, W.; Hänninen, H. Deformation localisation and EAC in inhomogeneous microstructures of austenitic stainless steels. In Proceedings of the International Conference on Environmental Degradation of Materials in Nuclear Power Systems, Virginia Beach, VA, USA, 23–27 August 2009; pp. 910–919. [Google Scholar]
  16. Moilanen, P. Pneumatic Servo-Controlled Material Testing Device Capable of Operating at High Temperature Water and Irradiation Conditions; VTT Technical Research Centre of Finland: Espoo, Finland, 2004; p. 154. [Google Scholar]
  17. Radek, N.; Filippo, S.; Debarberis, L.; Petr, S.; Kytka, M. Testing environmentally assisted cracking of reactor materials using. Int. J. Press. Vessel. Pip. 2006, 83, 701–706. [Google Scholar] [CrossRef]
  18. Penttilä, S.; Moilanen, P.; Karlsen, W.; Toivonen, A. Miniature Autoclave and Double Bellows Loading Device for Material Testing in Future Reactor Concept Conditions—Case Supercritical Water. J. Nucl. Eng. Radiat. Sci. 2018, 4, 011016. [Google Scholar] [CrossRef]
  19. Kyrki-Rajamäki, R.; Salomaa, R.; Vanttola, T.; Suikkanen, H.; Viitanen, T.; Penttilä, S.; Kangas, P. The Finnish Sustainable Energy (SusEn) project on New Type Nuclear Reactors. In Proceedings of the 20th International Conference on Structural Mechanics in Reactor Technology (SMiRT 20), Espoo, Finland, 9–14 August 2009. [Google Scholar]
  20. Singh, B.N.; Edwards, D.J.; Tähtinen, S.; Moilanen, P.; Jacquet, P.; Dekeyser, J. Final Report on In-Reactor Tensile Tests on OFCH-Copper and CuCrZr Alloys; Risoe National Laboratory: Roskilde, Denmark, 2004. [Google Scholar]
  21. Kurata, Y.; Itabashi, Y.; Mimura, H.; Kikuchi, T.; Amezawa, H.; Shimakawa, S.; Tsuji, H.; Shindo, M. In-pile and post-irradiation creep of type 304 stainless steel under diferent neutron spectra. J. Nucl. Mater. 2000, 283, 386–390. [Google Scholar] [CrossRef]
  22. Tuček, K.; Száraz, Z.; Novotný, R.; Knapek, M.; Novák, M.; Moniz, D.; Nilsson, K.; Fazio, C. Tensile testing of sub-sized 316L steel specimens in liquid lead. In Proceedings of the International Conference on Fast Reactors and Related Fuel Cycles (FR21), Beijing, China, 10–13 May 2021. [Google Scholar]
  23. Nilsson, K. Assessment of thin-walled cladding tube mechanical properties by segmented expanding Mandrel test (No. NEA-NSC-WPFC-DOC-2015-9). In Proceedings of the Structural Materials for Innovative Nuclear Systems (SMINS-3) Workshop Proceedings Idaho National Laboratory Idaho Falls, Idaho Falls, ID, USA, 7–10 October 2013. [Google Scholar]
  24. Zhu, Y.; Espinosa, H. An electromechanical material testing system for in situ electron microscopy and applications. Proc. Natl. Acad. Sci. USA 2005, 102, 14503–14508. [Google Scholar] [CrossRef]
  25. Ma, Z.; Zhao, H.; Huang, H.; Zhang, L.; Wang, K.; Zhou, X. A novel tensile device for in situ scanning electron microscope mechanical testing. Exp. Tech. 2015, 39, 3–11. [Google Scholar] [CrossRef]
  26. Wang, X.; Mao, S.; Zhang, J.; Li, Z.; Deng, Q.; Ning, J.; Yang, X.; Wang, L.; Ji, Y.L.; Liu, Y. MEMS device for quantitative in situ mechanical testing in electron microscope. Micromachines 2017, 8, 31. [Google Scholar] [CrossRef]
  27. Min, H.; Park, J. Development of in-situ SEM testing apparatus for observing behavior of material at high magnification during tensile test. Measurement 2023, 221, 113454. [Google Scholar] [CrossRef]
  28. Lunt, D.; Thomas, R.; Bowden, D.; Rigby-Bell, M.; de Moraes Shubeita, S.; Andrews, C.; Lapauw, T.; Vleugels, J.; da Fonseca, J.; Lambrinou, K.; et al. Detecting irradiation-induced strain localisation on the microstructural level by means of high-resolution digital image correlation. J. Nucl. Mater. 2023, 580, 154410. [Google Scholar] [CrossRef]
  29. Jalali, S.I.A.; Sen, M.; Banerjee, D. Strain mapping in fine scale multivariant α structures in titanium alloys. Mater. Charact. 2022, 193, 112260. [Google Scholar] [CrossRef]
  30. Kammers, A.; Daly, S. Digital image correlation under scanning electron microscopy: Methodology and validation. Exp. Mech. 2013, 53, 1743–1761. [Google Scholar] [CrossRef]
  31. Tasan, C.; Hoefnagels, J.; Geers, M. Microstructural banding effects clarified through micrographic digital image correlation. Scr. Mater. 2010, 62, 835–838. [Google Scholar] [CrossRef]
  32. Tasan, C.; Hoefnagels, J.; Diehl, M.; Yan, D.; Roters, F.; Raabe, D. Strain localization and damage in dual phase steels investigated by coupled in-situ deformation experiments and crystal plasticity simulations. Int. J. Plast. 2014, 63, 198–210. [Google Scholar] [CrossRef]
  33. Tasan, C.; Diehl, M.; Yan, D.; Zambaldi, C.; Shanthraj, P.; Roters, F.; Raabe, D. Integrated experimental–simulation analysis of stress and strain partitioning in multiphase alloys. Acta Mater. 2014, 81, 386–400. [Google Scholar] [CrossRef]
  34. Githens, A.; Ganesan, S.; Chen, Z.; Allison, J.; Sundararaghavan, V.; Daly, S. Characterizing microscale deformation mechanisms and macroscopic tensile properties of a high strength magnesium rare-earth alloy: A combined experimental and crystal plasticity approach. Acta Mater. 2020, 186, 77–94. [Google Scholar] [CrossRef]
  35. Preibisch, S.; Saalfeld, S.; Tomancak, P. Globally optimal stitching of tiled 3D microscopic image acquisitions. Bioinformatics 2009, 25, 1463–1465. [Google Scholar] [CrossRef]
  36. Schindelin, J.; Frise, A.-C.I.E.; Kaynig, V.; Longair, M.; Pietzsch, T.; Preibisch, S.; Rueden, C.; Saalfeld, S.; Schmid, B.; Tinevez, J.-Y.; et al. Fiji: An open-source platform for biological-image analysis. Nat. Methods 2012, 9, 676–682. [Google Scholar] [CrossRef] [PubMed]
  37. Lee, S.; Cho, H.; Bronkhorst, C.; Pokharel, R.; Brown, D.; Clausen, B.; Vogel, S.; Anghel, V.; Gray, G., III; Mayeur, J. Deformation, dislocation evolution and the non-Schmid effect in body-centered-cubic single-and polycrystal tantalum. Int. J. Plast. 2023, 163, 103529. [Google Scholar] [CrossRef]
  38. Monnet, G.; Vincent, L.; Gélébart, L. Multiscale modeling of crystal plasticity in Reactor Pressure Vessel steels: Prediction of irradiation hardening. J. Nucl. Mater. 2019, 514, 128–138. [Google Scholar] [CrossRef]
  39. Que, Z.; Lindroos, M.; Lydman, J.; Hytönen, N.; Lindqvist, S.; Efsing, P.; Nevasmaa, P.; Arffman, P. Brittle fracture initiation in decommissioned boiling water reactor pressure vessel head weld. J. Nucl. Mater. 2022, 569, 153925. [Google Scholar] [CrossRef]
  40. Scherer, J.; Besson, J.; Forest, S.; Hure, J.; Tanguy, B. Strain gradient crystal plasticity with evolving length scale: Application to voided irradiated materials. Eur. J. Mech. A/Solids 2019, 77, 103768. [Google Scholar] [CrossRef]
Figure 1. Model and dimensions of the load frame structure used for the in-situ testing device.
Metals 14 00154 g001
Figure 2. (a) Tensile specimen geometry and dimensions, and (b) model of fastening system.
Metals 14 00154 g002
Figure 3. The SEM tensile device with its main components highlighted.
Metals 14 00154 g003
Figure 4. Schematic model of the device used for the calibration of the bellows.
Metals 14 00154 g004
Figure 5. Example plot of the raw data obtained in a load-pressure calibration procedure (circles) and linear regression (red line).
Metals 14 00154 g005
Figure 6. Comparison between the load as quantified by a load cell during the calibration procedure and the calculated load.
Metals 14 00154 g006
Figure 7. Diagram on the functional mechanism of the pneumatically driven pressure regulation system [16].
Metals 14 00154 g007
Figure 8. Overview of the pneumatic control system and the mounting of the in-situ tensile testing device inside the SEM. (a) Pneumatic control mounted on moving rack, (b) SEM device with attached piping, and (c) in-situ tensile device mounted on SEM. The red arrow highlights the bellows position in the system.
Metals 14 00154 g008
Figure 9. Load as a function of displacement curves for the tests caried out inside and outside of the SEM device.
Metals 14 00154 g009
Figure 10. Load as a function of displacement from the second tensile test in the SEM.
Metals 14 00154 g010
Figure 11. SEM image of the specimen surface after the onset of necking.
Metals 14 00154 g011
Figure 12. Load as a function of displacement of the third test with a more ductile specimen and smaller 10 µm steps.
Metals 14 00154 g012
Figure 13. SEM images depicting the evolution of the specimen surface with deformation at displacements of (a) 0 mm, (b) 0.7 mm, (c) 1.1 mm, and rupture at (d) 1.18 mm.
Metals 14 00154 g013
Figure 14. Load as a function of displacement for the QT steel specimen in the fourth test with 50 µm steps.
Metals 14 00154 g014
Figure 15. (a) Detailed 3d representation and (b) photo of custom vibratory polisher adapter for small tensile specimen type.
Metals 14 00154 g015
Figure 16. (a) Mounted tensile specimen for EBSD, (b) position of mounted specimen inside the SEM for EBSD analysis, and (c) inverse pole figure map results with highlighted grain boundaries.
Metals 14 00154 g016
Figure 17. (a) 3D representation and (b) photo of the removable cassette system for attaching the specimen to the loading frame inside the SEM.
Metals 14 00154 g017
Figure 18. (a) Patterned tensile specimen prior to testing under stereo optical microscope and (b) strain distribution with measurement of regions in which strain occurred at ultimate tensile strength.
Metals 14 00154 g018
Figure 19. Stress-strain plots of RPV steel (JRQ) considering extensometers of different length and a strain gauge in the mid-section of the specimen.
Metals 14 00154 g019
Figure 20. Stitched and merged SEM images of a RPV steel microstructure at high magnification.
Metals 14 00154 g020
Figure 21. Digital image correlation maps depicting the full-field (a) x displacement and (b) y displacement at a global engineering strain of approximately 1.4%.
Metals 14 00154 g021
Figure 22. Full-field maps for (a) axial strain, (b) transverse strain, and (c) shear strain obtained with DIC at a global engineering strain of 1.4%.
Metals 14 00154 g022
Figure 23. (a) Experimental and model predicted stress-strain plots of RPV steel at room temperature and 288 °C. Model predicted (b) axial, (c) transverse, and (d) shear strain map of RPV steel at a global engineering strain of 1.4%.
Metals 14 00154 g023
Table 1. Displacement step per displacement range in the second tensile test.
Displacement Range/mmDisplacement Step/mm
0–0.030.005
0.03–0.250.02
0.25–0.970.05
Table 2. Summary of crystal plasticity model elasticity and dislocation slip parameters.
Elasticity Parameters
C 11 216,000 [MPa]
C 12 134,000 [MPa]
C 44 119,000 [MPa]
μ 82.3 [GPa] (22 °C),
77.9 [GPa] (288 °C)
Dislocation Slip Parameters
H 2 × 10¹¹ s−1
ρ m 1 × 10¹³ [1/m2]
ρ 0 7.0 × 10¹² [1/m2]
ρ r e f 1 × 10¹² [1/m2]
l s c m i n 10 [nm]
b s 0.248 [nm]
p 0.5
q 1.5
τ 0 s 122 [MPa]
K 5.3754   [ M P a / m m ]
d 5.2 [μm]
F 4.4204 × 10⁻¹⁹ [J]
a c a r b 1.0
D c a r b 200 [nm]
C c a r b 7.6000 × 10⁸ [1/mm3]
K o b s 3.8
y 2.48 [nm]
a s e l f / l a t e n t 0.1
a c o l l i n e a r 0.7
Disclaimer/Publisher’s Note: The statements, opinions and data contained in all publications are solely those of the individual author(s) and contributor(s) and not of MDPI and/or the editor(s). MDPI and/or the editor(s) disclaim responsibility for any injury to people or property resulting from any ideas, methods, instructions or products referred to in the content.

