
Quality Assurance in Resistance Spot Welding: State of Practice, State of the Art, and Prospects


Abstract
:1. Introduction
2. Quality Indicators
2.1. Joining Zone’s Geometrical Features
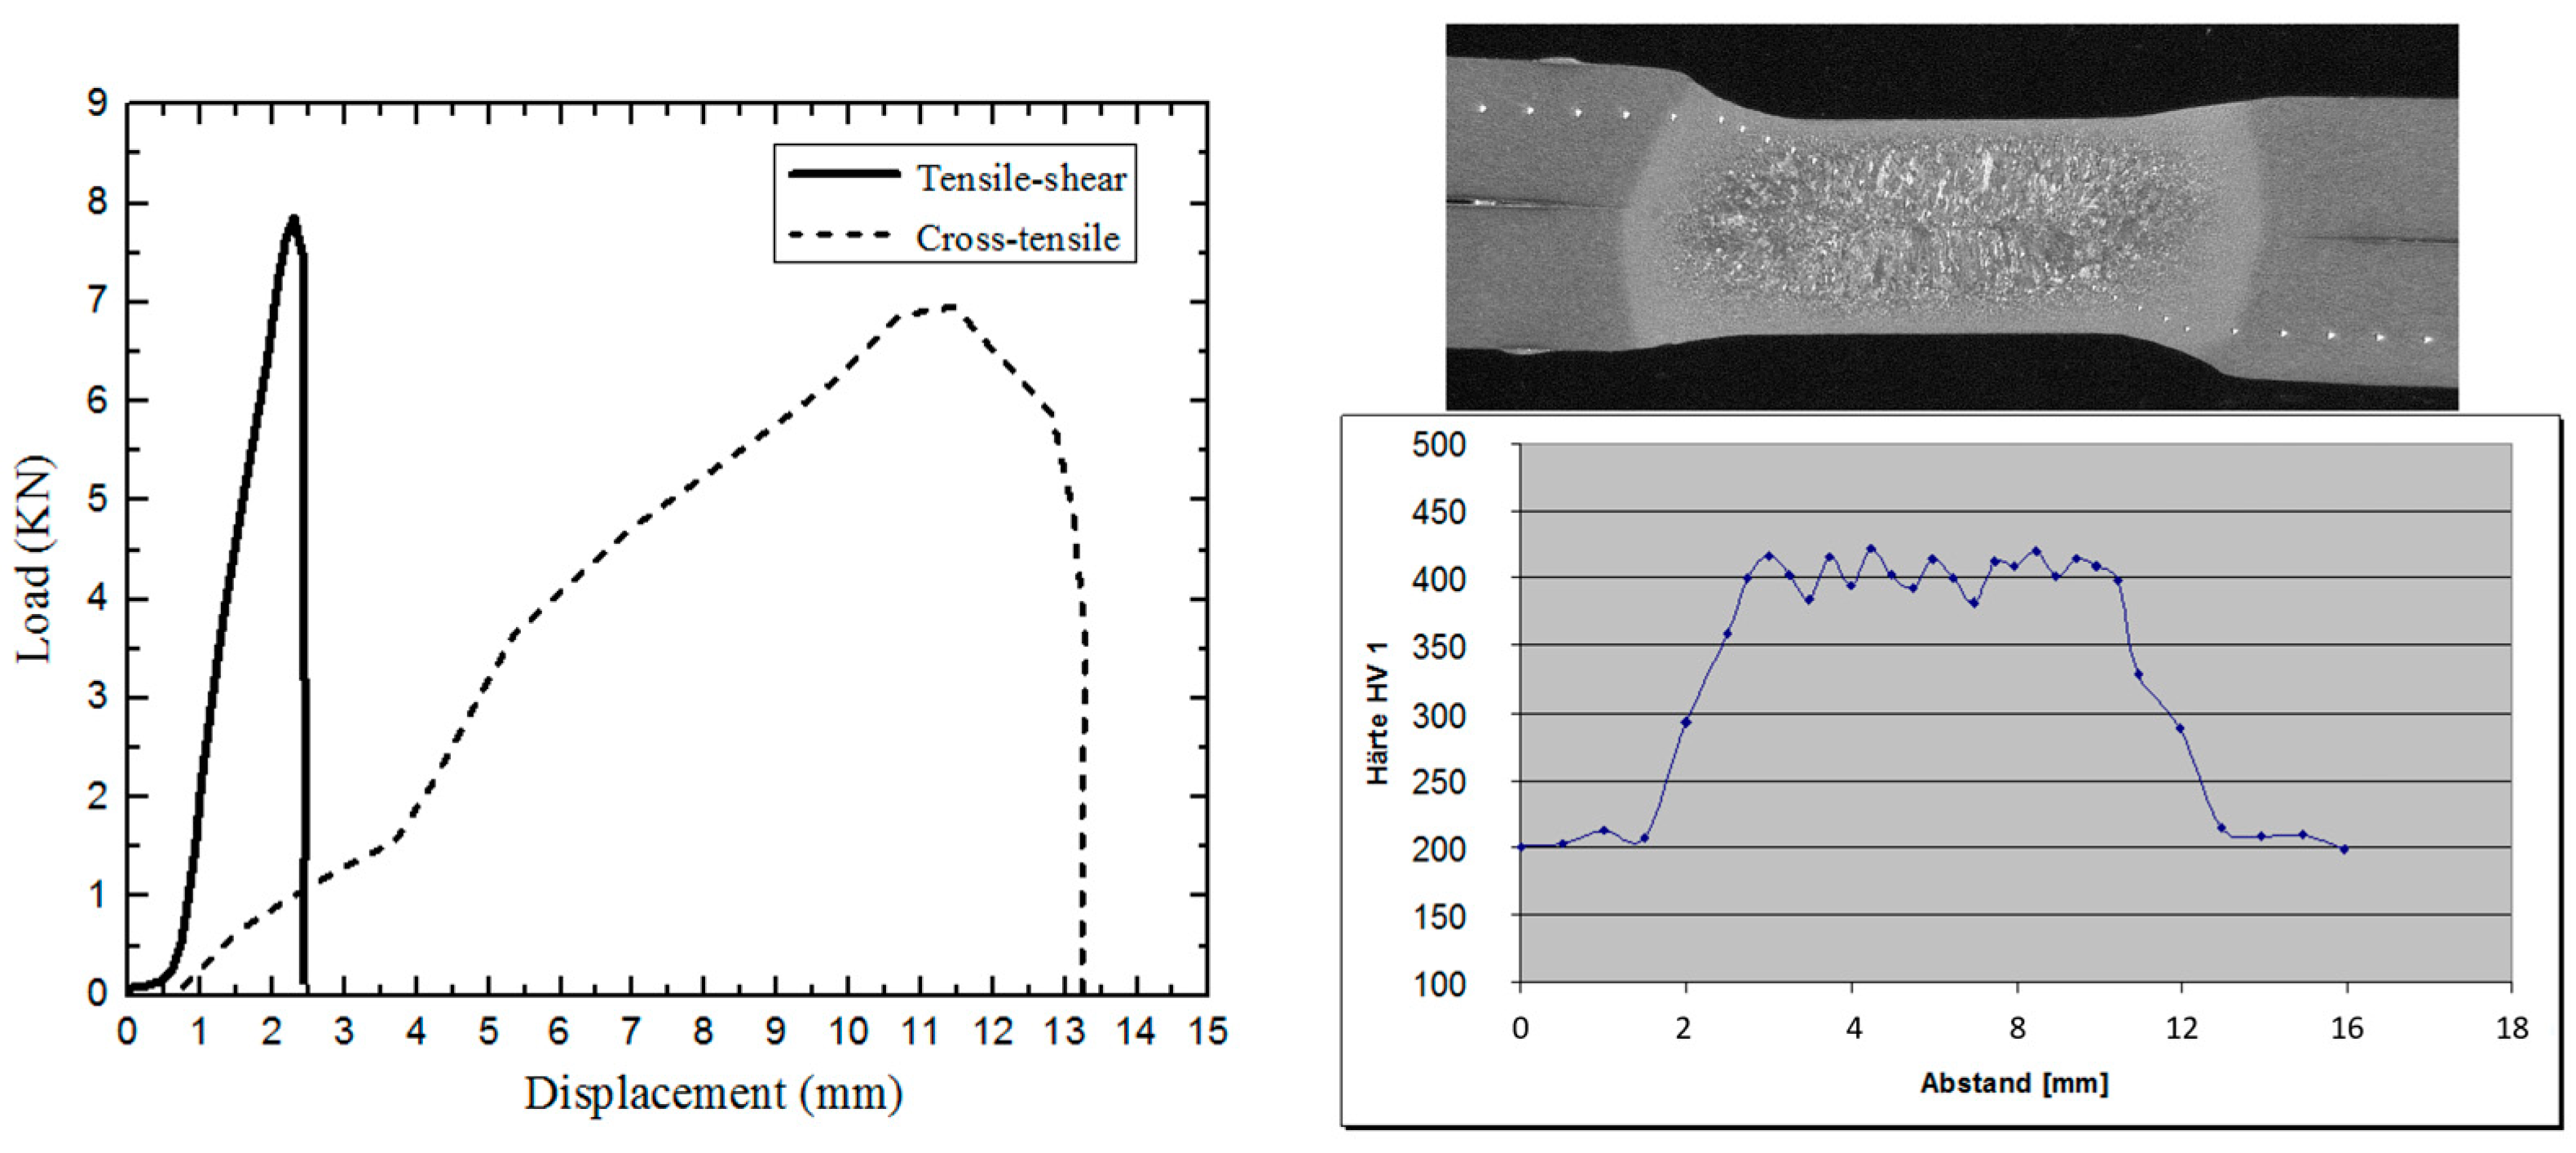
2.2. Mechanical Performance
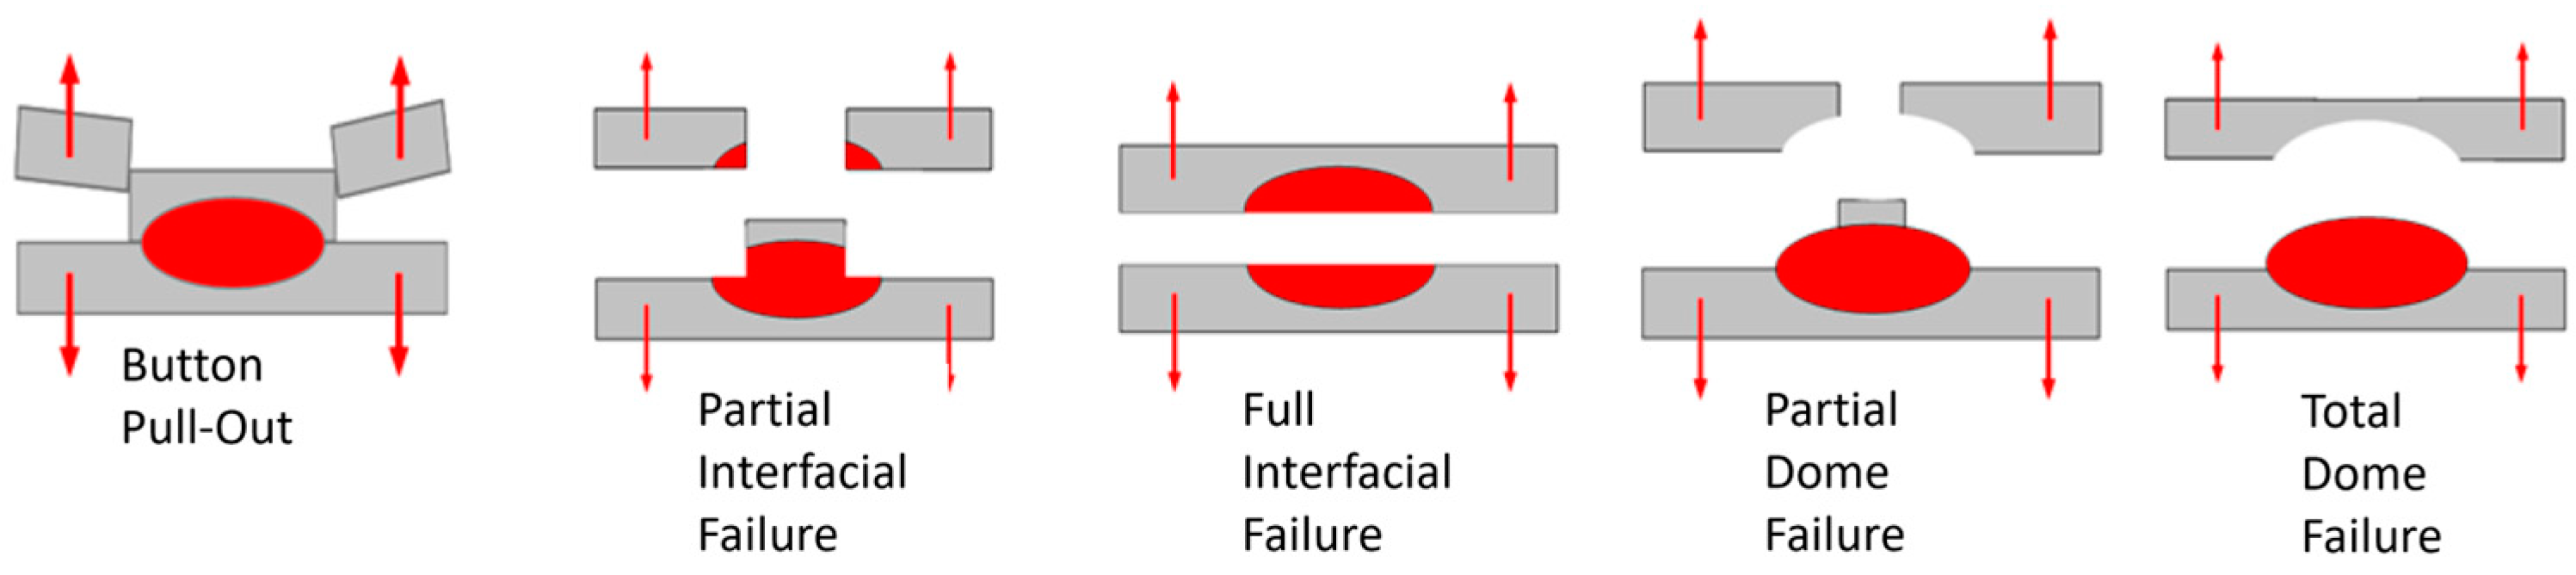
2.3. Failure Modes
2.4. Application-Specific KPIs
3. Defects in RSW
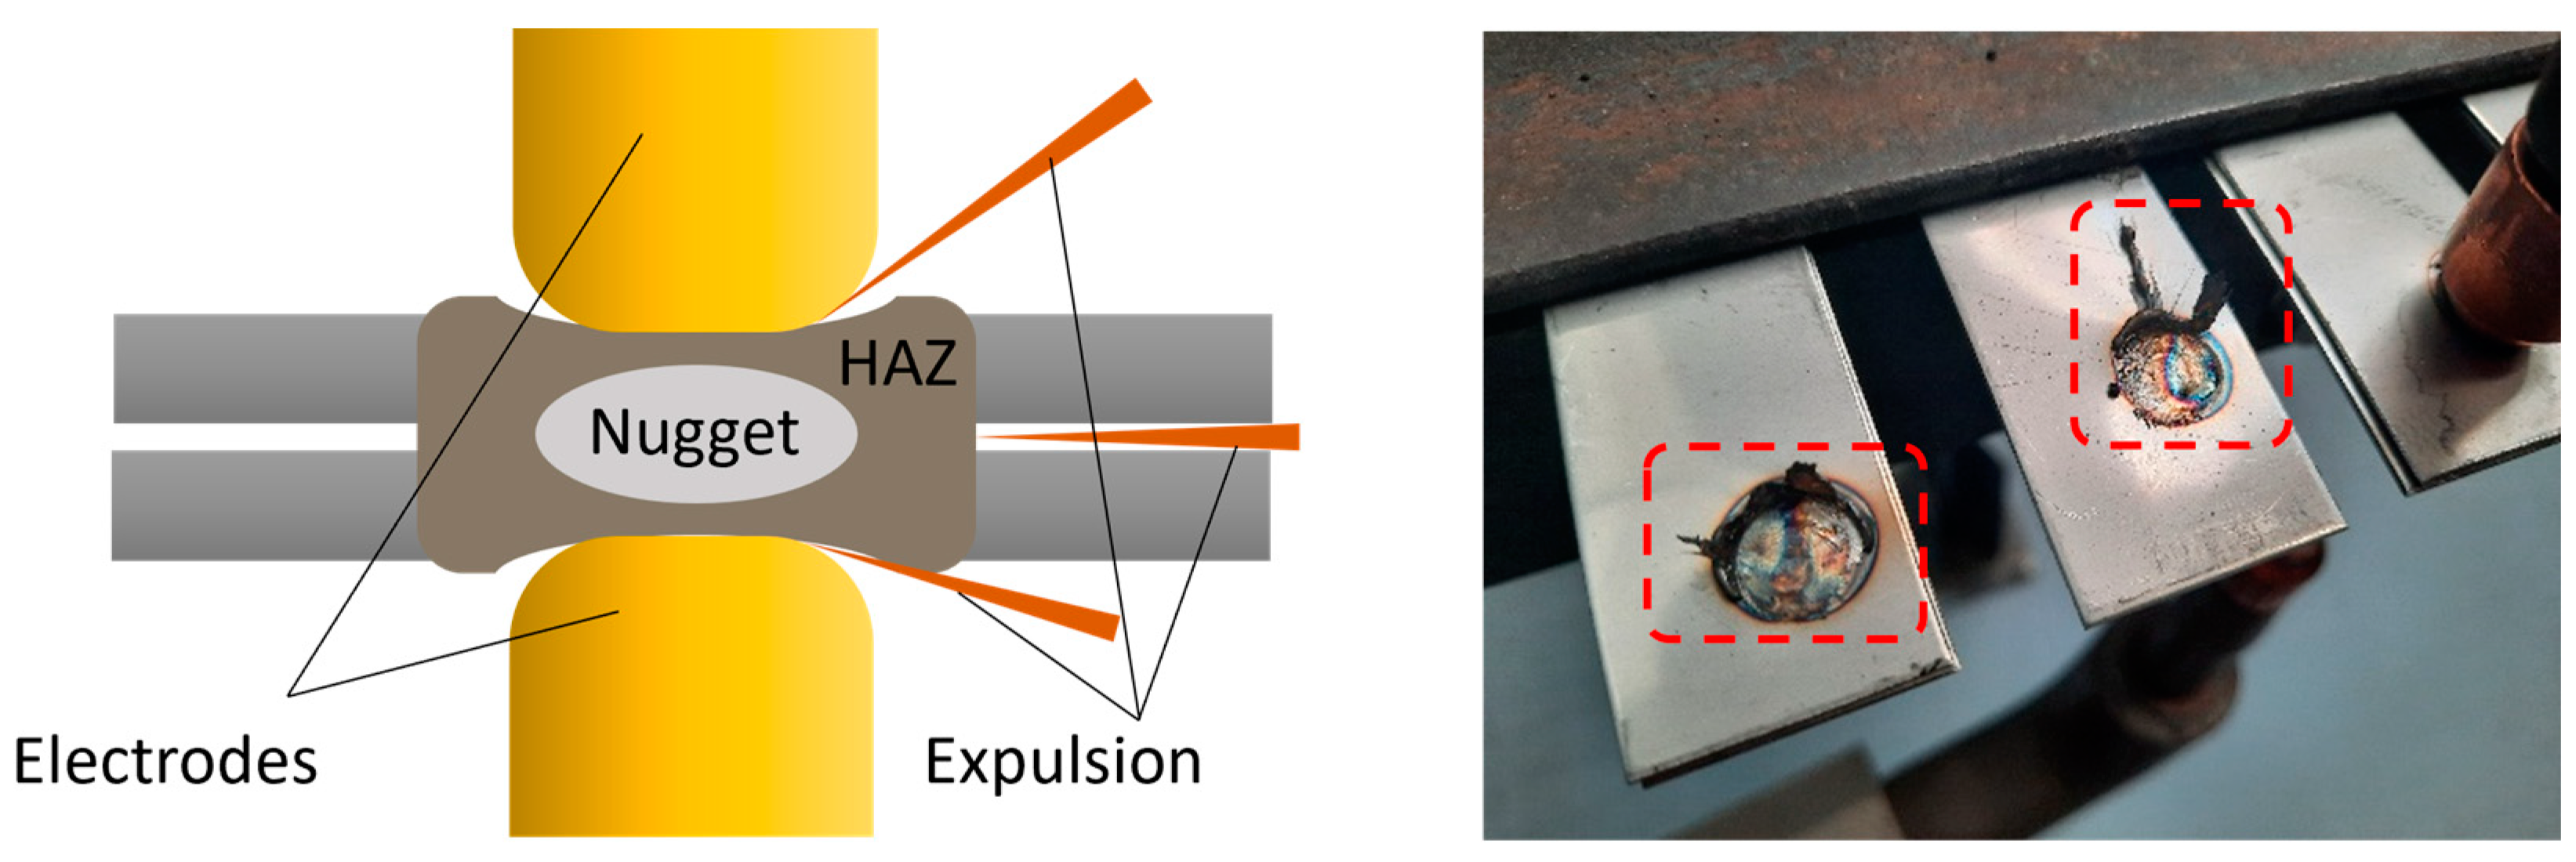
3.1. Expulsion
3.2. Shrinkage Void

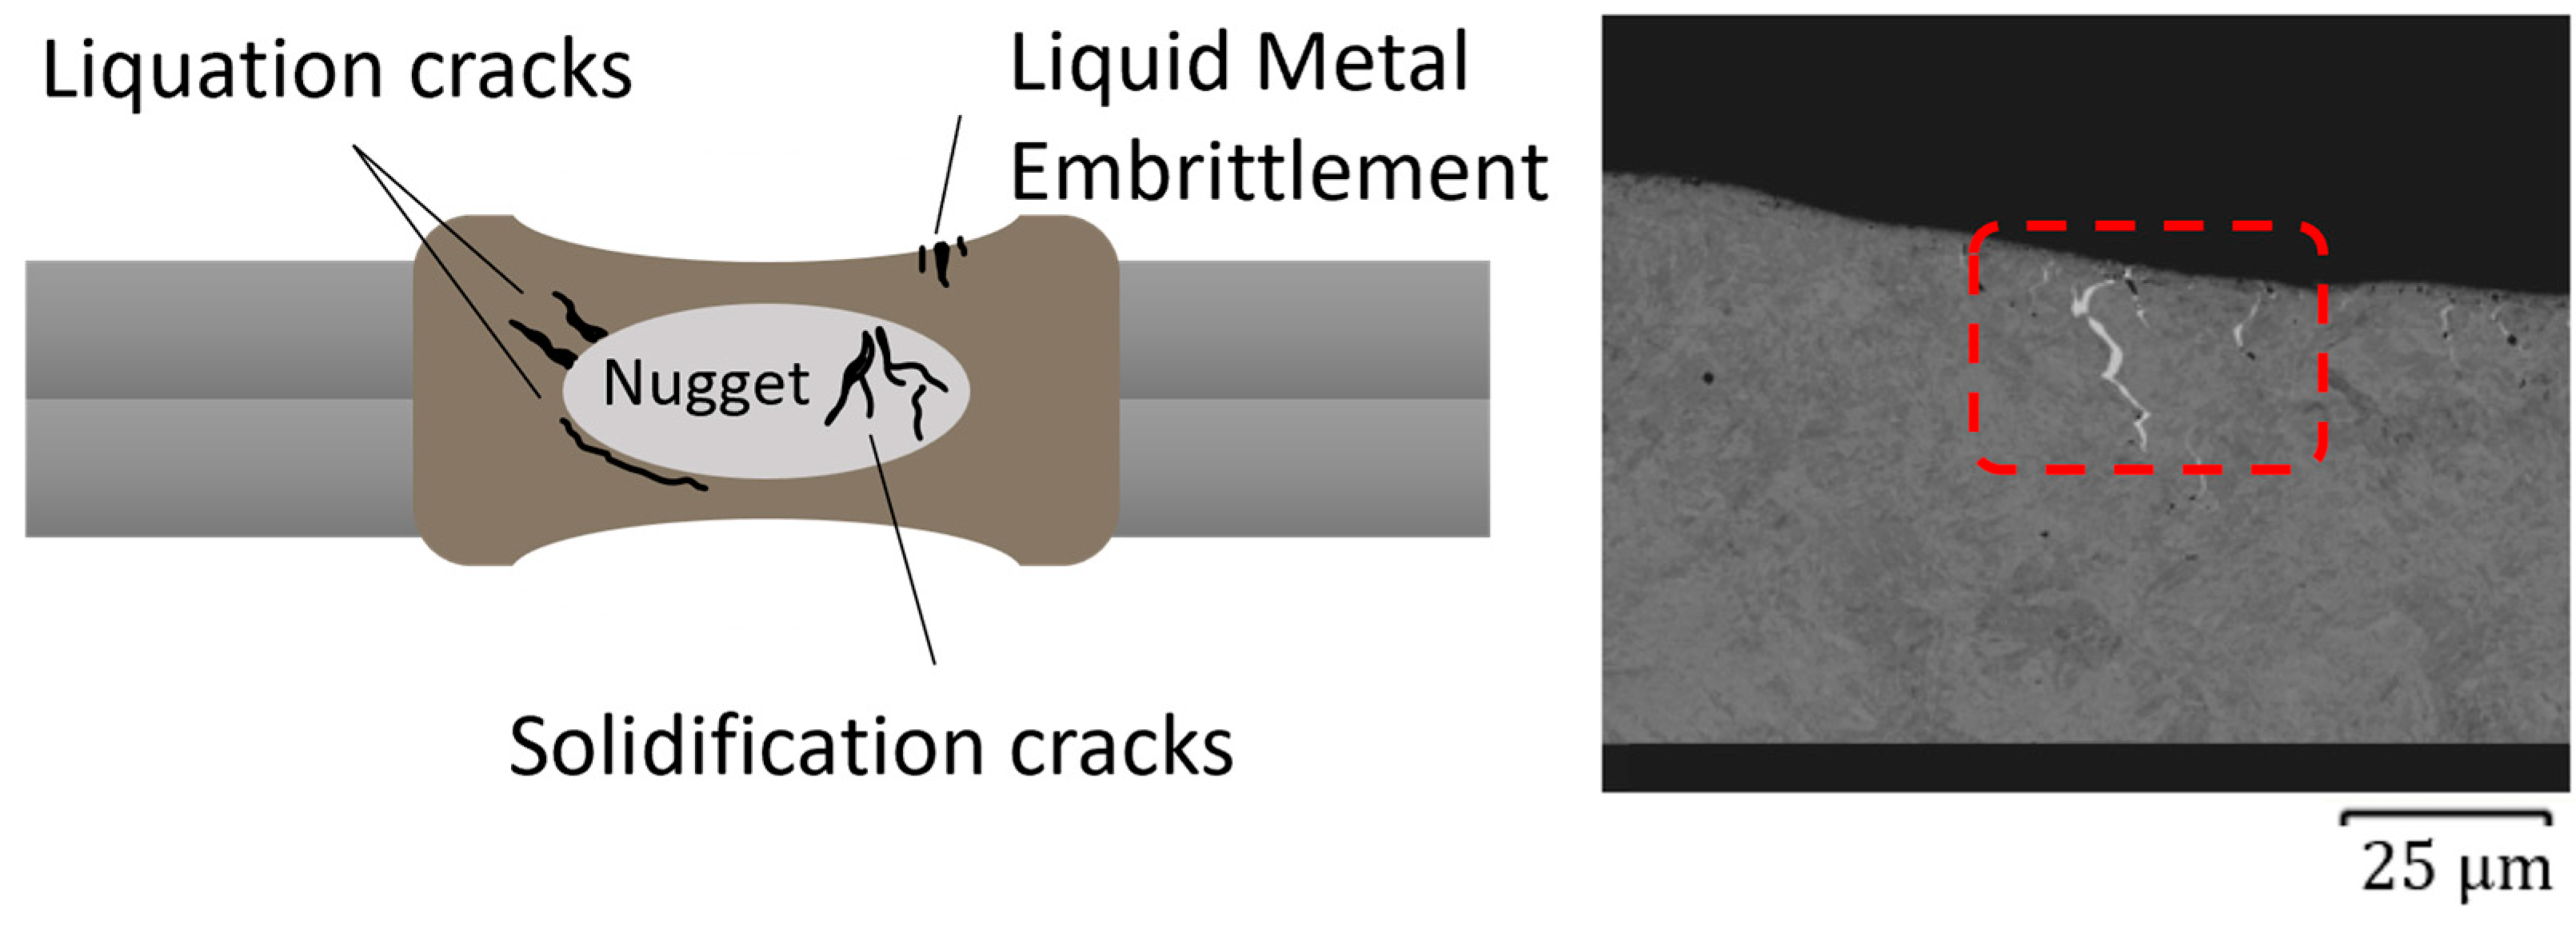
3.3. Cracking
4. Practices and Norms in Manufacturing
5. State-of-the-Art Methodologies
5.1. Inspection
5.2. Process Optimization—Open Loop Methods
5.3. Process Control—Closed-Loop Methods
6. Discussion
6.1. State of Practice and State of the Art: How They Affect Each Other
6.2. A Realistic Scenario for Online Quality Assessment in Production
6.3. Digital Twins and the Welding Ecosystem
7. Conclusions and Prospects
Author Contributions
Funding
Data Availability Statement
Conflicts of Interest
References
- Pardal, G.; Meco, S.; Dunn, A.; Williams, S.; Ganguly, S.; Hand, D.P.; Wlodarczyk, K.L. Laser spot welding of laser textured steel to aluminium. J. Mater. Process. Technol. 2017, 241, 24–35. [Google Scholar] [CrossRef]
- Zhang, W.; Roy, G.G.; Elmer, J.W.; DebRoy, T. Modeling of heat transfer and fluid flow during gas tungsten arc spot welding of low carbon steel. J. Appl. Phys. 2003, 93, 3022–3033. [Google Scholar] [CrossRef]
- Li, H.; Liu, X.S.; Zhang, Y.; Yuan, T.; Hodúlová, E.; Šimeková, B.; Bober, M.; Senkara, J.; Li, Z.X. Influence of the rotation speed on the interface microstructure and joining quality of aluminum alloy 6061/CF-PPS joints produced by refill friction stir spot welding. Weld. World 2022, 66, 923–933. [Google Scholar] [CrossRef]
- Shawn Lee, S.; Hyung Kim, T.; Jack Hu, S.; Cai, W.W.; Abell, J.A.; Li, J. Characterization of joint quality in ultrasonic welding of battery tabs. J. Manuf. Sci. Eng. 2013, 135, 021004. [Google Scholar] [CrossRef]
- Stavropoulos, P.; Sabatakakis, K.; Papacharalampopoulos, A.; Mourtzis, D. Infrared (IR) quality assessment of robotized resistance spot welding based on machine learning. Int. J. Adv. Manuf. Technol. 2022, 119, 1785–1806. [Google Scholar] [CrossRef]
- Zhou, K.; Yao, P. Overview of recent advances of process analysis and quality control in resistance spot welding. Mech. Syst. Signal Process. 2019, 124, 170–198. [Google Scholar] [CrossRef]
- Zhou, K.; Yao, P. Review of application of the electrical structure in resistance spot welding. IEEE Access 2017, 5, 25741–25749. [Google Scholar] [CrossRef]
- American Welding Society. Welding Inspection Handbook, 4th ed.; American Welding Society: Doral, NW, USA, 2015. [Google Scholar]
- Mei, L.; Yan, D.; Chen, G.; Xie, D.; Zhang, M.; Ge, X. Comparative study on CO2 laser overlap welding and resistance spot welding for automotive body in white. Mater. Des. 2015, 78, 107–117. [Google Scholar] [CrossRef]
- Capezza, C.; Centofanti, F.; Lepore, A.; Palumbo, B. Functional clustering methods for resistance spot welding process data in the automotive industry. Appl. Stoch. Models Bus. Ind. 2021, 37, 908–925. [Google Scholar] [CrossRef]
- VOGT Ultrasonics. PHAsisNEO Spot Weld Inspection Device. Available online: https://vogt-ultrasonics.de/en/ndt-inspection-systems/phasis/phasisneo/ (accessed on 16 April 2022).
- Stavropoulos, P.; Mourtzis, D. Digital twins in industry 4.0. In Design and Operation of Production Networks for Mass Personalization in the Era of Cloud Technology, 1st ed.; Mourtzis, D., Ed.; Elsevier: Amsterdam, The Netherlands, 2021; pp. 277–316. [Google Scholar] [CrossRef]
- Zhou, K.; Cai, L. Online nugget diameter control system for resistance spot welding. Int. J. Adv. Manuf. Technol. 2013, 68, 2571–2588. [Google Scholar] [CrossRef]
- Kumar, R.; Chohan, J.S.; Goyal, R.; Chauhan, P. Impact of process parameters of resistance spot welding on mechanical properties and micro hardness of stainless steel 304 weldments. Int. J. Struct. Integr. 2020, 12, 366–377. [Google Scholar] [CrossRef]
- Vural, M.; Akkuş, A.; Eryürek, B. Effect of welding nugget diameter on the fatigue strength of the resistance spot welded joints of different steel sheets. J. Mater. Process. Technol. 2006, 176, 127–132. [Google Scholar] [CrossRef]
- Tamizi, M.; Pouranvari, M.; Movahedi, M. The role of HAZ softening on cross-tension mechanical performance of martensitic advanced high strength steel resistance spot welds. Metall. Mater. Trans. A 2021, 52, 655–667. [Google Scholar] [CrossRef]
- Zhao, D.; Ren, D.; Song, G.; Zhao, K.; Liu, L.; Zhang, Z. Comparison of mechanical properties and the nugget formation of composite ceramic-centered annular welding and traditional resistance spot welding. Int. J. Mech. Sci. 2020, 187, 105933. [Google Scholar] [CrossRef]
- Yuan, X.; Li, C.; Chen, J.; Li, X.; Liang, X.; Pan, X. Resistance spot welding of dissimilar DP600 and DC54D steels. J. Mater. Process. Technol. 2017, 239, 31–41. [Google Scholar] [CrossRef]
- Huin, T.; Dancette, S.; Fabrègue, D.; Dupuy, T. Investigation of the failure of advanced high strength steels heterogeneous spot welds. Metals 2016, 6, 111. [Google Scholar] [CrossRef]
- Zhang, Y.; Tang, J.; Liu, T.; Ma, X.; Wang, Y. In Situ Observations of the Strain Competition Phenomenon in Aluminum Alloy Resistance Spot Welding Joints during Lap Shear Testing. Metals 2023, 13, 1601. [Google Scholar] [CrossRef]
- Mypati, O.; Pal, S.K.; Srirangam, P. Tensile and fatigue properties of aluminum and copper micro joints for Li-ion battery pack applications. Forces Mech. 2022, 7, 100101. [Google Scholar] [CrossRef]
- Tian, J.; Tao, W.; Yang, S. Investigation on microhardness and fatigue life in spot welding of quenching and partitioning 1180 steel. J. Mater. Res. Technol. 2022, 19, 3145–3159. [Google Scholar] [CrossRef]
- Sherepenko, O.; Kazemi, O.; Rosemann, P.; Wilke, M.; Halle, T.; Jüttner, S. Transient softening at the fusion boundary of resistance spot welds: A phase field simulation and experimental investigations for Al–Si-coated 22MnB5. Metals 2019, 10, 10. [Google Scholar] [CrossRef]
- Soomro, I.A.; Pedapati, S.R.; Awang, M. Double pulse resistance spot welding of dual phase steel: Parametric study on microstructure, failure mode and low dynamic tensile shear properties. Materials 2021, 14, 802. [Google Scholar] [CrossRef]
- Florea, R.S.; Bammann, D.J.; Yeldell, A.; Solanki, K.N.; Hammi, Y. Welding parameters influence on fatigue life and microstructure in resistance spot welding of 6061-T6 aluminum alloy. Mater. Des. 2013, 45, 456–465. [Google Scholar] [CrossRef]
- Marashi, P.; Pouranvari, M.; Amirabdollahian, S.; Abedi, A.; Goodarzi, M. Microstructure and failure behavior of dissimilar resistance spot welds between low carbon galvanized and austenitic stainless steels. Mater. Sci. Eng. A 2018, 480, 175–180. [Google Scholar] [CrossRef]
- Brand, M.J.; Schmidt, P.A.; Zaeh, M.F.; Jossen, A. Welding techniques for battery cells and resulting electrical contact resistances. J. Energy Storage 2015, 1, 7–14. [Google Scholar] [CrossRef]
- Xia, Y.J.; Su, Z.W.; Li, Y.B.; Zhou, L.; Shen, Y. Online quantitative evaluation of expulsion in resistance spot welding. J. Manuf. Process. 2019, 46, 34–43. [Google Scholar] [CrossRef]
- Senkara, J.; Zhang, H.; Hu, S.J. Expulsion prediction in resistance spot welding. Weld. J. 2004, 83, 123-S. [Google Scholar]
- Brandt, R.; Neuer, G. Electrical resistivity and thermal conductivity of pure aluminum and aluminum alloys up to and above the melting temperature. Int. J. Thermophys. 2007, 28, 1429–1446. [Google Scholar] [CrossRef]
- Cagran, C.; Wilthan, B.; Pottlacher, G. Enthalpy, heat of fusion and specific electrical resistivity of pure silver, pure copper and the binary Ag–28Cu alloy. Thermochim. Acta 2006, 445, 104–110. [Google Scholar] [CrossRef]
- Vijayan, V.; Murugan, S.P.; Son, S.G.; Park, Y.D. Shrinkage void formation in resistance spot welds: Its effect on advanced high-strength-steel weld strength and failure modes. J. Mater. Eng. Perform. 2019, 28, 7514–7526. [Google Scholar] [CrossRef]
- Pouranvari, M.; Marashi, S.P.H. Critical review of automotive steels spot welding: Process, structure and properties. Sci. Technol. Weld. Join. 2013, 18, 361–403. [Google Scholar] [CrossRef]
- Wan, X.; Wang, Y.; Fang, C. Welding defects occurrence and their effects on weld quality in resistance spot welding of AHSS steel. ISIJ Int. 2014, 54, 1883–1889. [Google Scholar] [CrossRef]
- Kustroń, P.; Korzeniowski, M.; Piwowarczyk, T.; Sokołowski, P. Development of resistance spot welding processes of metal–plastic composites. Materials 2021, 14, 3233. [Google Scholar] [CrossRef]
- Saha, D.C.; Chang, I.; Park, Y.D. Heat-affected zone liquation crack on resistance spot welded TWIP steels. Mater. Charact. 2014, 93, 40–51. [Google Scholar] [CrossRef]
- Bhattacharya, D. Liquid metal embrittlement during resistance spot welding of Zn-coated high-strength steels. Mater. Sci. Technol. 2018, 34, 1809–1829. [Google Scholar] [CrossRef]
- Kim, J.W.; Manladan, S.M.; Mahmud, K.; Jin, W.; Krishna, T.; Ji, C.; Park, Y.D. Liquid Metal Embrittlement Cracking in Uncoated Transformation-Induced Plasticity Steel during Consecutive Resistance Spot Welding. Metals 2023, 13, 1826. [Google Scholar] [CrossRef]
- American Welding Society. Available online: https://www.aws.org (accessed on 2 July 2022).
- European Welding Federation. Available online: https://www.ewf.be/ (accessed on 2 July 2022).
- Godina, R.; Matias, J.; Azevedo, S. Quality improvement with statistical process control in the automotive industry. Int. J. Ind. Eng. Manag. 2016, 7, 1. [Google Scholar] [CrossRef]
- Ramazani, A.; Mukherjee, K.; Abdurakhmanov, A.; Abbasi, M.; Prahl, U. Characterization of microstructure and mechanical properties of resistance spot welded DP600 steel. Metals 2015, 5, 1704–1716. [Google Scholar] [CrossRef]
- Saha, D.C.; Cho, Y.; Park, Y.D. Metallographic and fracture characteristics of resistance spot welded TWIP steels. Sci. Technol. Weld. Join. 2013, 18, 711–720. [Google Scholar] [CrossRef]
- Nodeh, I.R.; Serajzadeh, S.; Kokabi, A.H. Simulation of welding residual stresses in resistance spot welding, FE modeling and X-ray verification. J. Mater. Process. Technol. 2008, 205, 60–69. [Google Scholar] [CrossRef]
- Ultrasonic Spot Welding Quality Inspection. ABB. Available online: https://new.abb.com/products/robotics/functional-modules/ultrasonic-spot-welding-quality-inspection (accessed on 2 July 2022).
- Ji, C.; Na, J.K.; Lee, Y.S.; Park, Y.D.; Kimchi, M. Robot-assisted non-destructive testing of automotive resistance spot welds. Weld. World 2021, 65, 119–126. [Google Scholar] [CrossRef]
- BWI Active Thermography for Battery Weld Inspection. moviTHERM. Available online: https://movitherm.com/solutions/quality-inspection/battery-weld-inspection-for-quality-assurance/ (accessed on 2 January 2024).
- Zhao, X.; Zhao, Y.; Hu, S.; Wang, H.; Zhang, Y.; Ming, W. Progress in Active Infrared Imaging for Defect Detection in the Renewable and Electronic Industries. Sensors 2023, 23, 8780. [Google Scholar] [CrossRef] [PubMed]
- Zhou, K.; Yao, P.; Cai, L. Constant current vs. constant power control in AC resistance spot welding. J. Mater. Process. Technol. 2015, 223, 299–304. [Google Scholar] [CrossRef]
- Moshayedi, H.; Sattari-Far, I. Numerical and experimental study of nugget size growth in resistance spot welding of austenitic stainless steels. J. Mater. Process. Technol. 2012, 212, 347–354. [Google Scholar] [CrossRef]
- Pouranvari, M.; Asgari, H.R.; Mosavizadch, S.M.; Marashi, P.H.; Goodarzi, M. Effect of weld nugget size on overload failure mode of resistance spot welds. Sci. Technol. Weld. Join. 2007, 12, 217–225. [Google Scholar] [CrossRef]
- Mirzaei, F.; Ghorbani, H.; Kolahan, F. Numerical modeling and optimization of joint strength in resistance spot welding of galvanized steel sheets. Int. J. Adv. Manuf. Technol. 2017, 92, 3489–3501. [Google Scholar] [CrossRef]
- Stavropoulos, P.; Papacharalampopoulos, A.; Stavridis, J.; Sampatakakis, K. A three-stage quality diagnosis platform for laser-based manufacturing processes. Int. J. Adv. Manuf. Technol. 2022, 110, 2991–3003. [Google Scholar] [CrossRef]
- Xing, B.; Xiao, Y.; Qin, Q.H.; Cui, H. Quality assessment of resistance spot welding process based on dynamic resistance signal and random forest based. Int. J. Adv. Manuf. Technol. 2018, 94, 327–339. [Google Scholar] [CrossRef]
- Zhang, H.; Hou, Y.; Yang, T.; Zhang, Q.; Zhao, J. Welding quality evaluation of resistance spot welding using the time-varying inductive reactance signal. Meas. Sci. Technol. 2018, 29, 055601. [Google Scholar] [CrossRef]
- Sun, H.; Yang, J.; Wang, L. Resistance spot welding quality identification with particle swarm optimization and a kernel extreme learning machine model. Int. J. Adv. Manuf. Technol. 2017, 91, 1879–1887. [Google Scholar] [CrossRef]
- Zhao, D.; Ivanov, M.; Wang, Y.; Du, W. Welding quality evaluation of resistance spot welding based on a hybrid approach. J. Intell. Manuf. 2021, 32, 1819–1832. [Google Scholar] [CrossRef]
- Zhang, H.; Hou, Y.; Zhao, J.; Wang, L.; Xi, T.; Li, Y. Automatic welding quality classification for the spot welding based on the Hopfield associative memory neural network and Chernoff face description of the electrode displacement signal features. Mech. Syst. Signal Process. 2017, 85, 1035–1043. [Google Scholar] [CrossRef]
- Xia, Y.J.; Zhou, L.; Shen, Y.; Wegner, D.M.; Haselhuhn, A.S.; Li, Y.B.; Carlson, B.E. Online measurement of weld penetration in robotic resistance spot welding using electrode displacement signals. Measurement 2021, 168, 108397. [Google Scholar] [CrossRef]
- Xing, B.; Xiao, Y.; Qin, Q.H. Characteristics of shunting effect in resistance spot welding in mild steel based on electrode displacement. Measurement 2018, 115, 233–242. [Google Scholar] [CrossRef]
- Chen, S.; Wu, N.; Xiao, J.; Li, T.; Lu, Z. Expulsion identification in resistance spot welding by electrode force sensing based on wavelet decomposition with multi-indexes and BP neural networks. Appl. Sci. 2019, 9, 4028. [Google Scholar] [CrossRef]
- Hua, L.; Wang, B.; Wang, X.; He, X.; Guan, S. In-situ ultrasonic detection of resistance spot welding quality using embedded probe. J. Mater. Process. Technol. 2019, 267, 205–214. [Google Scholar] [CrossRef]
- Alghannam, E.; Lu, H.; Ma, M.; Cheng, Q.; Gonzalez, A.A.; Zang, Y.; Li, S. A novel method of using vision system and fuzzy logic for quality estimation of resistance spot welding. Symmetry 2019, 11, 990. [Google Scholar] [CrossRef]
- Hernández, A.E.; Villarinho, L.O.; Ferraresi, V.A.; Orozco, M.S.; Roca, A.S.; Fals, H.C. Optimization of resistance spot welding process parameters of dissimilar DP600/AISI304 joints using the infrared thermal image processing. Int. J. Adv. Manuf. Technol. 2020, 108, 211–221. [Google Scholar] [CrossRef]
- Kim, T.; Park, H.; Rhee, S. Optimization of welding parameters for resistance spot welding of TRIP steel with response surface methodology. Int. J. Prod. Res. 2005, 43, 4643–4657. [Google Scholar] [CrossRef]
- Zhao, D.; Wang, Y.; Sheng, S.; Lin, Z. Multi-objective optimal design of small scale resistance spot welding process with principal component analysis and response surface methodology. J. Intell. Manuf. 2014, 25, 1335–1348. [Google Scholar] [CrossRef]
- Vigneshkumar, M.; Varthanan, P.A. Comparison of RSM and ANN model in the prediction of the tensile shear failure load of spot welded AISI 304/316 L dissimilar sheets. Int. J. Comput. Mater. Sci. Surf. Eng. 2019, 8, 114–130. [Google Scholar] [CrossRef]
- Zhang, X.; Yao, F.; Ren, Z.; Yu, H. Effect of welding current on weld formation, microstructure, and mechanical properties in resistance spot welding of CR590T/340Y galvanized dual phase steel. Materials 2018, 11, 2310. [Google Scholar] [CrossRef] [PubMed]
- Hwang, I.S.; Kang, M.J.; Kim, D.C. Expulsion reduction in resistance spot welding by controlling of welding current waveform. Procedia Eng. 2011, 10, 2775–2781. [Google Scholar] [CrossRef]
- Yu, J. Adaptive resistance spot welding process that reduces the shunting effect for automotive high-strength steels. Metals 2018, 8, 775. [Google Scholar] [CrossRef]
- Shen, Y.; Xia, Y.J.; Li, H.; Zhou, L.; Li, Y.B.; Pan, H.T. A novel expulsion control strategy with abnormal condition adaptability for resistance spot welding. J. Manuf. Sci. Eng. 2021, 143, 111009. [Google Scholar] [CrossRef]
- PHAsis—For Spot Welds and Short Step Welds. VOGT Ultrasonics GmbH. Available online: https://vogt-ultrasonics.de/en/ndt-inspection-systems/phasis/ (accessed on 9 January 2024).
- UT/x Spot Weld Testing ScanMaster. Ultrasonic Inspection Solutions. Available online: https://scanmaster-irt.com/products/automotive/utx/ (accessed on 9 January 2024).
- Schubert, F.; Hipp, R.; Gommlich, A. Determination of diameter and thickness of weld nuggets in resistance spot weldings by high frequency ultrasound inspection. In Proceedings of the 11th European Conference on Non-Destructive Testing, Prague, Czech Republic, 6–10 October 2014. [Google Scholar]
- Adisorn, T.; Tholen, L.; Götz, T. Towards a digital product passport fit for contributing to a circular economy. Energies 2021, 14, 2289. [Google Scholar] [CrossRef]
- Khedmatgozar Dolati, S.S.; Caluk, N.; Mehrabi, A.; Khedmatgozar Dolati, S.S. Non-destructive testing applications for steel bridges. Appl. Sci. 2021, 11, 9757. [Google Scholar] [CrossRef]
- Dahmene, F.; Yaacoubi, S.; Mountassir, M.E.; Bouzenad, A.E.; Rabaey, P.; Masmoudi, M.; Taram, A. On the nondestructive testing and monitoring of cracks in resistance spot welds: Recent gained experience. Weld. World 2022, 66, 629–641. [Google Scholar] [CrossRef]
- Stavropoulos, P.; Sabatakakis, K.; Bikas, H.; Papacharalampopoulos, A. Monitoring and Quality Assurance of Laser Welding: From Offline Sample-Based Testing to In-Process Real-Time AI Inference and Digital Twins. In A Guide to Laser Welding, 1st ed.; Pereira, A.B., Marques, E.S.V., Gomes da Silva, F.J., Eds.; NOVA Science Publishers: Hauppauge, NY, USA, 2023. [Google Scholar] [CrossRef]
- Zhang, H.; Wang, F.; Xi, T.; Zhao, J.; Wang, L.; Gao, W. A novel quality evaluation method for resistance spot welding based on the electrode displacement signal and the Chernoff faces technique. Mech. Syst. Signal Process. 2015, 62, 431–443. [Google Scholar] [CrossRef]
- Zare, M.; Pouranvari, M. Metallurgical joining of aluminium and copper using resistance spot welding: Microstructure and mechanical properties. Sci. Technol. Weld. Join. 2021, 26, 461–469. [Google Scholar] [CrossRef]
- Podržaj, P.; Polajnar, I.; Diaci, J.; Kariž, Z. Expulsion detection system for resistance spot welding based on a neural network. Meas. Sci. Technol. 2004, 15, 592. [Google Scholar] [CrossRef]
- Yang, W.; Gao, P.P.; Gao, X. Online evaluation of resistance spot welding quality and defect classification. Meas. Sci. Technol. 2023, 34, 095016. [Google Scholar] [CrossRef]
- Xia, Y.J.; Shen, Y.; Zhou, L.; Li, Y.B. Expulsion intensity monitoring and modeling in resistance spot welding based on electrode displacement signals. J. Manuf. Sci. Eng. 2021, 143, 031008. [Google Scholar] [CrossRef]
- Zhou, L.; Zhang, T.; Zhang, Z.; Lei, Z.; Zhu, S. Monitoring of resistance spot welding expulsion based on machine learning. Sci. Technol. Weld. Join. 2022, 27, 292–300. [Google Scholar] [CrossRef]
- Mathiszik, C.; Köberlin, D.; Heilmann, S.; Zschetzsche, J.; Füssel, U. General approach for inline electrode wear monitoring at resistance spot welding. Processes 2021, 9, 685. [Google Scholar] [CrossRef]
- Han, L.; Thornton, M.; Boomer, D.; Shergold, M. Effect of aluminium sheet surface conditions on feasibility and quality of resistance spot welding. J. Mater. Process. Technol. 2012, 210, 1076–1082. [Google Scholar] [CrossRef]
- Stavropoulos, P.; Papacharalampopoulos, A.; Sabatakakis, K. Data Attributes in Quality Monitoring of Manufacturing Processes: The Welding Case. Appl. Sci. 2023, 13, 10580. [Google Scholar] [CrossRef]
- Stavropoulos, P. Digitization of Manufacturing Processes: From Sensing to Twining. Technologies 2022, 10, 98. [Google Scholar] [CrossRef]
- Glatt, M.; Sinnwell, C.; Yi, L.; Donohoe, S.; Ravani, B.; Aurich, J.C. Modeling and implementation of a digital twin of material flows based on physics simulation. J. Manuf. Syst. 2021, 58, 231–245. [Google Scholar] [CrossRef]
- Stavropoulos, P.; Papacharalampopoulos, A.; Sabatakakis, K.; Mourtzis, D. Metamodelling of manufacturing processes and automation workflows towards designing and operating digital twins. Appl. Sci. 2023, 13, 1945. [Google Scholar] [CrossRef]
- Dong, J.; Hu, J.; Luo, Z. Quality Monitoring of Resistance Spot Welding Based on a Digital Twin. Metals 2023, 13, 697. [Google Scholar] [CrossRef]
- Ren, S.; Ma, Y.; Ma, N.; Chen, Q.; Wu, H. Digital twin for the transient temperature prediction during coaxial one-side resistance spot welding of Al5052/CFRP. J. Manuf. Sci. Eng. 2022, 144, 031015. [Google Scholar] [CrossRef]
- Stavropoulos, P.; Papacharalampopoulos, A.; Michail, C.K.; Chryssolouris, G. Robust additive manufacturing performance through a control oriented digital twin. Metals 2021, 11, 708. [Google Scholar] [CrossRef]
- Franciosa, P.; Sokolov, M.; Sinha, S.; Sun, T.; Ceglarek, D. Deep learning enhanced digital twin for Closed-Loop In-Process quality improvement. CIRP Ann. 2020, 69, 369–372. [Google Scholar] [CrossRef]


Disclaimer/Publisher’s Note: The statements, opinions and data contained in all publications are solely those of the individual author(s) and contributor(s) and not of MDPI and/or the editor(s). MDPI and/or the editor(s) disclaim responsibility for any injury to people or property resulting from any ideas, methods, instructions or products referred to in the content. |
© 2024 by the authors. Licensee MDPI, Basel, Switzerland. This article is an open access article distributed under the terms and conditions of the Creative Commons Attribution (CC BY) license (https://creativecommons.org/licenses/by/4.0/).
Share and Cite
Stavropoulos, P.; Sabatakakis, K. Quality Assurance in Resistance Spot Welding: State of Practice, State of the Art, and Prospects. Metals 2024, 14, 185. https://doi.org/10.3390/met14020185
Stavropoulos P, Sabatakakis K. Quality Assurance in Resistance Spot Welding: State of Practice, State of the Art, and Prospects. Metals. 2024; 14(2):185. https://doi.org/10.3390/met14020185
Chicago/Turabian StyleStavropoulos, Panagiotis, and Kyriakos Sabatakakis. 2024. "Quality Assurance in Resistance Spot Welding: State of Practice, State of the Art, and Prospects" Metals 14, no. 2: 185. https://doi.org/10.3390/met14020185