Article

The Coupled Temperature Field Model of Difficult-to-Deform Mg Alloy Foil High-Efficiency Electro-Rolling and Experimental Study

1
National Engineering Research Center for Equipment and Technology of Cold Strip Rolling, Yanshan University, Qinhuangdao 066004, China
2
State Key Laboratory of Metastable Materials Science and Technology, Yanshan University, Qinhuangdao 066004, China
*
Author to whom correspondence should be addressed.
Metals 2024, 14(3), 343; https://doi.org/10.3390/met14030343
Submission received: 29 February 2024 / Revised: 13 March 2024 / Accepted: 16 March 2024 / Published: 17 March 2024
(This article belongs to the Special Issue Advances in Metal Rolling Processes)

Abstract

:
In response to the challenging difficult-to-deform of magnesium foils, a high-efficiency and high-precision electro-rolling temperature field coupled model is established. This model is designed to simulate the non-annealing electric rolling (NAER) process of Mg foils under conditions of high current density, rapid temperature rise rates, and large temperature gradients. Firstly, a coupled temperature field difference model for the guide roller, roll, and Mg foil is established, based on the equipment for NAER and the electrification conditions. The Joule heat, distortion heat, and friction heat in the electric rolling process were precisely considered. Secondly, considering the peculiarity of the heat source and the heat transfer mechanism during NAER, the influence of the dynamic boundary conditions on the instantaneous temperature of the Mg foil was analyzed, which was closer to the actual situation. The experimental results show that the original model can accurately simulate the transient temperature change in Mg foils during NAER, and the error between the predicted value and the measured value is within 7.1%. According to the calculation of the model, the microstructure of completely recrystallized magnesium foil with a grain size of 4.61 μm and a texture strength of 11.3 can be obtained at an inlet temperature of 250 °C.

1. Introduction

Mg alloys are widely used in aerospace, transportation, biomedicine, 3C (computer, communication, consumer electronics), and new energy, among other high-tech fields, with outstanding specific strength, specific stiffness, shock absorption, and electromagnetic shielding capabilities. However, there are only two independent slip systems of magnesium alloy foil at room temperature, which results in a poor rolling ability of magnesium alloy foils at room temperature. Magnesium alloy rolling is very sensitive to temperature, which directly affects the quality and yield of magnesium alloy thin strip products. If the temperature is too low (<225 °C), it will lead to serious surface cracks and edge cracks [1]. If the temperature is too high, it will induce coarse grains and reduce the mechanical properties and surface quality of rolled Mg alloy foils [2]. Therefore, it is very important to ensure the stability of rolling temperature and the uniformity of temperature distribution to realize the continuous production and production safety of magnesium alloy rolling. The optimum rolling temperature is generally controlled at 225~400 °C. Some special rolling processes can obtain excellent rolling capacity and mechanical properties, including asymmetric rolling [3], limited width rolling [4], electroplastic rolling, equal channel angular pressing rolling, and so on. At present, electroplastic rolling is an important auxiliary process to effectively improve the rolling capacity of a magnesium alloy. The continuous rolling of magnesium alloy foils at low temperature (room temperature) is realized using the pure electroplastic effect and thermal effect, which are the key technologies to realize high-efficiency continuous production of special alloy foil and strips and have a wide range of industrial application prospects.
In the electroplastic rolling process of magnesium alloys, the pure electric effect and Joule thermal effect are coordinated to realize the deformation and plasticizing of magnesium alloys, and the Joule thermal effect cannot be ignored. Kuang et al. [5] compared the microstructure and surface quality after electroplastic rolling and isothermal rolling, indicating that there is a pure electroplastic effect under specific temperature conditions to improve the rolling capacity of magnesium alloys. At present, the electric pulse heating rolling process mainly includes online heating rolling and continuous electroplastic rolling. Liu et al. [1], according to the characteristics of rapidity and uniformity of electric heating, significantly improved the surface quality of magnesium alloys after rolling in the online heating rolling process. By adjusting the rolling temperature [6] and the front and back tension [7], the surface quality and comprehensive mechanical properties of the strip were greatly improved [8]. Although the online heating rolling process of magnesium alloys has high heating efficiency, it cannot carry out continuous high-efficiency coil rolling. Online heating only needs to use the contact temperature measurement and control system to meet the experimental requirements.
Continuous electric pulse rolling is considered a continuous and efficient rolling process for refractory materials. The research by Yang [9] and Xu [10,11] mainly focuses on the introduction of pulse current in the rolling process, loading a constant pulse current to ensure the stability of the temperature at the entrance of the rolling mill. Generally, the finite element method and finite difference method are used to calculate the rolling temperature field, while the electroplastic rolling model needs to introduce the electric field module. The electric field solver of commercial finite element software (ABAQUS) is solved by implicit iteration, and the calculation period is 5~7 days. Therefore, the finite element simulation of multi-scale and large-scale electroplastic rolling puts forward extremely high requirements on the calculation force, and the finite difference method after reducing the dimension can meet the needs of engineering and experiment. Chai et al. [12], based on the one-dimensional heat conduction theory, established a dynamic temperature field difference model with the change in process and used the actual data to modify the mathematical model, which improved the accuracy of online temperature calculation by 30.6%. Wu et al. [13] also established a temperature field model based on the difference method, and a fully coupled finite element model of temperature, phase transition, and strain was established by coupling. The calculation time is greatly reduced, and the calculation accuracy is guaranteed. Jiang et al. [14] showed that the target temperature could be reached in 8 s by electric pulse heating, and a one-dimensional temperature field model was established according to the electric rolling process, which was in good agreement with the actual measured contact. Obviously, there is a significant temperature gradient along the rolling direction in the electroplastic rolling process. Previous studies have shown that there are differences in the transverse distribution of temperature and current density during the loading process of magnesium alloys with a width of 130 mm, but they are evenly distributed along the rolling direction [15]. The high thermal conductivity of magnesium alloys leads to heat loss in the rolling process of magnesium alloy strips. Therefore, the heat transfers and heat loss in the thickness direction and rolling direction need to be considered in the electroplastic rolling of magnesium alloys. The heat production from the electrical contact between the strip roll and the strip guide roller has always been the key evaluation index of the stable current transmission, especially under the condition of high current.
Therefore, a three-dimensional temperature field model of magnesium foil non-annealing electric rolling (NAER) coupled with the temperature rise of the guide roller was established using the finite difference method. The model thoroughly took into account the mechanism of Joule heat influence on the NAER process and the boundary heat transfer conditions. The AZ31 foil of the NAER was divided into a guide roller contact zone, a transition zone, and a rolling deformation zone for temperature field modeling analysis.

2. The NAER Coupled Temperature Field Model

2.1. Basic Assumptions and Meshing

(1)
The material is isotropic and homogeneous, and the material density is constant.
(2)
During the rolling process, the contact resistance between the guide roller and the foil is constant.
(3)
The current density in the guide roller contact zone and the rolling deformation zone is equal to the current density of the transition zone of Mg foils and remains unchanged along the rolling direction.
(4)
The rolling temperature and reduction rate do not affect the contact heat transfer coefficient, and the heat transfer coefficient between the roll and the magnesium foil is constant.
According to the characteristics of the rapid temperature rise of the NAER process and the symmetry of the rolling boundary conditions, the rolling pieces are meshed in the rectangular coordinate system. x i , y k , and z j (i = 0,1,…,N; j = 0,1,…,M; k = 0,1,…,W) denote the rolling direction, the transverse direction, and the thickness direction, respectively, as shown in Figure 1a. Figure 1b shows the device of the NAER, and the center dotted line is the real-time measurement position of the thermocouple.

2.2. Temperature Field Model

According to the temperature rise process of the Mg foil of NAER, a three-dimensional temperature field model was established for magnesium foil, and a two-dimensional temperature field model was established for the roll and guide roller.
{ T m t = λ m 2 T m + q mv ρ m c m ρ r c r T r t = λ r ( 2 T r r 2 + 1 r T r r + 2 T r y 2 ) + q rv
where ρ m and ρ r are the ribbon density of the Mg foil and roll, respectively, and c m and c r are the constant pressure heat capacity of the Mg foil and roll, respectively. λ m and λ r are the thermal conductivity of the Mg foil and roll, respectively. T m and T r are the node temperature of the Mg foil and roll, respectively. t is time. q mv and q rv are the heat source in the Mg foil and roll, respectively. The composition of the internal heat source is determined according to the area division of the electro-rolling process. r and y are the radial direction and transverse direction of the roll, respectively.
Figure 1b shows that according to the change in contact conditions during the NAER process, the temperature rise of the electric pulse is divided into three stages: in the guide roller contact zone ①, the calculation formula of the Mg foil heat source is
q mv = q e + q c , q e = J e 2 R m , q c = J e 2 R con / h 0
where q e is the Joule heat source, R m is electrical resistivity, J e is the RMS current density in the deformation zone, q c is the electric contact heat source, R con is the contact resistance, B is the width of the roll and foil contact zone, and h 0 is the foil inlet thickness. The electric contact heat is used as the off-site heat source to calculate the temperature of the guide roller, and the heat flow is equally distributed to the guide roller and the Mg foil, q rv = q e + q c .
The empirical formula for the calculation of contact resistivity is
R con = K con 0.102 σ con m
where R con is the contact resistivity, K con is the correlation coefficient with the surface condition of the contact material, σ con is the surface contact pressure, and m is the correlation index with contact form, pressure range, and other factors (rolling contact pressure is large for surface contact, take m = 1 ). T con T r is the temperature rise of the guide roller, which is linear with J con 2 l con / ( c m ρ m h 0 v r ) . K con can be regressed using the temperature rise of the guide roller measured experimentally. T con is outlet temperature of the guide roller, T r is room temperature, J con is the RMS contact current density, l con is the contact arc length between the guide roller and magnesium strip, l con = 0.1   mm , and v r is the rolling speed. The contact resistance between the guide roller and magnesium foil ( K con = K gr s = 0.018 ) is determined according to the temperature rise of the guide roller outlet in this experiment, as shown in Figure 2.
The heat generated in the transition zone ② only includes the Joule heat of the material itself, and the heat source calculation formula is q mv = q e .
In the deformation zone ③, the heat source calculation formula is
{ q mv = q e + q c + q f + q d q d = η d σ s ln ( h 0 / h 1 ) v r / 3 R ( h 0 h 1 ) q f = 2 η f μ σ s v r ln ( h 0 / h 1 ) / ( h 0 + h 1 )
where q d is the deformation heat, η d is the deformation heat equivalent (0.7~0.9, take 0.9), σ s is the yield stress of the Mg foil, R is the roll radius, h 1 is the foil outlet thickness, q f is the frictional heat, η f is the frictional heat equivalent, η f = 0.8 , μ is the contact friction coefficient, μ = 0.1 , and l is the flattening contact arc length between the roll and the foil. Friction heat and electric contact heat are used as off-site heat sources to calculate the temperature of the guide roller, and the heat flow is evenly distributed to the guide roller and Mg foil, q rv = q f + q c .
The yield stress is obtained by the regression of the measured rolling force using the Stone unit rolling force calculation formula and the Hitchcock flattening contact arc length [16] calculation formula. The calculation formula is
{ p ¯ = ( 1.154 σ s p ¯ t ) ( exp ( μ l h ¯ ) 1 μ l h ¯ ) l = R ( h 0 h 1 ) + [ 8 R ( 1 ν 2 ) π E p ¯ ] 2 + 8 R ( 1 ν 2 ) π E p ¯
where σ s is yield strength, p ¯ t is the average tensile stress, h ¯ is the average thickness of the Mg foil in the deformation zone, ν is Poisson‘s ratio of the roll, ν = 0.3 , and E is the elastic modulus of the roll.
The correlation coefficient of the contact material surface state between the roll and magnesium foil needs to be fitted again according to Formula (3). The contact resistance-contact pressure curves obtained from high-temperature compression experiments without lubrication are shown in Figure 3. The contact material is magnesium–steel and the temperature is 150~250 °C. In order to improve the stability of NAER, experimental rolling generally does not add any lubricant. The contact pressure should be determined according to Formula (5). The correlation coefficient of the contact material surface state between the roll and Mg foil is determined by the experiment, K con = K r s = 3.28 .

2.3. Boundary Conditions

According to the Joule heat temperature rise mechanism of the Mg foil in the NAER process, the NAER temperature field is divided into three parts: the deformer contact zone, transition zone, and rolling deformation zone, as shown in Figure 1a. The following describes the boundary conditions of the deformer contact zone, transition zone, and rolling deformation zone, respectively. (1) In the guide roller contact zone, considering that the electric contact heat between the roll and the foil mainly occurs on the contact surface, the electric contact heat between the guide roller and the foil is taken as the external heat source of the foil and acts on the surface joint of the Mg foil and the guide roller. Because the contact area between the guide roller and the Mg foil is small and the temperature difference is not large, the contact heat transfer between the guide roller and the Mg foil is ignored. (2) In the transition zone, Joule heat is the only internal heat source, and only the upper and lower surfaces of Mg foils are in contact with air heat transfer. Therefore, the upper and lower surface nodes of Mg foil in the transition zone are set as the boundary condition of air heat transfer, and the heat transfer coefficient is constant at 40 W/(m2·°C). (3) In the rolling deformation zone, Joule heat, deformation heat, surface friction heat, and electric contact heat are included. There is a large contact area between the roll and Mg foil. Therefore, the upper and lower surface nodes of the Mg foil are considered under the heat transfer conditions of the roll, and the contact heat transfer coefficient between the roll and the Mg foils is constant at 17,000 W/(m2·°C) [17]. Friction heat and electric contact heat are added to the surface joints of the foil as surface heat sources, the friction heat and electric contact heat are equally distributed to the Mg foil and the roll, and the roll temperature rise is calculated as an external heat source.

3. Experimental

In order to verify the accuracy of the temperature field model of Mg foils during the NAER, two groups of non-thermal rolling experiments with different thicknesses and different current densities were designed, as shown in Figure 4. Homogenization treatment is performed for the AZ31 commercial strip (300 °C, heat preservation 1 h). The surface-mounted thermocouple and thermal imaging method are used to collect the temperature rise in the rolling direction of Mg foils NAER in real time, as shown in Figure 1b. The NAER device parameters are a roll diameter of Φ95 mm, the rolling speed is 1.5 m/min, no lubrication is used in the rolling process, and the length of the transition zone is 155 mm. Two sets of schemes verify the temperature field of electric pulse rolling, including (1) the influence of different current densities on temperature rise with the same pass and (2) the effect of multi-pass NAER on temperature rise. In Scheme (1), the sample width × thickness is 40 mm × 1.0 mm and 40 mm × 0.5 mm, and the RMS current density is 7.5~34.5 A/mm2. In Scheme (2), the initial sample length × width × thickness is 500 mm × 40 mm × 1.0 mm for multi-pass rolling. The rolling procedures are shown in Table 1. The initial surface and strip temperatures of the roll and guide roller are 25 °C, and the ambient temperature is 25 °C.
The temperature ranges of electroplastic rolling are between 25 °C and 400 °C. The specific heat capacity and thermal conductivity only consider the influence of temperature, regardless of the influence of frequency and peak current on physical parameters. The physical parameters of the AZ31 alloy are shown in Table 2.

4. Example Verification

4.1. Temperature Field Simulation of the NAER

In order to verify the accuracy of the coupled temperature field model of NAER for Mg foils, the temperature field of Mg foils during NAER is simulated in both multi-pass and single pass. Figure 5 shows the temperature curves obtained by the NAER for Mg foils with a 40 mm width, 0.5 mm thickness, and 1.0 mm at different current densities. Solid dots are experimental temperature values, and thin solid lines are simulated NAER temperature field model values. From the experimental temperature data, it can be seen that there is an obvious temperature rise of magnesium foils passing through the conductive roller, and the temperature rise increases with the increase in current density and the decrease in thickness. The temperature rise caused by electrical contact Joule heat can be well predicted using the calibrated empirical formula NAER temperature field model. Contact resistance is mainly caused by incomplete contact between two conductors with rugged surfaces. According to the Joule heat formula, heat generation is proportional to the square of the current density. Therefore, electric contact heat cannot be neglected in high currents during the NAER process. The Joule heat produced by the internal resistance increases rapidly in the transition zone. Both experimental temperature and calculated temperatures show that there is a clear peak temperature T p just before the inlet of the mill. Due to the contact heat transfer between the Mg foil and the roll in the deformation zone, the rolling direction heat conduction makes a small temperature drop in the mill inlet during stable rolling. When the Mg foil passes through the deformation zone, the deformation zone is between two dotted lines due to intense heat exchange between the roll temperature of 30 °C and the Mg foil of 200 °C, leading to the temperature of the mill outlet T out to highly decrease. The higher the inlet peak temperature, the more obvious the outlet temperature drop.
In order to observe the effect of current density and reduction rate on the temperature field of the Mg foil by the NAER process. The peak temperature and outlet temperature of 1.0 mm thick Mg foil under different current densities and different reduction rates were simulated. Figure 6 shows that peak temperature increases as a quadratic function, apparently with increasing current density, and Joule heating dominates in the transition zone according to the Joule heating formula. Meanwhile, reduction has little effect on the peak temperature. The outlet temperature is an important parameter for calculating the average deformation temperature of the deformation zone, and a higher outlet temperature is very beneficial to the uniformity of the rolling deformation of the Mg foil. From the calculated outlet temperature, it can be seen that the outlet temperature increases significantly with the increase in current density, but the increased amplitude is clearly smaller than the peak temperature. Based on the curves of the effect of the reduction rate and current density on the outlet temperature of the Mg foil, it can be seen that the outlet temperature does not increase monotonically with the reduction rate. It may be that the change in the reduction rate in the deformation zone causes a shift in the proportion of different temperature rise mechanisms in the deformation zone, including magnesium foil Joule heat, deformation heat, friction heat, and electric contact heat. Therefore, it is necessary to analyze the influence of reduction rate on the temperature rise mechanism and the dominant mechanism of temperature rise in the deformation zone.
In order to clearly see the effect of the reduction rate on the temperature rise mechanism in the deformation zone, the NAER temperature field model was used to calculate temperature rise caused by Joule heat, deformation heat, friction heat, and electric contact heat accumulation in the rolling deformation zone with 1 mm thick aluminum foil under different rolling reduction rates at a current density of 30 A/mm2. Figure 7 shows that with the increase in the reduction rate, the temperature rise caused by total heat in the rolling deformation zone increases, among which the temperature rise of various heat sources increases in different degrees. The temperature rise of Joule heat increases from 15.5 °C to 31.0 °C, the temperature rise of deformation heat increases from 13.5 °C to 65.4 °C, and the friction heat increases from 3.8 °C to 43.4 °C. It can be seen in Formula (4) that h0/h1 increases with the increase in the reduction rate, which will inevitably cause a higher temperature rise of deformation heat. Similarly, with the increase in the reduction rate, the average rolling force increases according to Formula (5), and the contact arc length increases, resulting in more friction heat work between the roll and magnesium foil. Therefore, the temperature rises due to deformation heat and friction heat in the deformation zone increase significantly with the reduction rate.
Electrical contact heat is Joule heat generated by contact resistance. However, in the rolling deformation zone, the electrical contact heat accounts for only 5.0% of the total heat in the deformation zone with a reduction rate of 0.4. It can be seen that the contribution of electric contact heat to the heat generation in the deformation zone is the least, especially in the calculation of electric rolling with small thickness and high pressure. However, this did not mean that the electrical contact heat could be ignored as the rolling thickness continued to decrease. There were two main reasons: (1) the current required to reduce the thickness increased, which increased the Joule heat and electrical contact heat of the material itself. (2) After adding the grease, it may cause the electrical contact heat to increase with increased contact resistance. Therefore, from the point of view of electrical contact heat, it is extremely important to ensure the contact stability of the rolling deformation zone for the realization of the NAER stability of Mg foil.
In order to see the effect of the rolling thickness on the peak temperature and the outlet temperature, the temperature field of the NAER with a thickness of 0.1 mm to 1.0 mm was simulated at the same reduction rate of 20%. Figure 8a,b show that under the same RMS current density, the inlet peak temperature and the outlet temperature decrease significantly with the thickness of the inlet. The main reason is that the thickness of the inlet decreases, which increases the proportion of heat loss in the transition zone. Therefore, a larger current density is required for the AZ31 foil of NAER to ensure a constant inlet temperature during the NAER process of the AZ31 alloy.
In order to observe the effect of thickness on temperature rise in the deformation zone, the NAER temperature field model was used to calculate temperature rise caused by Joule heat, deformation heat, friction heat, and electric contact heat accumulation in the deformation zone of magnesium foil with a thickness of 0.1~1.0 mm under a current density of 30 A/mm2 and a reduction rate of 20%. Figure 9 shows that with the decrease in inlet thickness, the fraction of the Joule heat temperature rise in the deformation zone of the sample decreases from 40.2% to 8.9%, and the fraction of the friction heat increases gradually. It can be seen that the temperature rise of the rolling deformation zone mainly comes from deformation heat and friction heat, and the influence of the Joule heat (self-resistance heat + electric contact heat) can be nearly ignored with the decrease in foil thickness. During the NAER, the temperature loss due to heat transfer from the low-temperature roll contact should be taken into account to ensure that the temperature in the deformation zone is stable and within the rolling temperature range. Therefore, it is necessary to conduct temperature compensation operations on the roll to improve the rollability and rolling stability of Mg foils in the NAER process. From the research by Li et al. [19] and Liao et al. [20], it can be seen that the surface quality of Mg foils can be effectively improved by the roll temperature compensation operation.

4.2. Accuracy Evaluation of the Temperature Field Model

It can be seen in Figure 10a,b that the established temperature field model of the NAER can predict the peak temperature and the outlet temperature of the transition zone of the AZ31 foil NAER. The average relative error is 7.1% and the maximum is 23.0%. The model was evaluated to have a high prediction accuracy for the peak temperature in the transition zone. The roll temperature and the guide roller temperature of the multi-pass Mg foil of the NAER are measured as 27 °C and 31 °C, respectively.

4.3. Microstructure

Figure 11 shows the relation of the Vickers hardness of the transition zone to time and the temperature field of the fourth pass NAER. Combined with the temperature rise curves and microhardness curves, the hardness decreases up to 200 °C, which is considered to be the beginning of the recrystallization of the wrought Mg alloy. At the same time, the hardness is stabilized within several seconds, and the complete disappearance of the shear band is considered to be complete recrystallization through the OM. It is considered that the recrystallization temperature and the recrystallization completion temperature in the transition zone of the NAER may be closely related to the nucleation incubation time and the temperature rise rate. The NAER process is influenced by the electroplastic effect and the thermal effect, and the wrought Mg alloy is completely recrystallized before entering the rolling deformation zone. The temperature rise rate and peak temperature are the main factors affecting the recrystallization, and the rolling speed and the electric pulse parameters need to be reasonably controlled so that recrystallization can occur and accelerate at a lower temperature and the continuous rollability of the Mg foil can be improved. The recrystallization finish at lower temperatures effectively prevents grain overgrowth.
Figure 12a–c show the IPF diagrams of the inlet of the rolling deformation zone of the AZ31 foil NAER when the current density is 25.0 A/mm2, 28.5 A/mm2, and 32.1 A/mm2, respectively. It showed that the shear band at the entrance had completely disappeared, forming a fine equiaxed crystal structure. Figure 12a shows that the average grain size is 2.51 μm at the inlet of the deformation zone with a current density of 25.0 A/mm2, surrounded by small-sized grains that are formed and crystallized by the large-grain shear band, and the distribution is extremely uneven. The inlet recrystallization is also complete at a current density of 28.5 A/mm2 and 32.1 A/mm2, and the average grain size is 4.61 μm and 16.5 μm, respectively. At the same time, the GOS analysis shows that the recrystallization is complete when the current density is less than 1. Most of the grains are completely recrystallized at a current density of 25.0 A/mm2, 28.5 A/mm2, and 32.1 A/mm2, and the recrystallization fraction is 70.4%, 83.4%, and 93%, respectively. However, there are a lot of necklace-shaped recrystallized grains at that current density of 25.0 A/mm2, which is obviously in the initial stage of discontinuous recrystallization. It can be seen that the inlet peak temperature has a great influence on the inlet grain size. The results show that the equiaxed grain structure with a grain size of less than 7 μm can obtain good mechanical properties. It is obvious that high current density and high inlet temperature rise will cause excessive grain growth, which is unfavorable to rolling deformation and easily induces stress concentration and microcracks.
Figure 12b shows that there is a strong base plane texture at the mill inlet of the current density of 25.0 A/mm2 and 32.1 A/mm2, but at the current density of 28.5 A/mm2, the base plane texture is clearly weakened, and an obvious texture weakening inflection point appears. In order to analyze the cause of texture weakening, the ungrown grains with a grain size of less than 2 μm were extracted to calculate the texture strength to be 9.2, as shown in Figure 13. It was obvious that the crystallization texture of the shear band was weakened significantly. As the grain continued to grow, the crystallization of the grain would significantly reduce the overall texture strength, as shown in Figure 12b. However, the grain boundary of the large grains of the base texture will expand faster as the temperature rise at the entrance continues to increase, and these weak texture grains may be annihilated, thus reflecting the strong texture [21]. Weakening texture and grain refinement are key technologies to improve the ultimate plastic deformation of Mg alloys. In summary, the evolution of the texture and the growth rate of the recrystallization must be closely controlled in order to realize a large reduction rolling of AZ31 foils at room temperature/low temperatures.
The NAER temperature field model was used to set the pulse current at the mill entrance based on the target temperature. The AZ31 foil with current density calculated by the temperature field model of NAER has good surface quality after final rolling, no edge crack and foil breakage, and the precise control of rolling temperature can improve the stability of the NAER. However, using the conventional temperature field model [14] prediction would set a much larger effective current value, which would eventually lead to the melting of the AZ31 foil.

5. Conclusions

(1)
A coupled temperature field model of the NAER was established by considering the mill device and electrification process, and the Joule heat, deformation heat, and friction heat in the NAER process were accurately considered. The NAER temperature field model could accurately predict the peak temperature at the inlet and the outlet temperature of the multi-pass NAER of different thicknesses and different current densities. The average relative error of the prediction was about 7.1%, and the maximum relative error was about 23.0%.
(2)
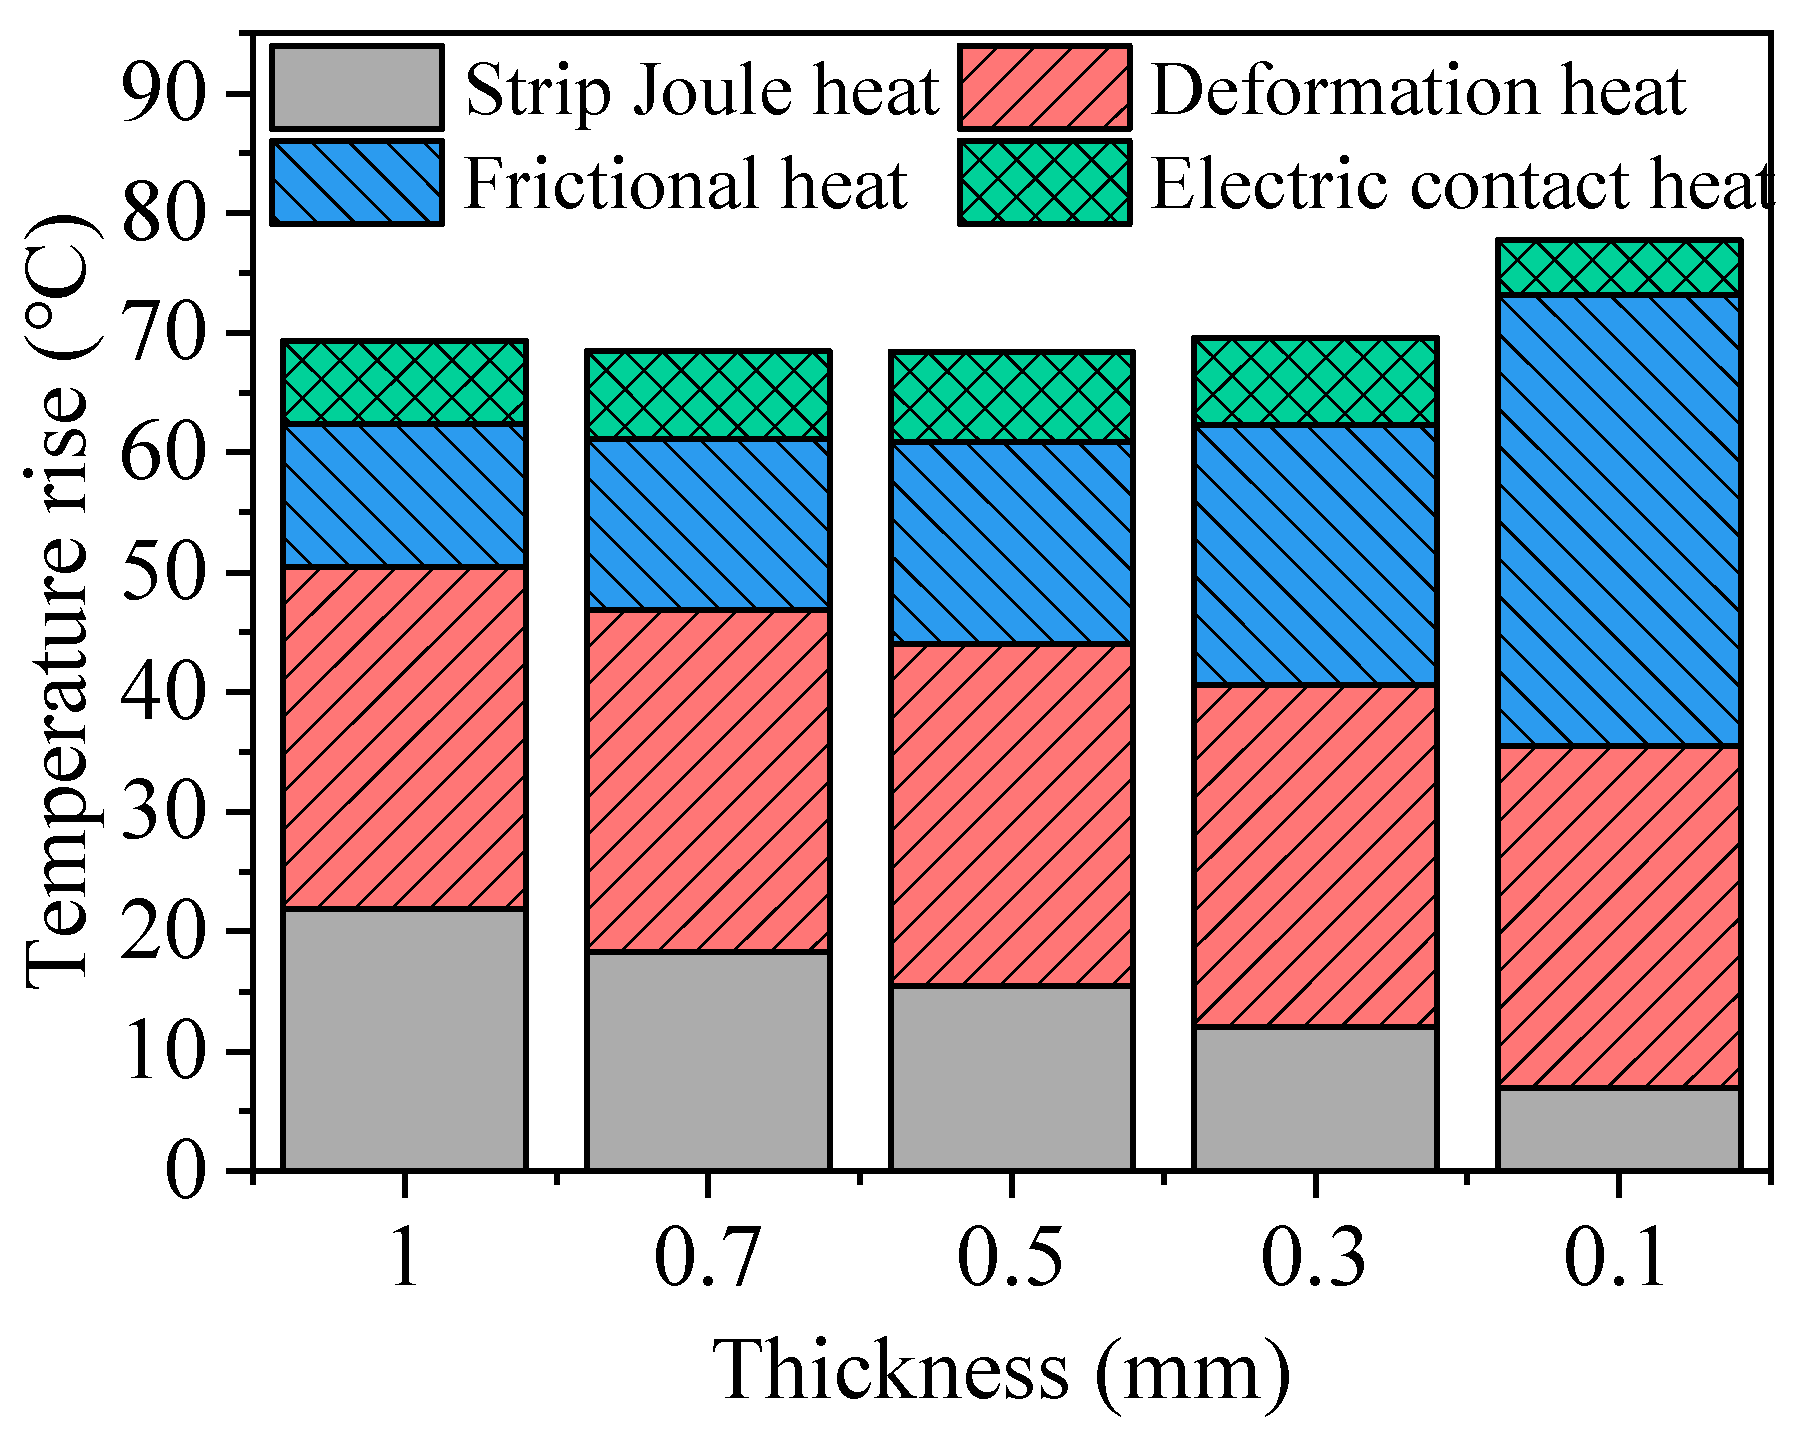
A thorough analysis of the effect of dynamical boundary conditions on the transient temperature in the transition zone and deformation zone of the AZ31 foil in the presence of a loaded pulse current is presented, taking into account the particularities of the NAER heat source and heat exchange mechanism. Both the experimental results and the simulation results show that the temperature in the deformation zone decreases significantly with the decrease in inlet thickness. Compared with the temperature rise of deformation heat, friction heat, and Joule heat in the deformation zone, the influence of Joule heat (the material of Joule heat and electric contact heat) on the temperature rise of the deformation zone is gradually reduced to 8.9%, and the influence of Joule heat on the temperature rise of the deformation zone can be almost ignored. Therefore, the current parameters must be calculated accurately according to the NAER temperature field model to ensure the stability of temperature in the deformation zone.
(3)
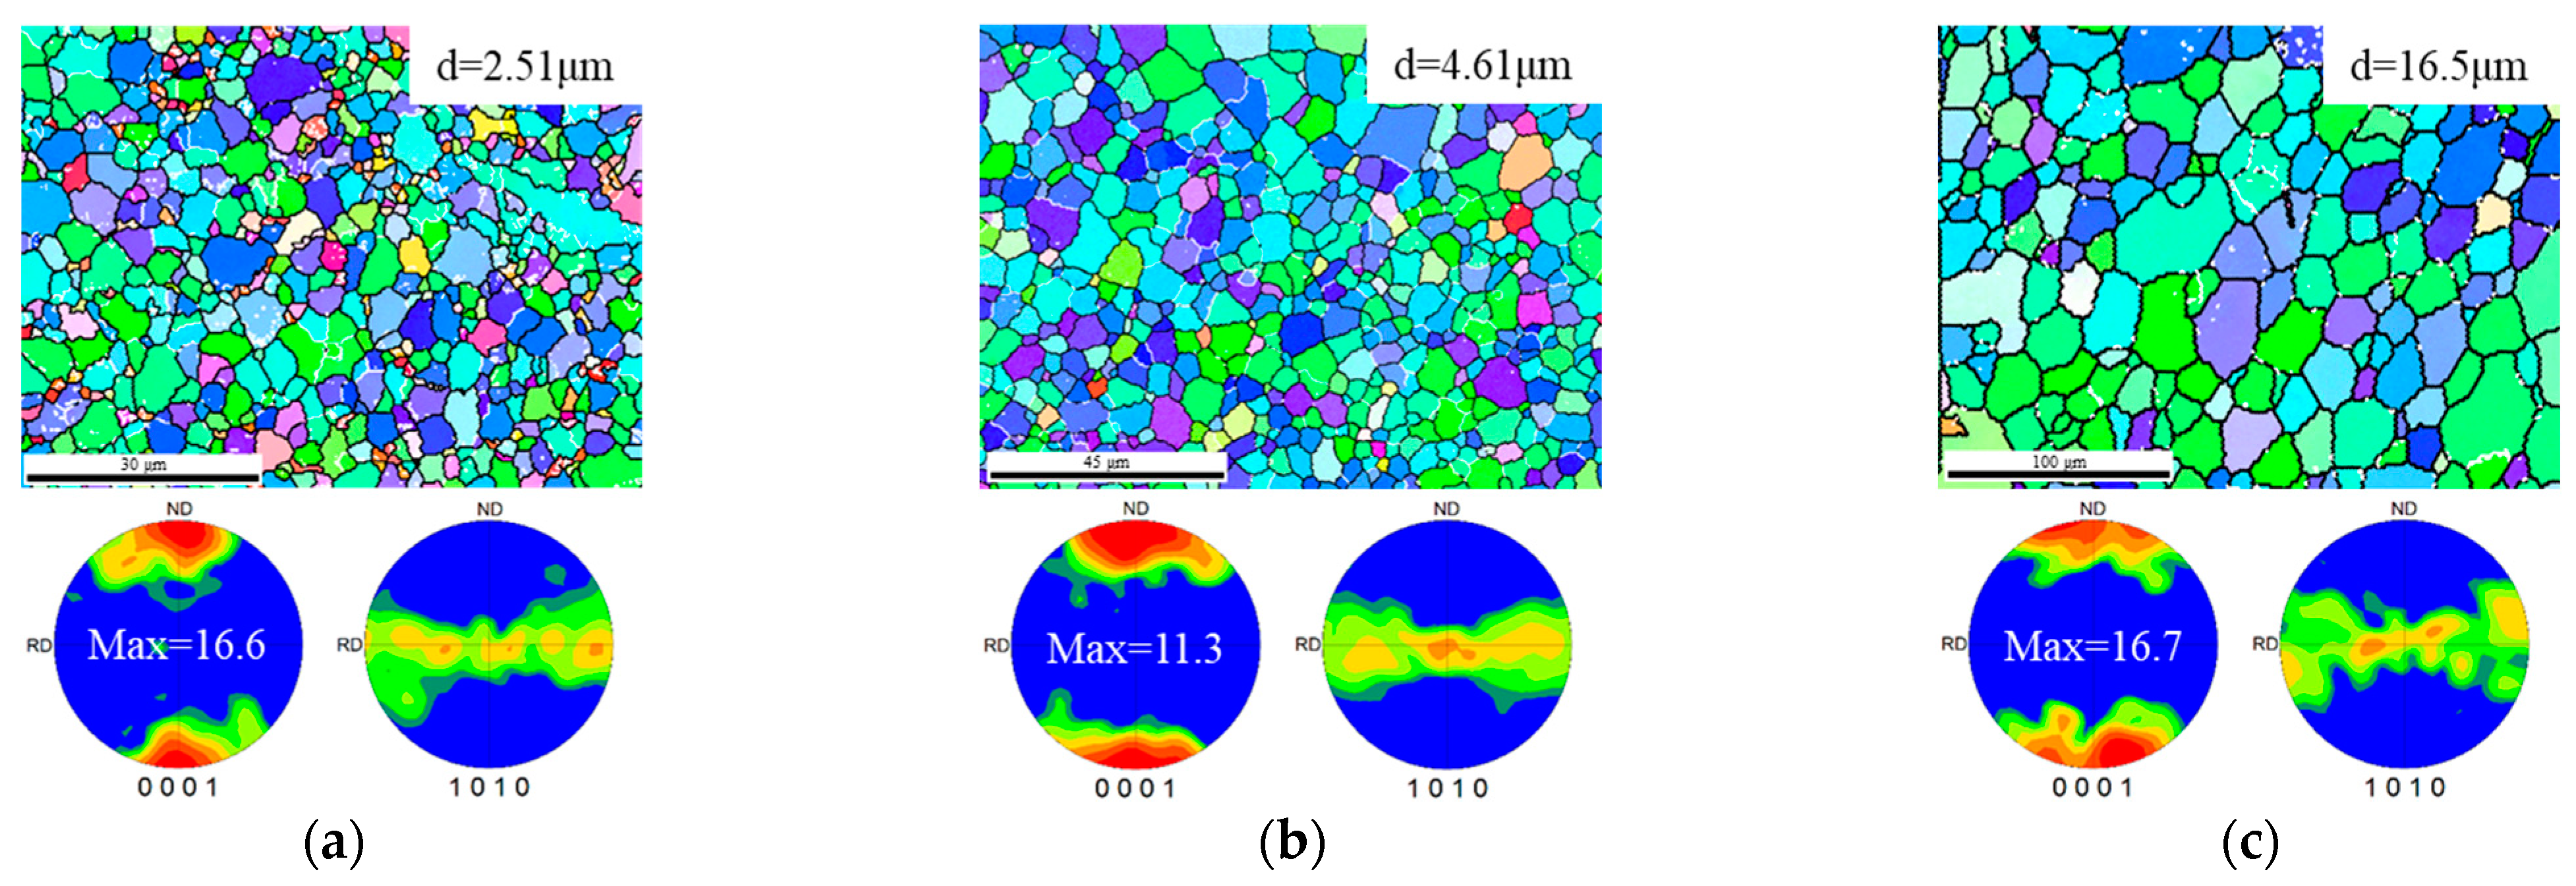
Combining the simulation of the AZ31 foil temperature field with the experimental results of the NAER showed that the electric pulse rolling temperature field model could accurately set the rolling entrance temperature, ensuring that there would be no high-temperature melting and low-temperature brittle fracture and greatly improving the surface quality of the rolled Mg foils. The microstructural analysis showed that the wrought Mg alloy initial recrystallization at 200 °C and the texture strength of the alloy turned into a turning point at the entrance temperature of 200~320 °C. In particular, at a current density of 28.5 A/mm2, the grain size is 4.61 μm and the texture intensity is 11.3 at the inlet of the mill.

Author Contributions

Conceptualization, G.L., L.Y. and D.W.; methodology, G.L.; software, G.L. and J.Y.; validation, G.L., H.L. and T.S.; formal analysis, G.L. and J.Y.; investigation, G.L.; resources, L.Y.; data curation, G.L., H.L. and T.S.; writing—original draft preparation, G.L. and J.Y.; writing—review and editing, G.L. and L.Y.; visualization, G.L. and D.W.; supervision, G.L.; project administration, G.L. and D.W. All authors have read and agreed to the published version of the manuscript.

Funding

This research was funded by the Returned Overseas Scholar Foundation of Hebei Province (Grant No. C20210321), the Natural Science Foundation of Hebei Province (Grant No. E2021203106), the Basic Innovation Research and Cultivation Project of Yanshan University (Grant No. 2022BZZD008), and the S&T Program of Hebei (Grant No. 236Z1019G).

Data Availability Statement

The data that support the findings of this study are available from the corresponding author, Lipo Yang and Gengliang Liu, upon reasonable request.

Conflicts of Interest

The authors declare that they have no known competing financial interests or personal relationships that could have appeared to influence the work reported in this paper.

References

  1. Liu, Q.; Liu, Y.; Luo, Q.; Song, J.; Xiao, B.; Jiang, B.; Wu, L.; Zhao, H.; Shen, Q.; Pan, F. Ameliorating the edge cracking behavior of Mg-Mn-Al alloy sheets prepared by multi-pass online heating rolling. J. Manuf. Process. 2023, 85, 977–986. [Google Scholar] [CrossRef]
  2. Chen, Q.; Chen, R.; Su, J.; He, Q.; Tan, B.; Xu, C.; Huang, X.; Dai, Q.; Lu, J. The mechanisms of grain growth of Mg alloys: A review. J. Magnes. Alloys 2022, 10, 2384–2397. [Google Scholar] [CrossRef]
  3. Ren, X.; Huang, Y.; Zhang, X.; Li, H.; Zhao, Y. Influence of shear deformation during asymmetric rolling on the microstructure, texture, and mechanical properties of the AZ31B magnesium alloy sheet. Mater. Sci. Eng. A-Struct. Mater. Prop. Microstruct. Process. 2021, 800, 140306. [Google Scholar] [CrossRef]
  4. Tian, J.; Lu, H.; Zhang, W.; Nie, H.; Shi, Q.; Deng, J.; Liang, W.; Wang, L. An effective rolling process of magnesium alloys for suppressing edge cracks: Width-limited rolling. J. Magnes. Alloys 2022, 10, 2193–2207. [Google Scholar] [CrossRef]
  5. Kuang, J.; Li, X.; Zhang, R.; Ye, Y.; Luo, A.A.; Tang, G. Enhanced rollability of Mg-3Al-1Zn alloy by pulsed electric current: A comparative study. Mater. Des. 2016, 100, 204–216. [Google Scholar] [CrossRef]
  6. Liu, Q.; Song, J.; Zhao, H.; Xiao, B.; Zheng, X.; Pan, F. Improved edge quality for AZ31 sheets using online heating rolling technique. J. Mater. Eng. Perform. 2020, 29, 4212–4221. [Google Scholar] [CrossRef]
  7. Huang, Y.; Xiao, B.; Song, J.; Zhao, H.; Liu, Q.; Jiang, B.; Pan, F. Effect of tension on edge crack of on-line heating rolled AZ31B magnesium alloy sheet. J. Mater. Res. Technol.-JmrT 2020, 9, 1988–1997. [Google Scholar] [CrossRef]
  8. Liu, Q.; Song, J.; Pan, F.; She, J.; Zhang, S.; Peng, P. The edge crack, texture evolution, and mechanical properties of Mg-1Al-1Sn-Mn alloy sheets prepared using on-line heating rolling. Metals 2018, 8, 860. [Google Scholar] [CrossRef]
  9. Yang, L.; Zhang, H.; Liu, G. Performance analysis of wide magnesium alloy foil rolled by multi-pass electric plastic rolling. Met. Mater. Int. 2023, 29, 2783–2794. [Google Scholar] [CrossRef]
  10. Xu, Z.; Tang, G.; Tian, S.; Ding, F.; Tian, H. Research of electroplastic rolling of AZ31 Mg alloy strip. J. Mater. Process. Technol. 2006, 182, 128–133. [Google Scholar] [CrossRef]
  11. Wang, R.; Xu, Z.; Jiang, Y.; Tang, G.; Wan, J.; Li, Q. Design high-performance AZ31 ultrathin strip through multi-pass electroplastic rolling without off-line annealing. Mater. Sci. Eng. A-Struct. Mater. Prop. Microstruct. Process. 2023, 862, 144510. [Google Scholar] [CrossRef]
  12. Chai, X.; Li, H.; Zhang, J.; Zhou, Y.; Ma, H.; Zhang, P.; Tian, J. A highly adaptable temperature field calculation model for work roll in hot tandem rolling. J. Plast. Eng. 2017, 24, 36–41. [Google Scholar]
  13. Wu, H.; Sun, J.; Lu, X.; Peng, W.; Wang, Q.; Zhang, D. Predicting stress and flatness in hot-rolled strips during run-out table cooling. J. Manuf. Process. 2022, 84, 815–831. [Google Scholar] [CrossRef]
  14. Jiang, Y.; Tang, G.; Shek, C.; Xie, J.; Xu, Z.; Zhang, Z. Mechanism of electropulsing induced recrystallization in a cold-rolled Mg-9Al-1Zn alloy. J. Alloys Compd. 2012, 536, 94–105. [Google Scholar] [CrossRef]
  15. Liu, G.; Yang, L.; Zhang, H. The electric-thermal uneven characteristics simulation of wide Mg alloy strip and electroplastic rolling experiment. Appl. Sci. 2023, 13, 2772. [Google Scholar] [CrossRef]
  16. Liu, X.; Fu, L.; Lu, Y.; Wang, T.; Xiao, H. Theory and numerical simulation of minimum rolling thickness for thin strip rolling. Iron Steel 2021, 56, 87–95. [Google Scholar]
  17. Yang, L.; Liu, S.; Liu, G. Dynamic contact heat transfer mechanism of magnesium alloy strip by rolling process simulation. Rare Met. Mater. Eng. 2023, 52, 890–898. [Google Scholar]
  18. Wang, X.; Xu, J.; Shan, D.; Guo, B.; Cao, J. Modeling of thermal and mechanical behavior of a magnesium alloy AZ31 during electrically-assisted micro-tension. Int. J. Plast. 2016, 85, 230–257. [Google Scholar] [CrossRef]
  19. Li, Y.; Ma, L.; Jiang, Z.; Huang, Z.; Lin, J.; Ji, Y. Numerical simulation and experimental verification of temperature field in medium plate rolling of AZ31 magnesium alloy. Rare Met. Mater. Eng. 2019, 48, 2185–2192. [Google Scholar]
  20. Liao, H.; Tang, G.; Jiang, Y.; Xu, Q.; Sun, S.; Liu, J. Effect of thermo-electropulsing rolling on mechanical properties and microstructure of AZ31 magnesium alloy. Mater. Sci. Eng. A-Struct. Mater. Prop. Microstruct. Process. 2011, 529, 138–142. [Google Scholar] [CrossRef]
  21. Guan, D.; Rainforth, W.M.; Ma, L.; Wynne, B.; Gao, J. Twin recrystallization mechanisms and exceptional contribution to texture evolution during annealing in a magnesium alloy. Acta Mater. 2017, 126, 132–144. [Google Scholar] [CrossRef]
Figure 1. Temperature field difference model of the NAER: (a) temperature field model meshing; (b) device of the NAER.
Metals 14 00343 g001
Figure 2. Contact resistance coefficient of the guide roller.
Metals 14 00343 g002
Figure 3. Contact resistance measurement and fitting curve.
Metals 14 00343 g003
Figure 4. Experimental steps of the NAER.
Metals 14 00343 g004
Figure 5. Calculated and experimental temperature values of Mg foils during the NAER: (a) 1.0 mm; (b) 0.5 mm.
Metals 14 00343 g005
Figure 6. Peak temperature and exit temperature–current curve of the Mg foil of the NAER temperature field simulation under different reduction rates.
Metals 14 00343 g006
Figure 7. The temperature rises in the deformation zone of Mg foils during the NAER with different reduction rates.
Metals 14 00343 g007
Figure 8. The temperature field calculated with Mg foils by NAER with different thicknesses: (a) peak temperature; (b) outlet temperature.
Metals 14 00343 g008
Figure 9. The temperature rises in the deformation zone of Mg foils during the NAER with different thicknesses.
Metals 14 00343 g009
Figure 10. The temperature measured and calculated values of Mg foils by the NAER: (a) the transition zone temperature field in experiment 1; (b) inlet and outlet temperatures of the mill in experiment 2.
Metals 14 00343 g010
Figure 11. Microhardness–time and temperature–time curves of Mg foils of the NARE.
Metals 14 00343 g011
Figure 12. IPF and (0001) PF for Mg foils at the mill inlet at (a) 25.0 A/mm2; (b) 28.5 A/mm2; (c) 32.1 A/mm2.
Metals 14 00343 g012
Figure 13. IPF and (0001) pole figures of a grain size of less than 2 μm at the mill inlet at 25.0 A/mm2.
Metals 14 00343 g013
Table 1. Continuous electroplastic rolling schedule.
Rolling PassRMS Current Density
Je/(A/mm2)
Inlet Thickness
h0/mm
Outlet Thickness
h1/mm
Rolling Force/kN
121.71.0500.9056.24
224.00.9010.7762.05
328.50.7720.6277.7
4-125.00.6010.51270.5
4-228.50.5990.49165.4
4-332.10.6010.47260.2
Table 2. Physical parameters of the AZ31 alloy adapted from [18].
Mass Density
ρm/kg·m−3
Electrical Resistivity
Rm/nΩ·m
Temperature
Tm/°C
Specific Heat Capacity
cm/J·kg−1·°C−1
Thermal Conductivity
km/W·m−1·°C−1
1.754 × 10391.40525100584.7
100103290.5
200104995.8
300106998.4
400109298.6
Disclaimer/Publisher’s Note: The statements, opinions and data contained in all publications are solely those of the individual author(s) and contributor(s) and not of MDPI and/or the editor(s). MDPI and/or the editor(s) disclaim responsibility for any injury to people or property resulting from any ideas, methods, instructions or products referred to in the content.

