Article

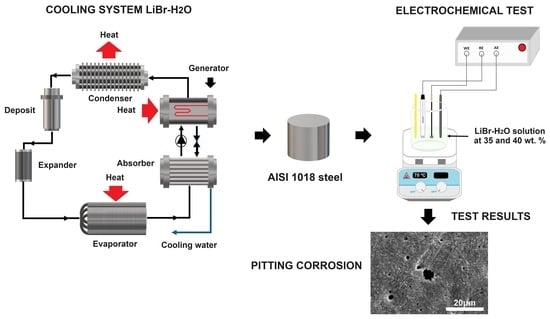
Corrosion Behavior of Carbon Steel in LiCl/H2O Mixtures

by
Modesto Avilés-Flores
1,
Ana Karen Larios-Gálvez
1,
José Martínez-González
1,
Roy Lopez-Sesenes
2,
Alfredo Brito-Franco
1,
Jesús Cerezo
1,
Francisco Christian Martinez Tejeda
1,
America Maria Ramirez-Arteaga
2 and
Jose Gonzalo Gonzalez-Rodriguez
1,*
1
CIICAp, Universidad Autonoma del Estado de Morelos, Av. Universidad 1001, Cuernavaca 62209, Mexico
2
Facultad de Ciencias Quimicas e Ingenieria, Universidad Autonoma del Estado de Morelos, Av. Universidad 1001, Cuernavaca 62209, Mexico
*
Author to whom correspondence should be addressed.
Metals 2024, 14(4), 376; https://doi.org/10.3390/met14040376
Submission received: 15 February 2024 / Revised: 15 March 2024 / Accepted: 19 March 2024 / Published: 23 March 2024

Abstract

:
The corrosion behavior of 1018 carbon steel in LiCl/H2O mixtures has been evaluated by using potentiodynamic polarization curves, electrochemical noise and electrochemical impedance spectroscopy techniques. Two different concentrations of LiCl were employed, namely 35 and 40 wt. %, and the testing temperatures included 25, 35 and 70 °C. It was found that the steel showed a passive zone; the corrosion current density value increased with an increase in the solution temperature and concentration. The pitting potential value decreased with an increase in the testing temperature and the solution concentration. The corrosion process was under charge transfer control. This mechanism was unaltered either by the solution temperature or concentration. The charge transfer resistance value decreased with an increase in both the solution temperature and concentration. A localized, pitting type of corrosion dominated the corrosion morphology at 25 and 35 °C, whereas at 70 °C, the main type of attack was a mixed type of corrosion.

Graphical Abstract

1. Introduction

Nowadays, a large number of people seek conditions of thermal comfort in their houses, offices, shopping centers, etc. Normal equipment for air-conditioning in these places includes vapor compressors and refrigeration systems (VCRS), which consume approximately 15% of the electricity produced in the whole world [1]. Thus, the energy they need for their operation comes from the use of fossil fuels, producing large amounts of greenhouse effect gases, inducing enormous environmental problems [2,3,4]. An alternative to reduce the energy consumption of the VCRS is the use of vapor absorption cooling systems (VACSs), which operate with solar, geothermal, biomass and wasted energy [5,6,7]. In addition to this, VCASs offer energetic and environmental benefits since they use natural coolants that do not produce damage to the ozone layer [8,9].
Currently, the most widely used cooling fluids in VCASs include mixtures such as LiBr-H2O and H2O-NH3. The absorption refrigeration based on LiBr-H2O possesses good thermal properties for air-conditioning conditions, i.e., for temperatures higher than 0 °C [10,11]. However, when temperatures are lower than 0 °C, another system based on H2O-NH3 mixture is normally preferred [12,13,14]. Nevertheless, this combination of cooling fluids shares a common problem, which is their high damage to the environment and high corrosion rates for metals used; therefore, new absorbent–refrigerant fluids, which do not affect the heat and mass transfer properties of the absorption chiller, are needed to overcome these problems. However, as we will see, many of these systems include chloride ions, and, as it is very well known, the corrosion problems of carbon steel, commonly used in these systems, are very important because this combination of metal/environment is widely used, for instance, in water treatment, acid pickling, chemical cleaning, marine environments, concrete, etc. [15,16,17,18]. Thus, Bourouis et al. [19] analyzed the performance of LiBr + LiNO3 + LiCl + LiI + H2O as a working fluid and found that the crystallization temperature was 35 °C lower than that in the LiBr solution. Li proposed several CaCl2-based working fluids with the addition of NaCl, KCl, LiCl, KNO3 and LiNO3, but observed that with the ternary mixture of CaCl2-LiBr-LiNO3 (15.5:5:1)/H2O, the best refrigeration properties were obtained, and evaluated the corrosion rate of carbon steel and copper, finding that the corrosion rate of the latter was seven times lower than that of the former [20]. In a similar work, Li evaluated the corrosion performance of 316-type stainless steel in the CaCl2 + LiBr + LiNO3 + H2O mixture, finding lower corrosion rates than those for carbon steel and copper [21].
Torres-Diaz et al. [22] evaluated an absorber that used LiBr-LiI-LiNO3-LiCl/H2O and found that the addition of Li-containing salts improved the LiBr solubility [22]. Similarly, Bellos [23] and Luo [24] used working fluids such as LiCl/H2O and LiNO3/H2O in the adsorption refrigerating system, finding that the addition of LiCl improved its efficiency, but the addition of LiNO3 decreased the metals’ dissolution rate. In another research work, 316L-type stainless steel was evaluated by When [25] in KCOOH and LiCl-H2O, and a lower dissolution rate in KCOOH was found as compared with that in LiCl-H2O. In our research, we have evaluated the corrosion behavior of different metals in the CaCl2-LiBr-LiNO3-H2O system instead of LiBr/H2O working fluid, finding a significant reduction in the corrosion rates of the different tested alloys [26,27,28]. In some research works [29,30], it has been shown that the LiCl-H2O cooling fluids have better thermophysical properties than LiBr-H2O. However, the corrosion problems of the metallic components in contact with this working fluid are still present. Thus, the originality of this work is the evaluation of the corrosion performance of 1018 carbon steel, commonly used in refrigeration systems, where the LiCl-H2O is the working fluid and not only thermophysical properties as previously reported.

2. Experimental Procedure

2.1. Testing Material

The material used in this research work was cylindrical bars of AISI 1018 carbon steel containing, in wt.%, Fe-0.14 C-0.90% Mn-0.03% P, which had a diameter of 6.00 mm. Specimens were embedded in a polymeric resin, ground up to 600-grade emery paper, and washed with distilled water and acetone.

2.2. Working Fluid

As a working fluid, two mixtures of LiCl-H2O in concentrations of 35 and 40 wt.% were prepared with analytical-grade reagents at three testing temperatures, i.e., room temperature (25 °C), 35 and 70 °C. The concentrations were chosen based on the short range of operation of the VACSs due to the crystallization of the solution and the temperatures of the different components (absorber, condenser, absorber, and evaporator) [31]. According to Conde, with these concentrations, the crystallization problems are avoided, and the testing temperatures are the ones used in the absorber and in the generator, respectively [32]. At a concentration of 25%, there is no crystallization, but the system efficiency is low, whereas at 55%, there is crystallization. At a concentration of 40%, there is a risk of crystallization, but at a concentration of 45%, we are within the zone of crystallization. Tested concentrations were found by simulation according to [31,32]. If other solution concentrations are used, the system’s efficiency decreases considerably.

2.3. Electrochemical Techniques

Standard electrochemical techniques such as potentiodynamic polarization curves, electrochemical impedance spectroscopy (EIS) and electrochemical noise (EN) were used. As a reference electrode, a silver/silver chloride one was used, whereas as an auxiliary electrode, a graphite rod with a diameter of 6.00 mm was used. Before starting these tests, the open circuit potential (OCP) value was measured during a period of 1800 s. Potentiodynamic polarization curves (PPC) started by cathodically polarizing the specimen 600 mV more negative than the free corrosion potential value, Ecorr, moving into the anodic direction and finishing the scanning 1000 mV more anodic than Ecorr at a scan rate of 1 mV/s. Since the steel exhibited the formation of a passive layer under all conditions, the passive current density value was used to calculate the corrosion current density values, Icorr. The EIS tests were conducted at the Ecorr value and the specimen was polarized with a peak-to-peak signal of ±10 mV in the frequency interval of 0.01–100 KHz. A Gamry potentiostat (Gamry Instruments, Warminster, OR, USA) was used for the polarization curves and EIS tests. In addition, EN measurements in both potential and current were taken. For the noise in potential, the silver/silver chloride reference electrode was used, whereas for the noise in current, a nominally identical working electrode was utilized. These were carried out by taking readings in blocks of 1024 readings at a sampling rate of 1 read/s. A point-to-point method was employed to carry out the trend removal of the electrochemical noise readings. An Auto ZRA (Zero Resistance Ammeter, ACM Instruments, Cartmel, UK) from ACM Instruments was used in this case. Selected specimens were analyzed in a low-vacuum LEO 1450VP scanning electronic microscope (SEM) (LEO Electron Microscope Inc., Thornwood, NY, USA).

3. Results and Discussion

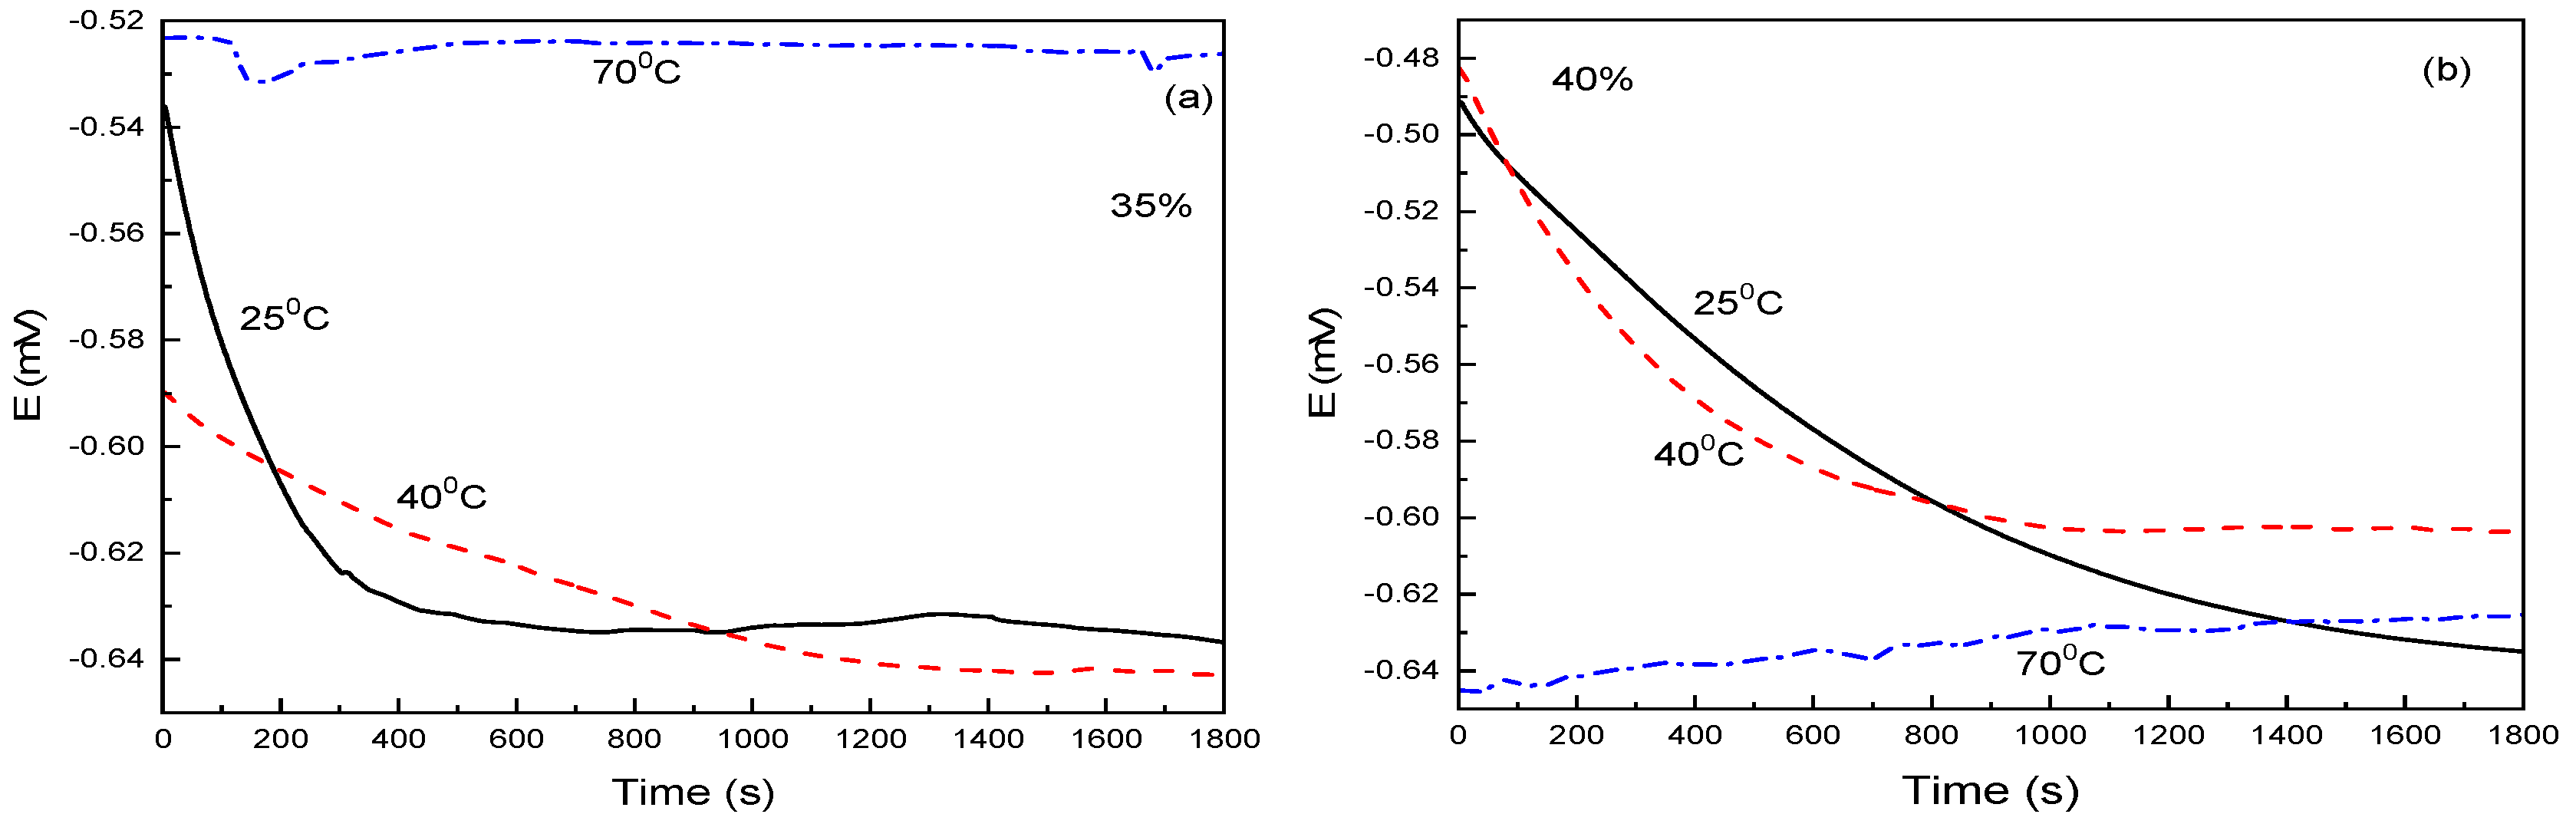
3.1. Open Circuit Potential

The variation in the OCP value with time at different testing temperatures for 1018 carbon steel in the LiCl-H2O mixture at concentrations of 35 and 40% is displayed in Figure 1. It can be seen that, at both concentrations, the OCP values for the tests at 25 and 35 °C start in the noble region but they rapidly shift towards more active values, where they reach steady-state values.
Opposite to this behavior, the OCP value at 70 °C was very stable during the whole testing time; however, in a concentration of 35%, the OCP value for this temperature was the noblest one, whereas the opposite was true for the test in a concentration of 40%. The shift in the OCP value towards more active values indicates the dissolution of any protective layer formed on top of the steel, whereas the move into nobler values indicates the formation of a barrier of corrosion products that protect the steel.

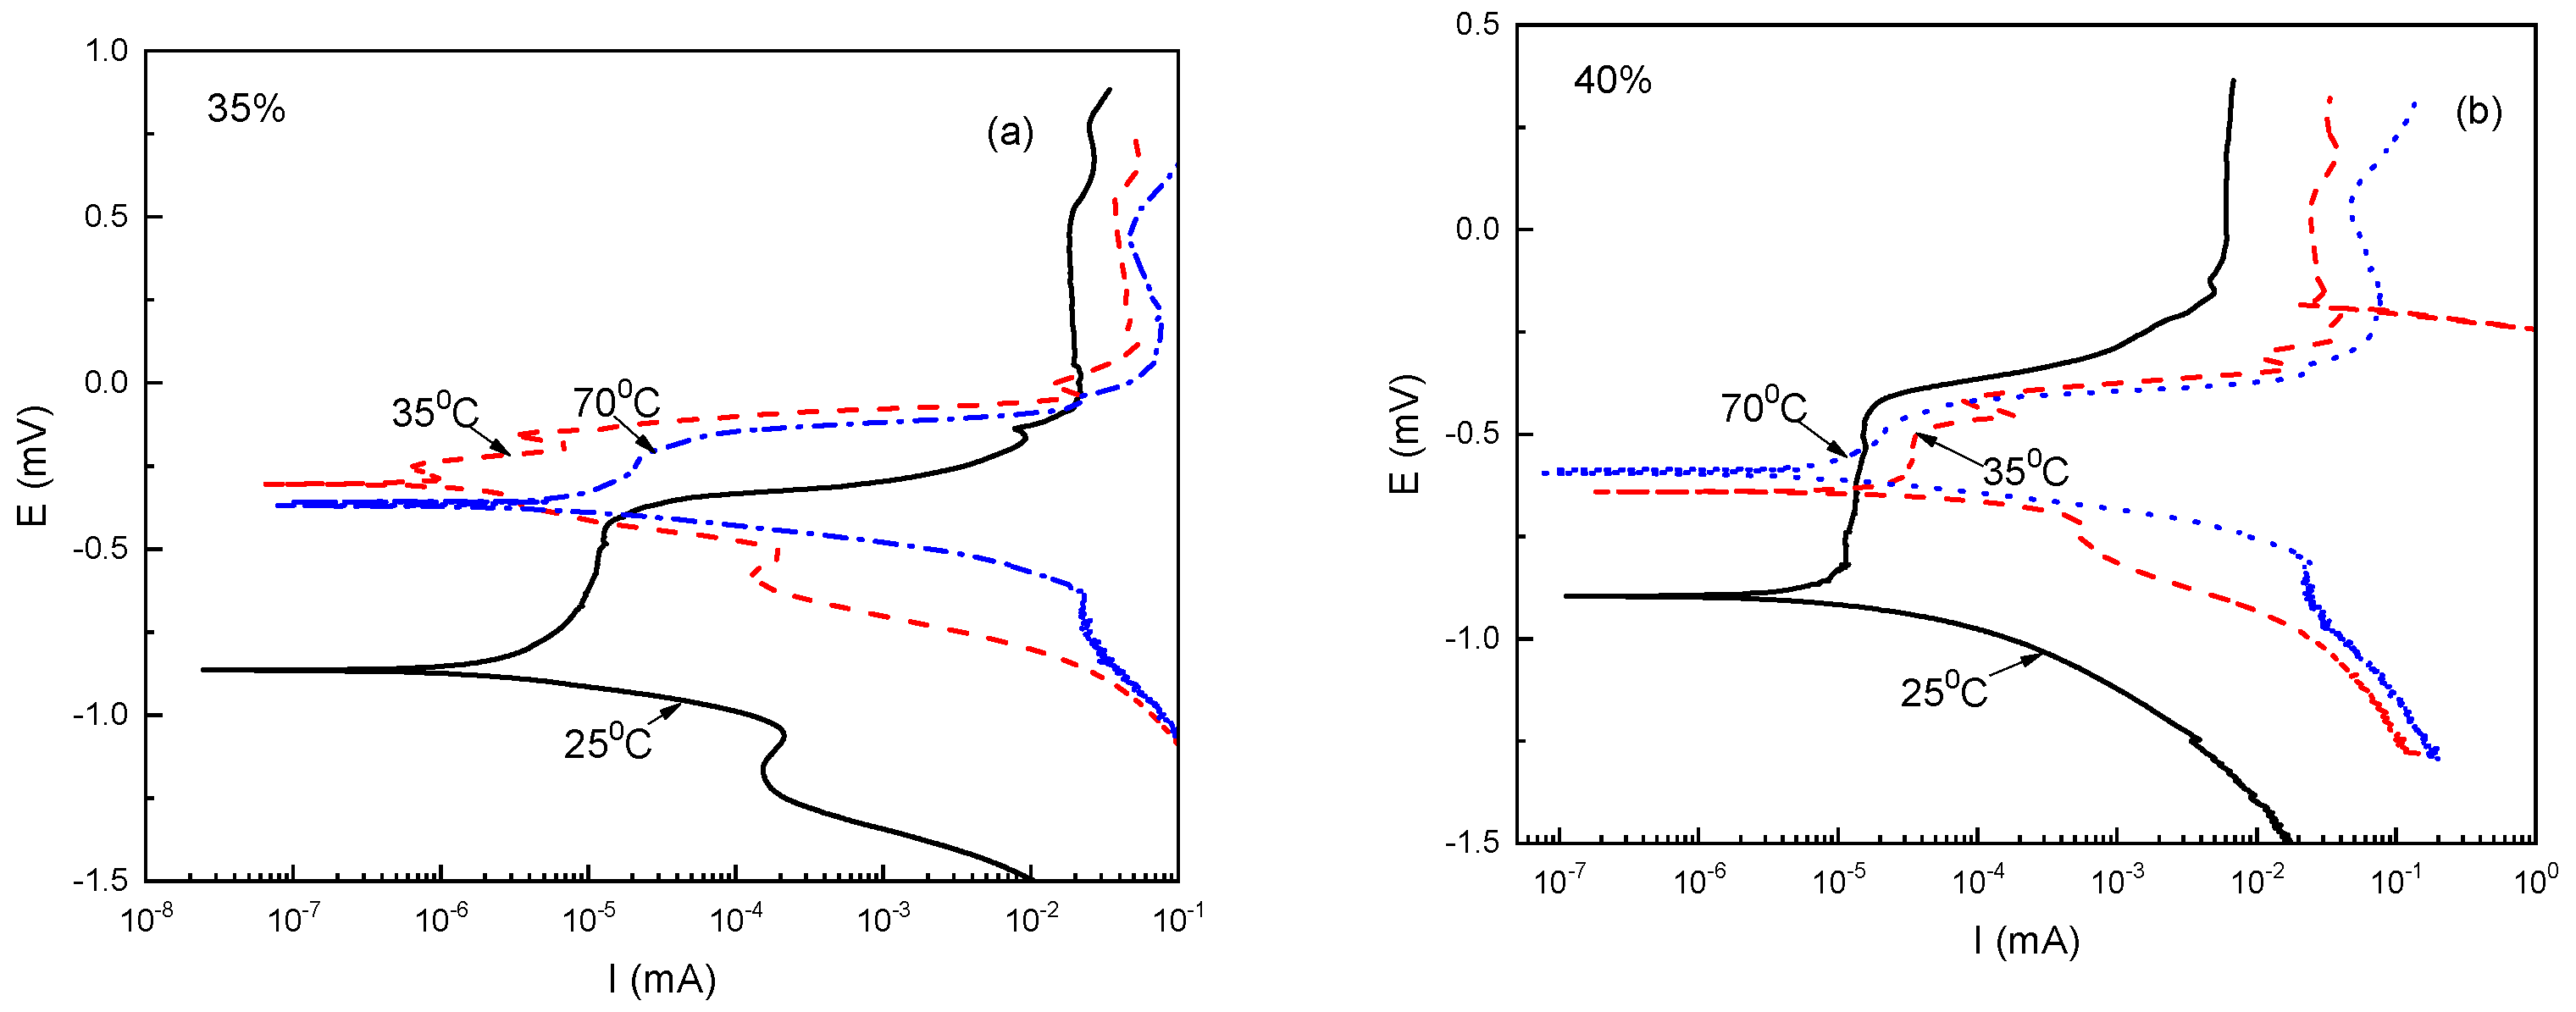
3.2. Potentiodynamic Polarization Curves (PPC)

The OCP value gives only an idea of the trend that a metal has to be corroded, but it does not give information about the kinetics of the corrosion process. For this, polarization curves were performed, and the effect of the testing temperature on the polarization curves for 1018 carbon steel in the LiCl-H2O mixtures at concentrations of 35 and 40% is shown in Figure 2, whereas electrochemical parameters such as Ecorr, Icorr, etc… are given in Table 1.
It can be seen in both figures that regarless of the testing temperature or the LilCl concentration, the polarization curves show the presence of a passive layer, which, according to Liang [33] and Tanno [34], is because of the formation of a film made of Fe3O4 on top of the steel, but according to Guo [35], the formation of Fe2O3 is also possible, although the former is the dominant corrosion product formed. On the cathodic branch of the curve, a limit current density can be observed due to the oxygen reduction reaction, whereas for more cathodic potentials, the hydrogen evolution reaction was also present. It can be seen that the OCP values depicted in Figure 1 are different from the Ecorr values shown in Figure 2. This is because during the OCP tests, the steel surface is covered with a layer of corrosion products and the metal is freely corroding. On the other side, for the polarization curves, the scanning starts at a very cathodic potential where the hydrogen evolution reaction cleans the steel surface of any layer of corrosion products. As the testing temperature increases, the Ecorr value becomes nobler in both concentrations according to the data given in Table 1, and an increase in the Icorr value can be observed. Alternatively, the corrosion current density values increase with an increase in the solution concentration. The pitting potential value, Epit, is the potential at which the passive layer is broken down and an increase in the anodic current density value is observed to become more active as the testing temperature increases. The increase in the Icorr value and the decrease in the Epit value indicate a degradation of the passive film properties with an increase in both the solution temperature and concentration. Finally, the passive zone becomes narrower with an increase in the testing temperature, as given by the difference between the Epit and the Ecorr values, which indicates a deterioration of the passive layer as the temperature increases.

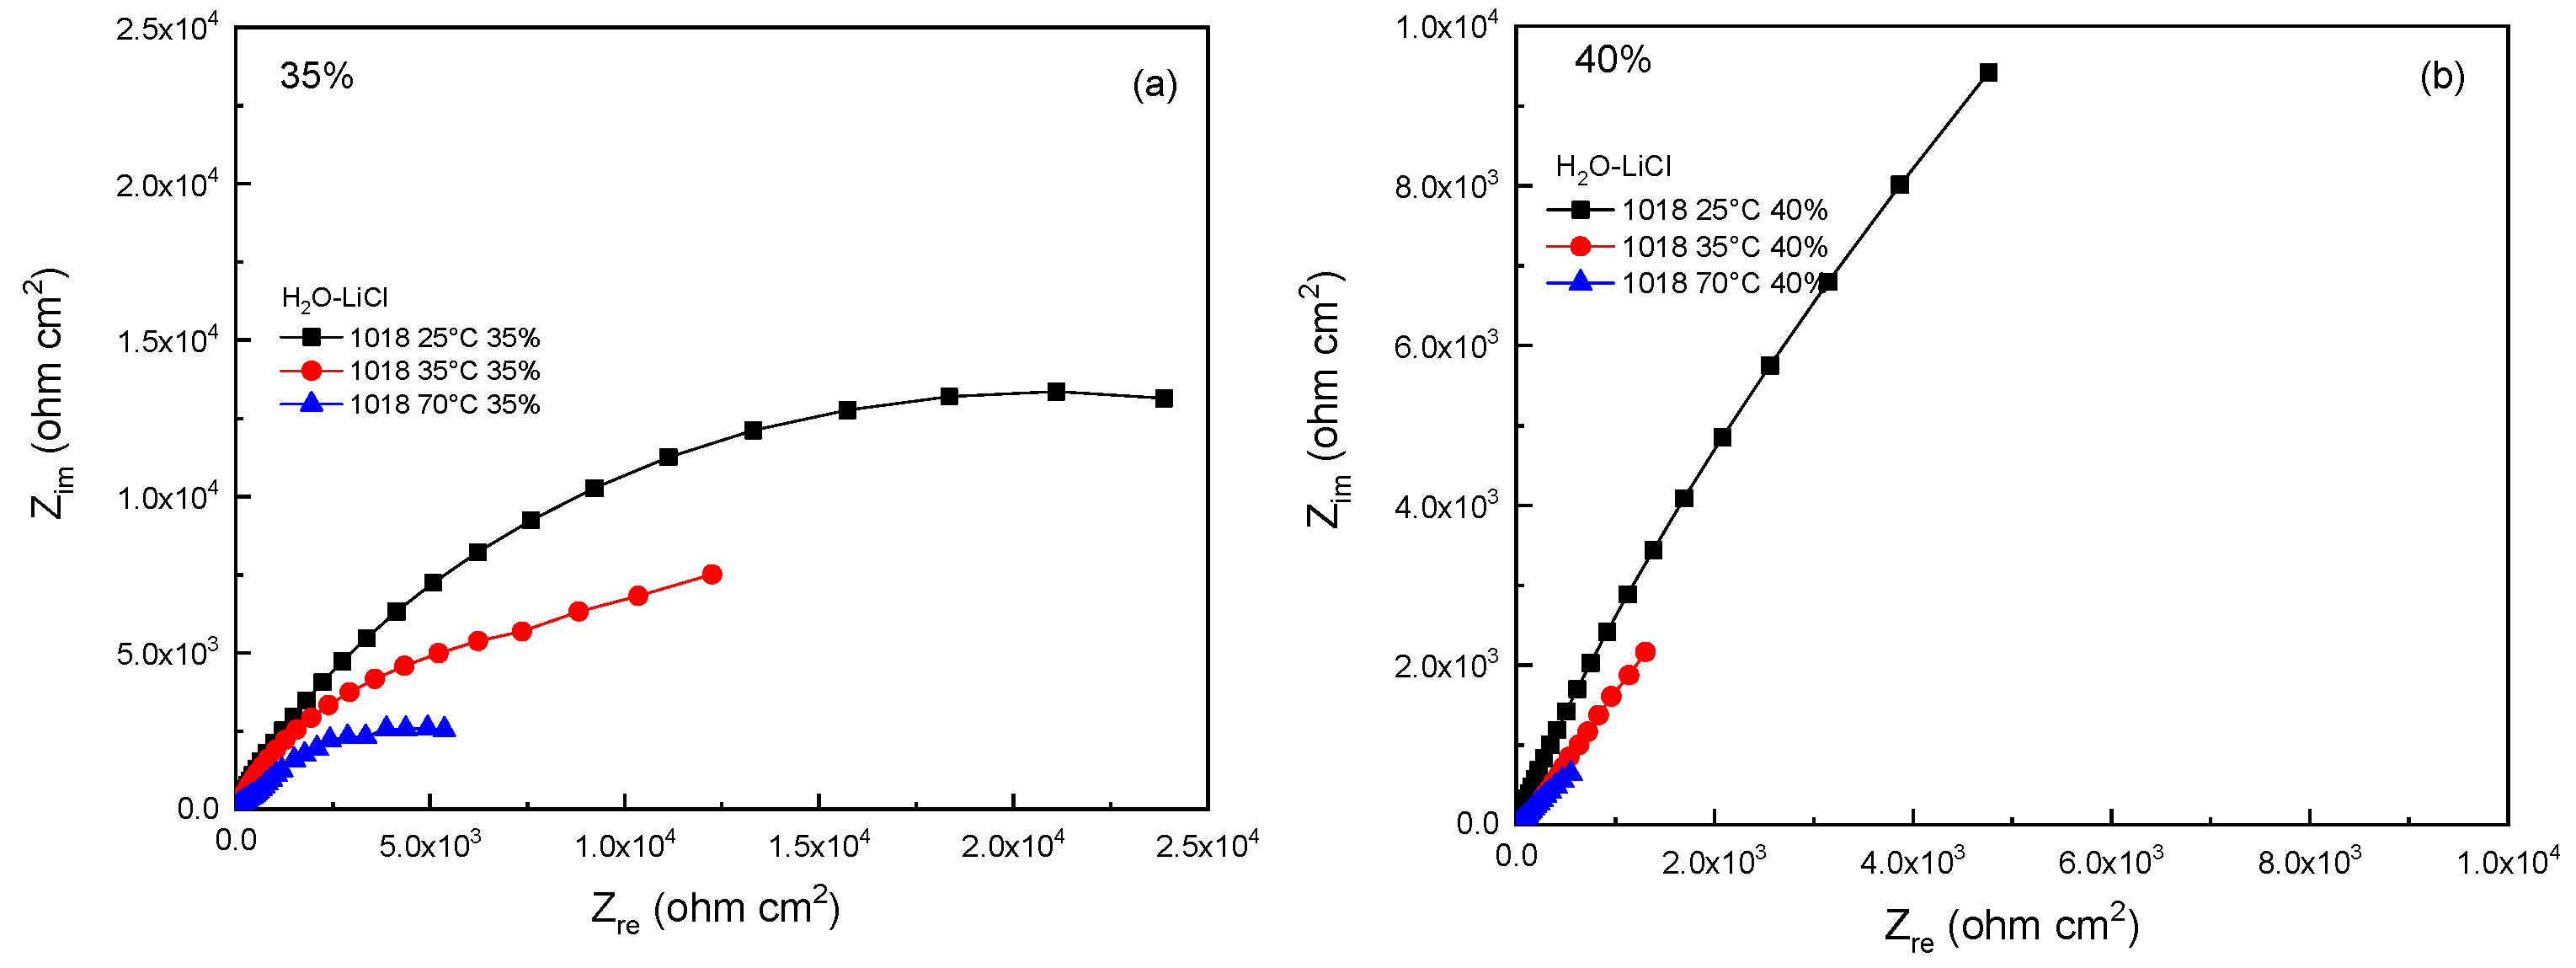
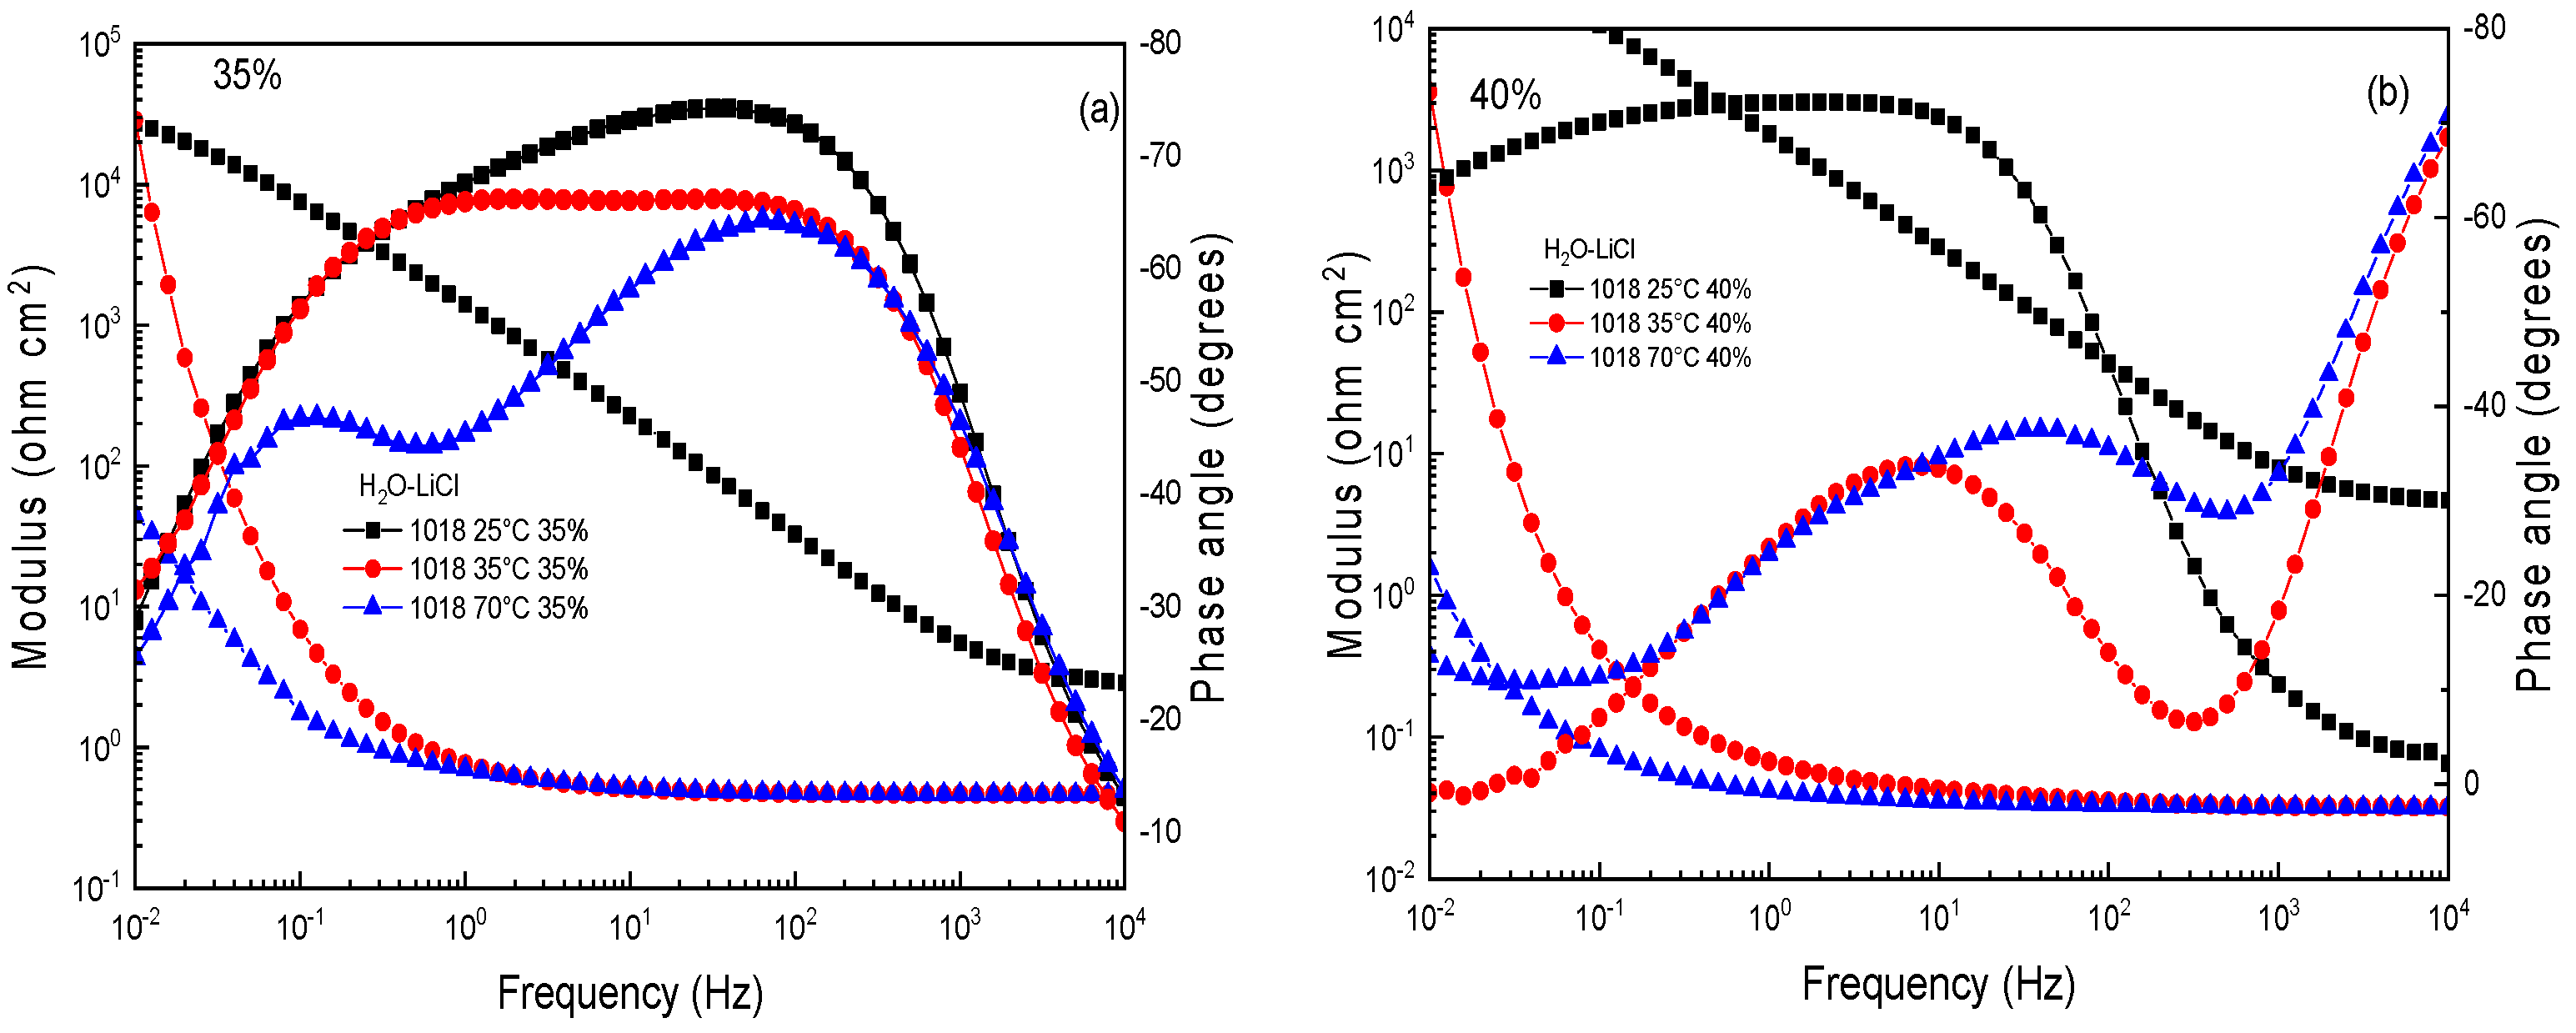
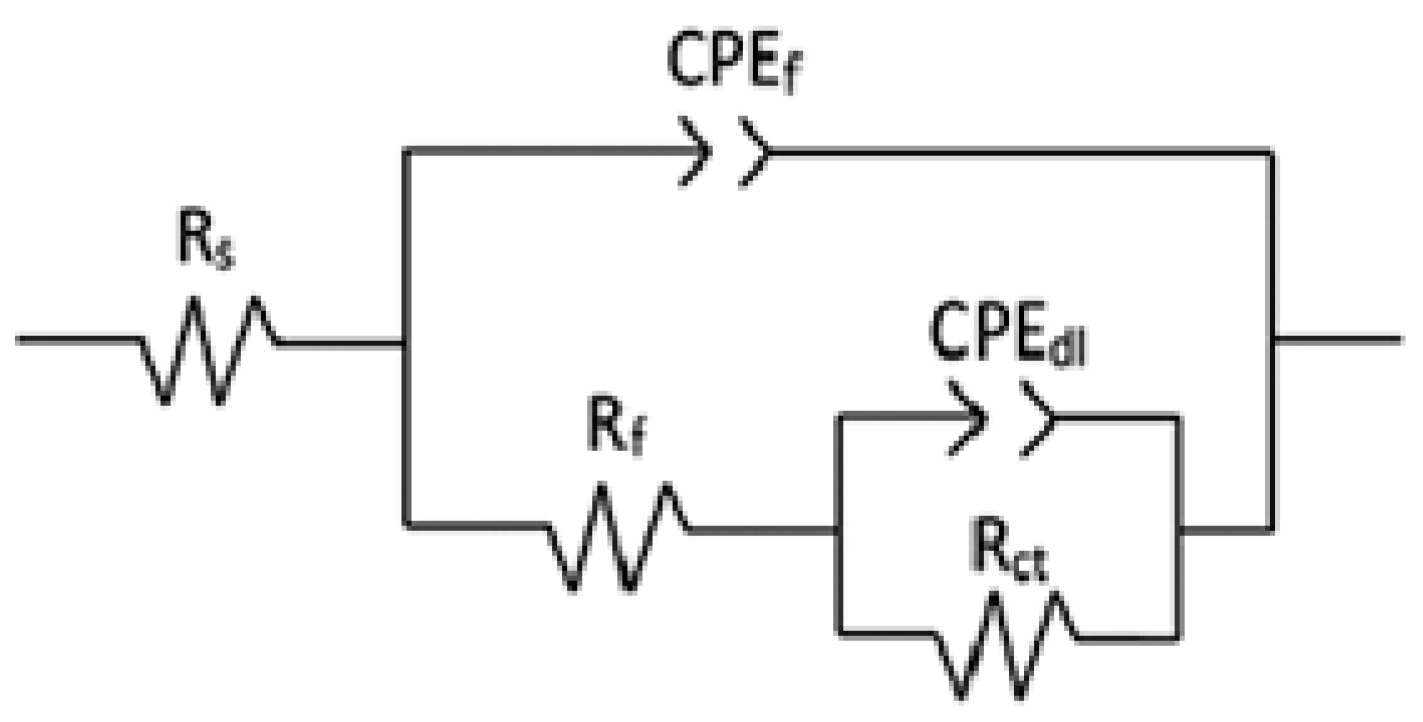
3.3. Electrochemical Impedance Spectroscopy (EIS)

Regarding the corrosion mechanism for 1018 carbon steel in the LiCl-H2O mixtures, EIS experiments can give us valuable information. Nyquist diagrams of 1018 carbon steel in the LiCl-H2O mixtures at different testing temperatures and solution concentrations of 35 and 40 wt.% are given in Figure 3.
This figure clearly shows that regardless of the testing temperature or solution concentration, Nyquist data display only one capacitive loop at all testing frequency values, indicting a charge-transfer-controlled corrosion process. Thus, the corrosion mechanism remains unchanged by the testing temperature or by the solution concentration. In both solution concentrations, as the testing temperature increases, the semicircle diameter decreases due to an increase in its corrosiveness, as evidenced by the data given in Table 1, where it was established that the Icorr value, at a given solution concentration, increases as the testing temperature increases. In addition to this, at a given testing temperature, the semicircle diameter decreases with an increase in the solution concentration and, thus, there is an increment in the Icorr value, as in Table 1, where it was shown that the Icorr value increased as the solution concentration increased at a fixed testing temperature.
On the other hand, Bode plots show that the impedance modulus decreases with an increase in the testing temperature and the solution concentration, as can be seen in Figure 4. Alternatively, the phase angle value for the tests at 25 °C remained very constant over a wide interval of frequency in both solution concentrations, with values close to −80°, typical of a metal covered by a protective, passive layer of corrosion products, indicating the presence of two time constants. As the testing temperature increases, the phase angle’s value decreases, indicating the protective film degradation, but the presence of two time constants is still clear.
Metal/electrolyte interphases can be interpreted as a series of capacitances and resistances in such a way that the EIS data can be simulated with the aid of electric circuits, as that shown in Figure 5, where Rs represents the electrolyte or solution resistance, Rct stands for the charge transfer resistance, the capacitance of the double electrochemical layer is represented by Cdl, and Rf represents the corrosion products film resistance and Cf its capacitance. Due to the fact that the Nyquist semicircles displayed in the Nyquist diagrams (Figure 3) are not perfect ones, but are instead depressed due to surface heterogeneities such as surface roughness, among other factors, ideal capacitances are replaced by constant phase elements, CPE, with an impedance value, ZCPE, given by [36]:
ZCPE = (jω)n/Y0
where Y0 is a proportionality constant, ω the angular frequency, j = −1½, and n is the shift factor which gives some information on the surface roughness. The parameters obtained from fitting the EIS data by using the electric circuit shown in Figure 5 are summarized in Table 2. This table shows that the Rf values are higher than those for Rct, which indicates that the corrosion resistance of 1018 carbon steel in the LiCl-H2O mixtures is given by the film formed on top of the steel which, as explained above, essentially consist of Fe3O4 and probably Fe2O3 [32,33,34]. Table 2 also shows that an increase in the testing temperature brings a decrease in both parameters, Rf and Rct. In addition to this, an increase in the solution concentration brings a decrease in the Rf and Rf parameters. This increase in the corrosiveness of the electrolyte brings an increase in the metallic ions’ transport through the double electrochemical layer such as Fe, which come from the dissolution of the steel, increasing this interphase conductivity. It can be seen that an increase in the testing temperature and in the solution concentration brins an increase in the CPEf and CPEdl values. The increase in the metallic ions’ transport across the double electrochemical layer due to the steel dissolution causes an increase in the CPEf parameter due to an increase in its capacitance, as shown in Table 2. Finally, the values for parameter n close to 1.0 are related to a smooth surface which has not been corroded by the environment; on the other hand, when values for this parameter are around 0.5, it means that the metal surface is very rough as a consequence of the corrosive action of the environment. Thus, the data given in Table 2 show that the values for these parameters decrease from 0.9 to 0.6 when the testing temperature increases due to an increase in the corrosion rate; a similar behavior can be observed when the solution concentration increases from 35 up to 40 wt.%, leading to a decrease in the ndl and nf parameters due to an increase in the surface roughness due to an increase in the metal dissolution rate.

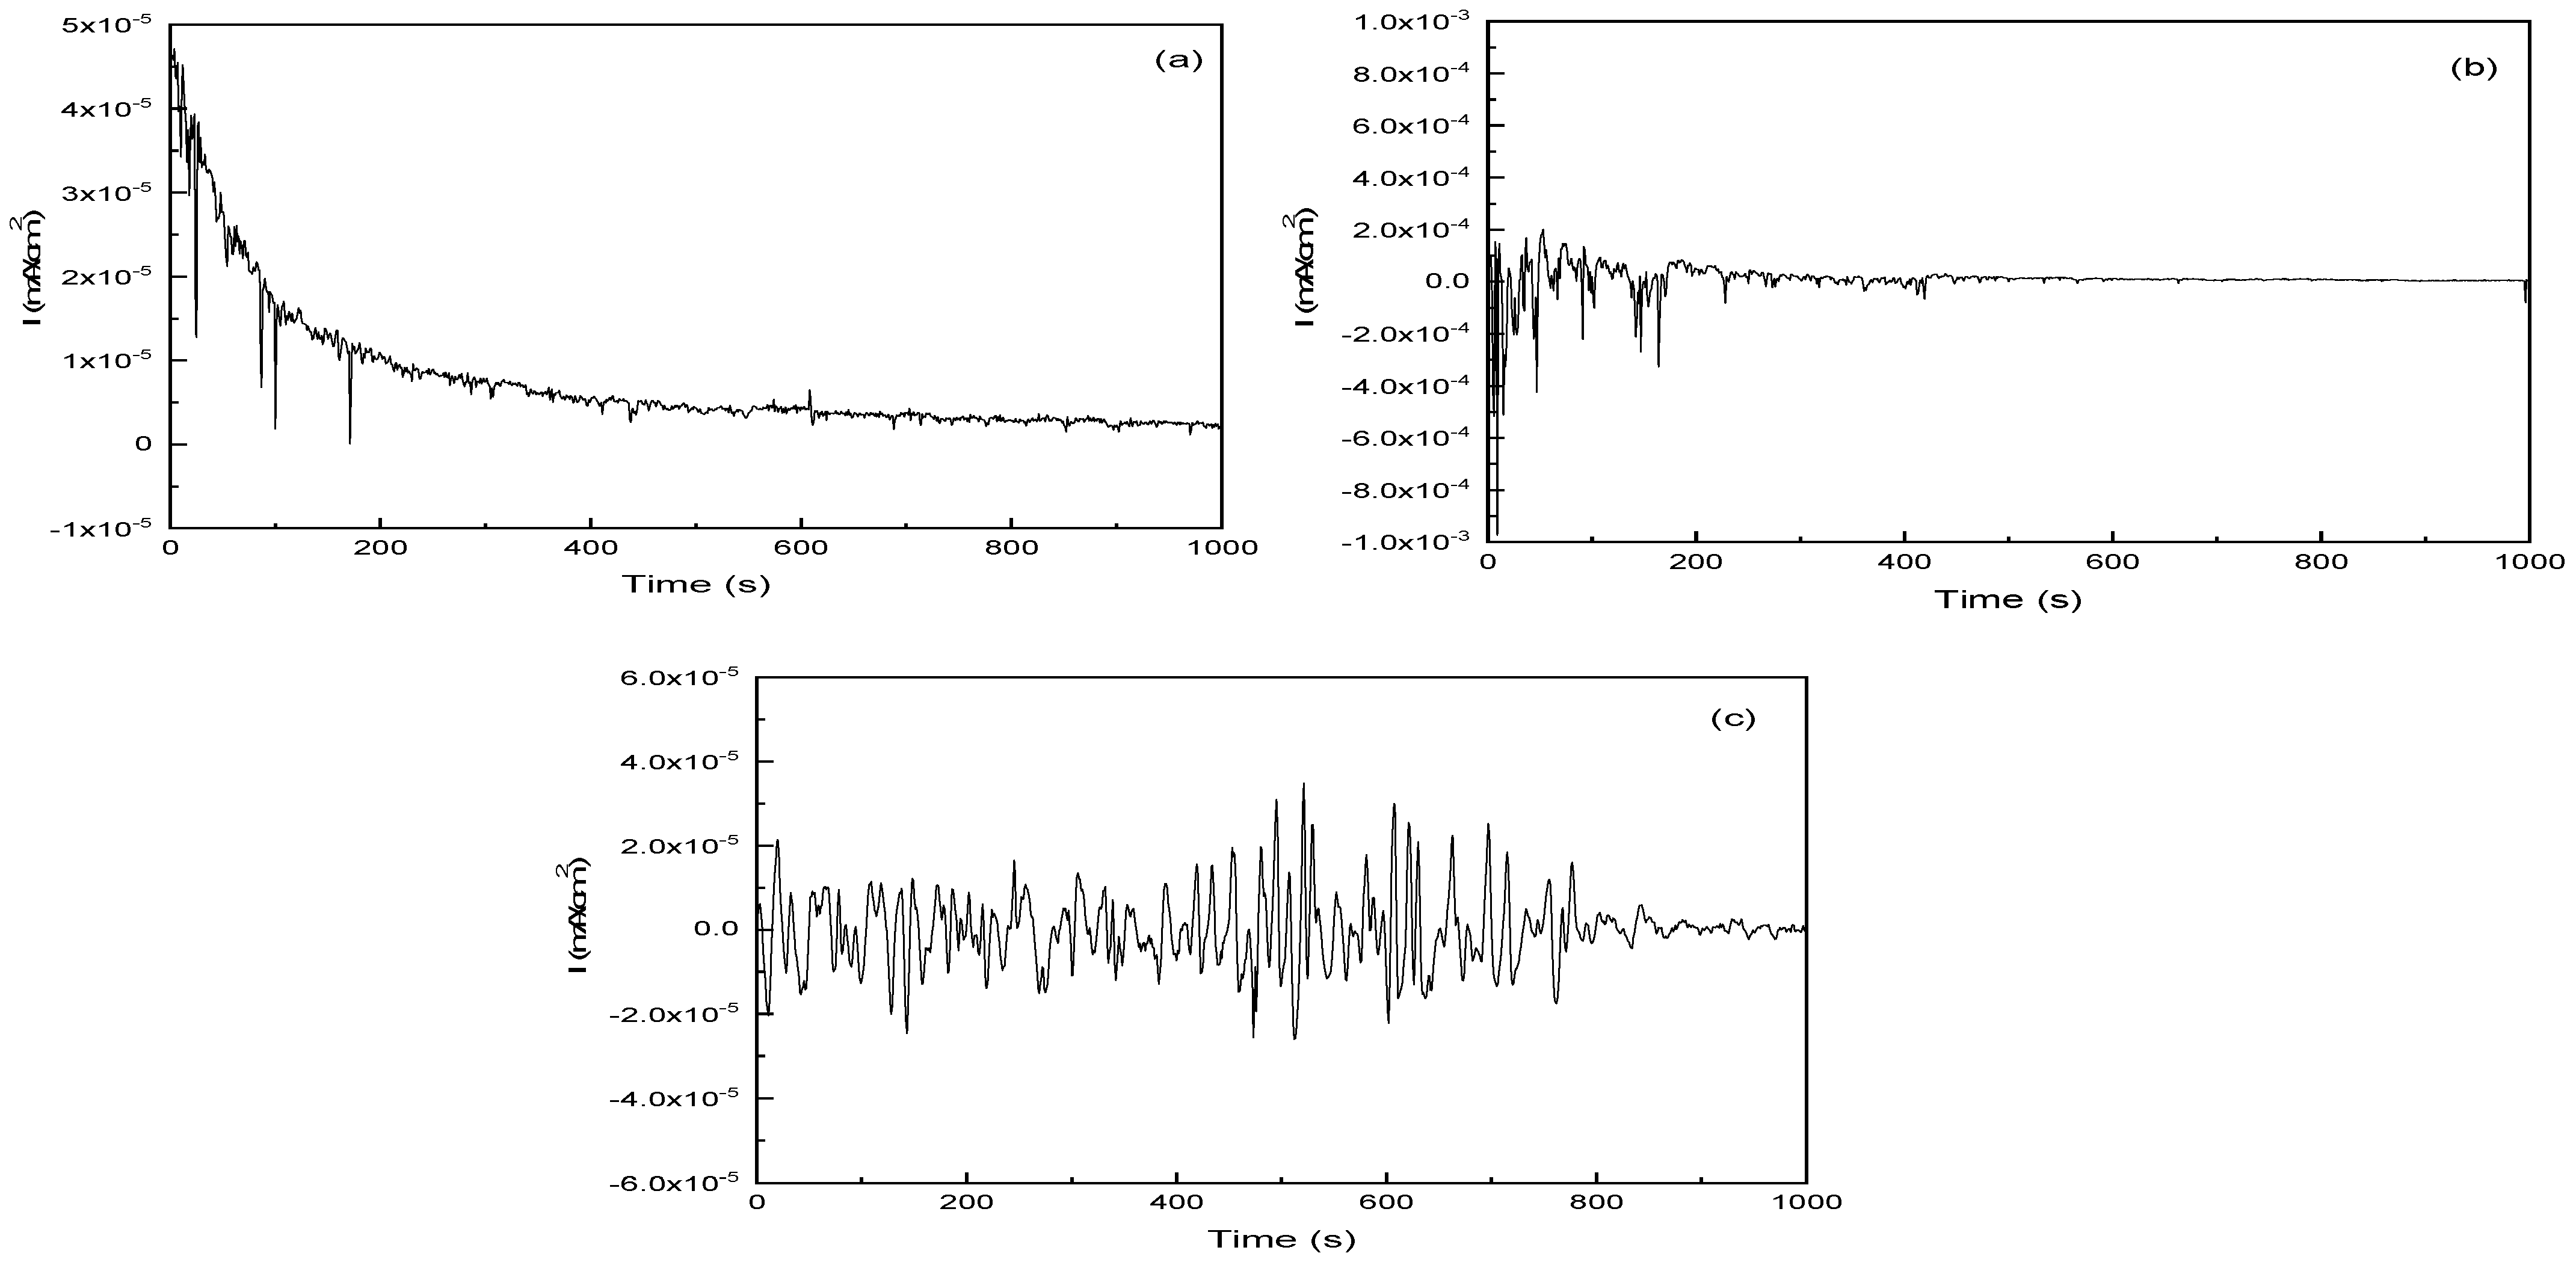
3.4. Electrochemical Noise Measurements (EN)

In order to know the type of corrosion that 1018 carbon steel suffers in the LiCl-H2O mixtures, i.e., a localized, mixed or uniform type of corrosion, electrochemical noise in both current and potential was carried out. Typical time series for the noise in current for 1018 carbon steel in 35 wt% LiCl-H2O mixture at the three different testing temperatures are shown in Figure 6. For the test at 25 °C (Figure 6a), the time series consist of transients with high frequency and low intensity combined with some transients with much lower frequency but higher intensity, typical of a material undergoing a type of localized attack such as pitting type of corrosion [36,37]. These low-frequency, high-intensity transients are the result of the rupture of the formed passive film on top of the steel and the re-healing of this passive film. After 200 s of testing, the high-intensity, low-frequency transients fade away, indicating that the steel is undergoing either a uniform type of corrosion or passivation [36]. When the testing temperature increases up to 35 °C (Figure 6b), the same behavior is observed, i.e., transients with low intensity and high frequency combine with other higher-intensity, lower-frequency transients, but their intensity is higher than that observed at 25 °C, indicating a higher susceptibility to a localized type of corrosion. However, for the test at 70 °C (Figure 6c), all the observed transients have a similar frequency and intensity, indicating a susceptibility to either a mixed or uniform type of corrosion.
For the time series for the noise in current in a LiCl-H2O solution in a concentration of 40 wt.% (Figure 7a), transients with low intensity and high frequency in combination with lower-frequency, higher-intensity transients are observed for the test at 25 °C, indicating film rupture and re-healing, typical of a material susceptible to a pitting type of corrosion. This behavior is also observed for the test at 35 °C (Figure 7b), but the transients’ intensity is higher than that observed at 25 °C. There was not a big difference between the shape of the transients observed for the two mixtures’ concentrations of 35 and 40 wt.%. Finally, for the test at 70 °C, only transients with similar intensity and frequency were observed (Figure 7c), indicating that the steel is susceptible either to a uniform or mixed type of corrosion, similar to the test at the same temperature but at a solution concentration of 35 wt.%.

3.5. Calculation of Icorr by Using Different Techniques

Since different electrochemical techniques have been used in this work, it is worth calculating the Icorr values with these different techniques by using the Stern–Geary equation. For potentiodynamic polarization curves, the modified version of this equation when the Icorr value is determined by the passive current density value was used to calculate the constant value, K [37]. With the use of this constant, the polarization resistance values obtained for the concentration of 35% at 25, 35 and 70 °C were 39,089, 16,985 and 7050 ohm cm2, respectively, whereas for the concentration of 40%, the Rp values obtained were 31,870, 9570 and 2545 ohm cm2.. For the EIS tests, the value for K given above was used, but the Rp value was calculated as the sum of Rs, Rct and Rf. Finally, for the EN measurements, the same K value given above was used, but the noise resistance value, Rn, was calculated by dividing the standard deviation in potential, σV, by the standard deviation in current, σI. The different values for Icorr are summarized in Table 3. It can be seen that there is a high agreement between the values obtained by the potentiodynamic polarization curves and the EIS tests; however, the values obtained by using the EN measurements are higher. This might be due to the fact that the noise resistance parameter is related to stochastic fluctuations in the current and potential values related to a localized type of corrosion rather than to a uniform type of corrosion. Another reason could be that the original noise time series were not used but a trend removal procedure was used, as explained in the experimental procedure, and this could affect the results of the Rn parameter.

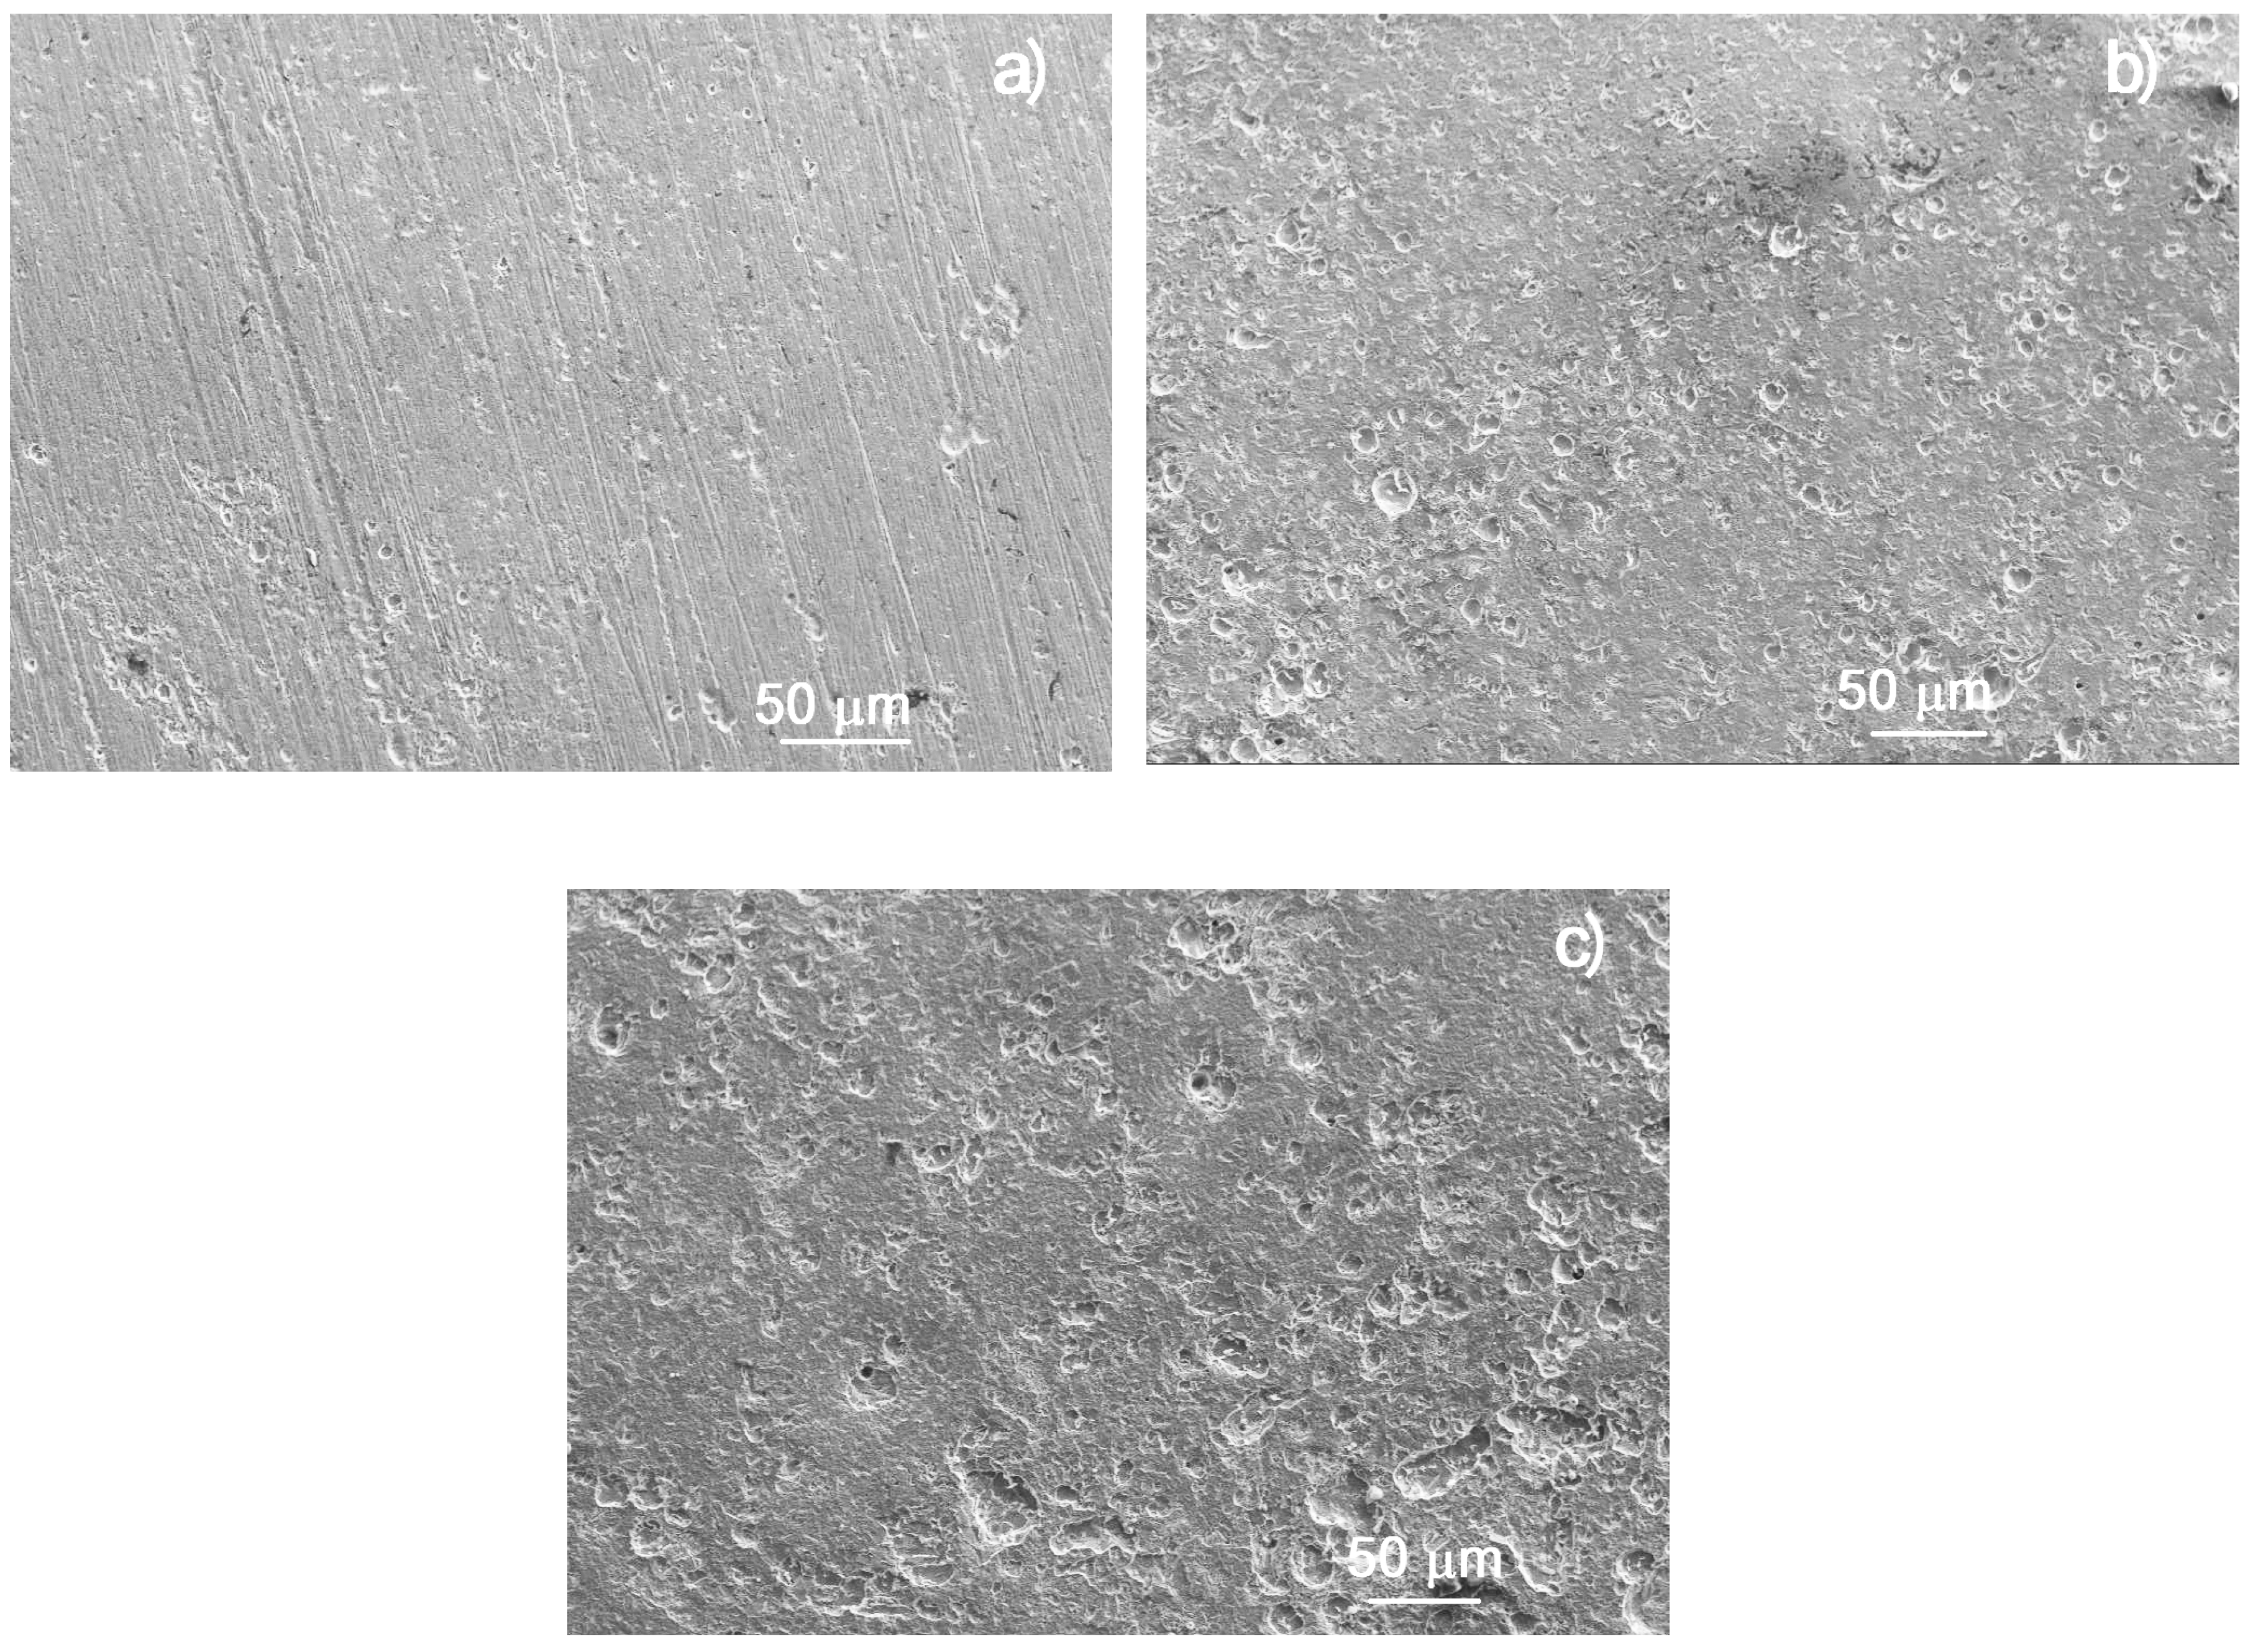
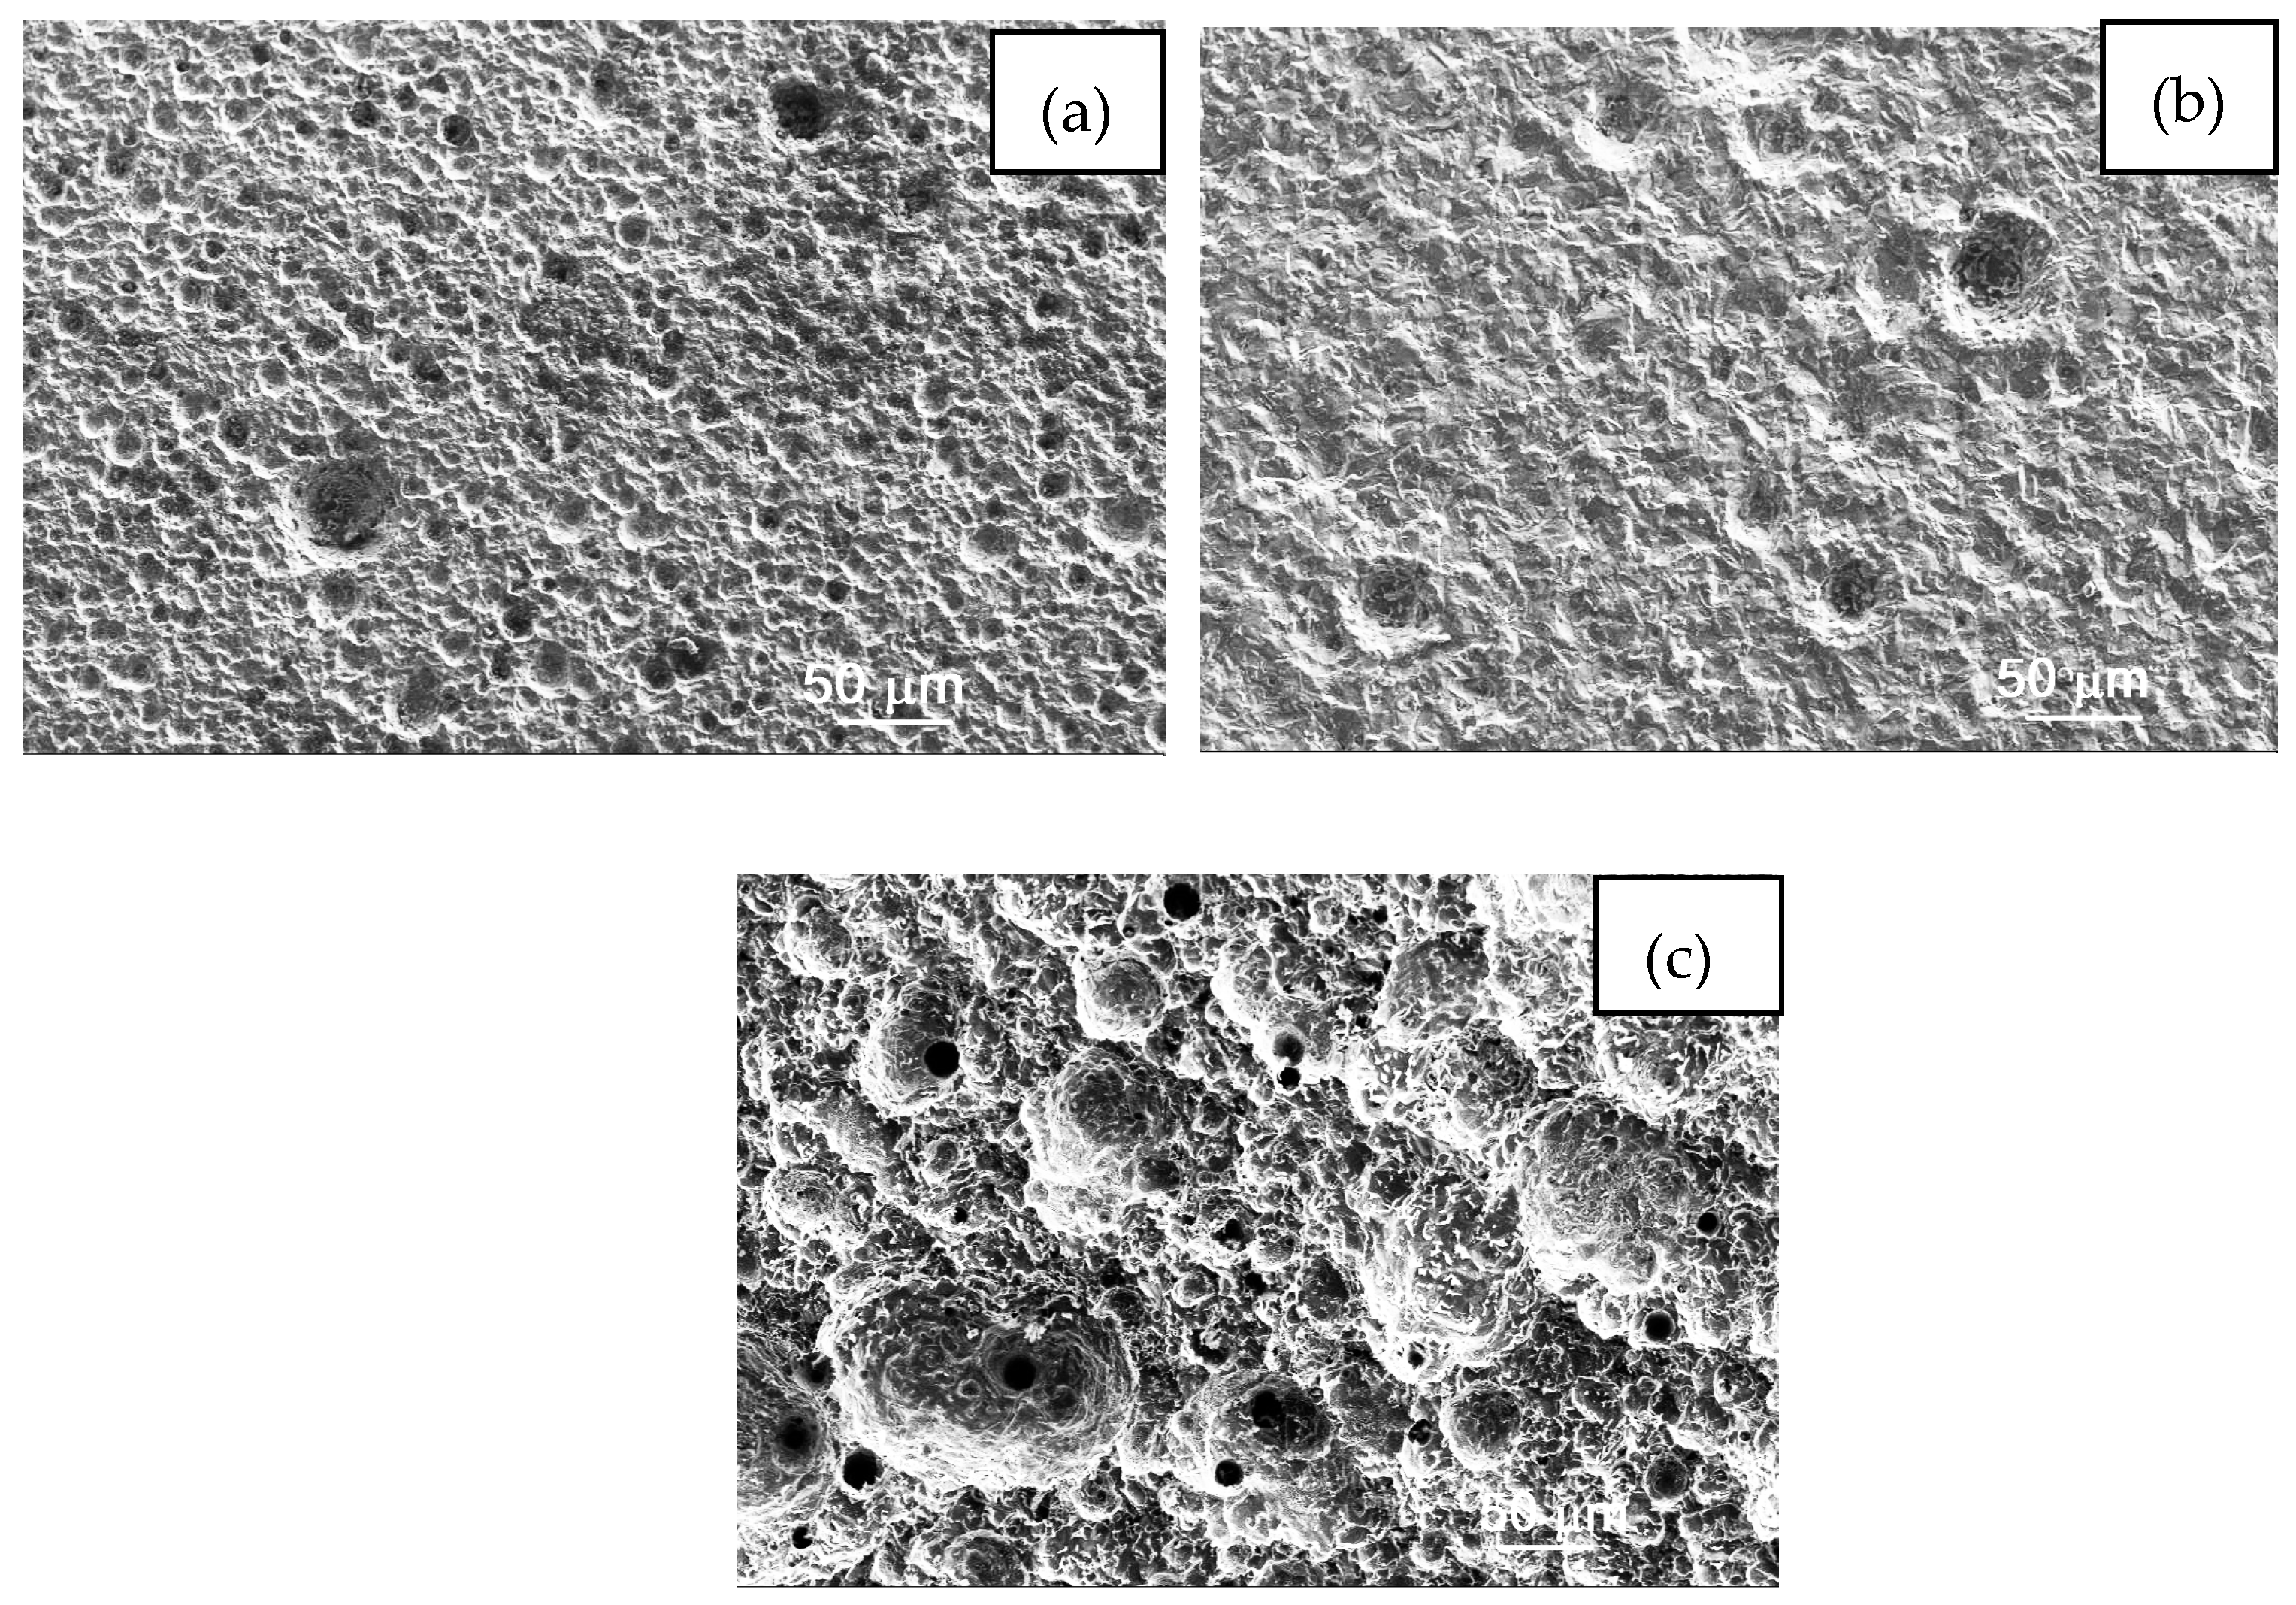
3.6. Analysis of Corroded Surfaces

SEM micrographs of corroded samples in the LiCl-H2O mixture at the different testing temperatures and concentrations are shown in Figure 8 and Figure 9. It is clear from these two figures that the main type of damage is a pitting type of corrosion regardless of the testing temperature or solution concentration, typical of metals corroded in chloride-containing environments.
For the tests in the solution concentration of 35 wt.% (Figure 8), not only do the density and diameter of the pits increase with an increase in the testing temperature, but they become shallower and, at 70 °C (Figure 8c), looks like some of them have coalesced and led the surface to look as if it has suffered a kind of mixed, localized and uniform type of corrosion. For the tests in the most concentrated solution, i.e., 40 wt.% (Figure 9), the density of the pits is much higher than that observed at 35 wt.%. Similar to the tests in the latter solution, the density and diameter of the pits increase with an increase in the testing temperature, and, at 70 °C, the pits have joined together and make the steel surface look as if it has suffered a uniform type of corrosion, or a mixture of localized, pitting-like, and uniform corrosion, as predicted by the noise time series given in Figure 6 and Figure 7.

4. Conclusions

A study on the effect of testing temperature and solution concentration on the corrosion behavior of 1018 carbon steel in LiCl/H2O mixtures has been carried out. The polarization curves showed the existence of a passive layer on the steel regardless of solution concentration or testing temperature. However, the Icorr values increased with both the testing temperature and solution concentration. The pitting potential value, Epit, decreased with an increase in the testing temperature but became more active as the solution concentration increased. The passive zone became narrower as the testing temperature increased at both solution concentrations. The corrosion process was charge transfer controlled and it was unaltered either by the solution temperature or concentration. However, the Rct and Rf values decreased with an increase in both parameters. The main type of attack that the steel exhibited was a localized, pitting type of corrosion at 25 and 35 °C, whereas at 70 °C, the morphology of the attack was a mixed, pitting and uniform type of corrosion.

Author Contributions

Conceptualization and methodology, M.A.-F. and A.K.L.-G.; software and validation J.M.-G. and R.L.-S.; formal analysis and investigation A.B.-F. and J.C.; data curation and funding acquisition F.C.M.T. and A.M.R.-A.; writing-original draft preparation and project administration J.G.G.-R. All authors have read and agreed to the published version of the manuscript.

Funding

This research has received no external funding.

Data Availability Statement

The original contributions presented in the study are included in the article, further inquiries can be directed to the corresponding author.

Conflicts of Interest

The authors declare no conflicts of interest.

References

  1. Mclinden, M.O.; Seeton, C.J.; Pearson, A. New refrigerants and system configurations for vapor-compression refrigeration. Science 2020, 370, 791–796. [Google Scholar] [CrossRef] [PubMed]
  2. Kadam, S.T.; Kyriakides, A.S.; Khan, M.S.; Shehabi, M.; Papadopoulosb, A.I.; Hassan, I.; Rahman, M.A.; Seferlis, P. Thermo-economic and environmental assessment of hybrid vapor compression-absorption refrigeration systems for district cooling. Energy 2022, 243, 122991. [Google Scholar] [CrossRef]
  3. Sharif, M.Z.; Azmi, W.H.; Ghazali, M.F.; Samykano, M.; Ali, H.M. Performance improvement strategies of R1234yf in vapor compression refrigeration system as a R134a replacement: A review. J. Taiwan Inst. Chem. Eng. 2023, 148, 105032. [Google Scholar] [CrossRef]
  4. Kong, D.; Yin, X.; Ding, X.; Fang, N.; Duan, P. Global optimization of a vapor compression refrigeration system with a self-adaptive differential evolution algorithm. Appl. Therm. Eng. 2021, 197, 117427. [Google Scholar] [CrossRef]
  5. Christopher, S.S.; Santosh, R.; Vikram, M.P.; Prabakaran, R.; Thakur, A.K.; Xu, H. Optimization of a solar water heating system for vapor absorption refrigeration system. Environ. Prog. Sustain. Energy 2021, 40, e13489. [Google Scholar] [CrossRef]
  6. Nikbakhti, R.; Wang, X.; Hussein, A.K.; Iranmanesh, A. Absorption cooling systems—Review of various techniques for energy performance enhancement. Alex. Eng. J. 2020, 59, 707–738. [Google Scholar] [CrossRef]
  7. Selvaraj, D.A.; Victor, K. Design and Performance of Solar PV Integrated Domestic Vapor Absorption Refrigeration System. Int. J. Photoenergy 2021, 2021, 6655113. [Google Scholar] [CrossRef]
  8. Abdullah, M.O.; Hieng, T.C. Comparative analysis of performance and techno-economics for an H2O-NH3-H2 absorption refrigerator driven by different energy sources. Appl. Energy 2010, 87, 1535–1545. [Google Scholar] [CrossRef]
  9. Lee, S.K.; Lee, J.W.; Lee, H.; Chung, J.T.; Kang, Y.T. Optimal design of generators for H2O-LiBr absorption chiller whit multi-heat sources. Appl. Energy 2019, 167, 47–59. [Google Scholar] [CrossRef]
  10. Lee, R.J.; DiGuilio, R.M.; Jeteter, S.M.; Teja, A.S. Properties of LiBr-H2O solutions at high temperatures and concentrations. Part II. Density and viscosity, ASHRAE. Transactions 1990, 96, 709–714. [Google Scholar]
  11. Wen, T.; Luo, Y.; Sheng, L. Experimental study on the corrosion behavior and regeneration performance of KCOOH aqueous solution. Sol. Energy 2020, 201, 638–648. [Google Scholar] [CrossRef]
  12. Sun, D.W. Comparison of the performance of NH3-H2O, NH3-LiNO3, and NH3-NaSCN absorption refrigeration system. Appl. Energy Conv. Manag. 1998, 39, 357–368. [Google Scholar] [CrossRef]
  13. Best, R.; Eisa, M.A.; Holland, F.A. Thermodynamic design data for absorption heat pump system operating on NH3-H2O. Part 2. Heating. Heat Recovery Syst. 1987, 7, 177–185. [Google Scholar] [CrossRef]
  14. Srikhirin, P.; Aphornratana, S.; Chungpaibulpatana, S. A Review of Absorption Refrigeration Technologies. Appl. Renew. Sust. Energy Rev. 2001, 5, 343–372. [Google Scholar] [CrossRef]
  15. Ihamdane, R.; Tiskar, M.; Outemsaa, B.; Zelmat, L.; Dagdag, O.; Berisha, A.; Berdimurodov, E.; Ebenso, E.E.; Chaouch, A. Essential oil of Origanum vulgare as a green corrosion inhibitor for carbon steel in acidic medium. Arab. J. Sci. Eng. 2023, 48, 7685–7701. [Google Scholar] [CrossRef]
  16. Fan, G.; Liu, H.; Fana, B.; Ma, Y.; Hao, H.; Yang, B. Trazodone as an efficient corrosion inhibitor for carbon steel in acidic and neutral chloride-containing media: Facile synthesis, experimental and theoretical evaluations. J. Mol. Liq. 2020, 311, 113302. [Google Scholar] [CrossRef]
  17. Wang, P.; Wang, Y.; Zhao, T.; Xiong, C.; Xu5, P.; Zhou, J.; Fan, Z. Effectiveness Protection Performance of an Internal Blending Organic Corrosion Inhibitor for Carbon Steel in Chloride Contaminated Simulated Concrete Pore Solution. J. Adv. Concrete Technol. 2020, 18, 116–128. [Google Scholar] [CrossRef]
  18. Refait, P.; Grolleau, A.M.; Jeannin, M.; Rémazeilles, C.; Sabot, R. Corrosion of Carbon Steel in Marine Environments: Role of the Corrosion Product Layer. Corros. Mater. Degrad. 2020, 1, 198–218. [Google Scholar] [CrossRef]
  19. Bourouis, M.; Vallès, M.; Medrano, M.; Coronas, A. Performance of air-cooled absorption air-conditioning systems working with water-(LiBr+ Lil+ LiNO3+ LiCl). J. Proc. Mech. Eng. 2005, 219, 205–213. [Google Scholar] [CrossRef]
  20. Li, Y.; Li, N.; Luo, C.; Su, Q. Study on a Quaternary Working Pair of CaCl2-LiNO3-KNO3/H2O for an Absorption Refrigeration Cycle. Entropy 2019, 21, 546. [Google Scholar] [CrossRef]
  21. Li, N.; Luo, C.; Su, Q. A working pair of CaCl2-LiBr-LiNO3/H2O and its application in a single-stage solar-driven absorption refrigeration cycle. Appl. Int. J. Refrig. 2017, 86, 1–13. [Google Scholar] [CrossRef]
  22. Torres-Díaz, T.; Siqueiros, J.; Coronas, A.; Salavera, D.; Huicochea, A.; Juárez-Romero, D. Performance of Li salts (LiBr + LiI + LiNO3+ LiCl) for an absorption cycle of an experimental absorption heat transformer for water purification. Desalination Water Treat. 2017, 82, 292–299. [Google Scholar] [CrossRef]
  23. Bellos, E.; Tzivanidis, C.; Pavlovic, S.; Stefanovic, V. Thermodynamic investigation of LiCl-H2O working pair in a double effect absorption chiller driven by parabolic trough collectors. Therm. Sci. Eng. Prog. 2017, 3, 75–87. [Google Scholar] [CrossRef]
  24. Luo, C.; Su, Q.; Li, N.; Li, Y. Corrosion of Copper in a Concentrated LiNO3 Solution at a High Temperature. Int. J. Electrochem. Sci. 2017, 12, 1896–1914. [Google Scholar] [CrossRef]
  25. Larios-Galvez, A.K.; Vazquez-Velez, E.; Martinez-Valencia, H.; Gonzalez-Rodriguez, J.G. Effect of Plasma Nitriding and Oxidation on the Corrosion Resistance of 304 Stainless Steel in LiBr/H2O and CaCl2-LiBr-LiNO3-H2O Mixtures. Metals 2023, 13, 920. [Google Scholar] [CrossRef]
  26. Flores-Guadarrama, I.; Gónzalez-Rodríguez, J.G.; García-Rosas, D.; Guardían-Tapia, R.; León-Hernández, V.; López-Sesenes, R. Corrosion behavior of brass immersed in CaCl2-LiBr-LiNO3/H2O blends. J. Solid State Electrochem. 2023, 27, 3017–3027. [Google Scholar] [CrossRef]
  27. Flores-Guadarrama, I.; Gonzalez-Rodriguez, J.G.; Uruchurtu-Chavarín, J.; Ramírez-Arteaga, A.M.; Bustos Rivera-Bahena, G.; Guardián-Tapia, R.; López-Sesenes, R. Effect of refrigerant absorbent combinations in the corrosion resistance of copper as structural material in absorption refrigeration systems (ARS). Corros. Eng. Sci. Technol. 2023, 58, 787–798. [Google Scholar] [CrossRef]
  28. Parham, K.; Atikol, U.; Yari, M.; Agboola, O.P. Evaluation and optimization of single stage absorption chiller using (LiCl + H2O) as the working pair. Adv. Mech. Eng. 2013, 5, 453–462. [Google Scholar] [CrossRef]
  29. She, X.; Yin, Y.; Xu, M.; Zhang, X. A novel low-grade heat-driven absorption refrigeration system whit LiCl-H2O and LiBr-H2O working pair. Appl. Int. J. Refrig. 2015, 58, 219–234. [Google Scholar] [CrossRef]
  30. Cerezo, J.; Romero, R.J.; Ibarra, J.; Rodríguez, A.; Montero, G.; Acuña, A. Dynamic Simulation of an Absorption Cooling System with Different Working Mixtures. Energies 2018, 11, 259. [Google Scholar] [CrossRef]
  31. Conde, R.M. Properties of aqueous solutions of lithium and calcium chlorides: Formulations for use in air conditioning equipment design. Int. J. Therm. Sci. 2004, 43, 367–382. [Google Scholar] [CrossRef]
  32. Liang, C.H.; Hu, X.Q.; Ma, L. Effects of Na3PW12O40 on the corrosion behavior of carbon steel in 55% LiBr solution. Mater. Corros. 2007, 58, 39–43. [Google Scholar] [CrossRef]
  33. Guo, J.; Liang, C. Corrosion of carbon steel in concentrated LiNO3 solution at high temperature. Corros. Eng. Sci. Technol. 2002, 14, 197–204. [Google Scholar]
  34. Tanno, K.; Itoh, M.; Sekiya, H.; Yashiro, H.; Kumagai, N. The corrosion inhibition of carbon steel in lithium bromide solution by hydroxide and molybdate at moderate temperaturas. Corros. Sci. 1993, 34, 1453–1461. [Google Scholar] [CrossRef]
  35. Smulko, J.; Darowicki, K.; Zielinski, A. Pitting corrosion in steel and electrochemical noise intensity. Electrochem. Commun. 2002, 4, 388–391. [Google Scholar] [CrossRef]
  36. Sasaki, K.; Isaacs, H.S. Origins of Electrochemical Noise during Pitting Corrosion of Aluminum. J. Electrochem. Soc. 2004, 151, B124–B129. [Google Scholar] [CrossRef]
  37. Barnatt, S. Electrochemical Nature of Corrosion. In Electrochemical Techniques for Corrosion Engineering; Baboian, R., Ed.; National Association of Corrosion Engineers: Houston, TX, USA, 1985; pp. 1–8. [Google Scholar]
Figure 1. Effect of the testing temperature on the variation in the OCP value for 1018 carbon steel in the LiCl-H2O mixtures at the concentrations of (a) 35 and (b) 40 wt.%.
Metals 14 00376 g001
Figure 2. Effect of the testing temperature on the polarization curves for 1018 carbon steel in the LiCl-H2O mixtures at the concentrations of (a) 35 and (b) 40 wt.%.
Metals 14 00376 g002
Figure 3. Effect of the testing temperature on the Nyquist plots for 1018 carbon steel in the LiCl-H2O mixtures at the concentrations of (a) 35 and (b) 40 wt.%.
Metals 14 00376 g003
Figure 4. Effect of the testing temperature on the Bode plots for 1018 carbon steel in the LiCl-H2O mixtures at the concentrations of (a) 35 and (b) 40 wt.%.
Metals 14 00376 g004
Figure 5. Electric circuit used to fit the EIS data.
Metals 14 00376 g005
Figure 6. Time noise series in current for 1018 carbon steel immersed in 35% LiCl-H2O mixtures at (a) 25, (b) 35 and (c) 70 °C.
Metals 14 00376 g006
Figure 7. Time noise series in current for 1018 carbon steel immersed in 40% LiCl-H2O mixtures at (a) 25, (b) 35 and (c) 70 °C.
Metals 14 00376 g007
Figure 8. SEM micrographs of 1018 carbon steel immersed in 35% LiCl-H2O mixtures at (a) 25, (b) 35 and (c) 70 °C.
Metals 14 00376 g008
Figure 9. SEM micrographs of 1018 carbon steel immersed in 40% LiCl-H2O mixtures at (a) 25, (b) 35 and (c) 70 °C.
Metals 14 00376 g009
Table 1. Electrochemical parameters obtained from polarization curves.
T
(°C)
Ecorr
(mV)
Icorr × 10−6
(mA/cm2)
Epit
(mV)
Epit-Ecorr (mV)
35%40%35%40%35%40%35%40%
25−840−8905.711−425−460415435
35−300−59015120−240−45060140
70−360−630290510−220−455140135
Table 2. Electrochemical parameters used to fit the EIS data.
%T
(°C)
Rs
(ohm cm2)
Rct
(ohm cm2)
CPEdl
(F cm−2)
ndlRf
(ohm cm2)
CPEf
(Fcm−2)
nf
3525329501.20 × 10−40.935,1097.23 × 10−50.9
3527705.23 × 10−40.815,7021.50 × 10−40.8
7022608.44 × 10−40.766526.17 × 10−40.7
4025411773.38 × 10−40.830,8253.24 × 10−50.8
3526776.16 × 10−40.793052.17 × 10−40.7
7021458.92 × 10−40.625395.20 × 10−40.6
Table 3. Values of the Icorr value with the different electrochemical techniques used in this work. (×10−6 (mA/cm2)).
T
(°C)
PPCEISEN
35%40%35%40%35%40%
255.7117.2112.83644
351512017.313151139
70290510302.152281211
Disclaimer/Publisher’s Note: The statements, opinions and data contained in all publications are solely those of the individual author(s) and contributor(s) and not of MDPI and/or the editor(s). MDPI and/or the editor(s) disclaim responsibility for any injury to people or property resulting from any ideas, methods, instructions or products referred to in the content.

