Article

Microstructural and Mechanical Characterization of Low-Alloy Fire- and Seismic-Resistant H-Section Steel

1
Incheon R&D Team, Hyundai Steel Company, Incheon 22525, Republic of Korea
2
Department of Materials Science and Engineering, Myongji University, 116 Myongji-ro, Cheoin-gu, Yongin 17058, Republic of Korea
3
Ferrous Alloy Department, Korea Institute of Materials Science, Changwon 51508, Republic of Korea
*
Author to whom correspondence should be addressed.
Metals 2024, 14(4), 374; https://doi.org/10.3390/met14040374
Submission received: 25 January 2024 / Revised: 12 March 2024 / Accepted: 21 March 2024 / Published: 23 March 2024
(This article belongs to the Special Issue Phase Transformation and Microstructure Characterization in Steels)

Abstract

:
This study investigates the microstructure and nano-hardness distribution across the thickness of an H-section steel beam, specifically designed for seismic and fire resistance and fabricated using a quenching and self-tempering process. The beam dimensions include a 24 mm thick flange, with flange and web lengths of 300 mm and 700 mm, respectively. Our findings indicate that the mechanical properties across the flange thickness meet the designed criteria, with yield strengths exceeding 420 MPa, tensile strengths of over 520 MPa, and a yield-to-tensile strength ratio below 0.75. Microstructurally, the central part of the flange predominantly consists of granular bainite with a small fraction of martensite–austenite (MA) constituents, while locations closer to the surface show increased acicular ferrite and decreased MA constituents due to faster cooling rates. Furthermore, thermal exposure at 600 °C reveals that while the matrix microstructure remains thermally stable, the MA phase undergoes tempering, leading to a decrease in nano-hardness. These insights underline the significant impact of MA constituents on the elongation properties and stress concentrations, contributing to the overall understanding of the material’s behavior under seismic and fire conditions. The study’s findings are crucial for enhancing the reliability and safety of construction materials in demanding environments.

1. Introduction

H-shaped structural steel plays a pivotal role in modern building construction, offering essential support and stability. In recent years, the focus has shifted towards enhancing the safety features of these materials, particularly in terms of fire and seismic resistance. This research aims to develop H-shaped steel that can withstand repeated exposure to fire and earthquakes without compromising the structural integrity of buildings. Achieving this involves simultaneously ensuring a low yield-to-tensile strength ratio for enhanced seismic resistance [1] and maintaining high-temperature strength for fire resistance [2].
The development of fire-resistant steel has advanced by incorporating alloying elements such as Mo, Nb, Ti, and V into standard C–Mn steel. This alloy composition is designed to maintain at least two-thirds of its yield strength at room temperature even after being subjected to temperatures of 600 °C for durations ranging from one to three hours [3,4,5]. These alloying elements, particularly Mo and Nb, are instrumental in forming a bainitic microstructure. They contribute to increased high-temperature properties through the formation of fine Nb-rich MX precipitates and a solid solution that impedes dislocation movement [6,7]. Bainitic steels are known for their favorable high-temperature strength and thermal stability, making them ideal for fire-resistant applications [1].
In the context of seismic resistance, recent advancements have focused on optimizing the alloying elements to improve low-cycle fatigue properties and thermal stability, catering to both earthquake and fire scenarios [1]. The quenching and self-tempering (QST) process has been adopted in the production of H-section structural steel beams, emerging as an advanced heat treatment technique. This unique material strengthening process involves intensive surface cooling followed by self-tempering (see Figure 1a). After the finishing rolling stage, the steel’s surface layer undergoes rapid quenching via high-pressure water injection in a quenching facility. Subsequently, the beam self-tempers using the heat retained in its interior. The key parameters in this process are the finishing rolling temperature (FRT) and the finishing cooling temperature (FCT), which are critical for achieving the desired microstructural and mechanical properties (illustrated in Figure 1b,c).
Recent theoretical studies have aimed to quantify these quenching parameters and simulate the transient quenching process [8], offering insights into the optimization of this online manufacturing process. The temperature profile of the quenched surface layer and core layer of the H-section flange is critical. After reaching the self-tempering temperature (STT), the entire section cools uniformly. Understanding the variance in microstructures across the thickness of the H-section flange is crucial, as is controlling processing parameters to achieve uniform microstructure and properties.
This study presents an in-depth analysis of H-section fire- and seismic-resistant structural steel produced by a pilot plant at Hyundai Steel’s Incheon works. The focus is on examining the microstructure and nano-hardness distribution changes through the thickness of the flange, providing a comprehensive understanding of the material’s multiphase microstructure and localized mechanical properties. The mechanical and microstructural properties of similar fire-resistant steel, enhanced by the addition of Mo and Nb, can be found in references [1,6,7,9,10].

2. Materials and Methods

In this study, the steels were produced through a series of carefully controlled processes. Initially, scrap metal was melted in an electric arc furnace to create molten steel. This was followed by refinement in a ladle furnace and subsequent vacuum degassing to achieve the desired alloy composition, as detailed in Table 1. From this refined steel, beam blanks were initially formed. These blanks were then processed into H-section steel beams. The dimensions of these beams were as follows: a flange length (B) of 300 mm, a web length (H) of 750 mm, a flange thickness (tF) of 24 mm, and a web thickness (tW) of 13 mm. The manufacturing process involved hot rolling, followed by a quenching and self-tempering procedure. The finishing rolling temperature (FRT) was maintained at 881 °C, and the finishing cooling temperature (FCT) was controlled at 737 °C. Surface reheating during the self-tempering process occurs due to heat transfer from the core, which has not yet cooled.
To assess the variance in microstructure across the thickness of the steel, specimens were extracted from specific locations. These were taken from the position corresponding to 1/4th of the flange length, as indicated in Figure 1d. The aim of the selection of this particular site to understand the differential impact of the quenching and self-tempering process across the thickness of the steel beam.
For the purpose of microstructural observation, the samples were mechanically polished to a fine finish of 1 μm. Subsequently, for etching, a solution comprising 3 mL of nitric acid (HNO3) and 100 mL of ethanol (C2H5OH), along with a 7% sodium metabisulfite aqueous solution (LePera etchant), was employed. The etched samples were then analyzed using Optical Microscopy (OM) and Scanning Electron Microscopy (SEM) to examine their microstructures. For a more detailed phase analysis, band contrast maps were generated and compared using electron backscatter diffraction (EBSD). The specimens for EBSD analysis underwent final mechanical polishing to 9 μm and were electropolished using an electrolytic solution containing 60 mL of perchloric acid in 1 L of 94% ethanol. This electropolishing was conducted for 10 s at a voltage of 32 V at room temperature, using an electropolisher.
For mechanical testing, tensile specimens were prepared with specific dimensions: a total length of 50 mm, a gauge length of 16 mm, a width of 3 mm, and a thickness of 1.4 mm. Tensile tests were performed at room temperature using a ZwickRoell Z005 tensile testing machine (Zwick-Roell, Ulm, Germany). The tests employed a strain rate of 10−3/s. Strain measurements during these tests were accurately captured and quantified using digital image correlation (DIC). The GOM Correlate software (v.2.0.1) was utilized to facilitate this strain measurement process, ensuring precise and reliable data collection.
Nanoindentation was conducted using an iMicro nanoindenter (Nanomechanics, Oak Ridge, TN, US), which was equipped with a Berkovich indenter. We adopted high-speed nanoindentation mapping, recognized as an innovative approach for the rapid and accurate evaluation of heterogeneous materials across large areas [11,12]. This method is characterized by its rapid execution, with each indentation taking approximately 1 s. However, it is important to note that nanoindentation results are influenced by several factors: the specimen’s surface treatment, the indentation force applied, and the spacing between individual indentations.
To optimize the nanoindentation mapping conditions, preliminary tests were carried out. These tests varied the specimen surface treatment, the indentation force, and the distance between indentations. The findings from these tests are presented as density plots in Figure 2. Specifically, Figure 2a compares nanoindentation results from specimens prepared via two different methods: one subjected to electrolytic polishing at 32 V for 10 s at room temperature in a 60 mL perchloric acid and 1 L ethanol (94%) solution, and the other polished with 0.04 μm of colloidal silica. The mechanically polished specimen using colloidal silica exhibited a wider distribution of nano-hardness, likely due to surface damage incurred during sample preparation. Furthermore, Figure 2b displays the impact of varying indentation forces after electropolishing. It was observed that a lower indentation force of 0.3 mN (resulting in an indentation depth of approximately 40 nm) produced higher average nano-hardness values with greater deviation compared to a force of 4 mN (resulting in approximately 250 nm depth), attributable to the indentation size effect. Additionally, Figure 2c illustrates the effects of varying indent spacing for a 4 mN indentation force. Closer spacing resulted in a higher average nano-hardness value, likely due to overlapping plastic zones from neighboring indentations [11]. Given these observations, the nanoindentation mapping for this study was performed on electropolished surfaces across five randomly selected 100 × 100 μm areas per specimen. In each area, 1089 indentations (33 × 33 matrix) were conducted with an indentation depth of 250 nm and a spacing of 3.3 μm between indentations.

3. Results and Discussion

Figure 3a–c present the OM microstructures at three distinct locations of the flange: the surface, approximately 3 mm inside from the surface, and the central position. Corresponding EBSD inverse pole figure maps and SEM secondary electron images for these locations are depicted in Figure 3d–f and Figure 3g–i, respectively. At the surface, the microstructure is primarily composed of polygonal ferrite (PF) with minor pearlite, extending up to a depth of 400 μm. This formation, possibly resulting from decarburization during the initial stages of processing or mishandling between the completion of finishing rolling and entry into the quenching facility, was observed in the pilot process but not in the later production of H-beam steel.
Deeper within the flange, the predominant internal microstructure is granular bainite (GB) with traces of acicular ferrite (AF), corroborating previous research findings [13]. AF, characterized by its narrow ferrite plates, is highlighted within a red circle in Figure 3b. GB, with its relatively coarser grains, is marked in Figure 3c. The EBSD orientation map (Figure 3f) shows GB with low-angle sub-grain boundaries (gray lines) and high-angle boundaries (black lines) indicating misorientation above 10°. The fraction of low-angle boundaries in Figure 3f (71.3%) is slightly higher than that in Figure 3e (67.3%). Consistent with earlier studies [14], GB regions predominantly exhibit low-angle grain boundaries, whereas AF regions show a higher proportion of high-angle grain boundaries. This aligns with observations from [9,15], suggesting increased AF formation near the surface due to higher cooling rates, as evidenced in Figure 1c.
The SEM images in Figure 3h,i reveal second-phase formations within the GB matrix, identified as martensite–austenite (MA) constituents and degenerated pearlite (DP), marked by arrows in Figure 3i. These observations are in agreement with findings from previous studies [1,9,10,13,15].
Figure 4 illustrates the stress–strain curves obtained from different locations along the flange’s thickness. The corresponding yield and tensile strengths determined from each location are summarized in Table 2. With the exception of the specimen consisting predominantly of polygonal ferrite and pearlite (marked as ①), the yield and tensile strengths were relatively consistent across all locations, averaging approximately 492 MPa and 685 MPa, respectively. Notably, the yield-to-tensile strength ratio remained below 0.75. However, a marked variation was observed in terms of elongation.
The uniform elongation, derived from the true tensile curves, alongside the strain hardening rate for each specimen is also detailed in Table 2. It was observed that the specimen from the central position (marked as ③) exhibited lower elongation, which may be attributed to differences in the cooling rate and the distribution of martensite–austenite (MA) constituents. MA presence is often linked to reduced toughness in steels [16], and the literature suggests that the fraction of MA diminishes with an increased cooling rate [9], leading to marginally enhanced ductility at higher cooling rates [17]. Nanoindentation mapping performed across the thickness of the flange at each specified location yields detailed insights into the variation in MA constituents along the thickness direction.
Prior to discussing the nanoindentation mapping results, Figure 5 illustrates the nanoindentation imprints on the phases identified in the microstructures depicted in Figure 3a,c. As shown in Figure 5a, the nano-hardness of PF was recorded in the range of 2.82 to 3.03 GPa, while pearlite exhibited a nano-hardness of 4.42 to 4.53 GPa. These values align closely with those reported in the literature [18], where ferrite and pearlite registered nano-hardness values of 2.82 ± 0.25 GPa and 4.42 ± 0.14 GPa, respectively. An SEM image capturing the indent on PF is displayed in Figure 5c. Furthermore, the nano-hardness of the GB microstructure, as shown in Figure 5b, was found to be between 3.29 and 3.88 GPa. Notably, in some instances, as shown in Figure 5d, nano-hardness values exceeding 6 GPa were recorded. These findings are consistent with previous research [14], which reported nano-hardness of approximately 3.3 GPa for GB and attributed higher nano-hardness values, approximately 8 GPa, to the MA phase. Comparable results were noted in other bainitic steels with similar yields and tensile strengths to the steel used in this study, where bainite demonstrated nano-hardness of 3.2 ± 0.1 GPa and the MA phase exhibited values around 9.0 ± 2.2 GPa [19].
To gain insight into the causes of high nano-hardness and to determine the proportion of the harder phase, nanoindentation mapping was conducted. SEM and EBSD micrographs of an indented area at the center of the flange thickness are provided in Figure 6a and Figure 6b, respectively.
In Figure 6a, areas enclosed in red boxes exhibit smaller indents, indicative of higher hardness values. A zoomed-in view of one such indented area, along with corresponding hardness values, is presented in Figure 6d. Given that the spacing between indents is approximately 3 μm, the size of the hard phase is inferred to be a few micrometers. These areas are located either at the boundaries or within GB grains, as shown in red boxes in Figure 6b. Figure 6c reveals that these areas correspond to darker regions, which typically display lower band contrast. It is noted that MA constituents usually exhibit low band contrast [20].
The nano-hardness histogram in Figure 6e demonstrates a distribution ranging to up to 10 GPa and centering around 3.5 GPa, the typical value for GB. Load–depth curves for several indents are depicted in Figure 6f, where a steeper slope is observed for the harder phase. This high nano-hardness is attributed to the presence of MA constituents, a finding supported by previous studies [19,21,22]. It has been reported that the nano-hardness of MA varies depending on its morphology, whether slender or blocky [23]. Furthermore, occasional ‘pop-ins’ in the load–depth curves for the harder phase are observed, as indicated by an arrow in Figure 6f. These pop-ins in the curve might be associated with the transformation of retained austenite into martensite [22].
Figure 7a presents box-and-whisker plots that illustrate the distribution of nano-hardness values measured at various positions through the thickness of the flange, as indicated in Figure 1d and in the inset of Figure 7b. Each box in the plot encapsulates the data range from the first quartile (25th percentile) to the third quartile (75th percentile), with the median nano-hardness value represented by the line within each box. Outliers, or data points falling outside the whisker lines, are denoted by dots. These whisker lines extend vertically from each box up to a length of 1.5 times the interquartile range.
Figure 7b features a plot showing the percentage of nano-hardness readings exceeding 6 GPa at each measured position. Notably, the highest fraction of the hard phase is observed in the central location of the flange. This observation aligns with findings from previous research [14], which reported a decrease in the area fraction of MA constituents with an increase in cooling rate. Consistently, the surface of the flange, experiencing a higher cooling rate compared to the center, exhibits a lower fraction of the hard phase.
Further investigations were conducted to ascertain the phase corresponding to areas of low band contrast, as illustrated in Figure 8. Figure 8a displays an optical micrograph of the central position of the flange, etched with LePera etchant solution. It is widely recognized that MA constituents exhibit a bright white appearance in micrographs etched with LePera etchant [10,20,24]. Figure 8b,c present EBSD band contrast and phase identification images. In these, a minor portion of the low band contrast region is identified as austenite (FCC), but the majority is body-centered cubic (BCC), indicating that most of the MA constituents are likely martensite. Similar findings regarding the crystal structure of MA constituents, observed as γ (FCC) and α’ (BCC), were noted in steel of comparable composition via selected area diffraction pattern analysis [10].
Additionally, Figure 8d–f reveal that regions exhibiting low band contrast are associated with higher concentrations of C, Mn, and Si. Previous studies [14,25] have noted that the C concentration in MA constituents is significantly higher than in the surrounding matrix, with C and Si being particularly concentrated within the MA phase.
The results obtained from Figure 6, Figure 7 and Figure 8 reveal several key aspects about the microstructural properties of the flange. Areas exhibiting low band contrast in the EBSD maps correspond to MA constituents, which are associated with higher nano-hardness values. Notably, the concentration of these MA constituents is most significant at the central location of the flange. This distribution of MA constituents is particularly relevant, considering their known impact on reducing material toughness [16,26]. Such a reduction in toughness is consistent with the decreased elongation observed in the stress–strain curves shown in Figure 4, likely attributable to the higher fraction of MA constituents at the center. The presence of hard MA phases induces stress concentrations at the interface between the matrix and the MA constituents, leading to crack formation and further deterioration of the material’s toughness [14].
Figure 9 presents the results of nanoindentation mapping conducted on a specimen from the central location, which was subjected to thermal exposure at 600 °C for 2 h. As indicated by the yellow box in Figure 9a, the nano-hardness in areas with low band contrast is observed to be lower than 6 GPa, as further illustrated in Figure 9b. Figure 9c compares nano-hardness histograms before (represented in red) and after (in blue) thermal exposure. While the median nano-hardness value shows minimal change, there is a notable decrease in the proportion of readings exceeding 6 GPa. Post-thermal exposure, the MA constituent initially present in the pristine steel (Figure 9d) transforms into a tempered MA constituent, as displayed in Figure 9e. This tempered MA structure is characterized by the presence of some carbides within the grains, a morphology similar to that observed in previous studies [21,23]. The decrease in nano-hardness within the MA constituents, attributed to the decomposition of MA, aligns with previously reported findings [27]. Figure 9f illustrates the overall distribution of nano-hardness across the thickness of the steel after thermal exposure. While the median values remain relatively unchanged, the outliers, or data points outside the whiskers, are significantly reduced compared to those in Figure 7a. Notably, the GB microstructure appears to remain unaffected by the thermal treatment, as evidenced by the comparison of Figure 9a with Figure 6b. Additionally, the percentage of nano-hardness measurements exceeding 6 GPa at each measured position following thermal exposure is depicted in Figure 7b.
Figure 10b illustrates how the average nano-hardness and its standard deviation for the central location specimen evolve with an increasing number of thermal exposures at 600 °C for 2 h, as depicted in Figure 10a. Notably, after the first thermal exposure, the nano-hardness remains relatively stable up to the fifth exposure, totaling 10 h of thermal treatment.
Studies on the thermal stability of bainitic microstructures have revealed that such structures remain largely unaffected by thermal exposure at 600 °C for durations extending up to 1000 h. During this period, the bainitic ferrite platelets are preserved, with only the MA constituents undergoing decomposition into ferrite and carbides [1]. This observation suggests that the material retains its microstructure and mechanical properties even after multiple exposures to fire-like conditions. Tensile properties both before and after exposure to thermal conditions at 600 °C ranging from 200 to 1000 h can be found in [1]. In this study, although furnace cooling was employed, it is anticipated that other cooling methods, such as air or water cooling, would have exerted minimal impact on the results. This expectation is based on previous findings indicating that the cooling method has a minor influence when the heating temperature remains below the austenitizing temperature [28].

4. Conclusions

In this study, we have examined the microstructure and nano-hardness distribution across the thickness of an H-section steel beam, which is designed for seismic and fire resistance and manufactured through a quenching and self-tempering process. Additionally, the impact of thermal exposure on the nano-hardness distribution of this steel was investigated. The key findings from our research can be summarized as follows:
(1)
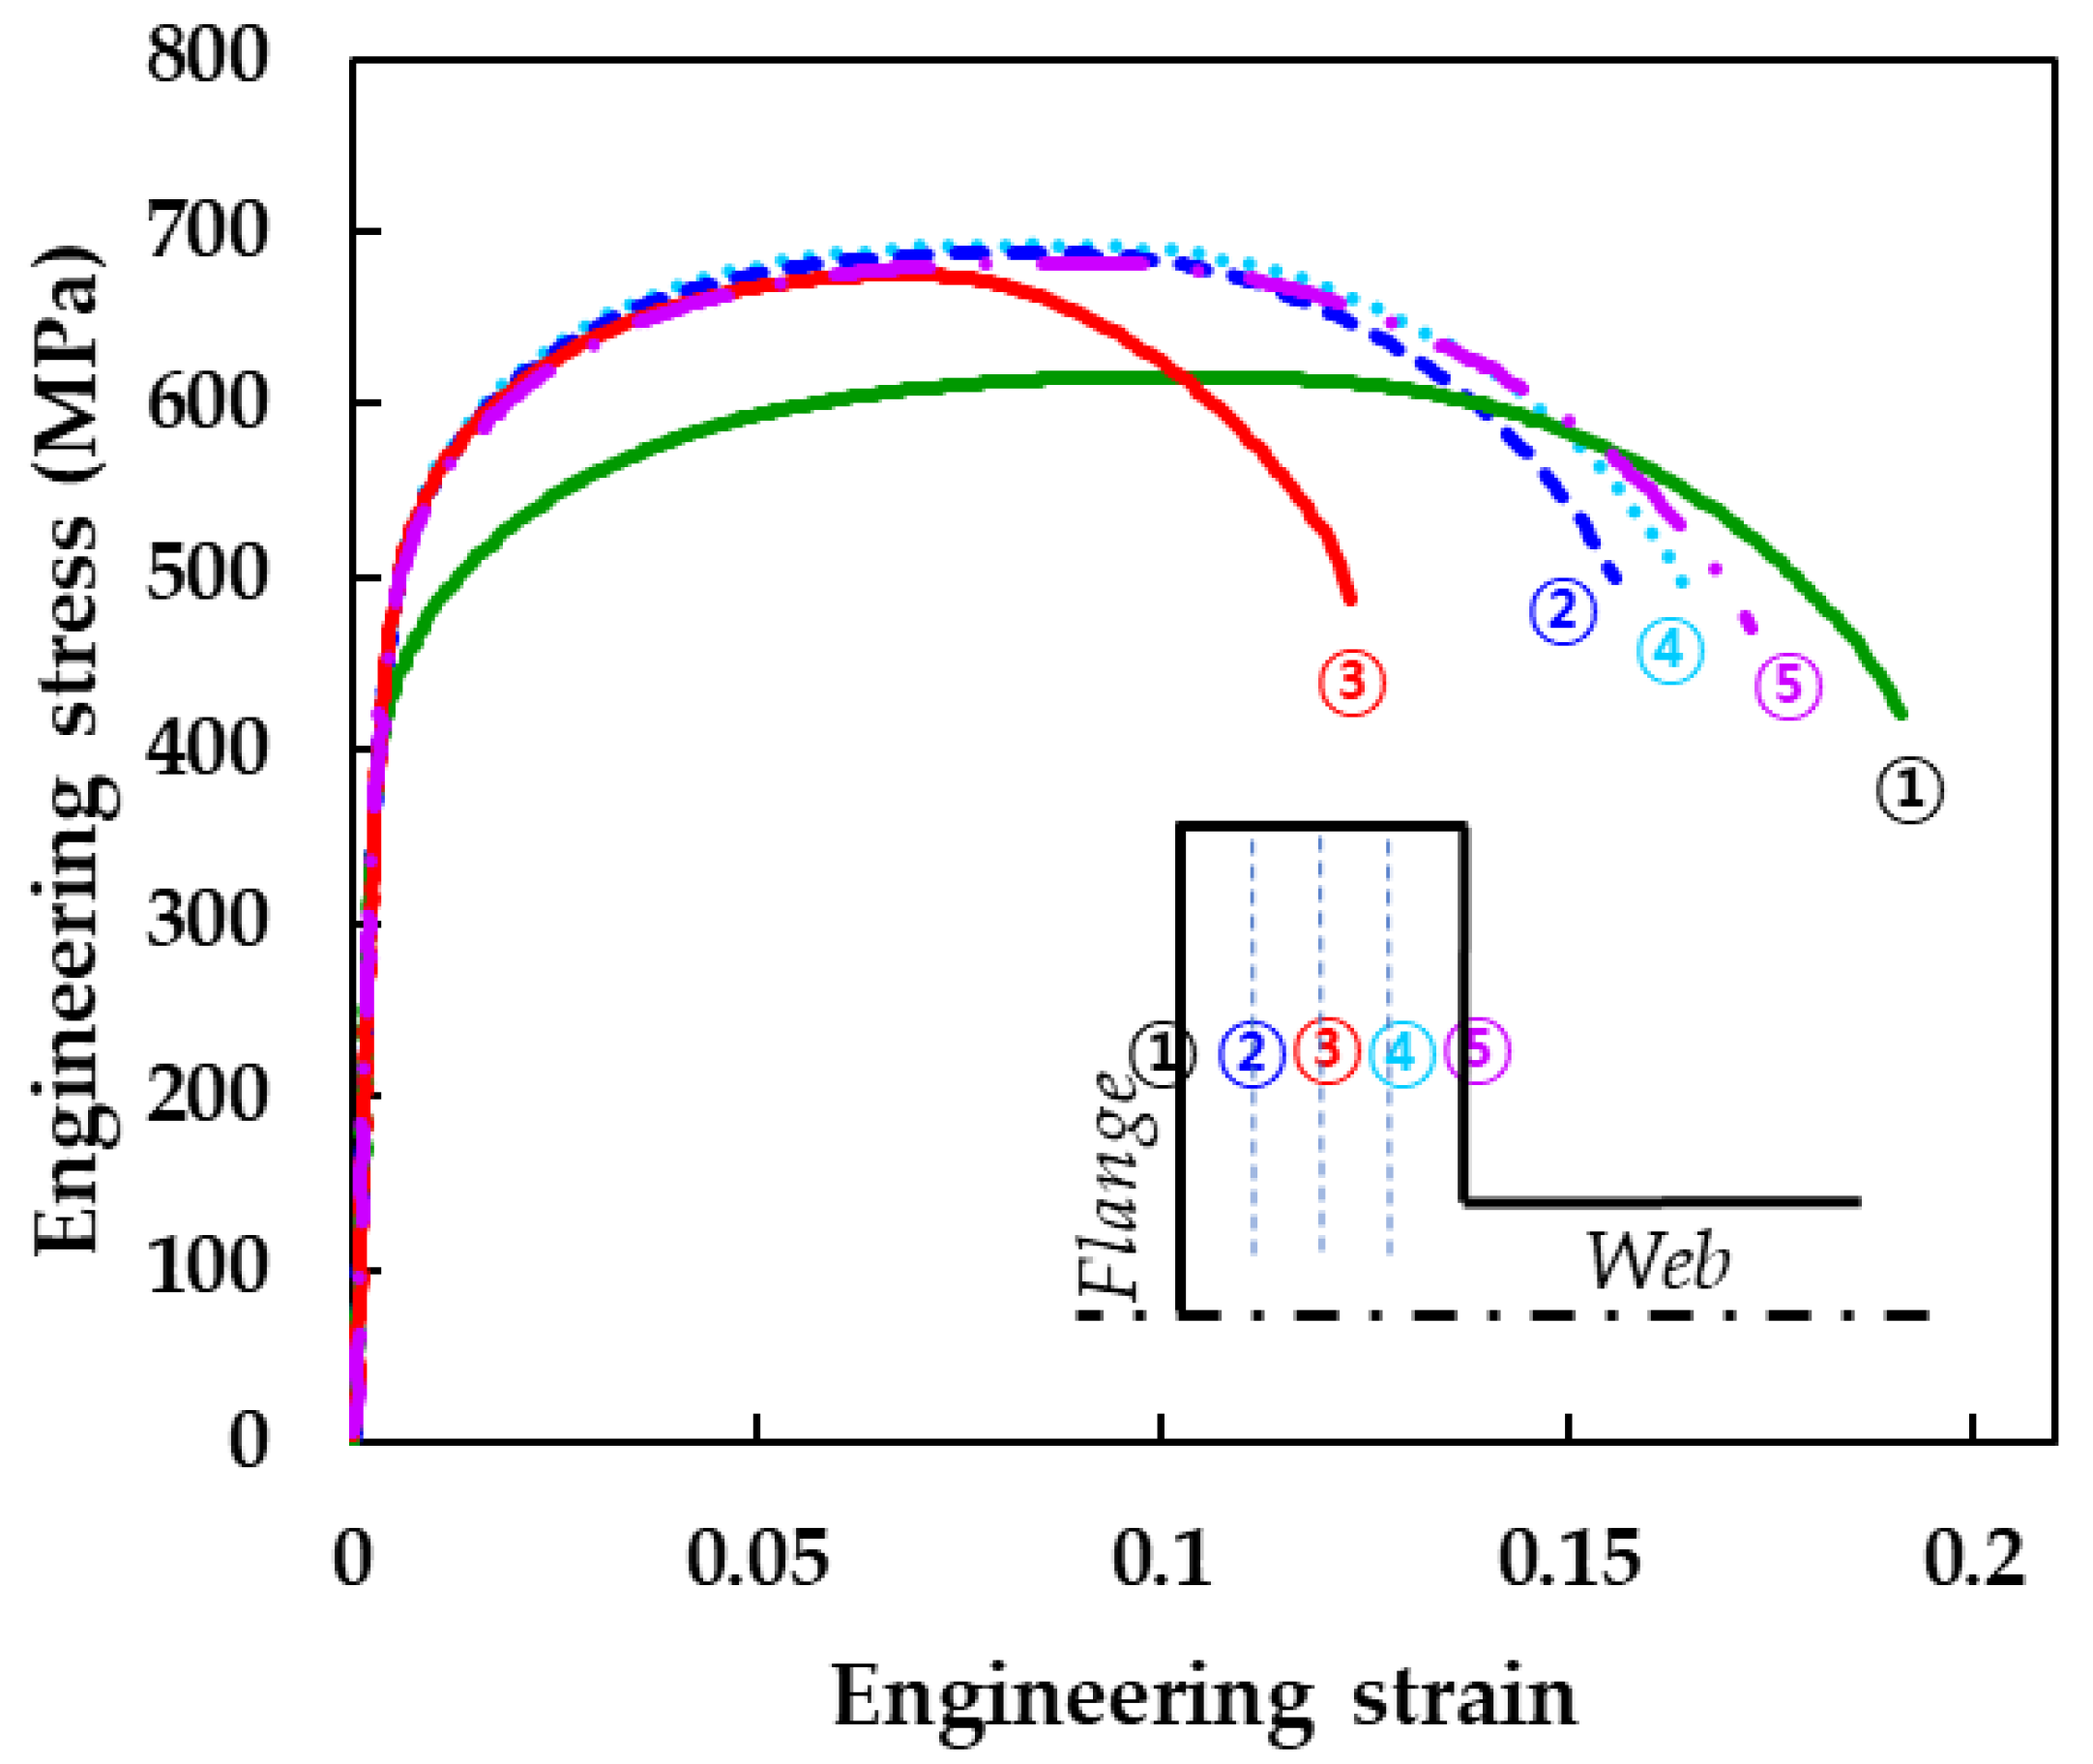
Across all areas of the H-section steel beam with a 24 mm thick flange, which has dimensions of 300 mm (flange length), 700 mm (web length), 24 mm (flange thickness), and 13 mm (web thickness), the steel met the designed mechanical criteria with a yield strength (YS) exceeding 420 MPa, tensile strength (TS) over 520 MPa, and a yield-to-tensile ratio below 0.75.
(2)
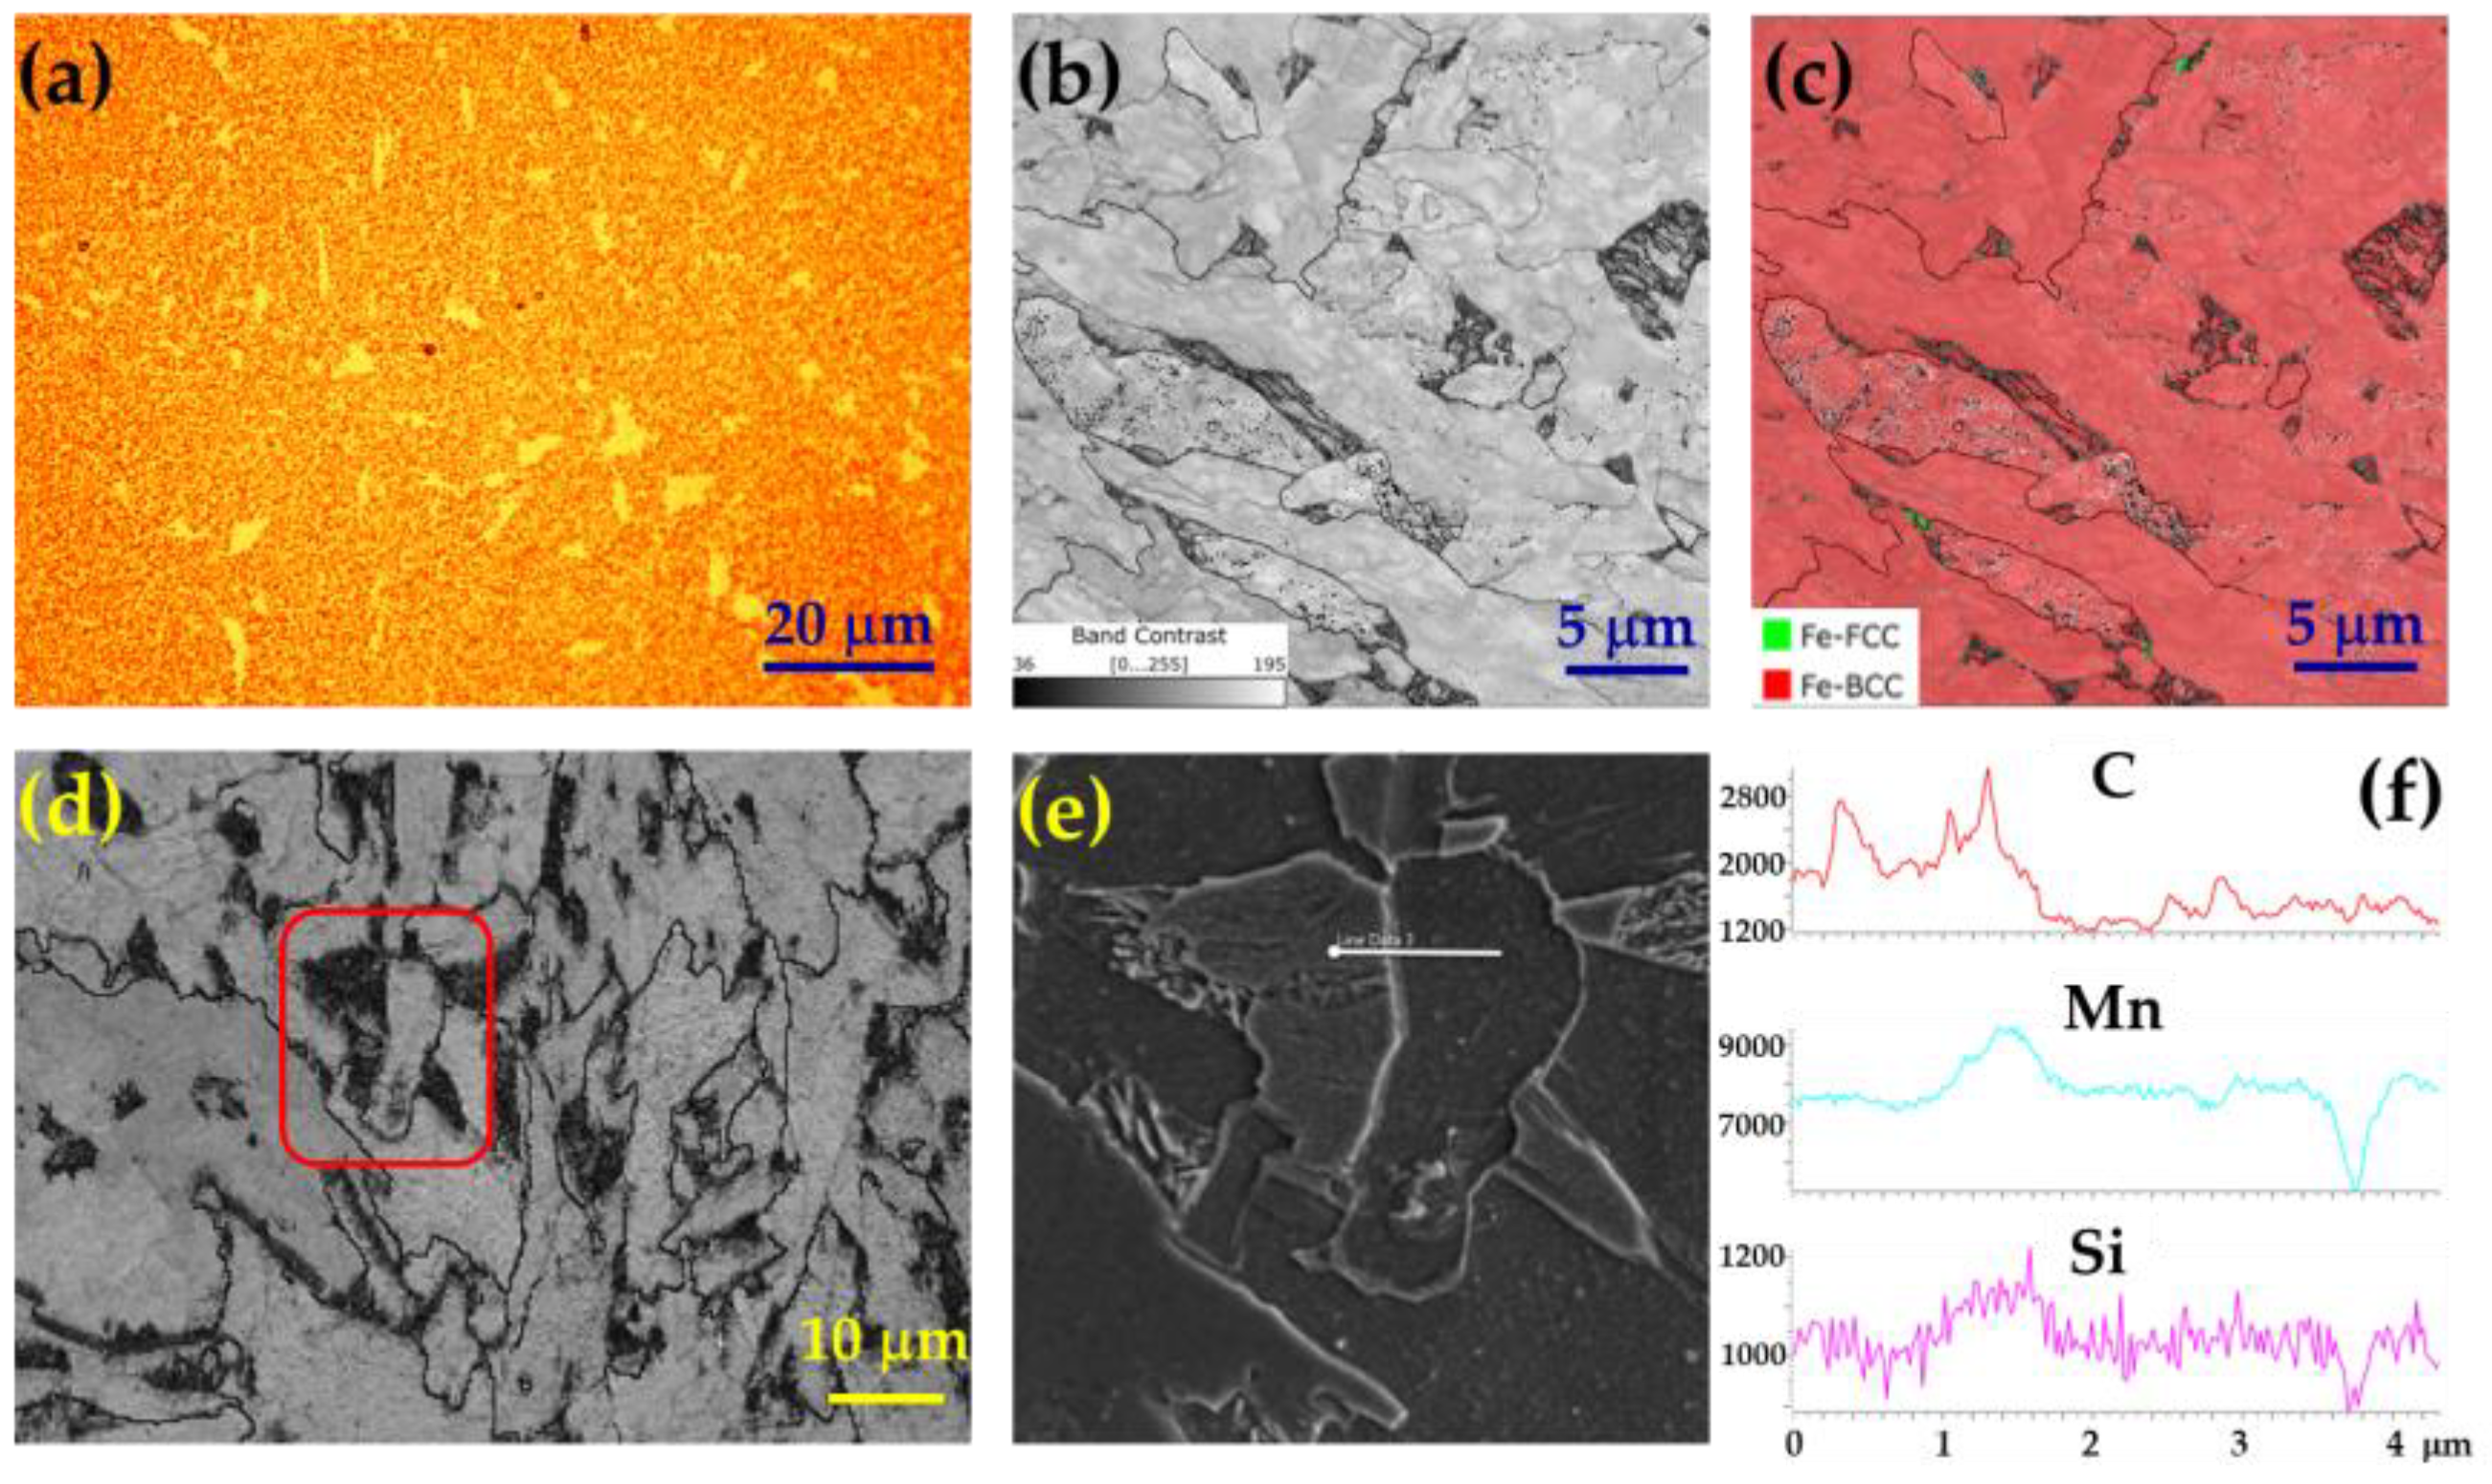
The central position of the flange predominantly features granular bainite with a minor portion of martensite–austenite (MA) constituents. Proximity to the surface results in an increased presence of acicular ferrite and a reduction in MA constituents, attributed to the faster cooling rate. Notably, the presence of MA constituents at the central location is linked to a reduction in elongation, underscoring their influence on mechanical properties.
(3)
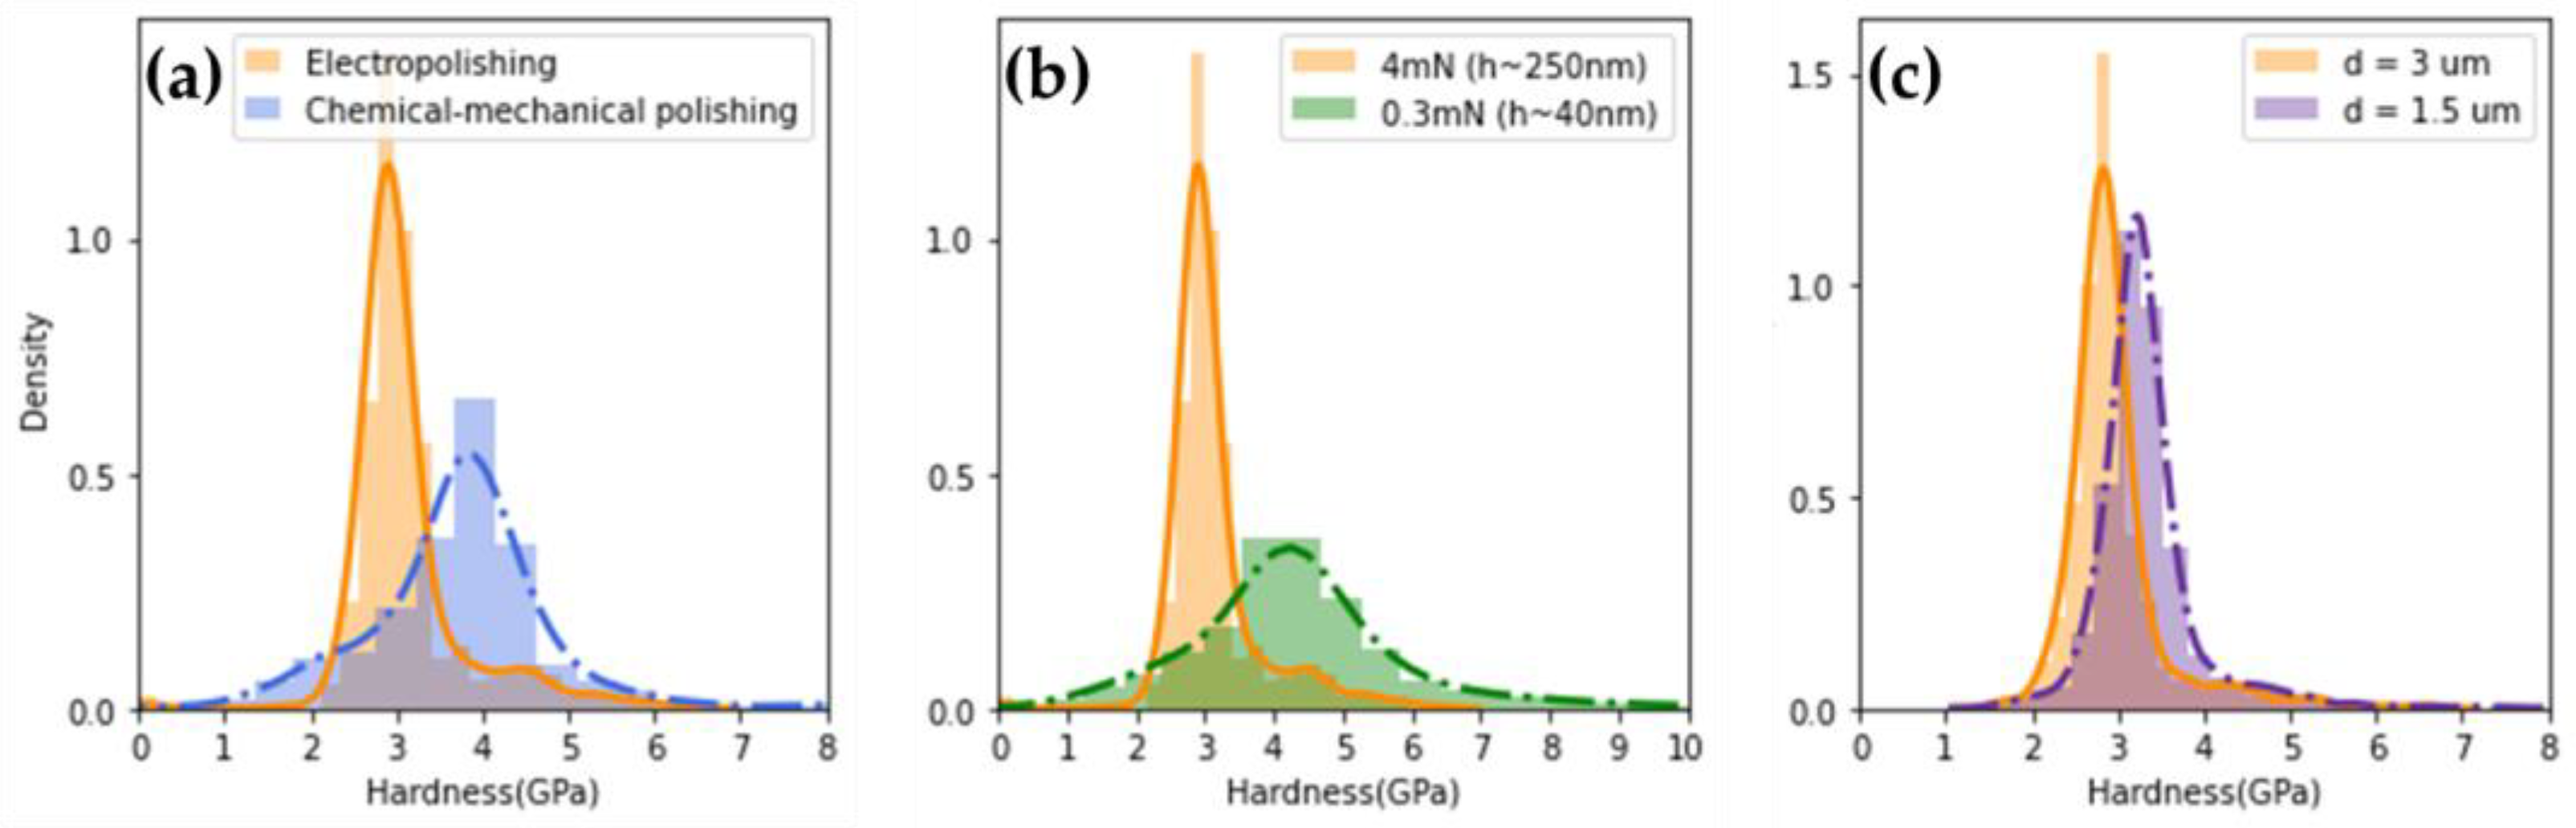
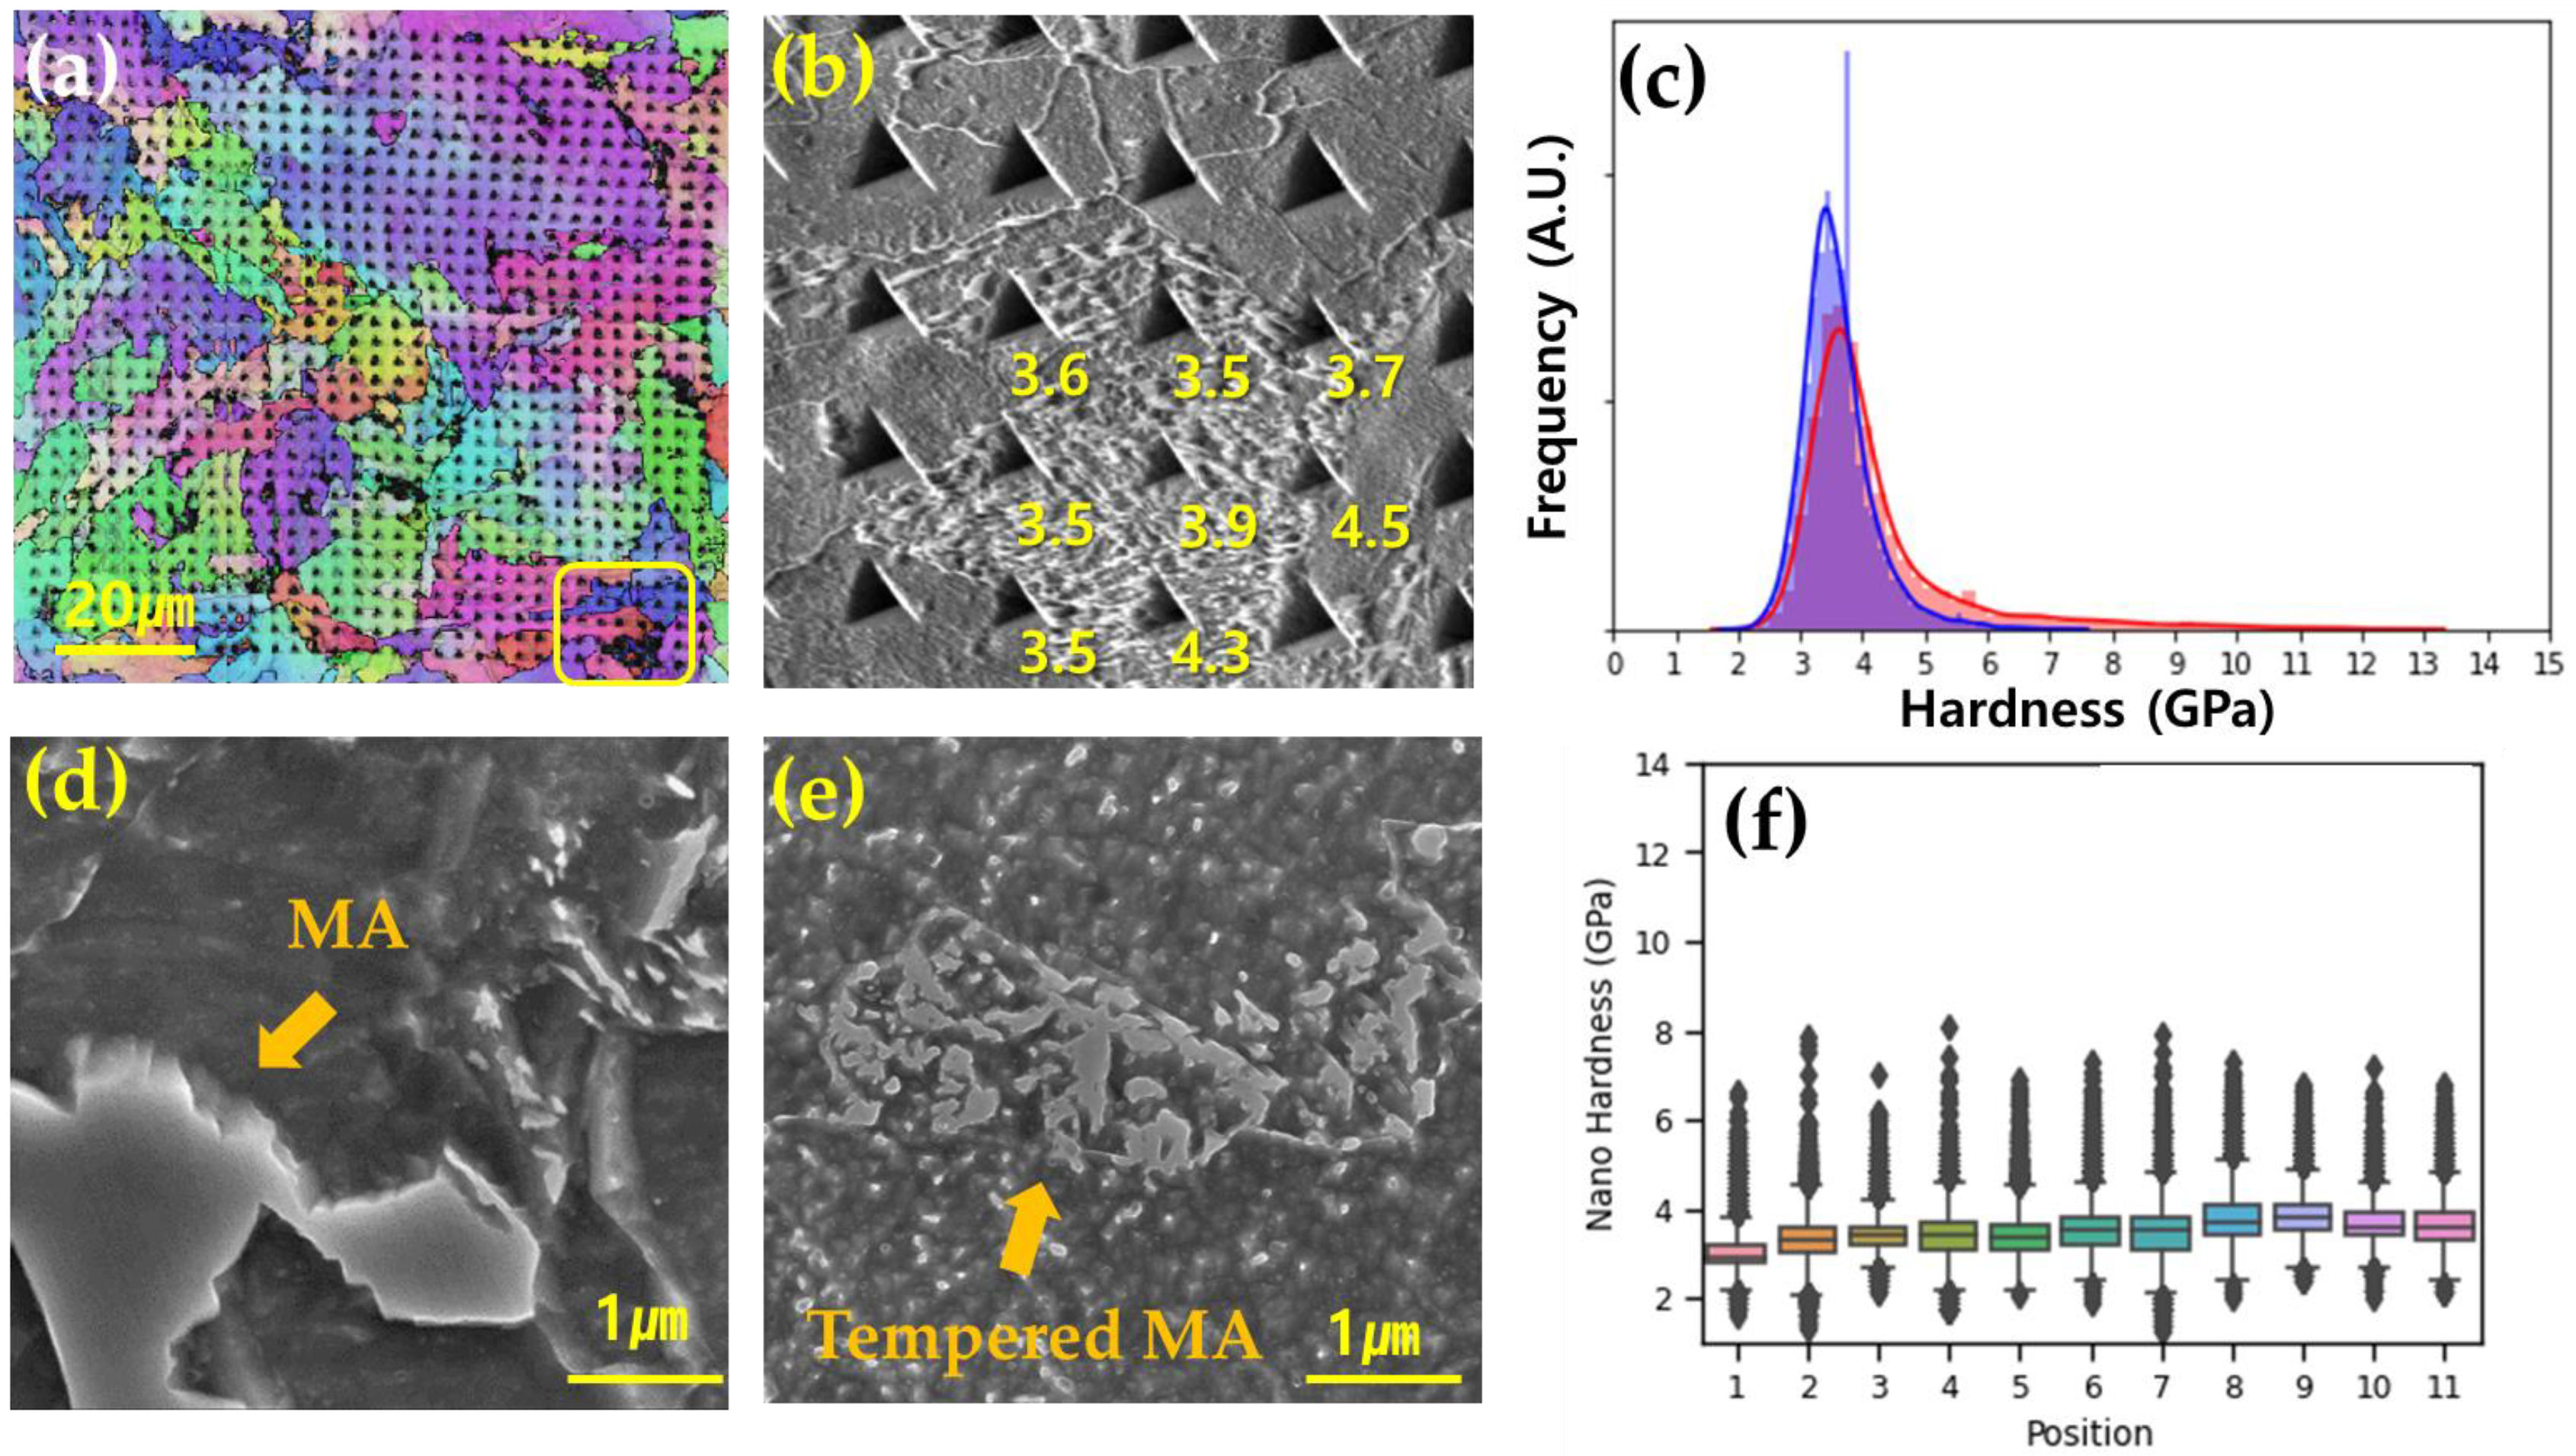
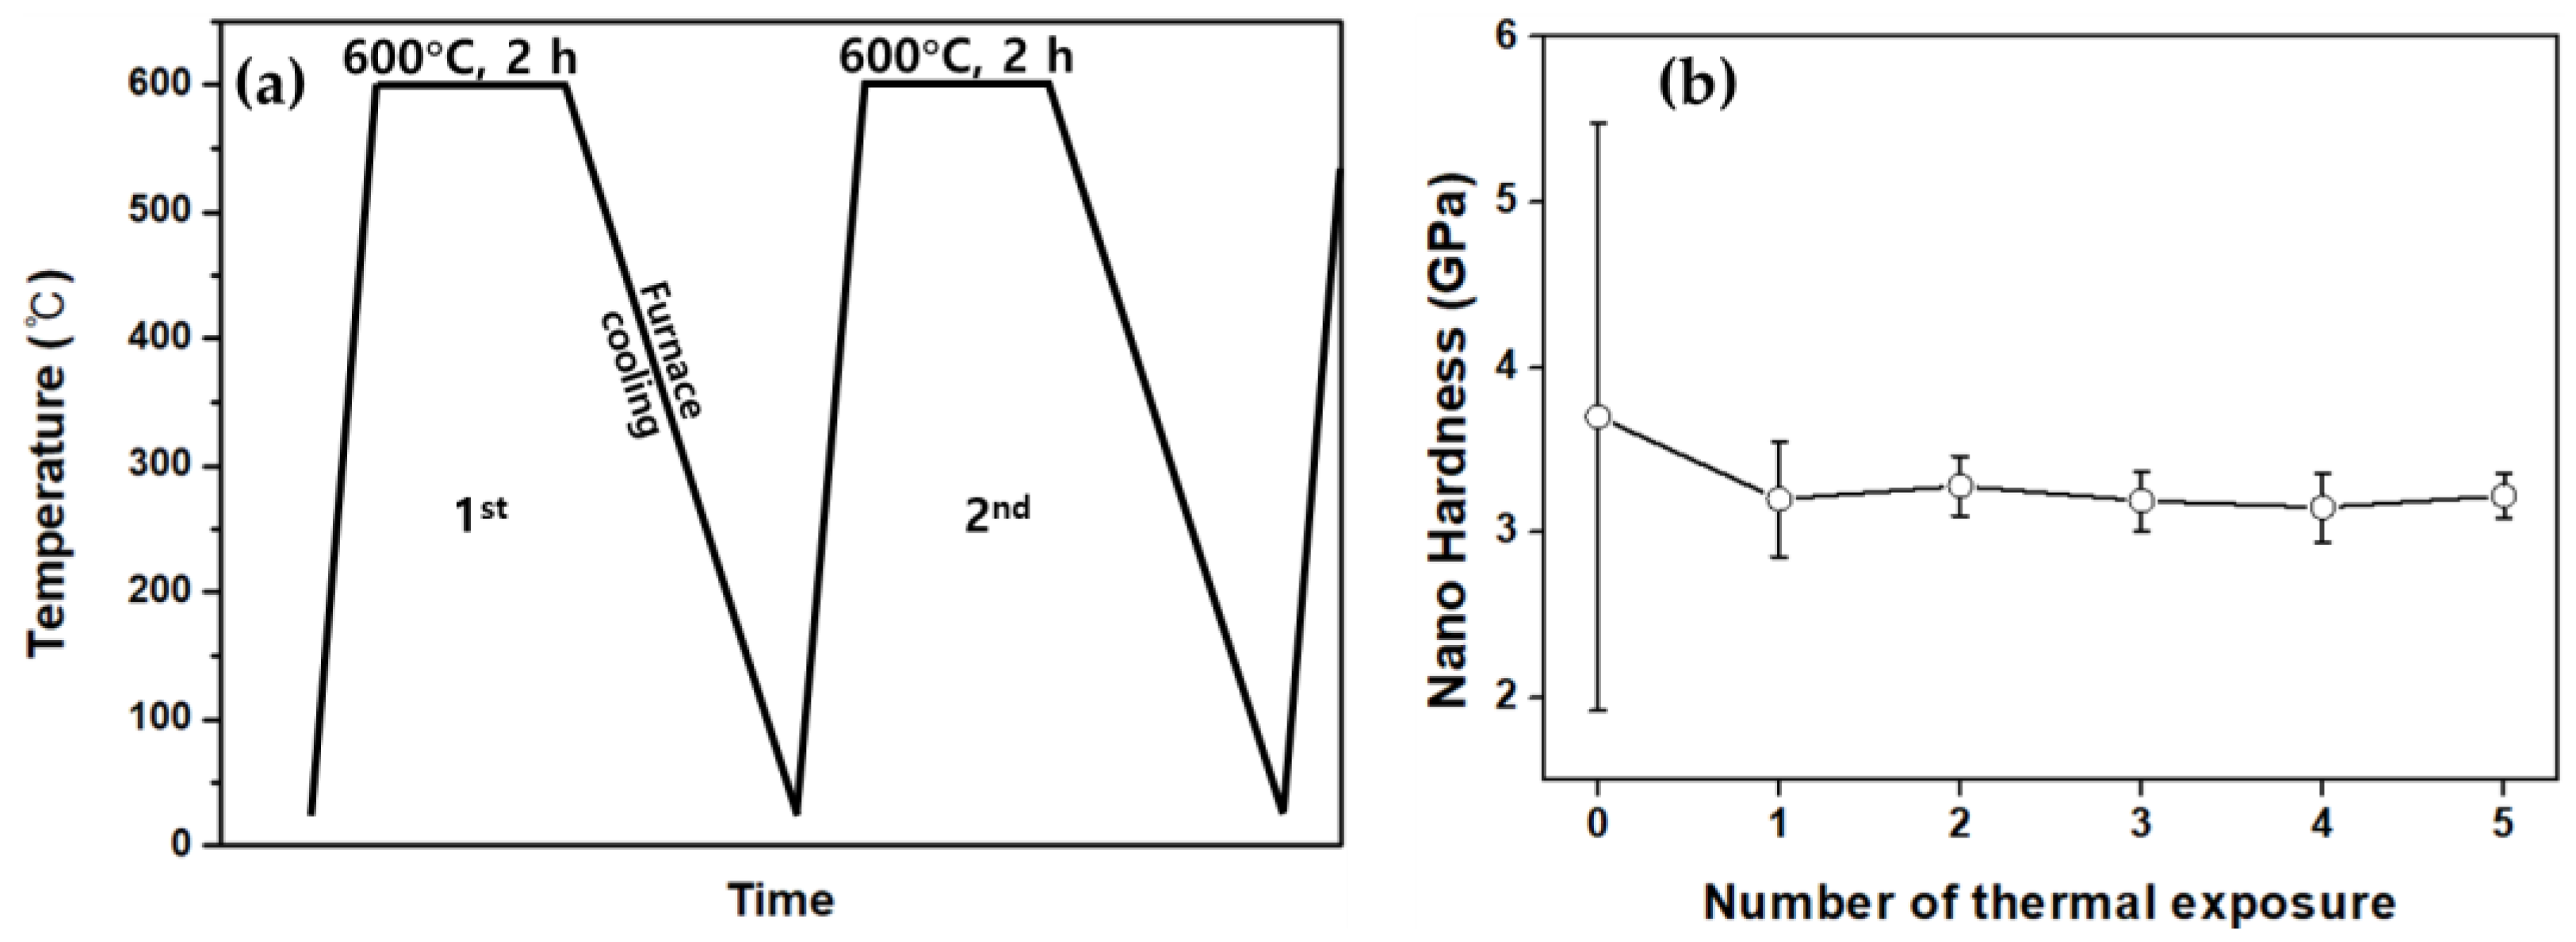
After being subjected to thermal exposure at 600 °C, the matrix microstructure of the steel demonstrated remarkable thermal stability. In contrast, the MA phase experienced tempering, resulting in decreased nano-hardness. This indicates that steel possessing a bainitic microstructure offers considerable advantages in terms of high-temperature strength and thermal stability under fire-simulating conditions.

Author Contributions

J.K.: investigation, data curation, writing—original draft, visualization. G.Y.: investigation, data curation, validation, S.K.: investigation, data curation. J.P.: investigation, data curation, M.A.: investigation, data curation, J.-H.C.: conceptualization, methodology, funding acquisition, project administration, C.-H.L.: conceptualization, methodology, C.S.: conceptualization, methodology, supervision, visualization, writing—review and editing. All authors have read and agreed to the published version of the manuscript.

Funding

This work was supported by the Technology Innovation Program—Materials and Components Development Program (Grant No. 20010453) funded by the Ministry of Trade, Industry and Energy (MOTIE, Republic of Korea).

Data Availability Statement

Data are contained within the article; further inquiries can be directed to the corresponding author.

Conflicts of Interest

Author Jun-Ho Chung was employed by the company Hyundai Steel (South Korea). The remaining authors declare that the research was conducted in the absence of any commercial or financial relationships that could be construed as a potential conflict of interest.

References

  1. Sim, J.H.; Kim, T.Y.; Kim, J.Y.; Kim, C.W.; Chung, J.H.; Moon, J.; Lee, C.H.; Hong, H.U. On the Strengthening Effects Affecting Tensile and Low Cycle Fatigue Properties of Low-Alloyed Seismic/Fire-Resistant Structural Steels. Met. Mater. Int. 2022, 28, 337–345. [Google Scholar] [CrossRef]
  2. Chijiwa, R.; Tamehiro, H.; Yoshida, Y.; Funato, K.; Uemori, R.; Horji, Y. Development and practical application of fire-resistant steel for buildings. Nippon Steel Tech. Rep. 1993, 58, 47–55. [Google Scholar]
  3. Wan, R.; Sun, F.; Zhang, L.; Shan, A. Development and study of high-strength low-Mo fire-resistant steel. Mater. Des. 2012, 36, 227–232. [Google Scholar] [CrossRef]
  4. Yoshida, S.; Okumura, T.; Kita, H.; Takahashi, J.; Ushioda, K. High temperature tensile properties and its mechanism in low carbon Nb-bearing steel. Mater. Trans. 2014, 55, 899–906. [Google Scholar] [CrossRef]
  5. Morozov, Y.D.; Chevskaya, O.N.; Filippov, G.A.; Muratov, A.N. Fire resistant structural steel. Metallurgist 2007, 51, 356–366. [Google Scholar] [CrossRef]
  6. Moon, J.; Kim, S.-D.; Lee, C.-H.; Jo, H.-H.; Hong, H.-U.; Chung, J.-H.; Lee, B.H. Strengthening mechanisms of solid solution and precipitation at elevated temperature in fire-resistant steels and the effects of Mo and Nb addition. J. Mater. Res. Technol. 2021, 15, 5095–5105. [Google Scholar] [CrossRef]
  7. Jo, H.-H.; Shin, C.; Moon, J.; Jang, J.H.; Ha, H.-Y.; Park, S.-J.; Lee, T.-H.; Lee, B.H.; Chung, J.-H.; Speer, J.G.; et al. Mechanisms for improving tensile properties at elevated temperature in fire-resistant steel with Mo and Nb. Mater. Des. 2020, 194, 108882. [Google Scholar] [CrossRef]
  8. Koo, B.S. A theoretical approach for estimating the effect of water-jet quenching on low-carbon steel beams. Sci. Rep. 2021, 11, 15401. [Google Scholar] [CrossRef]
  9. Ramachandran, D.C.; Moon, J.; Lee, C.-H.; Kim, S.-D.; Chung, J.-H.; Biro, E.; Park, Y.-D. Role of bainitic microstructures with M-A constituent on the toughness of an HSLA steel for seismic resistant structural applications. Mater. Sci. Eng. A 2021, 801, 140390. [Google Scholar] [CrossRef]
  10. Nam, J.; Lee, J.; Park, H.; Park, C.; Lee, C.; Chung, J.; Lee, S.-G. Alleviation of Hydrogen Embrittlement to Delay Effective Hydrogen Diffusion Against MA Constituent Formation Due to Mo Solutes for 420 MPa Grade Offshore Steels. Met. Mater. Int. 2023, 29, 1625–1636. [Google Scholar] [CrossRef]
  11. Rossi, E.; Wheeler, J.M.; Sebastiani, M. High-speed nanoindentation mapping: A review of recent advances and applications. Curr. Opin. Solid State Mater. Sci. 2023, 27, 101107. [Google Scholar] [CrossRef]
  12. Besharatloo, H.; Carpio, M.; Cabrera, J.-M.; Mateo, A.M.; Fargas, G.; Wheeler, J.M.; Roa, J.J.; Llanes, L. Novel Mechanical Characterization of Austenite and Ferrite Phases within Duplex Stainless Steel. Metals 2020, 10, 1352. [Google Scholar] [CrossRef]
  13. Kim, I.; Lee, M.; Choi, Y.; Kang, N. Effects of Mo Content on Low-Angle Misorientation Microstructure and Mechanical Properties of YS 550 MPa-Grade Steels for Offshore Structures. Steel Res. Int. 2018, 89, 1700278. [Google Scholar] [CrossRef]
  14. Lan, H.F.; Du, L.X.; Liu, X.H. Microstructure and Mechanical Properties of a Low Carbon Bainitic Steel. Steel Res. Int. 2013, 84, 352–361. [Google Scholar] [CrossRef]
  15. Shrestha, S.L.; Breen, A.J.; Trimby, P.; Proust, G.; Ringer, S.P.; Cairney, J.M. An automated method of quantifying ferrite microstructures using electron backscatter diffraction (EBSD) data. Ultramicroscopy 2014, 137, 40–47. [Google Scholar] [CrossRef] [PubMed]
  16. Liang, X.J.; Hua, M.J.; DeArdo, A.J. The Mechanism of Martensite-Austenite Microconstituents Formation during Thermomechanical Controlling Processing in Low Carbon Bainitic Steel. Mater. Sci. Forum 2014, 783–786, 704–712. [Google Scholar] [CrossRef]
  17. Huda, N.; Wang, Y.; Li, L.; Gerlich, A.P. Effect of martensite-austenite (MA) distribution on mechanical properties of inter-critical Reheated Coarse Grain heat affected zone in X80 linepipe steel. Mater. Sci. Eng. A 2019, 765, 138301. [Google Scholar] [CrossRef]
  18. Pham, T.-H.; Nguyen, N.-V. Mechanical properties of constituent phases in structural steels and heat-affected zones investigated by statistical nanoindentation analysis. Constr. Build. Mater. 2021, 268, 121211. [Google Scholar] [CrossRef]
  19. Fujita, N.; Ishikawa, N.; Roters, F.; Tasan, C.C.; Raabe, D. Experimental–numerical study on strain and stress partitioning in bainitic steels with martensite–austenite constituents. Int. J. Plast. 2018, 104, 39–53. [Google Scholar] [CrossRef]
  20. Ko, K.K.; Jang, J.H.; Tiwari, S.; Bae, H.J.; Sung, H.K.; Kim, J.G. Quantitative analysis of retained austenite in Nb added Fe-based alloy. Appl. Microsc. 2022, 52, 5. [Google Scholar] [CrossRef]
  21. Huda, N.; Lazor, R.; Gerlich, A.P. Study of MA Effect on Yield Strength and Ductility of X80 Linepipe Steels Weld. Metall. Mater. Trans. A 2017, 48, 4166–4179. [Google Scholar] [CrossRef]
  22. Zhou, S.; Hu, F.; Wang, K.; Hu, C.; Dong, H.; Wan, X.; Cheng, S.; Misra, R.D.K.; Wu, K. A study of deformation behavior and stability of retained austenite in carbide-free bainitic steel during nanoindentation process. J. Mater. Res. Technol. 2022, 20, 2221–2234. [Google Scholar] [CrossRef]
  23. Huda, N.; Midawi, A.; Gianetto, J.A.; Gerlich, A.P. Continuous cooling transformation behaviour and toughness of heat-affected zones in an X80 line pipe steel. J. Mater. Res. Technol. 2021, 12, 613–628. [Google Scholar] [CrossRef]
  24. Han, Y.; Kuang, S.; Liu, H.-s.; Jiang, Y.-h.; Liu, G.-h. Effect of Chromium on Microstructure and Mechanical Properties of Cold Rolled Hot-dip Galvanizing DP450 Steel. J. Iron Steel Res. Int. 2015, 22, 1055–1061. [Google Scholar] [CrossRef]
  25. Kim, I.; Nam, H.; Lee, M.; Nam, D.; Park, Y.; Kang, N. Effect of Martensite–Austenite Constituent on Low-Temperature Toughness in YS 500 MPa Grade Steel Welds. Metals 2018, 8, 638. [Google Scholar] [CrossRef]
  26. Junhua, K.; Lin, Z.; Bin, G.; Pinghe, L.; Aihua, W.; Changsheng, X. Influence of Mo content on microstructure and mechanical properties of high strength pipeline steel. Mater. Des. 2004, 25, 723–728. [Google Scholar] [CrossRef]
  27. Huda, N.; Ding, Y.; Gerlich, A.P. Temper-treatment development to decompose detrimental martensite–austenite and its effect on linepipe welds. Mater. Sci. Technol. 2017, 33, 1978–1992. [Google Scholar] [CrossRef]
  28. Wang, X.-Q.; Tao, Z.; Hassan, M.K. Post-fire behaviour of high-strength quenched and tempered steel under various heating conditions. J. Constr. Steel Res. 2020, 164, 105785. [Google Scholar] [CrossRef]
Figure 1. (a) Illustration of the quenching process applied to a hot-rolled H-beam; (b) cross-sectional view detailing the quenching mechanism of the H-beam, including specific dimensions and structural components; (c) graphical representation of the typical temperature profile experienced during the QST process, highlighting key thermal transitions; (d) photograph of an actual H-beam post-QST treatment, with specific locations marked for subsequent microstructural and mechanical analysis.
Metals 14 00374 g001
Figure 2. Detailed analysis of factors influencing nano-hardness measurements. (a) Impact of specimen surface treatment methods (4 mn indentation force); (b) effect of indentation force; (c) influence of spacing between indents (4 mN indentation force).
Metals 14 00374 g002
Figure 3. OM micrograph, EBSD orientation map, and SEM micrograph of microstructure observed at (a,d,g) the surface of the flange; (b,e,h) approximately 3 mm inside from the surface of the flange; (c,f,i) the central position along the thickness of the flange.
Metals 14 00374 g003
Figure 4. Engineering stress–strain curves from different locations in the flange thickness.
Metals 14 00374 g004
Figure 5. Nano-hardness measurement of (a) the PF and pearlite microstructure and (b) the GB microstructure; SEM image of the nanoindentation imprint on (c) PF and (d) instance of nano-hardness exceeding 6 GPa.
Metals 14 00374 g005
Figure 6. Nanoindentation mapping at the center of the flange thickness. (a,d) SEM micrographs depicting the nanoindentation imprints in the indented area; (b) EBSD micrograph highlighting the microstructural composition of the indented area; (c) band contrast image correlating with the nanoindentation marks; (e) histogram displaying the distribution of hardness values obtained from nanoindentation mapping, (f) load–depth curves representing the mechanical response of different microstructural components under indentation.
Metals 14 00374 g006
Figure 7. Analysis of nano-hardness across flange thickness. (a) Box-and-whisker plots illustrating the distribution of nano-hardness values at different locations through the thickness of the flange; (b) a graph depicting the percentage of nano-hardness measurements exceeding 6 GPa at each location.
Metals 14 00374 g007
Figure 8. (a) OM micrograph etched with LePera solution, (b,c) band contrast and phase identification, (df) band contrast, SEM, and EDS line analysis of elements of MA constituent.
Metals 14 00374 g008
Figure 9. (a) Nanoindentation mapping of the central location specimen after exposure to 600 °C for 2 h, highlighting areas with low band contrast (yellow box); (b) close-up view showing nano-hardness values below 6 GPa in the identified low-band-contrast areas; (c) histograms comparing nano-hardness distributions before (red) and after (blue) thermal exposure; SEM image of (d) the pristine MA constituent in the steel before thermal exposure and (e) tempered MA constituent post-thermal exposure; (f) through-thickness distribution of nano-hardness post-thermal exposure.
Metals 14 00374 g009
Figure 10. (a) Multiple thermal exposures at 600 °C for 2 h each for the cumulative thermal treatment process; (b) evolution of average nano-hardness and its standard deviation over successive thermal exposures.
Metals 14 00374 g010
Table 1. The composition of the steel used in this study. All the numbers are given in wt%.
FeCSiMnCrMoCuTiNbAlBN
Bal.0.080.231.380.290.120.130.0280.0460.0200.00220.009
Table 2. Mechanical properties and yield-to-tensile strength ratio evaluated from Figure 4.
Position0 (①)1/4 (②)1/2 (③)3/4 (④)1 (⑤)
YS (MPa)427.6 (±2.1)493.9 (±9.4)507.8 (±23.3)482.4 (±26.5)482.9 (±4.9)
UTS (MPa)616.9 (±2.4)688.1 (±2.3)674.8 (±1.7)693.3 (±0.6)681.3 (±1.0)
UE (%)9.2 (±0.4)7.6 (±0.4)6.1 (±0.4)7.9 (±0.06)8.0 (±0.3)
Yield ratio0.690.720.750.700.71
Disclaimer/Publisher’s Note: The statements, opinions and data contained in all publications are solely those of the individual author(s) and contributor(s) and not of MDPI and/or the editor(s). MDPI and/or the editor(s) disclaim responsibility for any injury to people or property resulting from any ideas, methods, instructions or products referred to in the content.

