Article

Dynamic Recrystallization Nucleation Mechanism and Precipitation Behavior of Homogeneous Al-Zn-Mg-Cu Alloy during Hot Deformation

School of Materials Science and Engineering, Taiyuan University of Science and Technology, Taiyuan 030024, China
*
Author to whom correspondence should be addressed.
Metals 2024, 14(4), 449; https://doi.org/10.3390/met14040449
Submission received: 9 March 2024 / Revised: 31 March 2024 / Accepted: 9 April 2024 / Published: 11 April 2024
(This article belongs to the Section Crystallography and Applications of Metallic Materials)

Abstract

:
The hot deformation behavior of Al-Zn-Mg-Cu alloy was investigated by flow stress curves in isothermal hot compression experiments with deformation temperatures of 350–450 °C and strain rates of 0.01 s−1 to 1 s−1, and the constitutive equation of homogeneous alloy was obtained. At the same time, the dynamic recrystallization and precipitation behavior during hot deformation and the relationship between them and the Z parameters were studied by using EBSD and TEM. DRV is the main mechanism of dynamic softening. With the decrease in Z parameter, the softening mechanism changes from dynamic recovery to discontinuous dynamic recrystallization or continuous dynamic recrystallization. At a higher Z parameter, the dislocation density and precipitated phase density are also higher because the high dislocation density provides heterogeneous nucleation sites of the precipitated phase. A large number of precipitates in the alloy also inhibit the nucleation and growth of dynamic recrystallization by hindering dislocation movement and grain boundary migration.

1. Introduction

In recent decades, aluminum alloys have been widely considered because of their excellent properties. Their high specific strength, corrosion resistance, and excellent formability have made them widely used in aerospace, ocean navigation, and automobile industries. Aging-hardened Al-Zn-Mg-Cu alloys are a very important group of alloys because they have the characteristics of light weight, high strength, high toughness, and rapid aging response [1,2,3]. Al-Zn-Mg-Cu alloys often undergo hot deformation treatments, such as extrusion, hot rolling, and forging, before they become the final process products, so higher requirements are put forward for their hot workability [4,5]. During hot deformation, Al-Zn-Mg-Cu alloys often exhibit dynamic softening behavior, which is attributed to dynamic recovery (DRV) and dynamic recrystallization (DRX). Because of the high stacking fault energy, DRV occurs easily in Al-Zn-Mg-Cu alloy, but DRX mainly occurs at high temperatures and low strain rates [6].
Continuous dynamic recrystallization (CDRX), discontinuous dynamic recrystallization (DDRX), geometric dynamic recrystallization (GDRX), and other DRX behaviors have been successively found in aluminum alloys [7]. DDRX is characterized by the formation of new recrystallized grains at grain boundaries, and the nucleation and growth of recrystallized grains can be found at the same time [8]. CDRX is formed by the progressive rotation of subgrains. When dislocations fully accumulate, low-angle grain boundaries (LAGBs) can be formed. Due to the continuous rotation of subgrain boundaries, the orientation difference increases, and then LAGBs gradually transform into high-angle grain boundaries (HAGBs) [9]. The grain refinement of aluminum alloy occurs through the process of grain elongation and thinning under high temperature and large strain, which leads to a sharp increase in grain boundary area. Due to the formation of a subgrain boundary (SGB), it becomes serrated, and finally the grain boundary is pinched to form new grains [10]. This is the formation process of GDRX. Among the above three mechanisms, only DDRX shows new grain nucleation. Although these three mechanisms have obvious characteristics, they are not easy to distinguish in practice.
Precipitation strengthening is the main strengthening method of Al-Zn-Mg-Cu alloy, and a large number of nanometer precipitates produced by aging treatments show obvious improvement on the mechanical properties of the alloy [11]. The precipitation sequence during aging is as follows: supersaturated solid solution (SSS) → Guinier–Preston zones (GP Ⅰ, Ⅱ) → η’→ η [12,13,14]. At the same time, the precipitation behavior is also affected during hot deformation. Wang et al. have studied the dynamic precipitation behavior of Al-Cu-Li alloy at deformation temperatures of 300 °C and 400 °C and strain rates of 0.01 s−1 and 0.1 s−1, finding that the precipitated phase will not affect the recrystallization mechanism but will significantly change the dynamic recrystallization fraction [15]. At the same time, it has been long believed that the coarse insoluble phases in Al-Cu-Li alloy can promote particle stimulated nucleation (PSN) and significantly increase the volume fraction of dynamic recrystallization and flow stress at low temperatures (<400 °C) [16].
The relationship between temperature, strain, and strain rate can be expressed by an accurate model, and the Arrhenius equation of strain compensation is widely used to predict the flow stress of aluminum alloy under specified conditions [17]. Combined with the experimental data on hot compression, the Arrhenius equation with the Zener–Hollomon parameter (Z) can not only evaluate the relationship between temperature, strain rate, and flow stress but also establish a hot working diagram based on a dynamic material model (DMM) to find the best processing parameters [18].
The Z value was found to be related to the microstructure evolution during hot deformation [19]. Tang [20] and others have studied the hot deformation behavior of Al-Zn-Mg-Cu alloys with different Zn contents at 300 °C and 400 °C, and 0.01 s−1 and 0.1 s−1 strain rates and found that different Z values affect the dynamic softening. Sun [21] and others have found that the lnZ value affects the microstructure change in high strength 7xxx aluminum alloy. With the lnZ value from high to low, the microstructure of the sample was softened by DRV, DRV + DRX, and DRX, in turn. Ding [22] and others have also found similar results in 6063 aluminum alloy.
Although the relationship between Z and the dynamic softening of Al-Zn-Mg-Cu alloys has been found, the effect of Z on DRX is rarely mentioned, and the relationship between dynamic precipitation and dynamic recrystallization during hot deformation is also poorly understood. Based on the Gleeble thermal simulation compression experiment, electron backscattering diffraction (EBSD) images and transmission electron microscope (TEM) images, the softening behavior of a new Al-Zn-Mg-Cu alloy was discussed. The relationship between the change in the lnZ value and the dominant mechanism of DRX was studied. The evolution process of different DRX was described in detail. At the same time, the role of the precipitate phase in the thermal deformation process was discussed from the point of view of precipitation behavior, which provided guidance for the practical production of high-strength 7 series aluminum alloy.

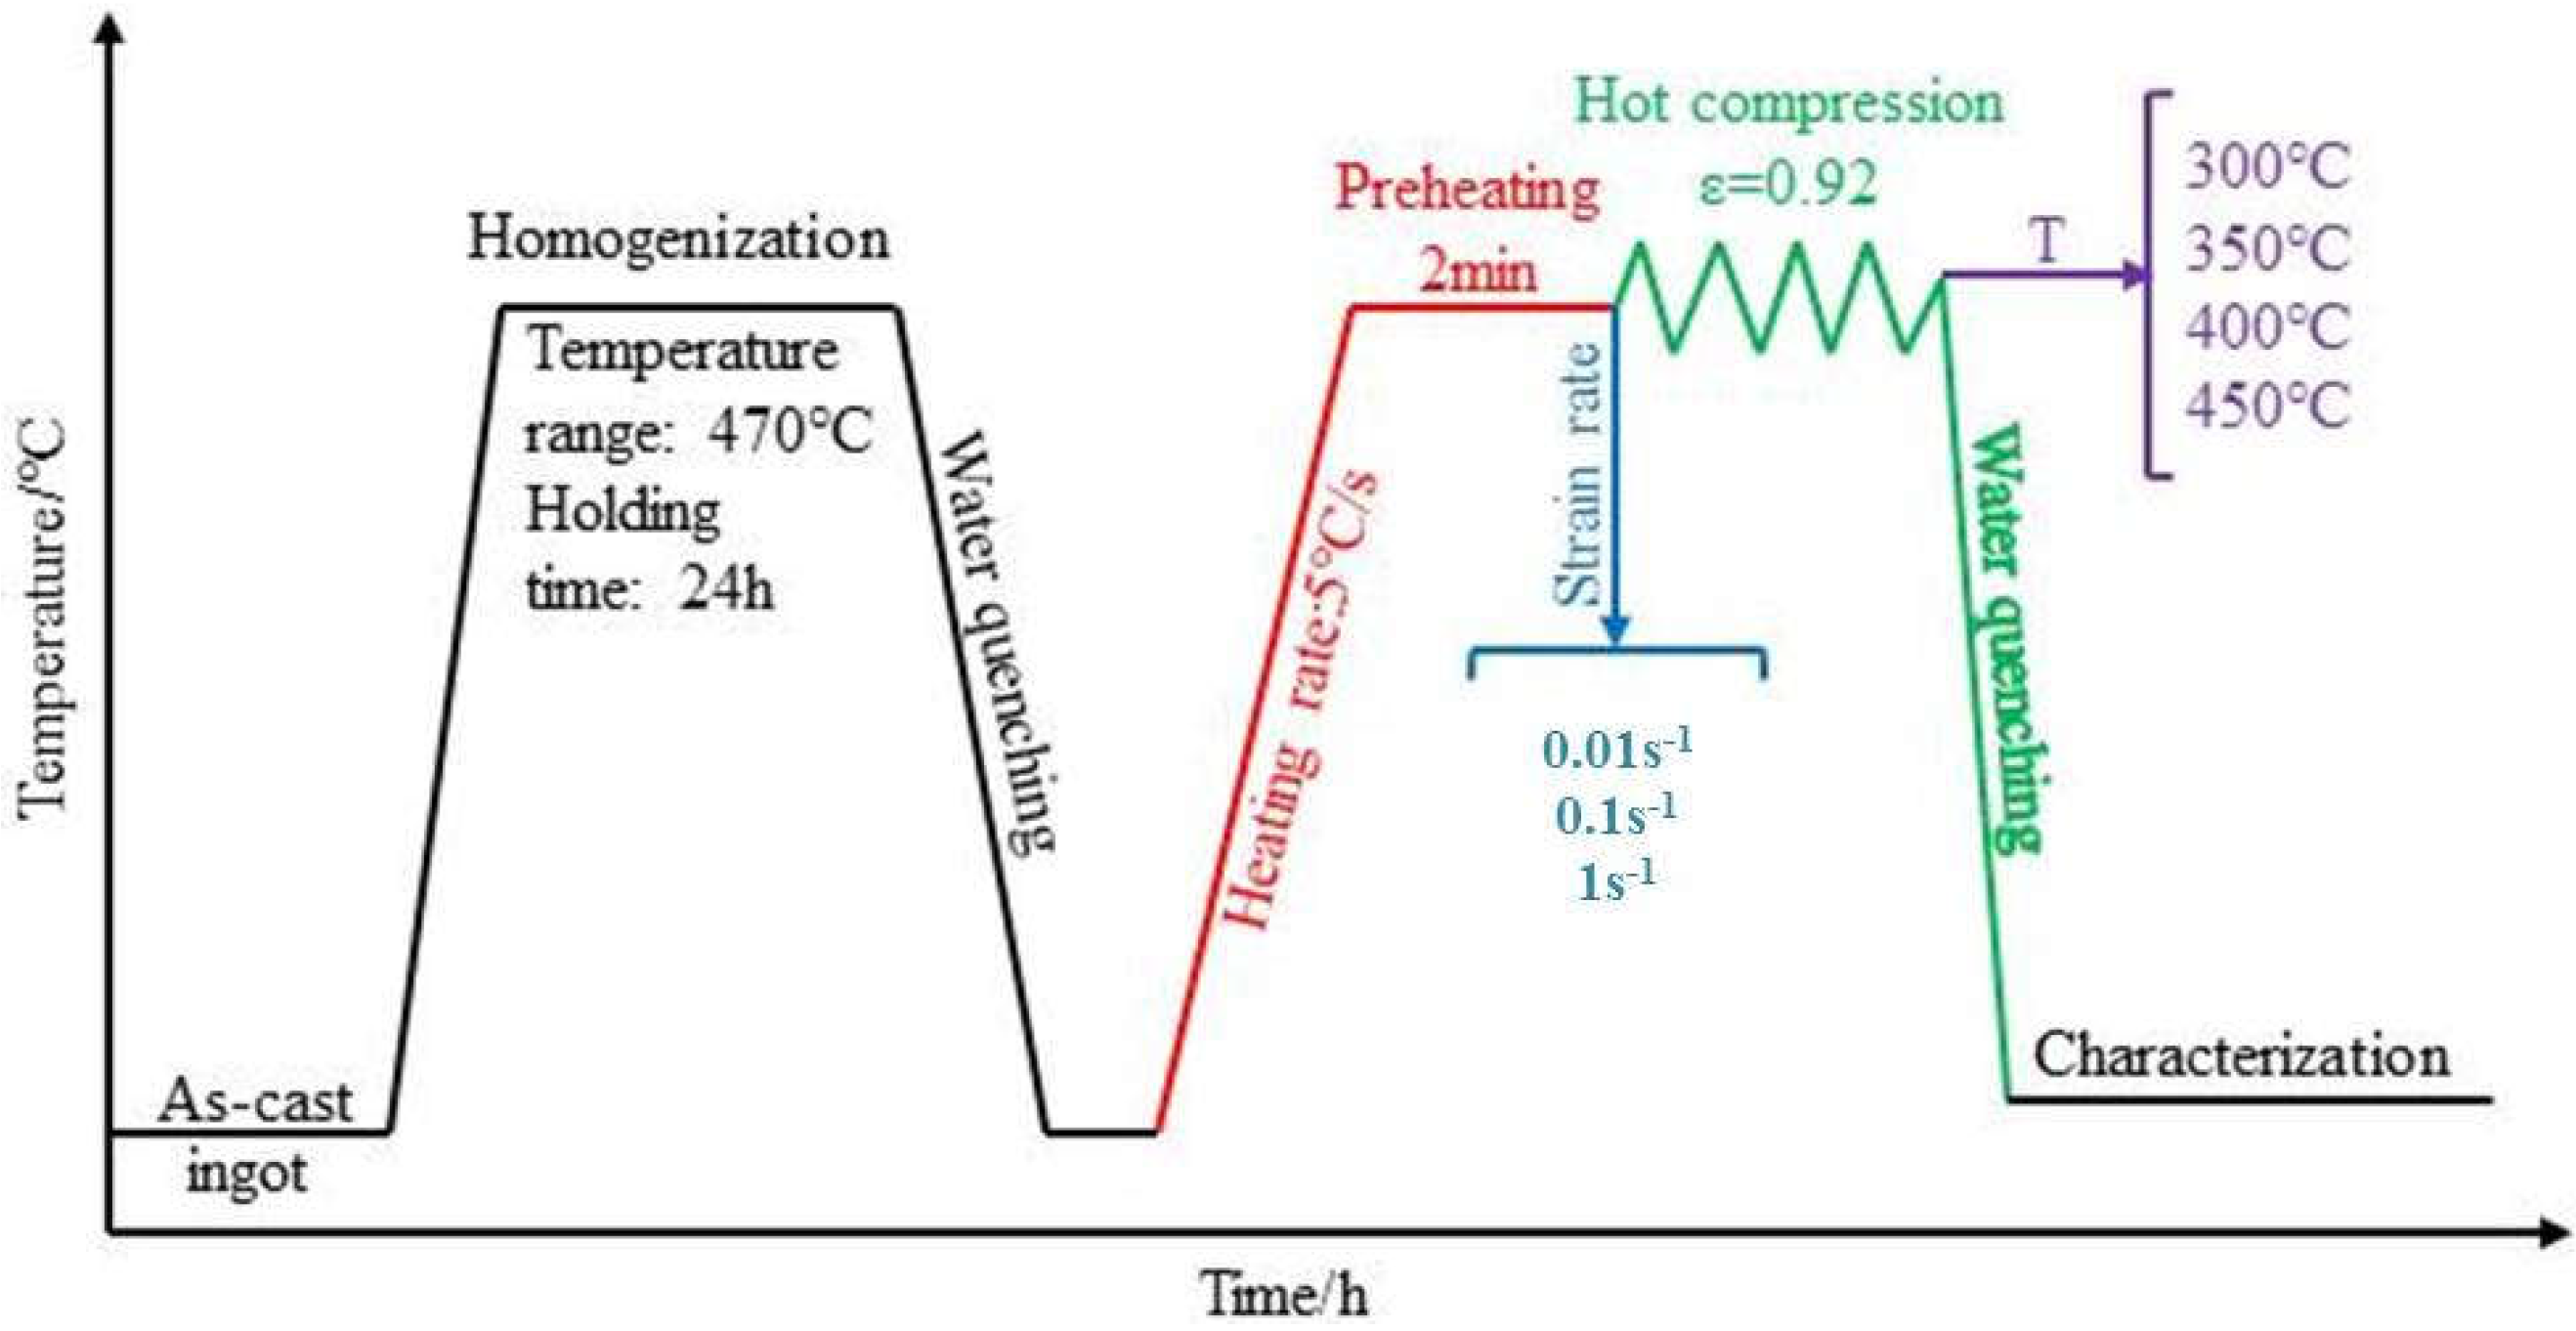
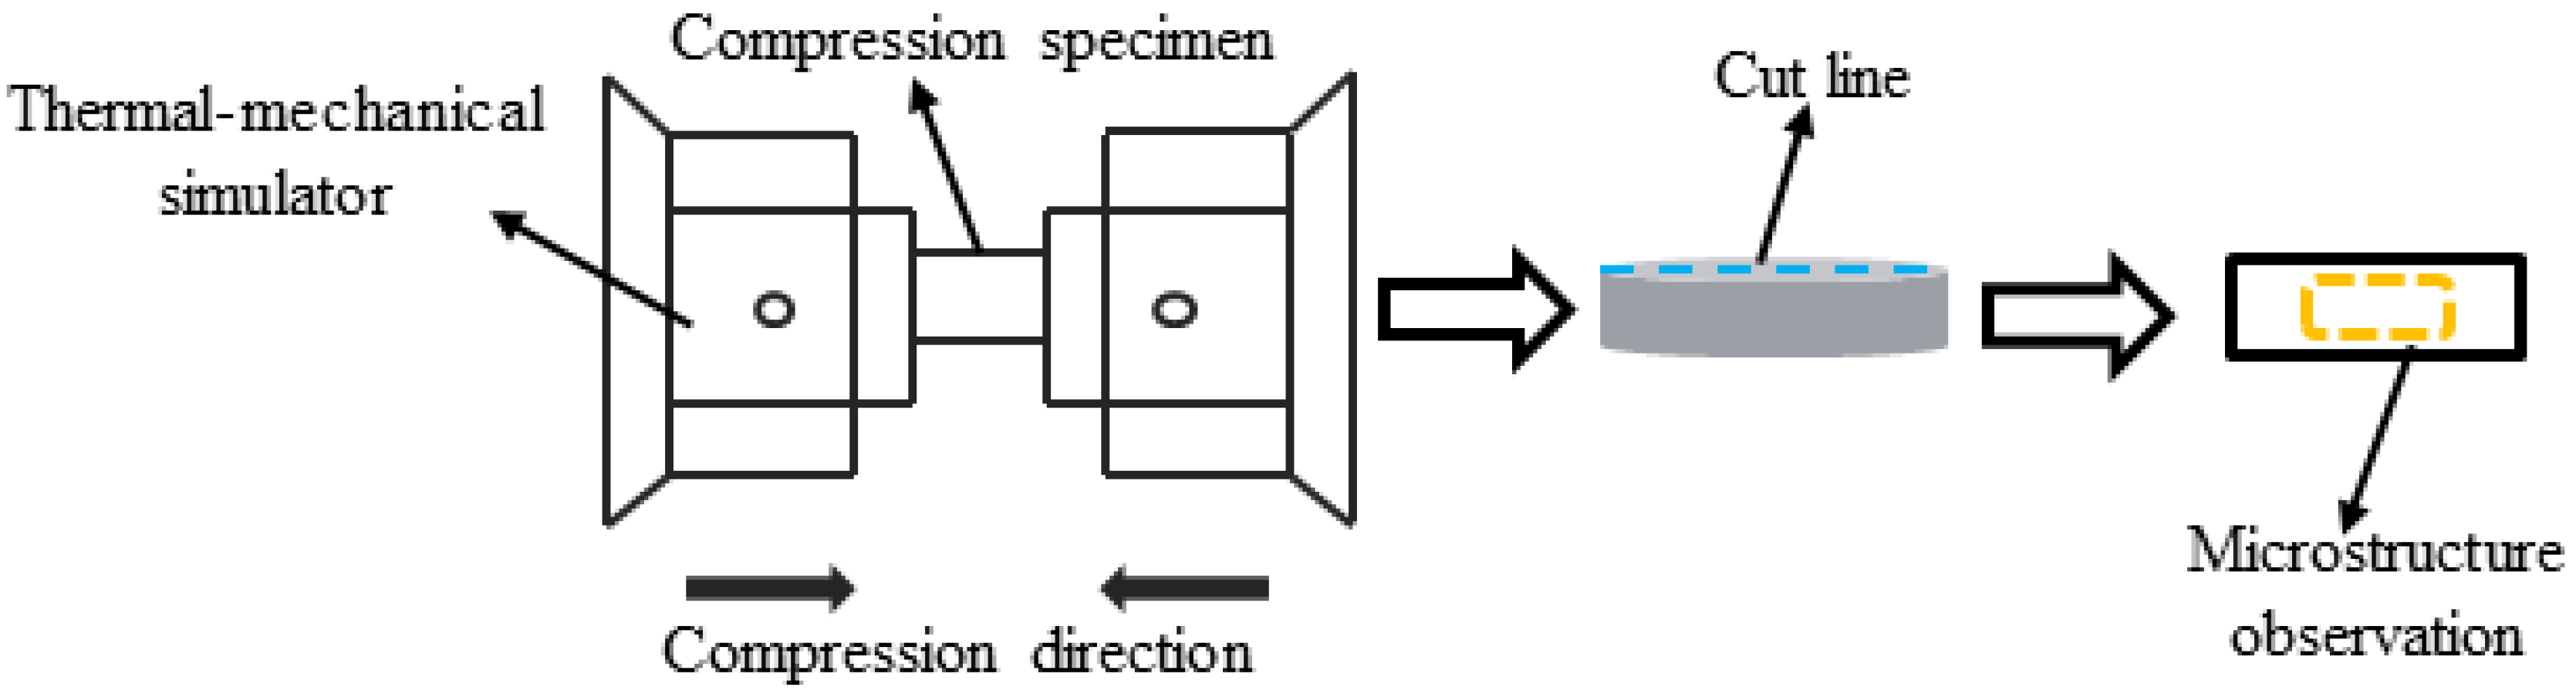
2. Material and Methods

In this study, Al-Zn-Mg-Cu semi-continuous ingot was used as the raw material, and its main chemical compositions are shown in Table 1. Before the hot compression experiment, the material was first treated. The cylindrical specimen was cut from the original slab by using WEDM technology. Its diameter and height were 10 mm and 15 mm, respectively. These cylindrical samples were first homogenized at 470 °C for 24 h, and then quenched to room temperature.
Axisymmetric isothermal compression is used to simulate extrusion and forging deformation, and the relationship between stress and strain can be measured at different temperatures and strain rates. In order to simulate the actual industrial processing conditions, isothermal compression experiments were carried out in the temperature range of 300 °C to 450 °C, and the strain rate was selected in the range of 0.01 s−1~1 s−1, using a Gleeble-3800 thermal simulator. The hot compression diagram of Al-Zn-Mg-Cu alloy is shown in Figure 1. The sample was heated to the deformation temperature at a heating rate of 5 °C/s and kept for 2 min to ensure the homogeneity of the microstructure. In order to reduce friction during hot working, the contact surface must be coated with graphite lubricant, and a high-purity graphite sheet must be placed between the sample and the compression indenter. A thermocouple was welded in the middle of the outer surface of the sample to accurately measure the temperature change. Immediately after the compression test, quenching and cooling should be carried out to room temperature to maintain the microstructure of the deformed structure.
The microstructures of the samples were studied by using optical microscopy (OM, Leica Microsystems Wetzlar GmbH, Wetzlar, Germany), transmission electron microscopy (TEM, FEI Tecnai G220, Hillsboro, OR, USA), and scanning electron microscopy (SEM, Sirion 200, FEI, Hillsboro, OR, USA). The sampling locations used for characterization are shown in Figure 2. The OM samples were ground and mechanically polished, and then corroded with Keller reagent. Quantitative microstructure characterization, including the average grain size of α-Al measured by using the linear intercept method, was realized using Image J 1.8.0 software. After grinding with 3000 mesh sandpaper, the EBSD samples were prepared by electrolytic polishing with 10% perchloric acid solution and 90% ethanol solution at −5 °C. The grain size, grain shape, grain orientation, angular distribution of grain boundary dislocation, and crystal texture were analyzed by using a scanning electron microscope (SEM) and OIM 7 software using the EBSD technique. The samples were ground to about 40 μm, and the TEM samples were prepared by using electrolytic double spraying with 30% nitric acid solution and 70% methanol solution in liquid nitrogen at −30 °C. As shown in Figure 2, the region for microscopic characterization was selected from the middle of the cross section of the compressed cylindrical specimen.

3. Results and Discussion

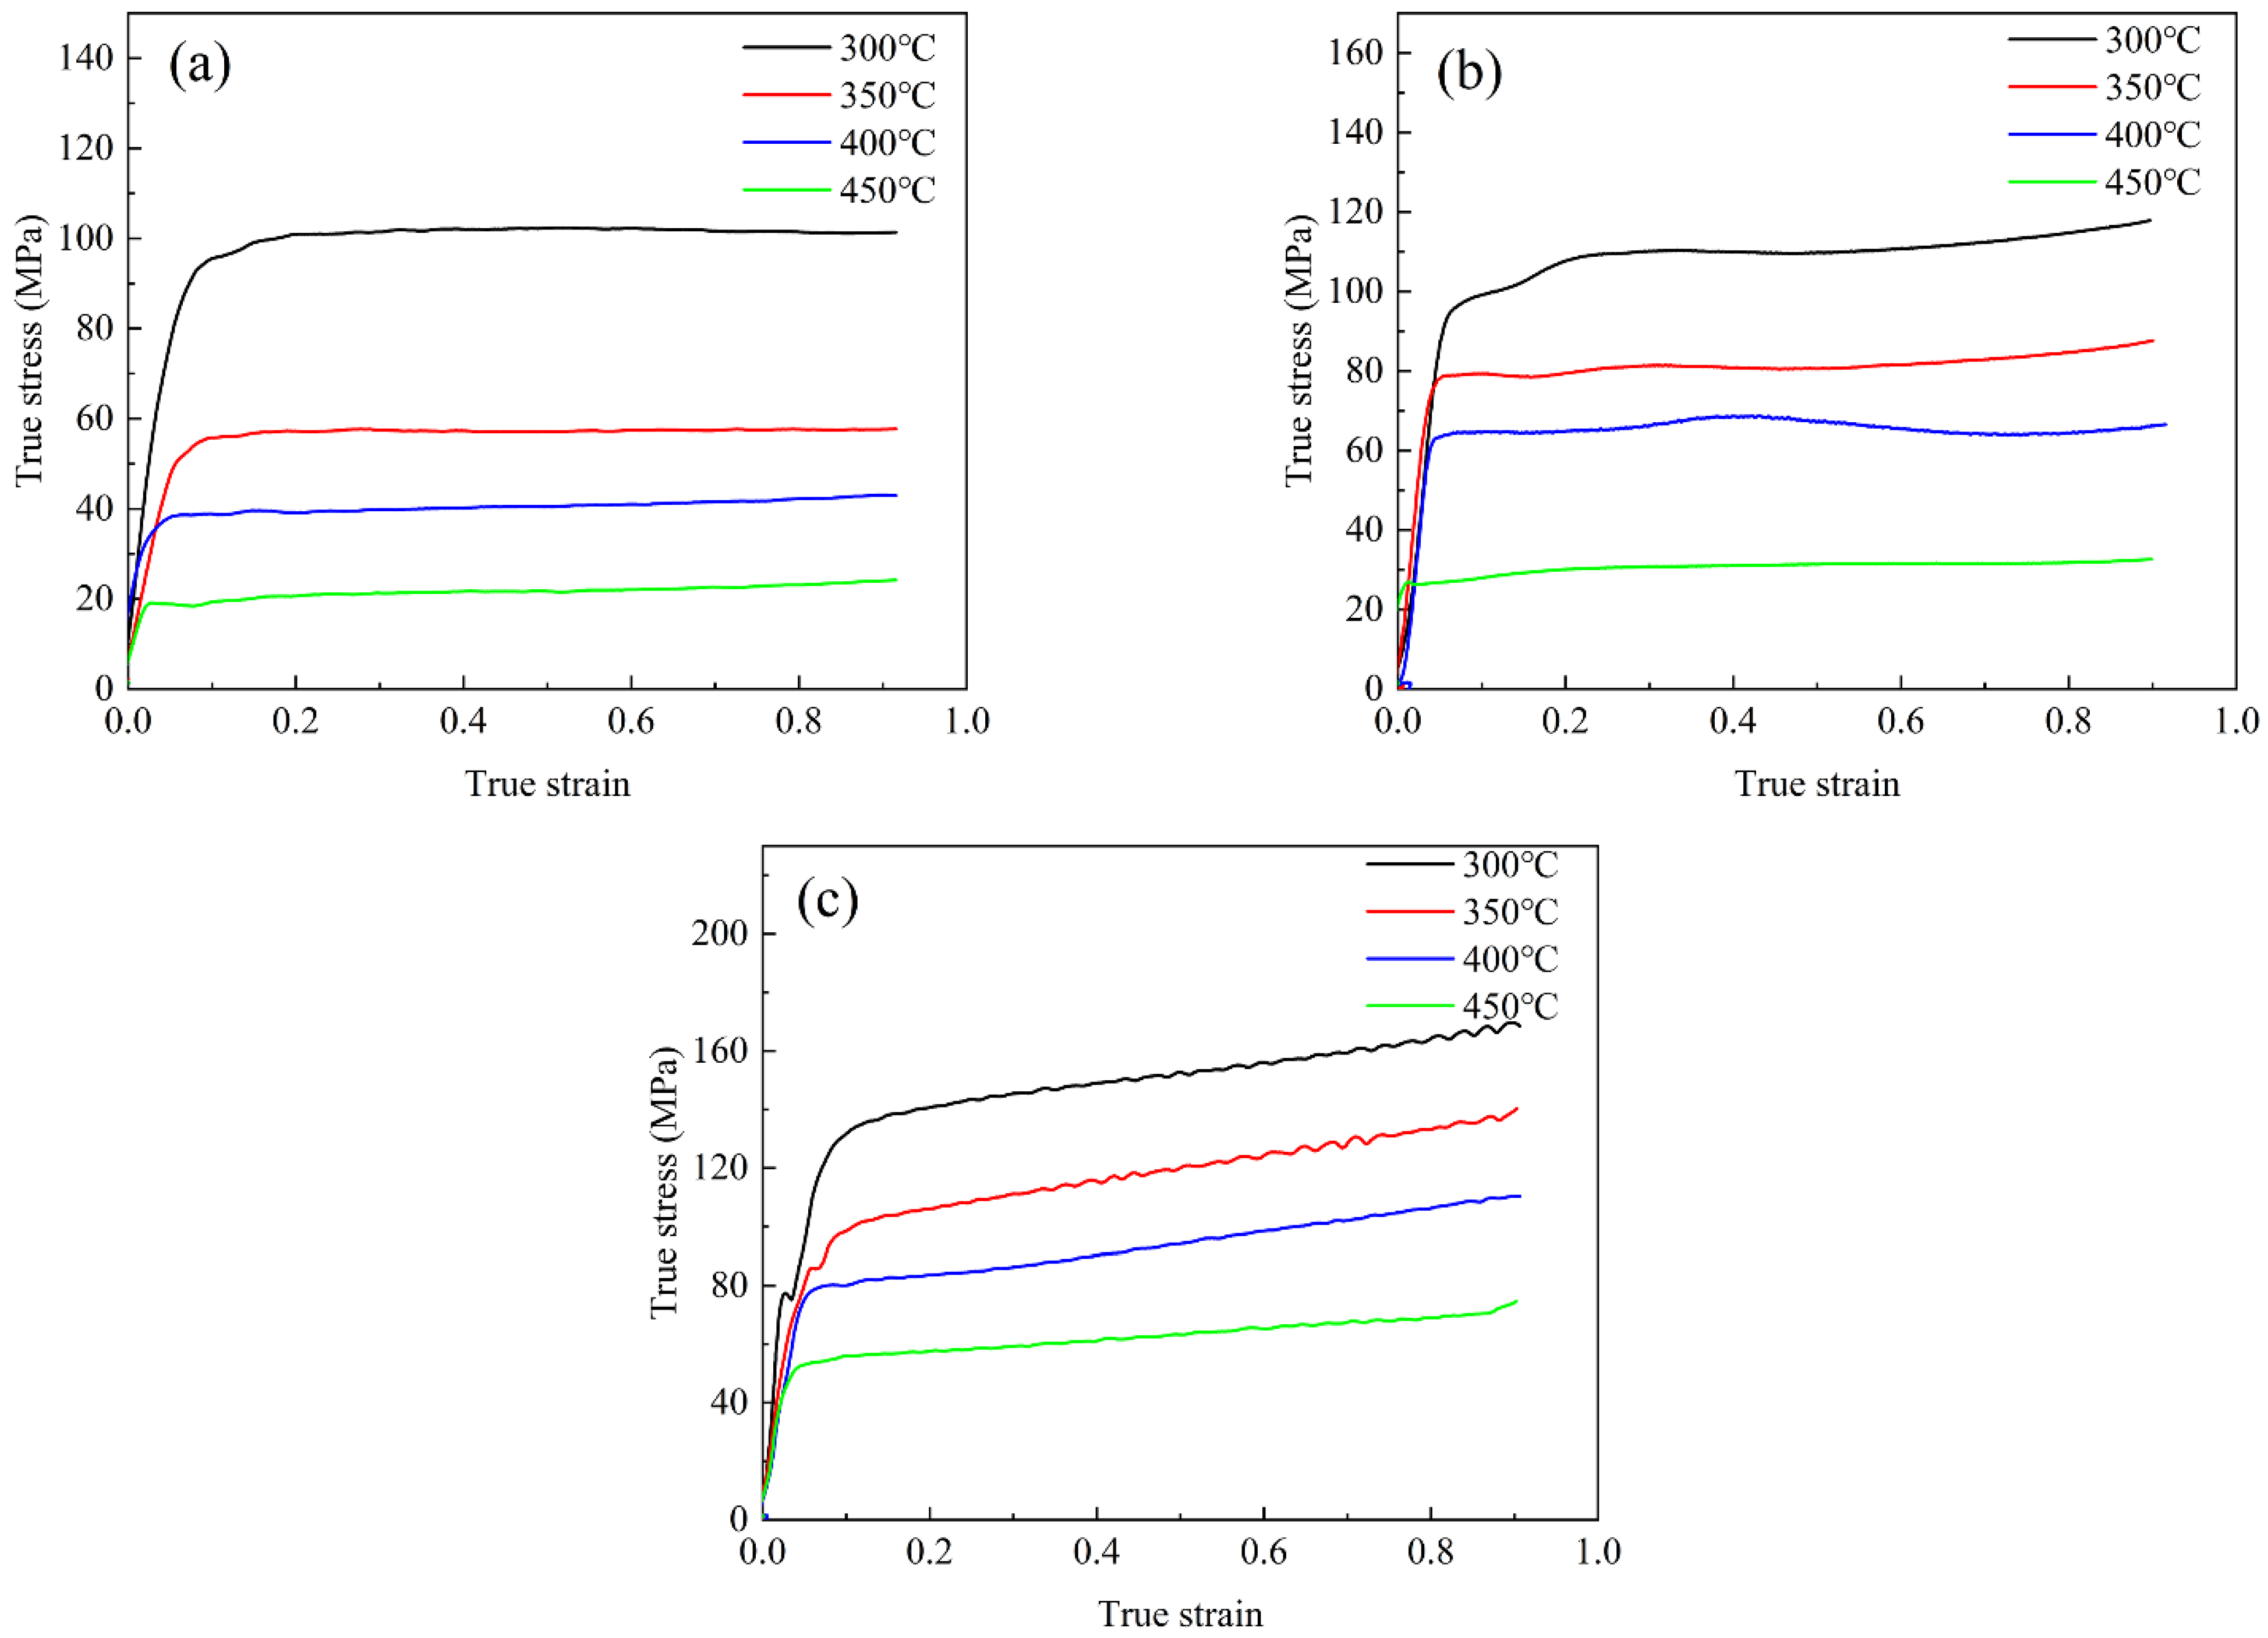
3.1. True Stress–Strain Curve

Figure 3 shows the true stress–strain curves with deformation temperatures of 300 °C~450 °C and strain rates of 0.01 s−1~1 s−1. It can be seen that the flow stress increases sharply at the initial stage of plastic deformation regardless of the strain rate, which can be attributed to the work hardening caused by the increase in dislocation density. When the strain rate is 0.01 s−1, the stress increases rapidly at first, and then decreases slowly to the equilibrium value. When the strain rate is 0.1 s−1, the stress also increases rapidly, but does not decrease obviously. When the strain rate is 1 s−1, the stress increases rapidly at the initial stage, and then increases slowly. It is well known that the evolution of the flow stress curve is influenced by the interaction of work hardening and dynamic softening. At the low strain rate (0.01 s−1), the dynamic softening mechanism is dominant in the deformation process, and it increases with the increase in strain, so the stress decreases slowly after reaching the peak value. At the medium strain rate (0.1 s−1), the dynamic softening and work hardening work at the same time, as they are in dynamic equilibrium, and the stress remains unchanged after reaching the peak value. At the high strain rate (1 s−1), work hardening is dominant, dynamic softening is not enough to completely counteract the consequences of work hardening, and the stress increases slowly with the strain after a sharp increase. At the same time, the peak value and steady value of stress gradually decrease with the increase in temperature and the decrease in strain rate because higher temperatures can promote atomic diffusion and dislocation movement [23], and lower strain rates can provide sufficient time for dynamic softening in the deformation stage [24].

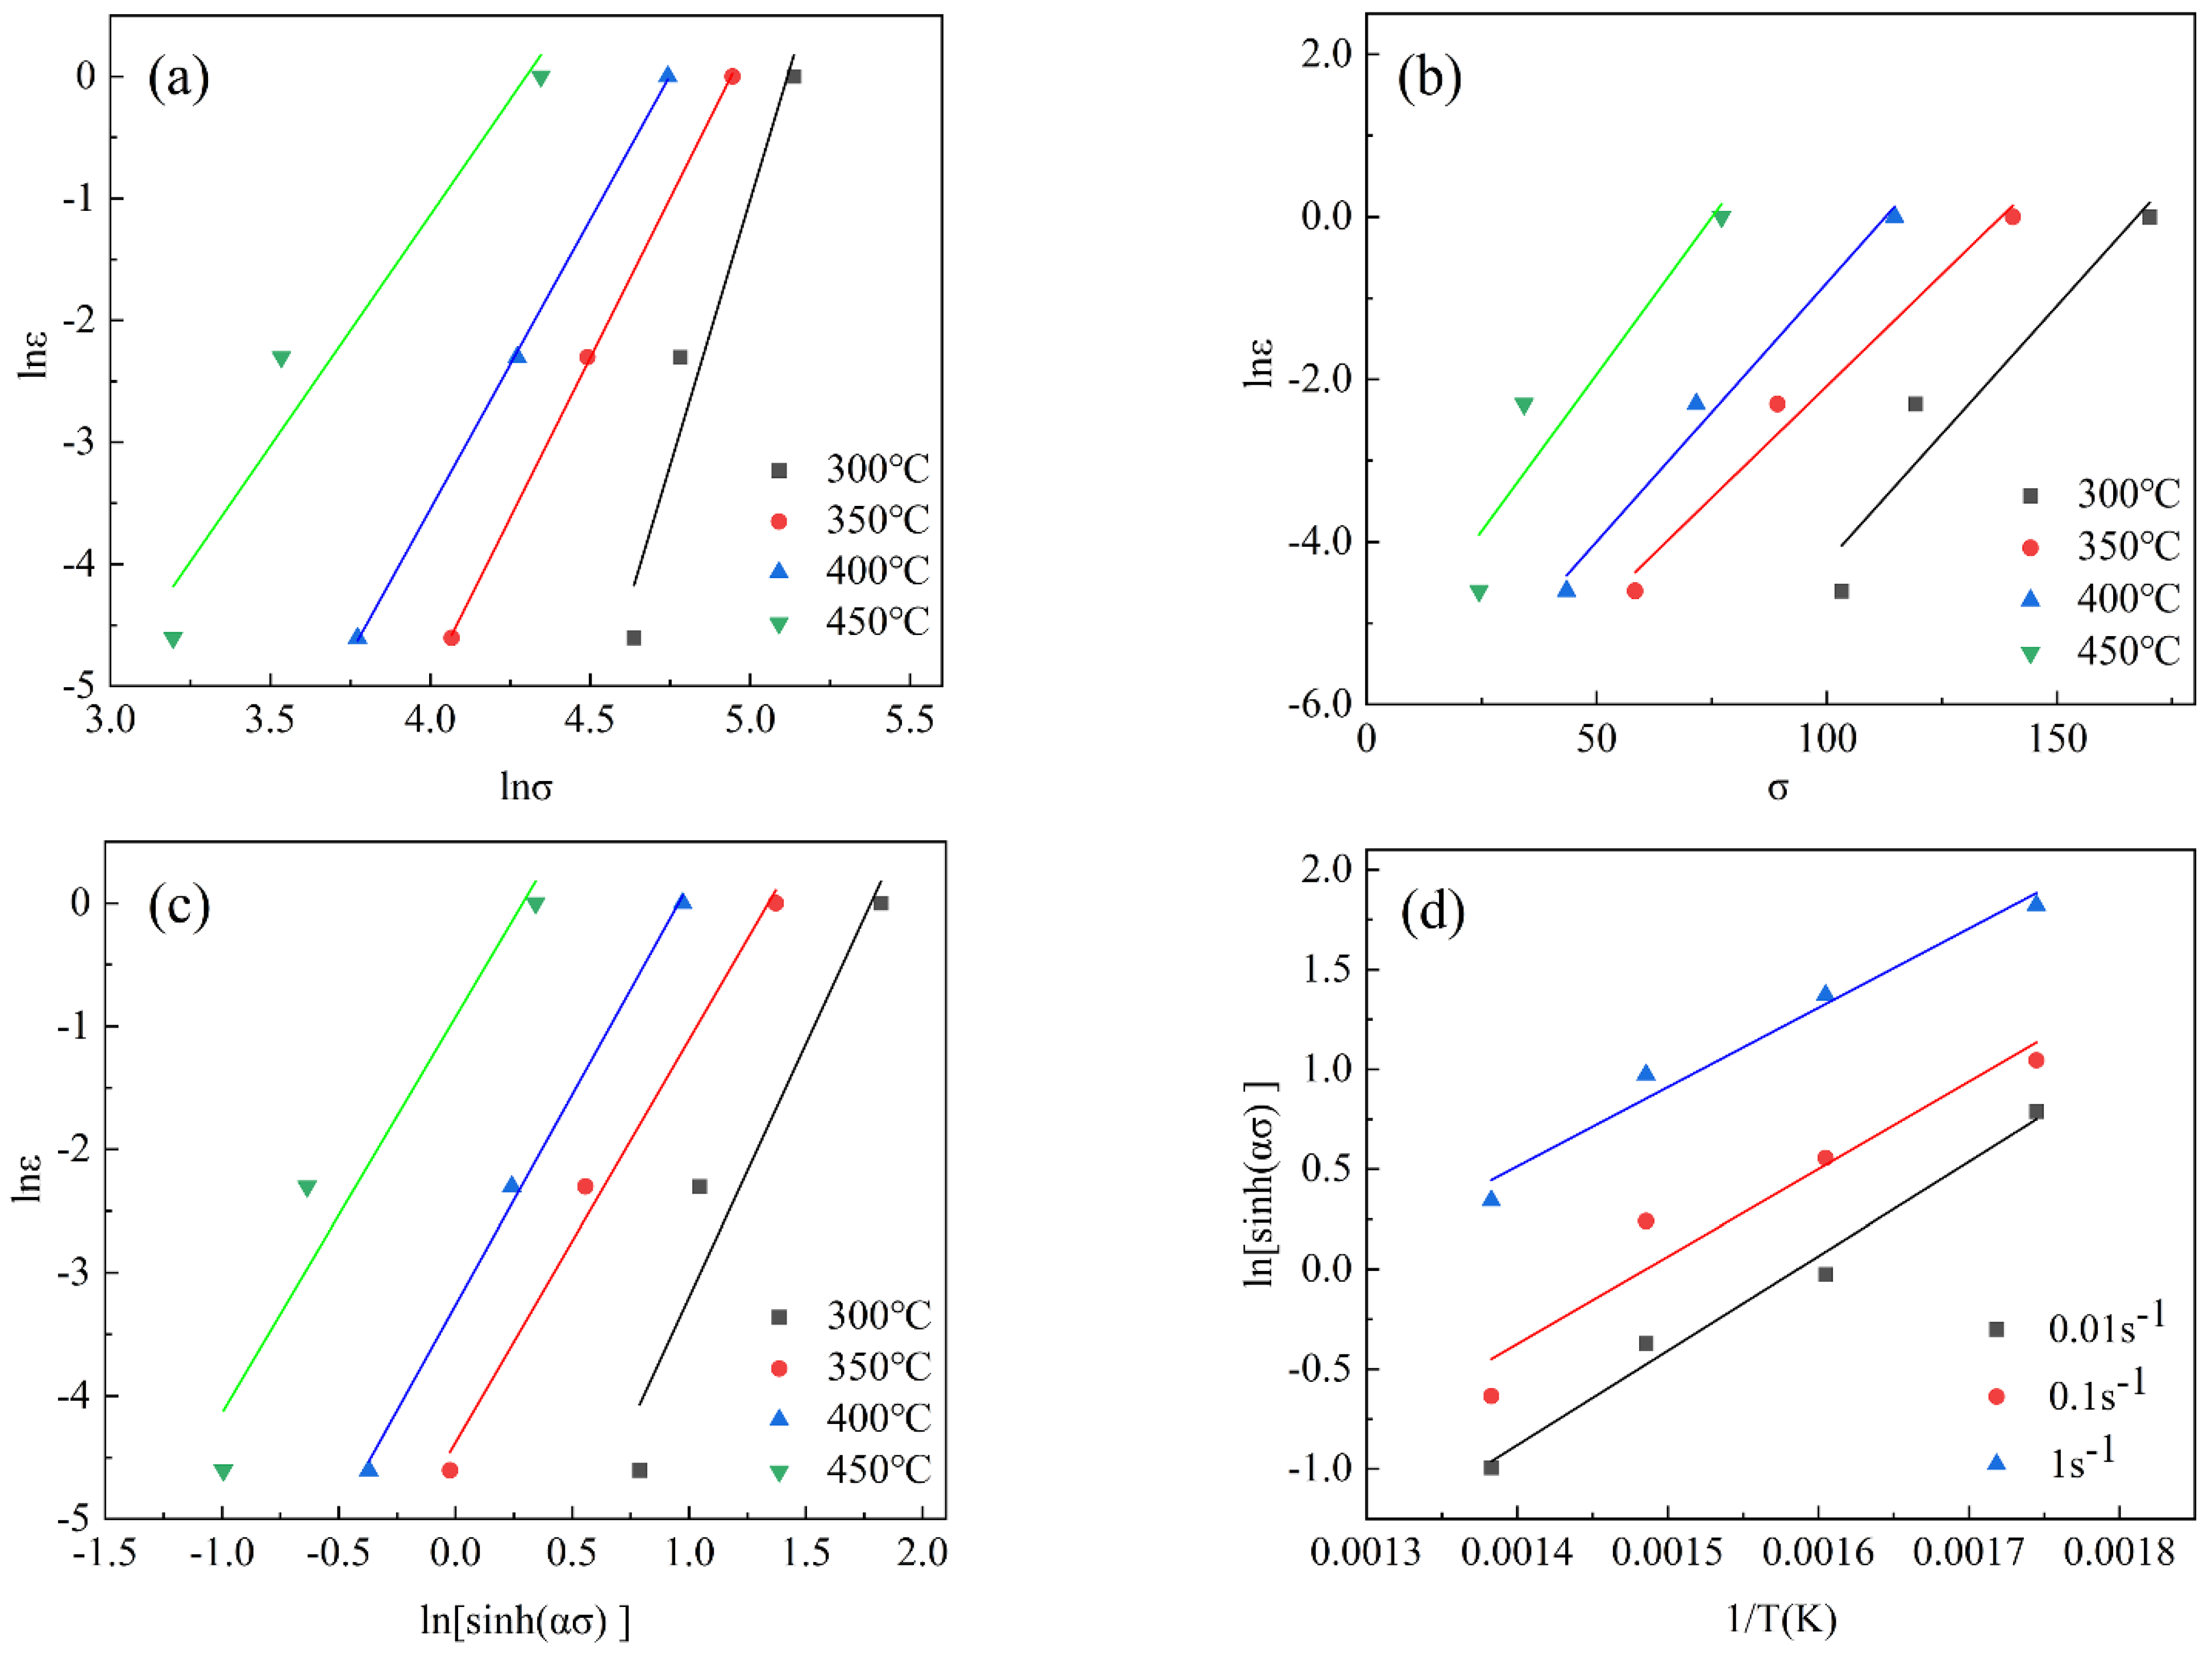
3.2. Constitutive Equation

Under the condition of high temperature plastic deformation, the relationship between true stress, strain rate, and deformation temperature of conventional thermal deformation can be expressed by the hyperbolic sine function proposed by Sellars C M and Tegart J M et al. [25,26,27]:
ε ˙ = A [ sinh α σ ] n exp ( Q R T )
where ε ˙ is the strain rate, s−1; σ is the true stress under a given strain, MPa; Q is the activation energy of thermal deformation, (J·mol−1); R is a gas constant with a value of 8.314 J·(mol·K)−1; T is thermodynamic temperature, K; A and α are temperature independent material constants; and n is the stress exponent.
At a low stress level (ασ < 0.8), it can be simplified as follows:
ε ˙ = A 1 σ n exp ( Q R T )
Under a high stress level (ασ > 1.2), it can be simplified as follows:
ε ˙ = A 2 exp ( β σ )   exp ( Q R T )
where A1, A2, n, and β are the material constants independent of temperature. Taking logarithms from both sides of Equations (2) and (3), we can obtain:
ln ε ˙ = ln A 1 Q ( R T ) + n ln σ
ln ε ˙ = ln A 2 Q / ( R T ) + β σ
According to the true stress–true strain curve obtained from the test, the peak stress σp of aluminum alloy under different deformation conditions is read, and the relationship between lnσp − ln ε ˙ and σp − ln ε ˙ is established, as shown in Figure 4a,b. It can be determined that n = 4.37, β = 0.0648, and α = 0.0148, as can be obtained from α = β/n. Taking the logarithm of Equation (1), we obtain:
ln ε ˙ = ln A Q / ( R T ) + n ln [ sinh ( α σ ) ]
The curves of ln[sinh(ασ)] − ln ε ˙ and ln[sinh(ασ)] − 1/T are shown in Figure 4c,d. n = 3.50, Q/nR = 4359.3469, and the activation energy Q = 126.90 kJ·mol−1 is obtained. The Arrhenius relation of the high temperature constitutive equation can characterize the relationship between stress and strain, strain rate, and deformation temperature (Figure 5). In the process of establishing this relationship, the Zener–Hollomon parameter, that is, the Z parameter, should be introduced, as shown in Equation (7):
Z = ε ˙ exp ( Q R T ) = ln A ln [ sinh ( α σ ) ] n
where Z is the temperature compensated strain rate parameter. Take the natural logarithms on both sides of Equation (7) to obtain:
ln Z = ln A + n ln [ sinh ( α σ ) ]
By making a lnZ − ln[sinh(ασ)] curve, we can obtain the intercept lnA = 19.96; then a = 4.68 × 10⁸. Therefore, the constitutive equation of aluminum alloy is as follows:
ε ˙ = 4.68 × 10 8 [ sinh ( 0.01482 × σ ) ] 4.37 exp ( 126900 R T )

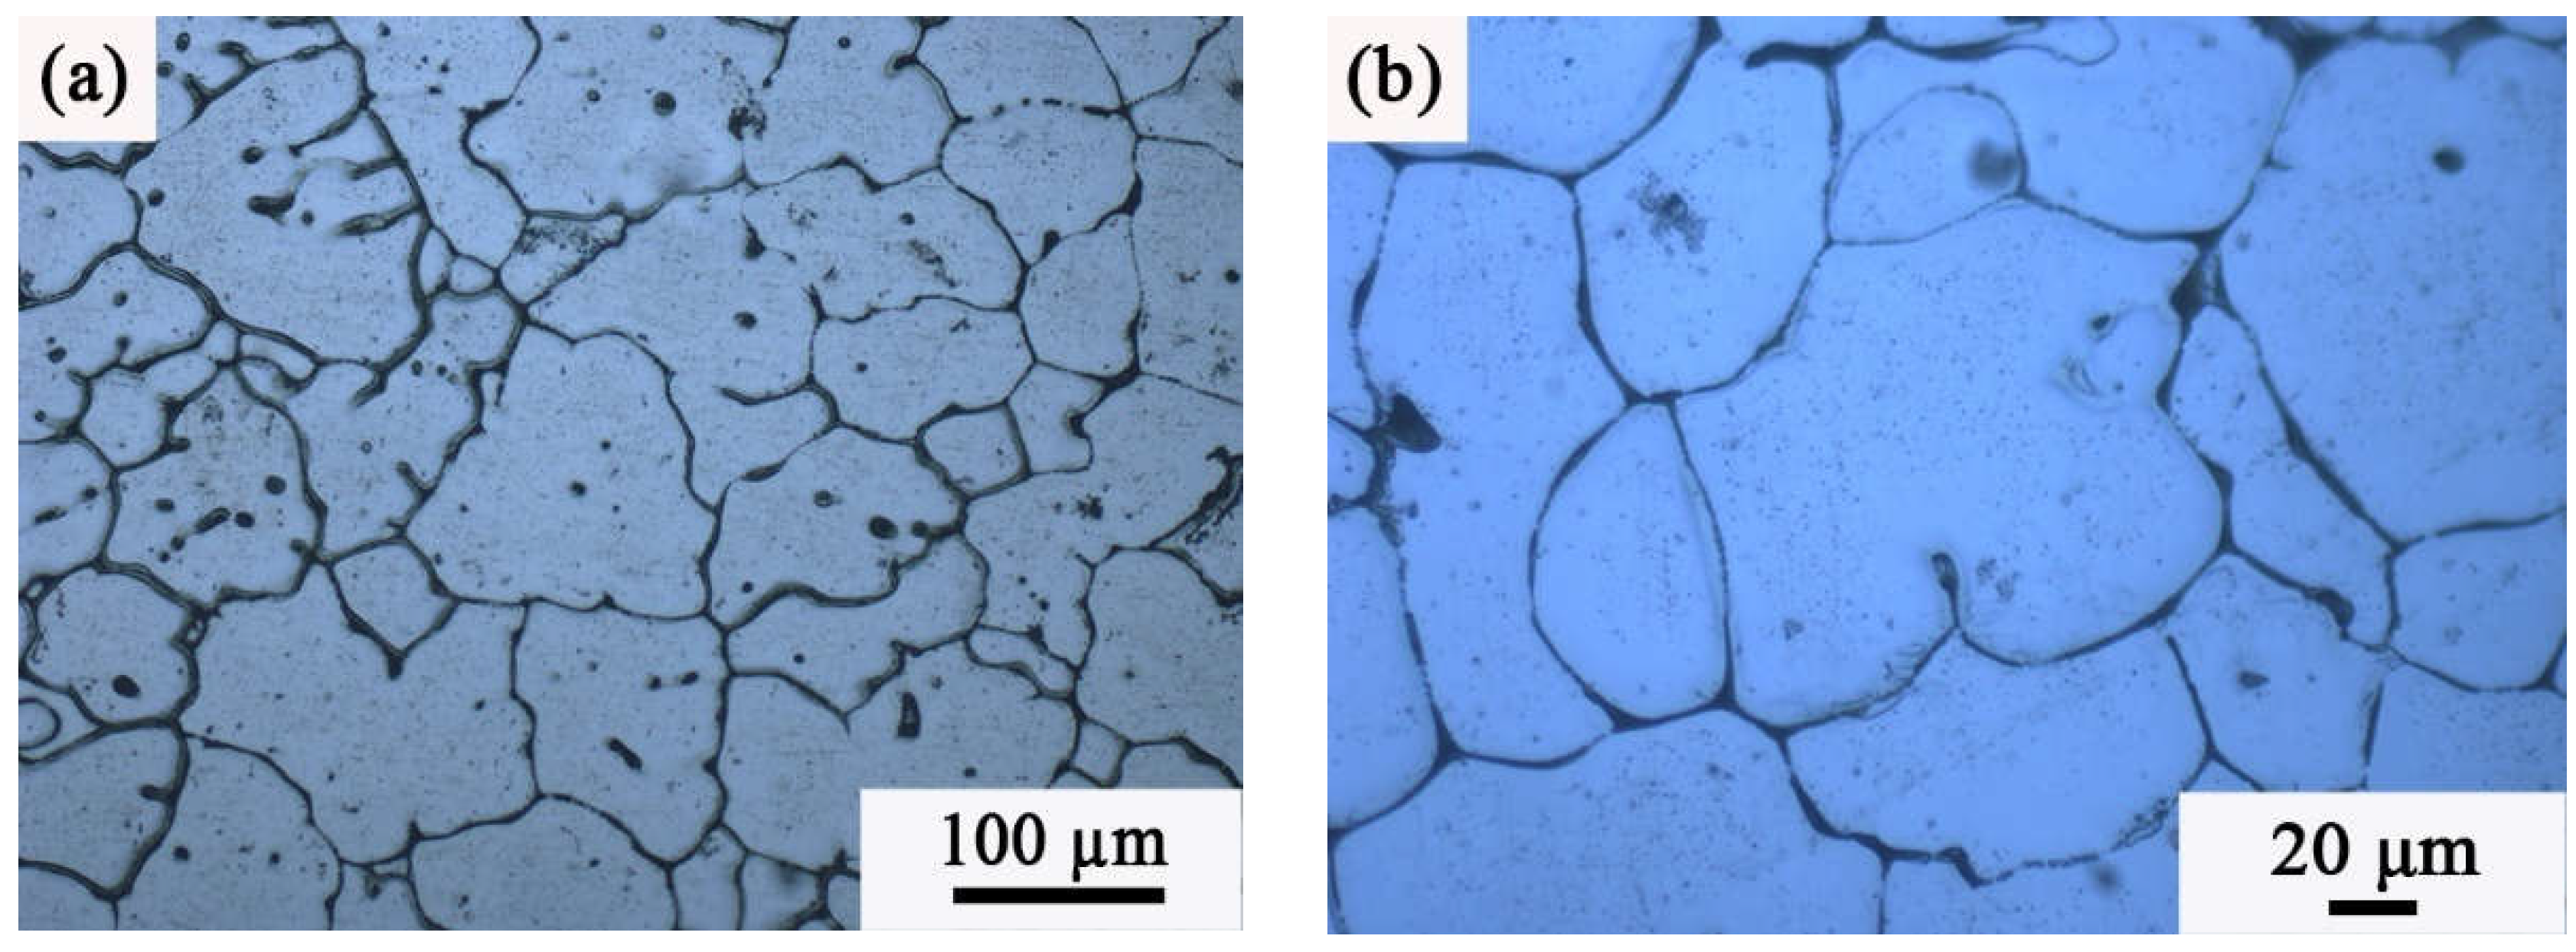
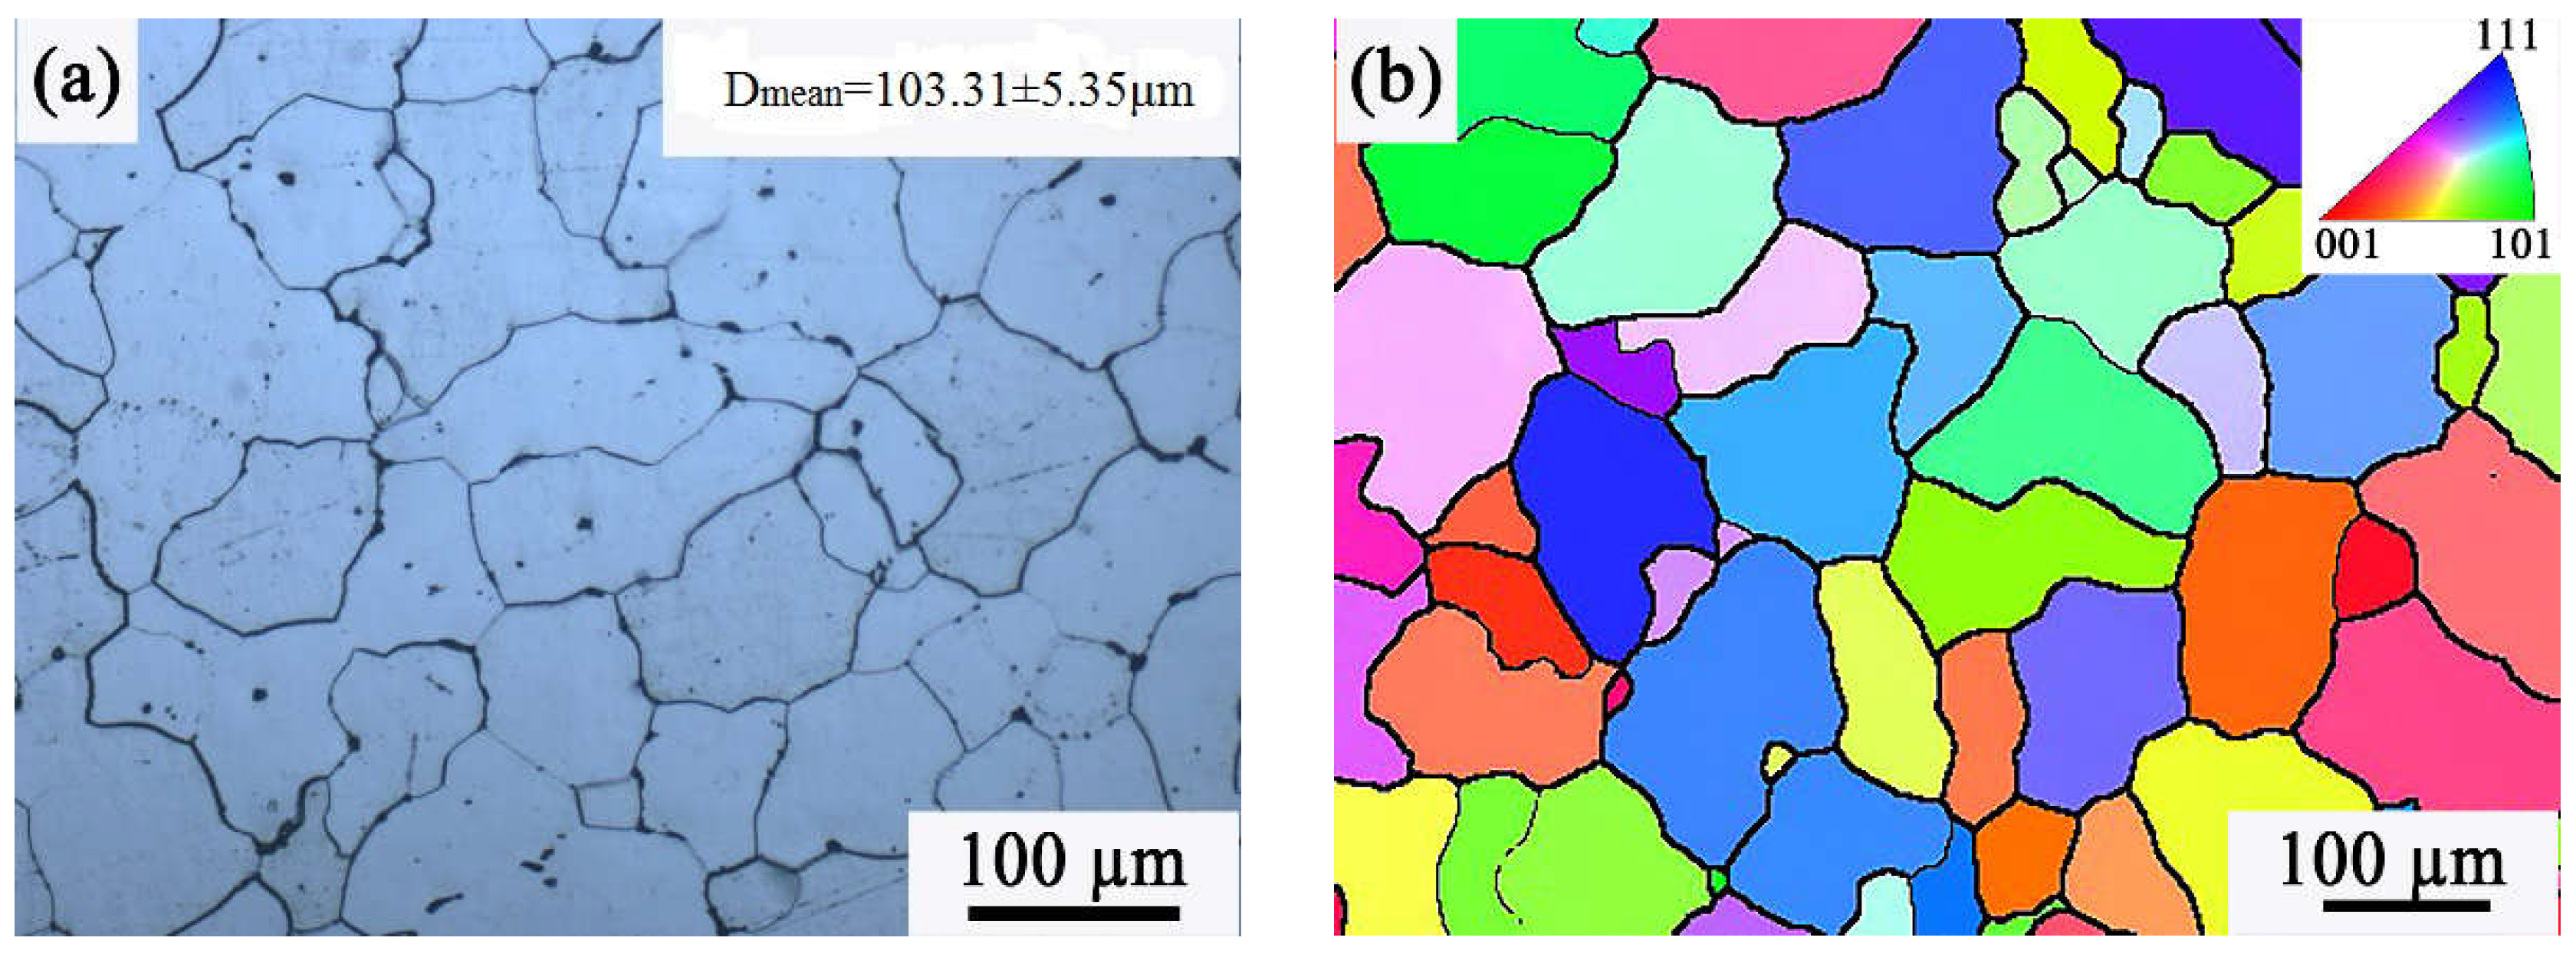
3.3. Homogenization Treatment

Figure 6 shows the original microstructure of the as-cast material. It can be seen from the figure that the microstructure is mainly composed of α-Al solid solution, a low-melting-point eutectic phase at the grain boundary, and precipitated phase in the grain; additionally, the eutectic phase at the grain boundary is basically distributed continuously in the network. The microstructure of the as-cast 7075 aluminum alloy is non-uniform, and there is microsegregation present. At the same time, there is a large number of precipitated phases in the crystal, which adversely affect the initial properties and subsequent processing of the alloy. These eutectic phases can be eliminated by heat treatment, so homogenization treatment should be carried out first.
The metallographic structure after homogenization treatment is shown in Figure 7a. The non-equilibrium eutectic structure was basically eliminated, and only a small amount of precipitated phase was completely eliminated. It is presumed that there was an insoluble Fe-rich phase and Si-rich phase formed by impurities such as Fe and Si introduced in the casting process, and its average grain size is measured to be 103.31 ± 5.35 μm. The IPF diagram after homogenization treatment is shown in Figure 7b. It can be seen that the grain size did not change obviously after homogenization, that the crystal has no obvious orientation, and that the grain is basically equiaxed.

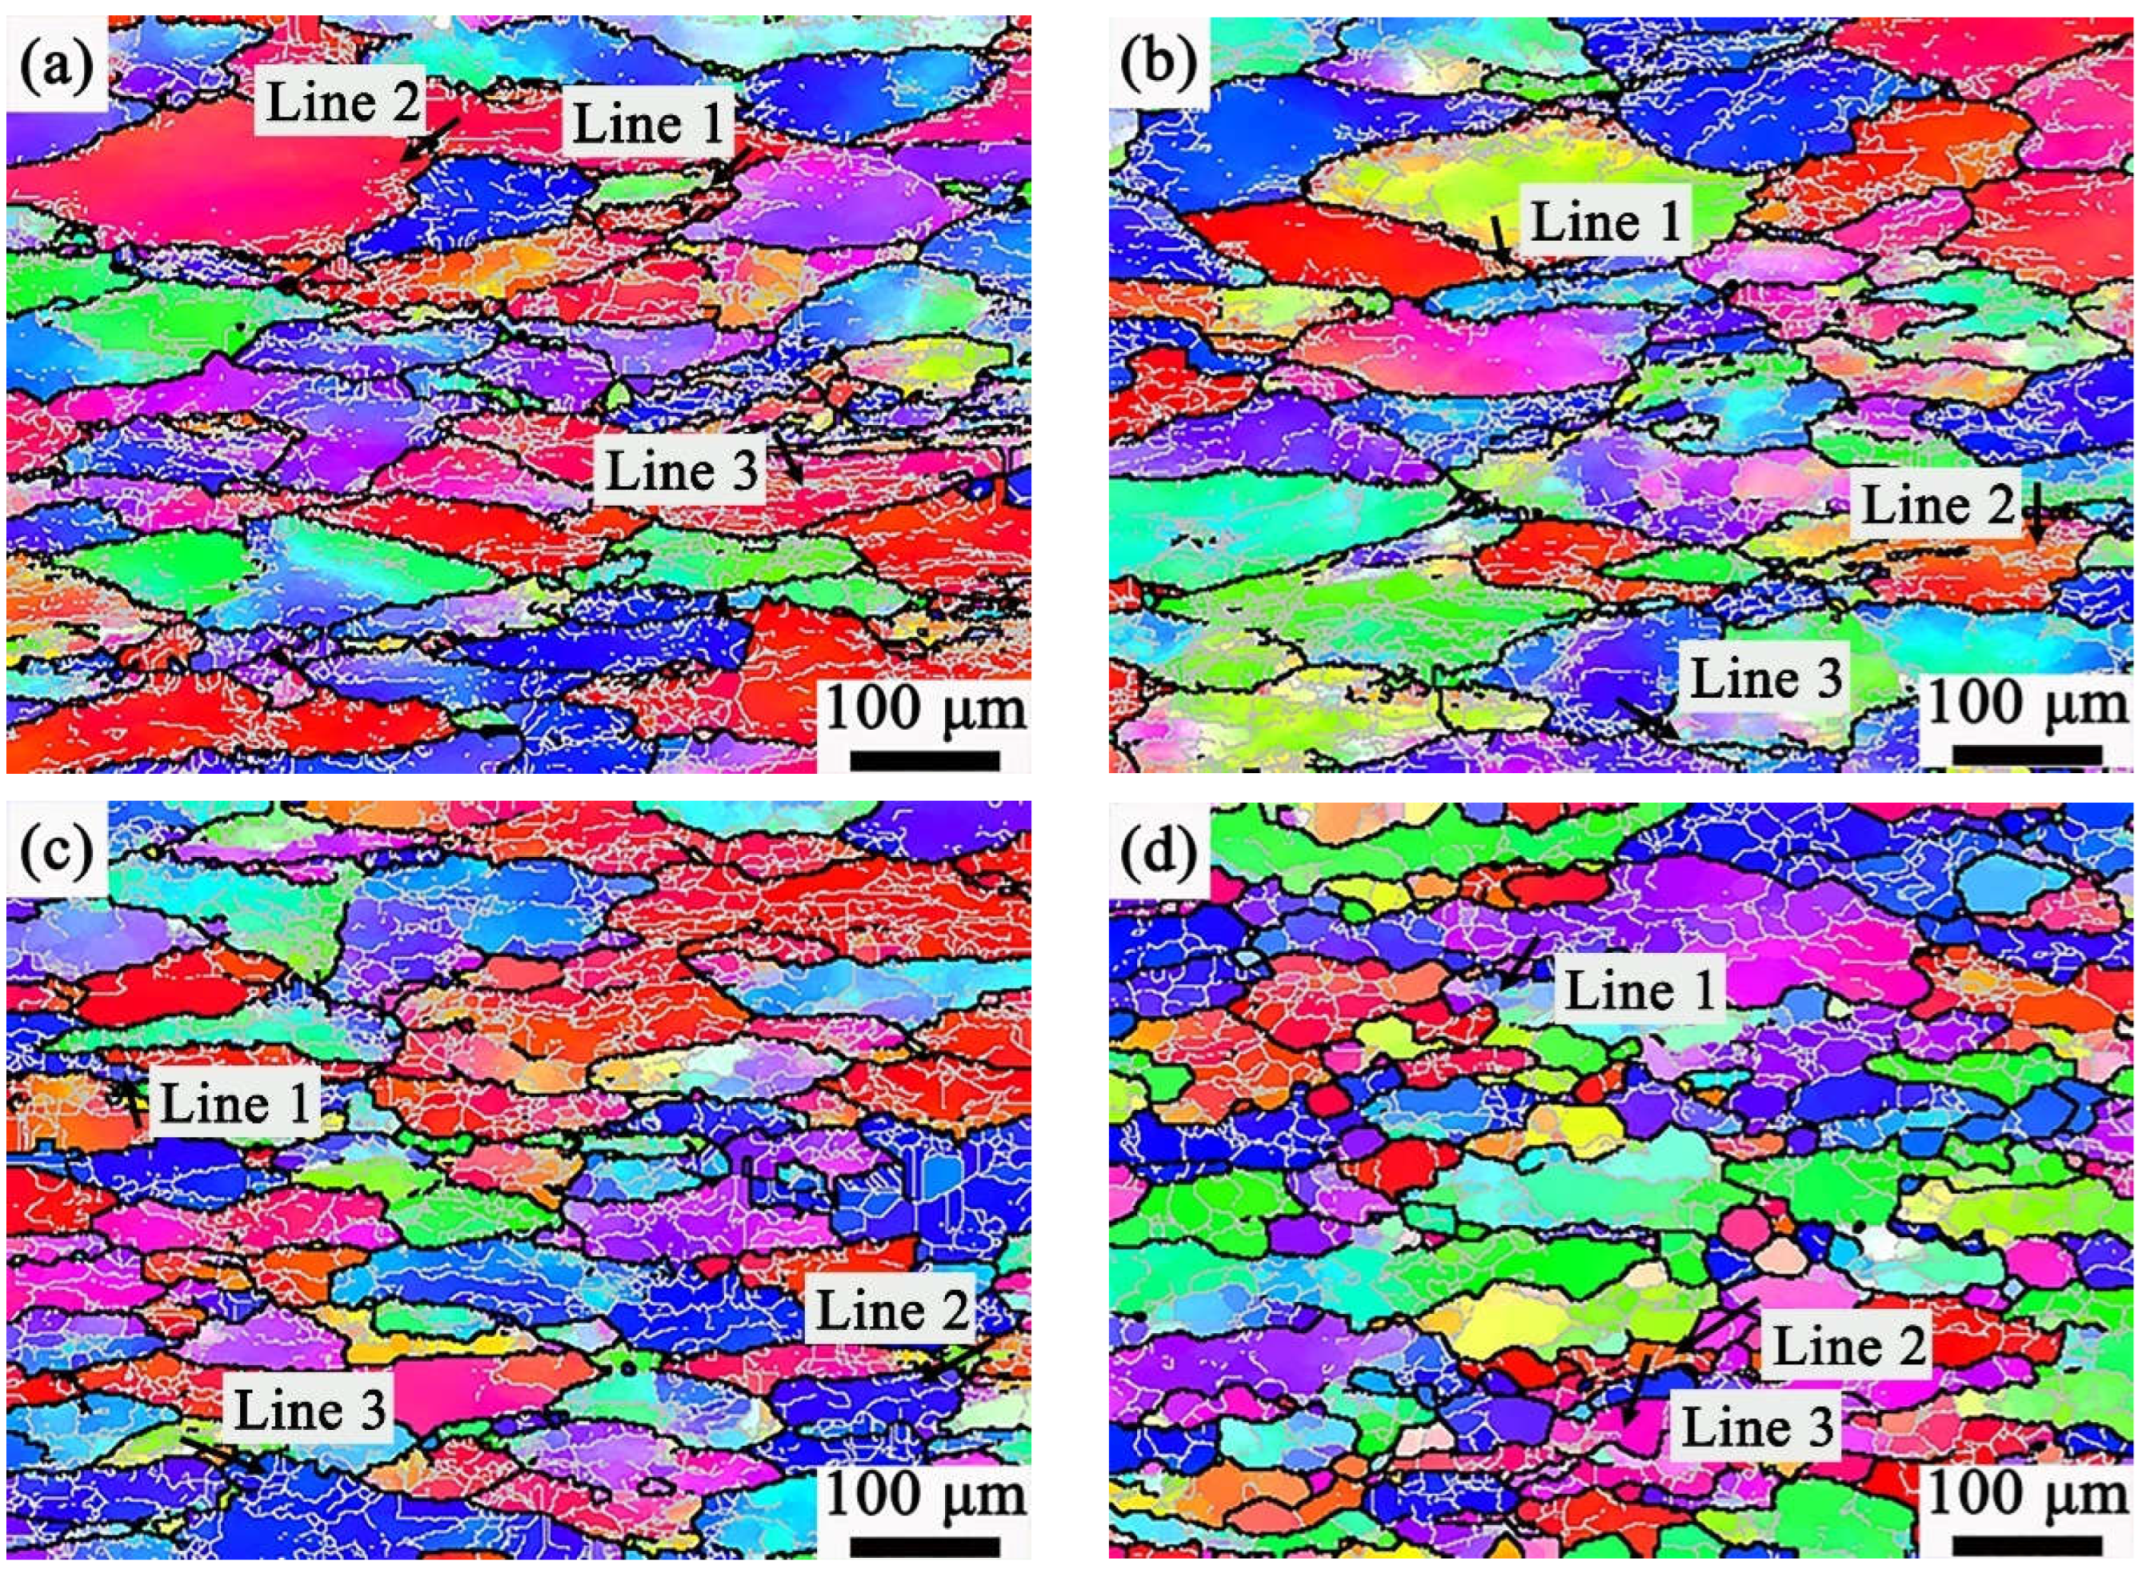
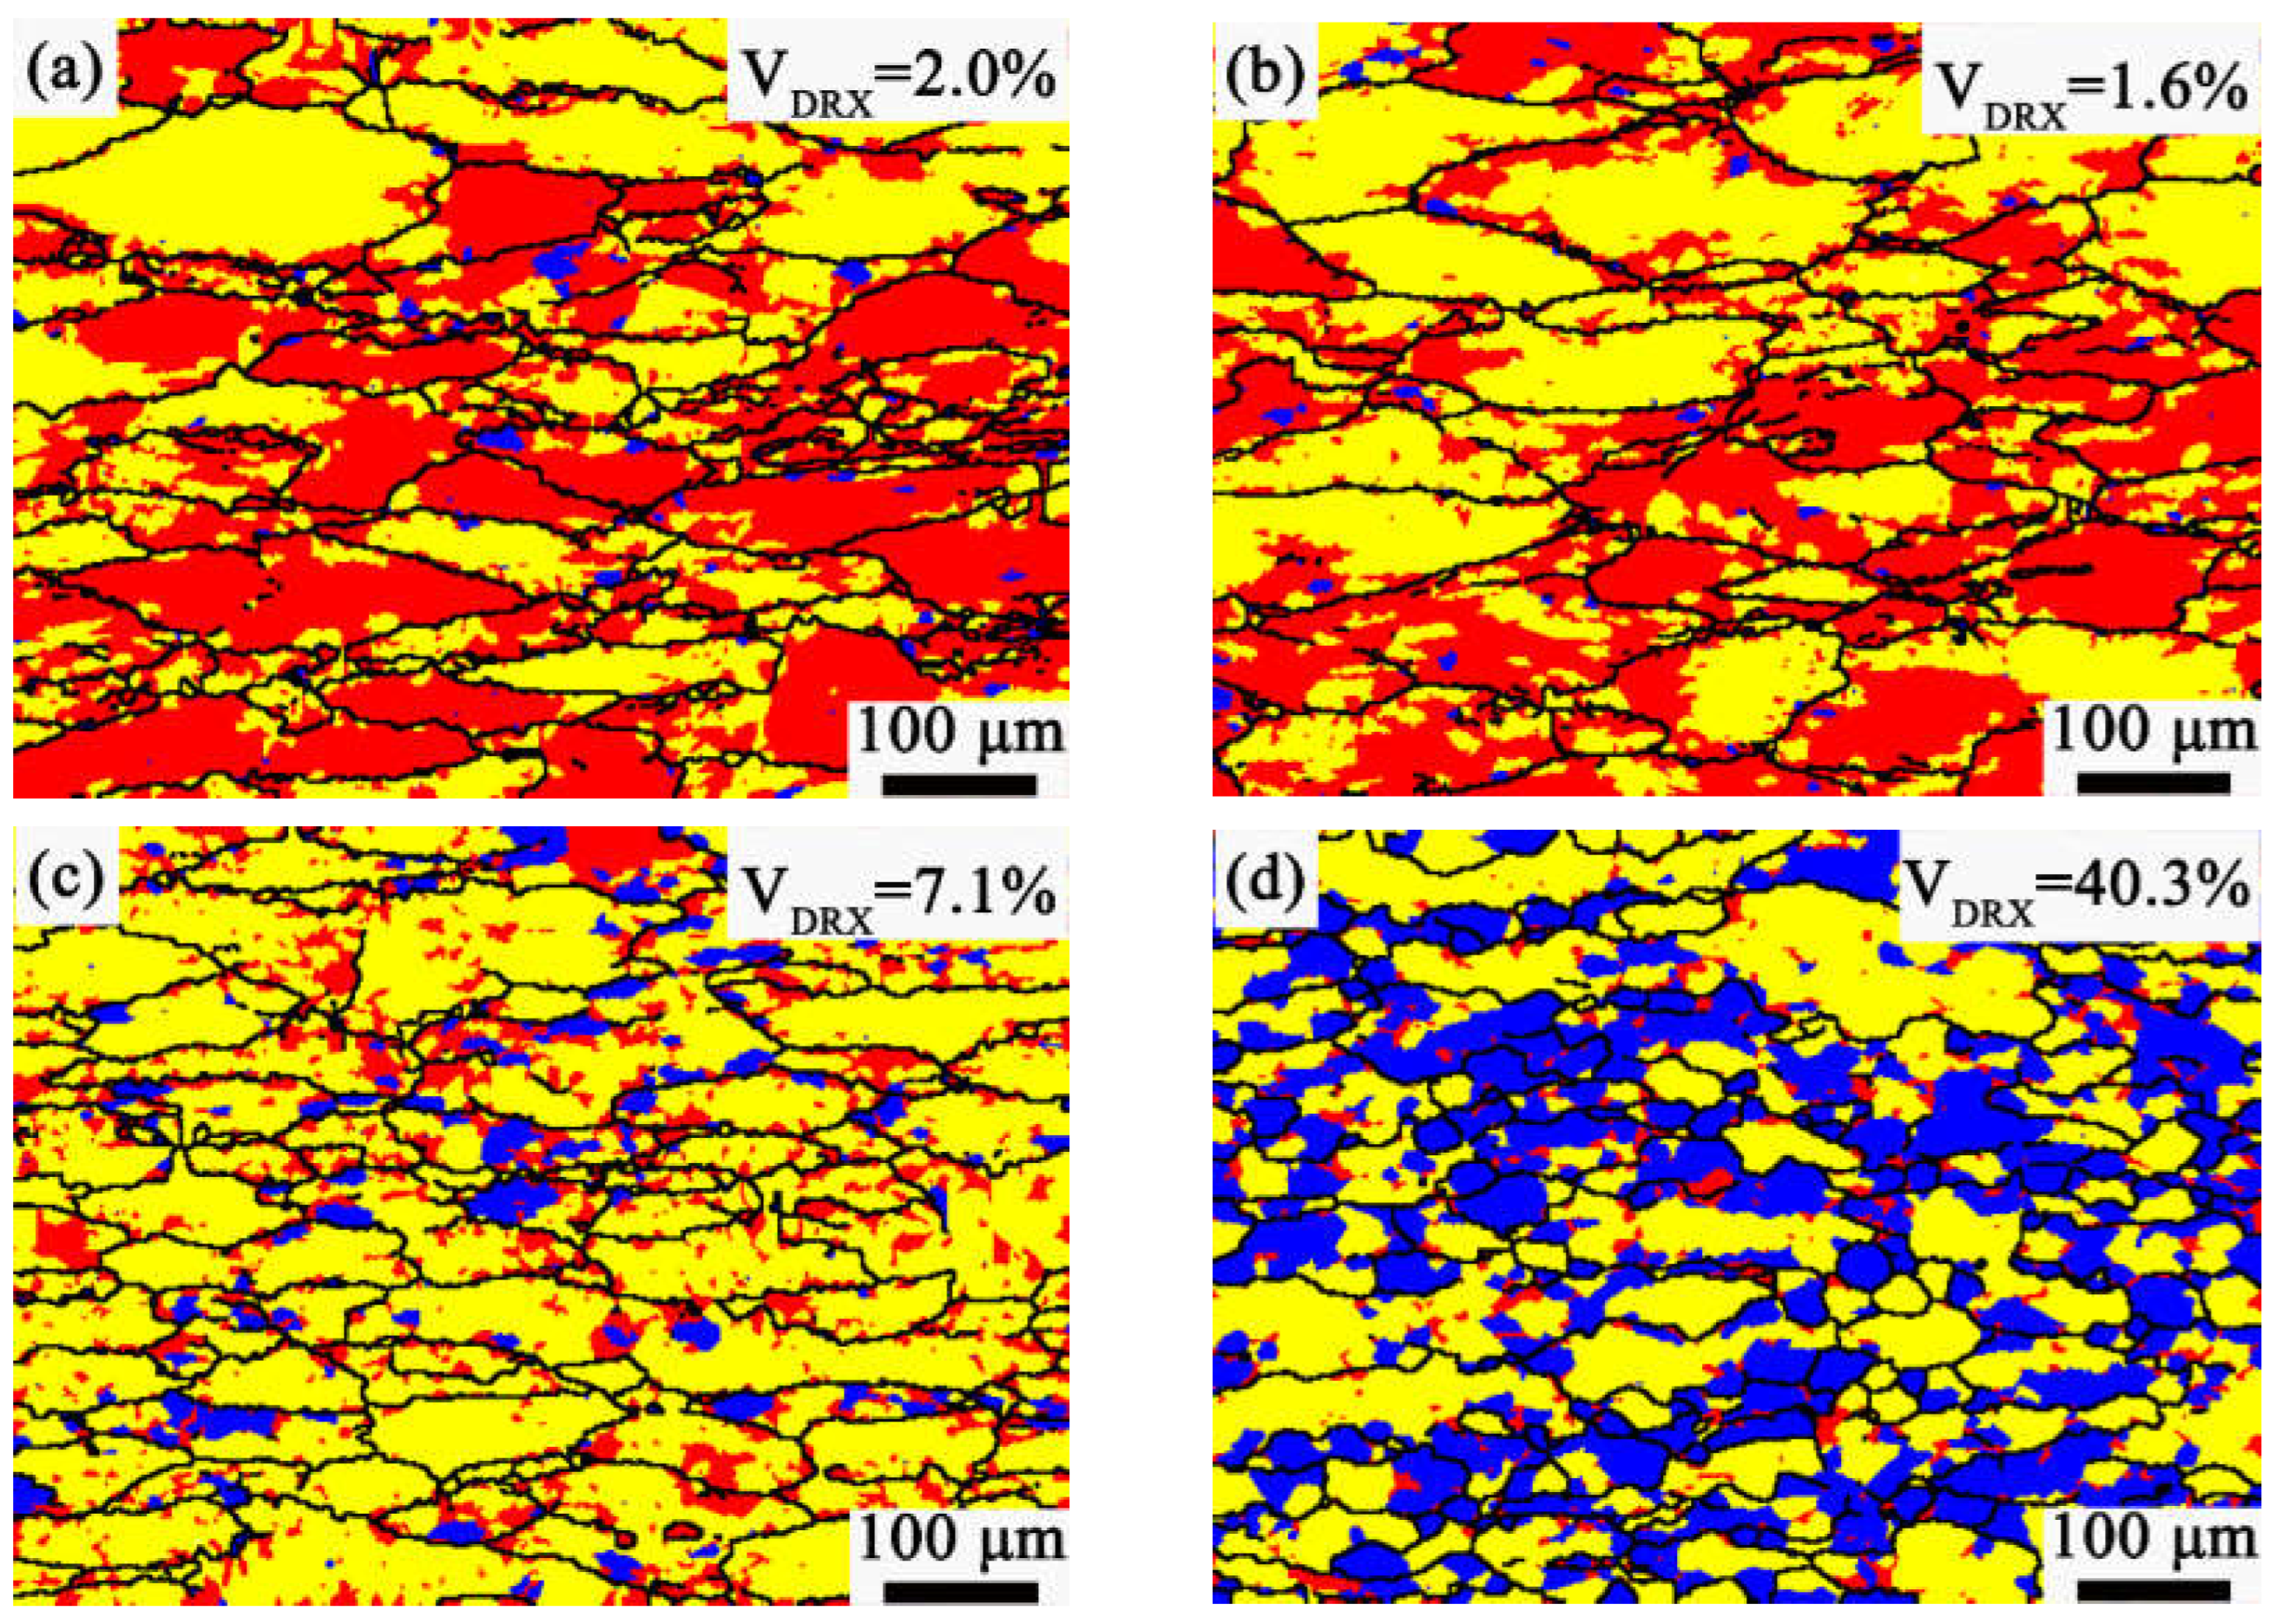
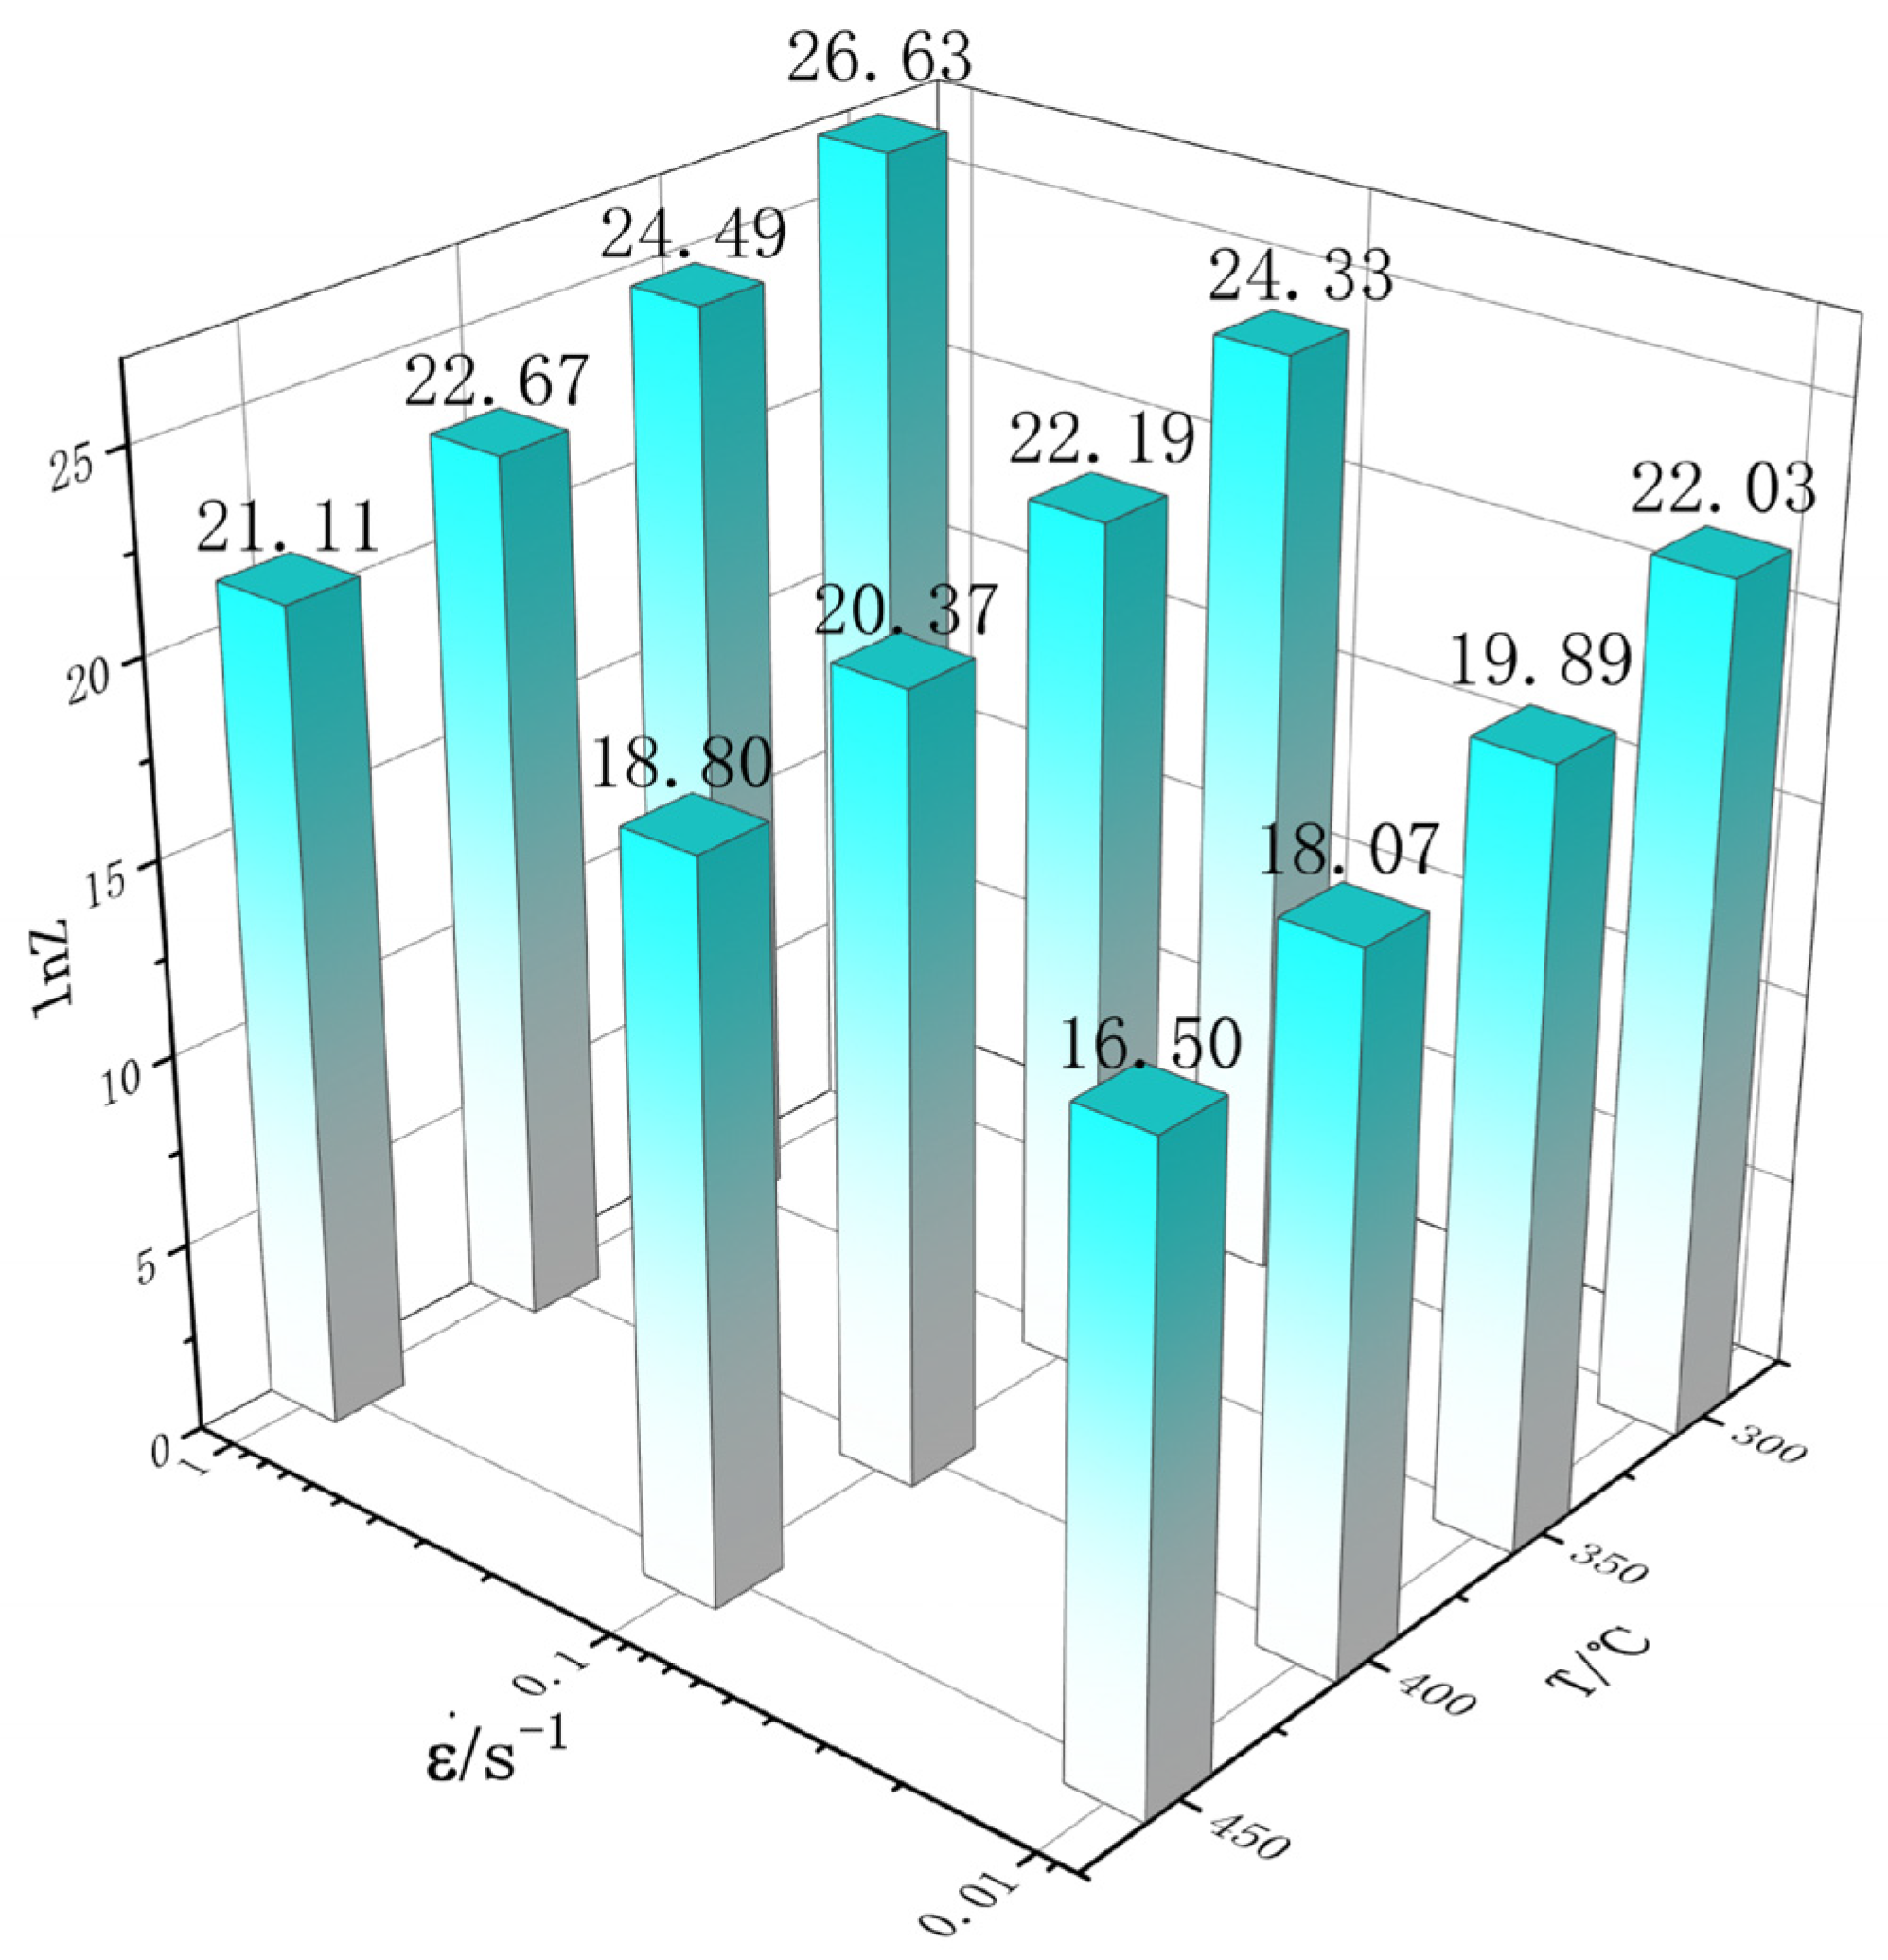
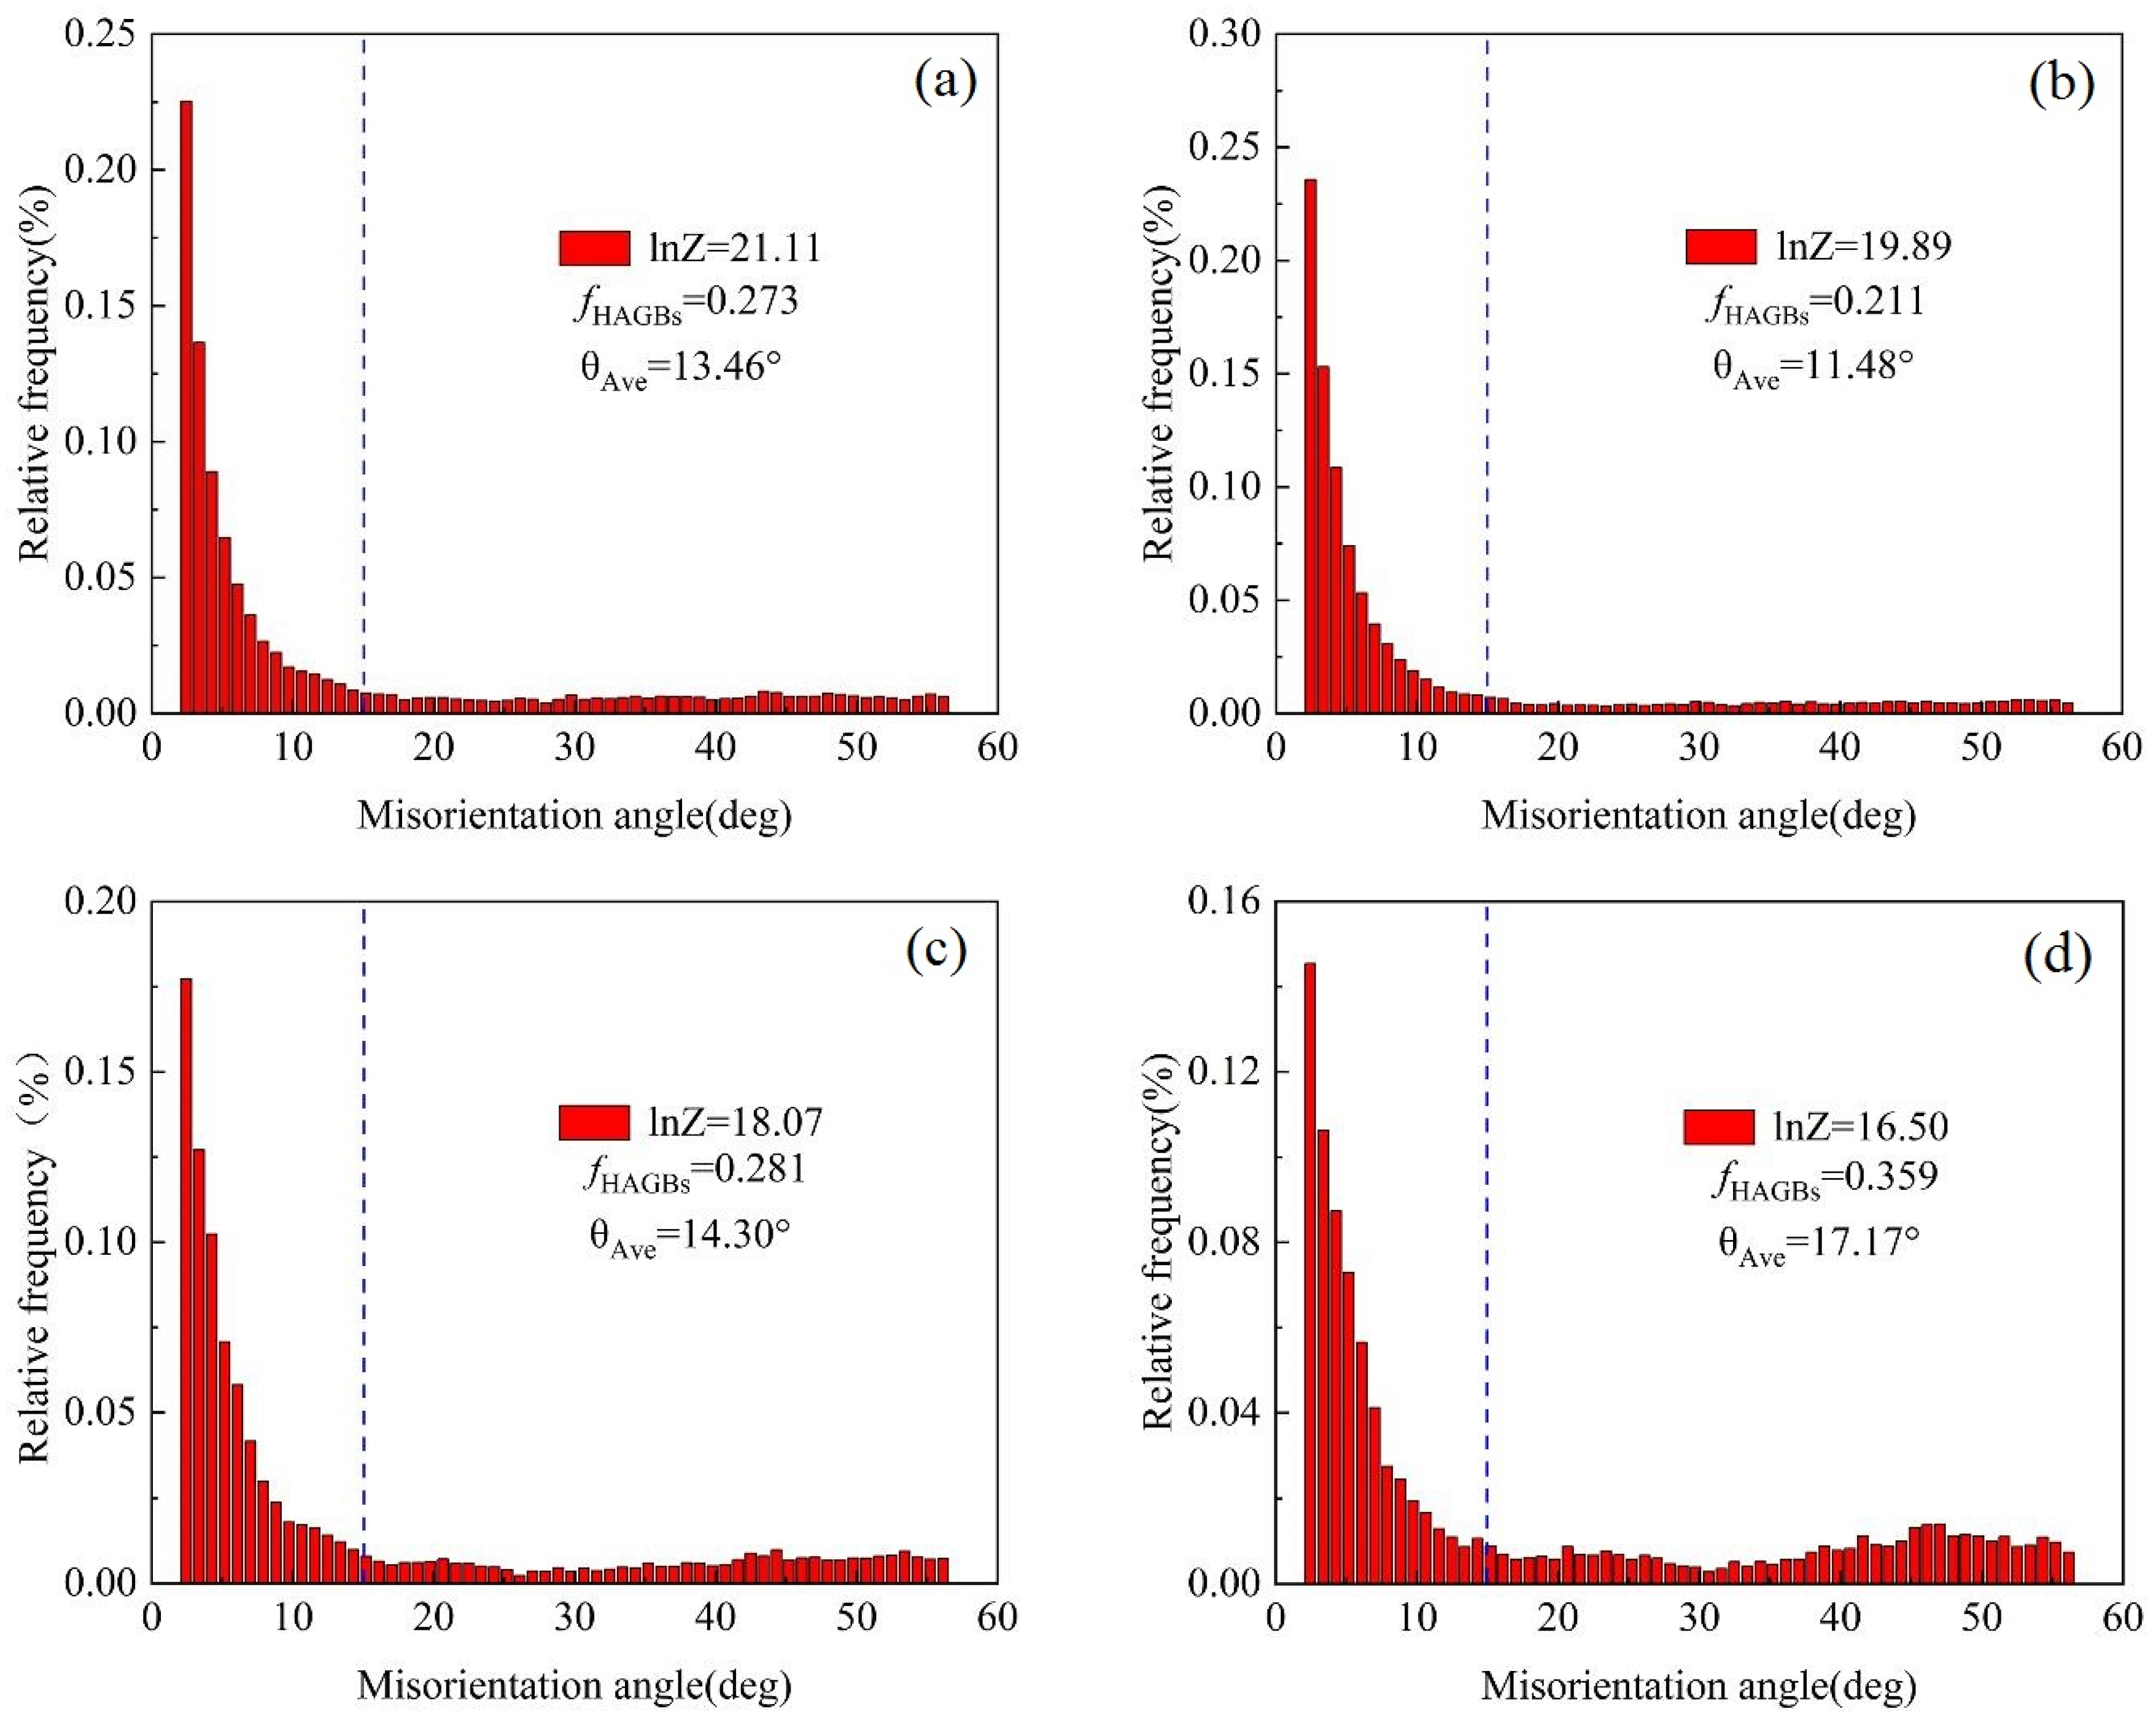
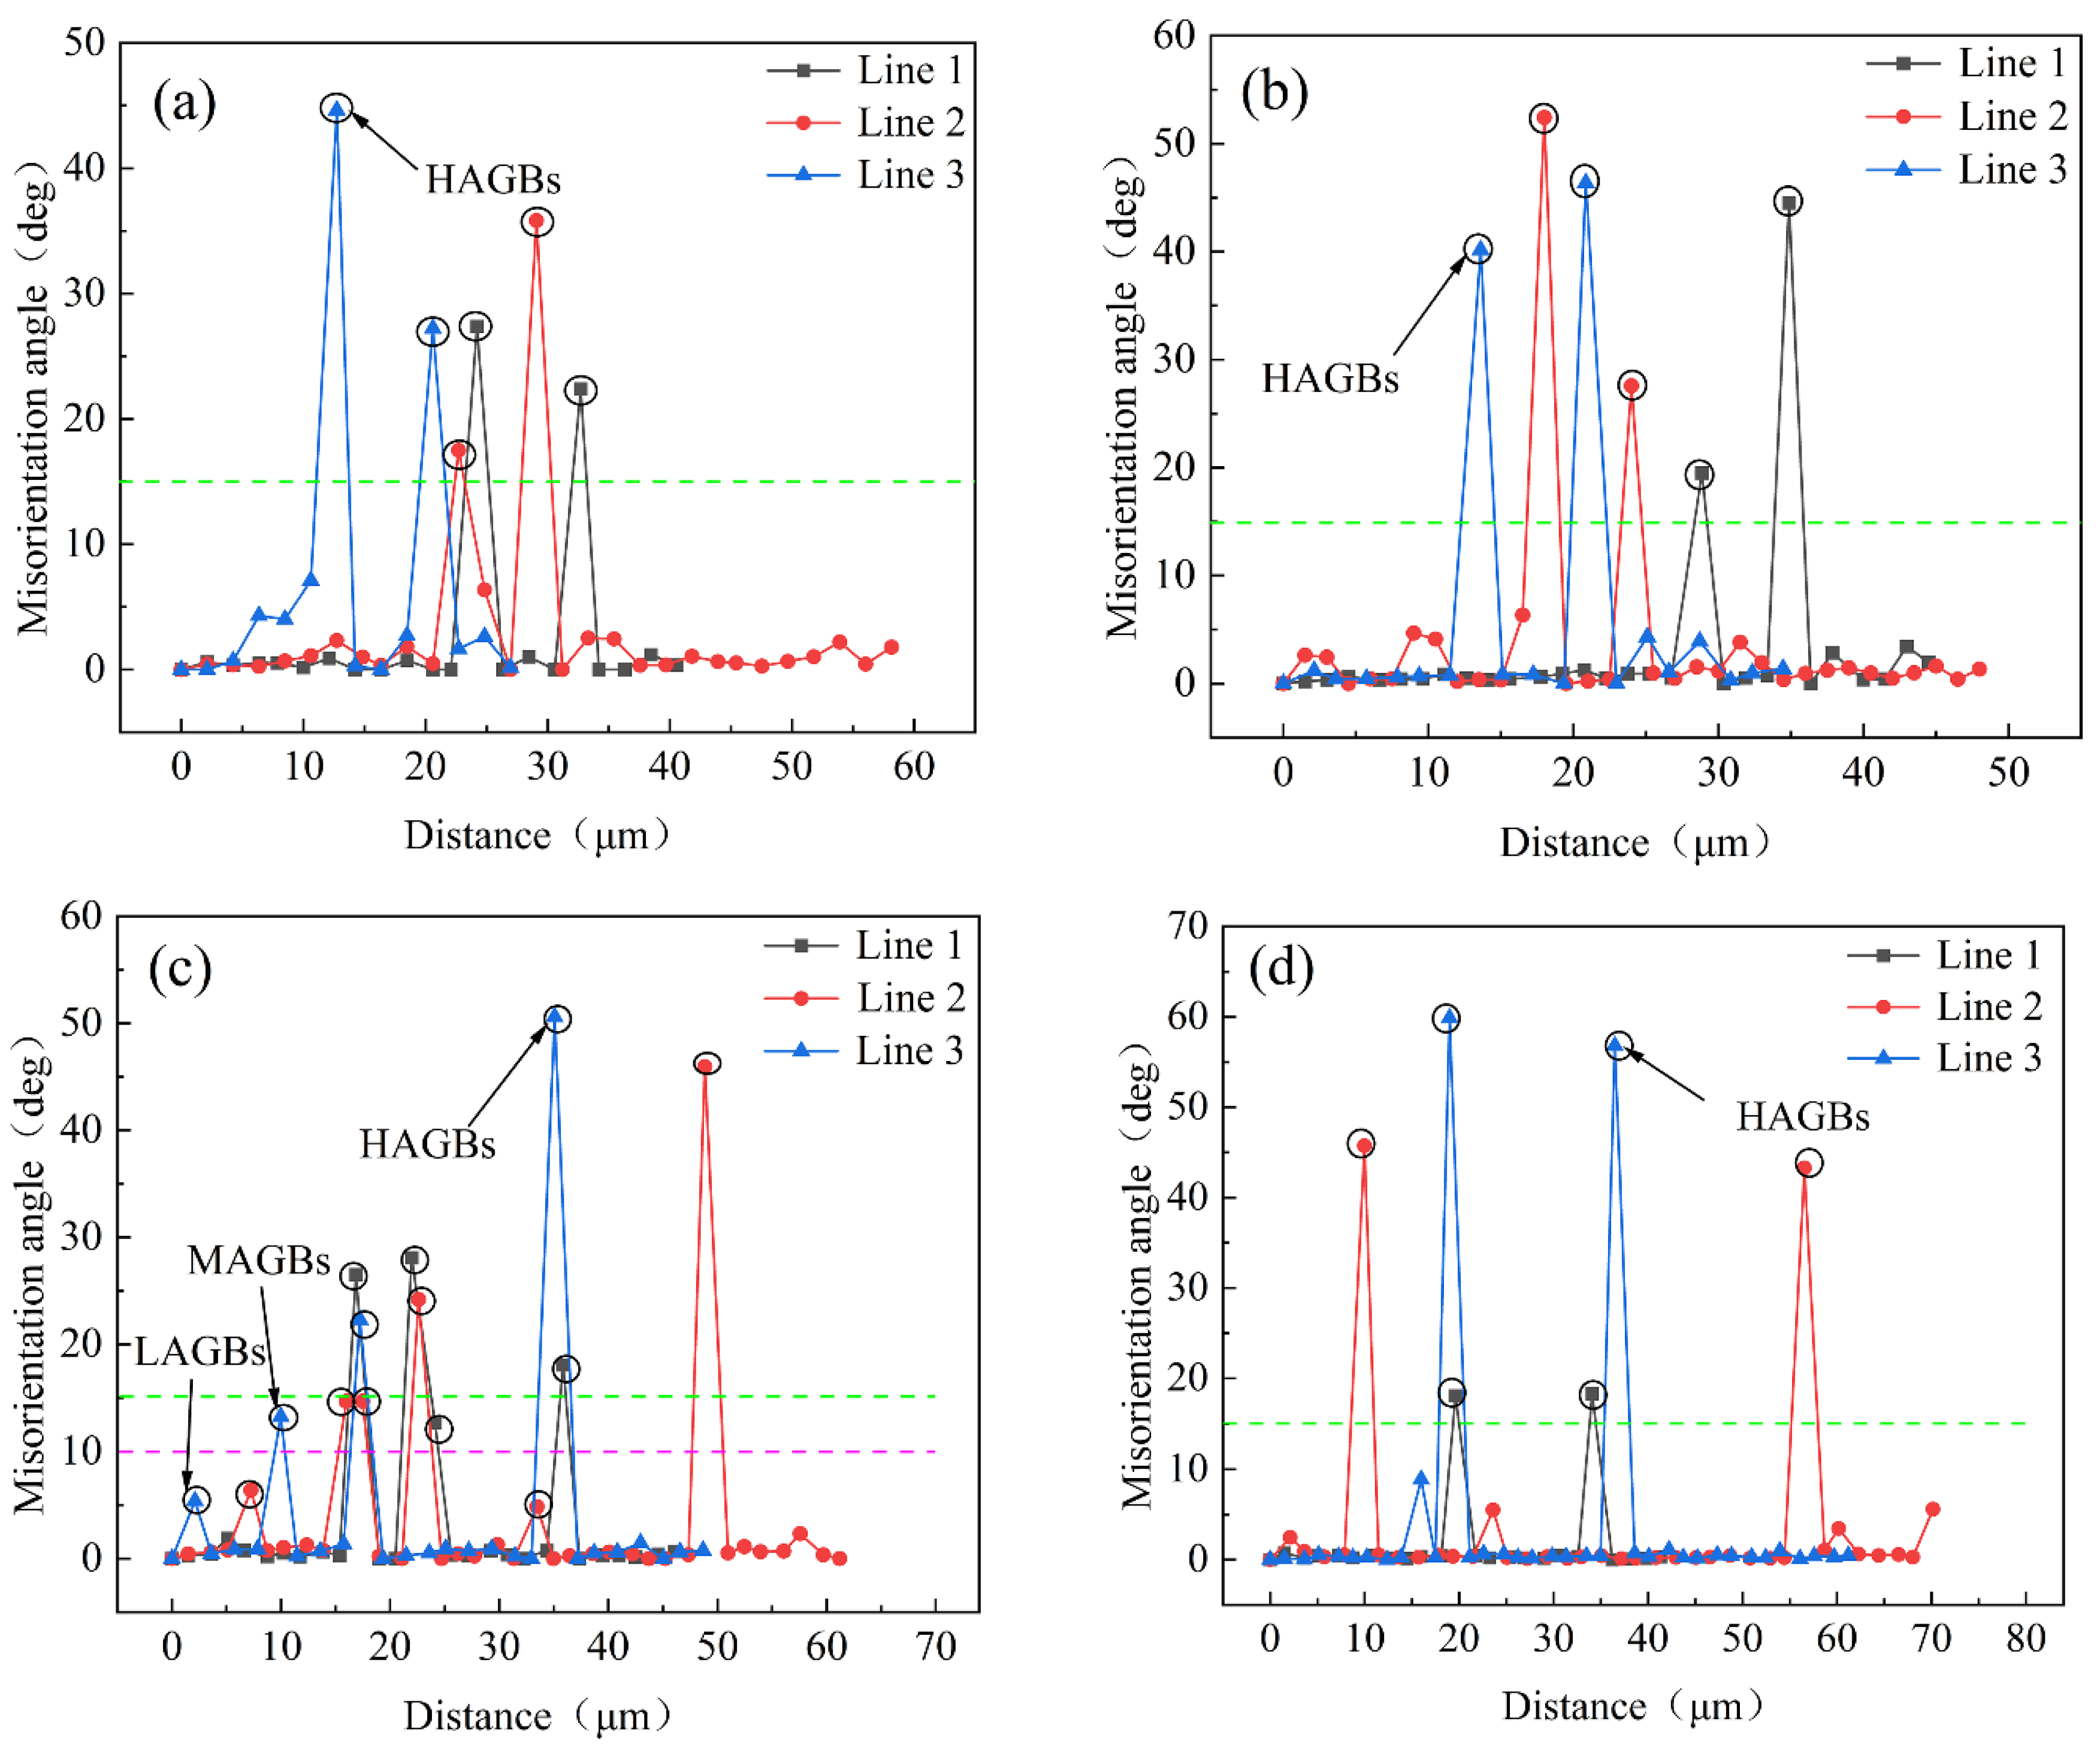
3.4. Effect of Z Parameter on Dynamic Recrystallization

In the process of hot deformation behavior analysis, it was found that the Z value can represent the coupling effect of deformation temperature and strain rate [28], so we can study the influence of the Z parameter’s change on the dynamic recrystallization of AlZn5.5Mg2.56Cu1.26 alloy. When the strain rate is 1 s−1, there is no dynamic recrystallization nucleation in the microstructure of the samples deformed at 300 to 400 °C, which is consistent with the stress–strain curve in Figure 3c. When the temperature increased to 450 °C (lnZ = 21.11), a small amount of recrystallization nucleation appeared gradually. Figure 8a,b shows the IPF diagram for lnZ = 21.11 and lnZ = 19.89. The sample shows obvious deformation microstructure characteristics, and the grains are flattened and elongated to both sides perpendicular to the deformation direction. At the same time, a large number of subgrain boundaries can be found around the grain boundaries of deformed grains, with white lines indicating small-angle grain boundaries (misalignment angle between 2° and 15°) and black lines indicating large-angle grain boundaries (misalignment angle greater than 15°). The grain boundaries of deformed grains are serrated, and many smaller grains are observed locally. As shown in Figure 9a,b, some small recrystallized grains can be found on the original grain boundaries, and the proportions of recrystallized grains are 2% and 1.6%, respectively. In the process of recrystallization, the high-density dislocations introduced by deformation become the driving force of recrystallization, while the subgrain boundary becomes the transition between dislocations and recrystallized grains. Because of the high orientation gradient, the bulge of the grain boundary becomes the ideal position for DDRX nucleation [29]. Figure 8c shows the IPF diagram for lnZ = 18.07. There are still many subgrain boundaries in the diagram, but the number and size of recrystallized grains is obviously increased. As shown in Figure 8c, the recrystallization ratio increases to 7.1%. Generally speaking, a lower lnZ value means a lower strain rate and a higher temperature, which will accelerate the diffusion of atoms and the movement of dislocations and contribute to the growth of recrystallized grains [30]. Figure 8d and Figure 9d show the IPF and recrystallization profiles for lnZ = 16.50, respectively. It can be seen that the proportion of recrystallized grains in the figure is larger than the other Z parameters, reaching 40.3%.
Figure 10 shows the distribution of orientation difference under the different Z parameters. When the Z values are high (lnZ = 21.11, lnZ = 19.89), the proportions of HAGBs are 27.3% and 21.1%, respectively. According to the proportion of HAGBs, it can be determined that a small amount of DRX occurs, while the proportion of LAGBs is ~80%, indicating that DRV still dominates under this condition. When the Z value continues to decrease (lnZ = 18.07), the proportion of HAGBs further increases to 28.1%, which indicates that DRX behavior is further strengthened with the increase in temperature and the decrease in strain rate, which is a similar finding to the results of Zhang [31] et al. When the Z value decreases to the lowest (lnZ = 16.50), the proportion of HAGBs increases greatly to 35.9%, which indicates that the proportion of LAGBs decreases continuously, and that the proportion of DRX in the alloy is higher.
Figure 10 shows the distribution of orientation difference between random recrystallized grains and their sides under different Z parameters. In Figure 8, we randomly select three different positions along the original deformed grain through the recrystallized grain to reach another original grain, which are indicated by black lines with arrow. When the lnZ value is high (lnZ = 21.11, lnZ = 19.89), only HAGBs and LAGBs pass through the grains, but there are no medium-angle grain boundaries (MAGBs), which shows that the DRX mechanism at this time is a process from LAGBs to HAGBs without the MAGBs stage. When lnZ is median (lnZ = 18.07), MAGBs appear in addition to HAGBs and LAGBs when black lines pass through grains. This indicates that the increase in HAGBs is caused by the joint transformation of LAGBs and MAGBs. The existence of MAGBs implies that recrystallized grains are formed through subgrain rotation and growth mechanisms [32]. The continuous rotation of subgrains is a typical characteristic of CDRX, so it can be judged that CDRX occurs easily when lnZ is median. When the value of LnZ is its lowest (lnZ = 16.50), it was found that only LAGBs and HAGBs, but no MAGBs, pass through the area of the black line with the arrow, which is a similar result to that seen when the value of lnZ is higher. Compared with Figure 11c, the medium-angle grain boundaries in Figure 11d disappear, indicating that the medium-angle grain boundaries gradually transform into high-angle grain boundaries with the increase in temperature. At the same time, a large number of subgrains with equiaxed grain morphology also appear inside the original grains, indicating that the nucleation mechanism under this condition is mainly CDRX.
According to the above analysis, it can be considered that CDRX and DDRX are the main nucleation mechanisms of the 7075Al alloy during thermal deformation [33], but that the DRX mechanisms are different under different lnZ values, so it is necessary to explore the occurrence conditions of various DRX mechanisms. When lnZ = 19.89, Figure 12a–c shows the grain boundary diagrams and geometric dislocation density (GND) diagrams, respectively. In the grain boundary diagrams, there are three grain boundaries of different colors, blue for 2° to 10°, red for 10° to 15°, and black for >15°. It can be seen from Figure 12b that the low-density dislocations appear around the grain boundaries of the original grains, and the bulges of grain boundaries can be observed at the positions with lower densities. Further through Figure 12a–c, it can be observed that the raised grain boundary is wrapped with a subgrain, which should be formed by subgrain rotation. With the deformation, the subgrain can further rotate, and when the orientation angle of the subgrain is greater than 15°, it becomes a recrystallized grain. Figure 13a shows the complete process of DDRX. First, the grain boundary will hinder dislocation movement, so that high-density dislocations are concentrated around the grain boundary, which gives it a higher storage energy and produces grain boundary bulges. As the deformation continues, the dislocation density increases continuously, dislocation cells and LAGBs are formed under the action of DRV, and then LAGBs and raised original grain boundaries form subgrains, which gradually transform into small DDRX grains. Many DDRX grains are formed along the grain boundaries of the original grains, forming a necklace-like structure.
When lnZ = 18.07, Figure 12e–h shows the grain boundary diagrams and GND diagrams, respectively. Two intermediate processes of CDRX can be clearly observed in Figure 12f,g, and Figure 12g shows the first intermediate process. It can be seen that the subgrains are surrounded by the original grains and LAGBs, but there is no high dislocation density around the grain boundary, so the original grain boundary is still straight, and there is no grain boundary bulge, thus DDRX cannot be produced [34]. However, through DRV, subgrains will be produced at the original grain boundary, and CDRX grains can be formed by the rotation of subgrains and the migration of the original grain boundary as the deformation continues. Figure 13b shows the complete process of the first mechanism of CDRX. Aluminum alloys have high stacking fault energy, so DRV is easy to occur. The rapid occurrence of DRV makes the dislocation density around grain boundaries decrease, and the grain boundaries cannot be raised. However, DRV makes dislocation cells and LAGBs form at the original grain boundary, and LAGBs are transformed into HAGBs with higher angle by subgrain rotation and growth mechanism, and CDRX grains are formed. Figure 12f shows the second intermediate process. It can be seen that a large number of subgrains appear in the original grain, which is obviously produced by DRV. With the increase in deformation, the grain rotation of adjacent subgrains may be induced, and then CDRX grains may be produced. Figure 13c shows the complete process of the second mechanism of CDRX. Under the action of DRV, dislocation cells form in the crystal, and then form subgrains with LAGBs, and CDRX grains are formed through subgrain rotation during further deformation. It is worth mentioning that the HAGBs generated in this process are all newly generated. Therefore, unlike DDRX, CDRX can appear both at grain boundaries and within grains. Figure 12d shows the grain boundary diagram for when lnZ = 16.50. A large number of subgrains with equiaxed grain morphology can be observed in the interior of the original grains, which is the next stage in the development of the recrystallization process in Figure 12f. In this process, there are more subgrains with equiaxed grain morphology inside the original grain, so the nucleation mechanism of this process is also the same as that shown in in Figure 13c.

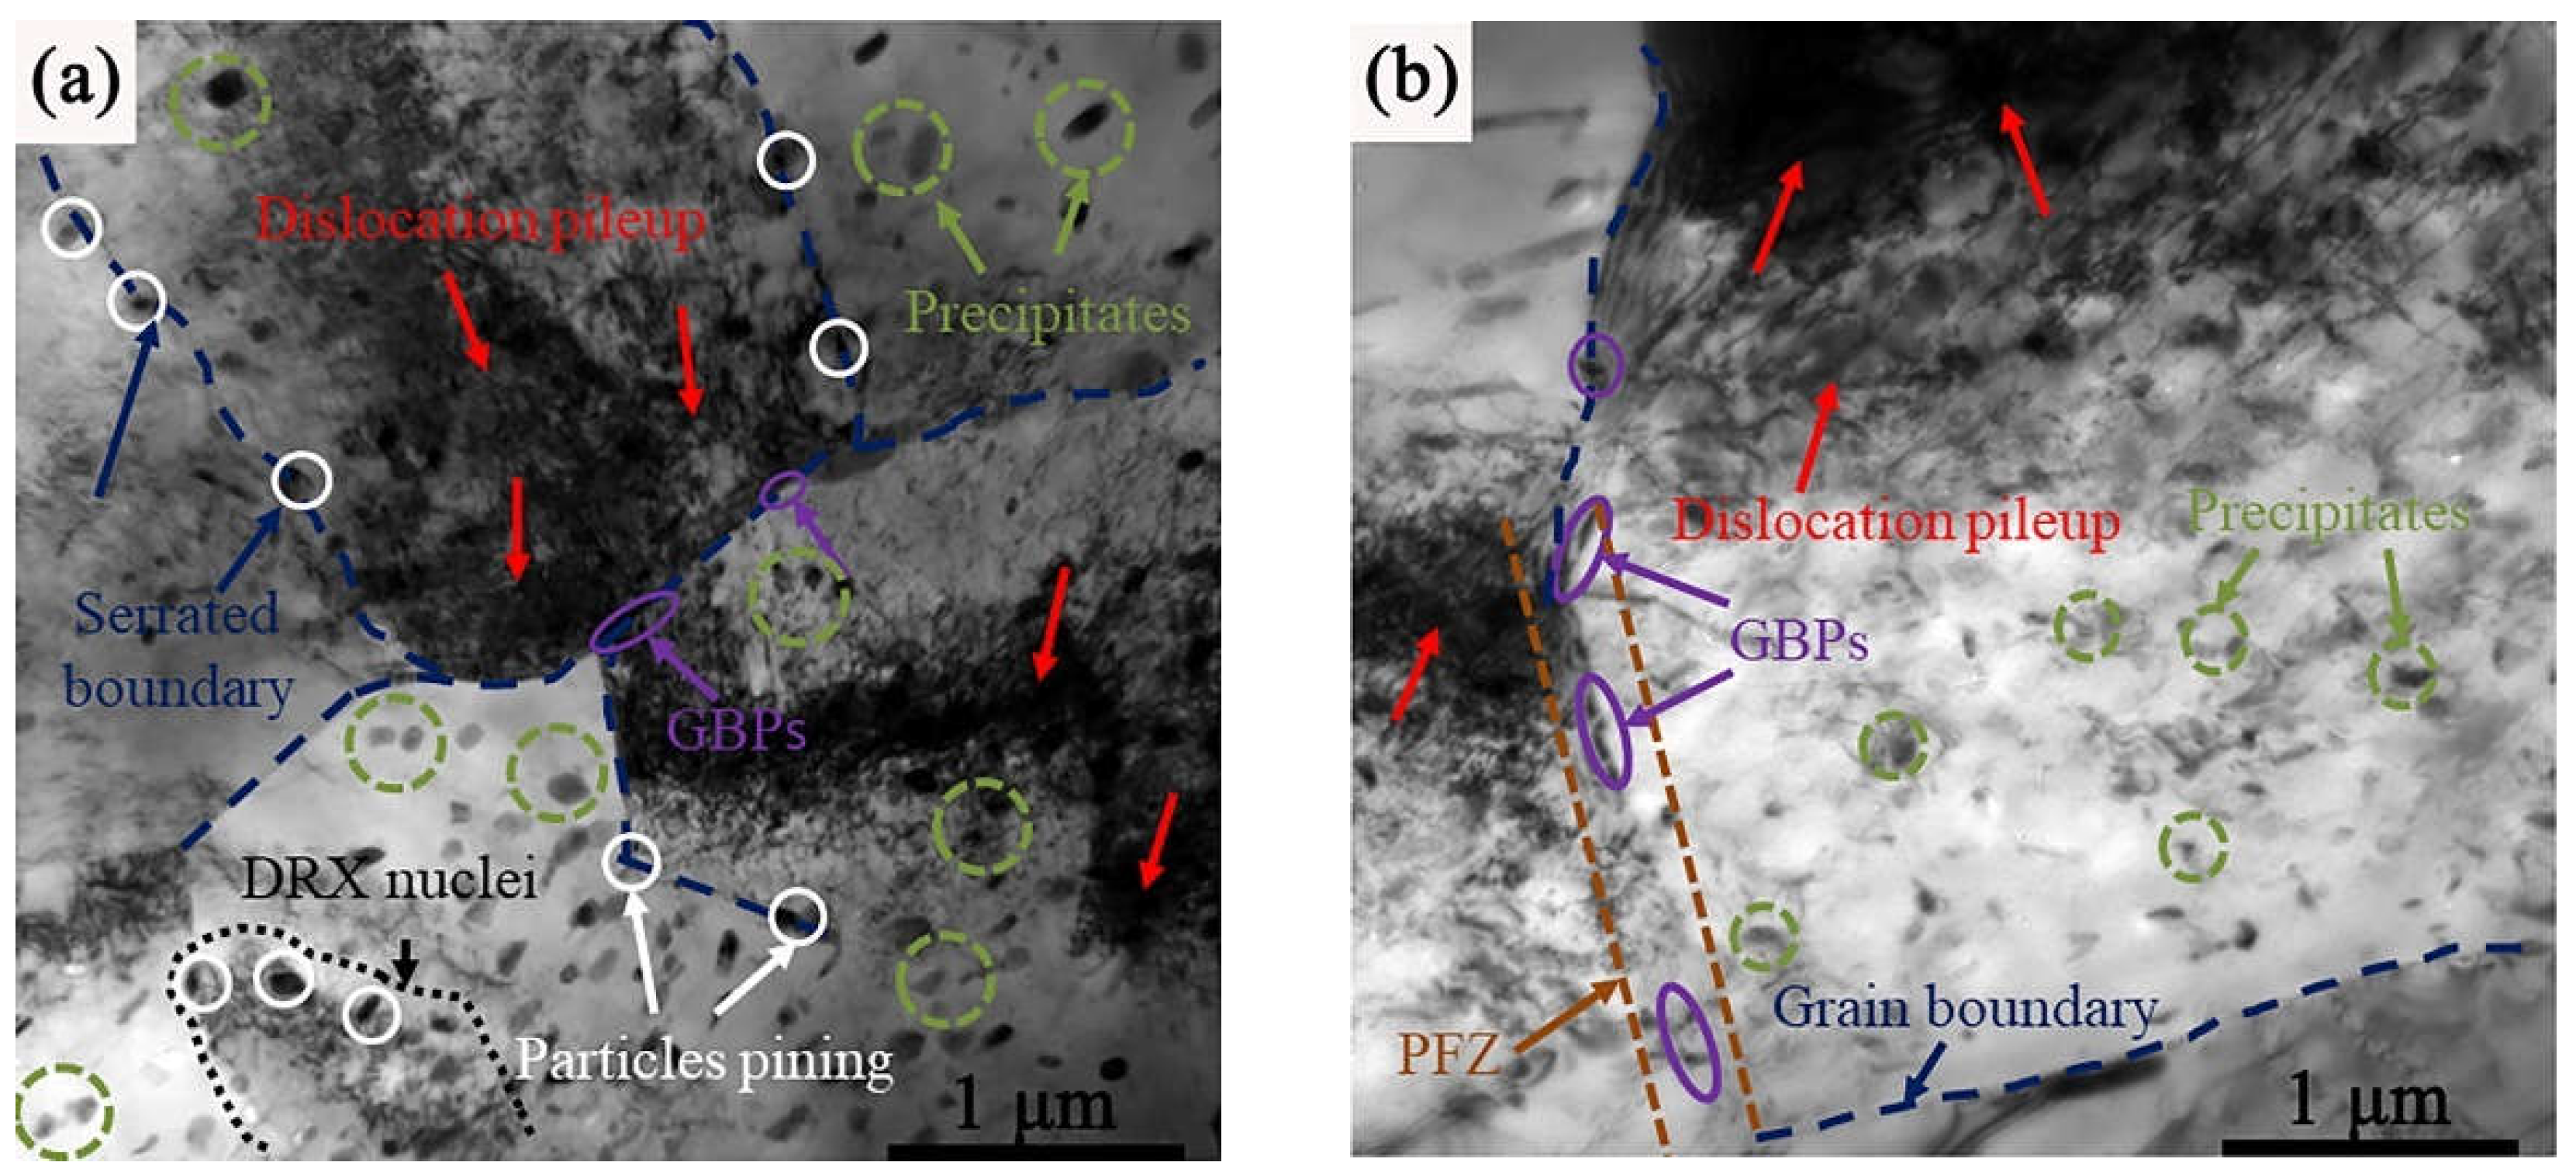
3.5. Dislocation Microstructure

Figure 14 shows the dislocation structure of the sample under different parameters. When lnZ = 21.11 and lnZ = 19.89, the dislocation density is extremely high. As shown in Figure 14a, dislocations gather around grain boundaries to form dislocation walls, which promote the formation of subgrain boundaries. At the same time, it is observed that a large number of dislocations in Figure 14b are distributed in an aluminum alloy matrix, forming a dislocation entanglement. When lnZ = 18.07, the dislocation density decreases significantly compared with in Figure 14a,b. With the decrease in dislocation density, the driving force of recrystallization decreases, and it is more difficult for dynamic recrystallization nucleation to occur [35,36,37]. When lnZ = 16.50, the dislocation density decreases further, and the grain boundary and subgrain boundary can be clearly observed. Therefore, it can be concluded that the dislocation density decreases with the decrease in the lnZ value.

3.6. Precipitation Behavior

Figure 15 shows the microstructure of the alloy under different Z parameters. Figure 15a–d shows that the fine precipitates appear and that these precipitates are dispersed in Al matrix. Most of the precipitates are elliptical, which indicates that dynamic precipitation occurs during thermal deformation. It can be seen from the figure that the amount of precipitates in the alloy is greatest at 450 °C, 1 s−1 (lnZ = 21.11) and 350 °C, 0.01 s−1 (lnZ = 19.89); that the precipitates gradually decrease at 400 °C, 0.01 s−1 (lnZ = 18.07); and that the precipitates are the lowest at 450 °C, 0.01 s−1 (lnZ = 16.50). This is because when the deformation temperature is 350 °C, the temperature is lower, which is beneficial to precipitation, and with the increase in temperature, a large number of precipitates are dissolved back into the matrix, which makes the number of precipitates decrease. At the same time, a low strain rate reduces dislocation density by promoting DRV, while a higher strain rate means more dislocations and favorable nucleation sites, which provides a fast diffusion path for accelerating growth and coarsening, reduces the energy barrier of dynamic precipitation, and promotes the heterogeneous nucleation of the precipitated phases [38,39]. Therefore, the higher Z parameter can promote dynamic precipitation during hot compression.
Figure 16 shows the microstructure morphology of the precipitated phase and the dislocation of the alloy. As can be seen from Figure 16a, a large number of dislocations had accumulated around the precipitated phase after hot compression. According to the Orowan mechanism, the precipitated phase will hinder the movement of dislocations and pin dislocations in the process of plastic deformation. Therefore, the precipitated phase delays dislocation slip and reduces dynamic recrystallization. At the same time, the pinning effect of grain boundary precipitates (GBPs) on grain boundaries makes grain boundaries appear serrated, which may be one of the origins of serrated grain boundaries in Figure 12a. As can be seen from Figure 16a,b, the precipitated phase is dispersed in the aluminum alloy matrix, and there is also a large number of precipitated phases around the grain boundary, which obviously affect the growth of dynamic recrystallization grains. Dynamic recrystallization nucleation can be observed in Figure 16a, and it can be seen that precipitates are pinned around the boundary, which obviously limits the expansion of grain boundaries. Therefore, precipitates in alloys always inhibit the nucleation and growth of dynamic recrystallization by hindering dislocation movement and grain boundary migration [40,41]. The influence of precipitation on dynamic recrystallization is related to the lnZ value. The larger the lnZ value, the more obvious the influence is. When the lnZ is high, the dislocations and grain boundaries can be effectively pinned by the dispersed fine precipitates, thus reducing the dynamic recrystallization behavior. However, when the lnZ value is low, the precipitated phase density and dislocation density are obviously reduced, and the restriction on recrystallization is weakened. It can be seen that the precipitated phase can only control the grain size of dynamic recrystallization; it cannot change the recrystallization mechanism.

4. Conclusions

(1)
According to the flow stress curve, the peak value and steady value of stress decrease gradually with the increase in deformation temperature and the decrease in strain rate. The hot deformation constitutive relation of the alloy is obtained by fitting the relevant numerical values. The hot deformation activation energy of the alloy is 126.9 kJ/mol, and the constitutive equation is as follows:
ε ˙ = 4.68 × 10 8 [ sinh ( 0.01482 × σ ) ] 4.37 exp 126900 R T
(2)
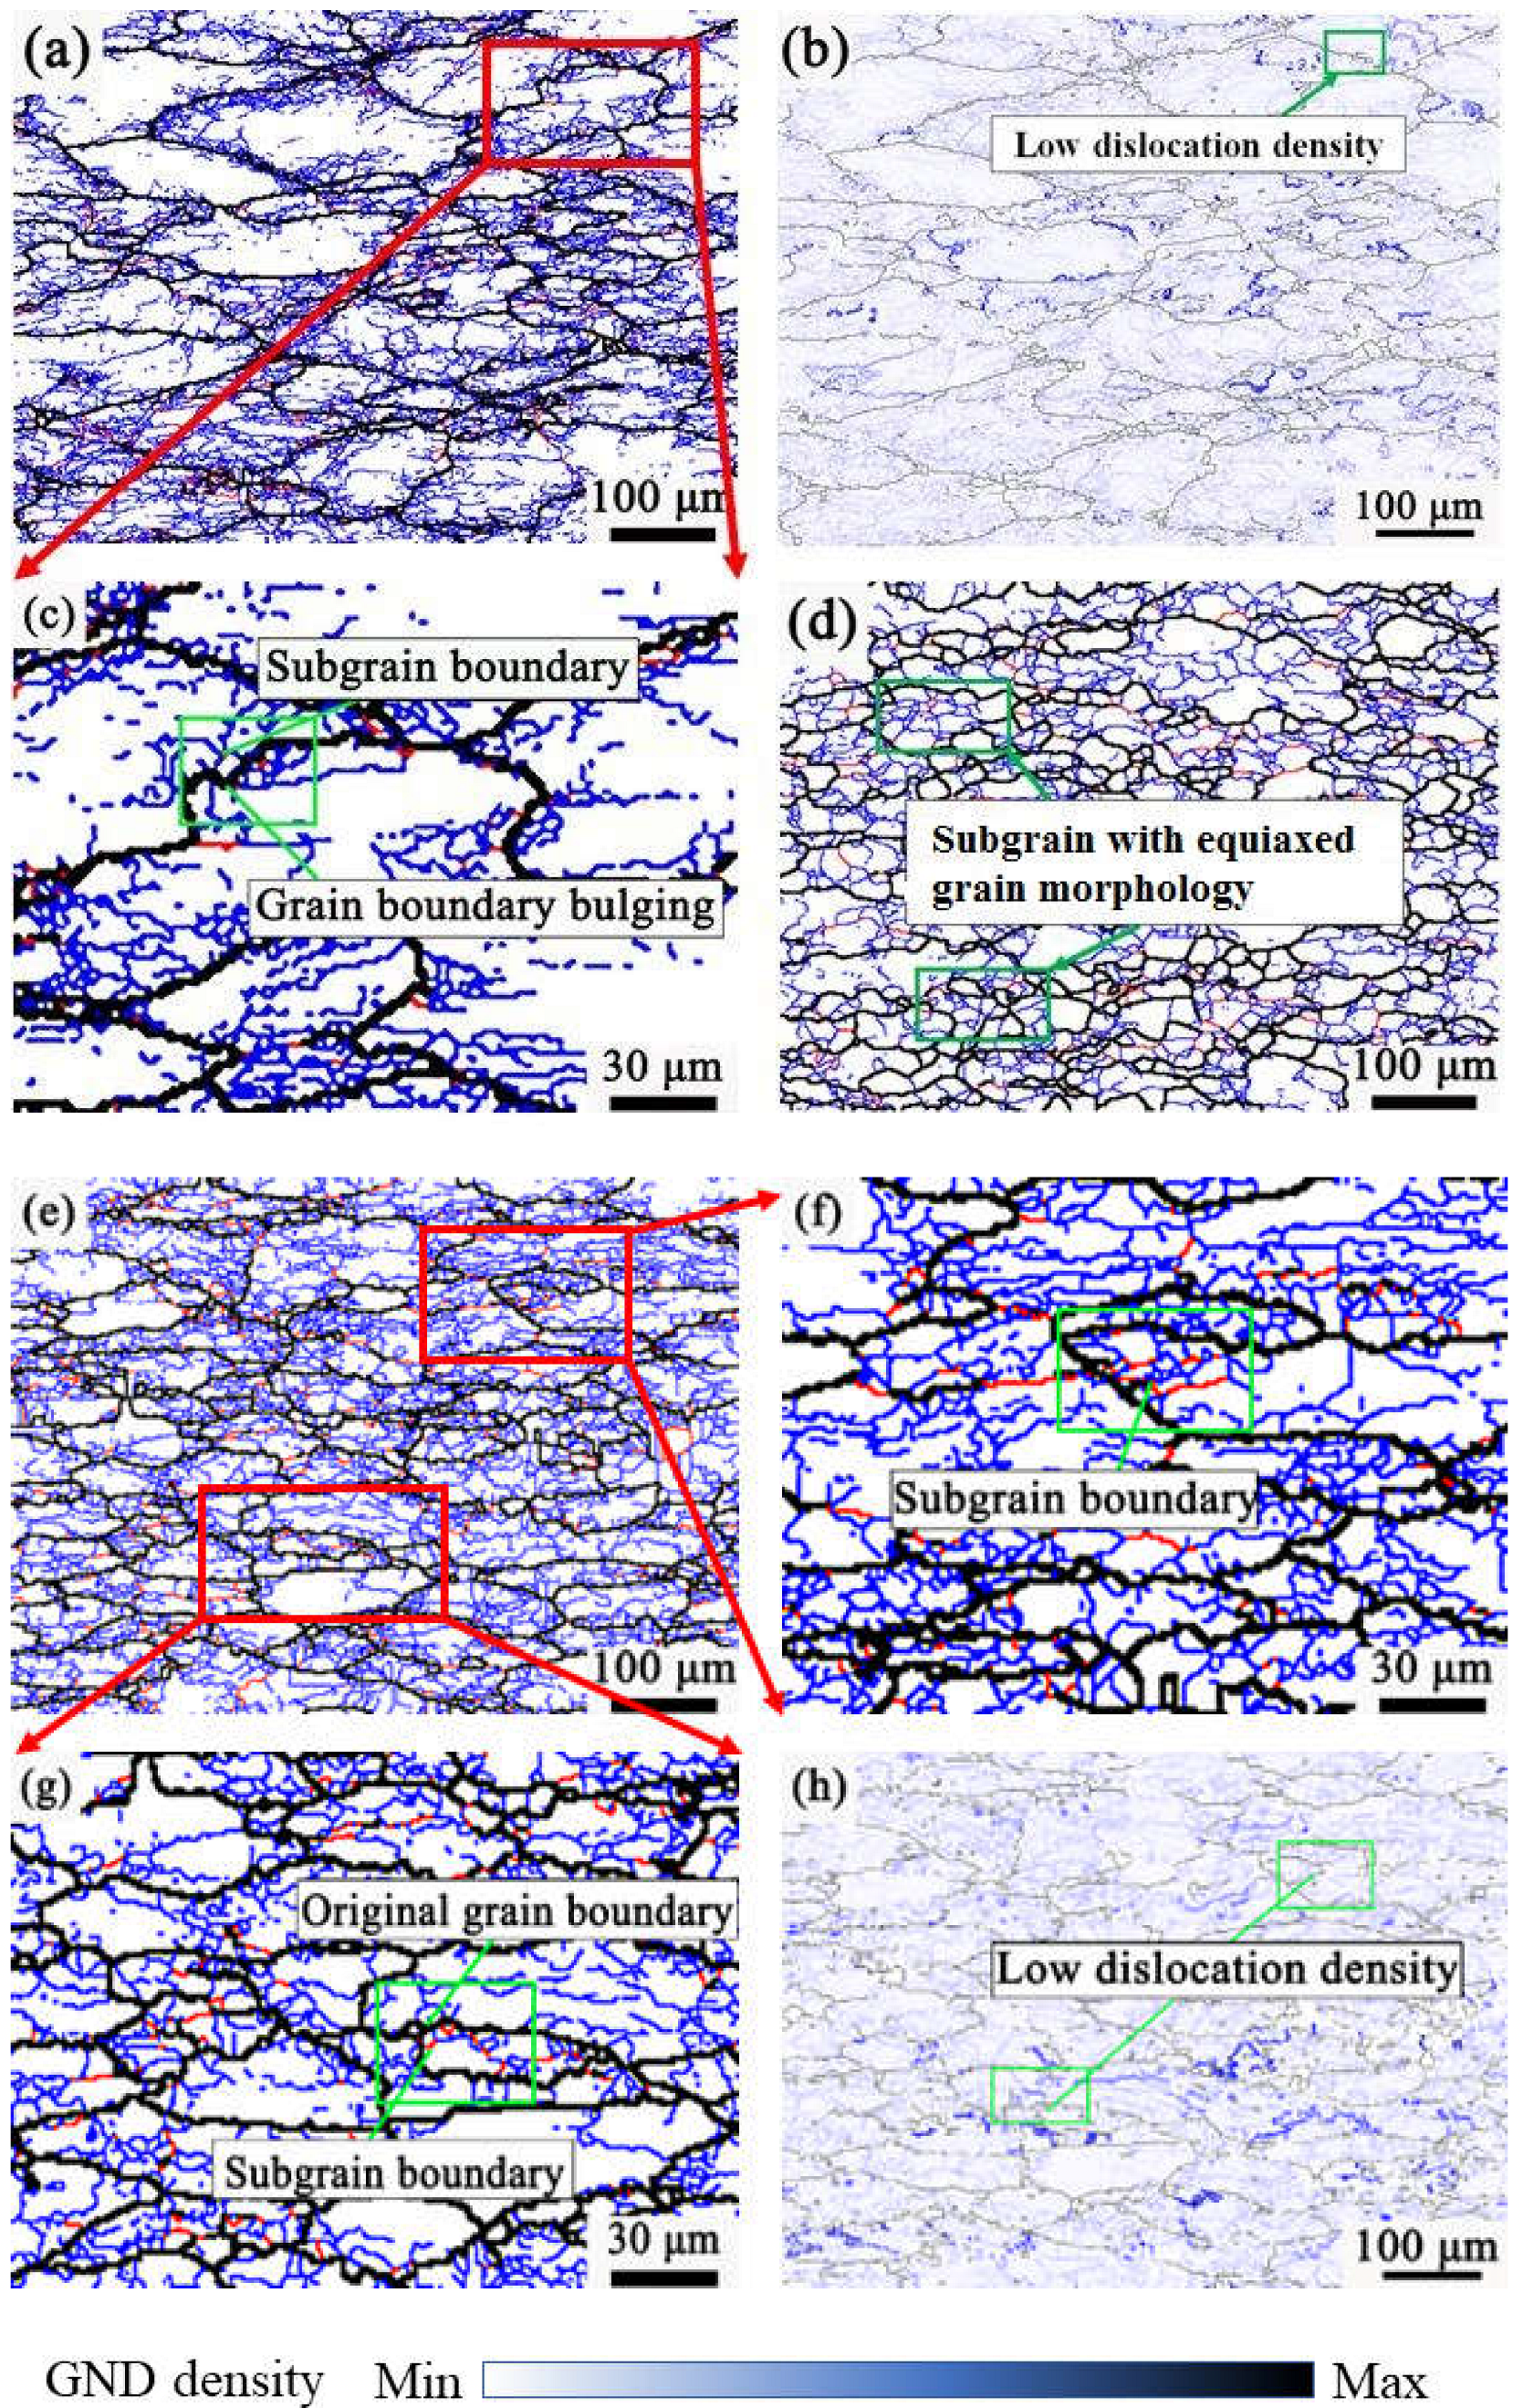
When the Z value is high, the softening mechanism of 7075 aluminum alloy is dynamic recovery. The main recrystallization mechanism of the alloy is DDRX at a relatively high Z value. However, at a lower Z value, the main recrystallization mechanism of the alloy is CDRX, and these experimental conditions are helpful to obtaining more uniformly refined grains.
(3)
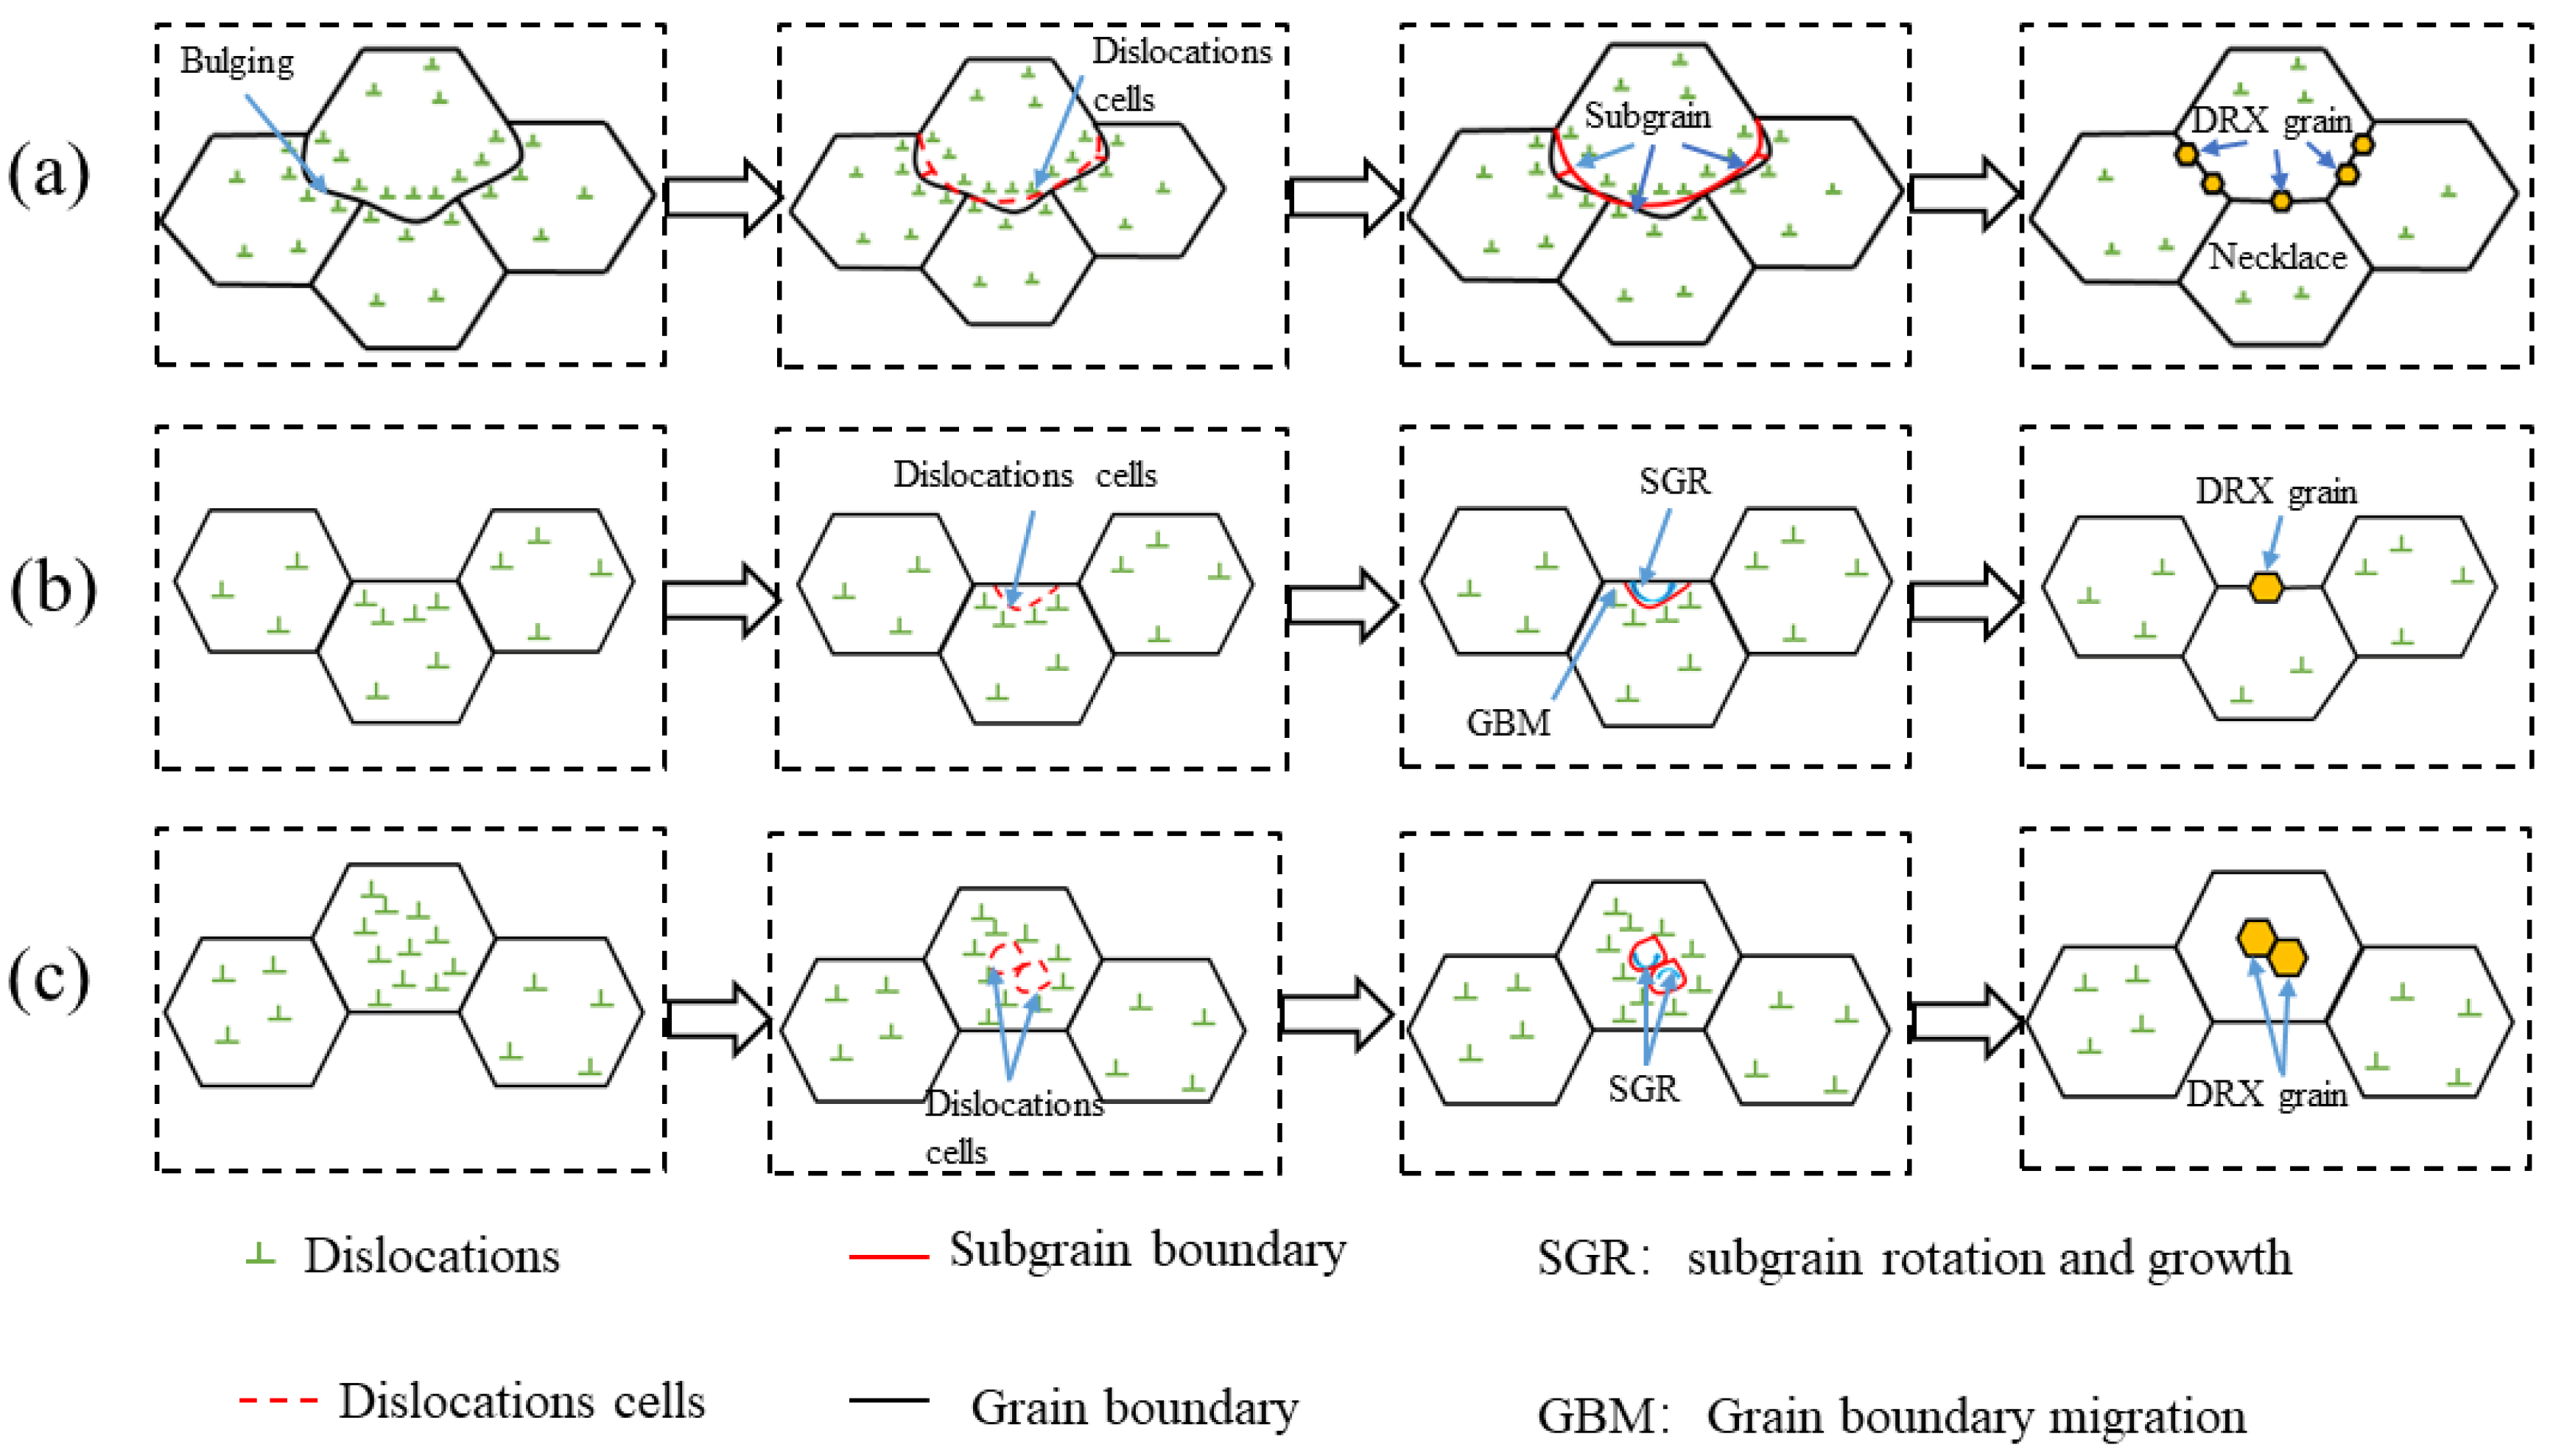
There are four different recrystallization mechanisms in AlZn5.5Mg2.56Cu1.26 alloys, among which DDRX is mainly produced by grain boundary bulge, subgrain rotation, and grain boundary migration; CDRX is mainly produced by subgrain rotation and grain boundary migration within grains and at grain boundaries; and GDRX is produced by the pinch breaking of original grains.
(4)
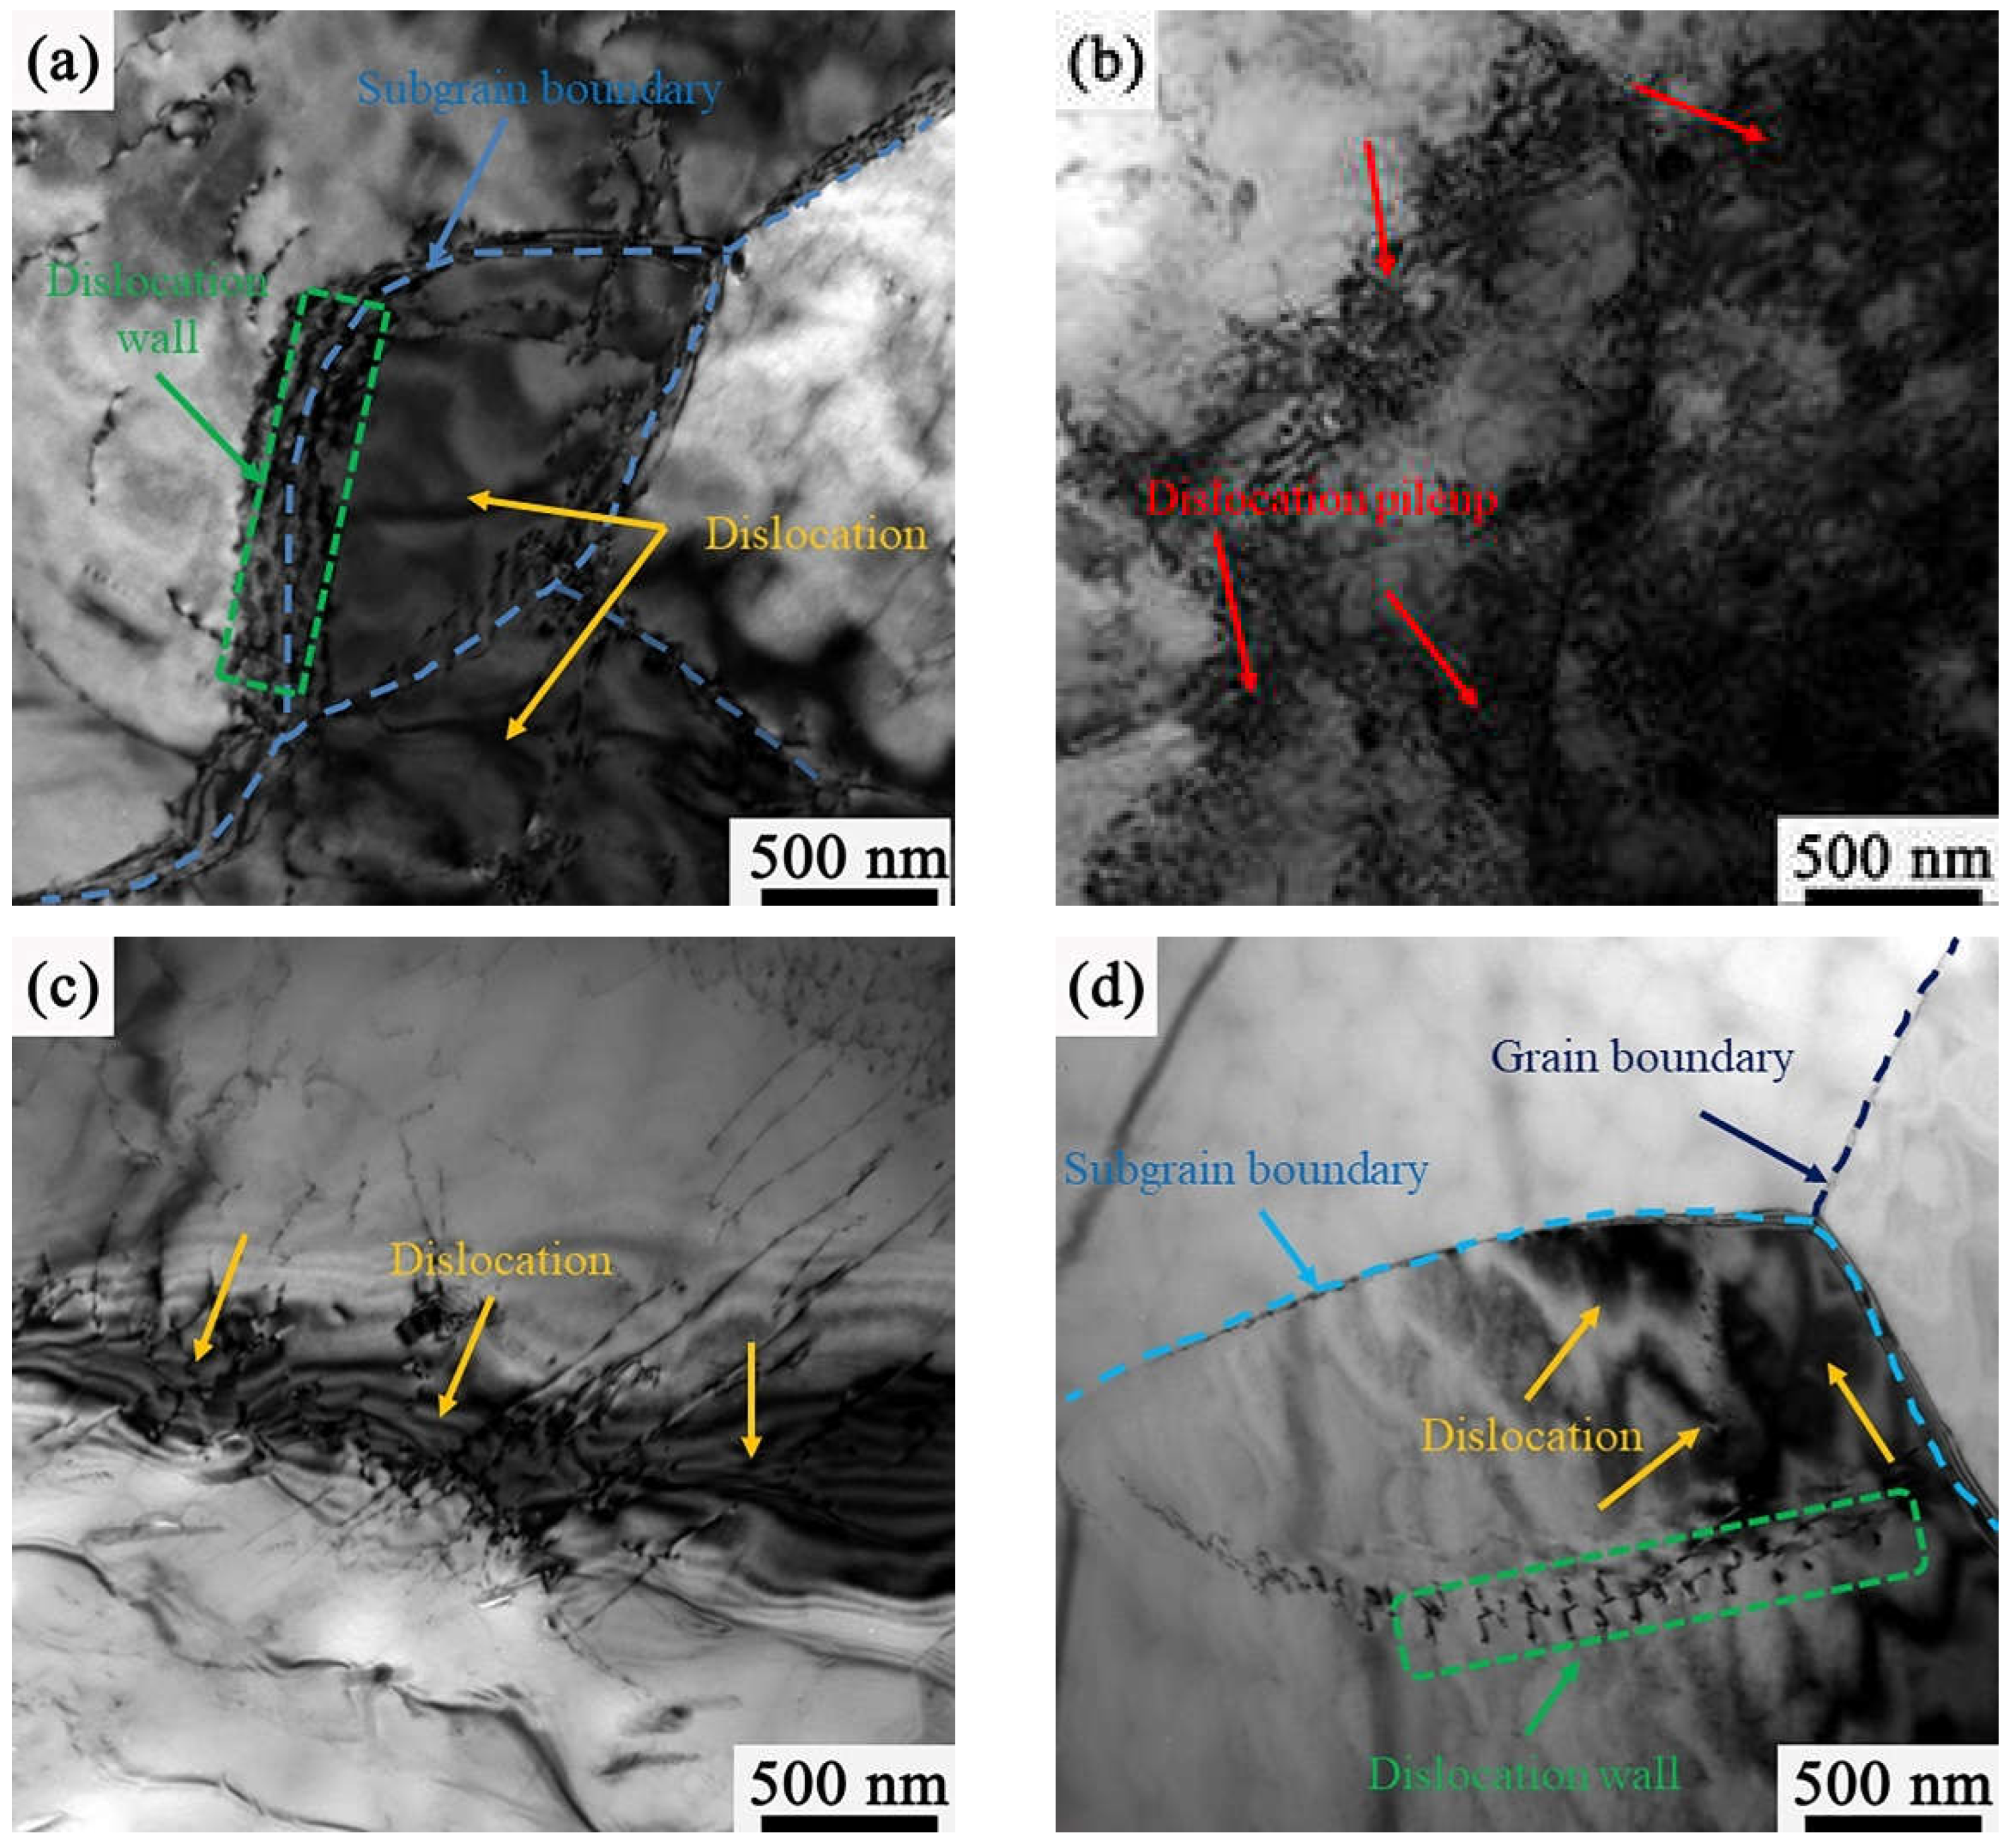
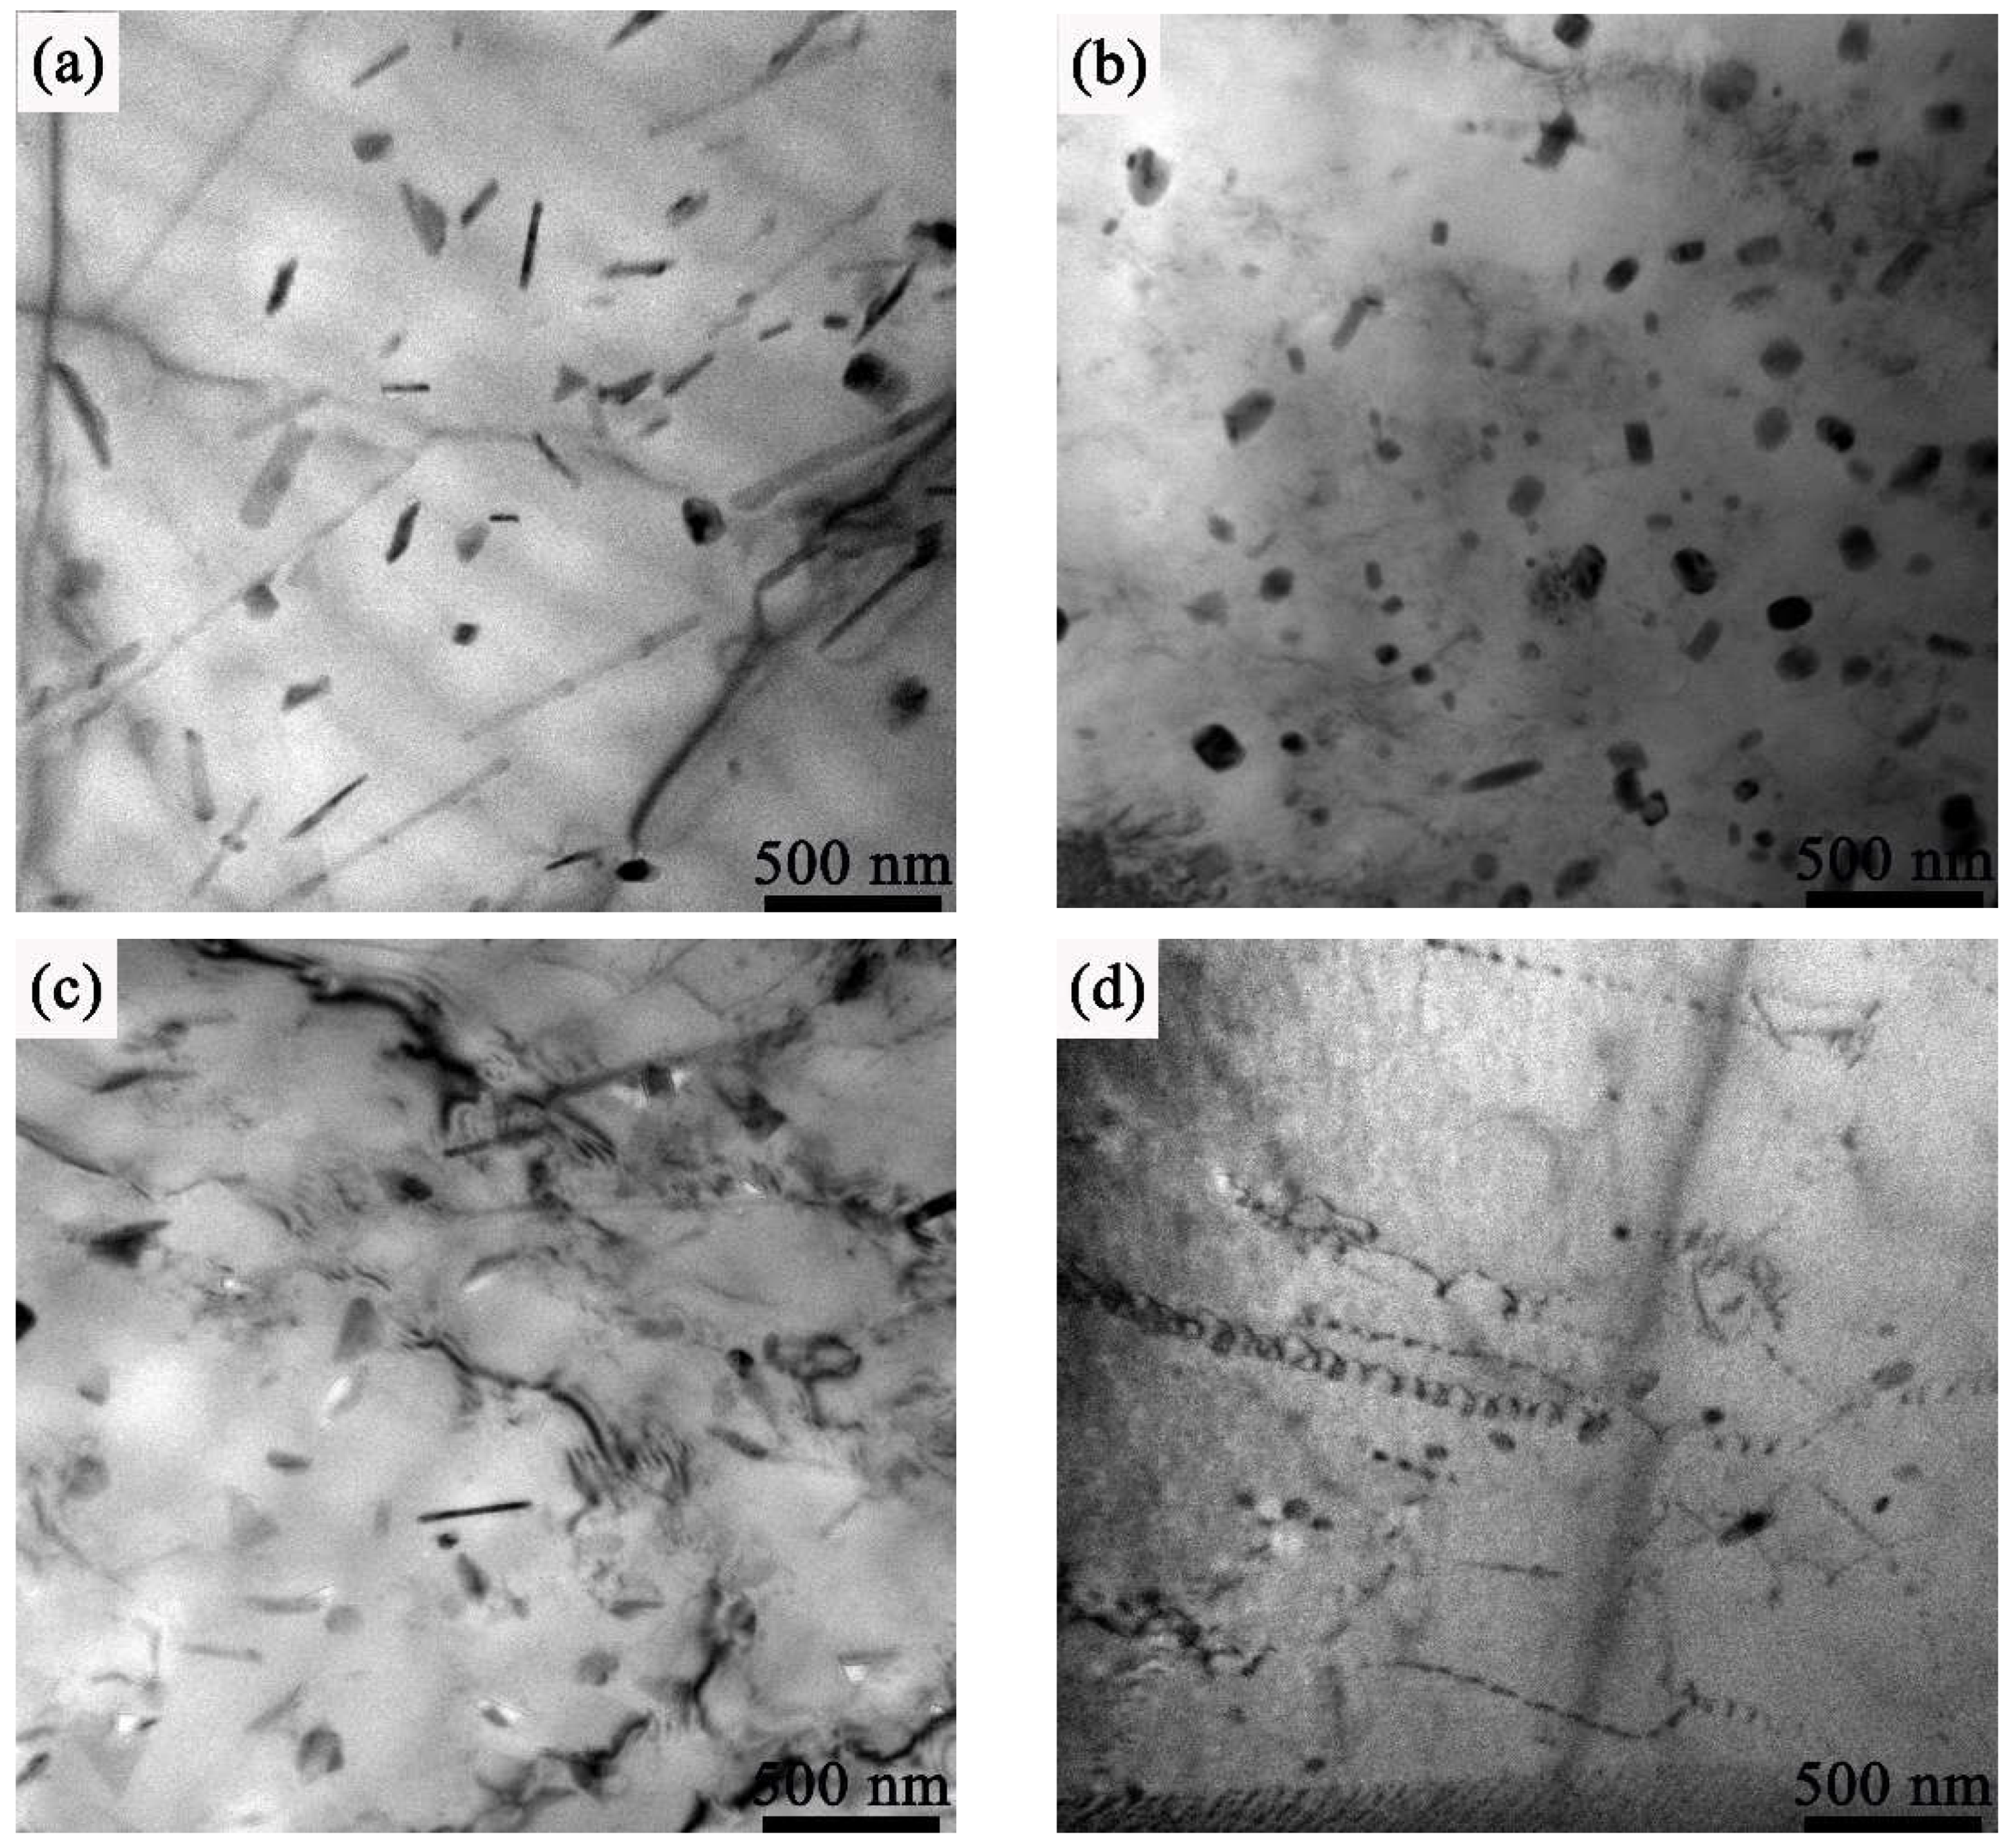
Higher Z parameters can promote dynamic precipitation during hot compression. The dislocation density of the alloy decreases with the decrease in the Z value. Precipitates in the alloy inhibit the nucleation and growth of dynamic recrystallization by hindering dislocation movement and grain boundary migration, and the greater the Z value, the more obvious the influence is.

Author Contributions

Conceptualization, X.Z. and Y.L.; methodology, K.C. and Y.F.; investigation, Y.F. and K.C.; resources, Y.L. and F.Q.; writing—original draft preparation, X.Z. and Y.F.; writing—review and editing, Y.L. and K.C.; project administration, F.Q. and X.Z. All authors have read and agreed to the published version of the manuscript.

Funding

This work was financially supported by the Central government guides local funds for science and technology development (No. YDZJSX20231A045), Fundamental Research Program of Shanxi Province (No. 202103021223288 and No. 202103021224282).

Data Availability Statement

The data presented in this paper are available on request from the corresponding author.

Conflicts of Interest

The authors declare no conflicts of interest.

References

  1. Heinz, A.; Haszler, A.; Keidel, C.; Moldenhauer, S.; Benedictus, R.; Miller, W.S. Recent development in aluminium alloys for aerospace applications. Mater. Sci. Eng. A 2000, 280, 102–107. [Google Scholar] [CrossRef]
  2. Zang, C.; Xiao, W.; Fu, Y.; Ma, C. Enhanced properties and homogeneity of Al-Zn-Mg-Cu alloy thick plate by non-isothermal aging. J. Alloys Compd. 2023, 952, 170023. [Google Scholar] [CrossRef]
  3. Atkinson, H.; Burke, K.; Vaneetveld, G. Recrystallisation in the semi-solid state in 7075 aluminium alloy. Mater. Sci. Eng. A 2008, 490, 266–276. [Google Scholar] [CrossRef]
  4. Ebrahimi, M.; Shaeri, M.; Naseri, R.; Gode, C. Equal channel angular extrusion for tube configuration of Al-Zn-Mg-Cu alloy. Mater. Sci. Eng. A 2018, 731, 569–576. [Google Scholar] [CrossRef]
  5. Zuo, J.; Hou, L.; Shi, J.; Cui, H.; Zhuang, L.; Zhang, J. Effect of deformation induced precipitation on grain refinement and improvement of mechanical properties AA 7055 aluminum alloy. Mater. Charact. 2017, 130, 123–134. [Google Scholar] [CrossRef]
  6. Feng, D.; Zhang, X.; Liu, S.; Deng, Y. Constitutive equation and hot deformation behavior of homogenized Al–7.68Zn–2.12Mg–1.98Cu–0.12Zr alloy during compression at elevated temperature. Mater. Sci. Eng. A 2014, 608, 63–72. [Google Scholar] [CrossRef]
  7. Li, J.; Wu, X.; Cao, L.; Liao, B.; Wang, Y.; Liu, Q. Hot deformation and dynamic recrystallization in Al-Mg-Si alloy. Mater. Charact. 2021, 173, 110976. [Google Scholar] [CrossRef]
  8. Zhao, J.; Deng, Y.; Tang, J. Grain refining with DDRX by isothermal MDF of Al-Zn-Mg-Cu alloy. J. Mater. Res. Technol. 2020, 9, 8001–8012. [Google Scholar] [CrossRef]
  9. Liu, S.; Pan, Q.; Li, M.; Wang, X.; He, X.; Li, X.; Peng, Z.; Lai, J. Microstructure evolution and physical-based diffusion constitutive analysis of Al-Mg-Si alloy during hot deformation. Mater. Des. 2019, 184, 108181. [Google Scholar] [CrossRef]
  10. Lu, D.-D.; Li, J.-F.; Guo, Y.-J.; Wang, G.; Wu, R.; Ma, P.-C.; Chen, Y.-L.; Zhang, X.-H.; You, W.; Zhang, R.-F. T1 precipitate bands and particle stimulated nucleation in 2195 Al-Cu-Li alloy during hot deformation. J. Alloys Compd. 2022, 909, 164716. [Google Scholar] [CrossRef]
  11. Lee, S.-H.; Jung, J.-G.; Baik, S.-I.; Park, S.H.; Kim, M.-S.; Lee, Y.-K.; Euh, K. Effects of Ti addition on the microstructure and mechanical properties of Al–Zn–Mg–Cu–Zr alloy. Mater. Sci. Eng. A 2021, 801, 140437. [Google Scholar] [CrossRef]
  12. Berg, L.; Gjønnes, J.; Hansen, V.; Li, X.; Knutson-Wedel, M.; Waterloo, G.; Schryvers, D.; Wallenberg, L. GP-zones in Al–Zn–Mg alloys and their role in artificial aging. Acta Mater. 2001, 49, 3443–3451. [Google Scholar] [CrossRef]
  13. Chung, T.-F.; Yang, Y.-L.; Shiojiri, M.; Hsiao, C.-N.; Li, W.-C.; Tsao, C.-S.; Shi, Z.; Lin, J.; Yang, J.-R. An atomic scale structural investigation of nanometre-sized η precipitates in the 7050 aluminium alloy. Acta Mater. 2019, 174, 351–368. [Google Scholar] [CrossRef]
  14. Li, Q.; Qin, J.; Jiang, D.; Yi, D.; Wang, B. Precipitate coarsening and mechanical properties in 6082 aluminium alloy during long-term thermal exposure. J. Alloys Compd. 2022, 909, 164819. [Google Scholar] [CrossRef]
  15. Wang, K.; Zhang, C.; Meng, Z.; Cheng, Z.; Chen, L.; Zhao, G. Precipitation behavior and its effect on the dynamic recrystallization of a novel extruded Al-Cu-Li alloy. Mater. Des. 2022, 223, 111135. [Google Scholar] [CrossRef]
  16. Long, S.; Wu, D.-X.; Wang, S.-Y.; Jiang, Y.-P.; Xia, R.-Z.; Li, S.-S.; Zhou, Y.-T.; Peng, P.; Dai, Q.-W. An optimized constitutive model and microstructure characterization of a homogenized Al-Cu-Li alloy during hot deformation. J. Alloys Compd. 2022, 929, 167290. [Google Scholar] [CrossRef]
  17. Kassner, M.; Barrabes, S. New developments in geometric dynamic recrystallization. Mater. Sci. Eng. A 2005, 410–411, 152–155. [Google Scholar] [CrossRef]
  18. Wang, X.; Pan, Q.; Xiong, S.; Liu, L. Prediction on hot deformation behavior of spray formed ultra-high strength aluminum alloy—A comparative study using constitutive models. J. Alloys Compd. 2018, 735, 1931–1942. [Google Scholar] [CrossRef]
  19. Yan, J.; Pan, Q.; Li, B.; Huang, Z.; Liu, Z.; Yin, Z. Research on the hot deformation behavior of Al–6.2Zn–0.70Mg–0.3Mn–0.17Zr alloy using processing map. J. Alloys Compd. 2015, 632, 549–557. [Google Scholar] [CrossRef]
  20. Tang, J.; Wang, J.; Teng, J.; Wang, G.; Fu, D.; Zhang, H.; Jiang, F. Effect of Zn content on the dynamic softening of Al–Zn–Mg–Cu alloys during hot compression deformation. Vacuum 2021, 184, 109941. [Google Scholar] [CrossRef]
  21. Sun, Y.; Pan, Q.; Huang, Z.; Wang, W.; Wang, X.; Li, M.; Lai, J. Evolutions of diffusion activation energy and Zener–Hollomon parameter of ultra-high strength Al-Zn-Mg-Cu-Zr alloy during hot compression. Prog. Nat. Sci. 2018, 28, 635–646. [Google Scholar] [CrossRef]
  22. Ding, W.; Liu, X.; Zhao, X.; Chen, T.; Zhang, H.; Cheng, Y.; Shi, H. Hot Deformation Behavior and Microstructure Evolution of 6063 Aluminum Alloy Modified by Rare Earth Y and Al-Ti-B Master Alloy. Materials 2020, 13, 4244. [Google Scholar] [CrossRef] [PubMed]
  23. Zhang, Y.; Jiang, J.; Wang, Y.; Liu, Y.; Huang, M. Hot deformation behavior and microstructure evolution of hot-extruded 6A02 aluminum alloy. Mater. Charact. 2022, 188, 111908. [Google Scholar] [CrossRef]
  24. Wang, Q.; He, X.; Deng, Y.; Zhao, J.; Guo, X. Experimental study of grain structures evolution and constitutive model of isothermal deformed 2A14 aluminum alloy. J. Mater. Res. Technol. 2021, 12, 2348–2367. [Google Scholar] [CrossRef]
  25. Sellars, C.; McTegart, W. On the mechanism of hot deformation. Acta Met. 1966, 14, 1136–1138. [Google Scholar] [CrossRef]
  26. Lei, C.; Wang, Q.; Tang, H.; Liu, T.; Li, Z.; Jiang, H.; Wang, K.; Ebrahimi, M.; Ding, W. Hot deformation constitutive model and processing maps of homogenized Al–5Mg–3Zn–1Cu alloy. J. Mater. Res. Technol. 2021, 14, 324–339. [Google Scholar] [CrossRef]
  27. Khomutov, M.G.; Pozdniakov, A.V.; Churyumov, A.Y.; Barkov, R.Y.; Solonin, A.N.; Glavatskikh, M.V. Flow Stress Modelling and 3D Processing Maps of Al4.5Zn4.5Mg1Cu0.12Zr Alloy with Different Scandium Contents. Appl. Sci. 2021, 11, 4587. [Google Scholar] [CrossRef]
  28. Hu, H.; Zhen, L.; Yang, L.; Shao, W.; Zhang, B. Deformation behavior and microstructure evolution of 7050 aluminum alloy during high temperature deformation. Mater. Sci. Eng. A 2008, 488, 64–71. [Google Scholar] [CrossRef]
  29. Xu, C.; Huang, J.; Jiang, F.; Jiang, Y. Dynamic recrystallization and precipitation behavior of a novel Sc, Zr alloyed Al-Zn-Mg-Cu alloy during hot deformation. Mater. Charact. 2022, 183, 111629. [Google Scholar] [CrossRef]
  30. Zhao, X.; Zhang, Q.; Yang, X.; Chu, Z.; Li, Y.; Qin, F. Flow Behavior and Microstructure Characterization of 7085 Aluminum Alloy Under Various Deformation Conditions. Met. Mater. Trans. A 2021, 52, 4865–4876. [Google Scholar] [CrossRef]
  31. Zhang, J.; Yi, Y.; Huang, S.; Mao, X.; He, H.; Tang, J.; Guo, W.; Dong, F. Dynamic recrystallization mechanisms of 2195 aluminum alloy during medium/high temperature compression deformation. Mater. Sci. Eng. A 2021, 804, 140650. [Google Scholar] [CrossRef]
  32. Zhang, M.; Li, C.; Zhang, Y.; Liu, S.; Jiang, J.; Tang, J.; Ye, L.; Zhang, X. Effect of hot deformation on microstructure and quenching-induced precipitation behavior of Al-Zn-Mg-Cu alloy. Mater. Charact. 2021, 172, 110861. [Google Scholar] [CrossRef]
  33. Huang, K.; Logé, R. A review of dynamic recrystallization phenomena in metallic materials. Mater. Des. 2016, 111, 548–574. [Google Scholar] [CrossRef]
  34. Wang, M.; Sun, C.; Fu, M.; Liu, Z.; Qian, L. Study on the dynamic recrystallization mechanisms of Inconel 740 superalloy during hot deformation. J. Alloys Compd. 2020, 820, 153325. [Google Scholar] [CrossRef]
  35. Yaghoobi, M.; Voyiadjis, G.Z. The effects of temperature and strain rate in fcc and bcc metals during extreme deformation rates. Acta Mater. 2018, 151, 1–10. [Google Scholar] [CrossRef]
  36. Hunter, A.; Preston, D.L. Analytic model of dislocation density evolution in fcc polycrystals accounting for dislocation generation, storage, and dynamic recovery mechanisms. Int. J. Plast. 2022, 151, 103178. [Google Scholar] [CrossRef]
  37. Hutchinson, C.; de Geuser, F.; Chen, Y.; Deschamps, A. Quantitative measurements of dynamic precipitation during fatigue of an Al–Zn–Mg–(Cu) alloy using small-angle X-ray scattering. Acta Mater. 2014, 74, 96–109. [Google Scholar] [CrossRef]
  38. Wang, S.-S.; Jiang, J.-T.; Fan, G.-H.; Panindre, A.; Frankel, G.; Zhen, L. Accelerated precipitation and growth of phases in an Al-Zn-Mg-Cu alloy processed by surface abrasion. Acta Mater. 2017, 131, 233–245. [Google Scholar] [CrossRef]
  39. Santos-Güemes, R.; Bellón, B.; Esteban-Manzanares, G.; Segurado, J.; Capolungo, L.; Llorca, J. Multiscale modelling of precipitation hardening in Al–Cu alloys: Dislocation dynamics simulations and experimental validation. Acta Mater. 2020, 188, 475–485. [Google Scholar] [CrossRef]
  40. Robson, J. A new model for prediction of dispersoid precipitation in aluminium alloys containing zirconium and scandium. Acta Mater. 2004, 52, 1409–1421. [Google Scholar] [CrossRef]
  41. Shi, C.; Chen, X.-G. Effect of Zr addition on hot deformation behavior and microstructural evolution of AA7150 aluminum alloy. Mater. Sci. Eng. A 2014, 596, 183–193. [Google Scholar] [CrossRef]
Figure 1. Schematic diagram of hot compression experiment of Al-Zn-Mg-Cu alloy.
Metals 14 00449 g001
Figure 2. Sampling method and location of microscopic characterization.
Metals 14 00449 g002
Figure 3. Stress–strain curves of AlZn5.5Mg2.56Cu1.26 alloy at different temperatures: (a) 0.01 s−1, (b) 0.1 s−1, (c) 1 s−1.
Metals 14 00449 g003
Figure 4. Fitting between different parameters: (a) lnσp − ln ε ˙ , (b) σp − ln ε ˙ , (c)   ln [ sinh ( α σ ) ]   − ln ε ˙ , (d)   ln [ sinh ( α σ ) ]   − 1/T.
Metals 14 00449 g004
Figure 5. Different lnZ values at different temperatures and strain rates.
Metals 14 00449 g005
Figure 6. Microstructure of as-cast AlZn5.5Mg2.56Cu1.26 alloy: (a) 200×, (b) 500×.
Metals 14 00449 g006
Figure 7. Microstructure of AlZn5.5Mg2.56Cu1.26 after homogenization: (a) OM, (b) EBSD.
Metals 14 00449 g007
Figure 8. IPF diagram of different thermal deformation parameters: (a) lnZ = 21.11 (450 °C 1 s−1), (b) lnZ = 19.89 (350 °C 0.01 s−1), (c) lnZ = 18.07 (400 °C 0.01 s−1), (d) lnZ = 16.50 (450 °C 0.01 s−1).
Metals 14 00449 g008
Figure 9. Recrystallization distribution under different thermal deformation parameters: (a) lnZ = 21.11, (b) lnZ = 19.89, (c) lnZ = 18.07, (d) lnZ = 16.50.
Metals 14 00449 g009
Figure 10. Distribution of orientation difference under different Z parameters: (a) lnZ = 21.11, (b) lnZ = 19.89, (c) lnZ = 18.07, (d) lnZ = 16.50.
Metals 14 00449 g010
Figure 11. Distribution of cumulative orientation difference through grain boundary along black lines with arrow in Figure 7: (a) lnZ = 21.11, (b) lnZ = 19.89, (c) lnZ = 18.07, (d) lnZ = 16.50.
Metals 14 00449 g011
Figure 12. GB diagram and GND density diagram under different Z parameters. (a,c) GB diagram when lnZ = 19.89; (d) GB diagram when lnZ = 16.50; (eg) GB diagram when lnZ = 18.07; (b,h) GND maps for lnZ = 19.89 and lnZ = 18.07.
Metals 14 00449 g012
Figure 13. Schematic diagram of DRX mechanism: (a) DDRX; (b,c) CDRX.
Metals 14 00449 g013
Figure 14. Dislocation structure under different parameters. (a) lnZ = 21.11; (b) lnZ = 19.89; (c) lnZ = 18.07; (d) lnZ = 16.50.
Metals 14 00449 g014
Figure 15. Morphology of precipitated phase under different parameters. (a) lnZ = 21.11; (b) lnZ = 19.89; (c) lnZ = 18.07; (d) lnZ = 16.50.
Metals 14 00449 g015
Figure 16. Precipitation phase and dislocation morphology of alloy: (a) lnZ = 19.89; (b) lnZ = 18.07.
Metals 14 00449 g016
Table 1. Subject chemical compositions of the employed Al-Zn-Mg-Cu alloys (wt.%).
SiFeCuMgCrZnTiZrAl
0.0780.1301.622.560.235.500.100.033Bal.
Disclaimer/Publisher’s Note: The statements, opinions and data contained in all publications are solely those of the individual author(s) and contributor(s) and not of MDPI and/or the editor(s). MDPI and/or the editor(s) disclaim responsibility for any injury to people or property resulting from any ideas, methods, instructions or products referred to in the content.

