Article

Tribological Study of Fe–Cr Alloys for Mechanical Refinement in a Corn Stover Biomass Environment

1
Department of Mechanical Engineering, University of Alabama, Tuscaloosa, AL 35487, USA
2
Department of Metallurgical Engineering, University of Alabama, Tuscaloosa, AL 35487, USA
3
Department of Mechanical Engineering, George Mason University, Fairfax, VA 22030, USA
*
Authors to whom correspondence should be addressed.
Metals 2024, 14(4), 448; https://doi.org/10.3390/met14040448
Submission received: 28 February 2024 / Revised: 28 March 2024 / Accepted: 2 April 2024 / Published: 11 April 2024

Abstract

:
The tribological behavior of three Fe–Cr alloys with Cr contents ranging from ~12 to 16 wt.% as well as low-alloy high-carbon 52100 steel were investigated using pin-on-disk wear testing. Wear tests were performed in both open atmospheric (dry) and biomass environments (wet). Delamination and abrasion were observed to be the dominant wear regimes following dry wear tests. For wet testing, adhesion and pitting corrosion were determined to be the primary wear mechanisms in the Fe–Cr alloys while adhesion and delamination/cracking were identified as the primary wear mechanisms in the 52100 steel. The 440C stainless steel and 52100 steel specimens exhibited the lowest wear volume following dry (7.58 ± 0.52 mm3 and 0.78 ± 0.05 mm3, respectively) and wet wear testing (0.11 ± 0.06 mm3 and 0.12 ± 0.09 mm3, respectively); however, these specimens exhibited the most significant corrosion damage. The 410 stainless steel specimen exhibited the best resistance to corrosion after wear testing in the deacetylated and disc-refined corn stover slurry and had measured wear volumes after dry and wet wear testing of 6.84 ± 0.88 mm3 and 0.33 ± 0.12 mm3, respectively. The worst wear resistance was observed by the 420 stainless steel specimen after both dry and wet wear testing.

1. Introduction

Lignocellulosic biomass (LB), which consists of the primary structural components of plants, is one of the most abundant renewable resources on Earth [1,2]. LB materials such as wood, corn stover, rice straw, wheat straw, and switchgrass—primarily composed of three different kinds of polymers (cellulose, hemicellulose, and lignin)—are of particular interest as a suitable alternative to fossil fuels in the production of second-generation biofuels [3,4]. Of these lignocellulose feedstocks, corn stover which consists of the cobs, leaves, and stalks of corn [5], is among the most widely available crop worldwide with an annual production of approximately 250 million tons in the United States alone [6,7]. Various types of pretreatment techniques have been studied with the goal of improving the digestibility of these polymers to make the cellulose more accessible in LBs for more efficient conversion into soluble sugars. The implementation of mechanical pretreatment techniques has gained popularity in recent years [8,9,10,11] due to the reductions in energy consumption and the increased benefits that these techniques provide in breaking up the structural components of LBs. The main advantages that mechanical pretreatment techniques provide are the ability to alter the properties of the lignocellulose through cutting, shearing, and compression, which make enzymes more accessible for hydrolysis conversion [12].
Deacetylation and mechanical refining pretreatment (DMR) is one of the treatment processes which incorporates two mechanical refinement steps, including disk refining and Szego milling [10,11,13,14]. Researchers at the National Renewable Energy Laboratory (NREL, Golden, CO, USA) have shown that the inclusion of this technique within the pretreatment cycle has improved sugar yields and concentrations from LBs including corn stover, switchgrass, sorghum, and blends of these LBs [9,10,15]. While disk refining and Szego milling have shown significant promise for inclusion within the pretreatment process of LB materials, further research into the materials and design of such mechanical refinement equipment is still needed to ensure mechanical durability and reliability. The Szego mill developed by researchers at the University of Toronto [16,17] is a planetary ring-roller mill which utilizes mechanical forces to break up the structural components of LBs for improved enzymatic hydrolysis. Previously, the lab-scale version of the Szego mill, namely the Szego mill 160 (SM 160) has been utilized [12,15], which includes three helically grooved rollers which rotate about a center drive shaft within a large cylindrical shell.
During Szego milling, biomass is fed through the top of the mill, ground and crushed between grooves in the helical rollers and against the outer cylindrical shell. During mechanical milling, chemical and physical interactions between the materials and the biomass take place. Corn stover and other LBs, which contain inorganic particles, especially SiO2 and Al2O3, can cause significant wear to internal components within the mill [18,19]. Due to the destructive nature of this process, materials with good wear and corrosion resistance are necessary to maintain reliability, predictability, and stability during milling. Previous work performed by NREL and others has shown that materials previously used in the design of the mill began experiencing significant wear and corrosion damage after the first duty cycle [15]. This accelerated surface damage of internal components not only lowers the reliability and stability of the mill, reducing its operational lifetime, but can also result in material loss contaminating the refined biomass product.
The materials being tested in this study include three commercially available Fe-Cr alloys with varying Cr and C content (410, 420, and 440C stainless steels as well as 52100 low-alloy high-carbon steel which has been previously used in the design of the helical rollers and the outer shell of the first-generation lab-scale SM 160. Fe-Cr alloys were selected for testing due to their good wear resistance, moderate corrosion resistance, good weldability, and high hardenability [20,21,22,23,24,25,26], as well as their commercial availability and economic feasibility [27]. The passive Cr-rich oxide films which form on Fe-Cr alloys when the free surface is exposed to an oxidizing environment reduces the reaction rate between the environment and the metal improving its corrosion resistance [28,29,30,31,32]. Fe-Cr alloys such as 410, 420, and 440C stainless steels are commonly used in many different applications where robust materials with good tribo-corrosion resistance are required, including nuclear, automotive, agricultural, biomedical, and petrochemical industries [33,34,35,36]. While 52100 steel does generally exhibit excellent wear resistance, high hardenability, and good dimensional stability, it is highly susceptible to corrosion due to the low concentrations of Cr [37,38] where, without the presence of water-resistant lubricants, corrosion has a big impact on the life of these components.
The wear characteristics of many different types of steels including 304, 316, 1018, 17–4 PH, 430, 445, Fe-Cr-Mo alloys, and Fe-Mn-Al alloys have been tested previously using pin-on-disk tests [39,40,41,42,43,44,45]. However, very few studies [46,47,48,49] have investigated the wear and tribological properties of the steels studied here, specifically in their annealed state. Additionally, although the wear characteristics of these steels have been investigated in some corrosive environments [50,51,52,53,54] with promising results, there is currently no literature relating to the wear properties of the steels being investigated here in biomass environments. In one study by Khare et al. [50], the wear behavior of tempered 13Cr martensitic stainless steel was investigated in nitric acid sliding conditions using ball on plate (pin-on-disk) tests. This steel has a comparable chemical composition to the 410 and 420 stainless steels tested here with the exception of a higher C content. In Khare et al.’s work, the combined effects of corrosion and wear were selectively studied by systematically investigating the wear characteristics of 13Cr stainless steel after immersion in a corrosive environment followed by dry wear testing, in a corrosive environment during wear testing, and being immersed in a corrosive environment followed by wear tests in the same corrosive environment. This allowed the authors to determine the contribution of chemical and mechanical effects on the wear characteristics of 13Cr stainless steel. Results showed that the specimen which was exposed to the 5% nitric acid prior to dry testing exhibited a higher wear rate than the reference specimen which was tested in a dry condition. This was attributed to pitting corrosion resulting from the chlorine (Cl) in the nitric acid solution which caused regions of high stress concentrations where intergranular cracks were generated beneath the wear surface. This highlighted the promotion of pitting corrosion in stainless steels which has been reported to be caused primarily by the existence of chloride ions (Cl) [55,56,57]. In another study by Venske et al. [52], the effects of biodiesel and diesel–biodiesel blends, derived from methanol, sodium hydroxide, and soybean oil, on the sliding wear behavior of 440B stainless steel was investigated in both annealed and heat-treated conditions. The 440B stainless steel used here is almost identical to 440C stainless steel; however, it has a lower C content approximately 0.75–0.95 wt.%. The results from this study were compared with previous work by this group on SAE 52100 and 1045 steel [58]. Results indicated that the annealed 440B stainless steel exhibited a similar trend, but reduced wear resistance to the SAE 52100 steel at low concentrations of biodiesel blends (7–50 vol.%); however, in the pure biodiesel the 440B stainless steel exhibited much poorer wear resistance than the SAE 52100 steel even though it had a higher hardness (20 HRC compared to 13 HRC). The decreased wear resistance of the 440B stainless steel was attributed to the larger carbides which were observed in the metal matrix. This was also likely attributed to the increased corrosion rate of the 440B stainless steel in the biodiesel environments due to the existence of chloride ions in the biodiesel fuels which can generate pitting [56,57]. A similar study on the influence of the oil–water ratio in drilling fluid on the wear of Cr13 stainless steel was also conducted by Mao et al. [51]. Here the authors investigated the primary wear mechanisms that dominated during pin-on-disk tribometer tests in drilling fluids with oil–water ratios from 0 to 5. Results indicated that at oil–water ratios of 0–2 the primary wear mechanism was abrasion, while at higher oil–water ratios of 3–5 the dominating wear mechanism was corrosive wear. The studies above highlight issues related to corrosion of Fe-Cr alloys, but they also indicate that in corrosive environments with lower concentrations of chlorine, Fe-Cr alloys exhibit very promising wear characteristics due to their high hardenability, good wear resistance, and moderate corrosion resistance.
The purpose of the current study is to investigate the influence of corn stover on the tribological behavior of four different steels using pin-on-disk wear testing to generate base tribological data and assist in proper material selection for the next generation pilot-scale Szego mills, namely the SM 280 and the SM 320X. While few studies have investigated the wear characteristics of similar steels in corrosive environments, to this date, there have been no published studies on the wear characteristics of Fe-Cr alloys or 52100 steel in a biomass environment. Both quantitative and qualitative techniques such as scanning electron microscopy (SEM), optical microscopy, profilometry, microindentation, and tribo-testing have been utilized to investigate the wear characteristics of the selected materials to determine the primary wear mechanisms exhibited during wear testing in both atmospheric and biomass environments. These results include the first of many that will be used to aid in the design and development of future-generation Szego mills (SM 280 and SM 320X) and similar biomass refinement equipment for enhanced mechanical reliability and processing of lignocellulosic biomasses for ethanol and advanced biofuel production.

2. Experimental Procedure

2.1. Materials Preparation and Characterization

All four types of steels studied here were fabricated and received in the form of ~50 mm (2”) diameter cylindrical rods. The 410, 420, and 440C stainless steel rods were fabricated according to ASTM A276 standard [59] specification for stainless steel bars in their fully annealed condition (Condition A—typically heated to 830–900 °C and then furnace cooled to ~600 °C and subsequently air cooled to room temperature), while the 52100 steel rod was fabricated according to ASTM A108 standard [60] specification for steel bars in its fully annealed condition (typically heated to ~775 °C and then furnace cooled to ~650 °C and subsequently air cooled to room temperature). The chemical compositions of the materials obtained from material certificates from McMaster Carr are listed in Table 1. Steels were tested in their annealed conditions since these materials will later be used to manufacture complex parts, such as helical rollers, which require close tolerances that can be distorted during high temperature quenching. Specimens with a thickness of ~6.6 mm (0.26″) were cut from the ~50 mm diameter rods using electric discharge machining (EDM). After EDM, specimens were then machined to include a countersunk hole in the center of the specimens and a pin hole offset from center to ensure proper constraint during wear testing. They were then ground using 240–4000 grit SiC grinding pads, polished with 9, 3, and 1 µm polishing pads, and then polished using 0.05 µm colloidal silica with a METPREP 3 PH-3 grinding/polisher system (Allied High-Tech Products Inc., Compton, CA, USA) to obtain a surface roughness (Rq) in the range of 2 µm.
Separate samples were cut from the steel rods using EDM to dimensions of approximately 10 mm × 10 mm × 10 mm for the purpose of SEM imaging. The microstructural analyses of the as-received, annealed steels were performed using an Apreo 2 scanning electron microscope (Thermo Scientific, Waltham, MA, USA). Prior to SEM imaging specimens, were etched with Alder’s etchant (HCl, (NH4)2CuCl4·2H2O, FeCl3, H2O) for ~2–5 s after they had been polished. Microhardness testing was also employed to measure the hardness of each of the steels. Cut steel samples were mounted in a conductive resin, ground, and polished following the same process as the specimens which were prepared for wear testing. A total of 16 indents were performed on each of the steel samples using an automated CLEMEX MMT-X7B microhardness tester (Clemex, Montreal, QC, Canada) with a load of 300 gf (~3 N), a dwell time of 10 s, and a 150 µm spacing between indents. The average Vickers microhardness of the annealed steels are illustrated in Figure 1.

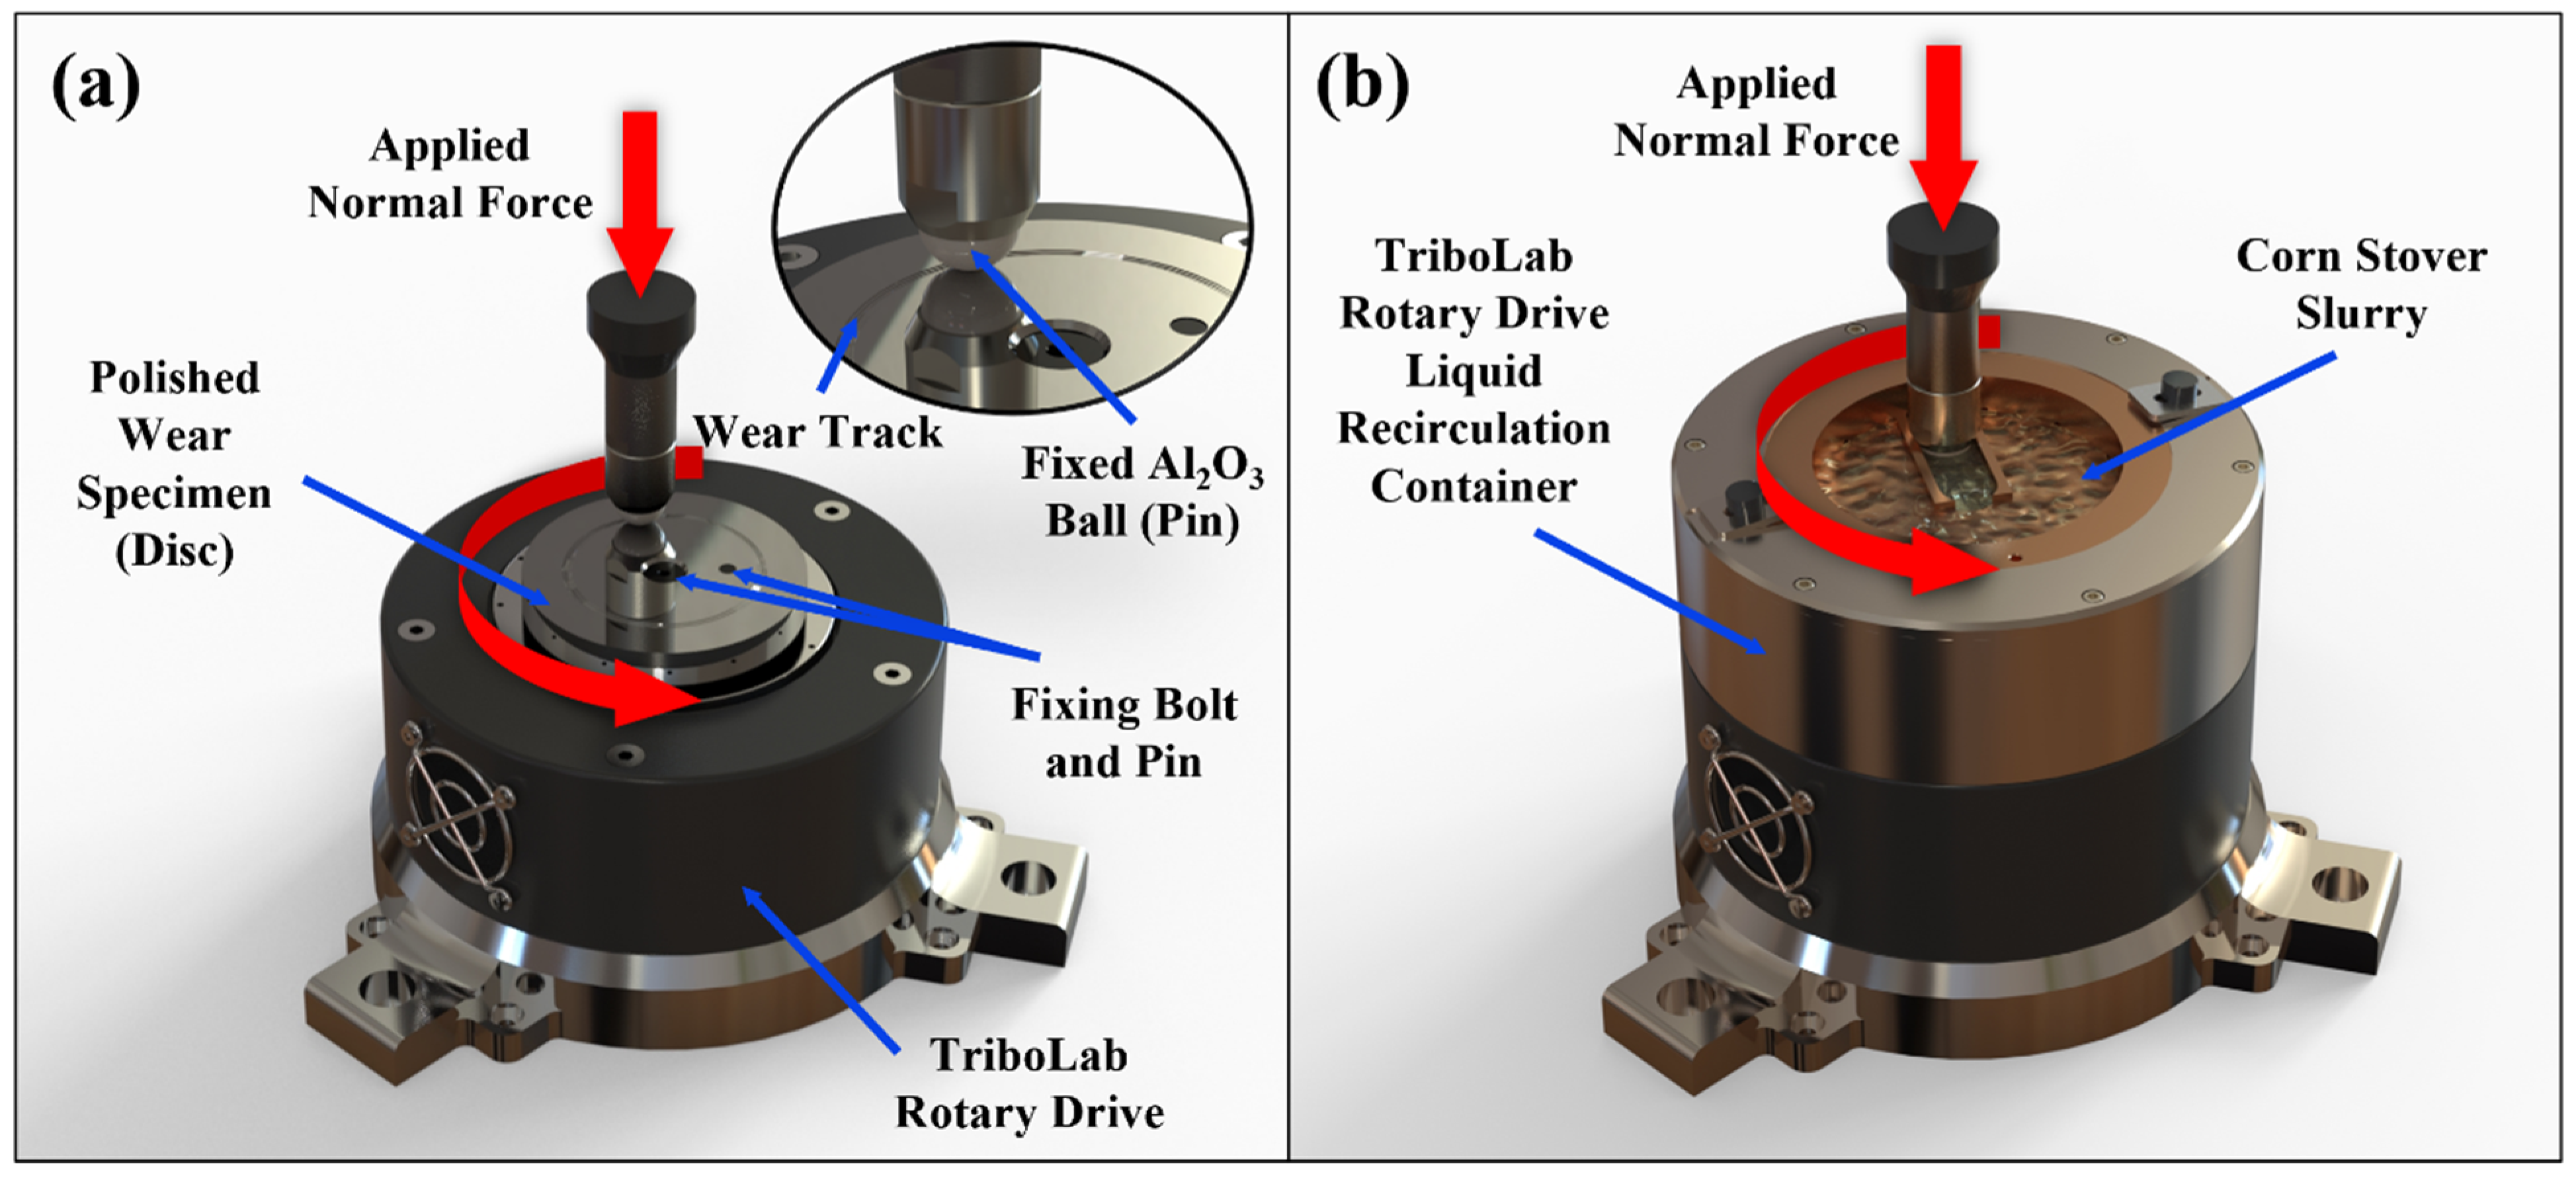
2.2. Tribological Testing

Friction and wear tests were performed according to the ASTM G99-17 standard [61] on a UMT-TriboLab (Bruker, Billerica, MA, USA) outfitted with a DFH-200-G high-load transducer (maximum load of 2000 N). All tests were performed in an open atmosphere at room temperature. A fixed hard (~75 HRC) Al2O3 ball (pin) with a diameter of ~9.5 mm (3/8 inch) was applied orthogonally to specimens during testing at an applied load of 50 N for a duration of 2700 s and a linear speed of 0.1 m/s for each wear test. The Al2O3 pin (counterbody) acted as the control variable and was used to accelerate wear by testing the steels in a more aggressive environment. This also allowed for direct comparisons to be drawn between the wear characteristics exhibited by each of the steels. The loading and sliding speed were chosen to simulate the lubrication conditions of the SM 280. The lubrication regime of the SM 280 is boundary to mix-lubrication, while the pin-on-disk tests exhibit boundary lubrication and represent the extreme case of the SM 280 to accelerate wear. Two different testing configurations depicted in Figure 2a,b were used for pin-on-disk wear tests. The test configuration in Figure 2a was used for dry testing in the open environment without a lubricating media, while the test configuration in Figure 2b was used for wet testing in the corn stover slurry. To ensure the repeatability of the tests, a total of 2–3 wear tests were performed on the surface of each specimen.
The corn stover used in this study was harvested by Idaho National Laboratory (INL) and then supplied to NREL. Upon receipt at NREL, the corn stover was deacetylated and disk refined (DDR) and then dewatered. Prior to testing, the dewatered DDR corn stover was diluted with deionized (DI) water to achieve a 4% total solid concentration (4 g of corn stover in 96 mL of DI water). The pH of the mixture was measured with a benchtop pH meter (Orion Versa Star Pro, Thermo Scientific) to be 3.83 pH, which is consistent with the previous literature [62]. A 4% solid concentration was selected here since this concentration has been previously tested in the lab-scale SM 160 by researchers at NREL and has proven to feed through the mill without clogging. The slurry was further refined in a generic blender for 1 min to improve the solubility of the corn stover in the DI water and to reduce the particle size to ensure reliable testing in the pin-on-disk apparatus. Finally, once the DDR corn stover was diluted with DI water and blended, the specimens were submerged in 10 mL of the slurry for each test in the liquid recirculation container for testing.
After the tests, the specimens were placed in an ultrasonic bath filled with isopropyl alcohol for 10 min and then blasted with nitrogen to remove any excess debris. Once specimens were cleaned and dried, a DektakXT profilometer (Bruker, Billerica, MA, USA) equipped with a 2 µm radius stylus tip, applied at a load of 0.01 mN (1 mg) was used to measure the wear profile of individual wear tracks at four different locations (90° apart). These four wear profiles were obtained immediately after wear testing and cleaning procedures. Using the measured profiles, cross-sectional areas ( A i ) of the wear track were calculated for the four locations. The average of four areas was then utilized along with the wear track circumference (Pappus–Guldinus theorem) to obtain the wear volume ( V ) from each test as specified in the ASTM G99-17 standard:
V = 2 π r 4 i = 1 N = 4 A i
where r is the radius of the wear track, and Ai is the cross-sectional area of the wear track measured at the ith location (N = four locations measured along the circumference of the wear tracks). Specimens were also examined metallographically after pin-on-disk wear testing with a scanning electron microscope as well as an optical microscope. Optical images were obtained using a KEYENCE VHX 7000 series optical microscope with a free angle VHX 7100 observation head (KEYENCE, Campbell, CA, USA) in the full coaxial lighting mode.

3. Results and Discussion

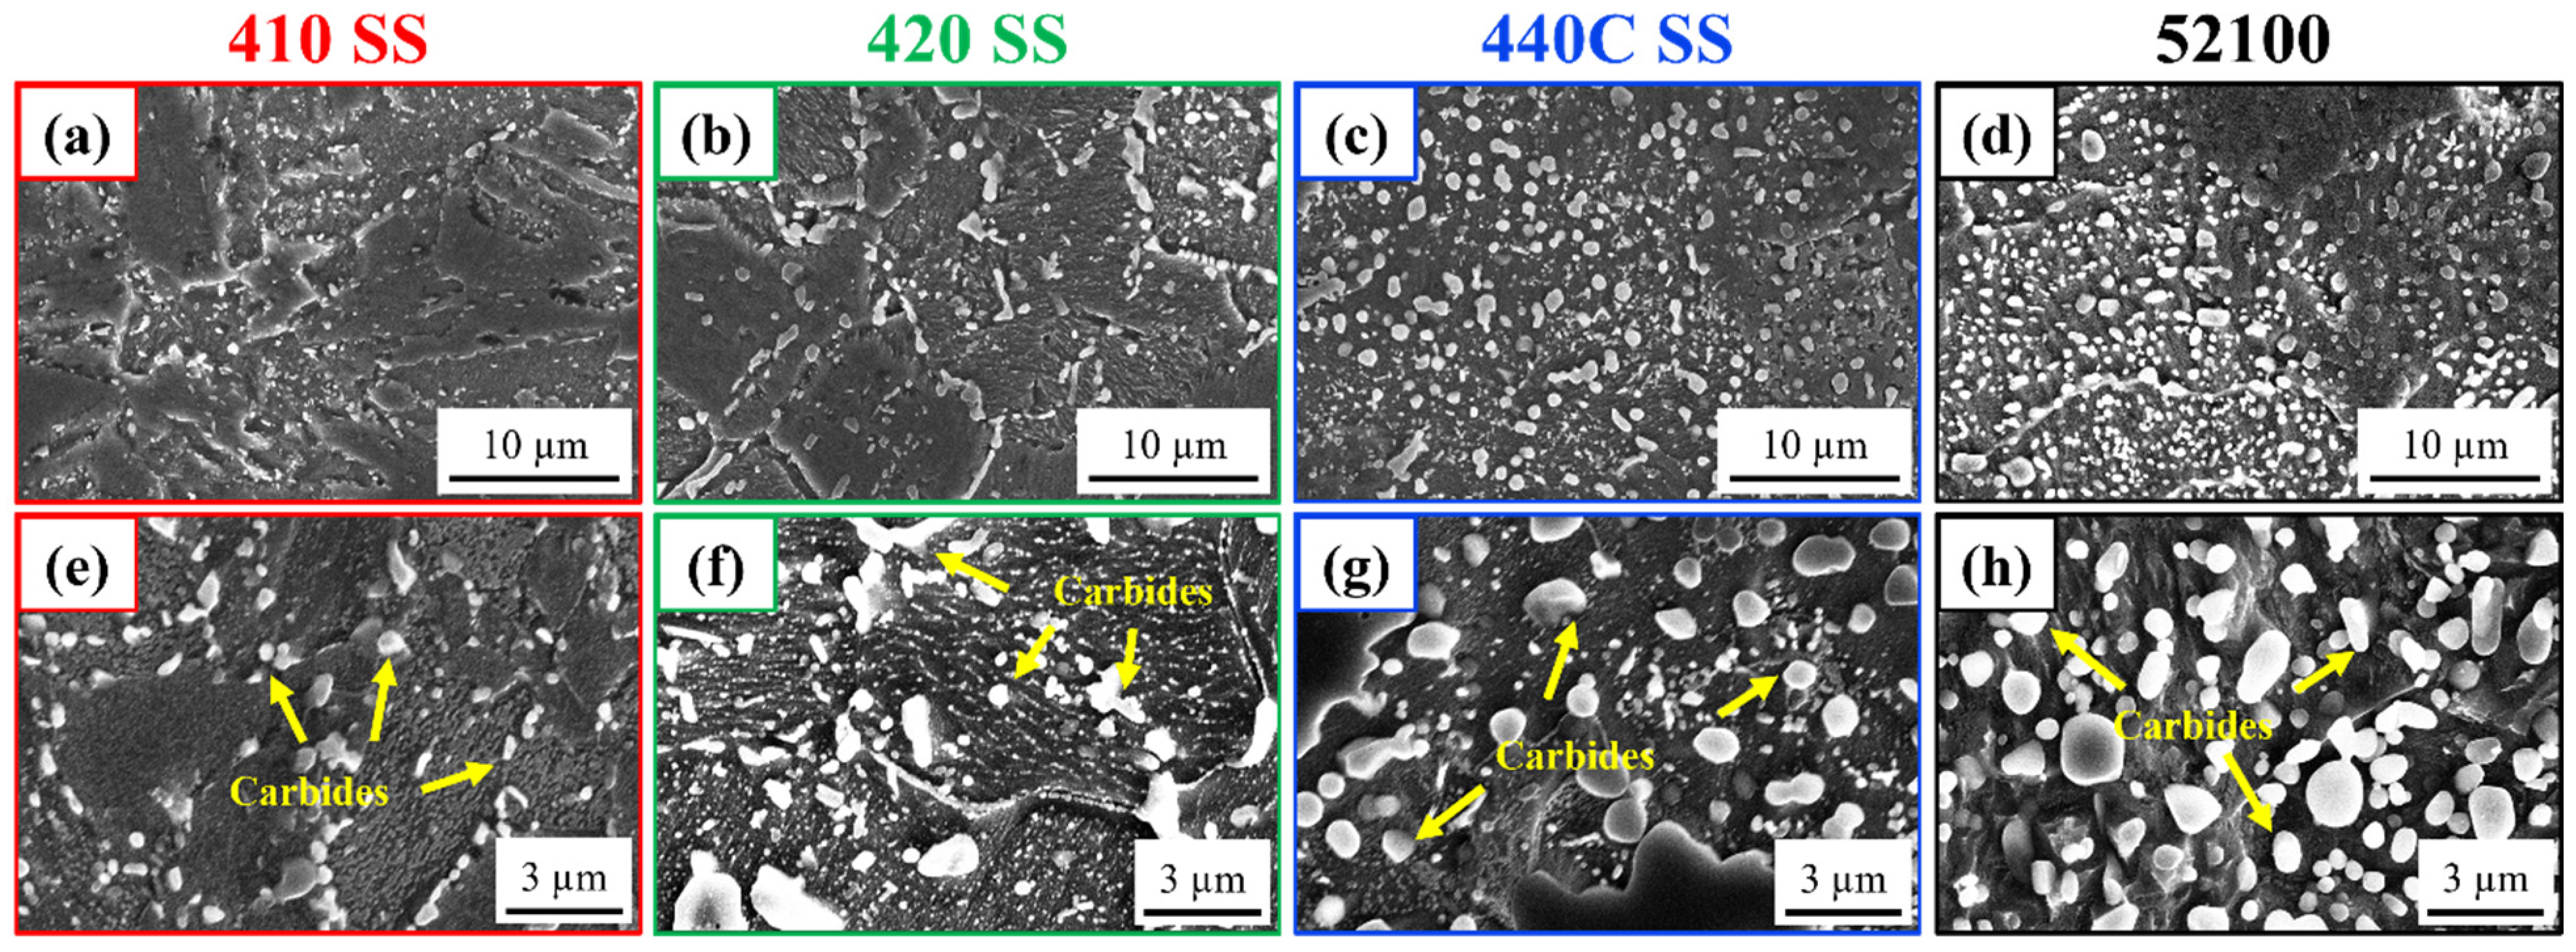
3.1. Microstructural Characterization

SEM micrographs of the microstructures of the annealed, as-received steels obtained using the secondary electron mode are presented in Figure 3a–h. The microstructures of the annealed steels appear to be primarily composed of the body-centered cubic (BCC) ferrite (α) phase and spheroidized carbides. Undissolved carbides within the ferrite matrix of the 410 and 420 stainless steels (Figure 3e,f) appear to grow preferentially along ferrite grain boundaries, while carbides in the 440C stainless steel and the 52100 steel microstructures (Figure 3g,h) are dispersed uniformly across the α matrix. Since the C has limited solubility in the BCC α phase, and since Cr has a higher affinity to C than Fe, many different carbides with crystal structures of M7C3 and M23C6 (M denoting a mixture of Fe and Cr) are formed in the Fe–Cr alloys. Such carbides have a very high hardness between 72 and 79 HRC (1600 and 1800 HV) [63,64] and contribute greatly to the mechanical properties of these alloys. The size and morphology of these carbides is largely dependent on annealing times. It has been shown by Godec et al. [65] that prolonged annealing times in high Cr steels can cause the further coarsening of carbides, and as these carbides grow and their neighboring distances decrease, carbides come into contact with one another to form single larger carbides. Additionally, it was found that at even longer annealing times, carbides migrated preferentially towards grain boundaries. These observations can be useful when investigating the size, morphology, and locations of the carbides within the metal matrix of the Fe–Cr alloys shown in Figure 3e–h). While the small concentrations of Cr (1.30–1.60 wt.%) in low-alloy high-carbon 52100 steel are not sufficient to form a passive oxide layer, Cr has a significant influence on the formation of spheroidal M3C carbides within the metal matrix [66,67]. These M3C carbides have a hardness between 64 and 68 HRC (910–1050 HV) [64], and while they are slightly softer than the M7C3 and M23C6 carbides that form in Fe–Cr alloys, they contribute greatly to the wear resistance of 52100 steel.
The smallest carbides, which can be seen in the 410 stainless steel microstructure (Figure 3e), appear to be largely spherical with little elongation, while carbides which are present in the 420 stainless steel (Figure 3f) not only appear to be larger than those present in the 410 stainless steel, but also appear to be elongated. This elongation is assumed to be due to neighboring carbides agglomerating during annealing [65]. A large amount of agglomeration of carbides can also be seen in the 420, 440C, and 52100 steels not only surrounding the α grains, but also within the α grains (Figure 3f–h), while little agglomeration of carbides is seen in the 410 stainless steel (Figure 3e). It should also be noted that carbides present with the matrix of the 440C stainless steel and the 52100 steel are much more uniformly distributed across the α matrix (Figure 3g,h). In some studies [68,69] it has been found that steels containing coarser carbides had a higher wear resistance than those with smaller carbides. However, in another study, it was found that steels which contained coarser carbides within the metal matrix led to increased wear [52]. During this process large carbides which have been previously removed from the matrix can remove more material by plowing during wear. The purpose of evaluating the microstructures of these steels is to better understand the influence that these carbides have on the wear characteristics of each of the selected steels.

3.2. Morphological Characterization

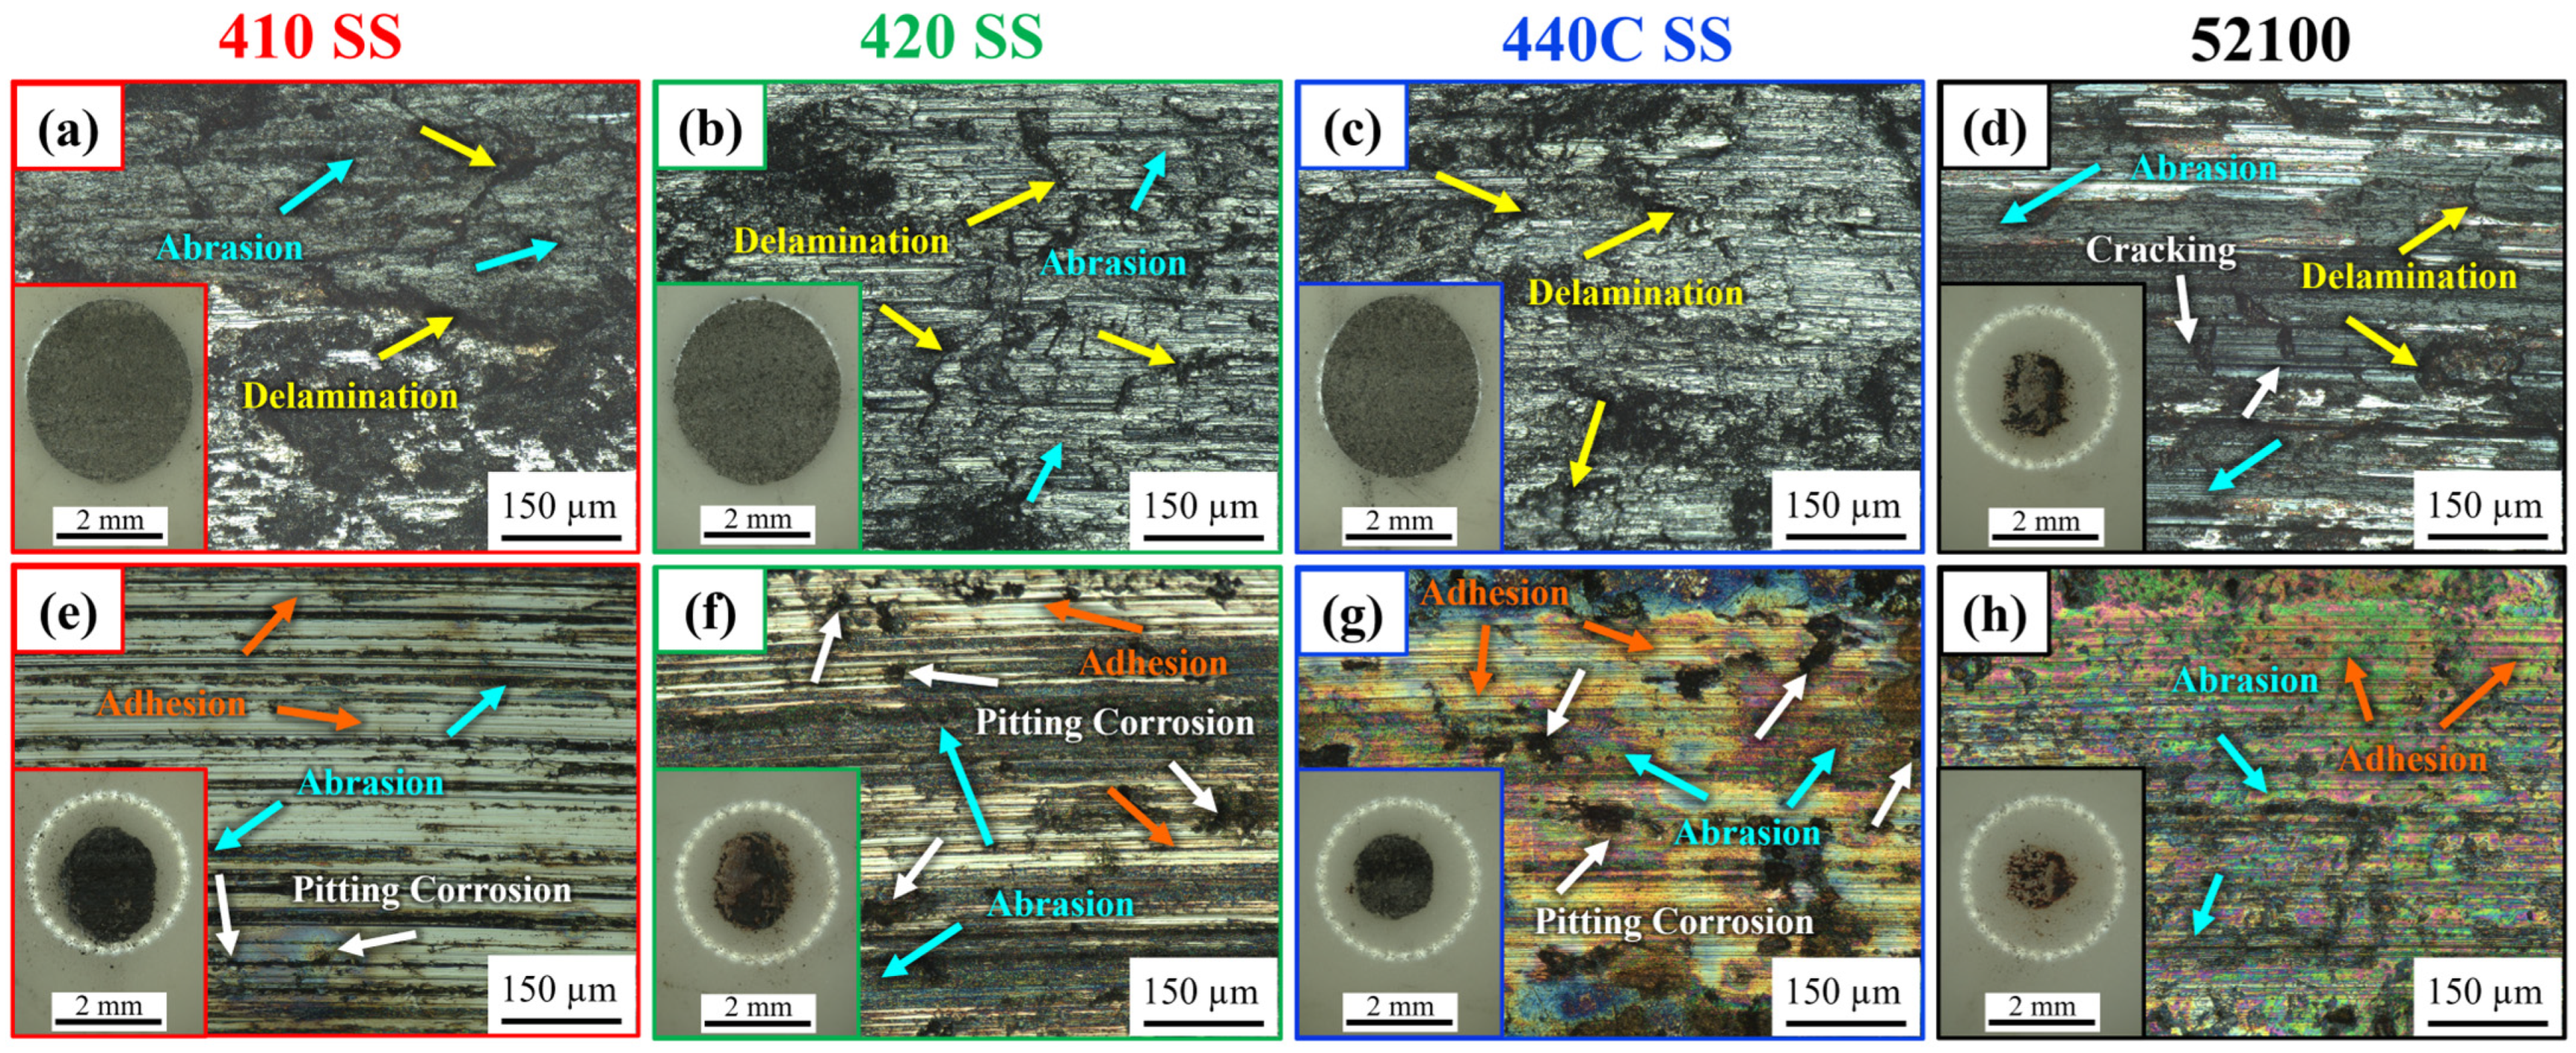
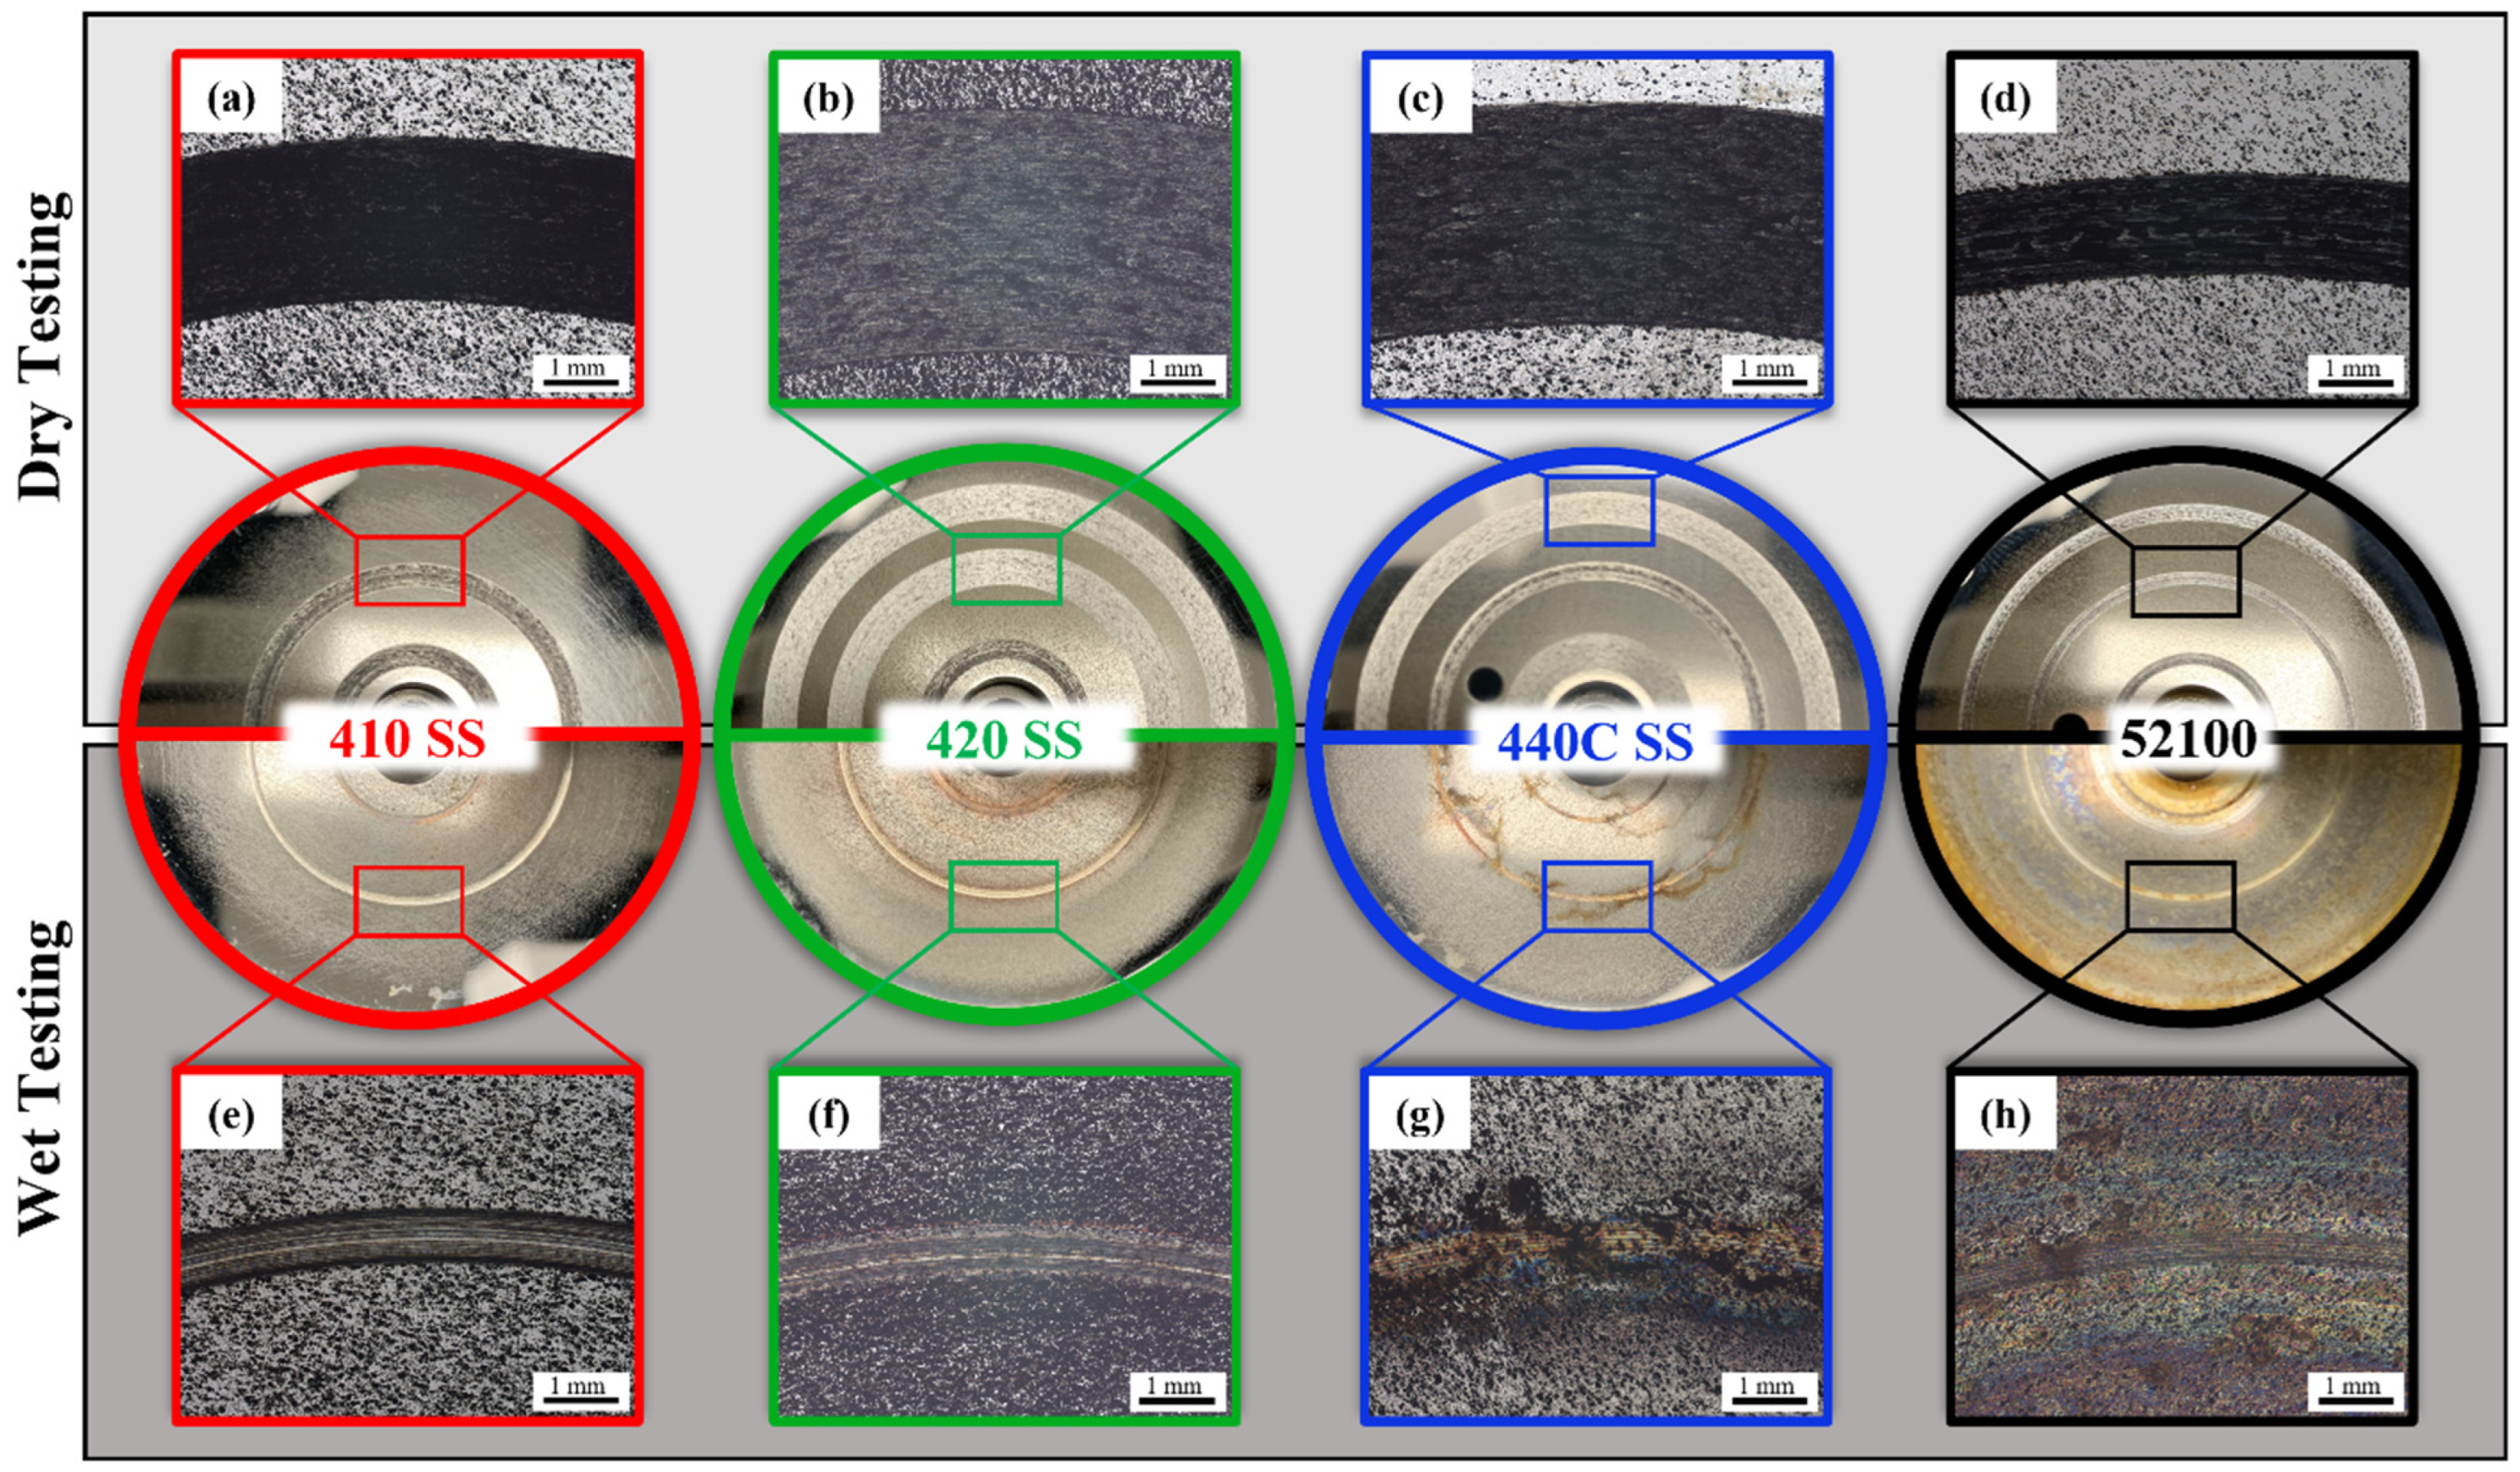
3.2.1. Optical Microscopy Analysis of Wear Tracks

Optical images of the specimens after wear testing are shown in Figure 4 with Figure 4a–d) corresponding to images of wear tracks after the dry testing, and Figure 4e–h) corresponding to images of wear tracks obtained after wet testing in the DDR corn stover slurry. Images in between Figure 4a–h show the ~50 mm (2″) diameter disks used in the pin-on-disk tests. Slight discoloration, which is indicative of rust that has been shown to consist of a mixture of Fe(III) oxides and hydroxides (Fe2O3, FeO(OH), and Fe(OH)3) [70], can be seen on and surrounding the wear tracks of the 420 stainless steel, 440C stainless steel, and 52100 steel specimens, while little-to-no discoloration of the wear track is observed on the 410 stainless steel specimen. Additionally, a significant amount of discoloration can be observed on the 52100 specimen which was tested in the wet mode. This prominent discoloration of the 52100 specimen has also been observed on components previously used in the lab-scale SM 160 after mechanical milling of the DDR corn stover.
As seen in Figure 4a–h, the width of wear tracks obtained in the dry condition are much wider than those obtained in the wet condition. This is expected since the DDR corn stover slurry acts as a lubricating media during testing which reduces solid-solid contact, reducing the coefficient of friction and the wear volume. A closer look at the wear tracks provides a better understanding of the wear mechanisms at play during wear testing and the influence of the DDR corn stover during wet testing. Higher magnification optical images of the wear tracks can be seen in Figure 5a–h. Due to the nature of the tests, two different types of surface damage processes will be evaluated in this study. These include mechanical wear processes such as abrasion, adhesion, and delamination as well as pitting corrosion, which is a chemical process common in Fe–Cr alloys in lubricating medias that contain Cl [57]. For the lubricated tests, the two mechanisms have, of course, synergic effects.
Here, for the dry wear testing, the abrasion and delamination processes seem to be the primary wear mechanisms. The abrasion primarily occurs due to severe plastic deformation of the steel when contacted with the much harder Al2O3 pin. This process is indicated by ploughing and cutting marks along with ridges and sharp edges. These sharp edges are usually formed by delaminated and severely deformed hard steel particles (debris) generated through the wear process [71]. Delamination occurs when layers of the material fracture from nucleated subsurface cracks due to the presence of high stress (and accumulated plastic deformation) (Figure 5a–d). During repetitive unidirectional loading, the unstable thin oxide layer which forms on the surface of the Fe–Cr alloys is delaminated causing direct contact between the metal and the Al2O3 pin. Further delamination of the exposed metal follows with continued loading, and as the pin continues to rotate around the specimen surface. Previously delaminated layers, which have not been ejected from the wear path, become compacted under repetitive loading. This process explains the apparent compaction of layers and sharp edges and ridges within the wear tracks which were exhibited during dry wear testing in all Fe–Cr alloys and 52100 steel (Figure 5a–d). These compacted layers can later delaminate and move to another location within the wear track or be ejected from the wear track entirely. The severity of delamination and abrasive wear will be explored further with the assistance of SEM (See Section 3.2.2) which provides better spatial resolution of the wear tracks. In addition to abrasion and delamination, adhesive wear is also present as secondary wear mechanism here. In fact, optical images included as insets in Figure 5a–d confirmed material transferred from the steel specimens to the pins.
Smooth grooves, which are indicative of adhesive wear, with little-to-no delamination present, appear within the wear tracks of specimens tested in the wet mode (Figure 5e–h). Adhesion between metals typically occurs when solid–solid contact occurs without the existence of an oxide layer [71]. It can be reasonably assumed that the DDR corn stover not only acted as a lubricant during pin-on-disk testing, reducing solid–solid contact and subsequently reducing plastic deformation and abrasion as well as the likelihood of delamination, but that the presence of the liquid may have also assisted in ejecting delaminated layers and debris so that they could not be compacted (reattached) under repetitive loading. As such, four different kinds of wear mechanisms appear to be dominant in specimens which were tested in the wet mode. Adhesive wear between the hard Al2O3 pin and the softer steels, which is indicated by smooth grooves within the wear tracks in the direction of sliding (Figure 5e–h), appears to be the primary wear mechanism in all steels tested in the wet mode. This was also verified by observing the Al2O3 pins under an optical microscope (see inset images in Figure 5e–h). In addition to adhesive wear, moderate abrasive wear—of lower intensity compared to dry testing—is also present. This is likely attributed to some loose debris that remained within the wear tracks as well as the direct contact between the pin and the disk. Two other primary wear mechanisms were also observed in the steel specimens tested in the DDR corn stover slurry. These include the chemical degradation process known as pitting corrosion and delamination/cracking which caused fragments of the material to be broken off from the solid surface. However, only one of these wear mechanisms, namely pitting corrosion, can be observed in the optical images of the Fe–Cr alloys (Figure 5e–g). The cracking and fragmentation which appeared to have caused the degradation of the 52100 steels surface (Figure 5h) will be investigated later with the use of the scanning electron microscope in Section 3.2.2.
Pitting corrosion is an electrochemical oxidation-reduction process which is primarily caused by local degradation of the passive oxide film on metals. During the stochastic process, ions disrupt the passive oxide film at locations where flaws are present and cause segregation of the metal matrix which results in localized pitting at the surface of the metal. Pit initiation not only reduces the strength of the material, but also creates areas with high stress concentrations on the surface of the metal where cracks can nucleate. Under repetitive unidirectional loading this can cause the material to fracture. The most common ions responsible for pitting in stainless steels are chlorides (Cl) or ions containing Cl [55,56]. Once these pits are initiated, anodic reactions occur inside the newly formed pit and electrons are transferred from the anode to the cathode where a cathodic reaction occurs. This causes the electrolyte within the pit to become positively charged which attracts the negatively charged chloride ions and increases the acidity within the pit, which further accelerates the process [72]. While the exact amount of Cl present in the DDR corn stover used in this study is unknown, it has been shown in a previous study by Lee et al. [19] that corn stover has a high concentration of Cl. To do this, Lee et al. obtained the EDS spectra of a clean Ti plate with and without corn stover and compared the spectra. Results showed that the Ti plate with corn stover had a Cl concentration of 5.37 wt.% as opposed to the cleaned Ti plate which contained only 0.07 wt.%. The presence of Cl in the DDR corn stover during tests likely accelerated pitting corrosion of the Fe–Cr alloys. However, it is important to note that these pits may not have only been generated by pitting corrosion, but by the combined effects of mechanical loading and corrosion (tribo-corrosion) which is typical during lubricated sliding wear with corrosive media. To systematically investigate the effects of pitting corrosion on the Fe–Cr alloys tested here, stand-alone immersion tests are required.
The most prominent pitting can be observed within the wear tracks of 420 and 440C stainless steels (Figure 5f and Figure 5g, respectively), with the largest pits and apparent discoloration present in the 440C stainless steel, while the least prominent pitting and discoloration can be seen in the 410 stainless steel (Figure 5e) with a few pits of small size present within the wear track. Comparing the size and distribution of these pits to those observed within the wear tracks of the other Fe–Cr alloys (420 and 440C stainless steels), it can be assumed that the 410 stainless steel had the most resilient passive oxide film of the Fe–Cr alloys. It has been experimentally shown by Steinsmo and Isaacs [73] that tendency for the repassivation of the oxide film increases with increasing Cr concentration in Fe–Cr alloys, meaning that the time required for the repassivation of the oxide film is increased with decreasing Cr content. As such, the results here appear to indicate that something more is contributing to the increased pitting in the Fe–Cr alloys with increasing Cr content. Since the repetitive unidirectional loading from the pin does not allow the Cr-rich oxide film to have enough time to repassivate [73], this is likely due to another phenomena. It is important to consider that Cr can form hard carbides in steels with crystal structures of M7C3 and M23C6 which have a very high hardness in the range of 72–79 HRC (1600–1800 HV) [63,64]. Since Cr has a higher affinity to C than Fe, higher concentrations of Cr can contribute to a greater number of these hard carbides within the metal matrix, and if the neighboring distances between these carbides decrease, they can agglomerate to form single larger carbides [65]. Comparing the microstructures of 420 and 440C stainless steels in Figure 3f,g, it can be observed that these stainless steels have larger carbides within their metal matrix than the 410 stainless steel (Figure 3e), with the coarsest and most uniformly distributed carbides present within the 440C stainless steel. Repetitive loading within the wear tracks of these specimens can cause these coarser carbides to dislodge from the metal matrix and form large cavities which can rupture the passive oxide films within the wear tracks. Energy dispersive spectroscopy (EDS) analysis showing the elemental distribution of material within the wear tracks of 420 stainless steel can be found in the Supplementary Information (SI) file. The existence of carbides within the wear track is confirmed by EDS analysis. Larger pits observed within the wear tracks of the 420 and 440C stainless steel specimens are likely a result of the above-mentioned larger cavities which accelerated the anodic reactions within the pits causing them to grow faster [54]. Similar observations have also been reported by Sun et al. [74,75] following pin-on-disc wear tests of stainless steels in corrosive environments. It has been observed that anodic dissolution and pit formation is accelerated by the sliding action during pin-on-disk tribo-corrosion tests. This can be reasonably assumed to be the mechanism responsible for the increased pitting observed in the higher Cr-content 420 and 440C stainless steels as opposed to the 410 stainless steel specimen following wet wear testing (Compare Figure 4f,g to Figure 4e).

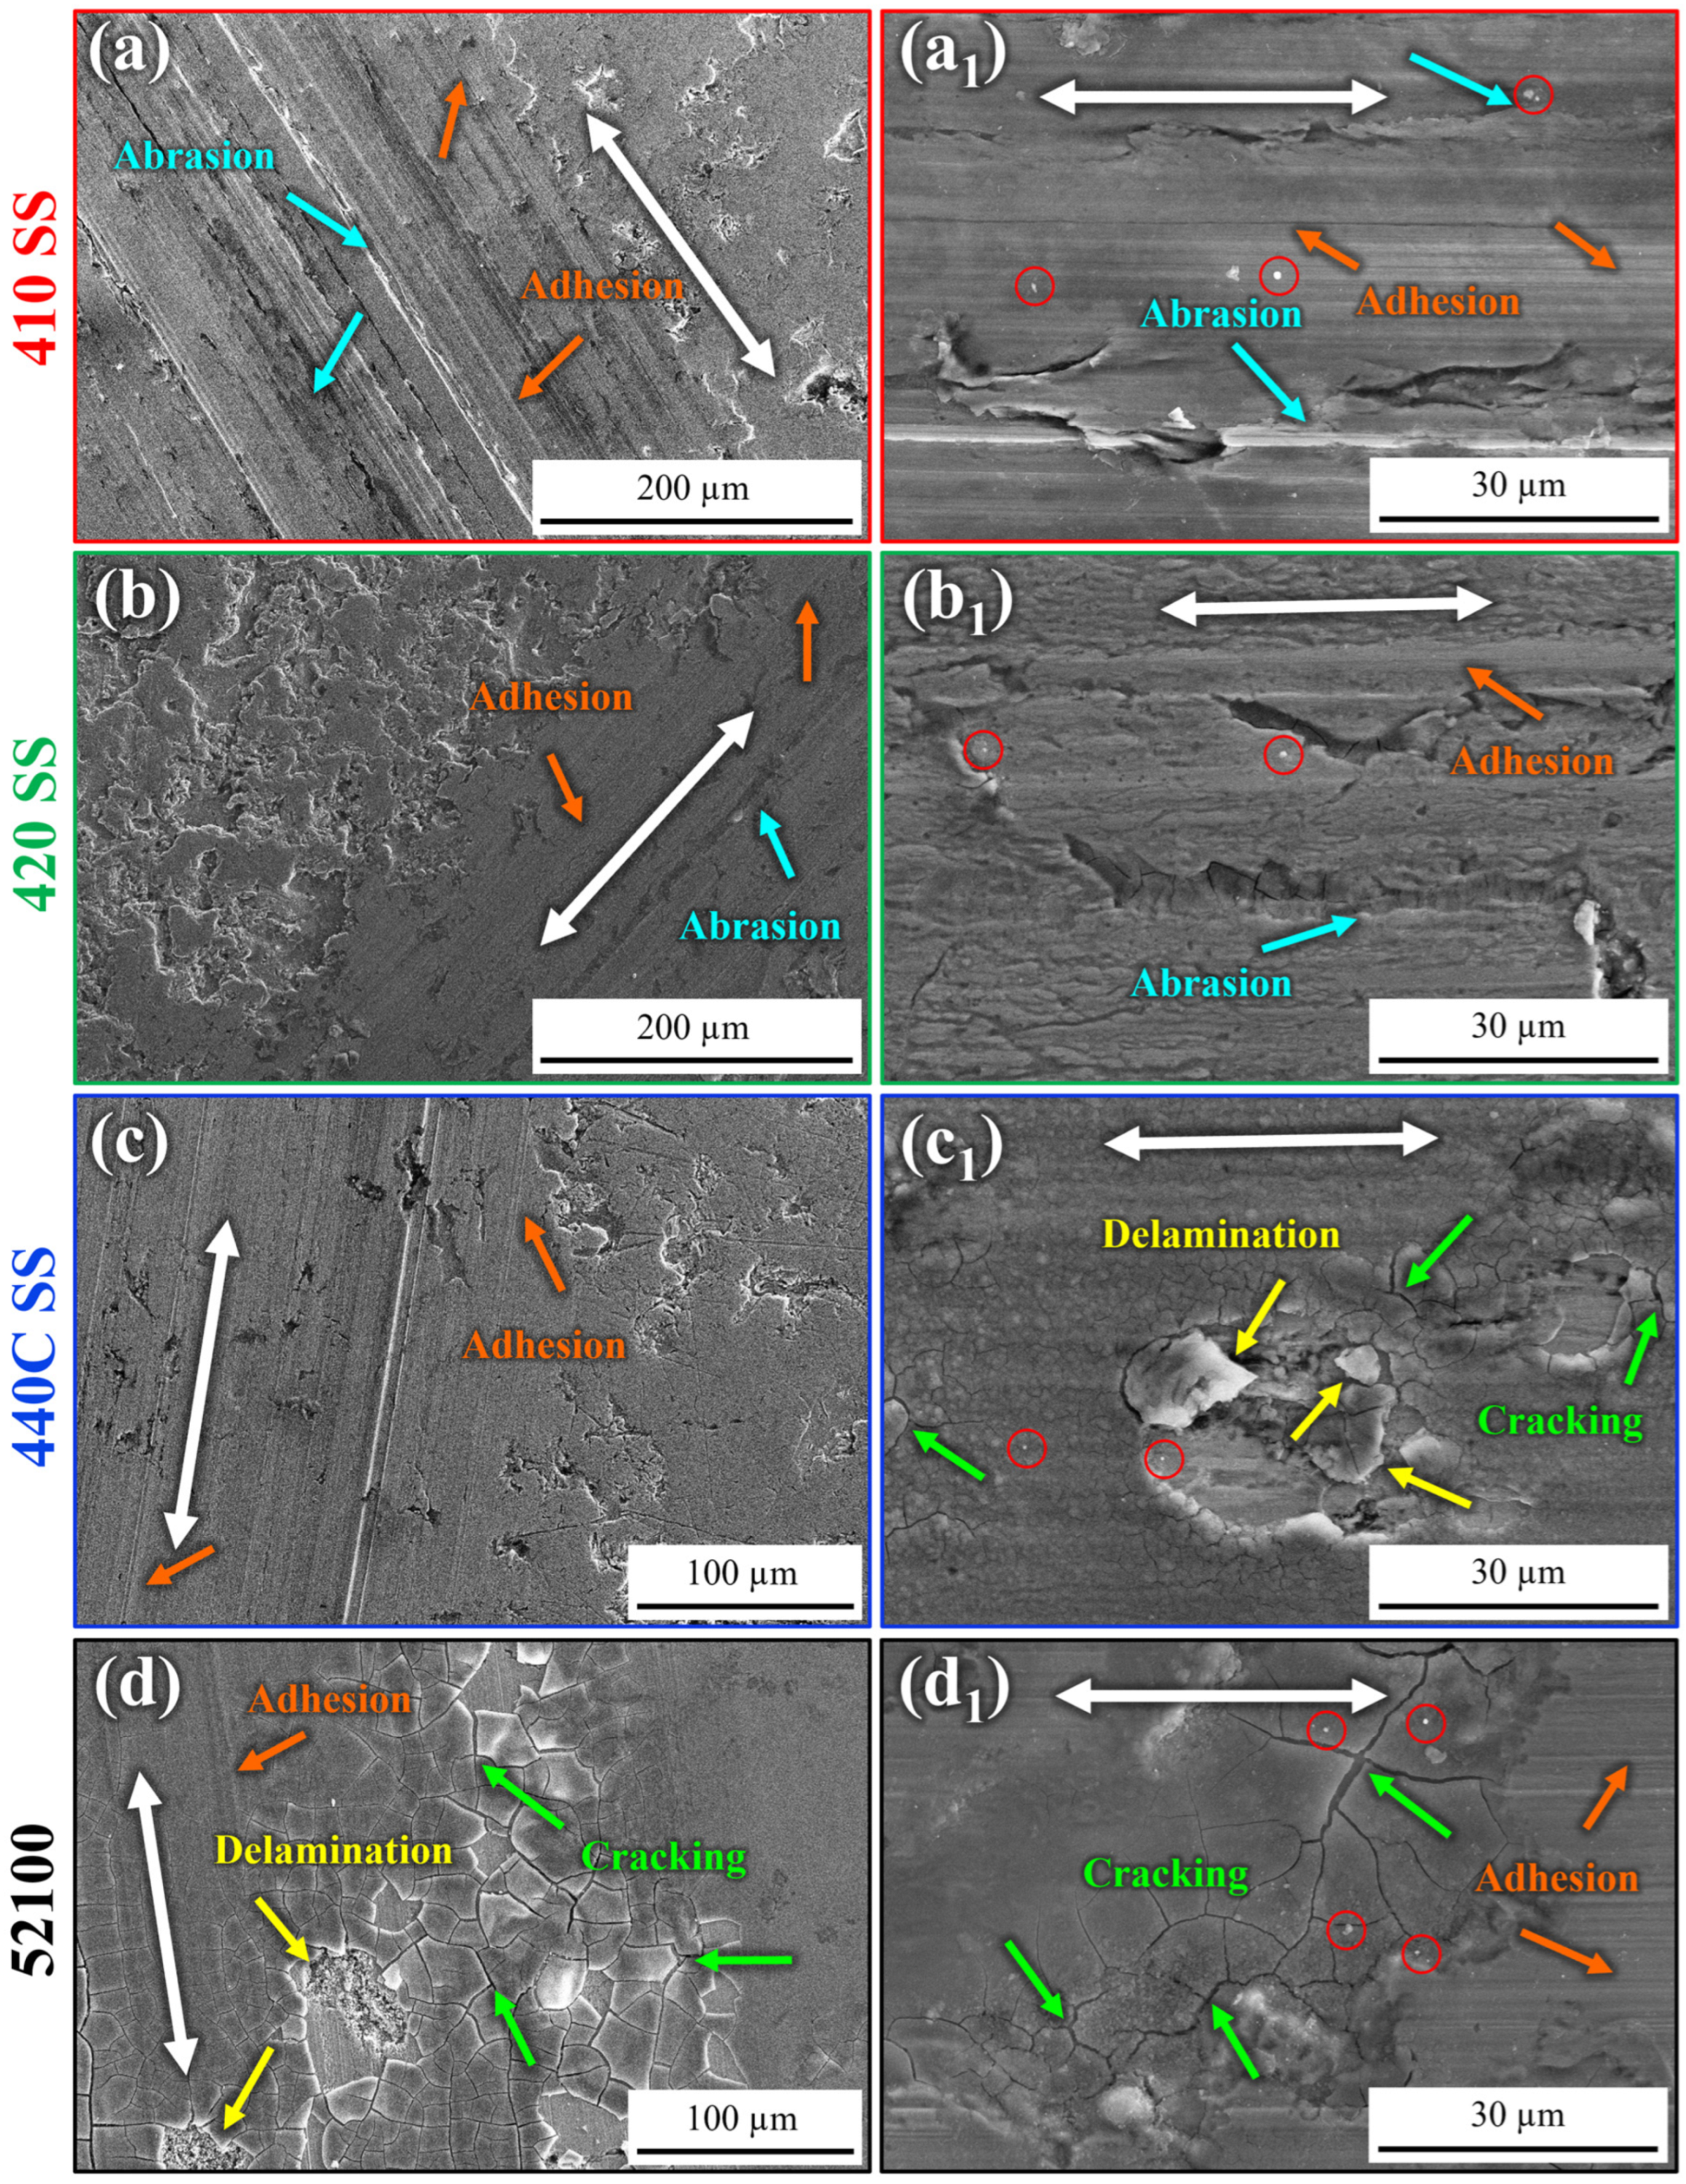
3.2.2. SEM Analysis of Wear Tracks

Further analysis of the wear tracks after dry and wet testing obtained using the scanning electron microscope in secondary electron mode are provided in Figure 6a–d and Figure 7a–d, respectively. While previous images of the wear tracks obtained using the optical microscope provided a clear distinction between the mechanical and chemical processes that dominated during wear testing in both the dry and wet conditions, the scanning electron microscope provides the spatial resolution necessary to further analyze the morphology of the wear tracks. Figures include low- (Figure 6a–d and Figure 7a–d) and high-magnification (Figure 6a1–d1 and Figure 7a1–d1) micrographs of the wear tracks.
Significant delamination of the metal surfaces can be observed across the entire wear tracks of specimens tested in the dry mode (Figure 6a–d). Abrasion (plowing marks—denoted by teal arrows) and adhesion (smooth grooves—denoted by orange arrows) can be observed clearly on the wear tracks of all specimens tested in the dry mode. During dry testing, the abrasive and adhesive wear coupled with repetitive unidirectional loading by the pin and the accumulated plastic strain, caused delamination. These delaminated layers can either be ejected from the track or are further compacted under the normal load within the track. A delaminated fragment of the material can be clearly seen in Figure 6c1 within the wear track of the 440C stainless steel specimen. The most obvious dominant wear mechanisms observed within these micrographs are delamination and abrasion, as previously shown in Figure 5a–d.
Figure 7a–d illustrated SEM micrographs of the wear track after wet wear testing. Smooth grooves, indicative of adhesive wear [71], are easily discernable (Figure 7a–d). As discussed above, in addition to adhesive wear, abrasive wear with low intensity is also present. Comparing Figure 6a–d to Figure 7a–d, it can be seen that adhesive wear was much more prominent within the wear tracks of specimens tested in the wet mode. These micrographs also corroborate the claim that delamination and abrasion were the primary mechanical wear mechanisms during dry pin-on-disk wear testing, while adhesive wear in combination with either pitting corrosion or delamination/cracking were the primary mechanical wear mechanisms during wet testing and abrasive wear as the secondary mechanism. The pitting that was observed within the wear tracks of the Fe–Cr alloys after wet testing (shown in Figure 5e–g) cannot clearly be seen here in the SEM micrographs; however, cracks can be observed within the wear tracks of the 440C stainless steel and 52100 steel after wet testing. The most prominent cracking can be observed in the 52100 steel where the cracking even extended outside of the wear track (Figure 7d,d1). While there was also some cracking observed in the 440C stainless steel specimen, the cracks are much smaller and localized within the wear track. It worth mentioning that SEM images shows instances of carbides within the wear track affecting coefficient of friction and wear. As mentioned above, EDS analysis (included in Supplementary Information file) confirms the presence of carbides within the wear track.

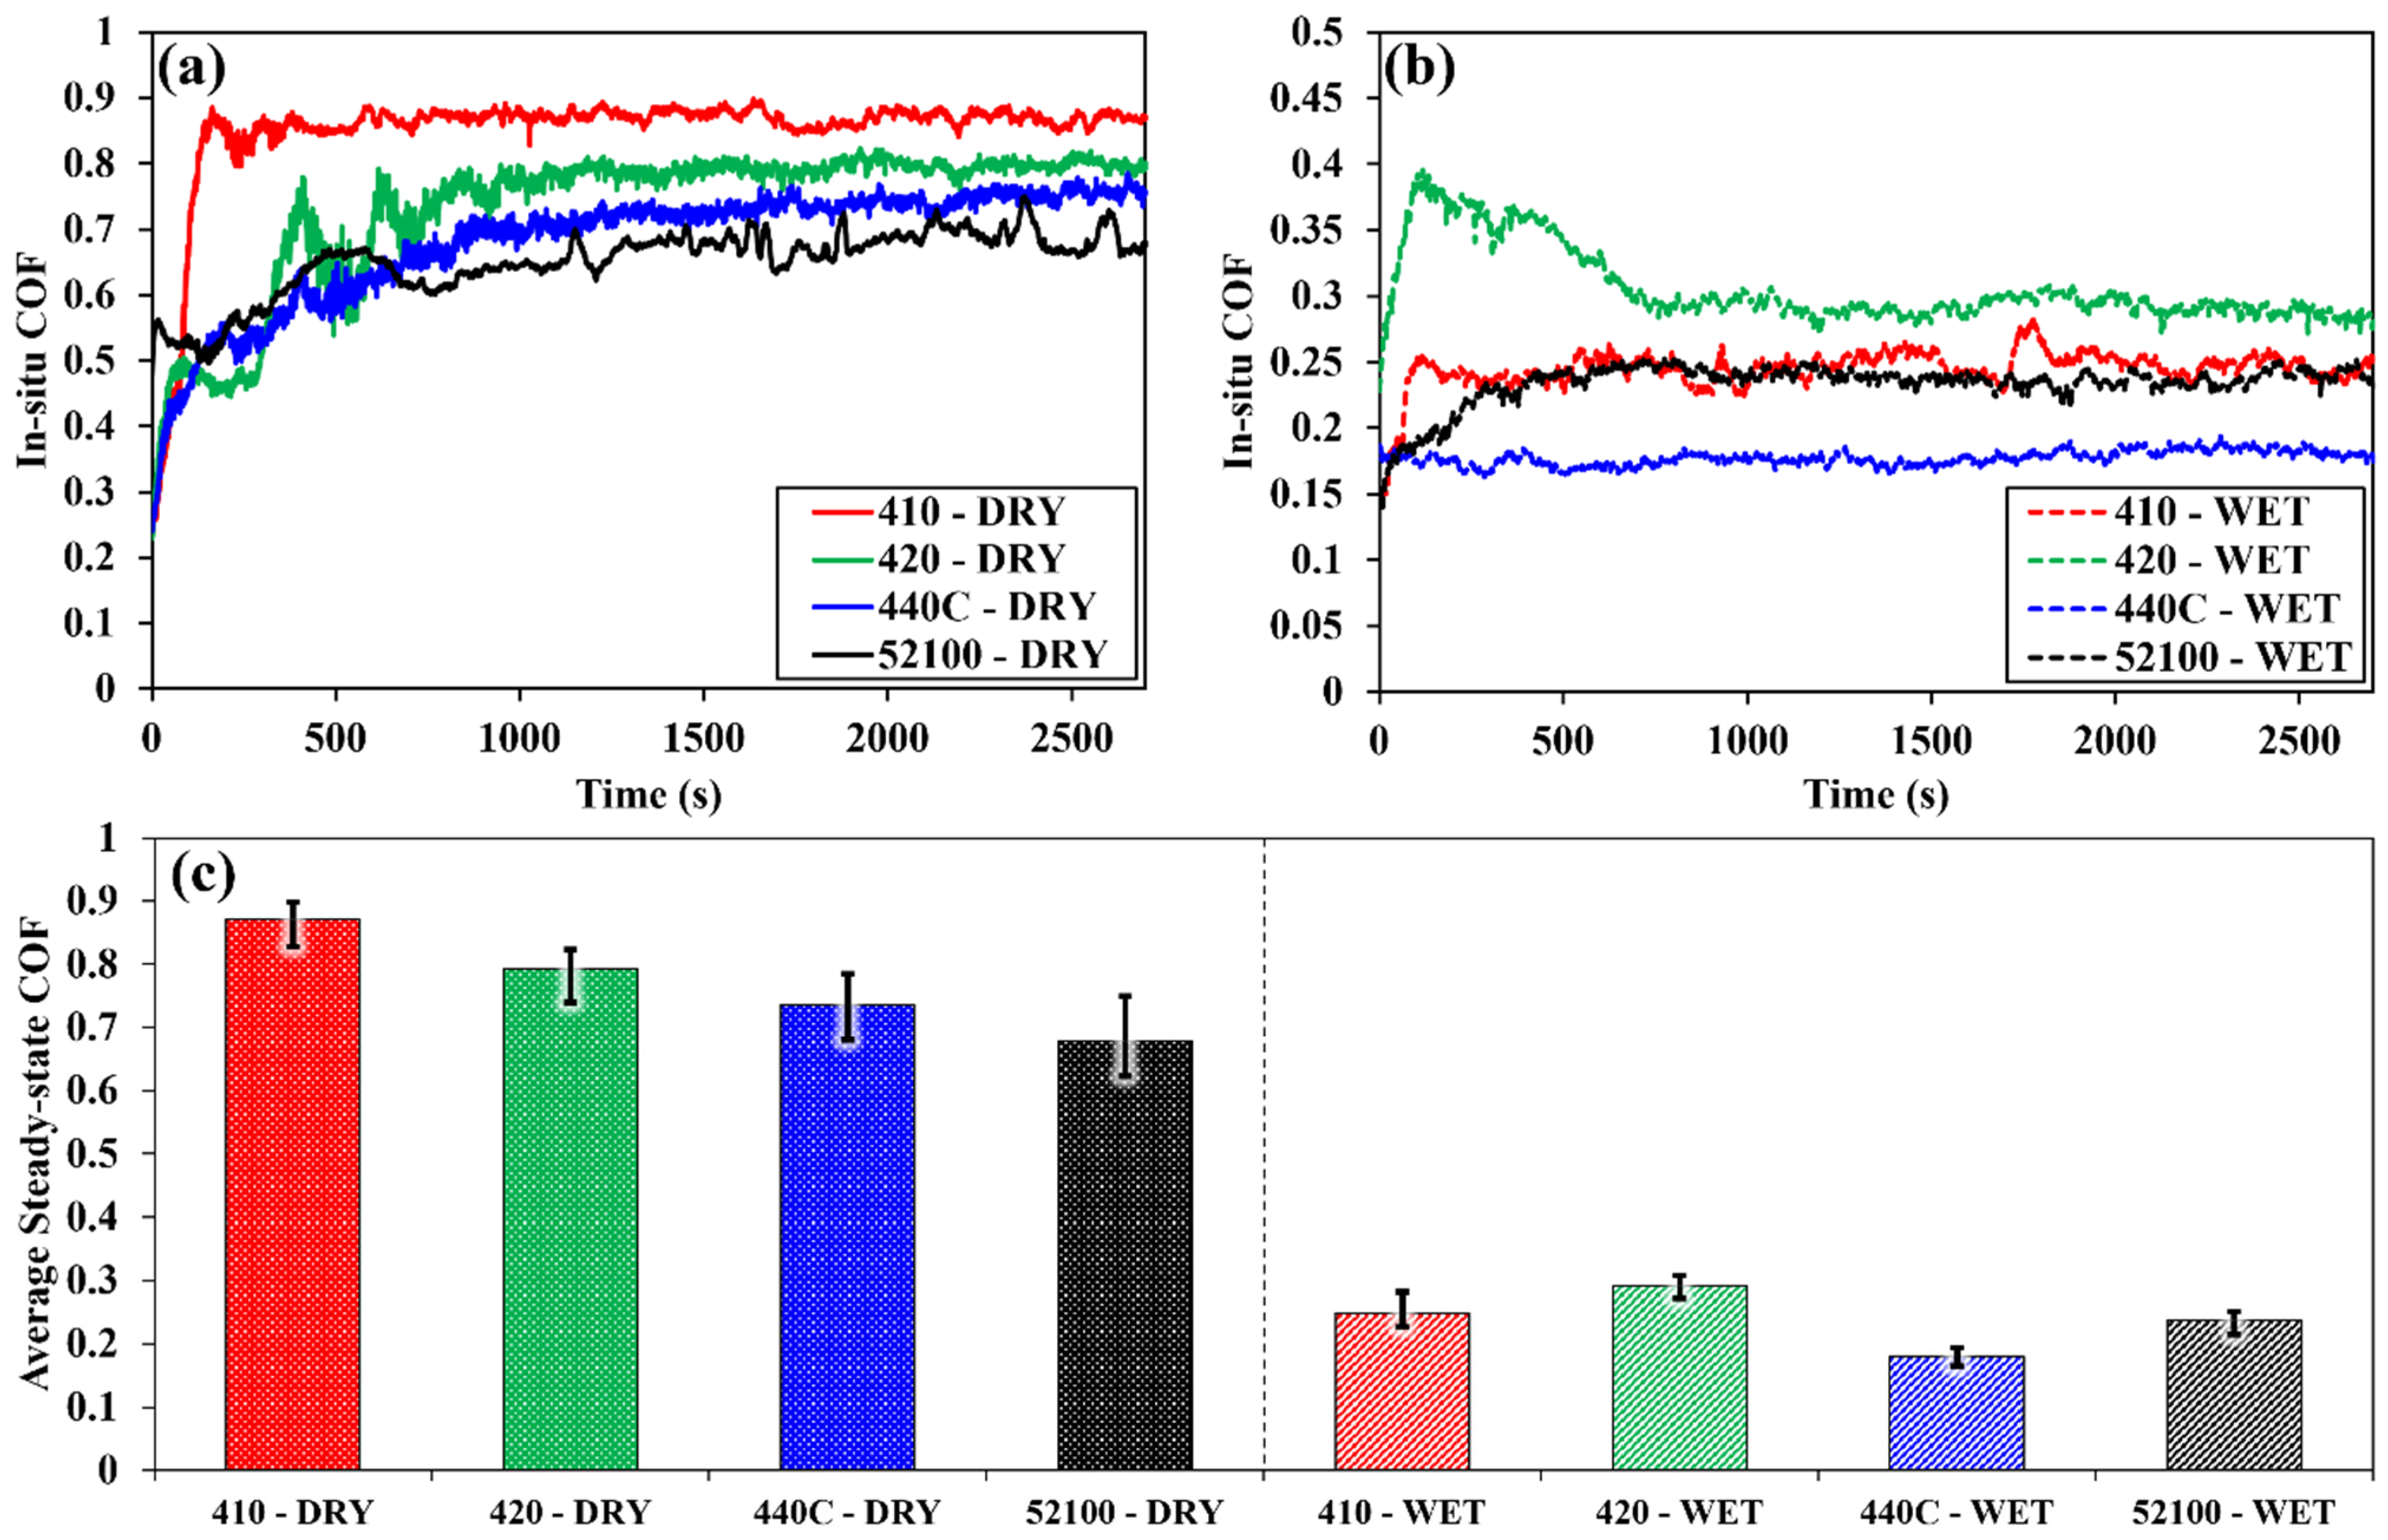
3.3. Coefficient of Friction

Qualitative analysis of the wear tracks has proven invaluable in determining the primary wear mechanisms including abrasion/adhesion, delamination, pitting, and cracking/fragmentation which occurred during pin-on-disk wear testing of each of the selected steels. However, to further understand the influence of each of these wear mechanisms and their effects on respective steels during wear testing, quantitative measurements must be employed. In-situ coefficient of friction (COF) measurements obtained with a 2D load transducer during sliding tests provide the possibility of linking the morphology of wear tracks to fluctuations in the COF exhibited during pin-on-disk wear testing. In addition to in-situ measurements, steady-state COF values were also calculated. Figure 8a,b include the in-situ COFs obtained from each of the steel specimens during testing in dry and wet conditions, respectively. The averaged steady-state COFs, obtained from the interval of 1000 to 2700 s, are shown in Figure 8c where the error bars represent the maximum and minimum fluctuations from the average COF within that interval.
The in-situ COF might fluctuate with sliding distance due to changes in the wear mechanism which causes structural changes to the material within the wear track during testing [76]. During unidirectional loading of the pin, previously delaminated layers of the material and carbides (debris) which have been removed from the metal matrix become compacted beneath the pin. This repetitive compaction of previously delaminated layers combined with abrasion from the pin and the free carbides beneath the pin cause the wear track to constantly change its structural state. This causes instability between the pin and the disc which can be observed as fluctuations in the COF. Similar analysis of the in-situ COFs obtained from metallic specimens have been conducted in previous studies [39,42,50,77,78,79]. In general, changes in the in-situ COFs are attributed to changes in testing process parameters, environmental conditions, surface conditions, among others [50]. Steady-state regimes are often defined within specific time intervals to draw comparisons between data obtained from different specimens. While the in-situ COF remains relatively stable for most materials in the steady-state region (1000–2700 s), one of the steel specimens exhibited fairly significant fluctuations in the COF during testing even within the steady-state region (See the error bars in Figure 8c).
During dry wear testing, the most significant fluctuations in the COF within the steady-state region were observed in the 52100 steel specimen (See Figure 8a) from 1000–2700 s and error bars in Figure 8c. Since the other materials tested in the dry mode (410, 420, and 440C stainless steels) also exhibited similar amounts of delamination and abrasion within their wear tracks (See Figure 5a–d and Figure 6a–d), it is suspected that something else also contributed to the increased fluctuations in the COF within the wear track of the 52100 steel. The existence of larger undissolved carbides observed within the 52100 steel matrix (See Figure 3h) which were dislodged from the matrix during repetitive mechanical loading, in addition to the combined effects of corrosion, affecting the 52100 steel more than its Cr-rich counterparts, are assumed to be responsible for the instability of contact between the pin and the disc which resulted in larger fluctuations in the COF. The fragmentation/cracking which was observed in Figure 5d within the wear track of the 52100 specimen after dry testing was also a likely culprit in the increased fluctuations in the COF during dry testing. All the Fe–Cr alloys tested in the dry mode exhibited fairly steady COF measurements during the steady-state regime with the softer materials (410 and 420 stainless steels) exhibiting the highest COFs. Initial unsteady-state regions can also be observed in Figure 8a for all of the Fe–Cr alloys. The 410 stainless steel appeared to enter into the steady-state regime much faster than the 420 or 440C stainless steels during dry wear testing.
The in-situ COF plots in Figure 8b correspond to measurements obtained during the wet testing of the steels. Here it can be seen that the 440C stainless steel exhibited not only the lowest COF throughout the testing duration, but also the steadiest COF values. It can also be seen that the in-situ COFs measured for each of the materials scaled with hardness, with the hardest materials exhibiting the lowest COFs (See Figure 1). The 410 and 420 stainless steels as well as the 52100 steel demonstrated similar unsteady-state regions at the beginning of the testing period during wet testing as they did during dry testing.
As expected, the steady-state COF is higher during dry wear testing due to the absence of a lubricating media. This reduction in COF has also been observed by others and is attributed to the reduction of solid–solid contact by the existence of a lubricating media [50,51]. This lubricating media can also cause carbides and delaminated material to be ejected from the wear tracks which might reduce the instability between the pin and disk leading to steadier COFs. Steady-state COF values obtained during dry wear testing were within the range of 0.6–0.9, while steady-state COF values obtained during wet testing were in the range of 0.1–0.3 (Figure 8c). The highest average steady-state COFs observed during dry wear testing were exhibited from the 410 and 420 stainless steels with values of 0.87 and 0.79. Both stainless steels were much softer than the 440C stainless steel and the 52100 steel (See Figure 1), and they had smaller carbides present within their metal matrix (See Figure 3e–h). The specimens which exhibited the lowest averaged steady-state COFs during dry testing were the 440C stainless steel and 52100 steel with values of 0.74 and 0.68, respectively. These specimens (440C stainless steel and 52100 steel) also exhibited the lowest averaged steady-state COFs during wet testing (0.18 and 0.24, respectively); however, while the 440C exhibited the lowest COF during wet testing, it was the second lowest COF during dry testing (after 52100 steel).

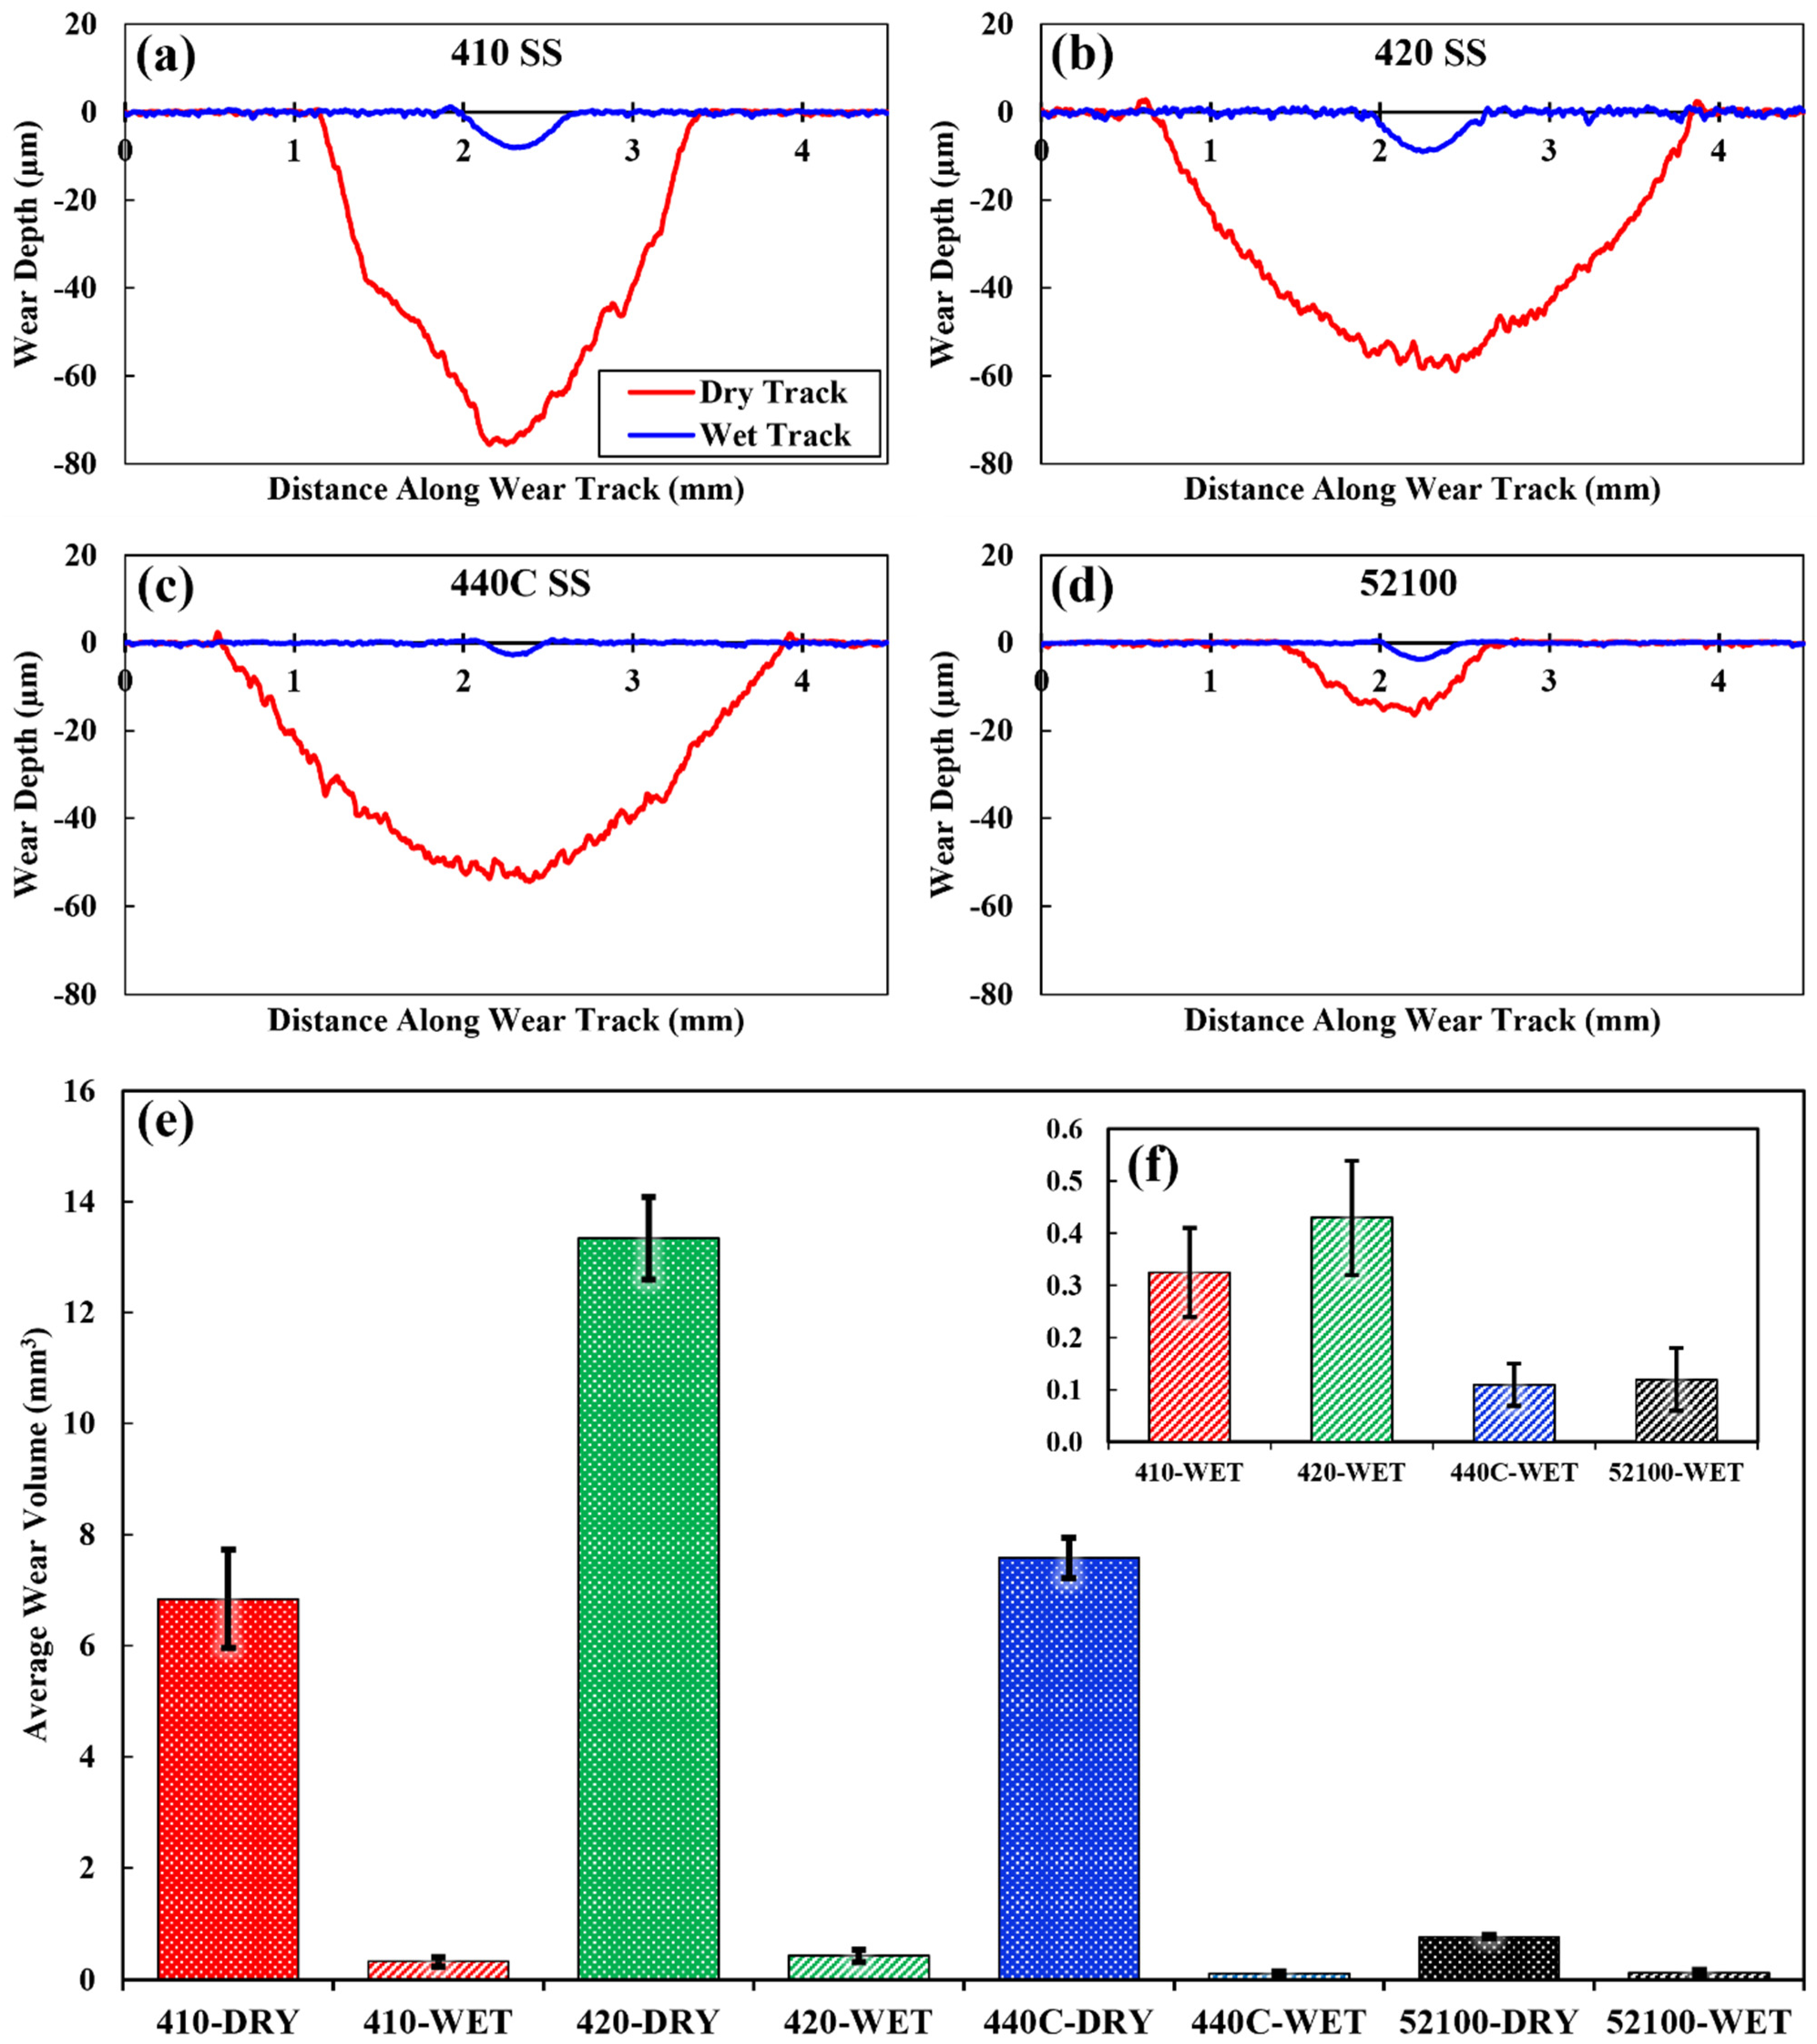
3.4. Wear Volume Analysis

To directly compare the amount of material removed from each of the steel specimens during wet and dry wear testing, the wear volume was calculated for each of the specimens after pin-on-disk testing. It should be mentioned that the pile-up near the edges of the wear tracks (clearly seen in Figure 9b,c) is the material that was displaced rather than removed. Hence, this was not included in calculation of the cross-sectional areas of the wear track and the subsequent estimation of the wear volume (Equation (1)). This methodology has been used by others to only consider removed material rather than the combination of displaced and removed material [50,51,77]. Since clear guidance on whether to include this displaced (piled-up) material is not provided in ASTM G99, displaced material has not been considered in this study. While it is difficult to draw a direct comparison between the material loss of each specimen solely by observing the wear profiles, some distinct features should be discussed. As expected, large variations in the depth and breadth of wear tracks between dry and wet testing can be observed from the wear track profiles of all specimens (compare red and blue profiles in Figure 9a–d). As discussed earlier, this is due to the presence of the DDR corn stover which acted as a lubricating media during wet testing that was shown to mitigate delamination and material loss within the wear tracks of specimens (See Figure 5a–h). The specimen which exhibited the greatest wear depth (~76 µm at its peak depth) within its wear tracks was the 410 stainless steel (Figure 9a). The profiles and the measured wear depth of the dry wear tracks of both the 420 and 440C stainless steels (Figure 9b,c) appear to coincide well with one another. The maximum depth near the peak of the 420 and 440C stainless steels wear tracks were measured to be ~59 µm and ~54 µm, respectively. Additionally, these two wear tracks also exhibited pile-up near edges of the wear tracks, which can be seen not only from the wear depth profiles obtained from profilometry, but also in the SEM micrographs in Figure 6b,c. No significant pile-up was observed near the edges of the wear tracks which resulted from dry testing on the 410 stainless steel or 52100 steel specimens in either the SEM micrographs (Figure 6a,d) or on the wear profiles (Figure 9a,d). No significant galling was found near the edges of wear tracks tested in the wet mode. The materials which exhibited the greatest wear depth during wet testing were the 410 and 420 stainless steels (Figure 9a,b), which also had the lowest hardness of the steels tested here (see Figure 1), with maximum depth measurements from the peak of the wear tracks measured to be ~8 µm and ~9 µm, respectively. The shallowest depths were realized within the wear tracks of the harder 440C stainless steel and 52100 steel specimens (Figure 9c,d). The maximum depth of the wear tracks measured from the peaks were ~3 µm for the 440C stainless steel specimen and ~4 µm for the 52100 steel specimen.
Figure 9e–f summarize the calculated wear volumes from each of the steel specimens after wear testing with Figure 9e depicting the wear volumes of specimens tested in both wet and dry modes, and Figure 9f depicting the wear volumes of specimens tested in the wet mode with a smaller scale for easier comparison. Since the load, sliding speed, and testing duration remained constant for all pin-on-disk tests, the wear volumes for each specimen are normalized. Maximum and minimum calculated wear volume error bars are also included to show the error between the wear volume calculated from the two wear tracks on each specimen.
The largest wear volume in both atmospheric and biomass environments was exhibited by the 420 stainless steel specimen which had the lowest hardness (~94 HRB). The averaged calculated wear volumes of the 420 stainless steel specimen after dry and wet testing were 13.34 mm3 and 0.43 mm3, respectively. A fairly similar wear volume was measured for both the 410 (6.84 mm3) and 440C stainless steel (7.58 mm3) specimens after dry wear testing. The measured wear volume of these Fe–Cr alloys is within the maximum/minimum error, and as such, it is assumed that their wear resistance in an atmospheric environment is relatively the same. Since these two Fe–Cr alloys had different measured values of hardness (~96 HRB (or ~19 HRC) for the 410 and ~23 HRC for the 440C stainless steel), another mechanism might be involved in the wear process leading to relatively the same wear resistance. The increased C content in the 440C stainless steel (1.05 wt.% compared to 0.13 wt.%) may have been attributed to the increased oxidation of the specimen during dry testing in the open atmospheric environment. This could be one possible explanation for the similar wear resistance exhibited by the softer 410 stainless steel and the harder 440C stainless steel. The 52100 steel specimen exhibited the lowest wear volume and thus the best wear resistance after dry wear testing even though its hardness was measured to be slightly less than that of the 440C stainless steel (~21 HRC). The wear volume of this specimen was calculated to be 0.78 mm3.
During wet wear testing in the DDR corn stover slurry, the 440C stainless steel and 52100 steel specimens exhibited the best wear resistance with the lowest measured wear volumes of 0.11 mm3 and 0.12 mm3, respectively. The superior wear resistance of these steels under the presence of a lubricating media can be mainly attributed to their high hardness. The steels which exhibited the poorest wear resistance during wet wear testing were the 410 and 420 stainless steels. The wear volumes of these specimens were calculated to be 0.33 mm3 for the 410 stainless steel and 0.43 mm3 for the 420 stainless steel. Although the wear resistance of the steels tested in the dry condition did not correspond to the hardness of the steel, during wet wear testing it can be seen that the softest materials exhibited the poorest wear performance, while the hardest materials exhibited the best.

4. Conclusions

In this study the influence of a lignocellulosic biomass, namely corn stover, and its effects on the tribological behavior of three different Fe–Cr alloys with varying Cr content (410, 420, and 440C stainless steel) and 52100 low-alloy high-carbon steel were evaluated using both qualitative and quantitative techniques. Pin-on-disk tribology tests were employed to simulate the unidirectional loading that occurs during the mechanical milling process known as Szego milling. Wear tests were performed on the steels in an open atmospheric environment without any lubricating media (dry) and in a biomass environment with deacetylated and disc refined corn stover slurry (wet). Optical microscopy and scanning electron microscopy were used to investigate the tribological behavior of the steels and to investigate the primary wear mechanisms which occurred during dry and wet testing. Additional energy dispersive spectroscopy analysis was performed (Supplementary Information) to confirm the existence of carbides within the wear tracks of the specimens tested in both dry and wet conditions. The in-situ coefficient of friction was used to investigate the behavior of the steels during wear testing, while the wear profiles were obtained to quantify the wear volume which was used to determine the amount of material removed from the steels after pin-on-disk wear testing. The following conclusions were drawn from the results obtained in this study.
-
Delamination and abrasion were the primary wear mechanisms observed after dry testing of all steels in the open atmospheric environment while adhesion was also present as the secondary mechanism. During wet testing, a combination of adhesion with moderate abrasion, pitting corrosion and cracking/fragmentation were observed to be the primary wear mechanisms after wet testing in the Fe-Cr alloys and the 52100 steel, respectively.
-
Energy dispersive spectroscopy analysis of the cross-sectioned wear tracks of the 420 stainless steel specimens tested in both wet and dry conditions proved the existence of carbides within the wear tracks.
-
The 410 stainless steel exhibited the best resistance to corrosion after wear testing in the DDR corn stover slurry compared to other Fe-Cr steels. It was attributed to lower concentrations of C present within the material.
-
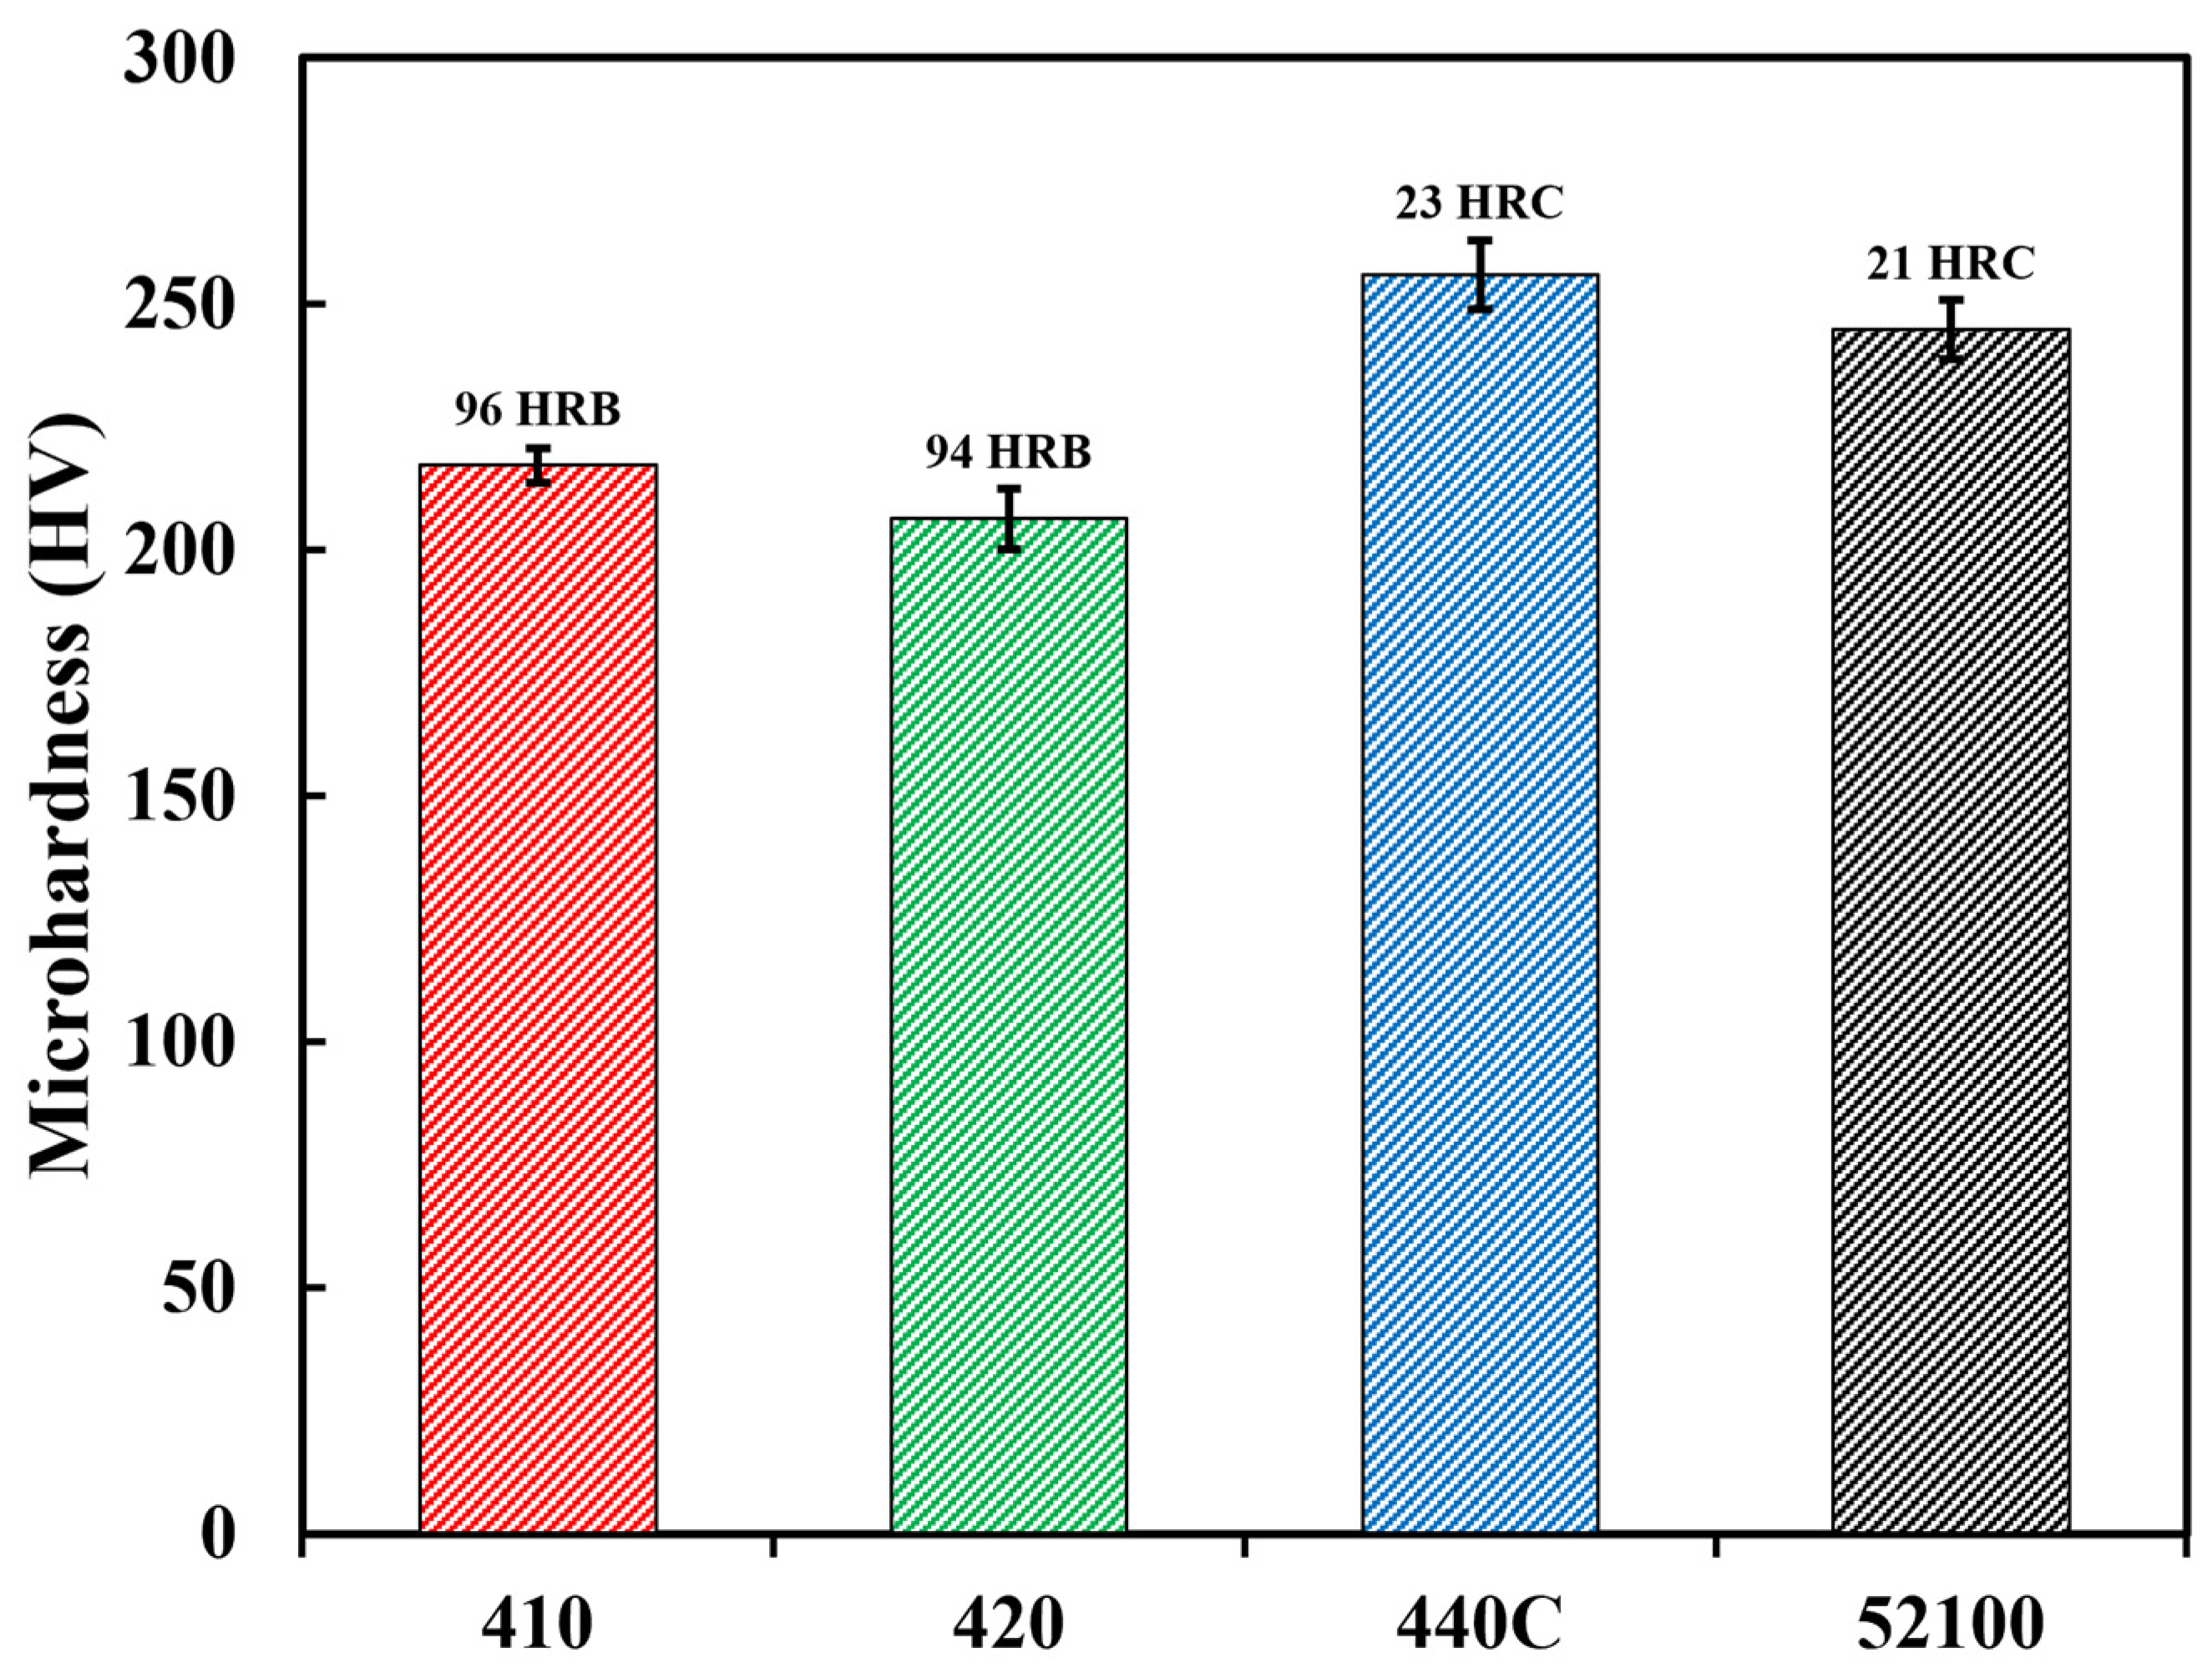
Besides the relatively lower hardness, the presence of large carbides is assumed to be one of the main reasons behind the poor corrosion and wear performance of the 420 stainless steel. Considering the steel with the highest hardness, the same conclusion can be made for the relatively poor tribo-corrosion performance of 440C stainless steel. The presence of coarse and high density carbides, which can be dislodged from the metal matrix during sliding tests, can rupture the passive oxide films. This can also generate large cavities accelerating pit growth while dislodged hard carbides debris accelerates wear.
-
The highest steady-state COFs during dry wear testing were exhibited by the 410 and 420 stainless steel specimens, while the lowest steady-state COF was exhibited by the 52100 steel.
-
The lowest steady-state COFs were exhibited by the 440C stainless steel and 52100 steel specimens during wet testing, while the highest steady-state COF was realized by the 420 stainless steel specimen.
-
The 420 stainless steel exhibited the poorest wear resistance during dry wear testing, while the 410 and 440C stainless steels exhibited similar wear resistance. The best wear resistance was exhibited by the 52100 steel during dry testing.
-
The 440C stainless steel and the 52100 steel and the 410 and 420 stainless steel exhibited similar wear resistance to one another during wet wear testing in the DDR corn stover slurry. The best wear resistance during wet testing was exhibited by 52100 steel specimens.

Supplementary Materials

The following supporting information can be downloaded at: https://www.mdpi.com/article/10.3390/met14040448/s1.

Author Contributions

N.B.: Writing—original draft, formal analysis, conceptualization, methodology. L.B.: Supervision, funding acquisition, writing—review and editing. A.B.: Resources, formal analysis, writing—review and editing. K.D.: Supervision, funding acquisition, resources, writing—review and editing. All authors have read and agreed to the published version of the manuscript.

Funding

This research was funded by the U.S. Department of Energy’s Office of Energy Efficiency and Renewable Energy (EERE) under the Bioenergy Technologies Office Award Number DE-EE0009256.

Data Availability Statement

The raw data supporting the conclusions of this article will be made available by the authors on request.

Acknowledgments

The authors would like to thank Xiaowen Chen and Yudong Li from NREL and Olev Trauss from General Comminution Inc. for helpful discussions. The authors also acknowledge the use of The University of Alabama’s Central Analytical Facility (CAF).

Conflicts of Interest

The authors declare that they have no known competing financial interests or personal relationships that could have appeared to influence the work reported in this paper.

Full Legal Disclaimer

This report was prepared as an account of work sponsored by an agency of the United States Government. Neither the United States Government nor any agency thereof, nor any of their employees, makes any warranty, express or implied, or assumes any legal liability or responsibility for the accuracy, completeness, or usefulness of any information, apparatus, product, or process disclosed, or represents that its use would not infringe privately owned rights. Reference herein to any specific commercial product, process, or service by trade name, trademark, manufacturer, or otherwise does not necessarily constitute or imply its endorsement, recommendation, or favoring by the United States Government or any agency thereof. The views and opinions of authors expressed herein do not necessarily state or reflect those of the United States Government or any agency thereof.

References

  1. Zoghlami, A.; Paës, G. Lignocellulosic Biomass: Understanding Recalcitrance and Predicting Hydrolysis. Front. Chem. 2019, 7, 874. [Google Scholar] [CrossRef] [PubMed]
  2. Demirbas, M.F.; Balat, M.; Balat, H. Potential Contribution of Biomass to the Sustainable Energy Development. Energy Convers. Manag. 2009, 50, 1746–1760. [Google Scholar] [CrossRef]
  3. Bajpai, P. Pretreatment of Lignocellulosic Biomass for Biofuel Production; Springer: Berlin/Heidelberg, Germany, 2016. [Google Scholar]
  4. Pandey, R.; Nahar, N.; Pryor, S.; Pourhashem, G. Cost and environmental benefits of using pelleted corn stover for Bioethanol Production. Energies 2021, 14, 2528. [Google Scholar] [CrossRef]
  5. Aden, A. National Renewable Energy Laboratory, 2002, Lignocellulosic Biomass to Ethanol Process Design and Economics Utilizing Co-Current Dilute Acid Prehydrolysis and Enzymatic Hydrolysis for Corn Stover. Available online: https://www.nrel.gov/docs/fy02osti/32438.pdf (accessed on 5 March 2023).
  6. Gao, Z.; Mori, T.; Kondo, R. The Pretreatment of Corn Stover with Gloeophyllum Trabeum Ku-41 for Enzymatic Hydrolysis. Biotechnol. Biofuels 2012, 5, 28. [Google Scholar] [CrossRef] [PubMed]
  7. Khan, M.F.; Akbar, M.; Xu, Z.; Wang, H. A Review on the Role of Pretreatment Technologies in the Hydrolysis of Lignocellulosic Biomass of Corn Stover. Biomass Bioenergy 2021, 155, 106276. [Google Scholar] [CrossRef]
  8. Hendriks, A.T.W.M.; Zeeman, G. Pretreatments to Enhance the Digestibility of Lignocellulosic Biomass. Bioresour. Technol. 2009, 100, 10–18. [Google Scholar] [CrossRef]
  9. Kuhn, E.M.; Chen, X.; Tucker, M.P. Deacetylation and Mechanical Refining (DMR) and Deacetylation and Dilute Acid (DDA) Pretreatment of Corn Stover, Switchgrass, and a 50:50 Corn Stover/Switchgrass Blend. ACS Sustain. Chem. Eng. 2020, 17, 6734–6743. [Google Scholar] [CrossRef]
  10. Li, Y.; Tao, L.; Nagle, N.; Tucker, M.; Chen, X.; Kuhn, E.M. Effect of Feedstock Variability, Feedstock Blends, and Pretreatment Conditions on Sugar Yield and Production Costs. Front. Energy Res. 2022, 9, 792216. [Google Scholar] [CrossRef]
  11. Li, Y.; Davis, R.; Tan, E.C.; Dempsey, J.; Lynch, K.; Sievers, D.A.; Chen, X. Impact of mechanical refining conditions on the energy consumption, enzymatic digestibility, and economics of sugar production from Corn Stover. ACS Sustain. Chem. Eng. 2023, 11, 15876–15886. [Google Scholar] [CrossRef]
  12. Chen, X.; Kuhn, E.; Wang, W.; Park, S.; Flanegan, K.; Trass, O.; Tenlep, L.; Tao, L.; Tucker, M. Comparison of Different Mechanical Refining Technologies on the Enzymatic Digestibility of Low Severity Acid Pretreated Corn Stover. Bioresour. Technol. 2013, 147, 401–408. [Google Scholar] [CrossRef]
  13. Chen, X.; Shekiro, J.; Pschorn, T.; Sabourin, M.; Tao, L.; Elander, R.; Park, S.; Jennings, E.; Nelson, R.; Trass, O.; et al. A Highly Efficient Dilute Alkali Deacetylation and Mechanical (Disc) Refining Process for the Conversion of Renewable Biomass to Lower Cost Sugars. Biotechnol. Biofuels 2014, 7, 98. [Google Scholar] [CrossRef]
  14. Li, Y.; Sievers, D.A.; Chen, X. Modeling the Disc Refining of Lignocellulosic Biomass toward Reduced Biofuel Production Cost and Greenhouse Gas Emissions: Energy Consumption Prediction and Validation. ACS Sustain. Chem. Eng. 2021, 9, 9717–9726. [Google Scholar] [CrossRef]
  15. Chen, X.; Wang, W.; Ciesielski, P.; Trass, O.; Park, S.; Tao, L.; Tucker, M.P. Improving Sugar Yields and Reducing Enzyme Loadings in the Deacetylation and Mechanical Refining (DMR) Process through Multistage Disk and Szego Refining and Corresponding Techno-Economic Analysis. ACS Sustain. Chem. Eng. 2015, 4, 324–333. [Google Scholar] [CrossRef]
  16. Trass, O.; Gandolfi, E.A.J. Fine Grinding of Mica in the Szego Mill. Powder Technol. 1990, 60, 273–279. [Google Scholar] [CrossRef]
  17. Gravelsins, R.J.; Trass, O. Analysis of Grinding of Pelletized Wood Waste with the Szego Mill. Powder Technol. 2013, 245, 189–198. [Google Scholar] [CrossRef]
  18. Roy, S.; Lee, K.; Lacey, J.A.; Thompson, V.S.; Keiser, J.R.; Qu, J. Material Characterization-Based Wear Mechanism Investigation for Biomass Hammer Mills. ACS Sustain. Chem. Eng. 2020, 8, 3541–3546. [Google Scholar] [CrossRef]
  19. Lee, K.; Roy, S.; Cakmak, E.; Lacey, J.A.; Watkins, T.R.; Meyer, H.M.; Thompson, V.; Keiser, J.; Qu, J. Composition-Preserving Extraction and Characterization of Biomass Extrinsic and Intrinsic Inorganic Compounds. ACS Sustain. Chem. Eng. 2020, 8, 1599–1610. [Google Scholar] [CrossRef]
  20. Wang, L.; Dong, C.; Man, C.; Hu, Y.; Yu, Q.; Li, X. Effect of Microstructure on Corrosion Behavior of High Strength Martensite Steel—A Literature Review. Int. J. Miner. Metall. Mater. 2021, 28, 754–773. [Google Scholar] [CrossRef]
  21. Mesquita, T.J.; Chauveau, E.; Mantel, M.; Bouvier, N.; Koschel, D. Corrosion and Metallurgical Investigation of Two Supermartensitic Stainless Steels for Oil and Gas Environments. Corros. Sci. 2014, 81, 152–161. [Google Scholar] [CrossRef]
  22. Klar, E.; Samal, P.K. Powder Metallurgy Stainless Steels: Processing, Microstructures, and Properties; ASM International: Materials Park, OH, USA, 2007. [Google Scholar]
  23. Nayebi, B.; Najafi, H.; Farnia, A. Microstructural, hardening, and wear characteristics of surface re-melted AISI 410s stainless steel via fiber laser process. J. Mech. Sci. Technol. 2021, 35, 4419–4426. [Google Scholar] [CrossRef]
  24. Li, J.; Tao, X.; Wu, W.; Xie, G.; Yang, Y.; Zhou, X.; Zhang, S. Effect of arc current on the microstructure, tribological and corrosion performances of AISI 420 martensitic stainless steel treated by arc discharge plasma nitriding. J. Mater. Sci. 2023, 58, 2294–2309. [Google Scholar] [CrossRef]
  25. Borgioli, F. The ‘expanded’ phases in the low-temperature treated stainless steels: A Review. Metals 2022, 12, 331. [Google Scholar] [CrossRef]
  26. Abdo, H.S.; Seikh, A.H.; Alharbi, H.F.; Mahammed, J.A.; Soliman, M.S.; Fouly, A.; Ragab, S.A. Tribo-behavior and corrosion properties of welded 304 L and 316 L stainless steel. Coatings 2021, 11, 1567. [Google Scholar] [CrossRef]
  27. Reinshagen, J.H.; Witsberger, J.C. Processing and Properties of 400 Series PM Stainless Steels. Met. Powder Rep. 1991, 46, 38–44. [Google Scholar] [CrossRef]
  28. Olsson, C.-O.A.; Landolt, D. Passive Films on Stainless Steels—Chemistry, Structure and Growth. Electrochim. Acta 2003, 48, 1093–1104. [Google Scholar] [CrossRef]
  29. Morshed-Behbahani, K.; Zakerin, N.; Najafisayar, P.; Pakshir, M. A Survey on the Passivity of Tempered AISI 420 Martensitic Stainless Steel. Corros. Sci. 2021, 183, 109340. [Google Scholar] [CrossRef]
  30. Ha, H.-Y.; Kim, K.-W.; Park, S.-J.; Lee, T.-H.; Park, H.; Moon, J.; Hong, H.-U.; Lee, C.-H. Effects of Cr on pitting corrosion resistance and passive film properties of austenitic Fe–19Mn–12Al–1.5 C lightweight steel. Corros. Sci. 2022, 206, 110529. [Google Scholar] [CrossRef]
  31. Wang, X.; Fan, L.; Ding, K.; Xu, L.; Guo, W.; Hou, J.; Duan, T. Pitting corrosion of 2Cr13 stainless steel in deep-sea environment. J. Mater. Sci. Technol. 2021, 64, 187–194. [Google Scholar] [CrossRef]
  32. Zhao, Y.; Liu, W.; Dong, B.; Wang, Y.; Fan, Y.; Zhang, T.; Banthukul, W. Effects of microstructure and material composition on the formation kinetics of passive film and pitting behavior of Super 13cr stainless steel. Metall. Mater. Trans. A 2021, 52, 1985–1998. [Google Scholar] [CrossRef]
  33. Sathyaseelan, V.S.; Rufus, A.L.; Chandramohan, P.; Subramanian, H.; Velmurugan, S. Preparation, Characterization and Dissolution of Passive Oxide Film on the 400 Series Stainless Steel Surfaces. J. Nucl. Mater. 2015, 467, 89–96. [Google Scholar] [CrossRef]
  34. Shah, S.O.; McMillen, J.R.; Samal, P.K.; Klar, E. Development of Powder Metal Stainless Steel Materials for Exhaust System Applications. SAE Tech. Pap. Ser. 1998, 107, 171–180. [Google Scholar] [CrossRef]
  35. Davis, J.R. Alloy Digest Sourcebook: Stainless Steels; ASM International: Materials Park, OH, USA, 2000. [Google Scholar]
  36. Loto, R.T. Study of the Corrosion Behaviour of S32101 Duplex and 410 Martensitic Stainless Steel for Application in Oil Refinery Distillation Systems. J. Mater. Res. Technol. 2017, 6, 203–212. [Google Scholar] [CrossRef]
  37. Ghasemi, H.M.; Furey, M.J.; Kajdas, C. Surface Temperatures and Fretting Corrosion of Steel under Conditions of Fretting Contact. Wear 1993, 162–164, 357–369. [Google Scholar] [CrossRef]
  38. Watson, S.W.; Friedersdorf, F.J.; Madsen, B.W.; Cramer, S.D. Methods of Measuring Wear-Corrosion Synergism. Wear 1995, 181–183, 476–484. [Google Scholar] [CrossRef]
  39. Shin, W.-S.; Son, B.; Song, W.; Sohn, H.; Jang, H.; Kim, Y.-J.; Park, C. Heat Treatment Effect on the Microstructure, Mechanical Properties, and Wear Behaviors of Stainless Steel 316L Prepared via Selective Laser Melting. Mater. Sci. Eng. A 2021, 806, 140805. [Google Scholar] [CrossRef]
  40. Shanta, S.M.; Molina, G.J.; Soloiu, V. Tribological Effects of Mineral-Oil Lubricant Contamination with Biofuels: A Pin-on-Disk Tribometry and Wear Study. Adv. Tribol. 2011, 2011, 820795. [Google Scholar] [CrossRef]
  41. Nuraliza, N.; Syahrullail, S.; Faizal, M.H. Evaluation on the Tribological Properties of Double Fractionated Palm OLEIN at Different Loads Using Pin-on-Disc Machine. J. Tribol. 2016, 9, 45–59. [Google Scholar] [CrossRef]
  42. Alias, S.K.; Halmy, M.N.; Shah, M.A.; Ahmad, N.N.; Sulaiman, S.A.; Pahroraji, H.F.; Abdullah, B. Effect of Surface Attrition on Hardness on the Hardness and Wear Properties of 304 Stainless Steels. IOP Conf. Ser. Mater. Sci. Eng. 2020, 834, 012058. [Google Scholar] [CrossRef]
  43. Luiz, V.D.; Santos, A.J.; Camara, M.A.; Rodrigues, P.C. Influence of different contact conditions on friction properties of AISI 430 steel sheet with deep drawing quality. Coatings 2023, 13, 771. [Google Scholar] [CrossRef]
  44. Su, Q.; Wang, X.; Wang, H.; Huang, Y.; Wang, Y.; Li, Z. The tribocorrosion behavior of high-nitrogen bearing stainless steel in acetic acid at various applied loads. Metals 2023, 13, 1287. [Google Scholar] [CrossRef]
  45. Barona-Osorio, G.M.; Teran, L.A.; Rodriguez, S.A.; Coronado, J.J. On the tribocorrosion behavior ofFe-Mn-Al-C alloys in Ringer’s solution. Metals 2022, 12, 1339. [Google Scholar] [CrossRef]
  46. Manoj Samson, R.; Harshavardhana, N.; Nirmal, R.; Ranjith, R. Enhancement of Ductility and Strength in 410 Stainless Steel through Cyclic Heat Treatment. IOP Conf. Ser. Mater. Sci. Eng. 2020, 912, 032034. [Google Scholar] [CrossRef]
  47. Abidin, Z.; Nugroho, T.; Indrawati, R.T.; Safriana, E.; Putri, F.T.; Supandi, S. Wear Rate Analysis Due to Dry Sliding Contact of Modified Rail to Increase Life Time in Air Blow Machine. J. Rekayasa Mesin 2022, 17, 151. [Google Scholar] [CrossRef]
  48. Prieto, G.; Tuckart, W.R. Wear Behavior of Cryogenically Treated AISI 420 Martensitic Stainless Steel. In Proceedings of the VIII Iberian Conference on Tribology; Universidad Politécnica de Cartagena: Cartagena, Spain, 2015. [Google Scholar]
  49. Strmčnik, E.; Majdič, F.; Kalin, M. Water-Lubricated Behaviour of AISI 440C Stainless Steel and a DLC Coating for an Orbital Hydraulic Motor Application. Tribol. Int. 2019, 131, 128–136. [Google Scholar] [CrossRef]
  50. Khare, N.; Bonagani, S.K.; Limaye, P.K.; Kain, V. Tribological Study on Tempered 13CR Martensitic Stainless Steel Susceptible to Interlath/Intergranular Corrosion under Nitric Acid Sliding Conditions. Mater. Chem. Phys. 2022, 285, 126097. [Google Scholar] [CrossRef]
  51. Mao, L.; Cai, M.; Liu, Q.; Wang, G. Influence of Oil-Water Ratio on the Wear of CR13 Casing Lubricated with Drilling Fluid. Mater. Today Commun. 2020, 25, 101341. [Google Scholar] [CrossRef]
  52. Venske, A.F.; De Castro, V.V.; Da Costa, E.M.; Dos Santos, C.A. Sliding Wear Behavior of an AISI 440B Martensitic Stainless Steel Lubricated with Biodiesel and Diesel–Biodiesel Blends. J. Mater. Eng. Perform. 2018, 27, 5427–5437. [Google Scholar] [CrossRef]
  53. Labiapari, W.S.; Alcantara, C.M.; Costa, H.L.; De Mello, J.D.B. Stainless steel as an antiwear material for the bio-fuel industry. Wear 2013, 302, 1536–1545. [Google Scholar] [CrossRef]
  54. Dalmau, A.; Richard, C.; Igual-Muñoz, A. Degradation mechanisms in martensitic stainless steels: Wear, corrosion and tribocorrosion appraisal. Tribol. Int. 2018, 121, 167–179. [Google Scholar] [CrossRef]
  55. Grabke, H.J.; Spiegel, M.; Zahs, A. Role of Alloying Elements and Carbides in the Chlorine-Induced Corrosion of Steels and Alloys. Mater. Res. 2004, 7, 89–95. [Google Scholar] [CrossRef]
  56. Loto, R.T. Pitting Corrosion Resistance and Inhibition of Lean Austenitic Stainless Steel Alloys. In Austenitic Stainless Steels—New Aspects; IntechOpen: Rijeka, Croatia, 2017. [Google Scholar] [CrossRef]
  57. Stolica, N. Pitting Corrosion on Fe-Cr and Fe-Cr-Ni Alloys. Corros. Sci. 1969, 9, 455–470. [Google Scholar] [CrossRef]
  58. De Castro, V.V.; Mazzini Fontoura, L.A.; Benfica, J.D.; Seferin, M.; Pacheco, J.L.; Dos Santos, C.A. Lubricated Sliding Wear of SAE 1045 and SAE 52100 Steel against Alumina in the Presence of Biodiesel, Diesel and a 50:50 Blend of Those Fuels. Wear 2016, 368–369, 267–277. [Google Scholar] [CrossRef]
  59. ASTM A276 Standard; Standard Specification for Stainless Steel Bars and Shapes. ASTM: West Conshohocken, PA, USA, 2015.
  60. ASTM A108 Standard; Standard Specification for Steel Bar, Carbon and Alloy, Cold-Finished. ASTM: West Conshohocken, PA, USA, 2024.
  61. ASTM G99-17 Standard; Standard Test Method for Wear Testing with a Pin-on-Disk Apparatus. ASTM: West Conshohocken, PA, USA, 2023.
  62. Chen, X.; Kuhn, E.; Jennings, E.W.; Nelson, R.; Tao, L.; Zhang, M.; Tucker, M.P. DMR (Deacetylation and Mechanical Refining) Processing of Corn Stover Achieves High Monomeric Sugar Concentrations (230 G L−1) during Enzymatic Hydrolysis and High Ethanol Concentrations (>10% v/v) during Fermentation without Hydrolysate Purification or Concentration. Energy Environ. Sci. 2016, 9, 1237–1245. [Google Scholar] [CrossRef]
  63. Xu, M.L. Secondary Carbide Dissolution and Coarsening in 13% Cr Martensitic Stainless Steel During Austenizing; Northeastern University: Boston, MA, USA, 2012. [Google Scholar]
  64. Techaboonanek, C. Precipitation during Tempering of Martensite in Fe-Cr-C Alloys. Master’s Thesis, KTH School of Industrial Engineering and Management, Stockholm, Sweden, 2012. [Google Scholar]
  65. Godec, M.; Balantič, D.A.S. Coarsening Behaviour of M23C6 Carbides in Creep-Resistant Steel Exposed to High Temperatures. Sci. Rep. 2016, 6, 29734. [Google Scholar] [CrossRef] [PubMed]
  66. Beswick, J.M. The Effect of Chromium in High Carbon Bearing Steels. Metall. Trans. A 1987, 18, 1897–1906. [Google Scholar] [CrossRef]
  67. Hosseini, S.B.; Dahlgren, R.; Ryttberg, K.; Klement, U. Dissolution of Iron-Chromium Carbides during White Layer Formation Induced by Hard Turning of AISI 52100 Steel. Procedia CIRP 2014, 14, 107–112. [Google Scholar] [CrossRef]
  68. Badisch, E.; Mitterer, C. Abrasive Wear of High Speed Steels: Influence of Abrasive Particles and Primary Carbides on Wear Resistance. Tribol. Int. 2003, 36, 765–770. [Google Scholar] [CrossRef]
  69. Gore, G.J.; Gates, J.D. Effect of Hardness on Three Very Different Forms of Wear. Wear 1997, 203–204, 544–563. [Google Scholar] [CrossRef]
  70. Cornell, R.M.; Giovanoli, R.; Schneider, W. Review of the Hydrolysis of Iron (III) and the Crystallization of Amorphous Iron (III) Hydroxide Hydrate. J. Chem. Technol. Biotechnol. 2007, 46, 115–134. [Google Scholar] [CrossRef]
  71. Buckley, D.H. Surface Effects in Adhesion, Friction, Wear, and Lubrication; Elsevier Scientific: Amsterdam, The Netherlands, 1981. [Google Scholar]
  72. Ma, F.-Y. Corrosive Effects of Chlorides on Metals; INTECH Open Access Publisher: London, UK, 2012. [Google Scholar]
  73. Steinsmo, U.; Isaacs, H.S. The Dissolution and Repassivation Kinetics of Fe-Cr Alloys in Pit Solutions. Corros. Sci. 1993, 35, 83–88. [Google Scholar] [CrossRef]
  74. Sun, Y. Tribocorrosion behavior of low temperature plasma carburized stainless steel. Surf. Coat. Technol. 2013, 228, S342–S348. [Google Scholar] [CrossRef]
  75. Sun, Y.; Rana, V. Tribocorrosion behaviour of Aisi 304 stainless steel in 0.5 M nacl solution. Mater. Chem. Phys. 2011, 129, 138–147. [Google Scholar] [CrossRef]
  76. Mondal, M.K.; Biswas, K.; Maity, J. A Transient Heat Transfer Model for Assessment of Flash Temperature during Dry Sliding Wear in a Pin-on-Disk Tribometer. Metall. Mater. Trans. A 2015, 47, 600–607. [Google Scholar] [CrossRef]
  77. Tripathy, M.; Gaskell, K.; Laureto, J.; Davami, K.; Beheshti, A. Elevated temperature fretting wear study of additively manufactured Inconel 625 Superalloy. Addit. Manuf. 2023, 67, 103492. [Google Scholar] [CrossRef]
  78. Rahman, M.S.; Ding, J.; Beheshti, A.; Zhang, X.; Polycarpou, A.A. Helium tribology of Inconel 617 at elevated temperatures up to 950 °C: Parametric study. Nucl. Sci. Eng. 2019, 193, 998–1012. [Google Scholar] [CrossRef]
  79. Rahman, M.S.; Ding, J.; Beheshti, A.; Zhang, X.; Polcarpou, A.A. Tribology of incoloy 800HT for nuclear reactors under helium environment at elevated temperatures. Wear 2019, 436–437, 203022. [Google Scholar] [CrossRef]
Figure 1. Microhardness plots of the annealed steels tested in this study (error bars indicate standard deviation error).
Metals 14 00448 g001
Figure 2. Experimental setup for (a) dry and (b) wet pin-on-disk wear experiments.
Metals 14 00448 g002
Figure 3. SEM images of the microstructures of the annealed steels, including (a,e) 410, (b,f) 420, (c,g) 440C stainless steels, and (d,h) 52100 steel.
Metals 14 00448 g003
Figure 4. Wear test specimens tested in both (ad) dry and (eh) wet conditions for the (a,e) 410 stainless steel, (b,f) 420 stainless steel, (c,g) 440C stainless steel, and (d,h) 52100 steel.
Metals 14 00448 g004
Figure 5. Optical images of wear tracks for (a,e) 410, (b,f) 420, and (c,g) 440C stainless steels, and (d,h) 52100 steel. Yellow, teal, orange, and white markers are used to denote various features. Inset images show the surfaces of the Al2O3 pins used for (ad) dry and (eh) wet tests.
Metals 14 00448 g005
Figure 6. SEM micrographs of wear tracks after dry testing for (a) 410, (b) 420, (c) 440C stainless steels, and (d) 52100 steel. The figures (a1d1) are higher magnification images. White arrows indicate the sliding direction during pin-on-disk wear tests. Red circles included in (a1d1) show instances of carbides within the wear tracks.
Metals 14 00448 g006
Figure 7. SEM micrographs of wear tracks after wet testing for (a) 410, (b) 420, (c) 440C stainless steels, and (d) 52100 steel. The figures (a1d1) are higher magnification images. White arrows indicate the sliding direction during pin-on-disk wear tests. Red circles included in (a1d1) show instances of carbides within the wear tracks.
Metals 14 00448 g007
Figure 8. In-situ coefficient of friction plots obtained during (a) dry and (b) wet testing and (c) the steady-state coefficient of friction obtained from dry and wet testing (1000–2700 s); error bars in (c) indicate maximum/minimum fluctuations from the averaged steady-state COFs within the interval from 1000–2700 s.
Metals 14 00448 g008
Figure 9. Wear depth profiles from (a) 410, (b) 420, (c) 440C stainless steels, and (d) 52100 steel. (e) The average wear volume calculated for each steel in both the dry and wet testing, and (f) only in the wet mode with a smaller scale. Error bars included in (e,f) are maximum and minimum calculated wear volumes.
Metals 14 00448 g009
Table 1. Chemical compositions of the annealed steels used in pin-on-disk tribometer experiments.
MaterialElements (wt.%)
FeCrCMnNiCuMoSi
410Bal.11.730.130.510.130.12<0.10.34
420Bal.13.230.081.00<0.1<0.1<0.11.00
440CBal.16.271.050.830.220.110.510.39
52100Bal.1.481.000.40<0.10.11<0.10.24
Disclaimer/Publisher’s Note: The statements, opinions and data contained in all publications are solely those of the individual author(s) and contributor(s) and not of MDPI and/or the editor(s). MDPI and/or the editor(s) disclaim responsibility for any injury to people or property resulting from any ideas, methods, instructions or products referred to in the content.

