
A Comprehensive Review of Fatigue Strength in Pure Copper Metals (DHP, OF, ETP)


Abstract
1. Introduction
2. Mechanical Fatigue Data Review
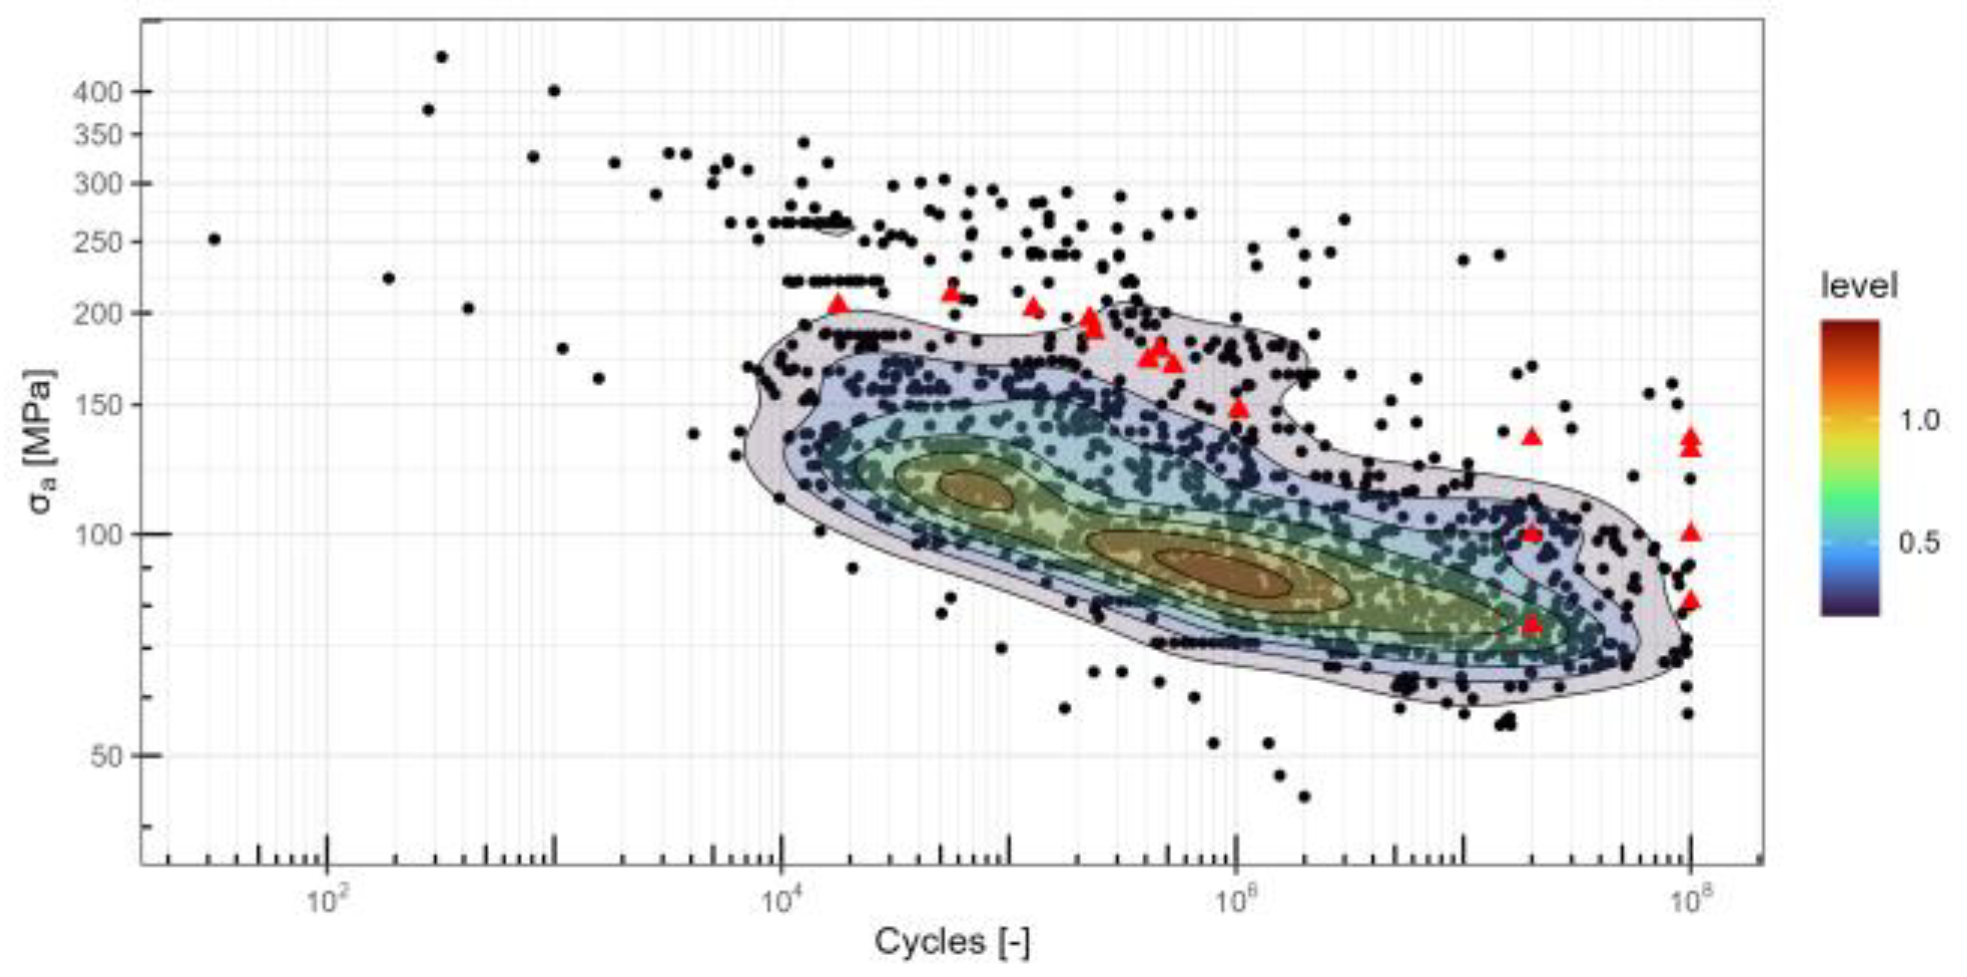
2.1. High-Cycle Fatigue: Stress–Life (S-N) Approach to Predict the Fatigue Damage
2.1.1. Fatigue Strength (Se) and Zero Mean Stress (σm = 0)
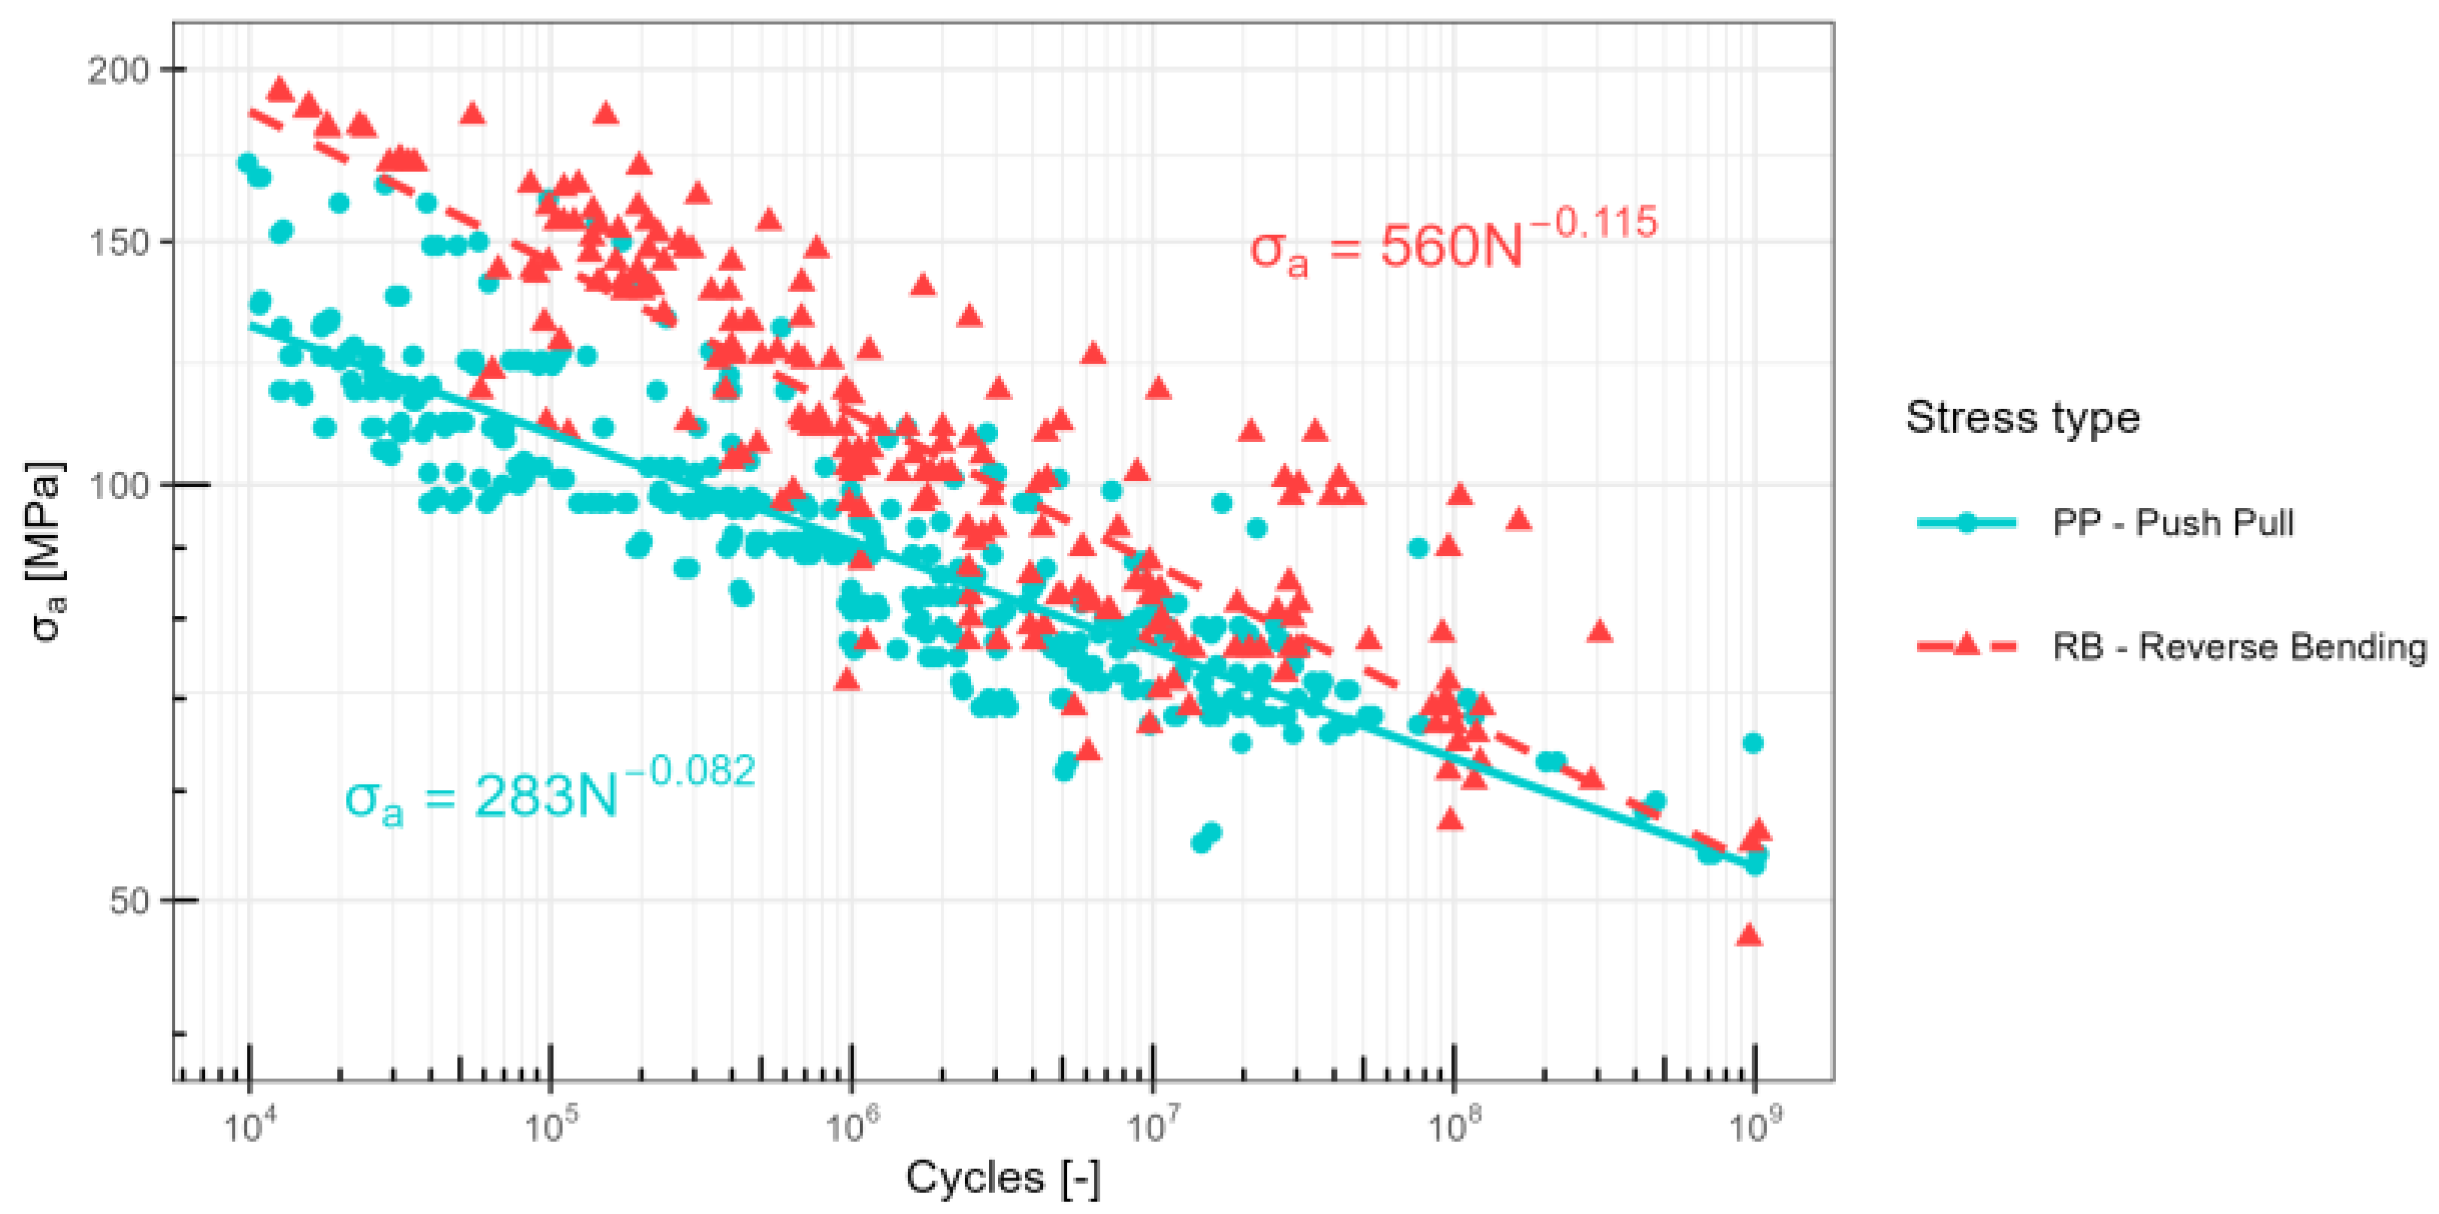
Stress Type Factor

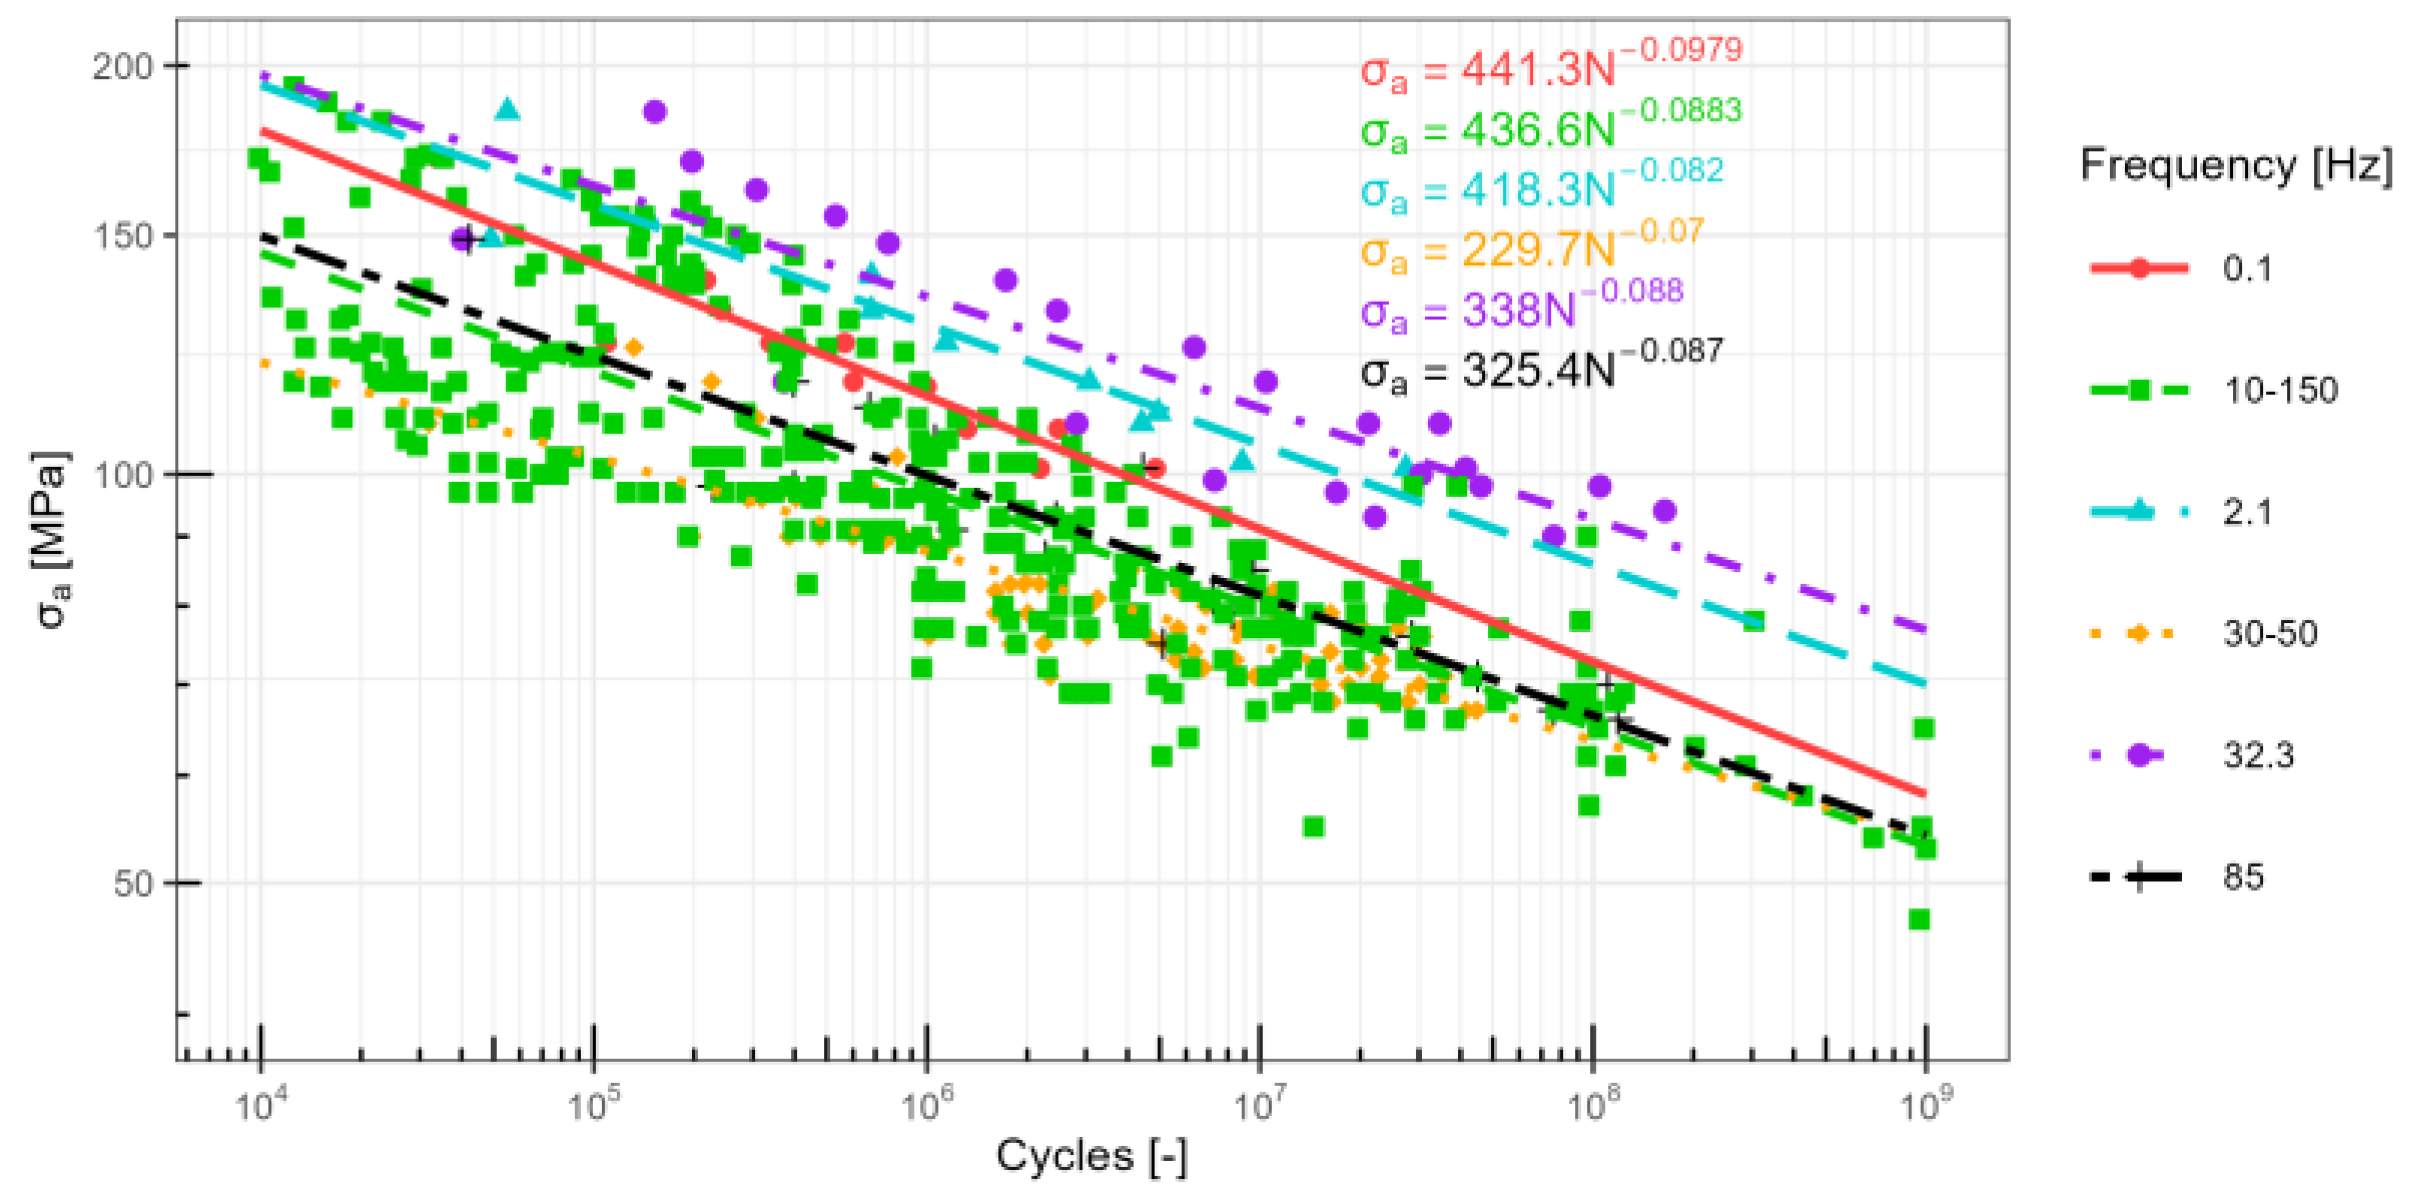
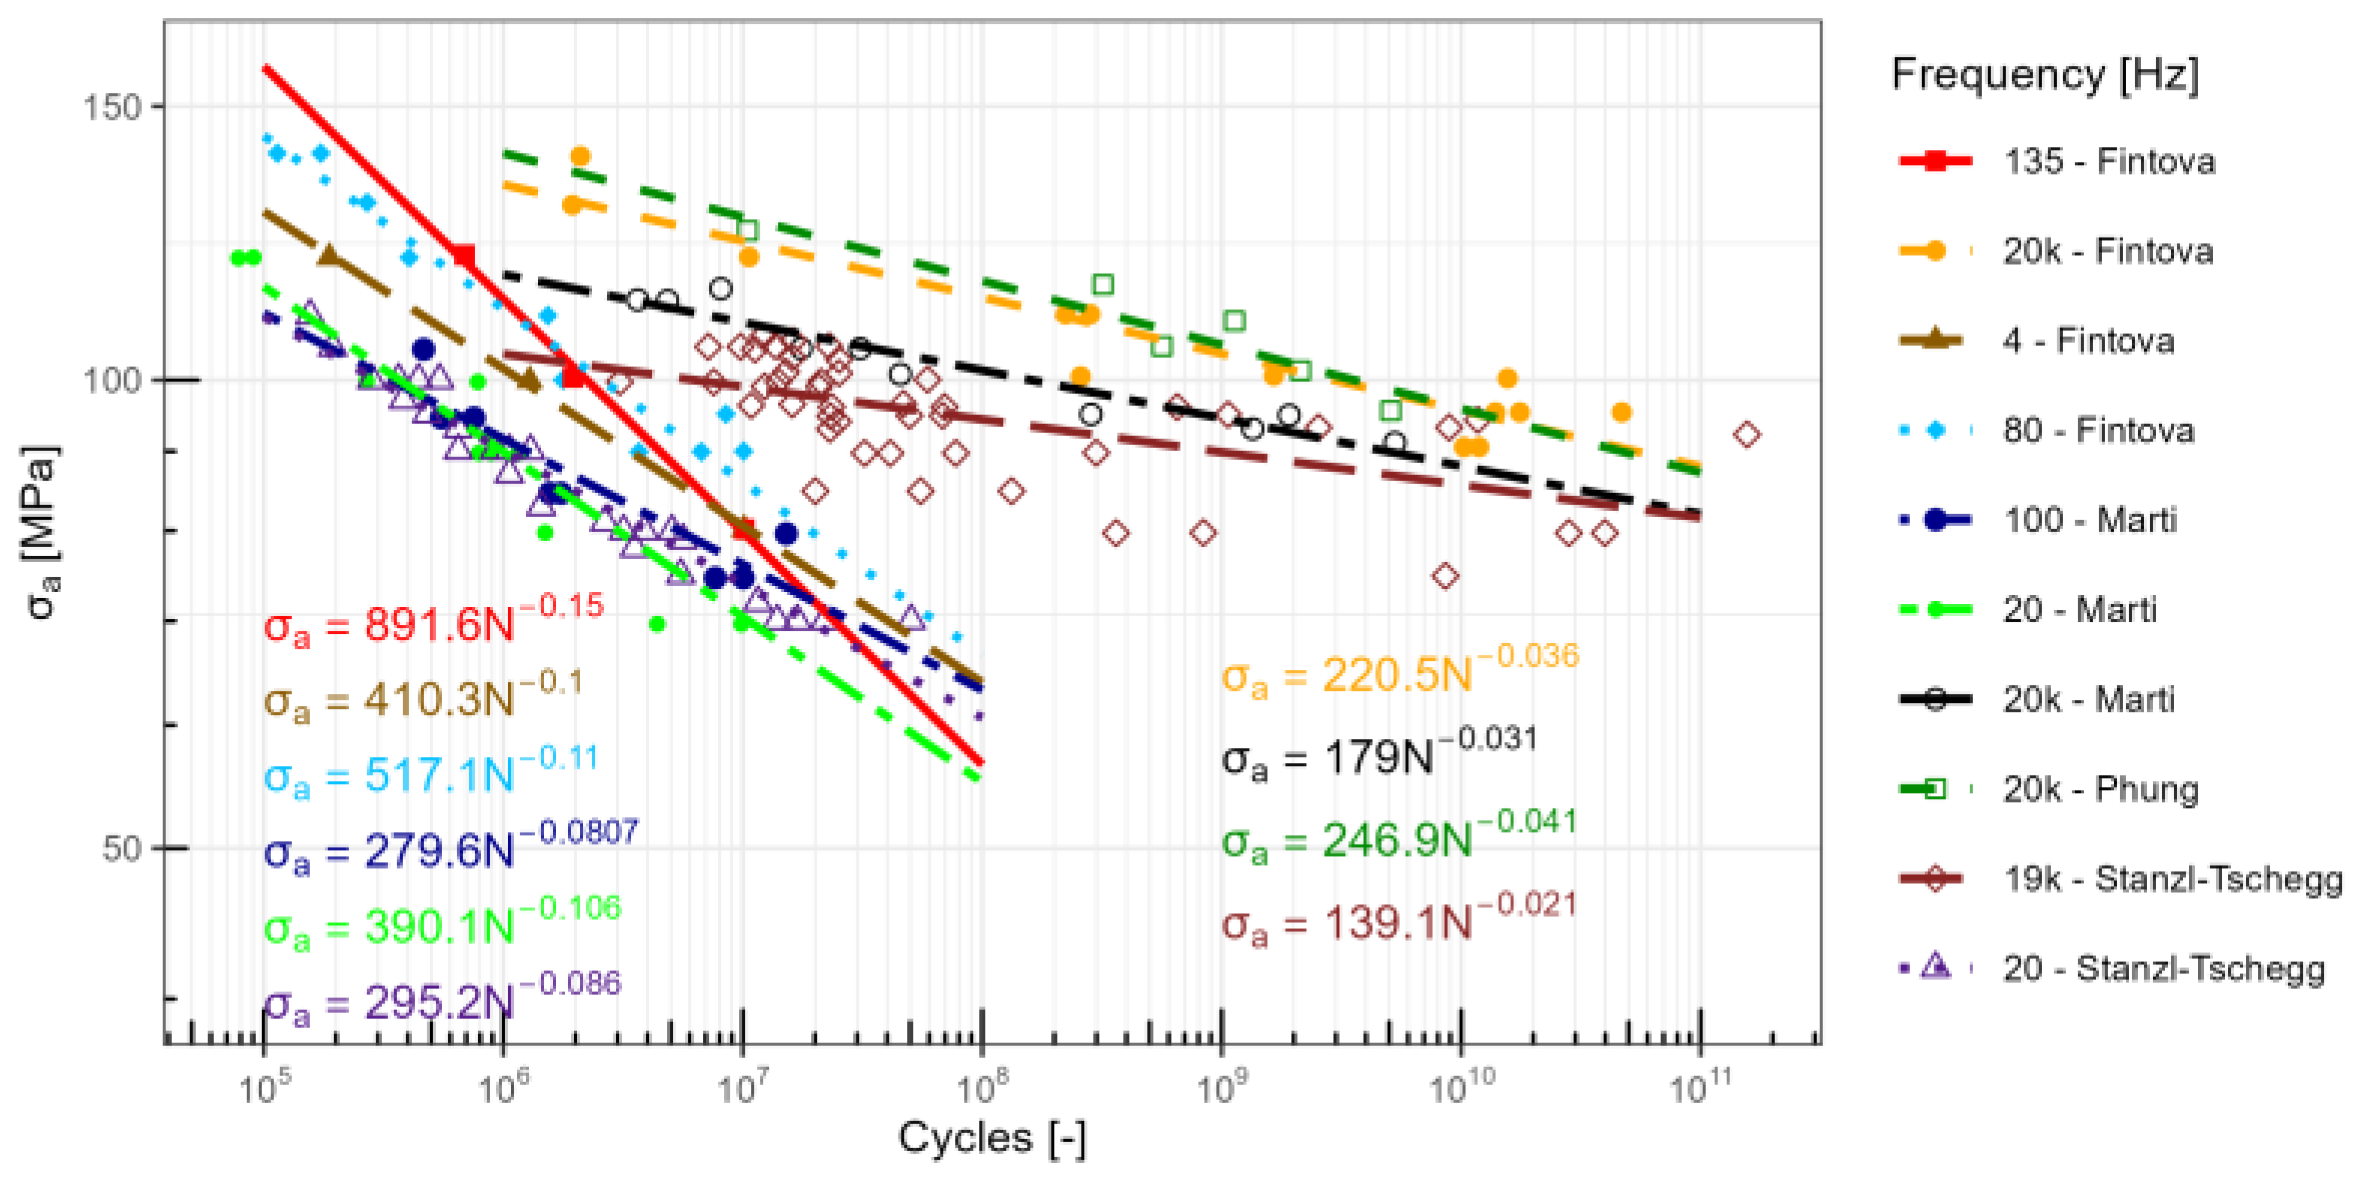
Frequency Factor


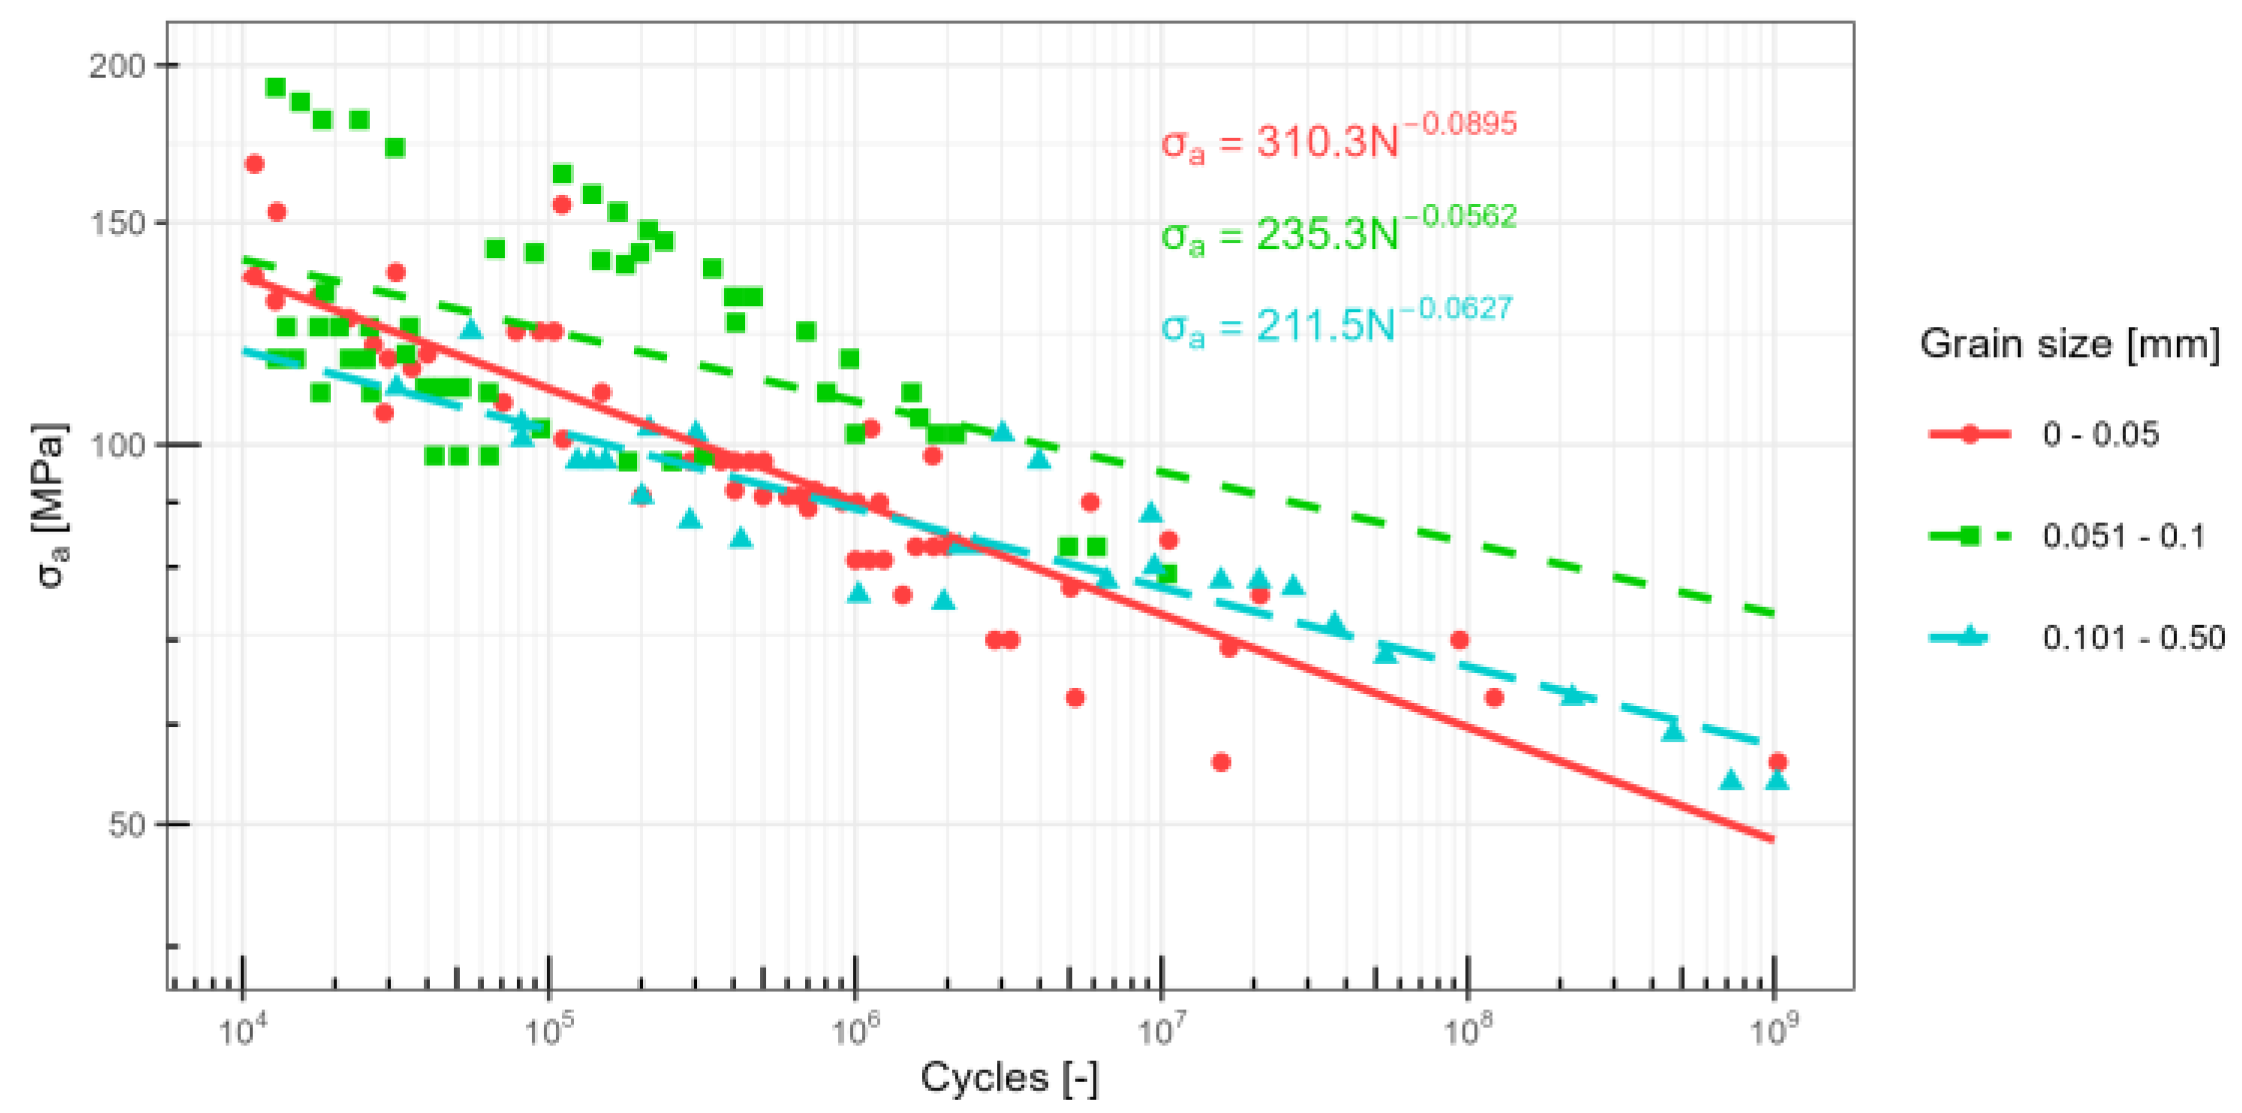
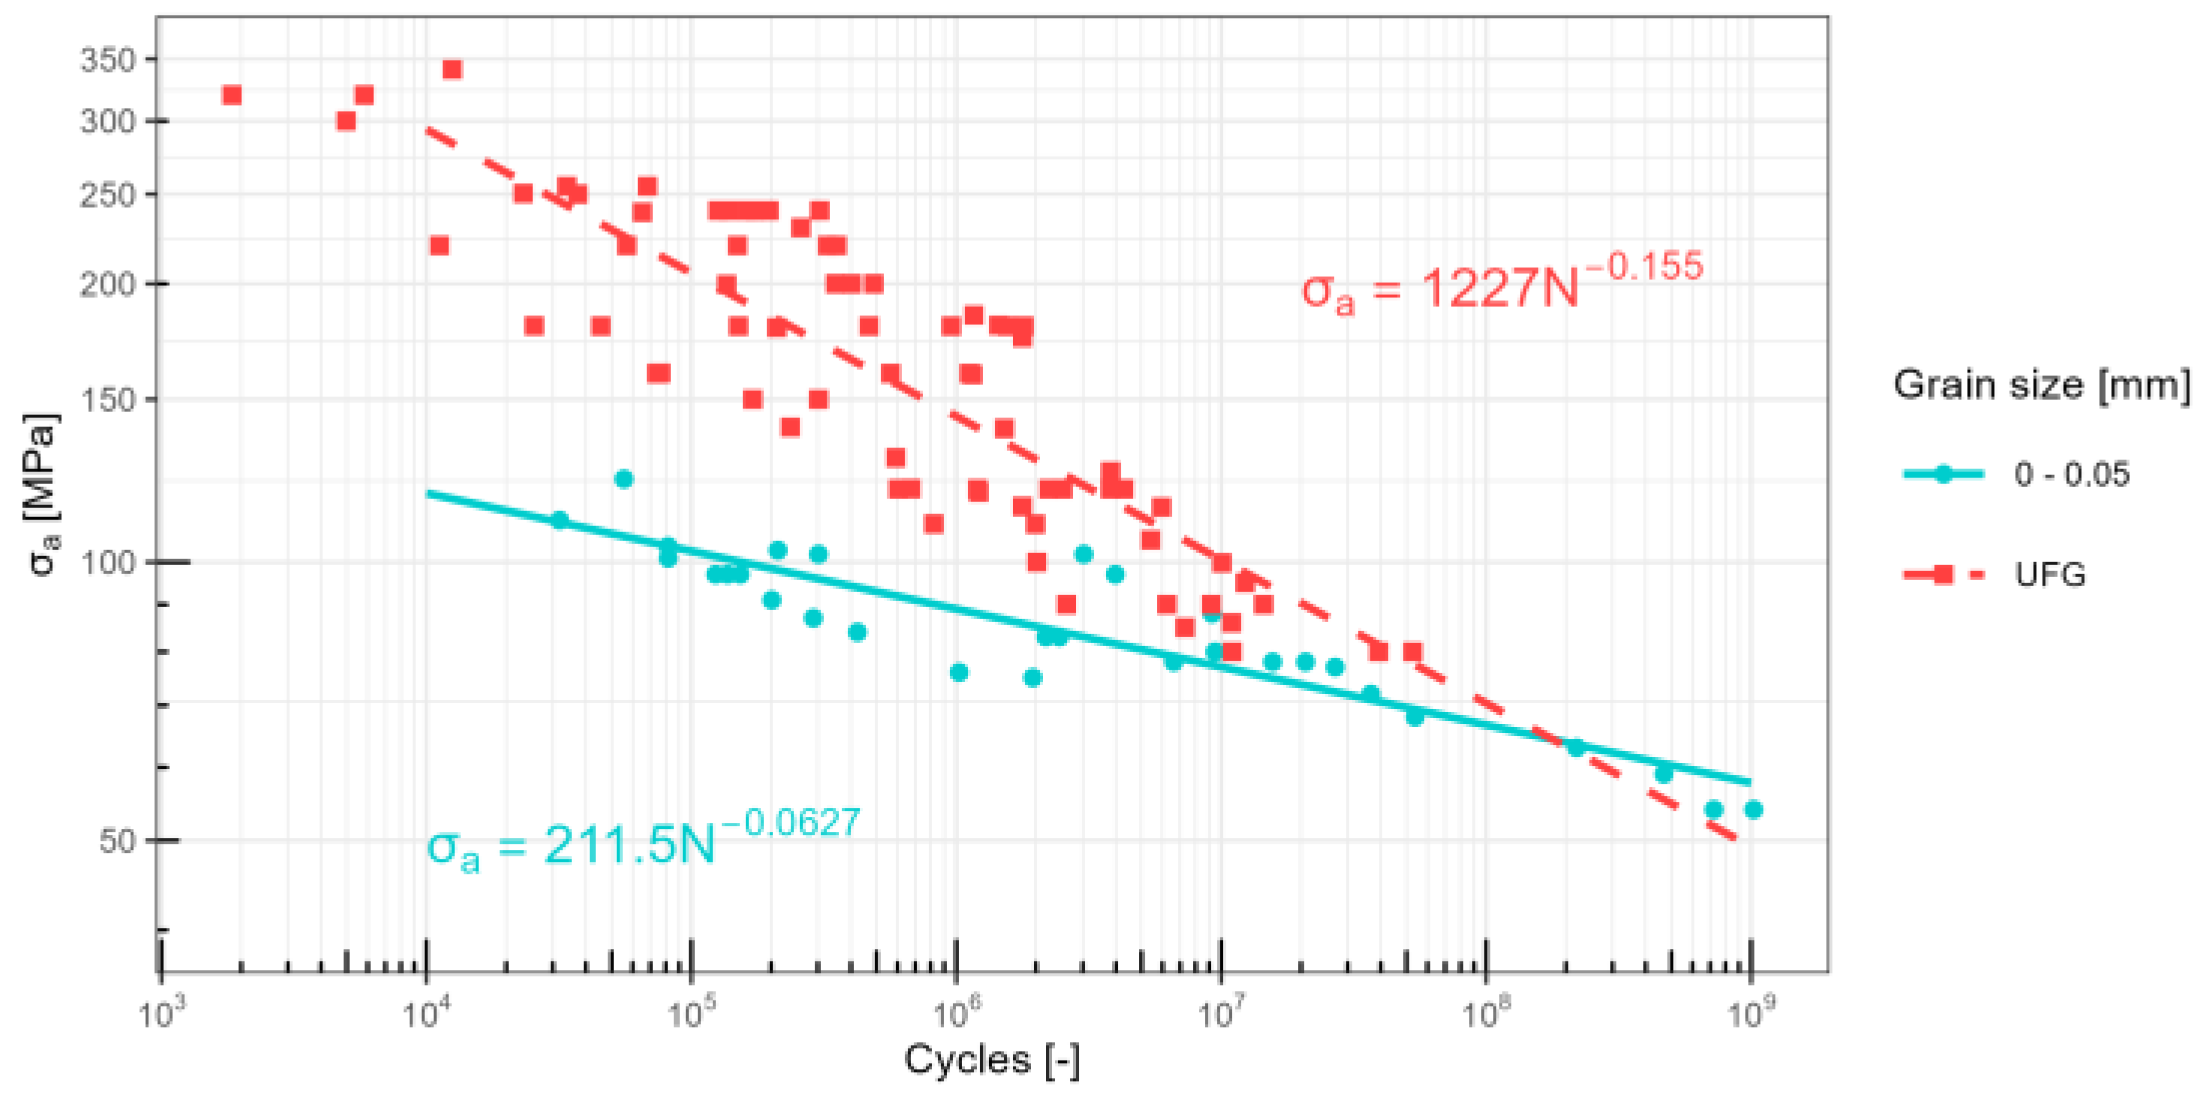
Grain Size Factor

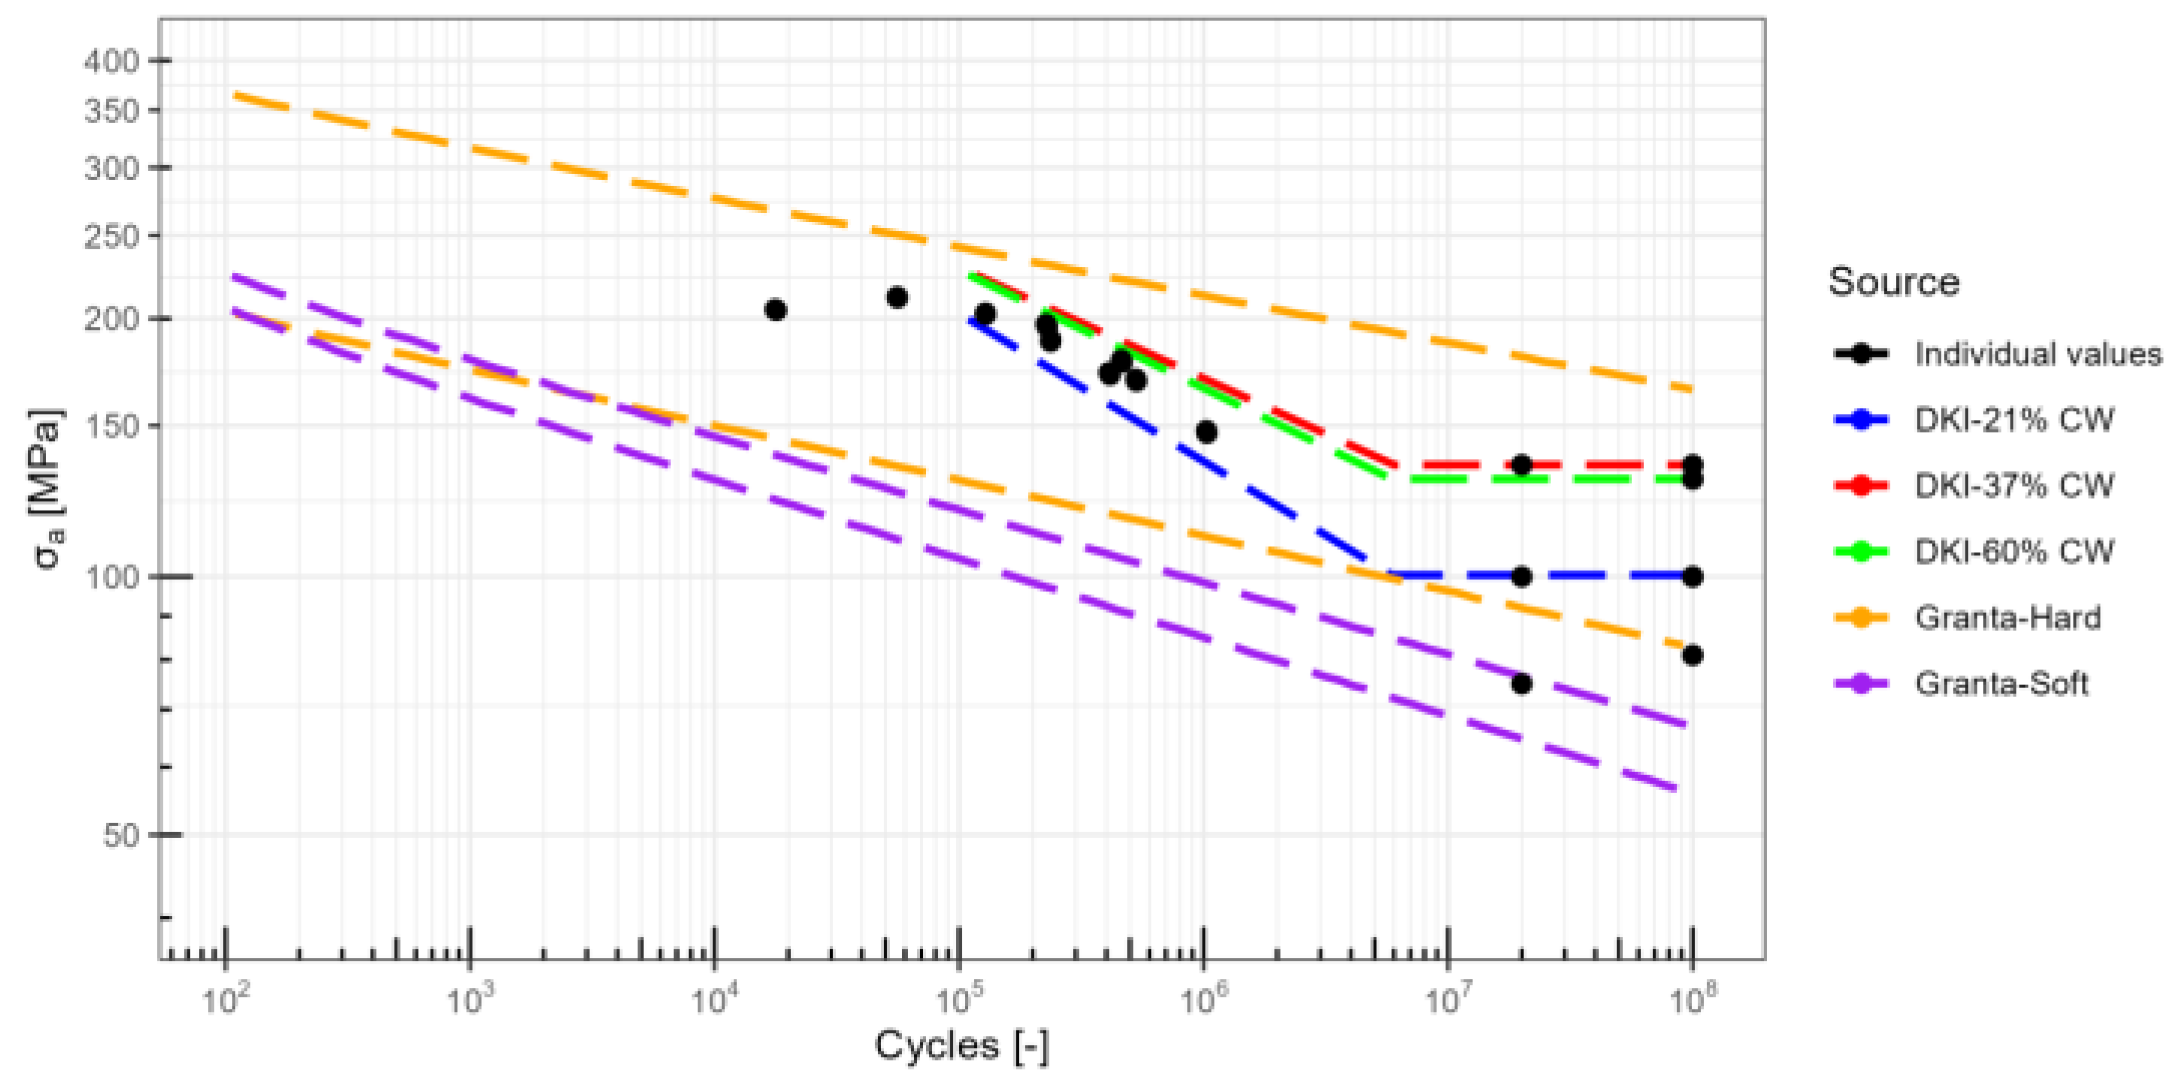
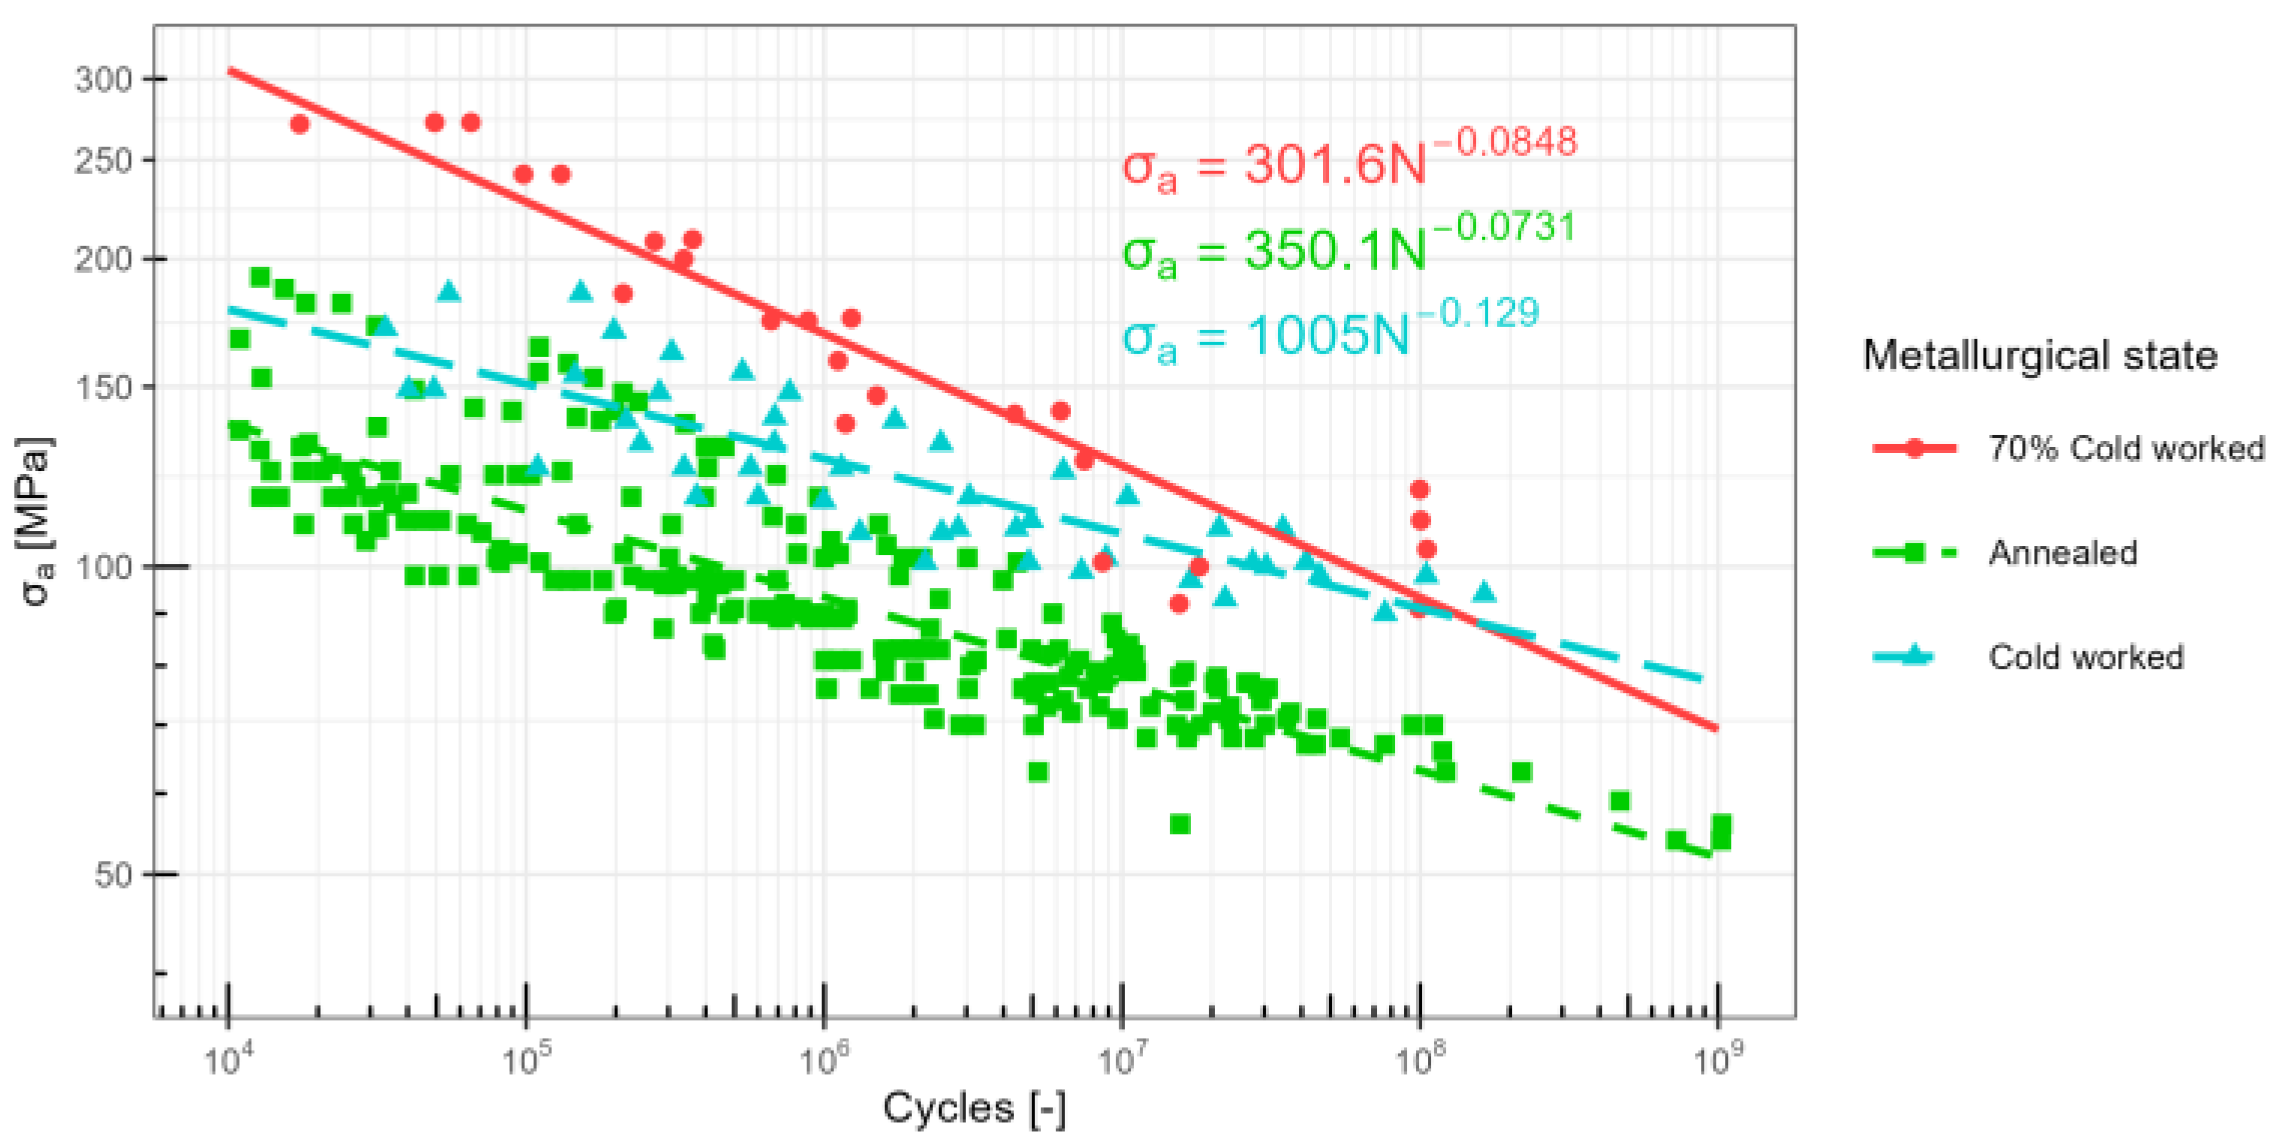
Cold Work Level Factor

Environment Factor

Temperature Factor

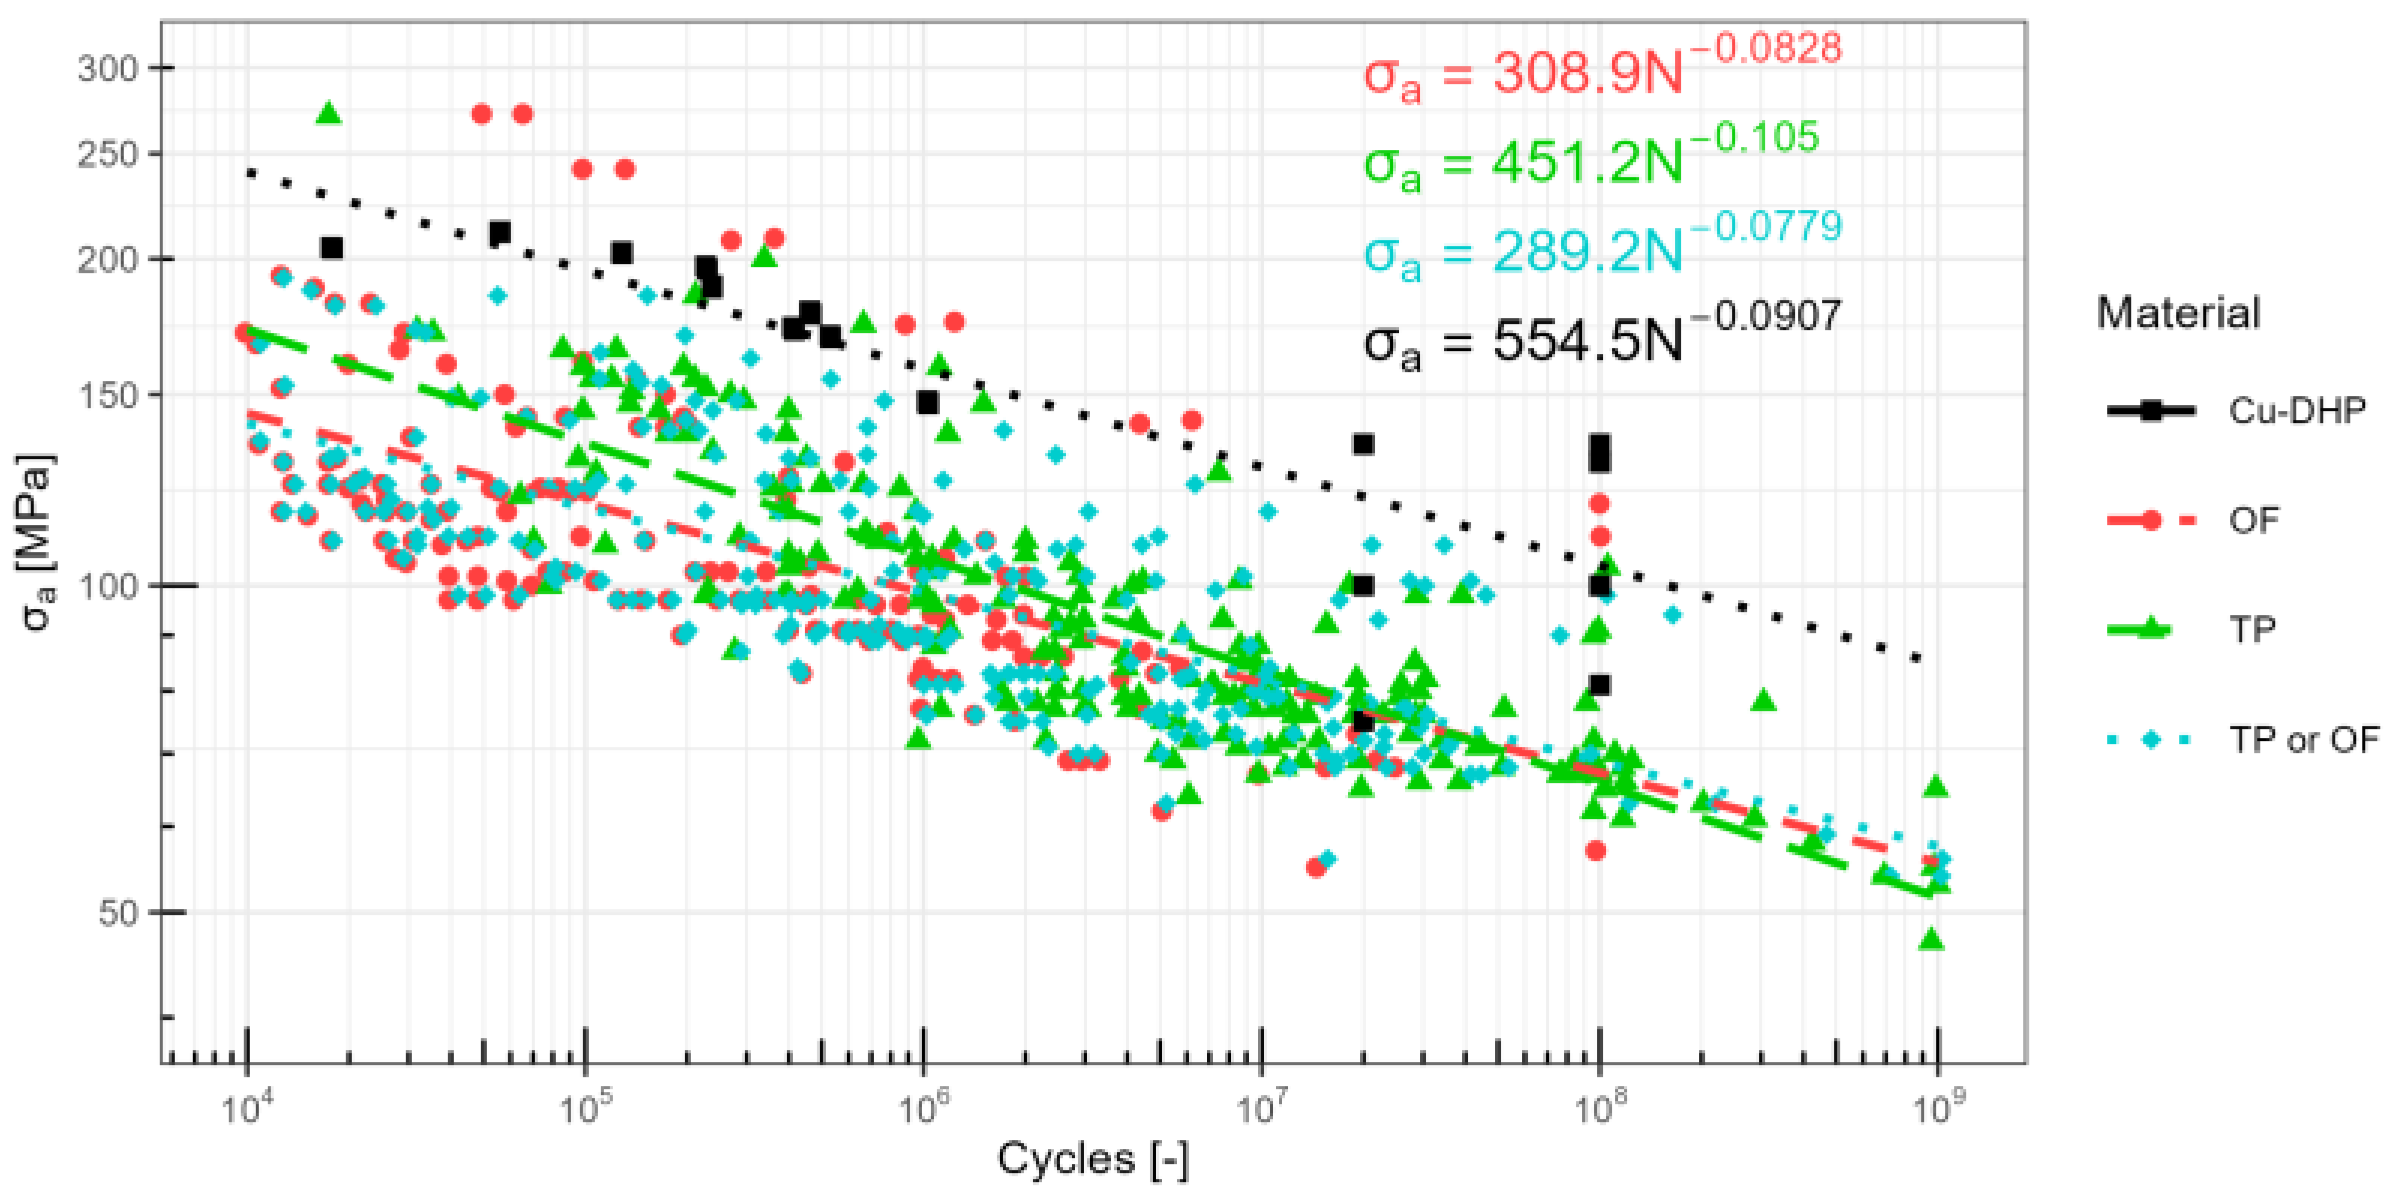
Material Factor
2.1.2. Fatigue strength (Se) and Non-Zero Mean Stress (σm ≠ 0)
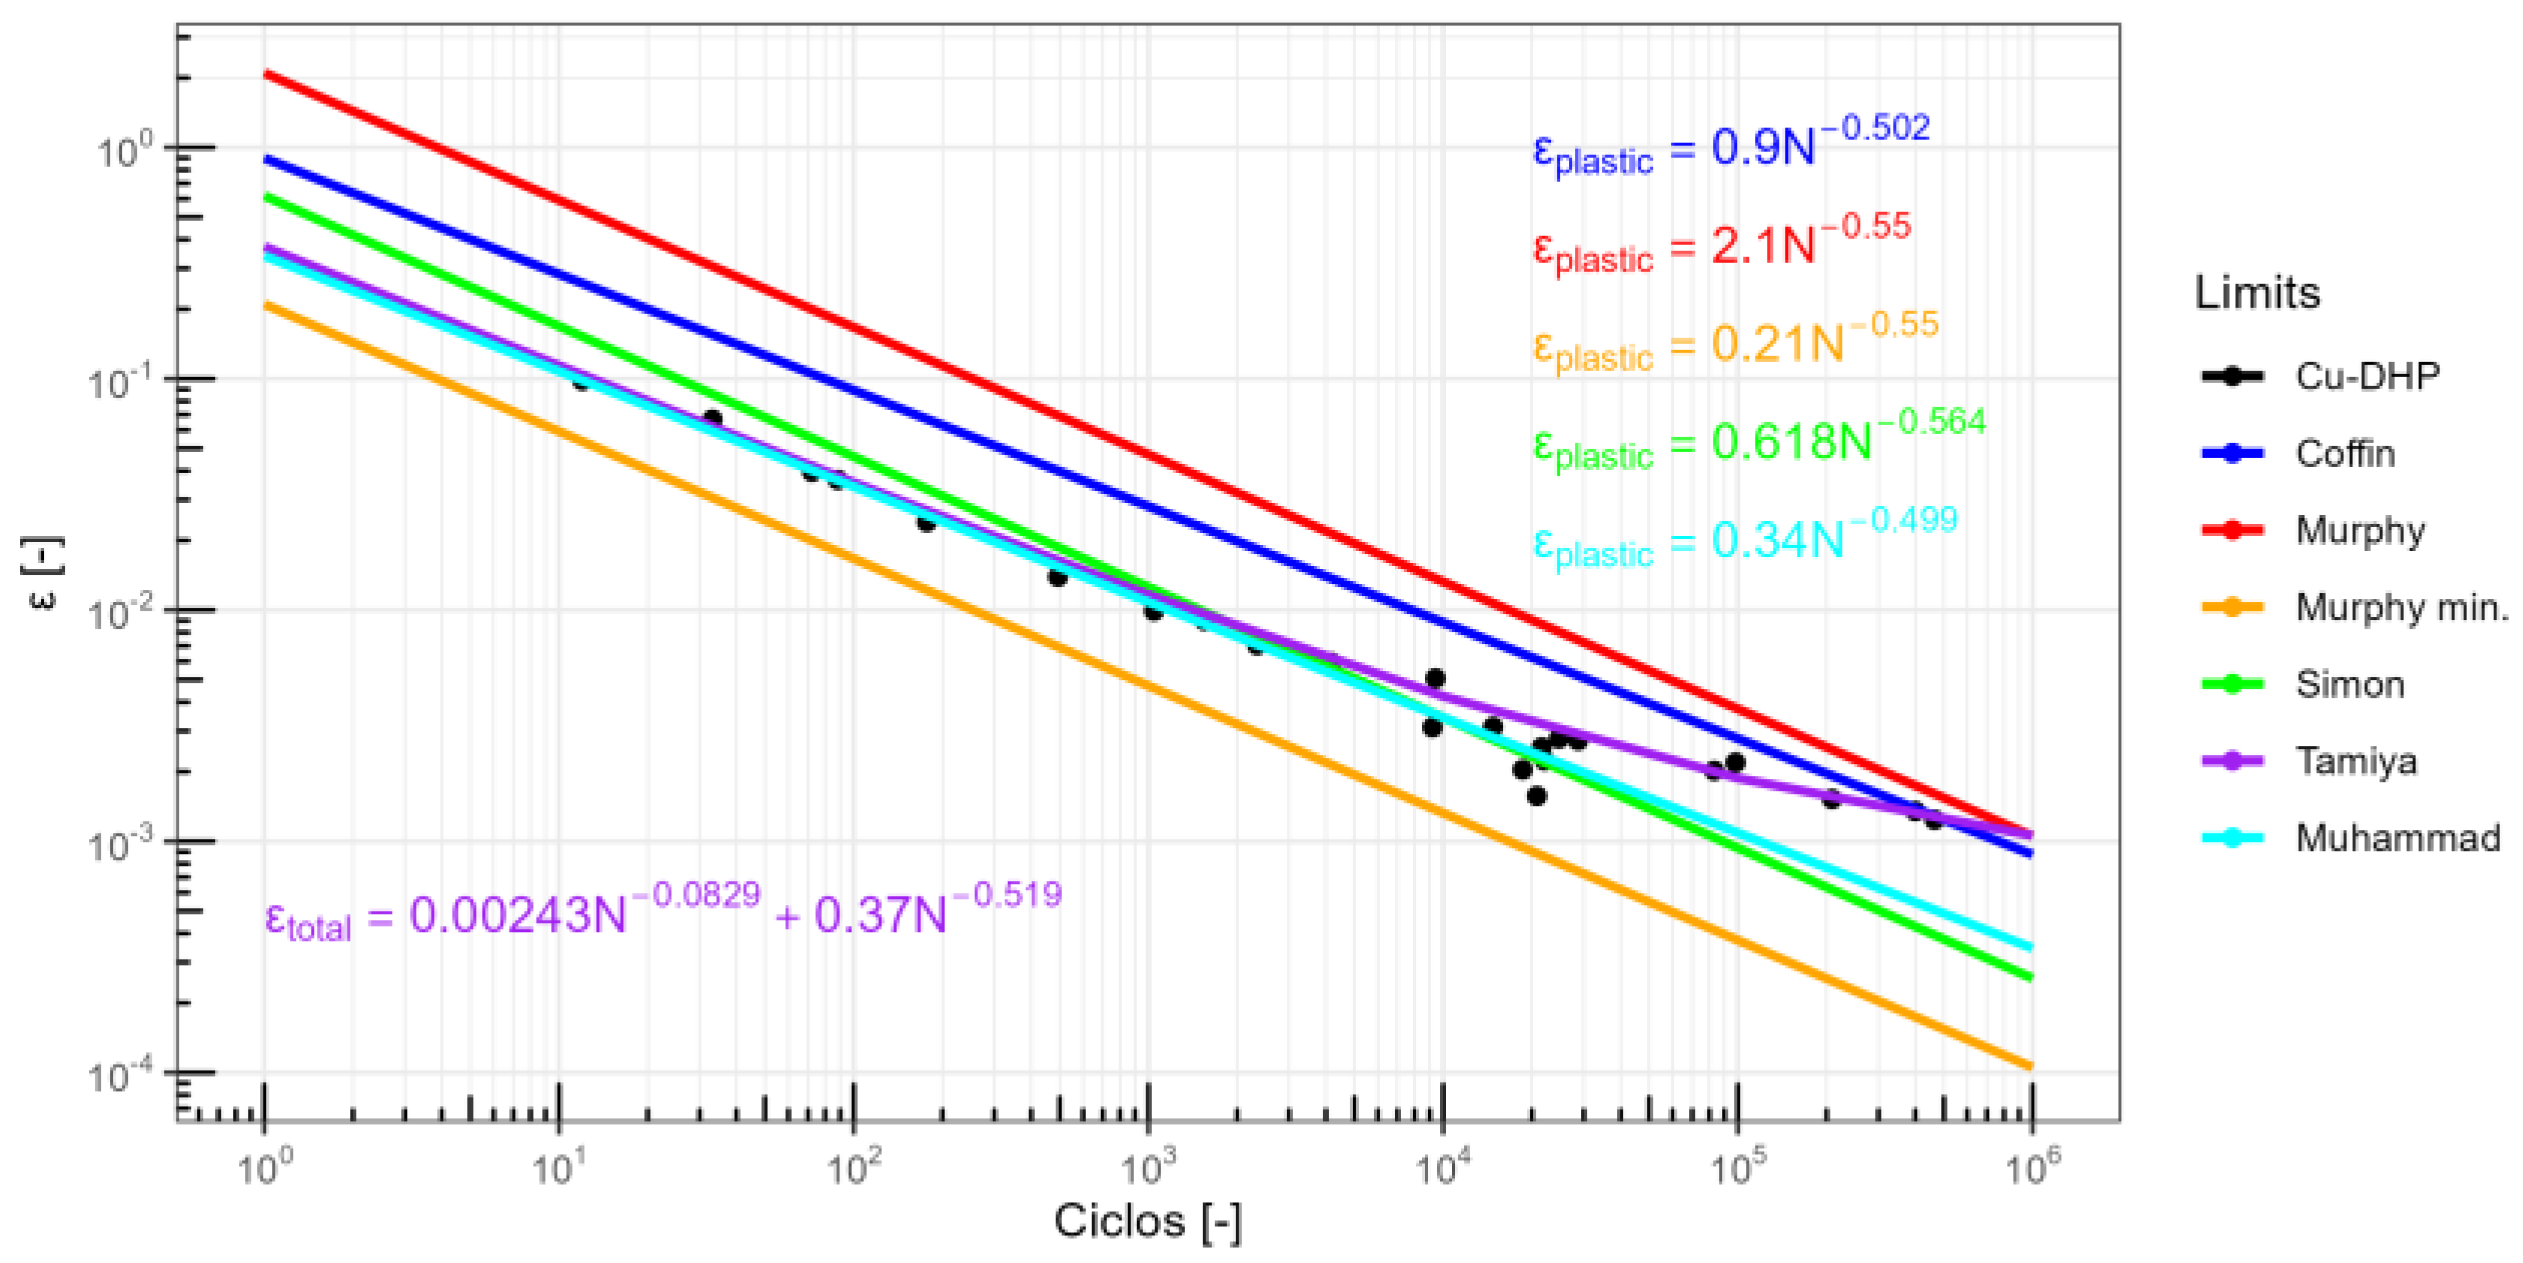
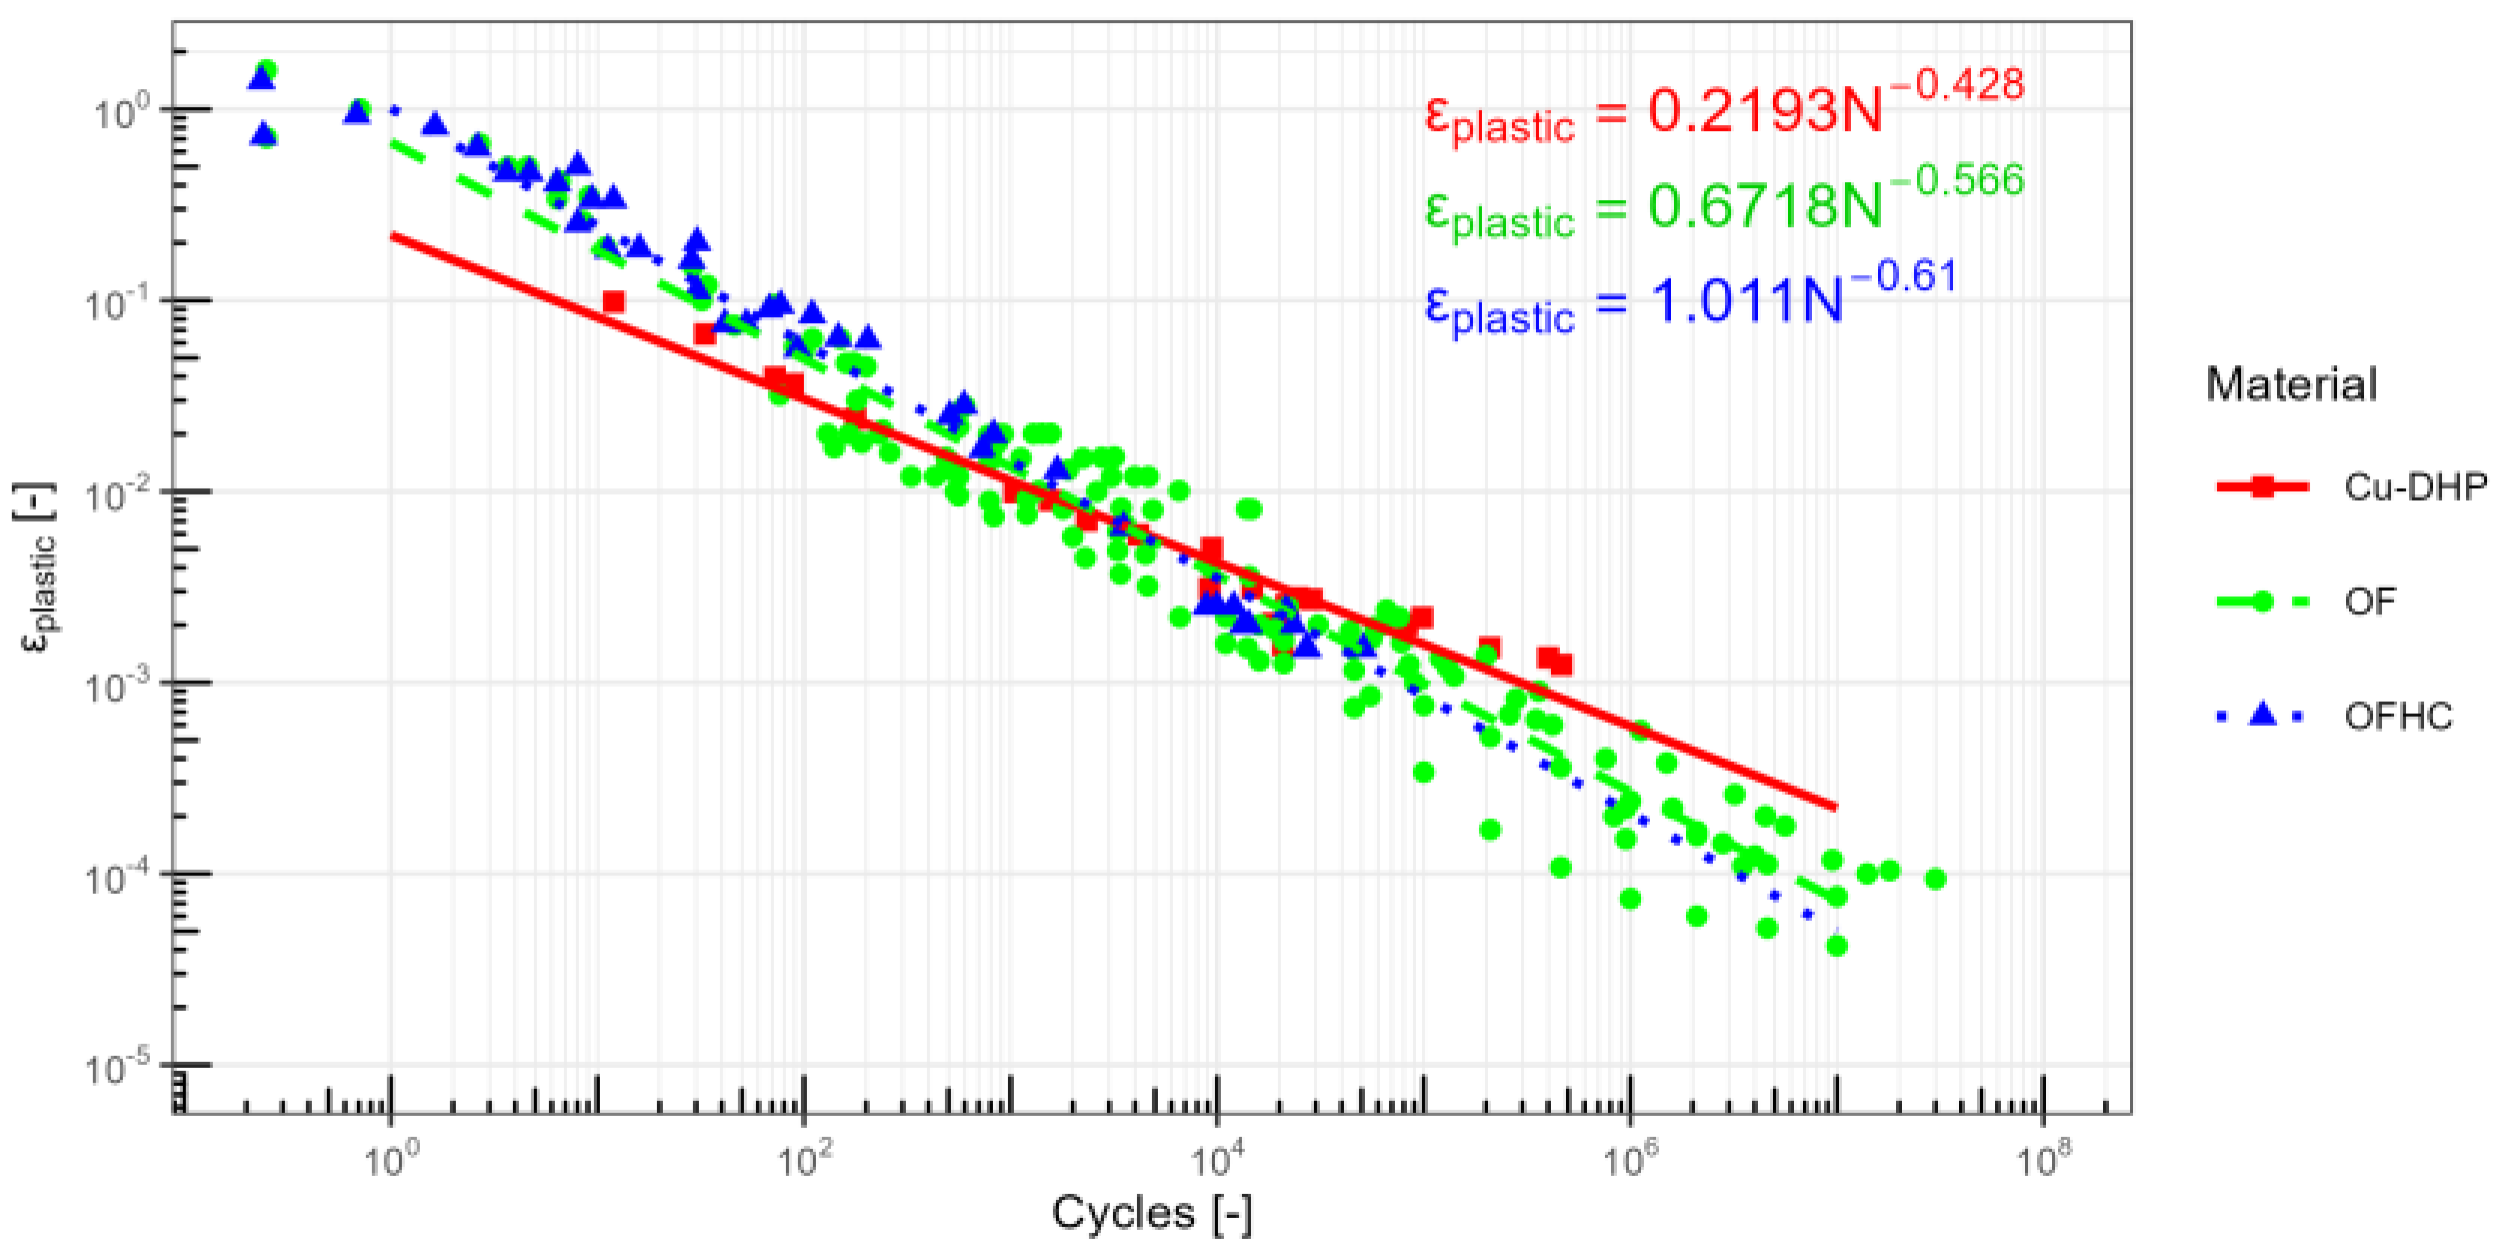
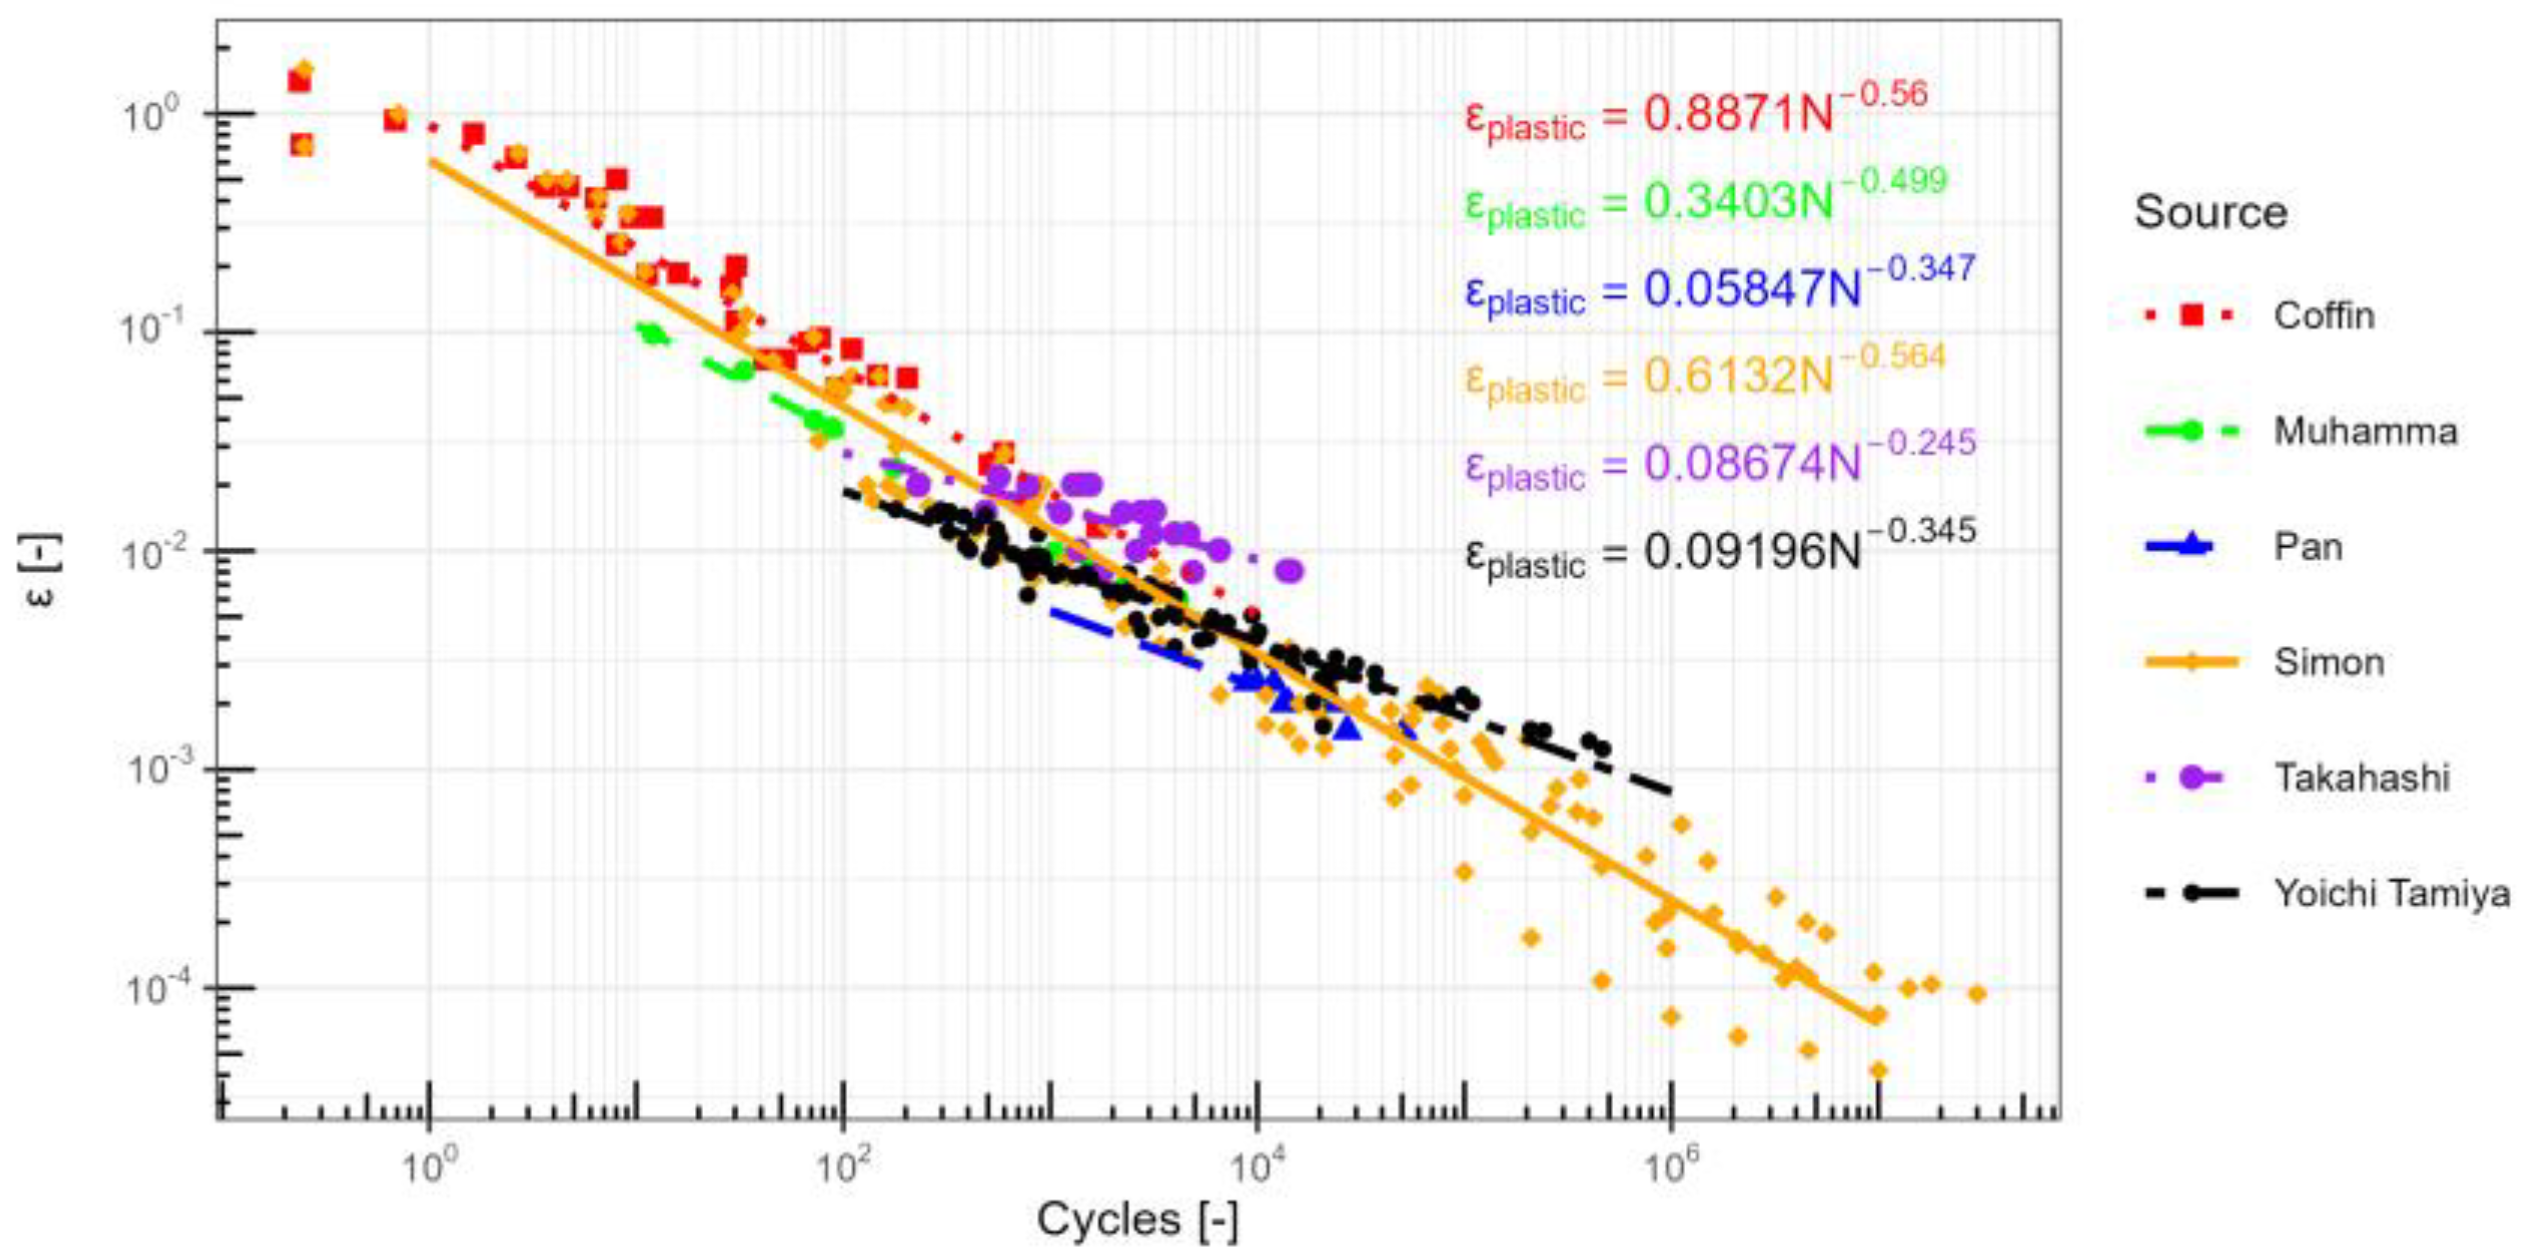
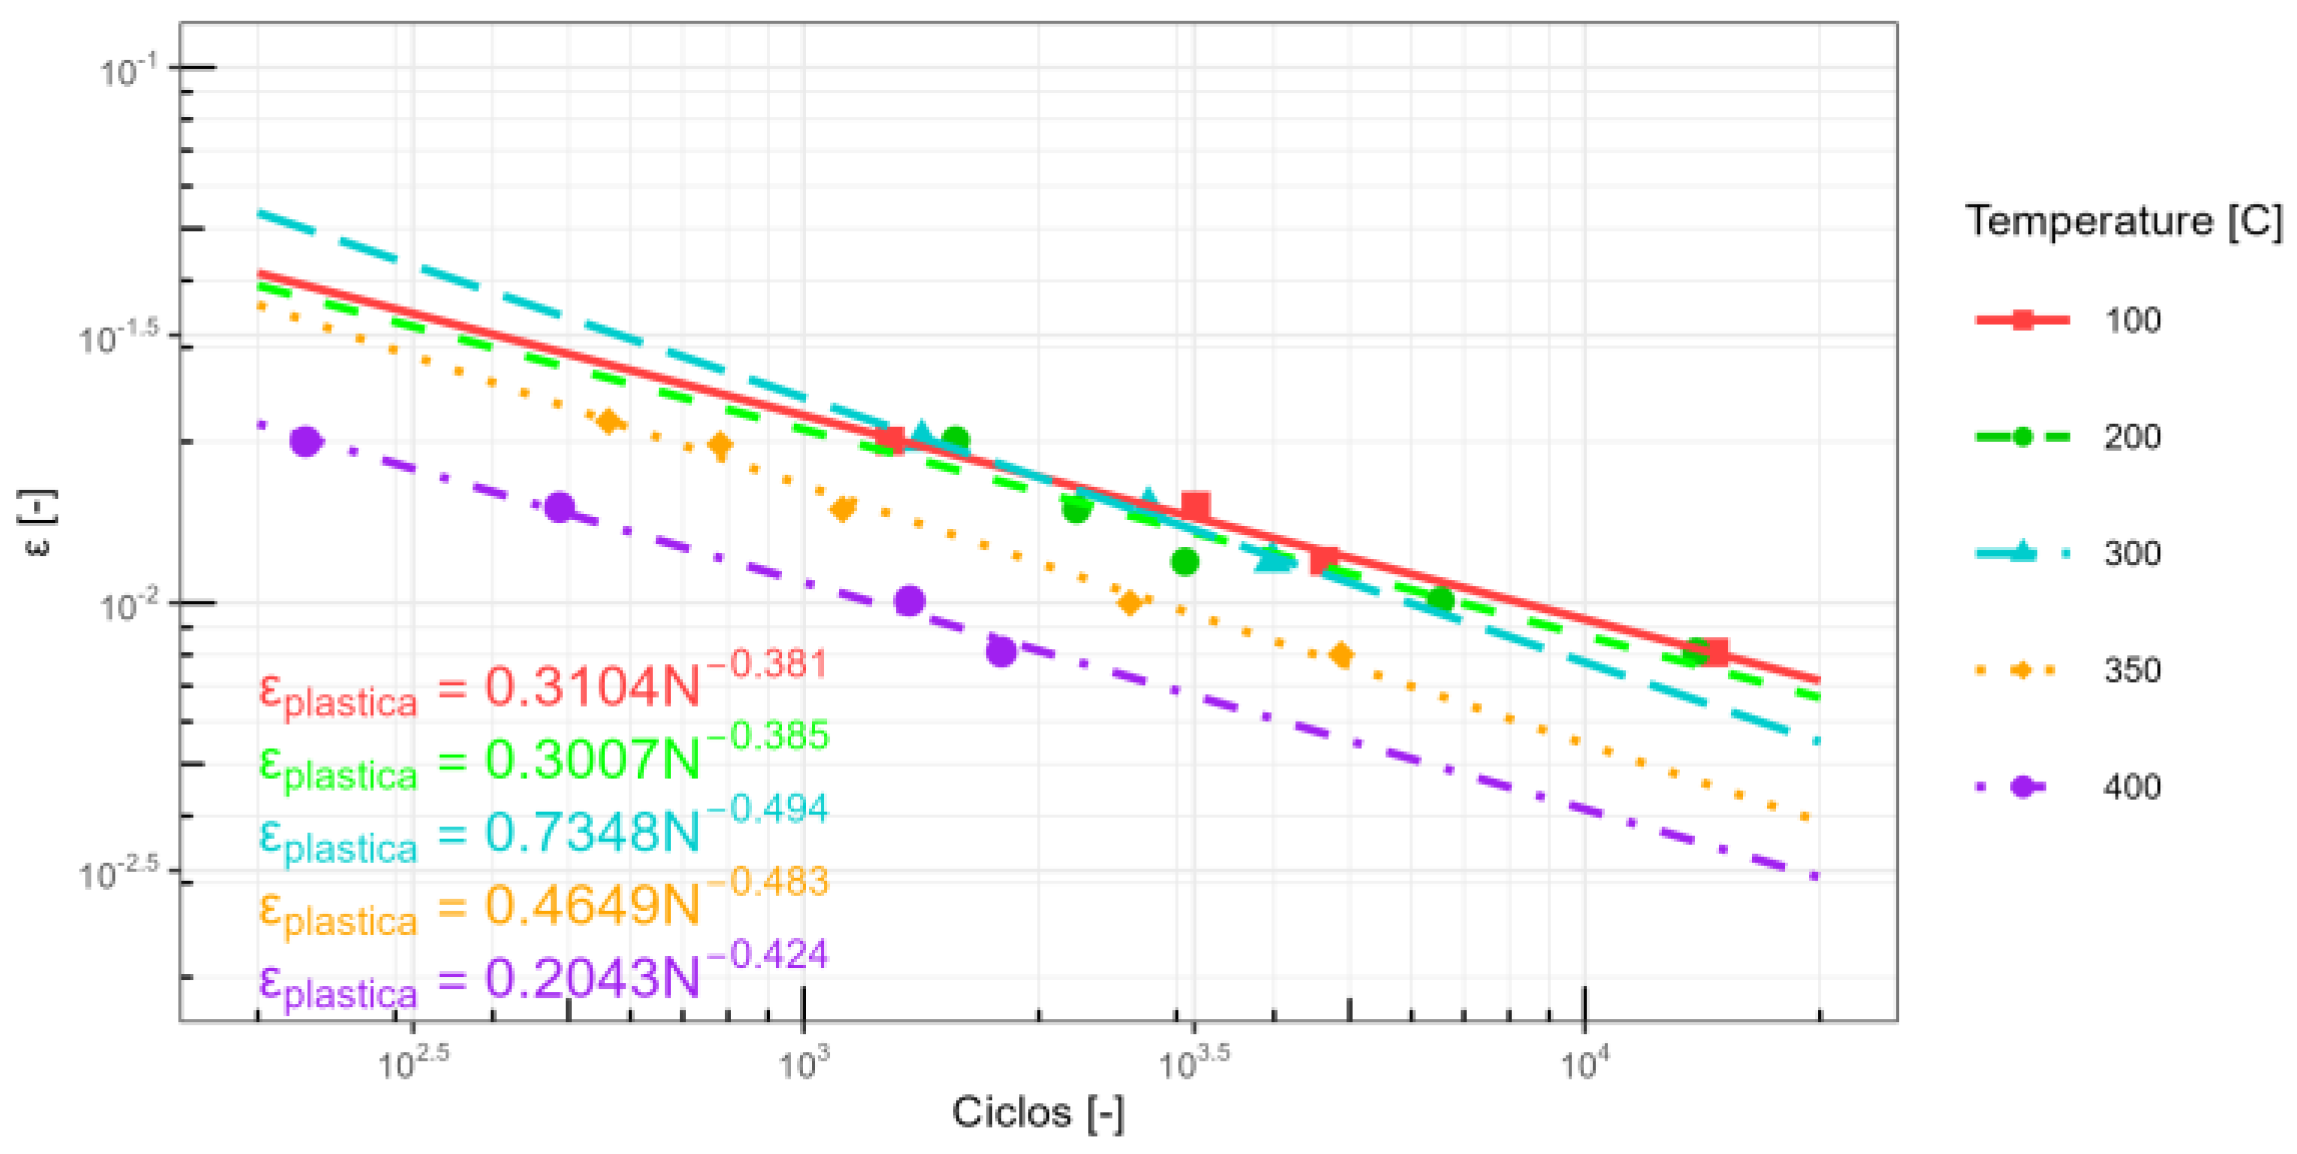
2.2. Low Cycle Fatigue (LCF): Strain–Life (ε-N) Approach to Predict the Fatigue Damage
Strain Data
3. Other Factors
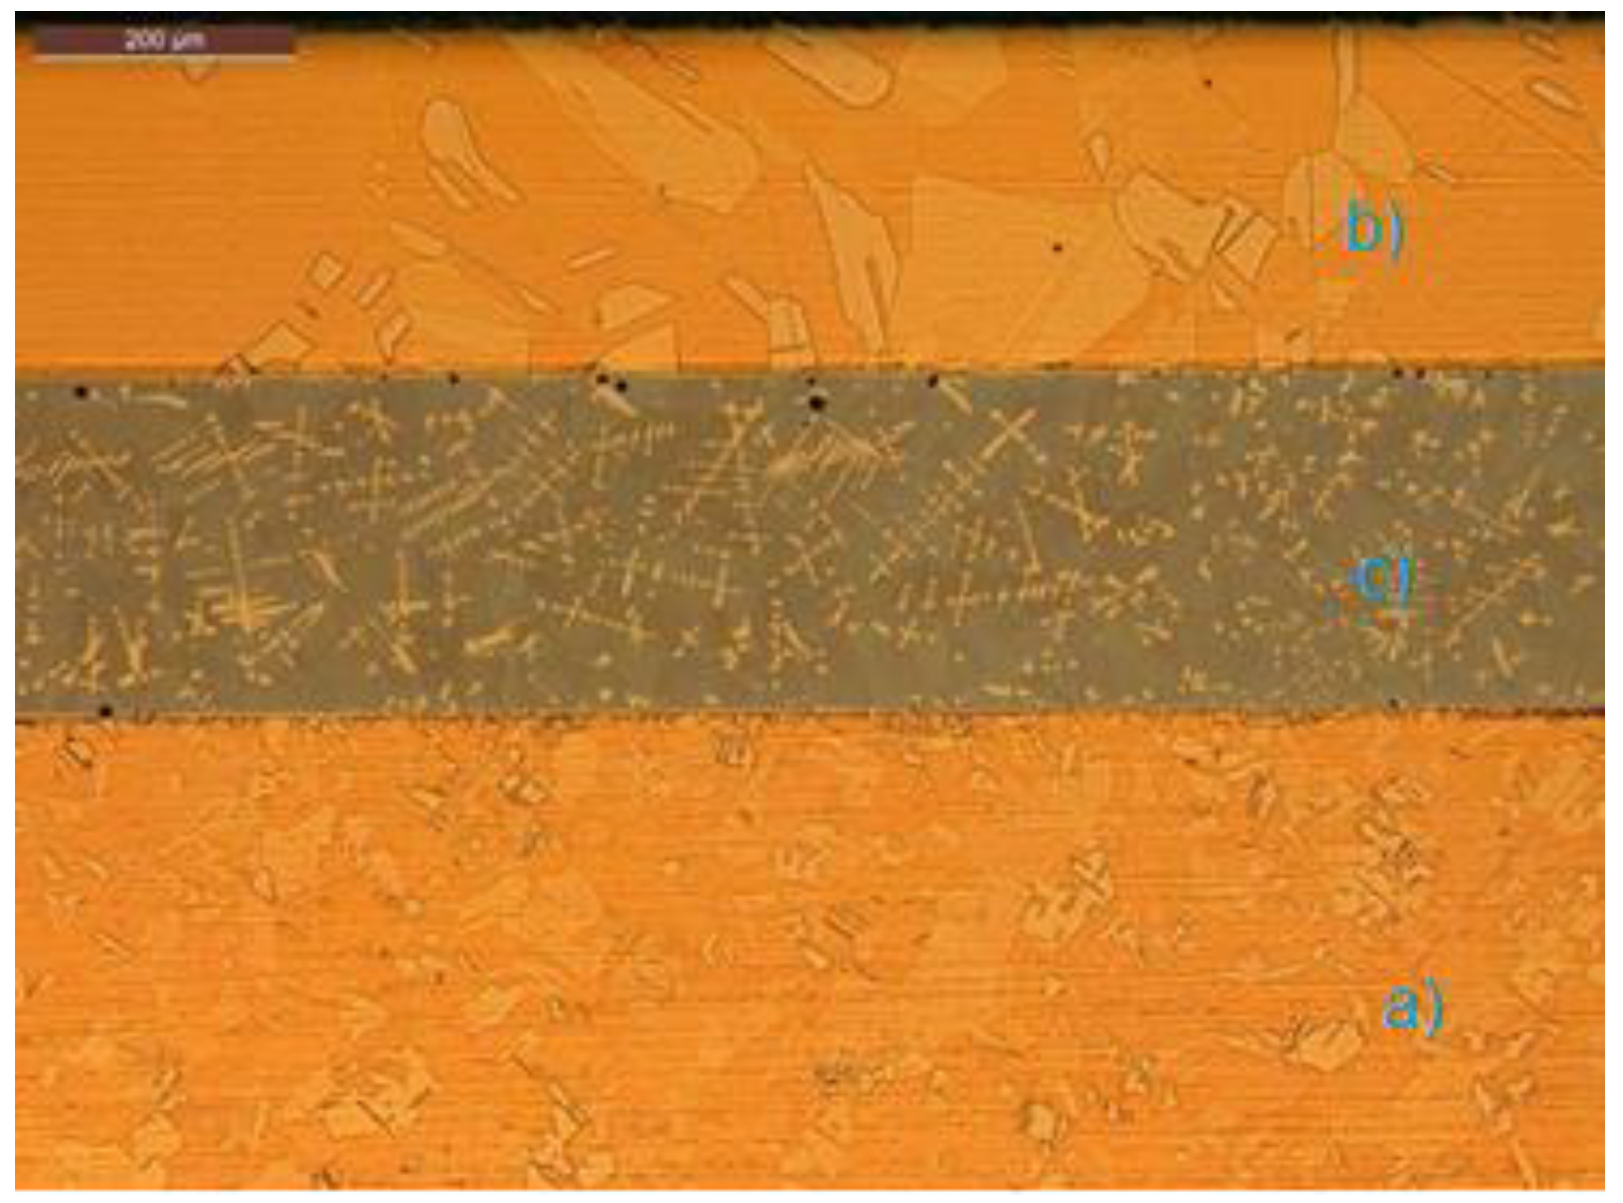
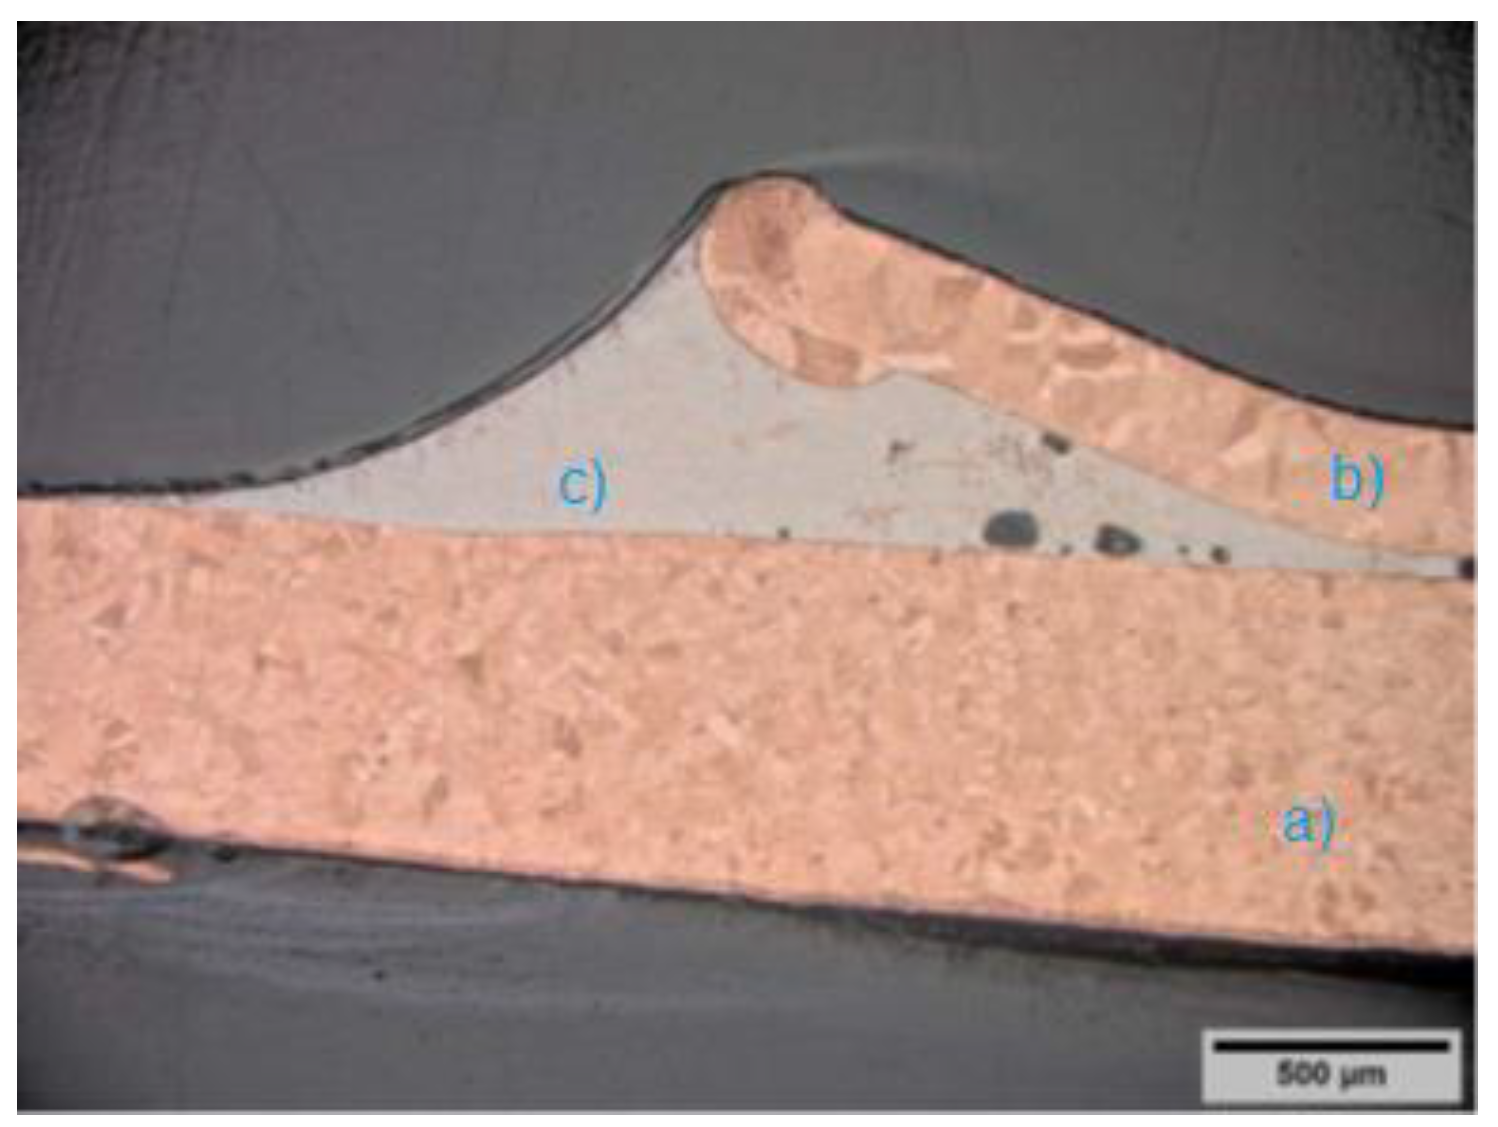
3.1. Brazing Zone
3.1.1. Heat-Affected Zone
3.1.2. Liquid Metal Embrittlement
3.1.3. Stress Concentration
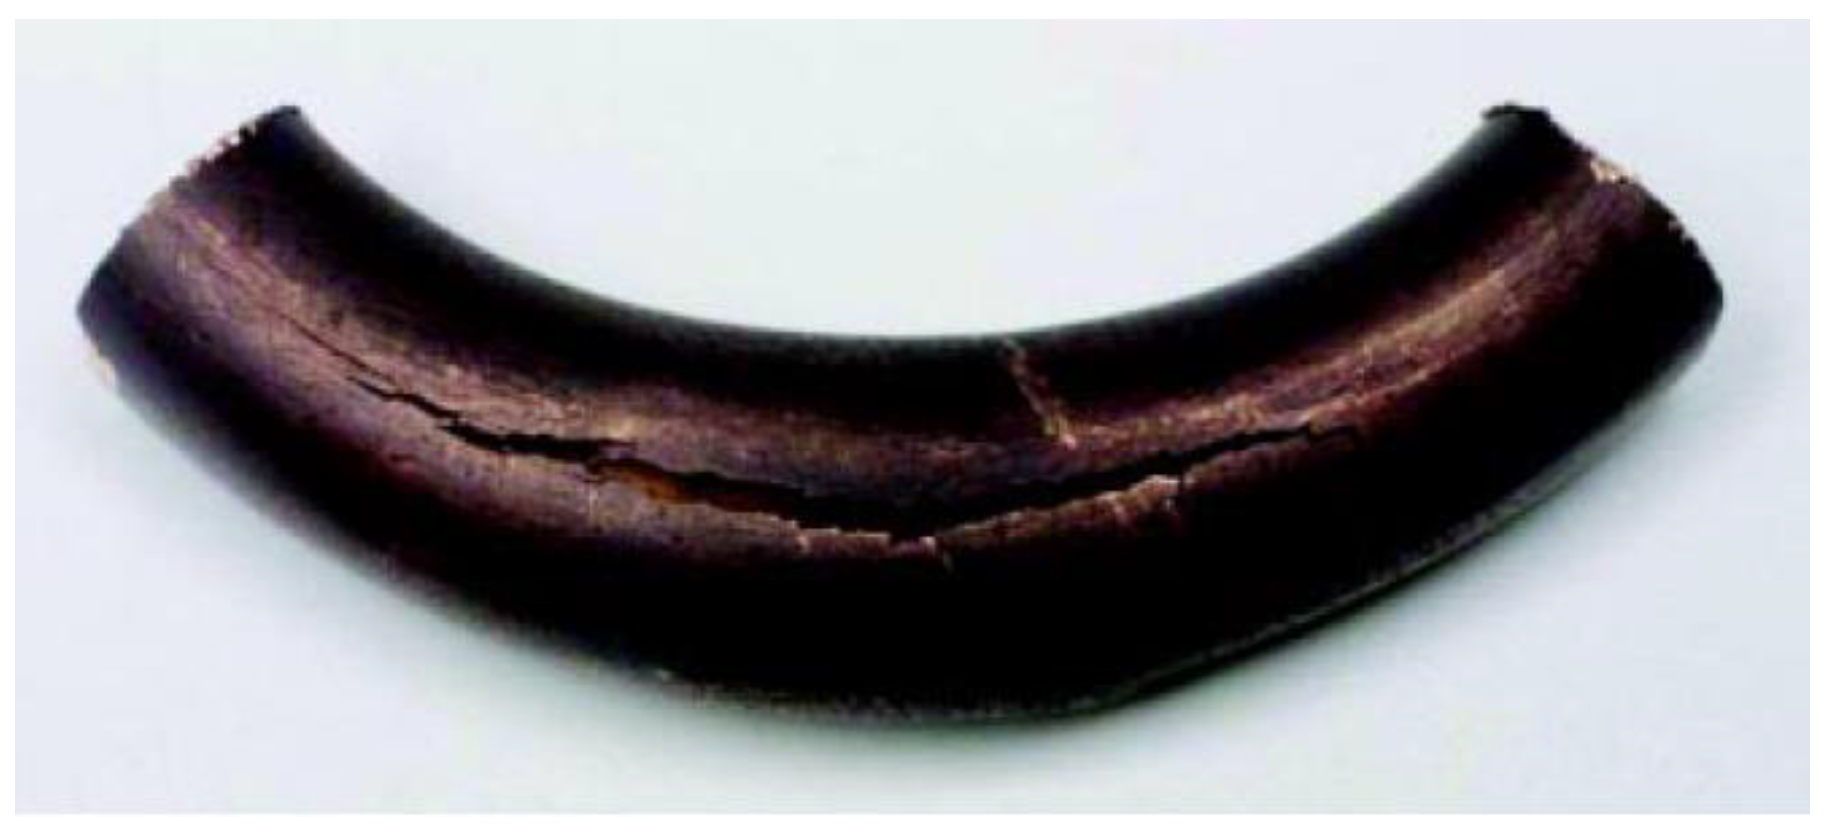
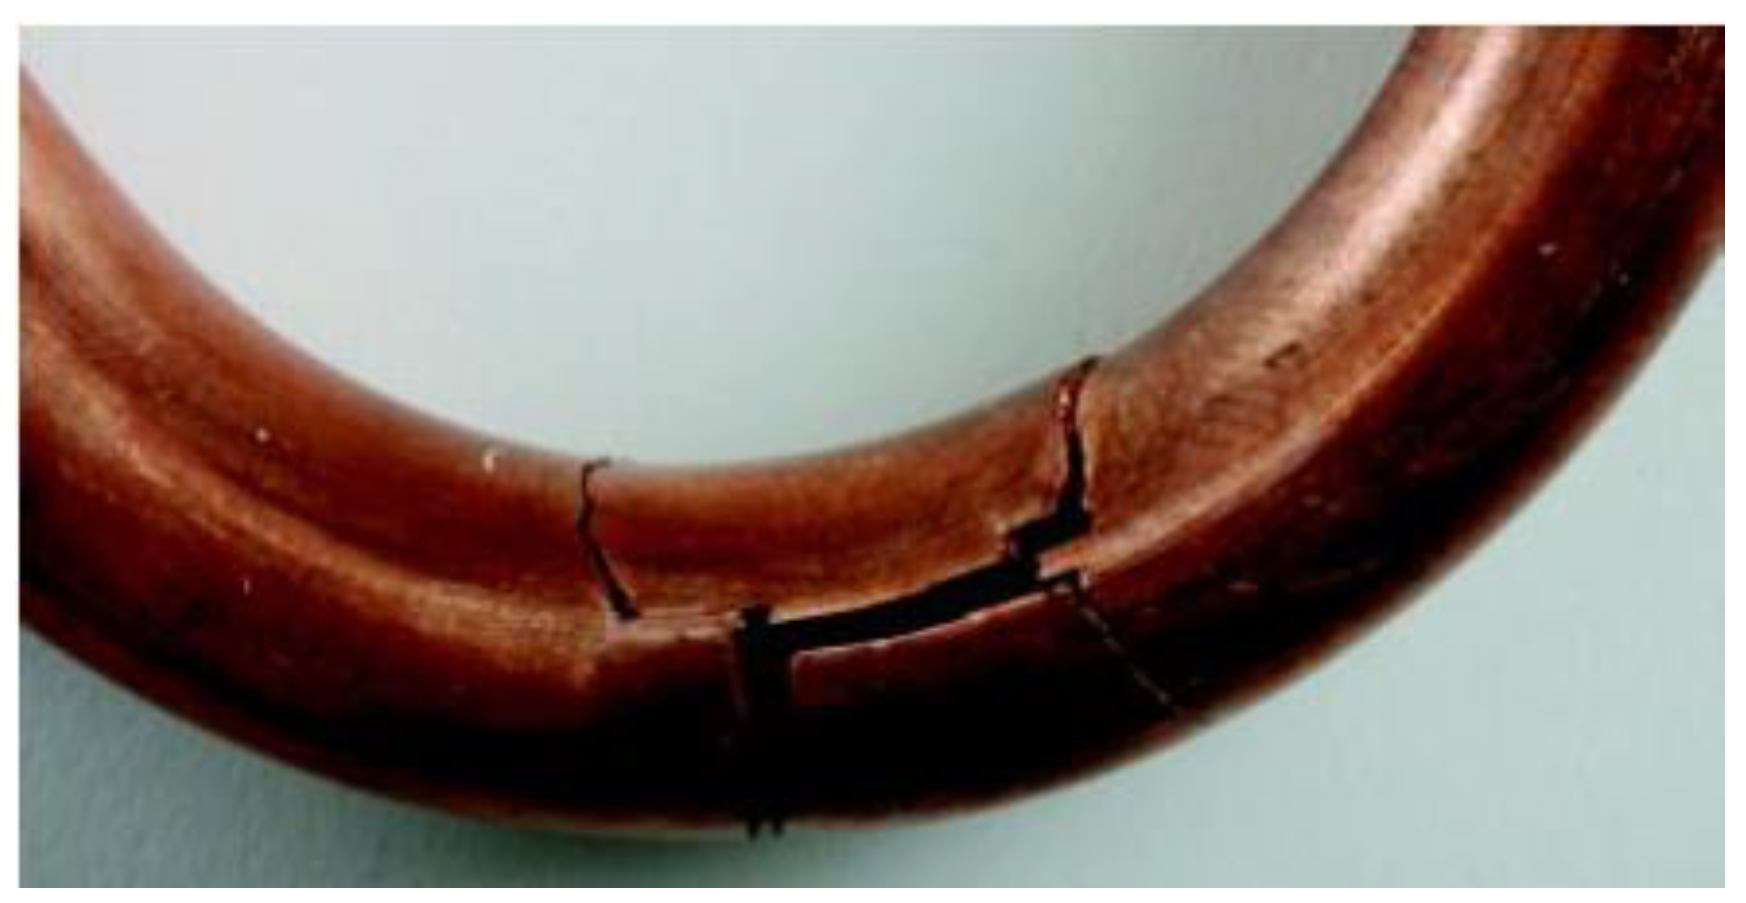
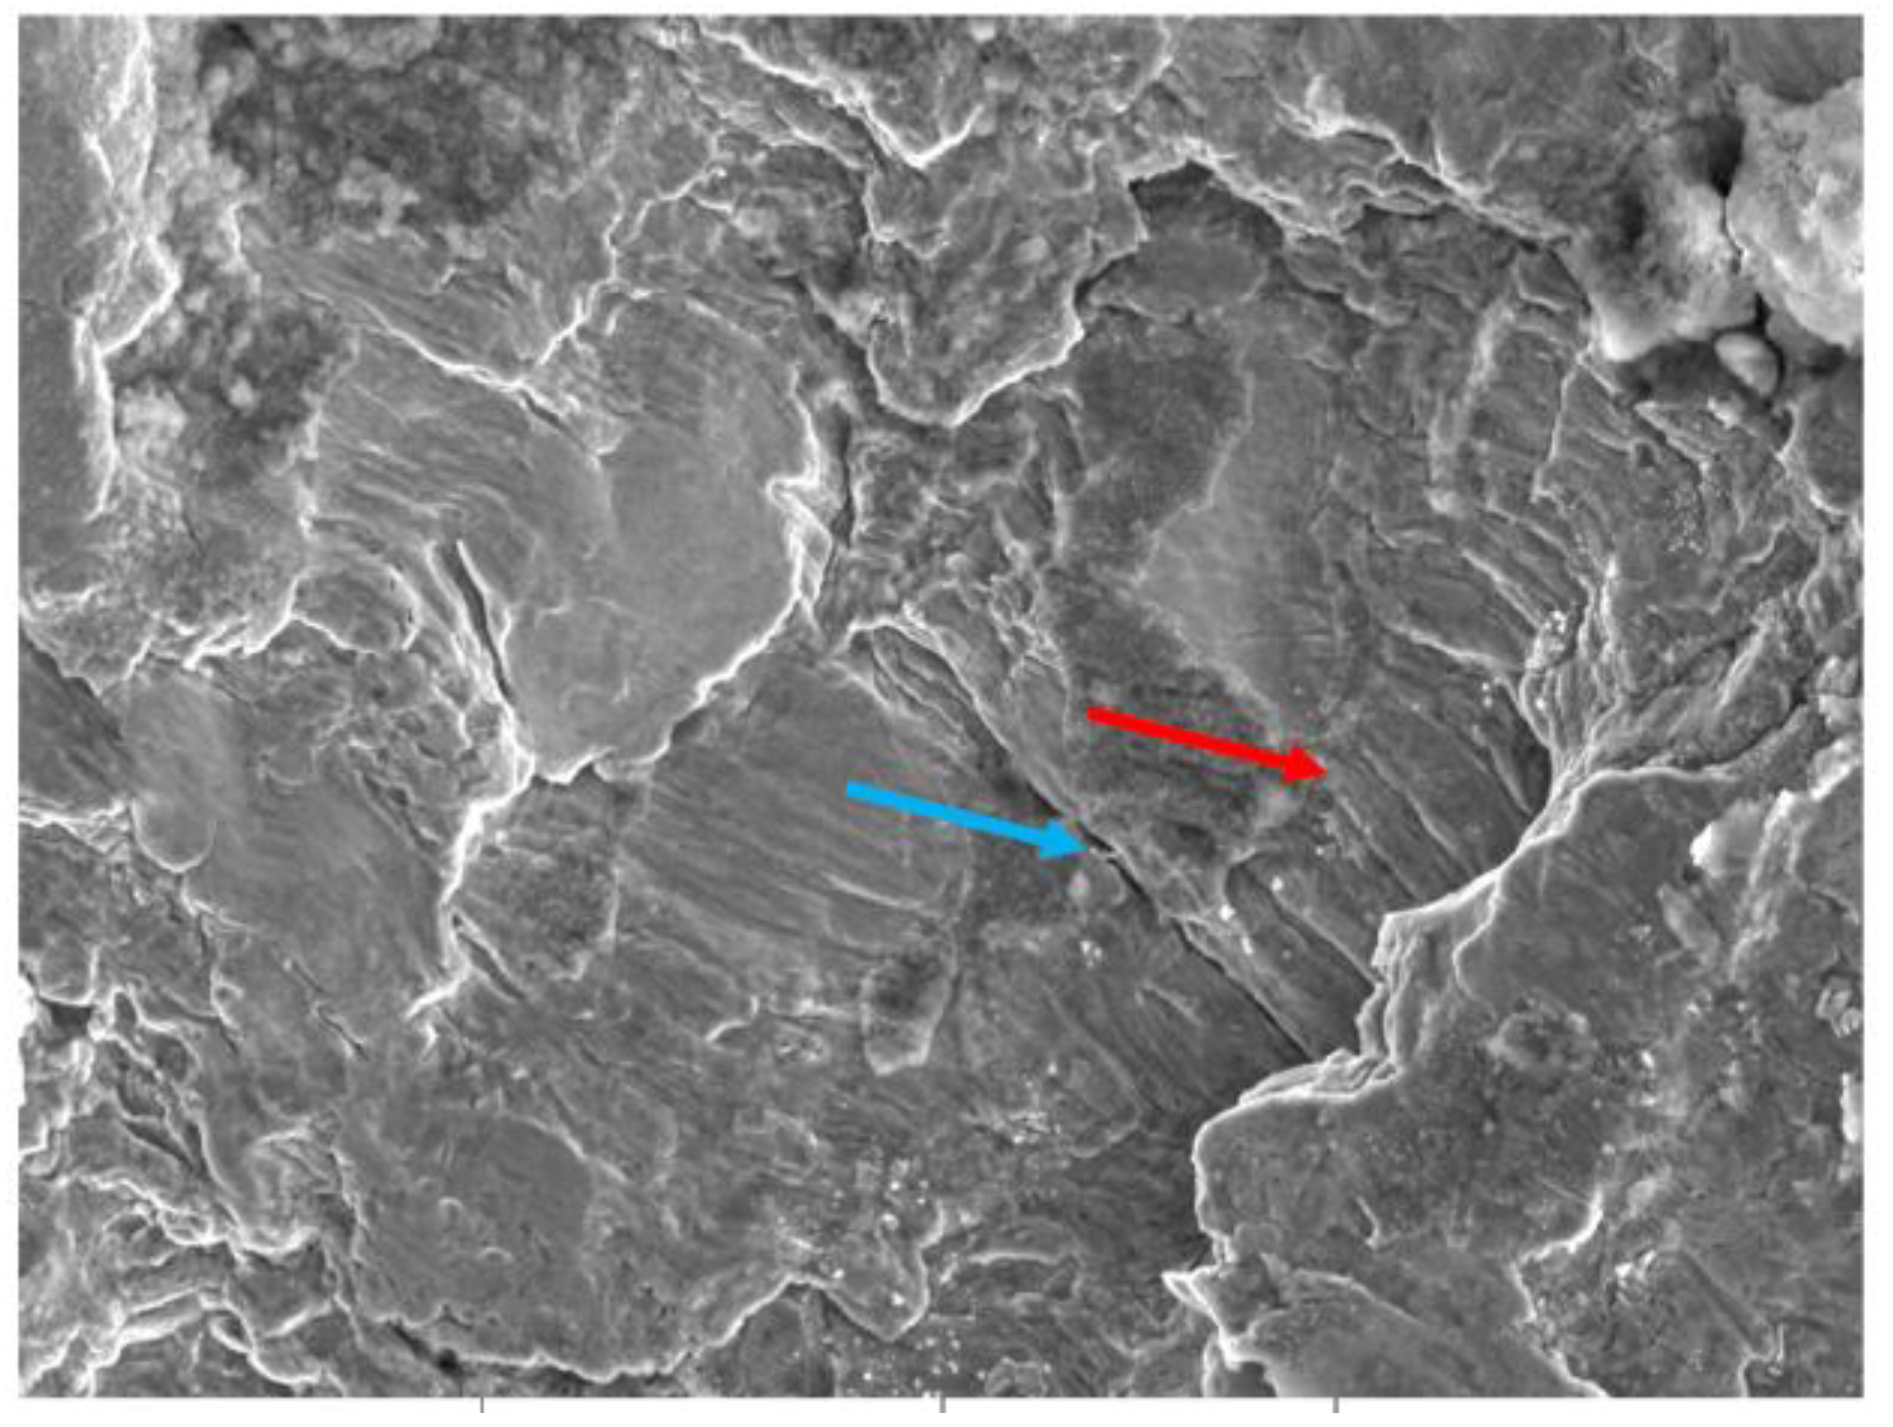
3.2. Bent Tubes and Field Failures
4. Discussion
5. Conclusions
- -
- The effect of loading is more severe in the case of axial loading (tension-compression) than bending. The higher the number of cycles, the smaller the difference.
- -
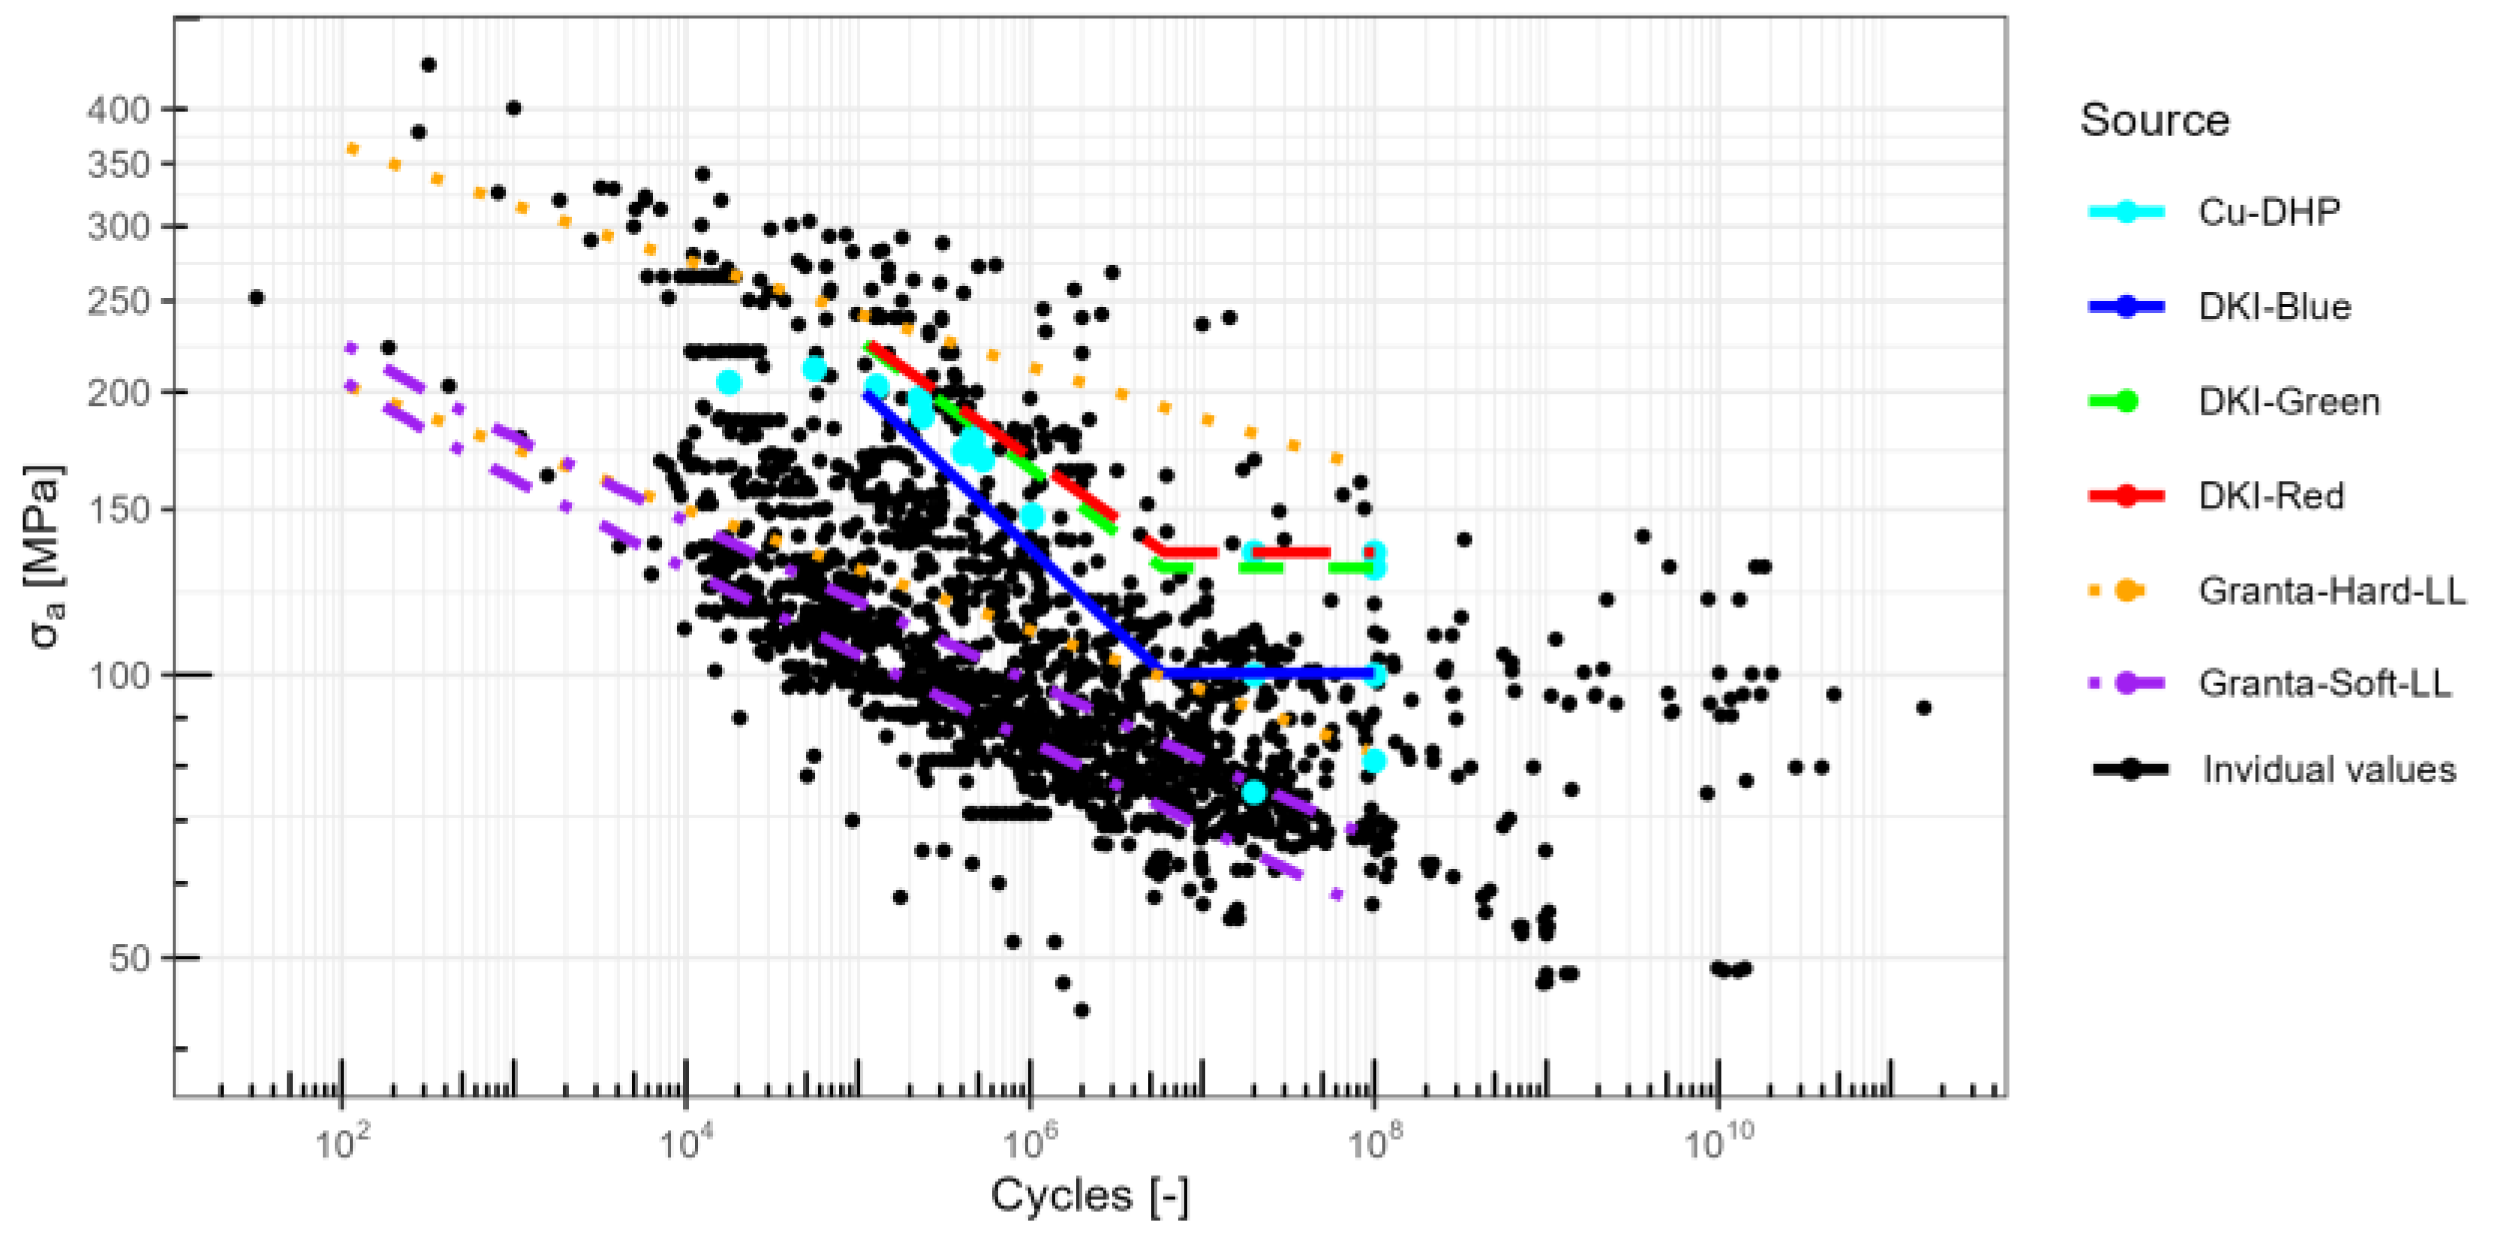
- The fatigue strength (Se) for 1010 cycles is between 50 and 60 MPa at room temperature, irrespective of the type of loading. This means that stress is equal to zero.
- -
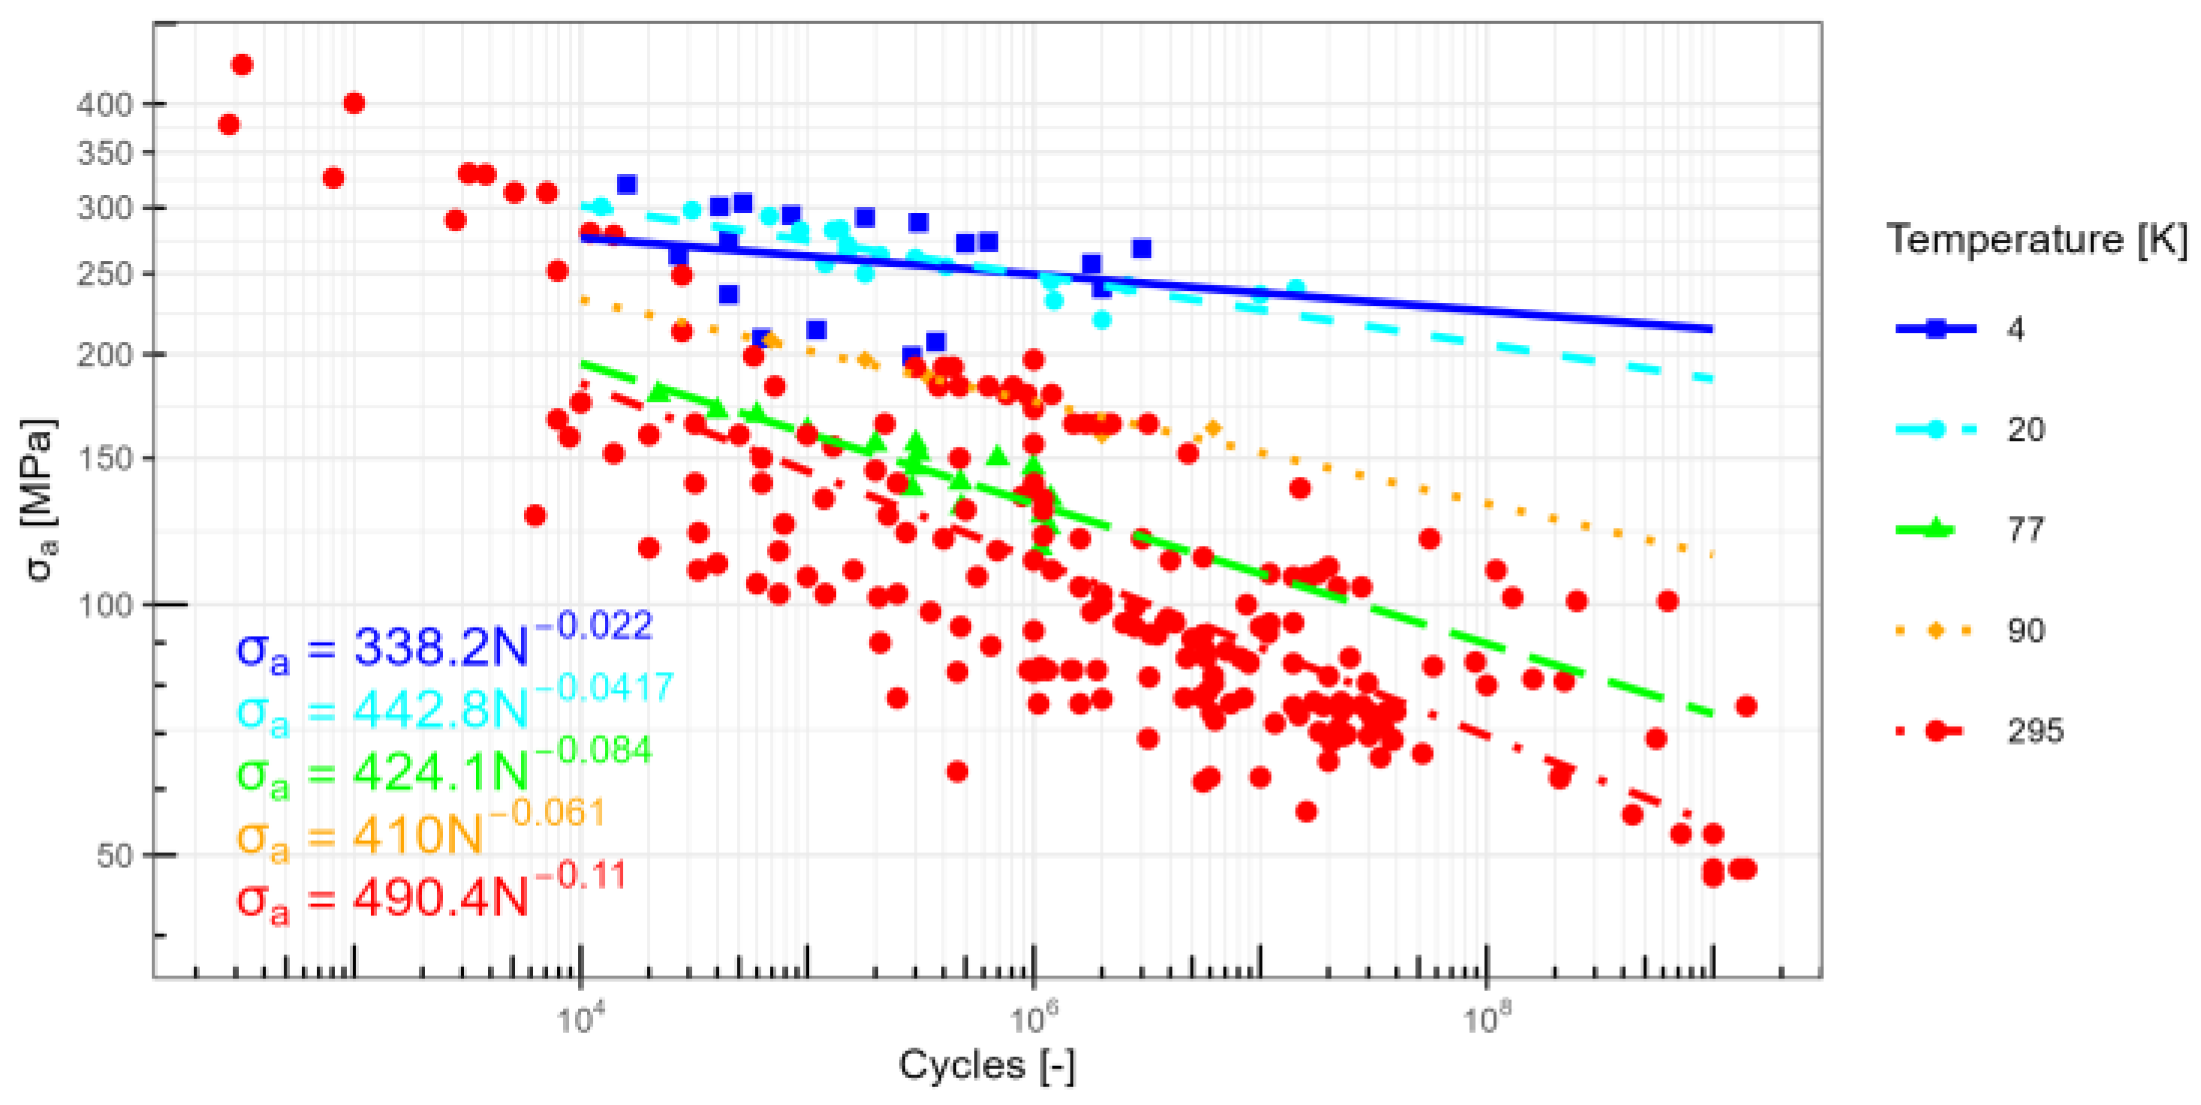
- The high-cycle fatigue strength (Se) of copper increases as the temperature decreases. At low cycles, the temperature also affects the fatigue strength (Se). Between the room temperature and 300 °C, there is no significant variation in a vacuum. However, above this temperature threshold, there is a significant decline in fatigue strength (Se).
- -
- The fatigue strength (Se) of copper increases with smaller grain sizes. For UFG, the improvement decreases as the order of 107 cycles is approached. If the stresses are torsional, the improvement extends to higher cycles.
- -
- Cold working of the copper part has a significant effect as well. The greater the degree of cold work, the greater the fatigue strength (Se).
- -
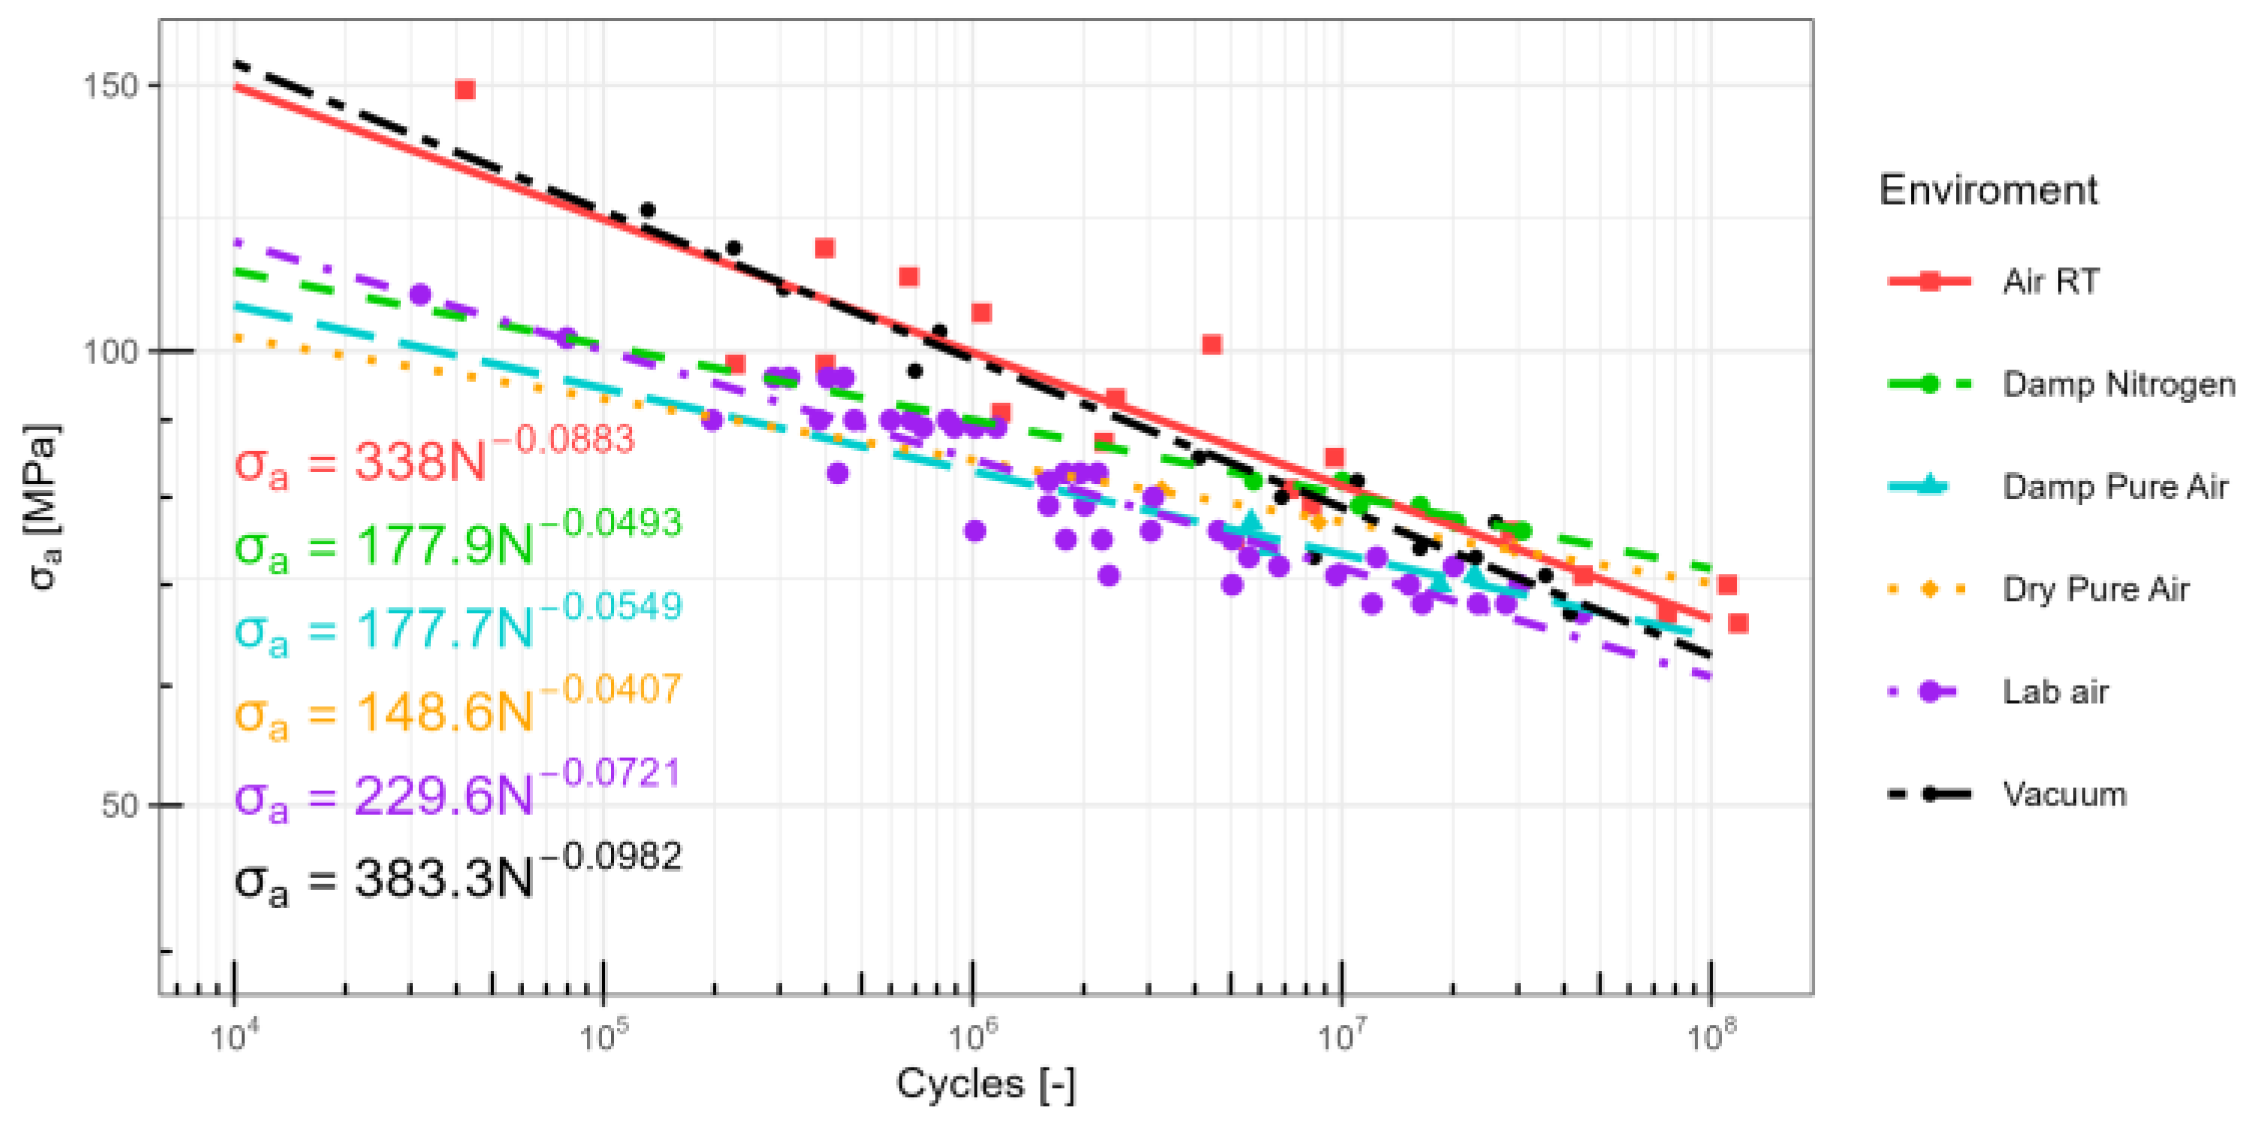
- Atmosphere also has a significant effect, increasing the fatigue strength in a vacuum.
Author Contributions
Funding
Data Availability Statement
Conflicts of Interest
Nomenclature
| ETP | Electrolytic tough-pitch |
| OFE | Oxygen-free electronic |
| OF | Oxygen-free |
| OFHC | Oxygen-free high-conductivity |
| Cu-DHP | Phosphorus-deoxidized copper (high residual phosphorus) |
| S-N | Stress–life |
| σ | Stress |
| σmax | Maximum stress |
| σmin | Minimum stress |
| σm | Mean stress = (σmax + σmin)/2 |
| σa | Alternating stress = (σmax − σmin)/2 |
| Se | Fatigue strength |
| Se (108) | Fatigue strength at 108 cycles |
| Syp | Yield strength |
| Sut | Ultimate strength |
| εplastic | Plastic strain amplitude |
| εelastic | Elastic strain amplitude |
| εTotal | Total strain amplitude |
| ε-N | Strain–life |
| R | Stress ratio (min/max) |
References
- Wöhler, A. Results of tests made in the central workshop of the Niederschlesisch-Märkischen Eisenbahn at Frankfurt a.d.O., on the relative strength of iron, steel and copper. Z. Bauw. 1866, 16, 67–83. [Google Scholar]
- Sun, Y.; Li, T.; Lan, L.; Chen, J.; Zhu, W.; Xue, S.; Jin, L. A Mini-Review on the Thermal Fatigue Properties of Copper Materials Applied at the Front-End of Synchrotron Radiation Facilities. Entropy 2023, 25, 714. [Google Scholar] [CrossRef] [PubMed]
- Bathias, C. Piezoelectric Fatigue Testing Machines and Devices. Int. J. Fatigue 2006, 28, 1438–1445. [Google Scholar] [CrossRef]
- Valiev, R.Z.; Langdon, T.G. Principles of Equal-Channel Angular Pressing as a Processing Tool for Grain Refinement. Prog. Mater. Sci. 2006, 51, 881–981. [Google Scholar] [CrossRef]
- Design of Rotating Electrical Machines. Wiley. Available online: https://www.wiley.com/en-us/Design+of+Rotating+Electrical+Machines-p-9780470740088 (accessed on 6 December 2023).
- Louthan, M.R. Hydrogen Embrittlement of Metals: A Primer for the Failure Analyst. J. Fail. Anal. Prev. 2008, 8, 289–307. [Google Scholar] [CrossRef]
- Deutsches Kupferinstitute Cu-DHP.pdf. Available online: https://kupfer.de/wp-content/uploads/2019/11/Cu-DHP.pdf (accessed on 5 October 2023).
- Data Sheet No. A6 Cu-DHP; Conseil International Pour le Developpement du Cuivre (CIDEC): Madrid, Spain, 1968.
- Burghoff, H.L. Fatigue Characteristics of Some Copper Alloys. Proc. ASTM 1947, 47, 695–712. [Google Scholar]
- Hoyt, S.L. ASME Handbook Metals Properties; McGraw Hill: New York, NY, USA, 1954. [Google Scholar]
- Wieland-Werke. Wieland-Kupferwerkstoffe: Herstellung, Eigenschaften und Verarbeitung, 6th ed.; Wieland: Ulm, Germany, 1999. [Google Scholar]
- Granta Copper, C12200, Hard (Phosphorus de-Oxidized Arsenical h.c Copper). Available online: https://www.ansys.com/products/materials/materials-data-library (accessed on 4 December 2021).
- Park, S.; Kwon, H.H.; Koo, J.M.; Seok, C.S.; Jung, D.H.; Mo, J.Y. A Study on the Fatigue Life Prediction for Bending Pipe. Adv. Mater. Res. 2012, 415–417, 2219–2225. [Google Scholar] [CrossRef]
- Murphy, M.C. The Engineering Fatigue Properties of Wrought Copper. Fatigue Fract. Eng. Mater. Struct. 1981, 4, 199–234. [Google Scholar] [CrossRef]
- Grover, H.J.; Institute, B.M. Fatigue of Metals and Structures; U.S. Government Printing Office: Washington, DC, USA, 1960. [Google Scholar]
- Budynas, R.G.; Nisbett, J.K. Shigley’s Mechanical Engineering Design; McGraw Hill: New York, NY, USA, 2019; ISBN 978-0-07-339821-1. [Google Scholar]
- WebPlotDigitizer. Extract Data from Plots, Images, and Maps. Available online: https://automeris.io/WebPlotDigitizer/ (accessed on 4 November 2023).
- Rstudio Home Page. Available online: https://posit.co/products/open-source/rstudio/ (accessed on 4 December 2023).
- R: The R Project for Statistical Computing. Available online: https://www.r-project.org/ (accessed on 1 November 2023).
- Tahmasbi, K.; Alharthi, F.; Webster, G.; Haghshenas, M. Dynamic Frequency-Dependent Fatigue Damage in Metals: A State-of-the-Art Review. Forces Mech. 2023, 10, 100167. [Google Scholar] [CrossRef]
- Marti, N.; Favier, V.; Gregori, F.; Saintier, N. Correlation of the Low and High Frequency Fatigue Responses of Pure Polycrystalline Copper with Mechanisms of Slip Band Formation. Mater. Sci. Eng. A 2020, 772, 138619. [Google Scholar] [CrossRef]
- Fintová, S.; Kuběna, I.; Chlupová, A.; Jambor, M.; Šulák, I.; Chlup, Z.; Polák, J. Frequency-Dependent Fatigue Damage in Polycrystalline Copper Analyzed by FIB Tomography. Acta Mater. 2021, 211, 116859. [Google Scholar] [CrossRef]
- Stanzl-Tschegg, S.E. Influence of Material Properties and Testing Frequency on VHCF and HCF Lives of Polycrystalline Copper. Int. J. Fatigue 2017, 105, 86–96. [Google Scholar] [CrossRef]
- Phung, N.-L. Fatigue Sous très Faibles Amplitudes de Contrainte: Analyse des Mécanismes Précurseurs de L’amorçage de Fissures dans le Cuivre Polycristallin. Ph.D. Thesis, Ecole Nationale Supérieure d’arts et Métiers—ENSAM, Paris, France, 2012. [Google Scholar]
- Singh, B.N.; Toft, P.; Stubbins, J.F. Fatigue Performance of Copper and Copper Alloys before and after Irradiation with Fission Neutrons: (ITER R & D Task No. T213); Risø National Laboratory: Roskilde, Denmark, 1997; ISBN 978-87-550-2313-0. [Google Scholar]
- Lukáš, P.; Kunz, L. Effect of Grain Size on the High Cycle Fatigue Behaviour of Polycrystalline Copper. Mater. Sci. Eng. 1987, 85, 67–75. [Google Scholar] [CrossRef]
- Collini, L. Copper Alloys—Early Applications and Current Performance—Enhancing Processes; InTech: London, UK, 2012; ISBN 978-953-51-0160-4. [Google Scholar]
- Goto, M.; Han, S.Z.; Yakushiji, T.; Kim, S.S.; Lim, C.Y. Fatigue Strength and Formation Behavior of Surface Damage in Ultrafine Grained Copper with Different Non-Equilibrium Microstructures. Int. J. Fatigue 2008, 30, 1333–1344. [Google Scholar] [CrossRef]
- Khatibi, G.; Horky, J.; Weiss, B.; Zehetbauer, M.J. High Cycle Fatigue Behaviour of Copper Deformed by High Pressure Torsion. Int. J. Fatigue 2010, 32, 269–278. [Google Scholar] [CrossRef]
- Li, R.H.; Zhang, Z.J.; Zhang, P.; Zhang, Z.F. Improved Fatigue Properties of Ultrafine-Grained Copper under Cyclic Torsion Loading. Acta Mater. 2013, 61, 5857–5868. [Google Scholar] [CrossRef]
- Lukáš, P.; Kunz, L.; Svoboda, M. Fatigue Mechanisms in Ultrafine-Grained Copper. Kov. Mater. 2009, 47, 1–9. [Google Scholar]
- Lukáš, P.; Kunz, L.; Svoboda, M. Overview of Fatigue Behaviour of Ultrafine-Grained Copper Produced by Severe Plastic Deformation. Mater. Sci. Forum 2008, 567–568, 9–16. [Google Scholar] [CrossRef]
- Mughrabi, H. Fatigue, an Everlasting Materials Problem—Still En Vogue. Procedia Eng. 2010, 2, 3–26. [Google Scholar] [CrossRef]
- Thompson, A.W.; Backofen, W.A. The Effect of Grain Size on Fatigue. Acta Metall. 1971, 19, 597–606. [Google Scholar] [CrossRef]
- Vinogradov, A.; Hashimoto, S. Multiscale Phenomena in Fatigue of UltraFine Grain Materials—An Overview. Mater. Trans. 2001, 42, 74–84. [Google Scholar] [CrossRef]
- Mughrabi, H.; Höppel, H.W.; Kautz, M. Fatigue and Microstructure of Ultrafine-Grained Metals Produced by Severe Plastic Deformation. Scr. Mater. 2004, 51, 807–812. [Google Scholar] [CrossRef]
- Carstensen, J.V. Structural Evolution and Mechanisms of Fatigue in Polycrystalline Brass; Risø National Laboratory: Roskilde, Denmark, 1998. [Google Scholar]
- Thompson, N.; Wadsworth, N.; Louat, N.X. The Origin of Fatigue Fracture in Copper. Philos. Mag. A J. Theor. Exp. Appl. Phys. 1956, 1, 113–126. [Google Scholar] [CrossRef]
- Duquette, D.J. Environmental Effects on General Fatigue Resistance and Crack Nucleation in Metals and Alloys; DTIC: Fort Belvoir, VA, USA, 1978. [Google Scholar]
- Mughrabi, H. On the Life-Controlling Microstructural Fatigue Mechanisms in Ductile Metals and Alloys in the Gigacycle Regime. Fatigue Fract. Eng. Mater. Struct. 1999, 22, 633–641. [Google Scholar] [CrossRef]
- Wang, Z.; Nian, T.; Ryding, D.; Kuzay, T.M. Low-Cycle-Fatigue Behavior of Copper Materials and Their Use in Synchrotron Beamline Components. Nucl. Instrum. Methods Phys. Res. Sect. A Accel. Spectrometers Detect. Assoc. Equip. 1994, 347, 651–656. [Google Scholar] [CrossRef]
- Simon, N.J.; Drexler, E.S.; Reed, R.P. Properties of Copper and Copper Alloys at Cryogenic Temperatures; National Institute of Standards and Technology: Gaithersburg, MD, USA, 1992; p. NIST MONO 177. [Google Scholar]
- ASME—ANSI B106.1M. Design of Transmission Shafting (Second Printing). GlobalSpec. Available online: https://standards.globalspec.com/std/709086/ANSI%20B106.1M (accessed on 6 December 2023).
- Soderberg, C.R. Factor of Safety and Working Stress. Trans. Am. Soc. Mech. Eng. 2023, 52, 13–21. [Google Scholar] [CrossRef]
- Haigh, B.P. Experiments on the Fatigue of Brasses. J. Inst. Met. 1917, 18, 55–86. [Google Scholar]
- Tamiya, Y. Low-Cycle Fatigue Fracture Phenomenon of Bended Copper Pipes under Internal Pressure. J. Soc. Mater. Sci. Jpn. 2012, 61, 550–555. [Google Scholar] [CrossRef]
- Harun, M.F.; Mohammad, R. Fatigue Properties of JIS H3300 C1220 Copper for Strain Life Prediction. AIP Conf. Proc. 2018, 1958, 020001. [Google Scholar] [CrossRef]
- Neuber, H. Theory of Stress Concentration for Shear-Strained Prismatical Bodies With Arbitrary Nonlinear Stress-Strain Law. J. Appl. Mech. 1961, 28, 544–550. [Google Scholar] [CrossRef]
- Pan, X.; Wu, X.; Fu, G.; Stubbins, J.F. Grain Size Effect on Room Temperature Fatigue and Creep-Fatigue Behavior of OFHC Copper. Fusion Sci. Technol. 2007, 52, 521–525. [Google Scholar] [CrossRef]
- Coffin, L.F. Fatigue at High Temperature-Prediction and Interpretation. Proc. Inst. Mech. Eng. 1974, 188, 109–127. [Google Scholar] [CrossRef]
- Takahashi, S.; Sano, M.; Watanabe, A.; Kitamura, H. Prediction of Fatigue Life of High-Heat-Load Components Made of Oxygen-Free Copper by Comparing with Glidcop. J. Synchrotron. Radiat. 2013, 20, 67–73. [Google Scholar] [CrossRef] [PubMed]
- Papavinasam, S. Chapter 5—Mechanisms. In Corrosion Control in the Oil and Gas Industry; Papavinasam, S., Ed.; Gulf Professional Publishing: Boston, MA, USA, 2014; pp. 249–300. ISBN 978-0-12-397022-0. [Google Scholar]
- Briant, C.L.; Banerji, S.K. Embrittlement of Engineering Alloys, 1st ed.; Elsevier: Amsterdam, The Netherlands, 1983; Available online: https://shop.elsevier.com/books/embrittlement-of-engineering-alloys/briant/978-0-12-341825-8 (accessed on 26 October 2023).
- Lynch, S.P. 18—Failures of Structures and Components by Metal-Induced Embrittlement. In Stress Corrosion Cracking; Raja, V.S., Shoji, T., Eds.; Woodhead Publishing Series in Metals and Surface Engineering; Woodhead Publishing: Sawston, UK, 2011; pp. 714–748. ISBN 978-1-84569-673-3. [Google Scholar]
- Norkett, J.E.; Dickey, M.D.; Miller, V.M. A Review of Liquid Metal Embrittlement: Cracking Open the Disparate Mechanisms. Met. Mater. Trans. A 2021, 52, 2158–2172. [Google Scholar] [CrossRef]
- Duffner, D.H. Air Conditioner Failure Investigation-Intergranular Cracking in a Pure Copper Condenser Tube. J. Fail. Anal. Prev. 2005, 5, 79–85. [Google Scholar] [CrossRef]
- McDougal, J.L.; Stevenson, M.E. Stress-Corrosion Cracking in Copper Refrigerant Tubing. J. Fail. Anal. Prev. 2005, 5, 13–17. [Google Scholar] [CrossRef]
- Stevenson, M.E.; McDougall, J.L.; Barkey, M.E. Stresses in Bent Copper Tubing: Application to Fatigue and Stress-Corrosion Cracking Failure Mechanisms. J. Fail. Anal. Prev. 2005, 5, 25–29. [Google Scholar] [CrossRef]
- Pantazopoulos, G. Metallurgical Observations on Fatigue Failure of a Bent Copper Tube. J. Fail. Anal. Prev. 2009, 9, 270–274. [Google Scholar] [CrossRef]
- Pantazopoulos, G.; Zormalia, S.; Vazdirvanidis, A. Failure Analysis of a Copper Tube in an Industrial Refrigeration Unit: A Case History. Int. J. Struct. Integr. 2013, 4, 55–66. [Google Scholar] [CrossRef]
- Miyamoto, H.; Saburi, D.; Fujiwara, H. A Microstructural Aspect of Intergranular Stress Corrosion Cracking of Semi-Hard U-Bend Tubes of Commercially Pure Copper in Cooling Systems. Eng. Fail. Anal. 2012, 26, 108–119. [Google Scholar] [CrossRef]
- Kim, S.Y.; Kim, H.I.; Seok, C.S.; Lee, J.K.; Mo, J.Y.; Park, D.Y. Evaluation of Tensile Properties and Bending-Induced Residual Stress of Slender Copper Pipe. Key Eng. Mater. 2006, 321–323, 636–639. [Google Scholar] [CrossRef]
- Kim, S.-Y.; Koo, J.-M.; Seok, C.-S. Evaluation of Residual Stress of Copper Pipe by Using Raman Spectroscopy. Mod. Phys. Lett. B 2008, 22, 1007–1012. [Google Scholar] [CrossRef]
- Harlow, D.G. Statistically Modeling the Fatigue Life of Copper and Aluminum Wires Using Archival Data. Metals 2023, 13, 1419. [Google Scholar] [CrossRef]
- Tanaka, T.; Sugioka, T.; Kobayashi, T.; Shohji, I.; Shimada, Y.; Watanabe, H.; Kamakoshi, Y. Low Cycle Fatigue Characteristics of Oxygen-Free Copper for Electric Power Equipment. Materials 2021, 14, 4237. [Google Scholar] [CrossRef] [PubMed]


| Form | Treatment | Nº Cycles [×106] | Ultimate Strength [MPa] | Fatigue Strength Se [MPa] | Authors |
|---|---|---|---|---|---|
| Strip, Th. 0.8 mm | CW 21% | 100 | 300 | 100 | Burghoff [9] |
| Strip, Th. 0.8 mm | CW 37% | 100 | 360 | 135 | Burghoff [9] |
| Strip, Thh 0.8 mm | CW 60% | 100 | 415 | 130 | Burghoff [9] |
| Pipe | Annealed. Grain size 0.050 mm | 20 | 225 | 75 | Hoyt [10] |
| Pipe | CW 15% | 20 | 280 | 100 | Hoyt [10] |
| Pipe | CW 40% | 20 | 385 | 135 | Hoyt [10] |
| Designation | Type of Copper | UNS | Cu [%] |
|---|---|---|---|
| ETP | Electrolytic tough-pitch (ETP) | C11000 | 99.99 |
| OFE | Oxygen-free electronic (OFE) | C10100 | 99.95 |
| OF | Oxygen-free (OF) | C10200 | 99.90 |
| DHP | Phosphorized, high-residual phosphorus (DHP) | C12200 | 99.90 |
Disclaimer/Publisher’s Note: The statements, opinions and data contained in all publications are solely those of the individual author(s) and contributor(s) and not of MDPI and/or the editor(s). MDPI and/or the editor(s) disclaim responsibility for any injury to people or property resulting from any ideas, methods, instructions or products referred to in the content. |
© 2024 by the authors. Licensee MDPI, Basel, Switzerland. This article is an open access article distributed under the terms and conditions of the Creative Commons Attribution (CC BY) license (https://creativecommons.org/licenses/by/4.0/).
Share and Cite
Jiménez-Ruiz, E.; Lostado-Lorza, R.; Berlanga-Labari, C. A Comprehensive Review of Fatigue Strength in Pure Copper Metals (DHP, OF, ETP). Metals 2024, 14, 464. https://doi.org/10.3390/met14040464
Jiménez-Ruiz E, Lostado-Lorza R, Berlanga-Labari C. A Comprehensive Review of Fatigue Strength in Pure Copper Metals (DHP, OF, ETP). Metals. 2024; 14(4):464. https://doi.org/10.3390/met14040464
Chicago/Turabian StyleJiménez-Ruiz, Eduardo, Rubén Lostado-Lorza, and Carlos Berlanga-Labari. 2024. "A Comprehensive Review of Fatigue Strength in Pure Copper Metals (DHP, OF, ETP)" Metals 14, no. 4: 464. https://doi.org/10.3390/met14040464
APA StyleJiménez-Ruiz, E., Lostado-Lorza, R., & Berlanga-Labari, C. (2024). A Comprehensive Review of Fatigue Strength in Pure Copper Metals (DHP, OF, ETP). Metals, 14(4), 464. https://doi.org/10.3390/met14040464