Article

Orientation Relationship of the Intergrowth Al13Fe3 and Al13Fe4 Intermetallics Determined by Single-Crystal X-ray Diffraction

1
State Key Laboratory of Metastable Materials Science and Technology, Yanshan University, Qinhuangdao 066004, China
2
Hebei Key Lab for Optimizing Metal Product Technology and Performance, Yanshan University, Qinhuangdao 066004, China
3
School of Mechanical and Materials Engineering, North China University of Technology, Beijing 100144, China
*
Author to whom correspondence should be addressed.
Metals 2024, 14(4), 463; https://doi.org/10.3390/met14040463
Submission received: 3 March 2024 / Revised: 28 March 2024 / Accepted: 12 April 2024 / Published: 15 April 2024

Abstract

:
In the Al-Fe binary system, the Al13Fe3 phase as well as the Al13Fe4 phase has similar icosahedral building blocks like those appearing in quasicrystals. Therefore, it is of vital importance to clarify the formation process of these two phases. Coexistence of the Al13Fe3 and Al13Fe4 phases was discovered from the educts obtained with a nominal atomic ratio of Al/Fe of 9:2 by high-pressure sintering for the first time. Firstly, single crystal X-ray diffraction (SXRD) combined with a scanning electron microscope (SEM) with energy dispersive X-ray spectroscopy (EDX) measurement capabilities were adopted to determine the detailed crystal structures of both phases, which were sharply refined with regard to Al13Fe3 and Al13Fe4. Secondly, the orientation relationship between Al13Fe3 and Al13Fe4 was directly deduced from the SXRD datasets and the coexistence structure model was consequently constructed. Finally, seven pairs of parallel atomic planes and their unique orientation relations were determined from the reconstructed reciprocal space precession images. In addition, the real space structure model of the intergrowth crystal along with one kind of interfacial atomic structure were constructed from the determined orientation relations between two phases.

1. Introduction

Al and Fe are the two most abundant metallic elements in the earth’s crust. Due to their extensive sources and low cost, they are the two most commonly used metals in industry. Compared with other aluminum alloys, Fe forms a variety of Al-Fe intermetallic compounds with Al, having relatively high strength and hardness and possessing a wide range of applications [1,2,3,4,5]. Al-Fe alloy can not only partially replace titanium alloy in the aerospace field [6,7,8,9] but also reduce the research and development costs in the automotive manufacturing process [10,11,12,13]. Many researchers have carried out numerous exploration and research studies on refining alloy microstructure and improving intermetallic compound content [14,15,16,17,18,19,20,21]. In addition, Al-Fe alloy has been widely studied due to its unique structure, of which the quasicrystals of Al-Fe binary system were studied as early as 1986 [22]. Many quasicrystal-related phases, including some approximate phases in the Al-Fe system, have been discovered, such as the cubic phase AlFe [23,24], cubic phase Al8Fe5 [25], orthorhombic phase Al5Fe2 [26], triclinic crystal system Al2Fe [27], monoclinic crystal system Al13Fe4 [28], and trigonal crystal system Al13Fe3 [29].
As a typical quasicrystalline approximant phase, the crystal structure of Al13Fe4 has been studied extensively [28,30,31,32,33,34]. It has also been found that the Al13Fe4 phase is an important intermedium phase between icosahedral and decagon quasicrystallines [35]. Early X-ray diffraction patterns suggested that this compound has an orthorhombic lattice [36,37]. Careful structural analysis showed a twinning feature of crystals, which resulted in an orthorhombic pseudo-symmetry [38,39]. There have been various discussions about the crystal structure of Al13Fe4. For example, Griger et al. determined the crystal structure of Al13Fe4 by powder X-ray diffraction and concluded that the occupancy of the Al2 atom at the 2m Wykoff site is 0.7 [40]. Grin et al. [28] determined the crystal structure of Al13Fe4 by the single-crystal X-ray diffraction method. The difference lies in that the occupancy of the Al2 atom at the 2m Wykoff site is refined to 0.92. Subsequently, Popevic et al. [33] also performed single-crystal structure determinations and found that there was no vacancy defect in the crystal.
Moreover, the Al13Fe3 phase of the trigonal system is the quasicrystalline approximate phase of the Al-Fe binary system. It was firstly observed with transmission electron microscopy by Chandrasekaran et al. in 1988 [41] and was believed to be a new rhombohedral phase. Later, in 1992, Tsuchimo et al. [42] also found this phase when studying the iron-rich phase in the Al-Fe system. They believed that the space group of this phase belonged to R3c or R 3 - c but did not provide its exact crystal structure. In 2018, the fine crystal structure of this phase was determined by our group for the first time by the single-crystal X-ray diffraction method [29]. The cell parameters of this phase are refined to a = b = 14.5784(9), c = 7.5020(5), α = β = 90°, and γ = 120° with the R3c space group.
Previous research works mainly focused on charactering the existence of the Al13Fe4 phase as well as its thermodynamic and dynamical behaviors under different processing conditions [43,44,45,46,47,48]. There are also a number of works mentioning the co-existence of Al13Fe4 with a pure Al matrix or another phase like Al5Fe2 [49,50]. However, the orientation relationship between Al13Fe4 and Al5Fe2 has only very recently been reported by Chatelier et al. as far as we know using surface X-ray diffraction [51]. The orientation relationship between Al2Fe and Al5Fe2 has been studied very recently by our group [52]. However, there are no related works on the orientation relationship between Al13Fe3 and Al13Fe4, to the best of our knowledge, possibly due to the Al13Fe3 phase not having been discovered until 2018 by our group [29]. Information on the orientation relationship between coexistence phases can reveal the growth process of crystals and the arrangement of atoms at the interface to a certain extent. Therefore, in the following, we will introduce the discovery of the coexistence of Al13Fe3 and Al13Fe4. Firstly, sample preparation by the high-pressure sintering method and the analysis of the SXRD datasets will be introduced. Secondly, the solving and refinement process of the crystal structures of these two phases as well as the acquisition of the orientation relationship of the two phases in the real space will be illustrated. The parallel atomic planes present between the coexisting phases were analyzed, and a preferential interface was constructed by referring to the reconstructed precession images in reciprocal space.

2. Materials and Methods

The high-purity elements aluminum (Al, Aladdin Industrial Corporation, Shanghai, China) and iron (Fe, Alfa Aesar, Tianjin, China) with indicated purities of 99.95% and 99.9%, respectively, were combined at a stoichiometric ratio of 9:2, weighing 2 g in total. The mixture was thoroughly ground in an agate mortar. The resulting powders were then placed in a cemented carbide grinding mold with a 5 mm diameter and compressed into a tablet at approximately 4 MPa pressure for a duration of 3 min. A cylindrical block was successfully formed without any deformations or cracks. Further information regarding the high-pressure sintering process conducted using a six-anvil, high-temperature, high-pressure apparatus can be found in a study by Liu and Fan (2018) [34]. The samples underwent pressurization up to 6 GPa, were heated to 1573 K for 10 min, were subsequently cooled to 1423 K, were maintained at that temperature for 30 min, and were finally rapidly cooled to room temperature by deactivating the furnace power. A fragment of a singular crystal measuring 0.10 × 0.06 × 0.06 mm3 was chosen and affixed to a glass fiber for the purpose of conducting single-crystal X-ray diffraction analyses. The diffraction assessments were performed using a four-circle single-crystal X-ray diffractometer (Bruker D8 Venture, Bruker AXS GmbH, Karlsruhe, Germany). To examine the morphology and chemical composition, a scanning electron microscope (SEM, Hitachi S-3400N model, Hitachi, Tokyo, Japan) equipped with energy dispersive X-ray spectroscopy (EDX) capabilities (EDAX Inc., Mahwah, NJ, USA) was employed, operating at a cathode voltage of 20 kV and a current of 80 mA (see Figure S1 and Table S1 in the Supplementary Materials).
The APEX3 program [53] was used to process all datasets from SXRD. Its capabilities include indexing, integration, scaling, absorption correction [54], space group determination, structural solving, and refinement [55,56]. The Diamond program (Version 4.6.8) [57] was utilized to draw the structural models, while the ToposPro package (Version 5.5.2.0) [58] was used to analyze the building clusters of the studied phases.

3. Results

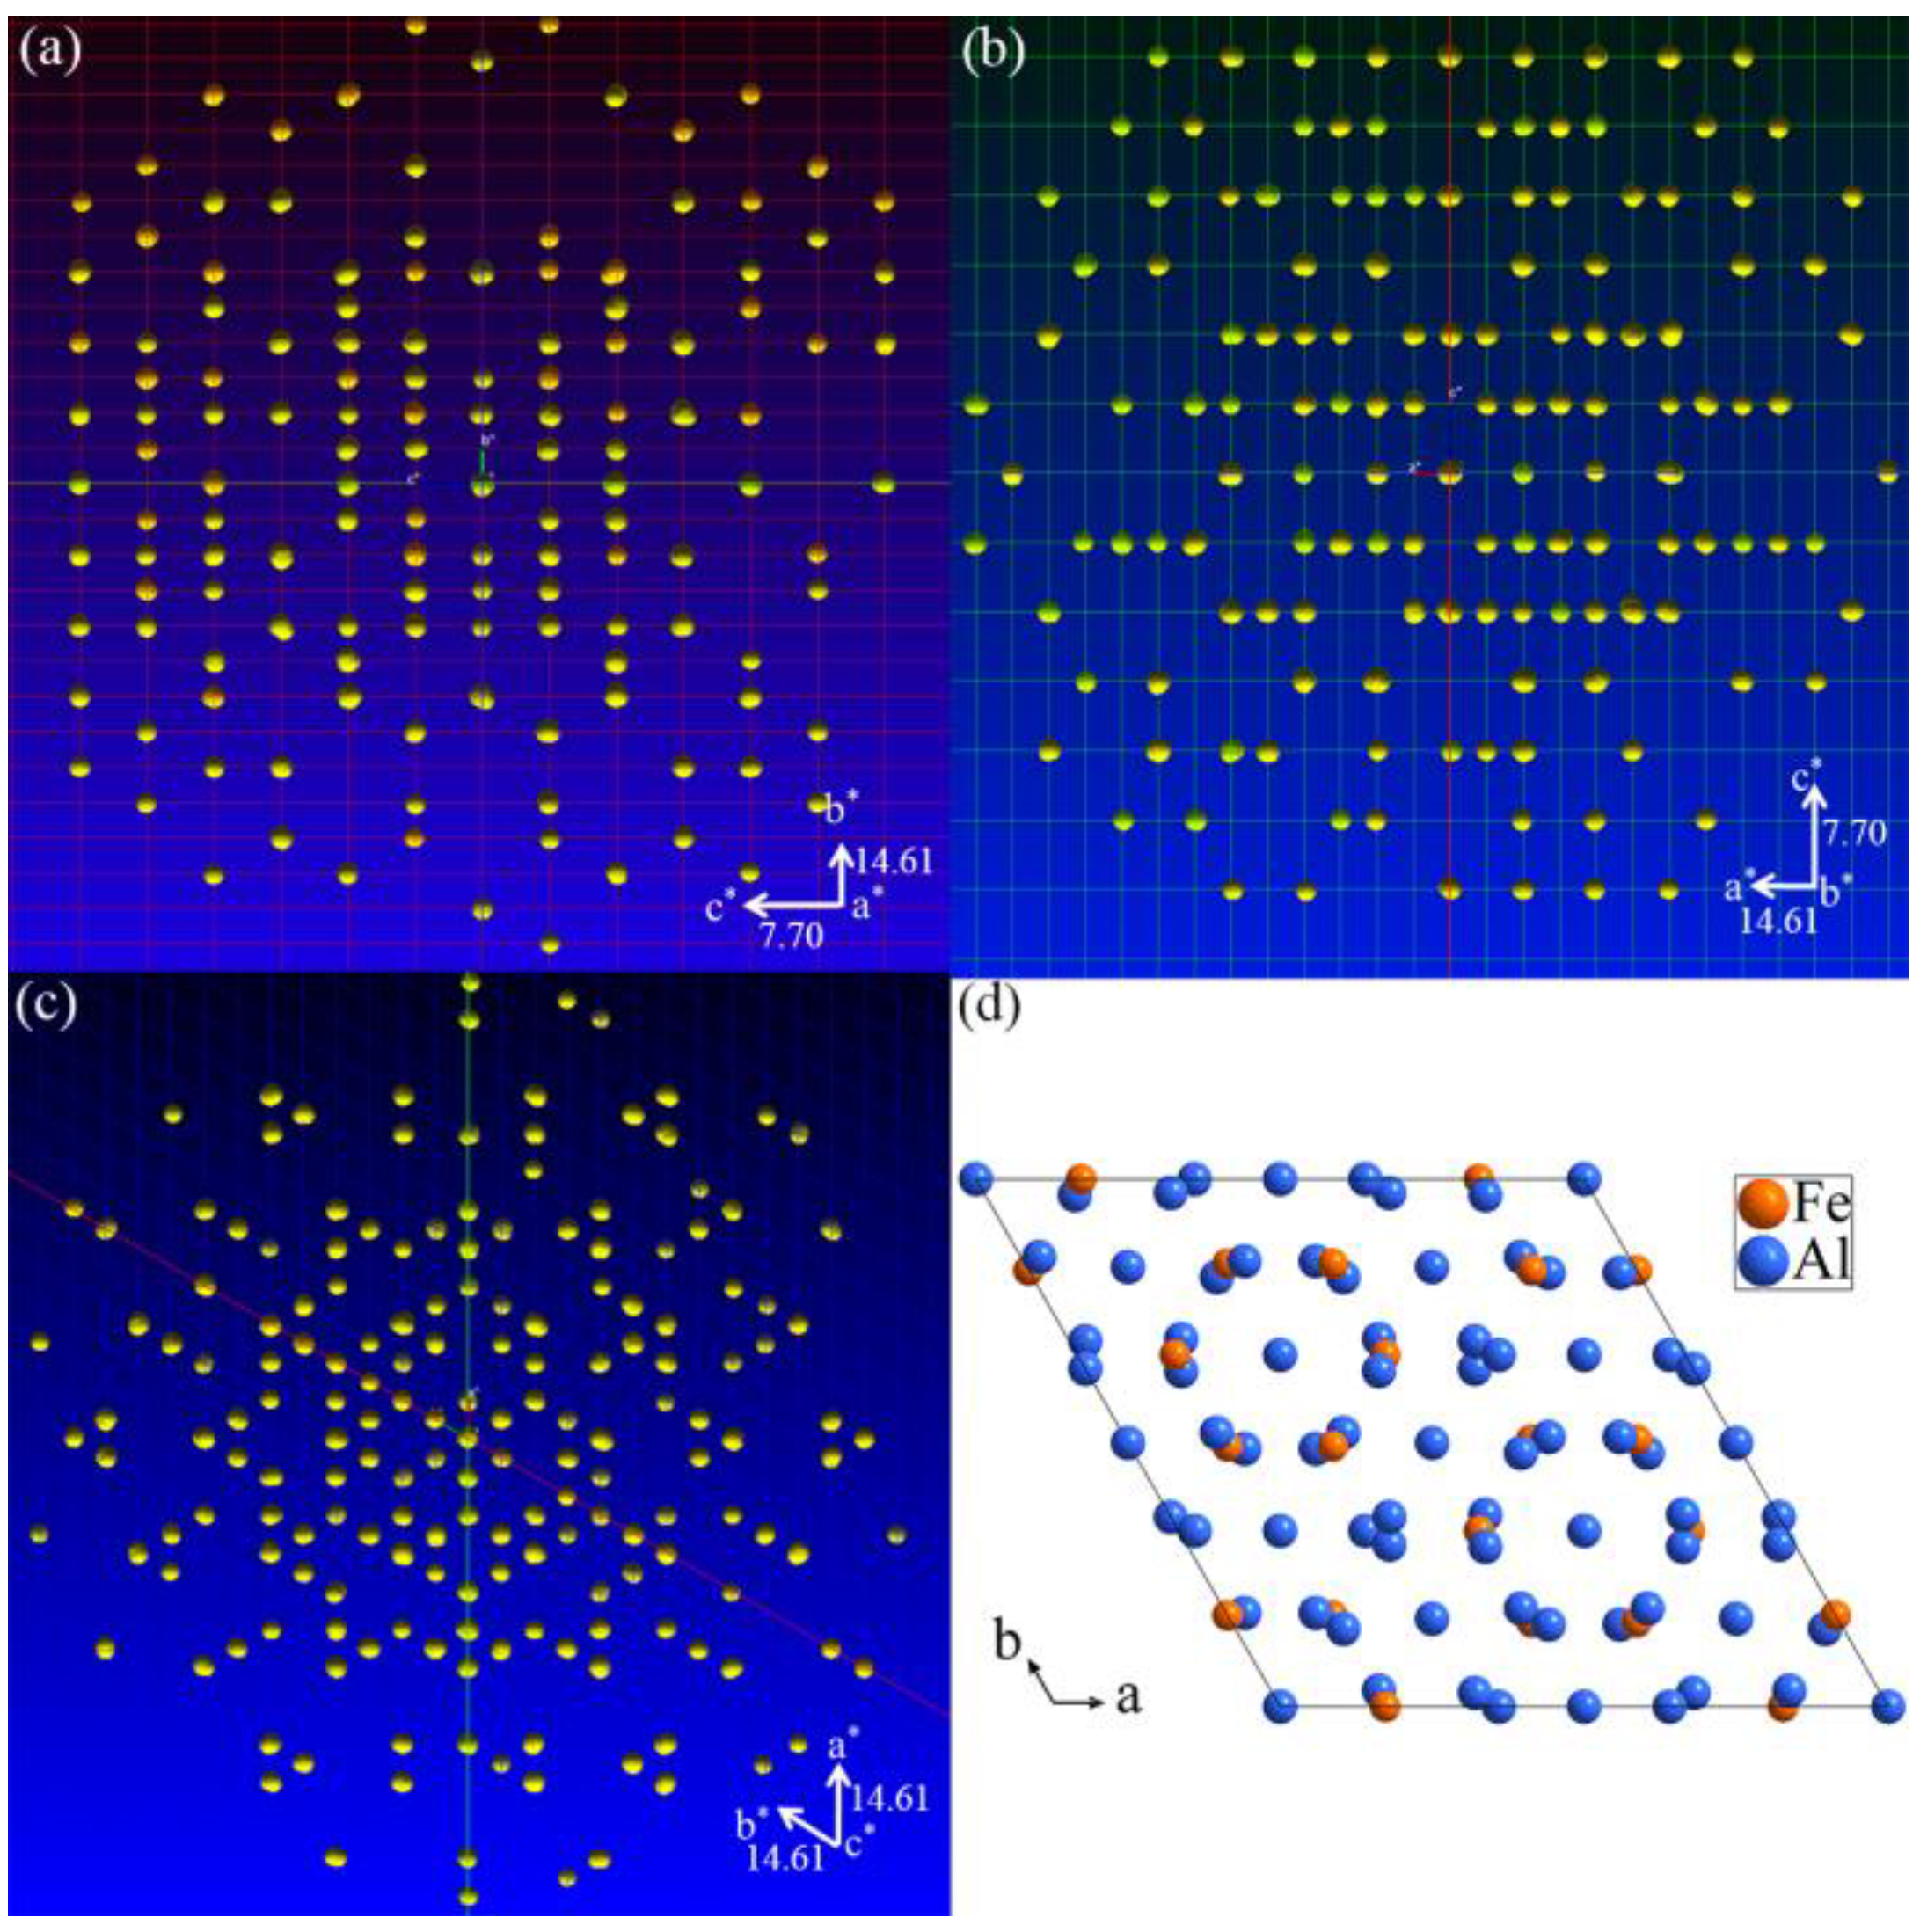
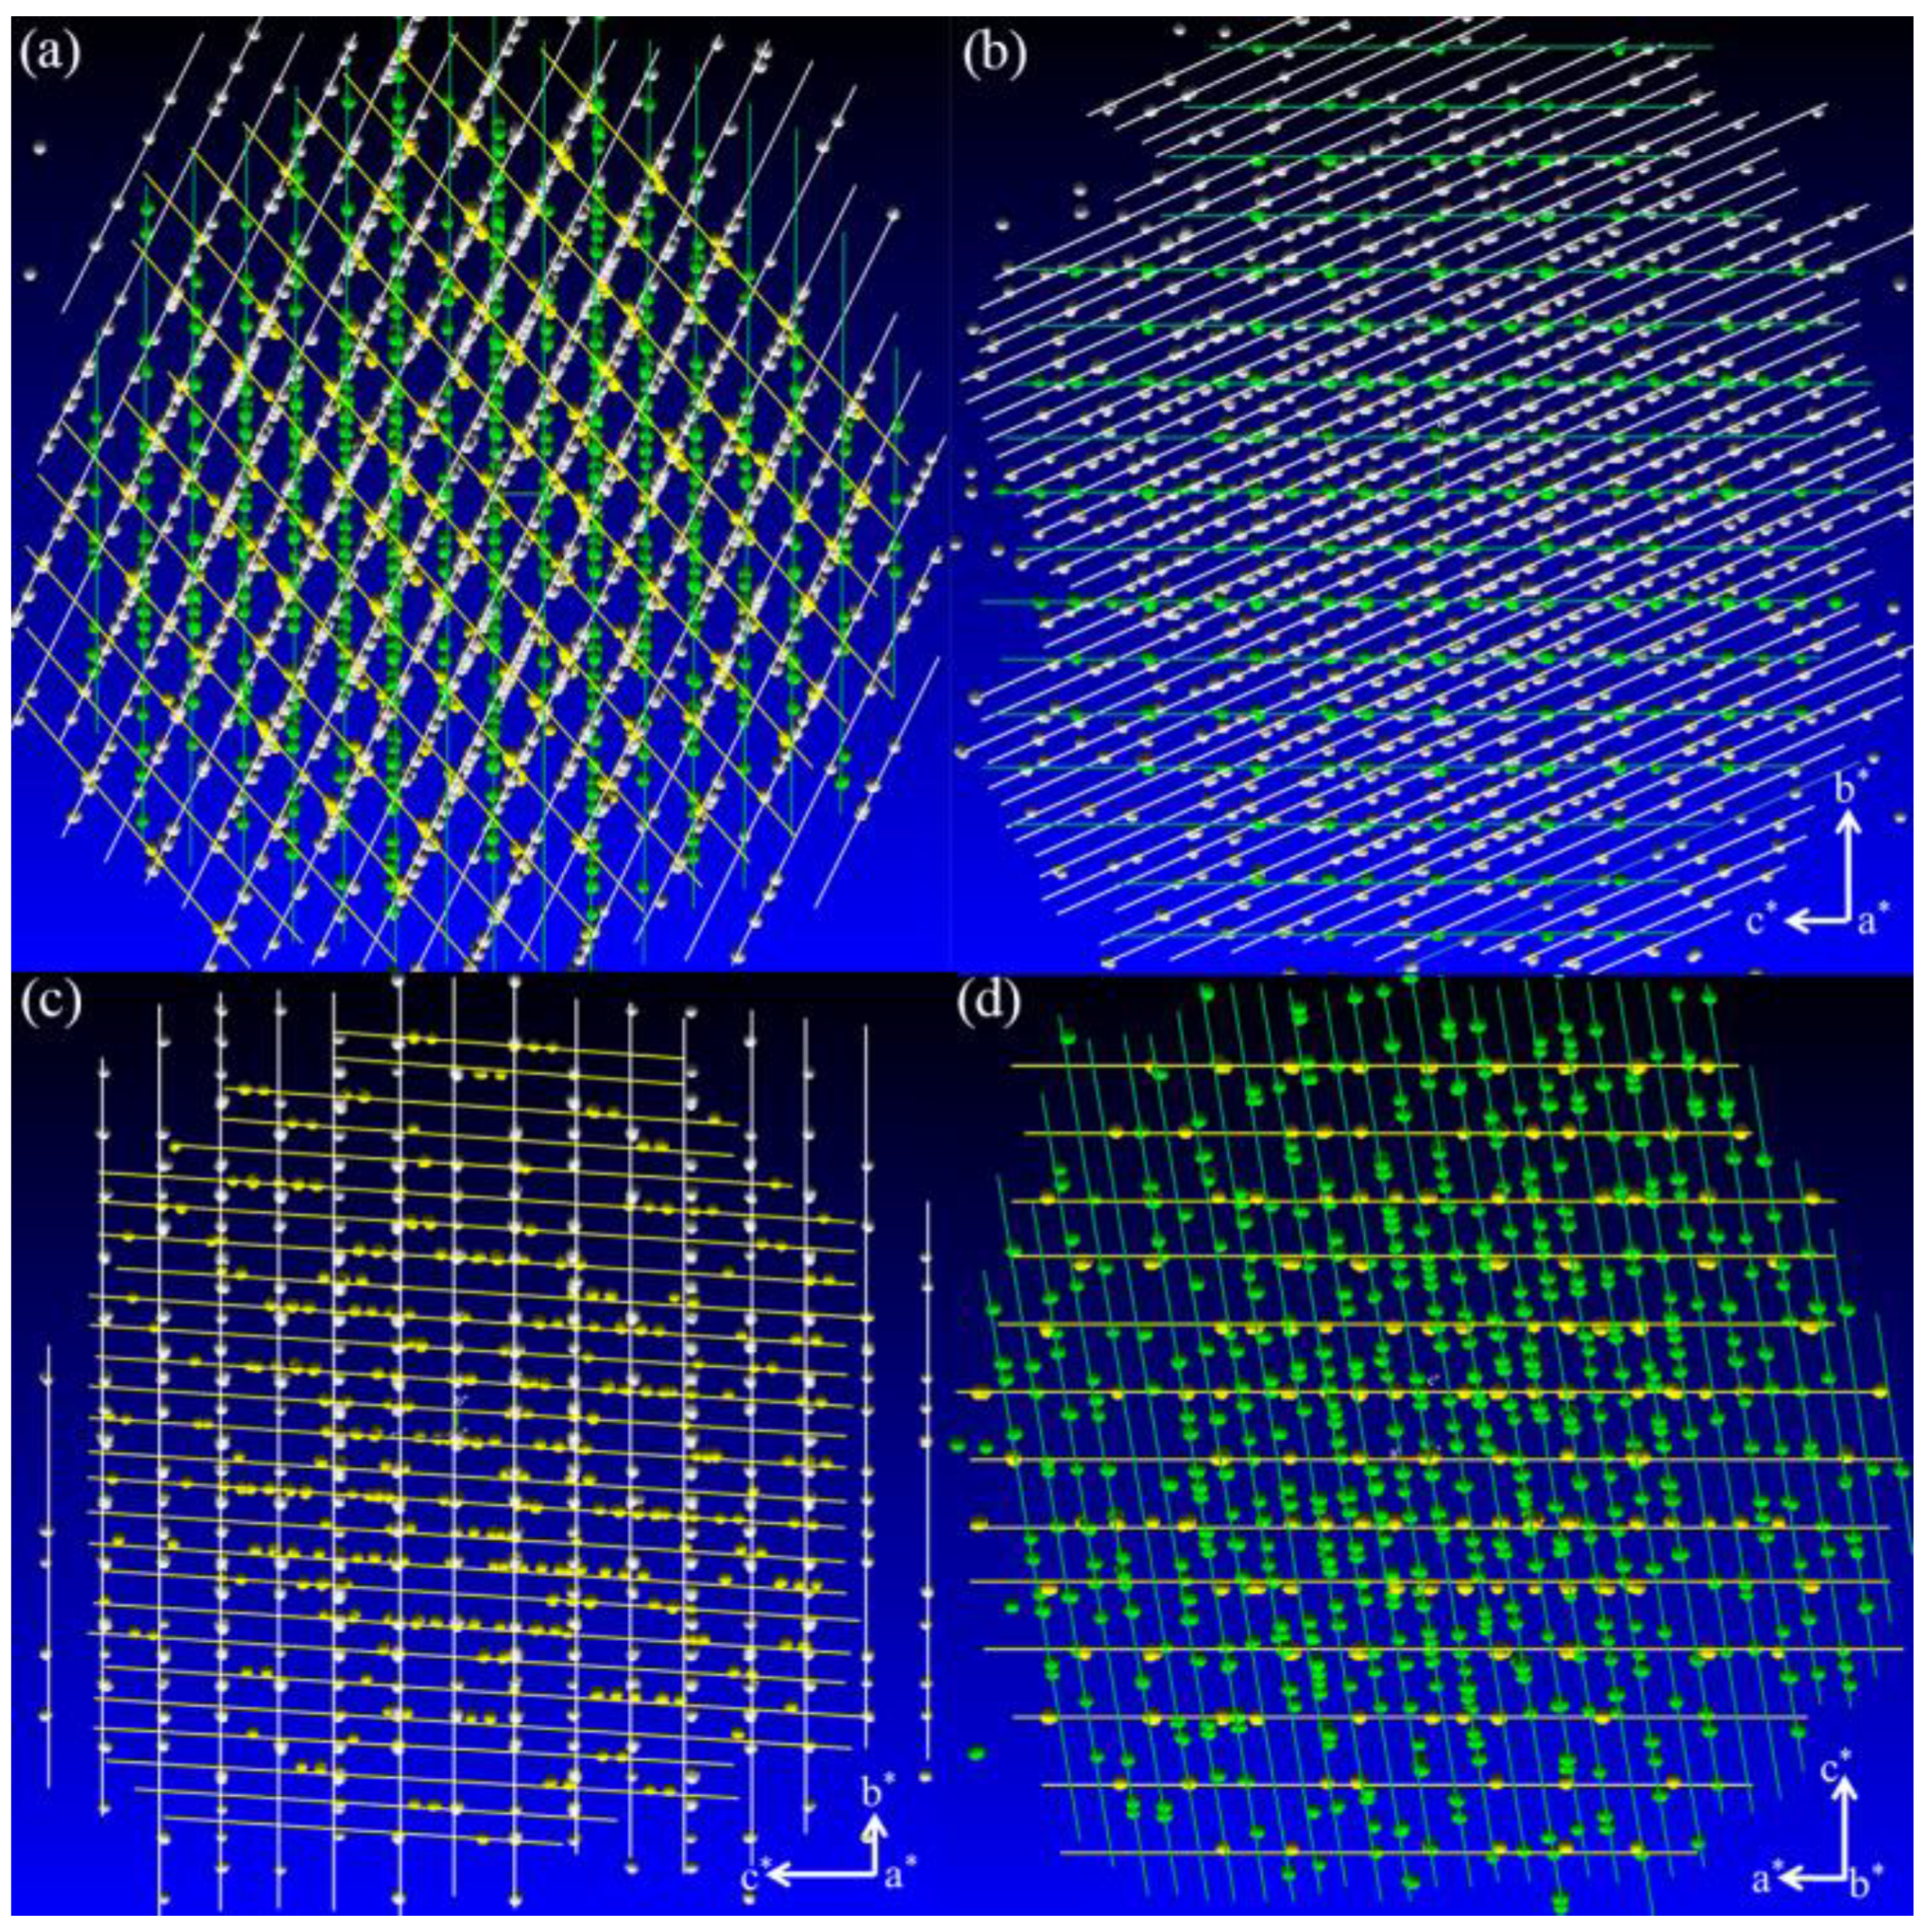
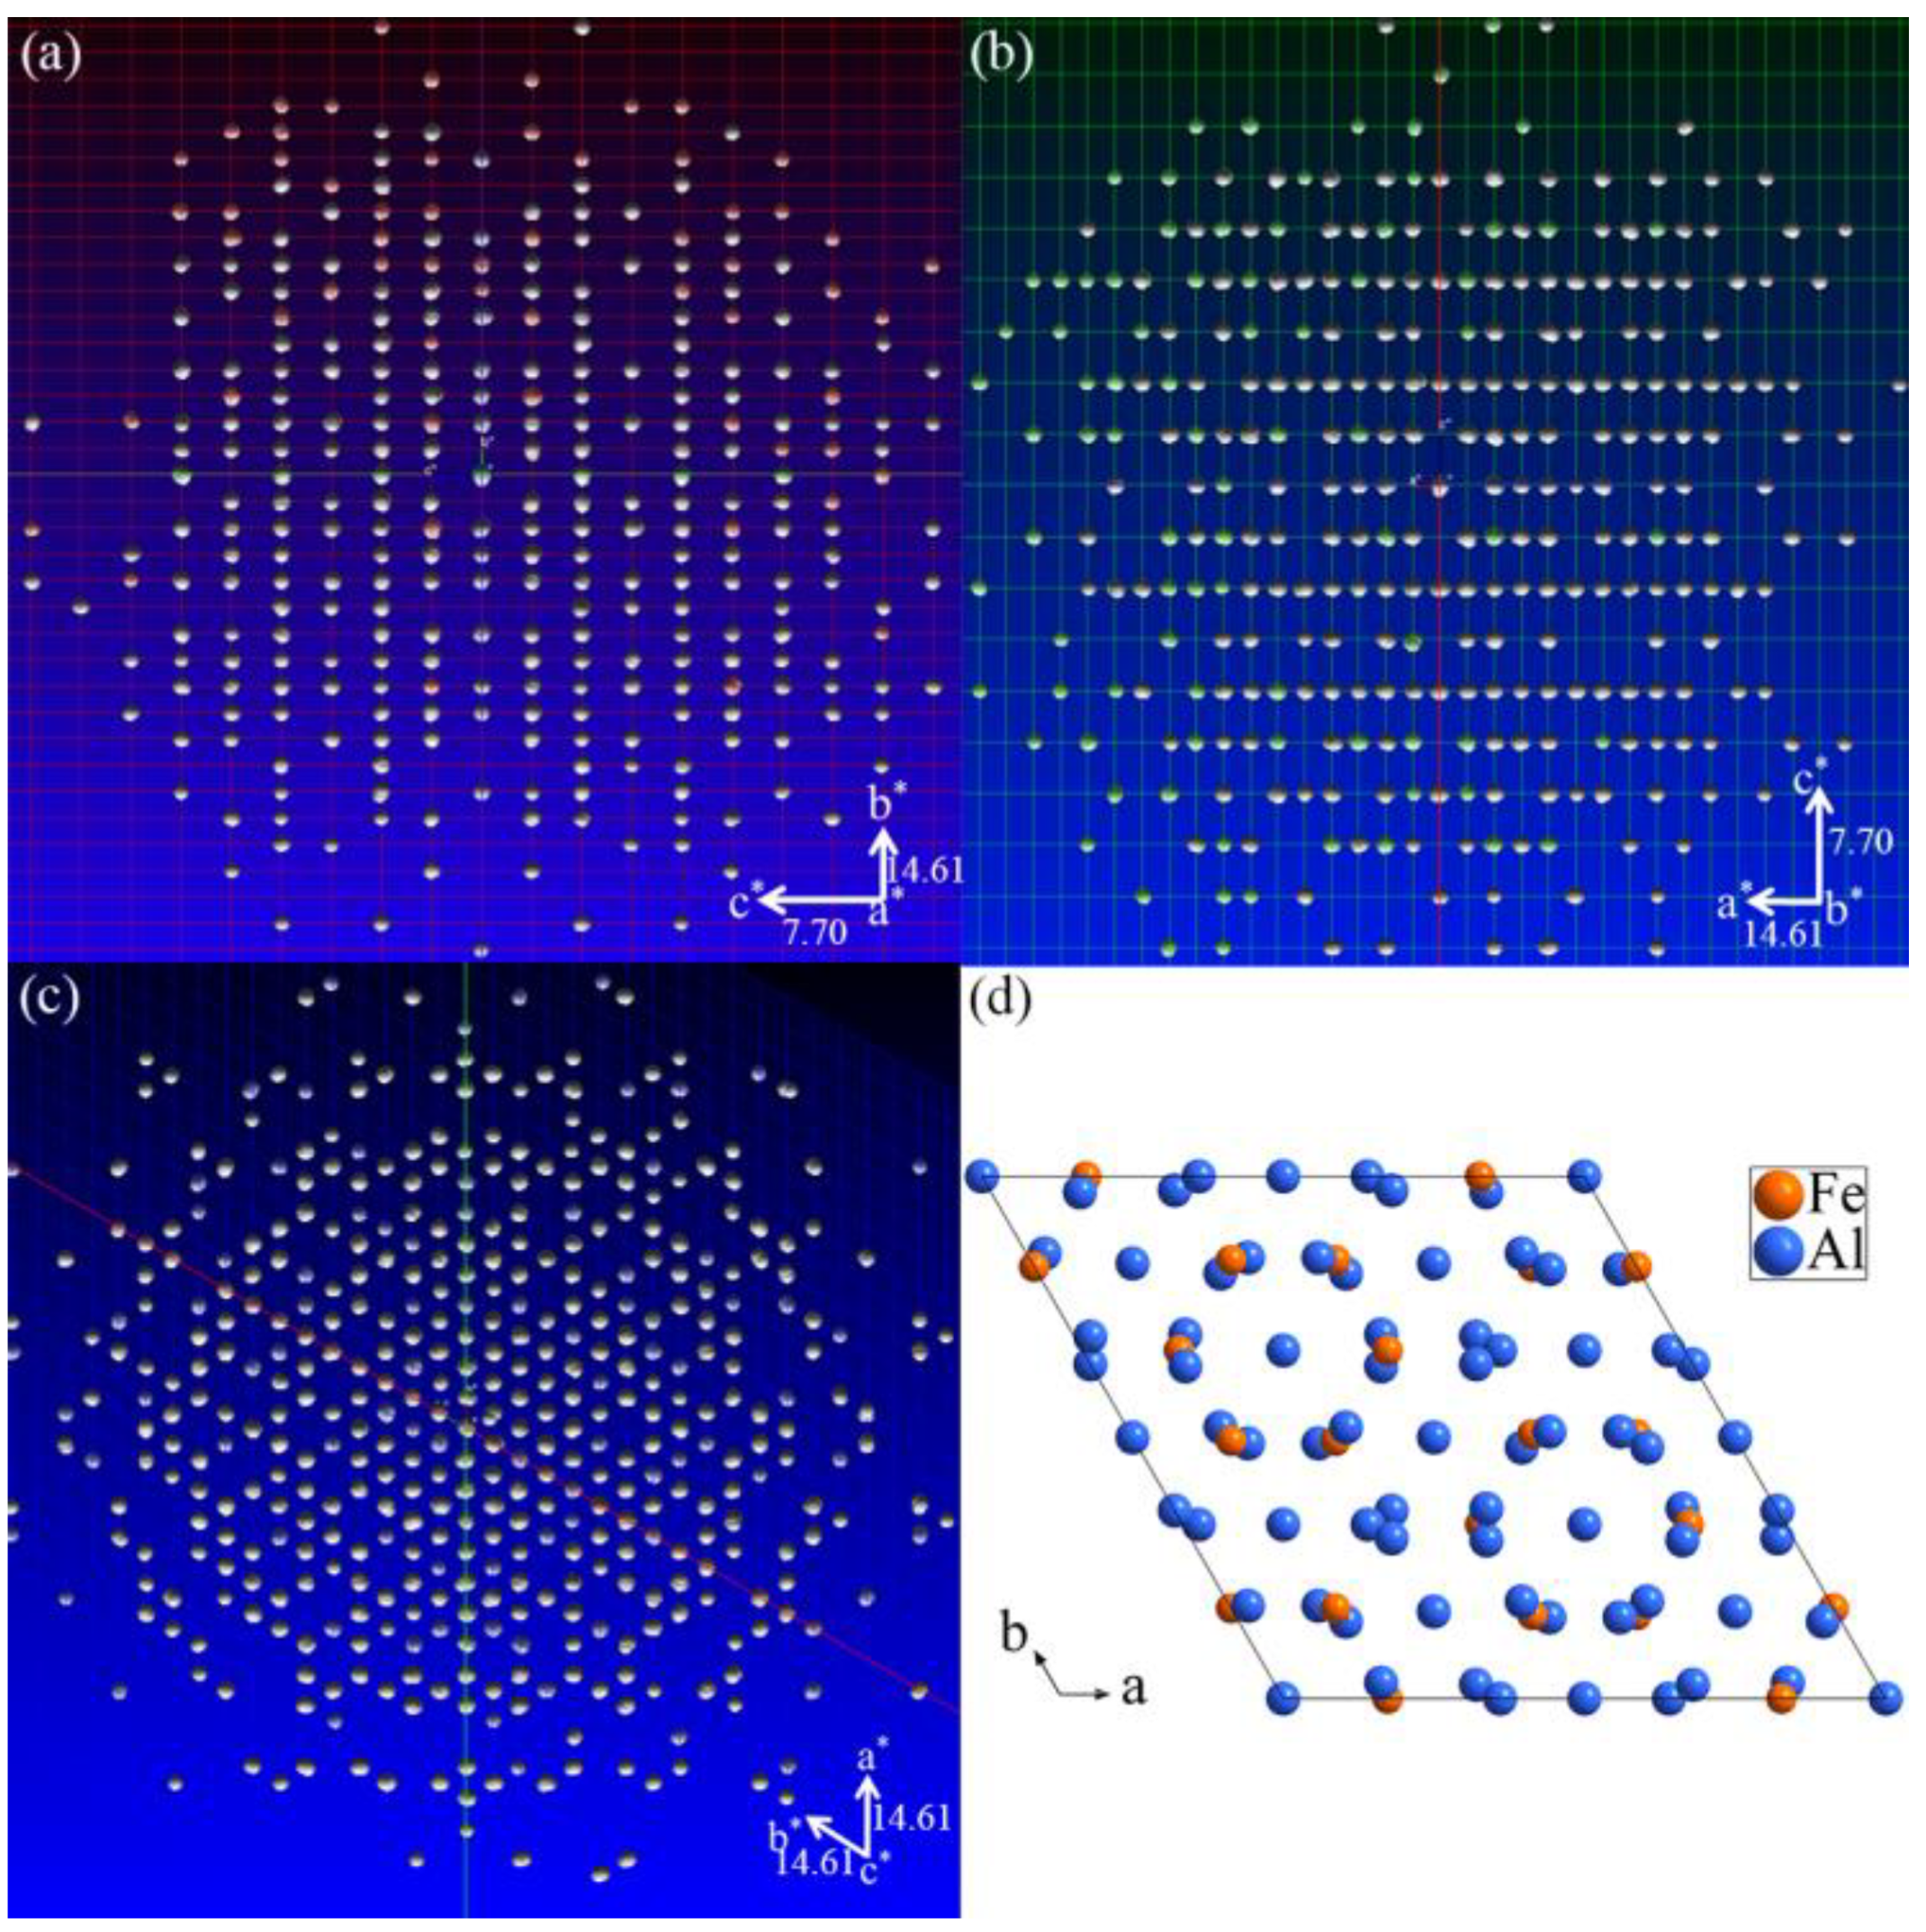
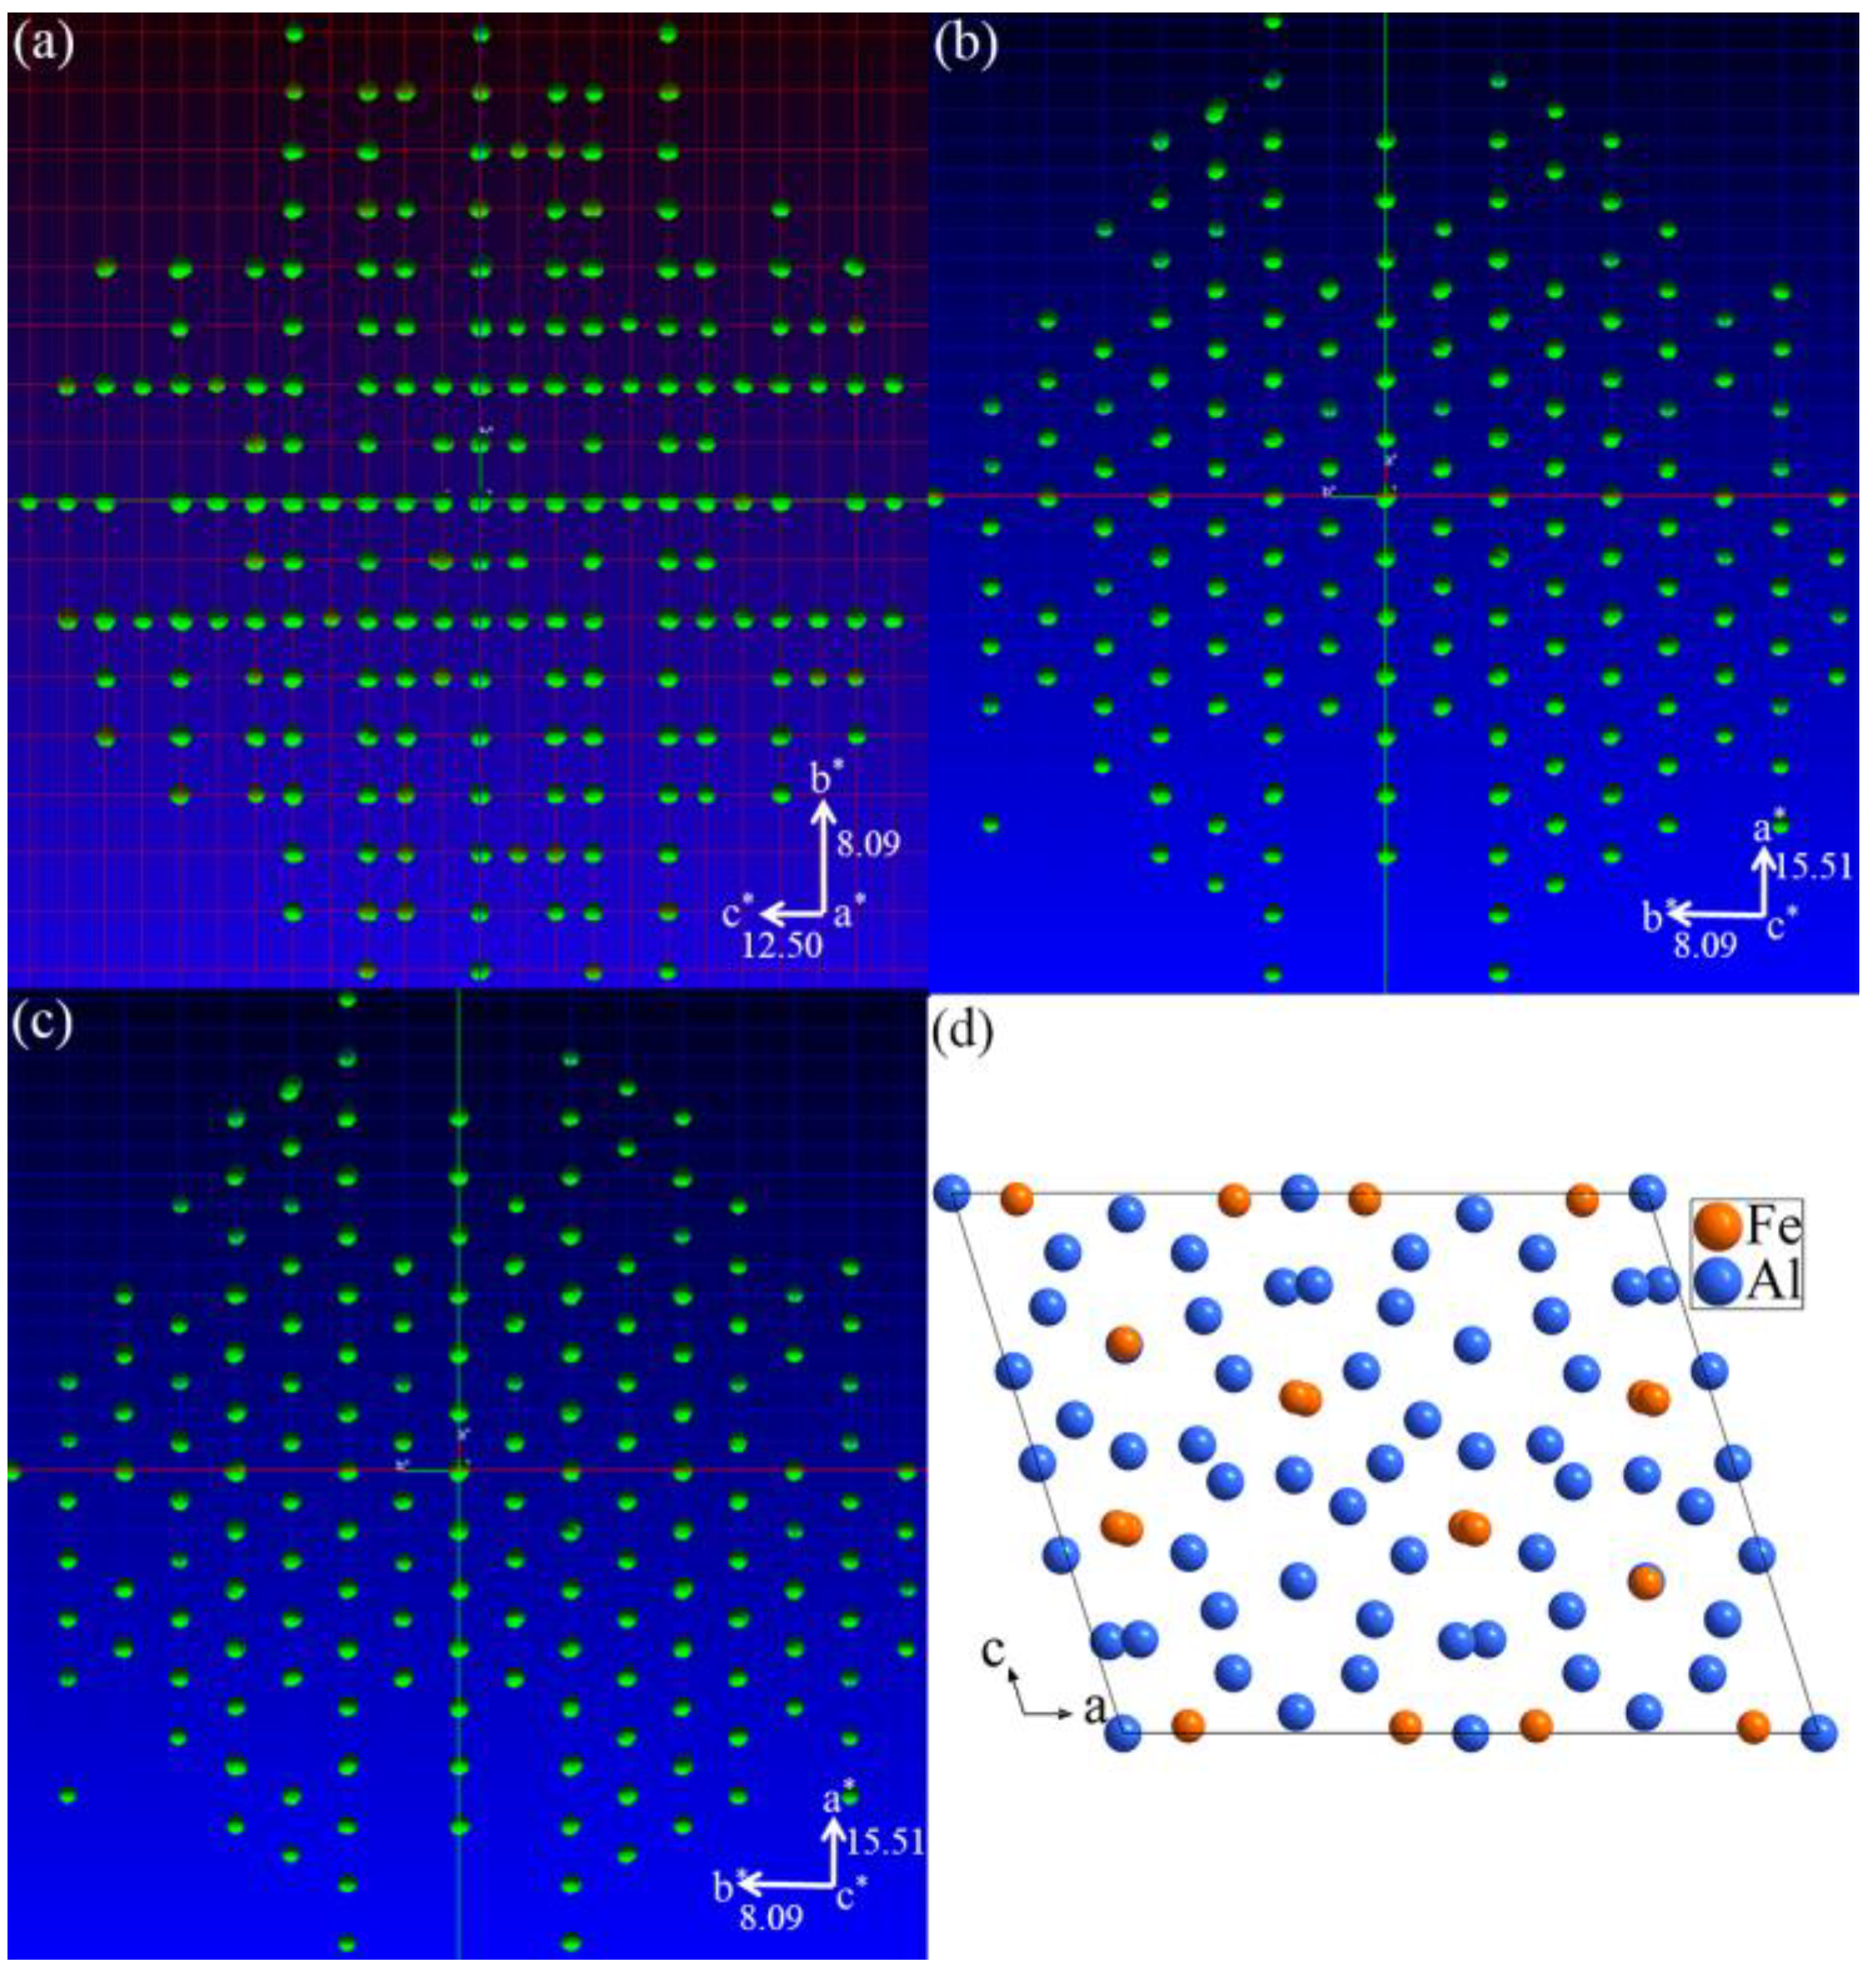
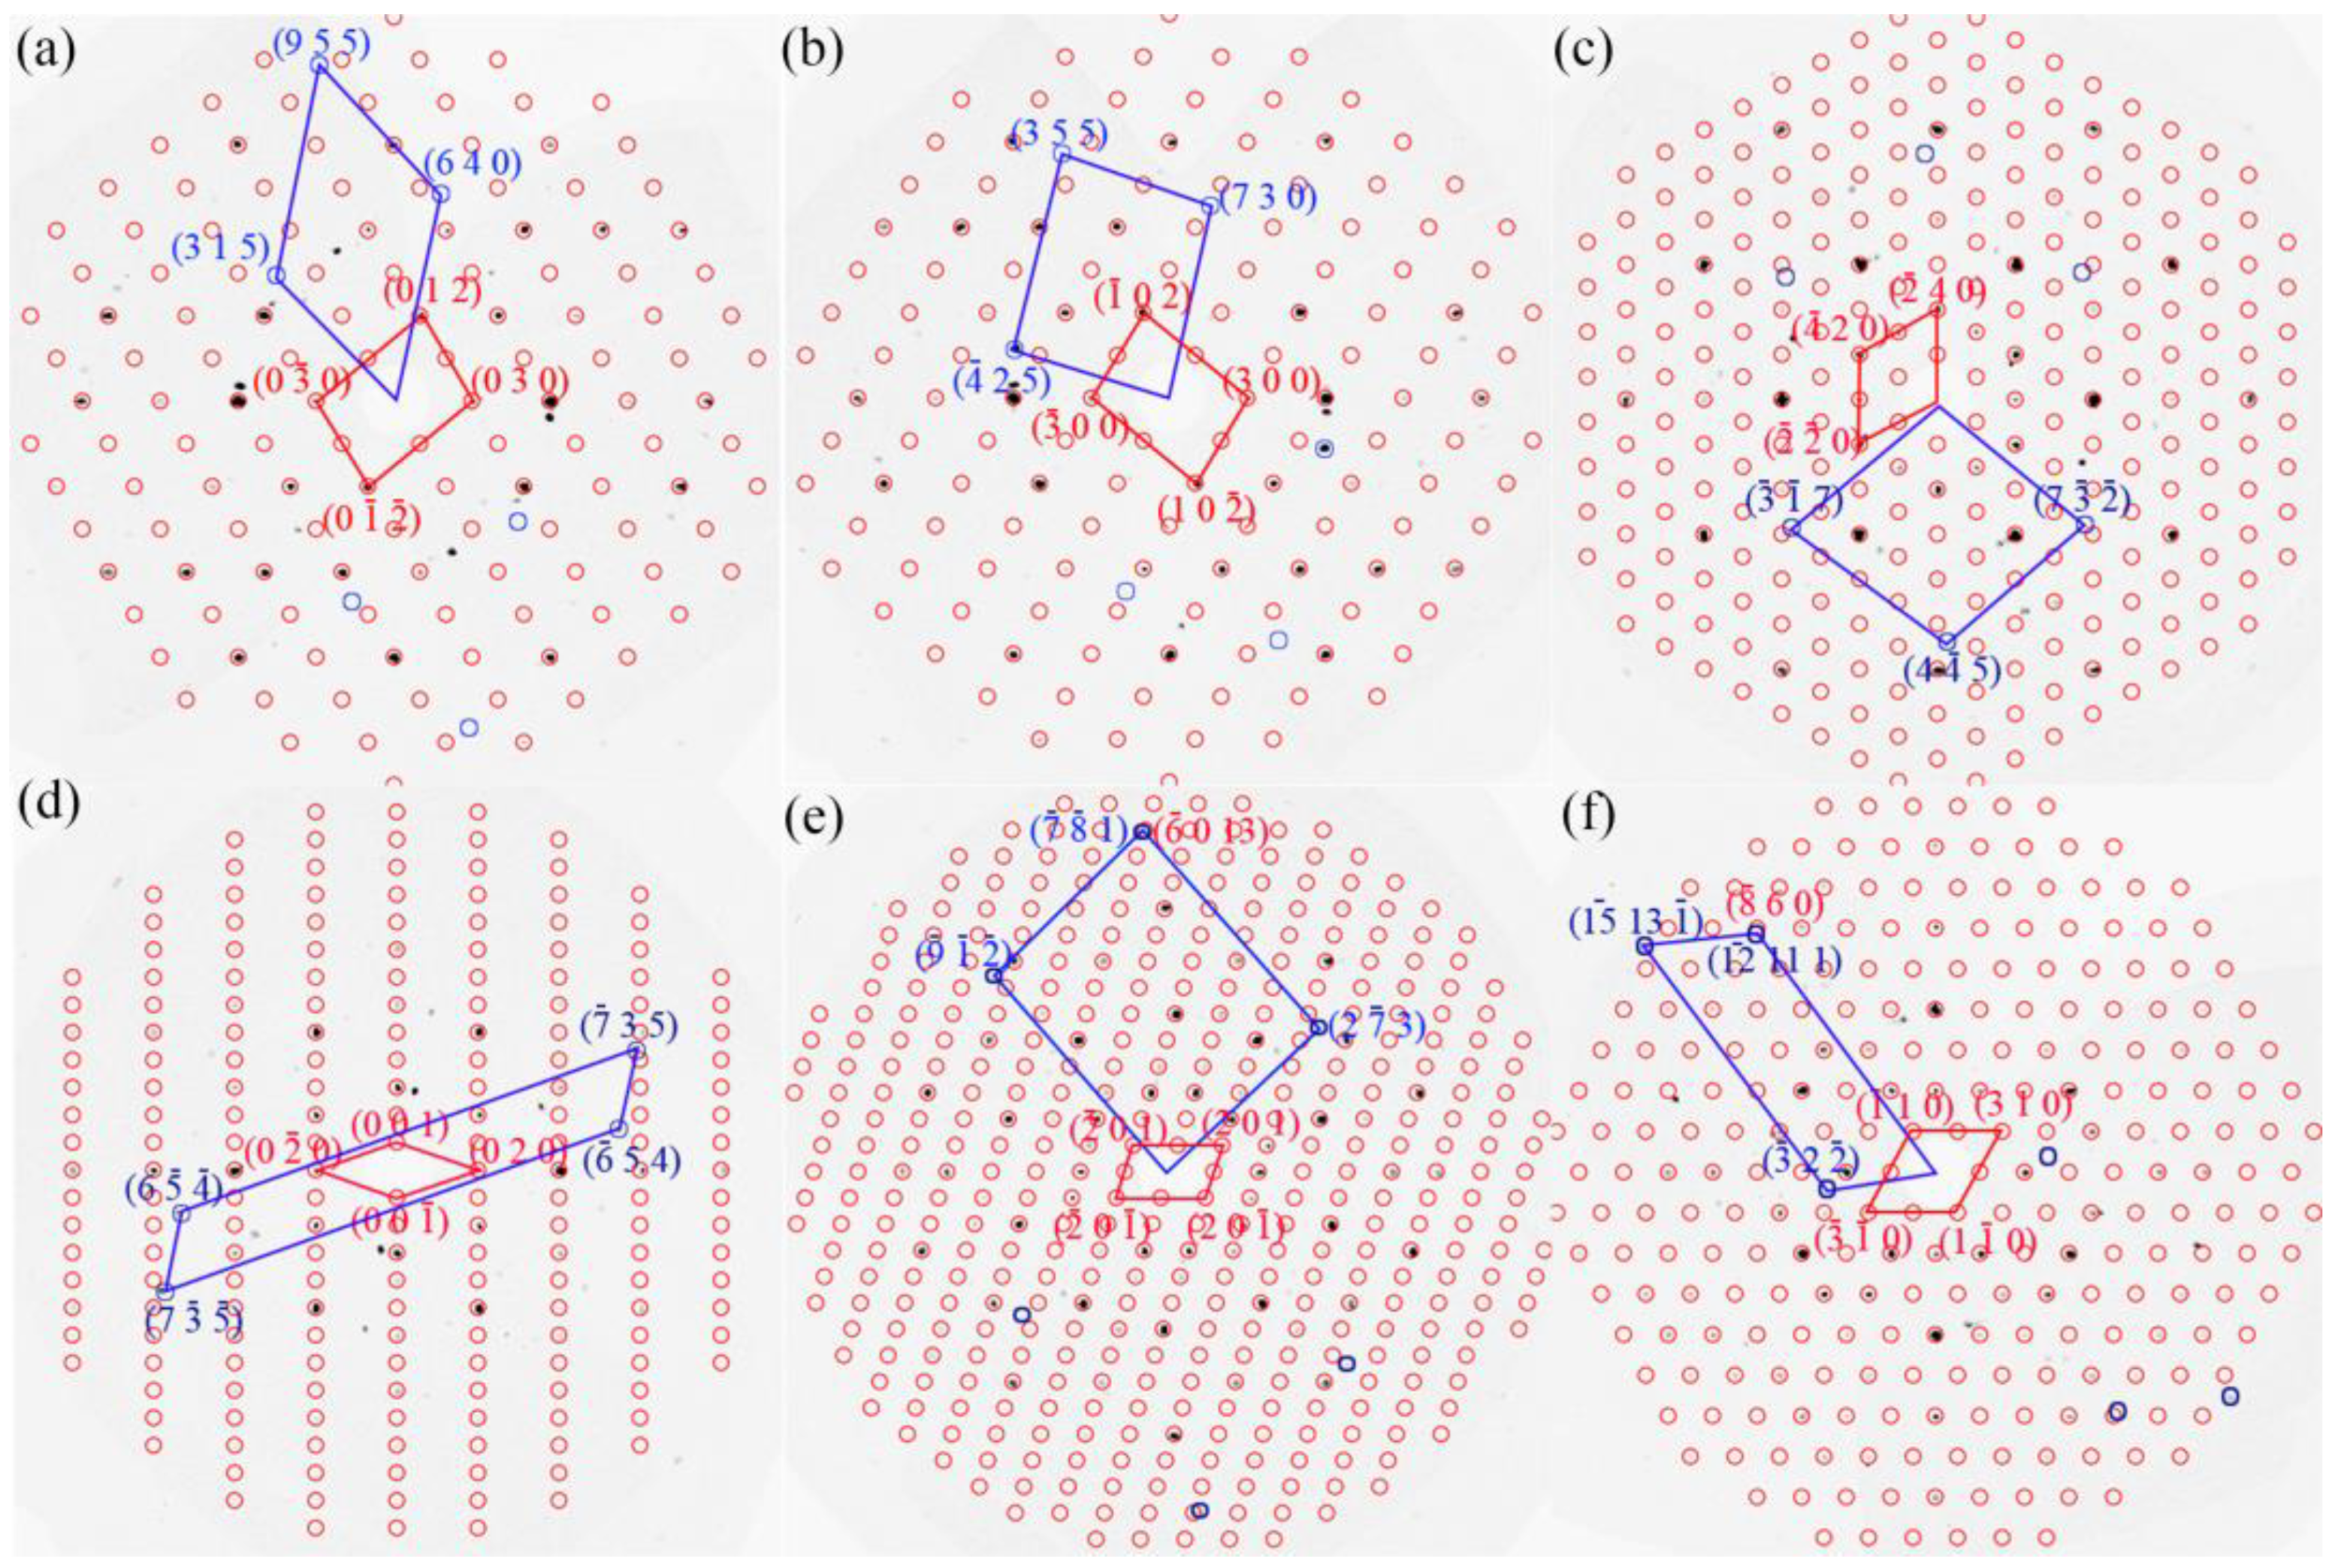
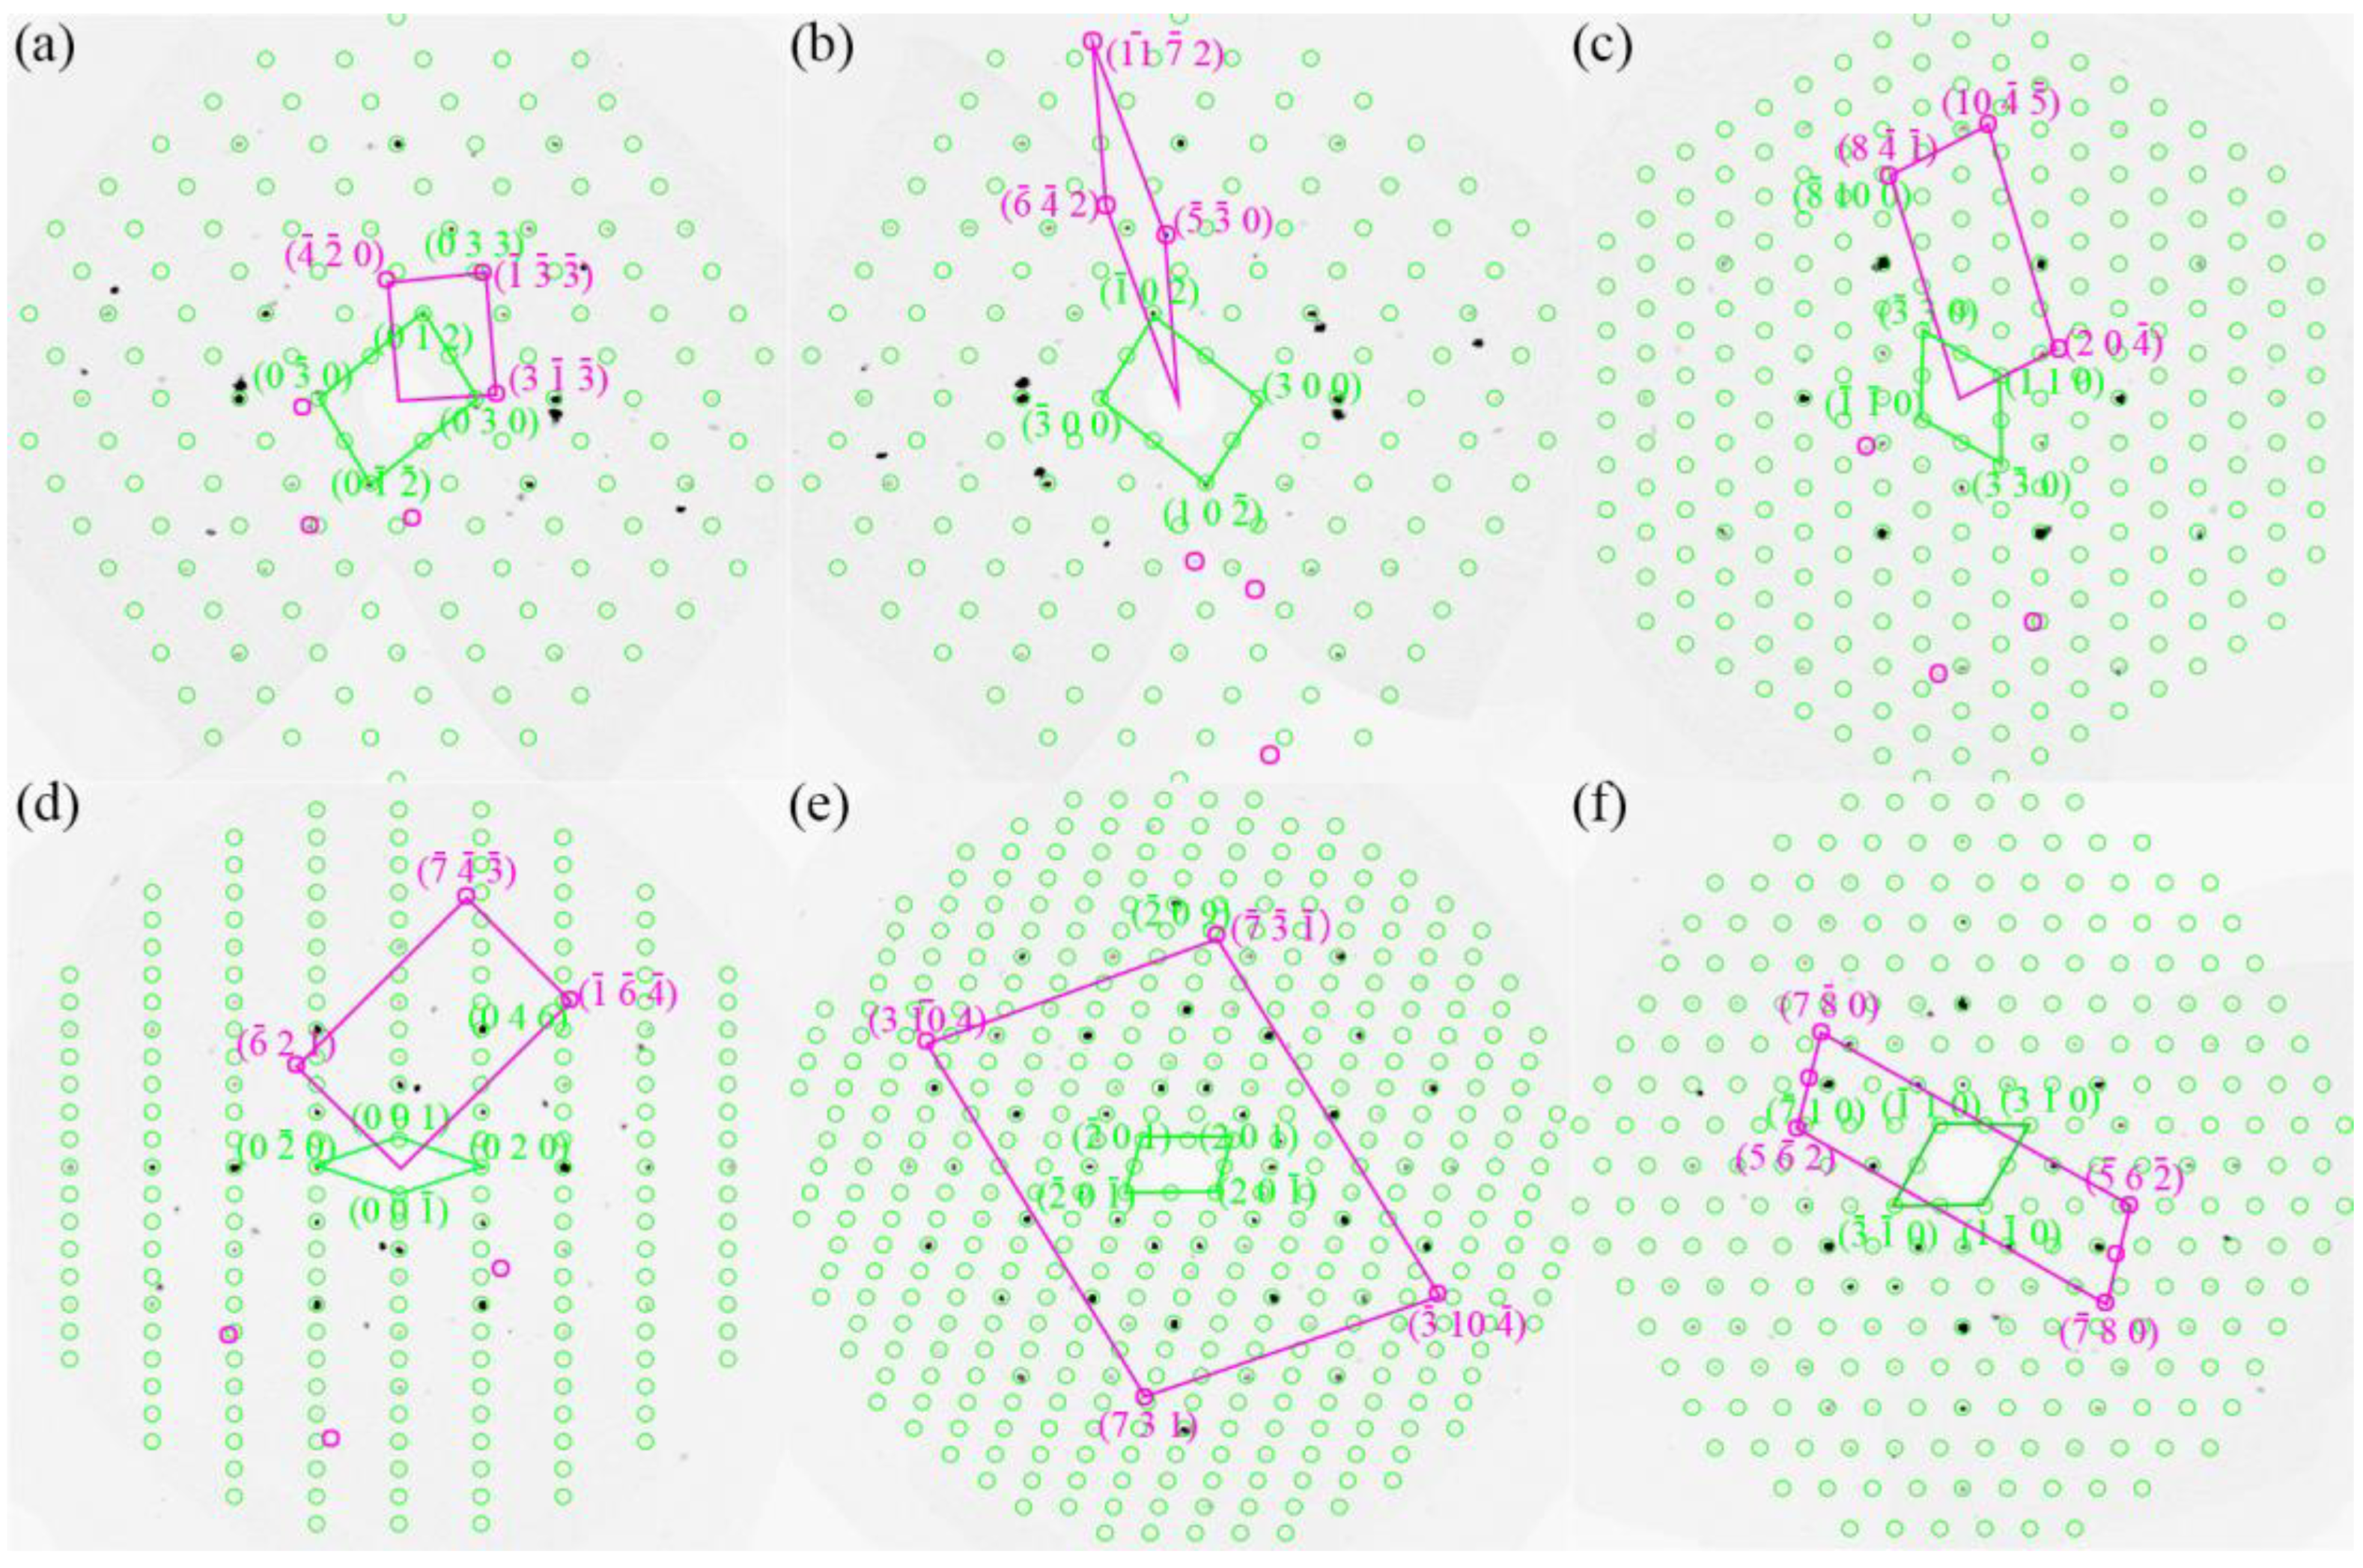
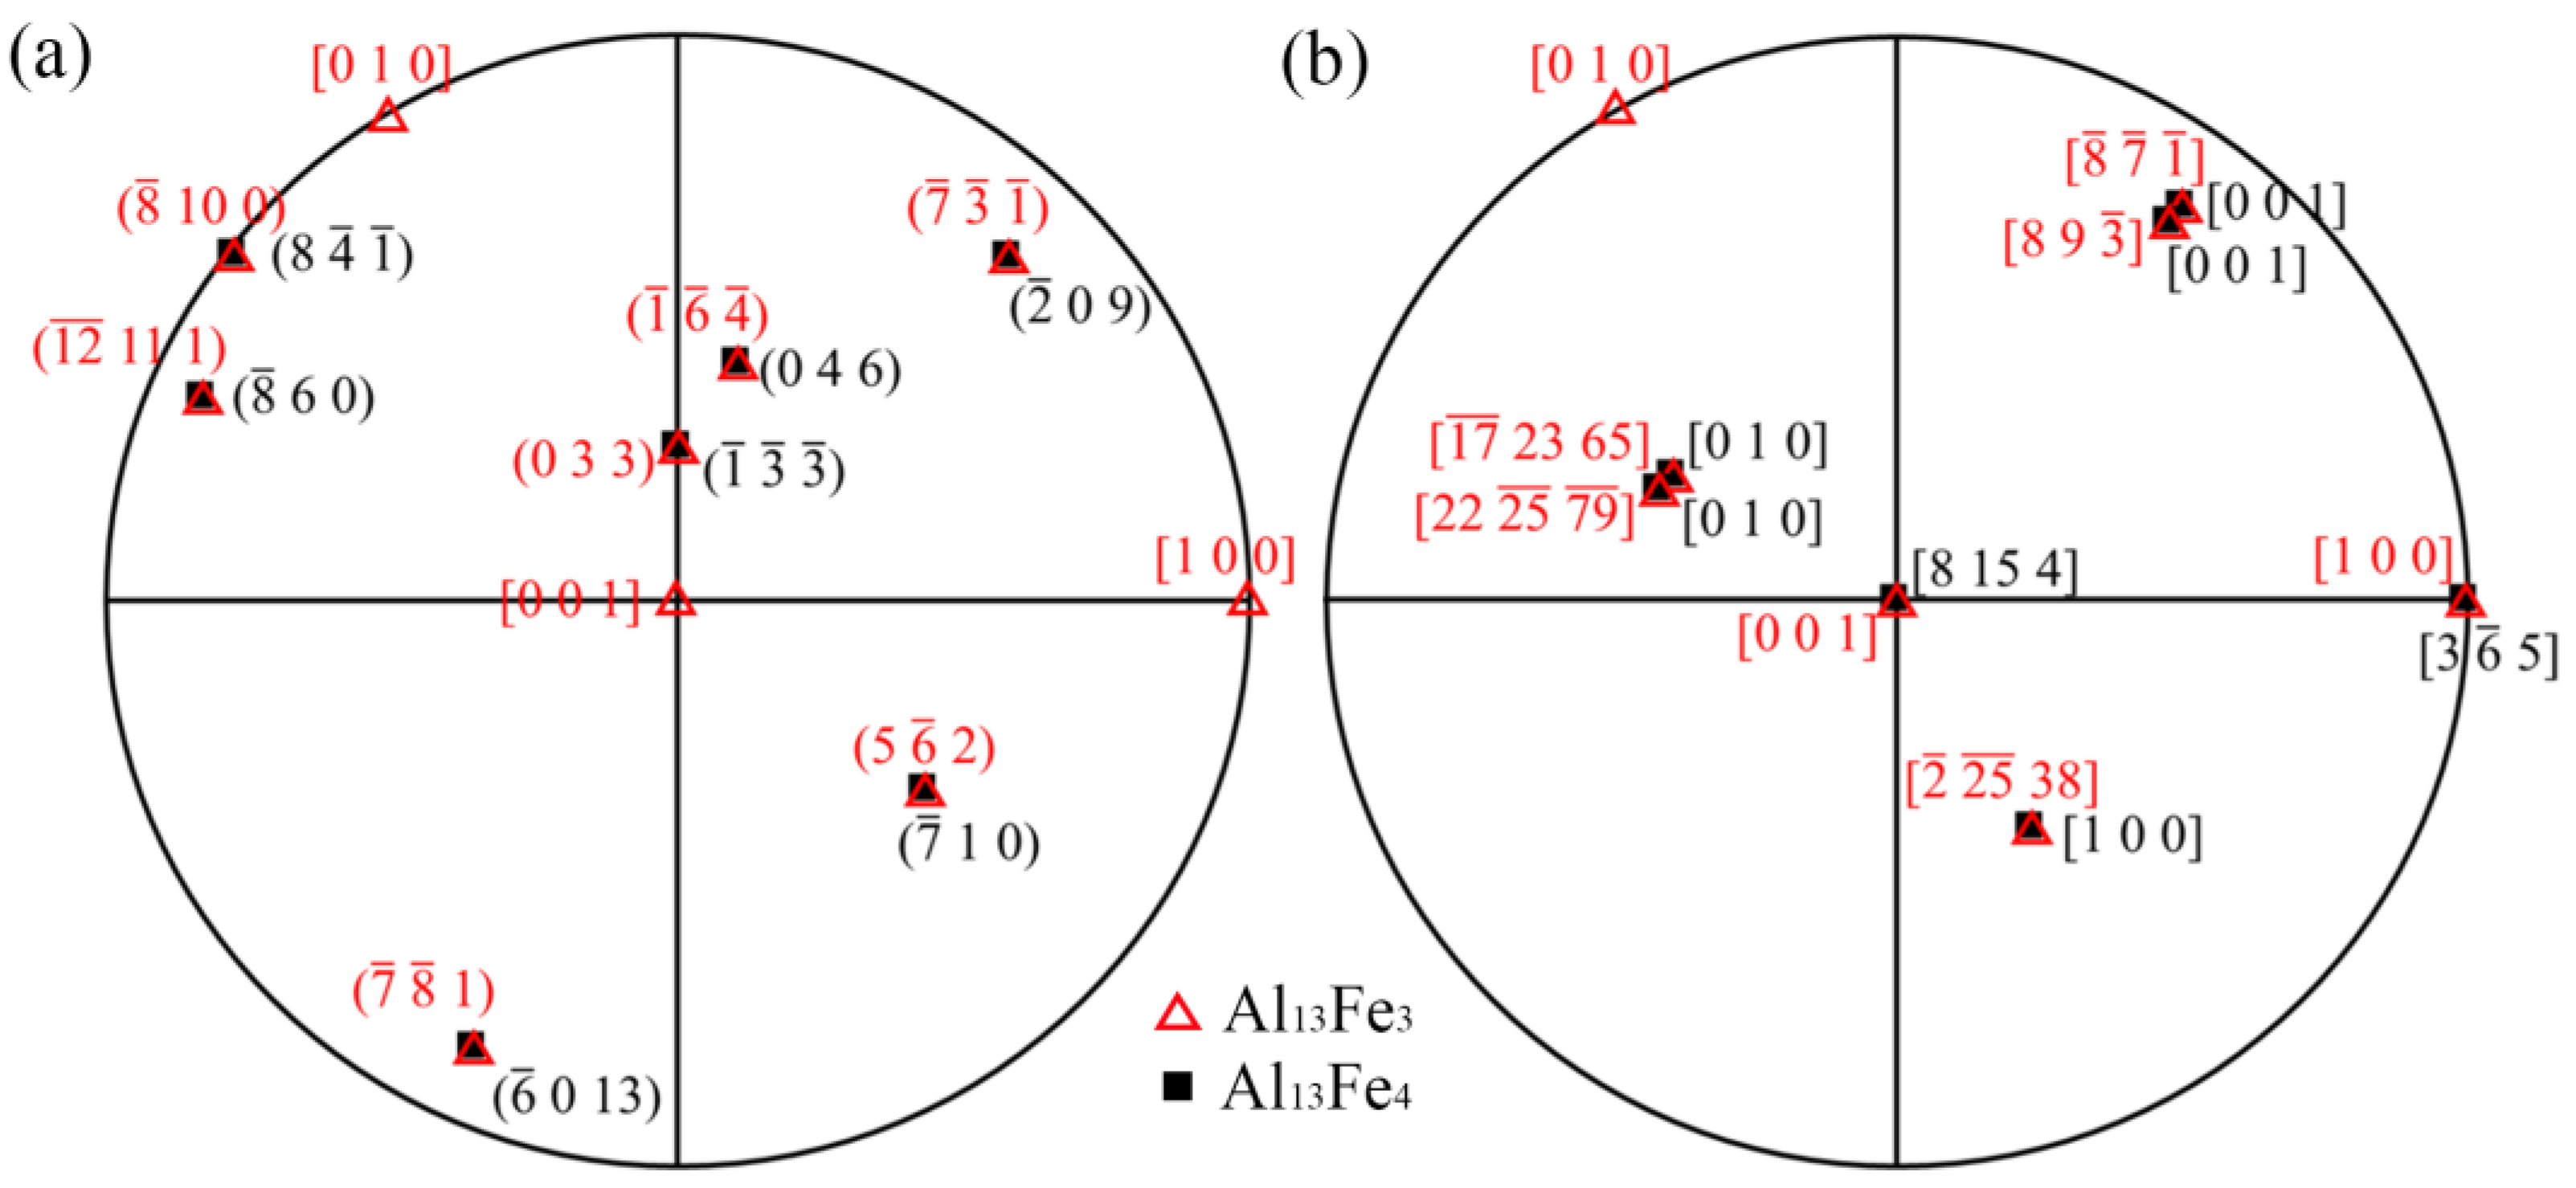
3.1. Single-Crystal XRD Patterns

Figure 1 shows the diffraction points in the reciprocal space of the entire sample, which were obtained from 11 runs of SXRD measurements. As depicted in Figure 1a, these diffraction points can be distinctly categorized into three distinct datasets. The gray and yellow diffraction points represent the Al13Fe3 phase, the gray diffraction point corresponds to the Al13Fe3-1 phase, and the yellow diffraction point corresponds to the Al13Fe3-2 phase. The green diffraction points represent the Al13Fe4 phase. Figure 1b–d show the diffraction points projection of any two datasets so that it can be more clearly seen that they belong to different datasets. An individual analysis of the three datasets was conducted. The SXRD analysis of the sample involved a total of 11 runs, resulting in the collection of 9913 diffraction points in reciprocal space when the criterion of I/σ(I) equaled 7 for phase indexing. Within these diffraction points, 4572 were attributed to the Al13Fe3_1 phase, 1213 to the Al13Fe3_2 phase, and 2342 to the Al13Fe4 phase. The remaining 1786 diffraction points were associated with anomalous phases, such as amorphous structures or very small crystalline phases that could not be indexed to determine a unit cell.
Figure 2, Figure 3 and Figure 4 depict the reciprocal lattice patterns and crystal structure diagram of the Al13Fe3 and Al13Fe4 phases projected in different directions. The arrangement of diffraction points in reciprocal space appears orderly for each phase. The first dataset (highlighted in gray in Figure 1) corresponds to lattice parameters a = b = 14.61 Å, c = 7.70 Å, α = β = 90°, and γ = 120°, consistent with those of the Al13Fe3 phase as depicted in Figure 2. The second dataset (highlighted in green in Figure 1) is characterized by lattice parameters a = 15.51 Å, b = 8.09 Å, c = 12.50 Å, α = γ = 90°, and β = 107.76°, aligning with the properties of the Al13Fe4 phase as shown in Figure 3. The third dataset (highlighted in yellow in Figure 1) is identified as being identical to the first dataset.

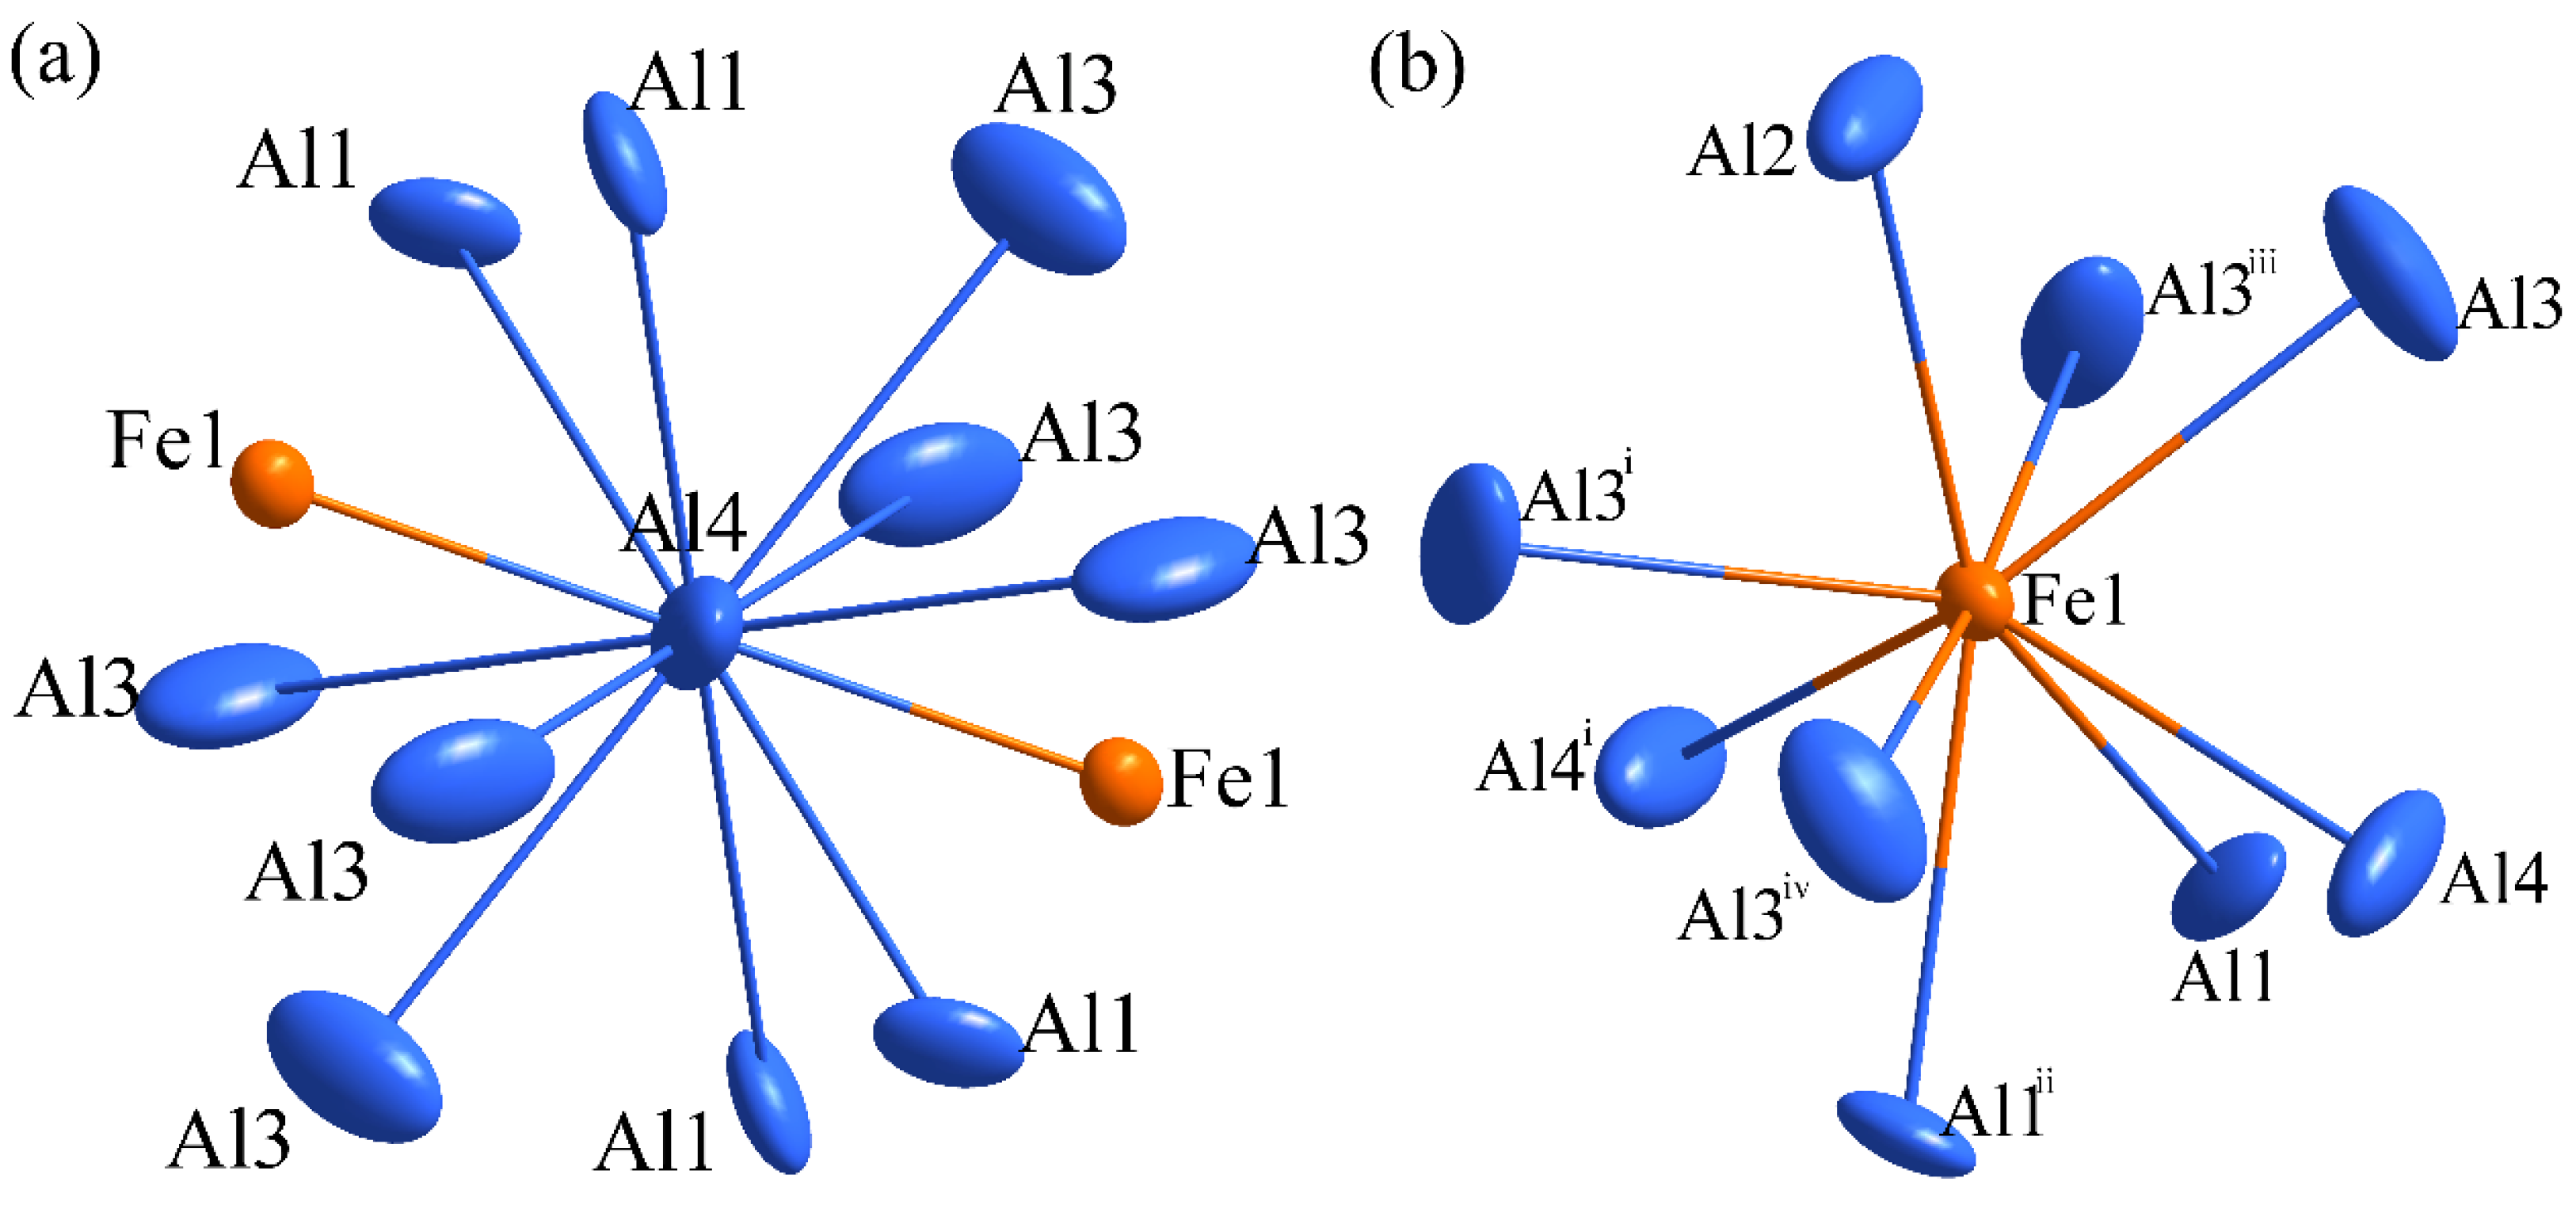
3.2. Crystal Structure Refinement of Al13Fe3 Phase and Al13Fe4 Phase

The crystallographic information, data collection, and structure refinement details for the Al13Fe3 and Al13Fe4 phases are outlined in Table 1. The crystallographic parameters of both phases conform to the standards set by international crystallography for the rationalization of crystal structures.
Table 2 shows the equivalent isotropic displacement parameters (Ueq), fractional atomic coordinates, and atomic occupancy (Occ.) of the Al13Fe3 phase. It is noteworthy that all atoms in this structure are fully occupied. Comparing the current refined crystal structure model with the Al13Fe3 phase identified in 2018 [29] reveals some differences: we find that the Al3 atom is located at the 36f Wyckoff position in the present refined Al13Fe3 structure model rather than two 18b Wyckoff positions in the previous one, resulting in its space group changing from R3c to R 3 - c.
The Al13Fe3 phase’s building units were analyzed using the nanocluster method within the Topospro software (Version 5.5.2.0). The structural model of Al13Fe3 can be characterized by a single type of cluster, Al3(1)(1@12), which is an icosahedral cluster with the Al3 atom positioned at the cluster’s center. In Figure 5a, the central atoms and the isolated atoms (atoms in the purple circle, which refers to the single atom that the structural model can contain to fill the space between the nanoclusters [59]) of the cluster were depicted within the Al13Fe3 unit cell. The cluster assembly model of the Al13Fe3 unit cell along the direction [001] is shown in Figure 5b. The clusters are connected in two ways: collinear and coplanar. In Figure 6, the surroundings of Al4 and Fe1 atoms are depicted. Al4 atoms are encircled by a total of 12 atoms: 4 Al1, 6 Al3, and 2 Fe1 atoms. On the other hand, Fe1 atoms are surrounded by nine atoms: two Al1, one Al2, four Al3, and two Al4 atoms. The closest distance between Fe1 and Al4 atoms measures 2.4715 Å.
Table 3 shows the equivalent isotropic displacement parameters (Ueq), fractional atomic coordinates, and atomic occupancy (Occ.) of the Al13Fe4 phase. All atoms in this structure are fully occupied which is nearly identical to the structure model of Sugiyama et al. reported in 2012 [60]. It should be noted that the ‘EADP AL2 AL3 AL6’ instruction was used to eliminate the N.P.D. alerts for Al2 and Al6 atoms and the ADP alert for the Al3 atom that are caused by these atoms during the refinement process of the Al13Fe4 phase (see the Al13Fe4 CIF file in the Supplementary Materials).
We focused on the structural model of Al13Fe4. It was discovered that the structure of Al13Fe4 can be explained using two different cluster models: Al15(1)(1@12) and Al7(2)(1@12@46). The Al15(1)(1@12) cluster is an 18-hedron cluster with Al15 atom as the center, which can be seen in Figure 7c. The Al7 atom serves as the heart of the complicated double-shell cluster referred to as Al7(2)(1@12@46). Twelve coordinated atoms (Al2, Al13, Al14, and Fe2) make up the first shell, or inner shell, which is represented as an icosahedron in Figure 7a. The centered Al7 and Al2, Al13, Al14, and Fe2 have atomic distances of 3.242 Å, 2.816 Å, 2.711 Å, and 2.468 Å, respectively. The outer shell consists of atoms that are coordinated, with 46 atoms, including 4 Al1 atoms, 4 Al10 atoms, 4 Al11 atoms, 8 Al12 atoms, 6 Al3 atoms, 4 Al4 atoms, 2 Al6 atoms, 2 Al8 atoms, 4 Al9 atoms, 4 Fe1 atoms, and 4 Fe5 atoms as shown in Figure 7b. These two types of clusters are closely connected to form the global crystal structure of the Al13Fe4 phase as shown in Figure 7d. Figure 8 illustrates the surroundings of the Al7 and Al15 atoms. Each Al7 atom is encompassed by 12 neighboring atoms, comprising 3 Al13, four Al14, 2 Al2, and 2 Fe2 atoms and 1 Al1 atom. Similarly, each Al15 atom is surrounded by 12 neighboring atoms, which includes 2 Al1, 2 Al6, 2 Al10, 2 Al11, 2 Fe3, and 2 Fe4 atoms.
There are two interesting phenomena: First, all of the atoms in the Al13Fe3 and Al13Fe4 phases are completely occupied, and there are no disordered defects. Second, through topological analysis of the structures of Al13Fe3 and Al13Fe4, twisted icosahedrons were found in both of these structures as building units. We deduce that it is the structural similarity that governs the intergrowth between the two phases.

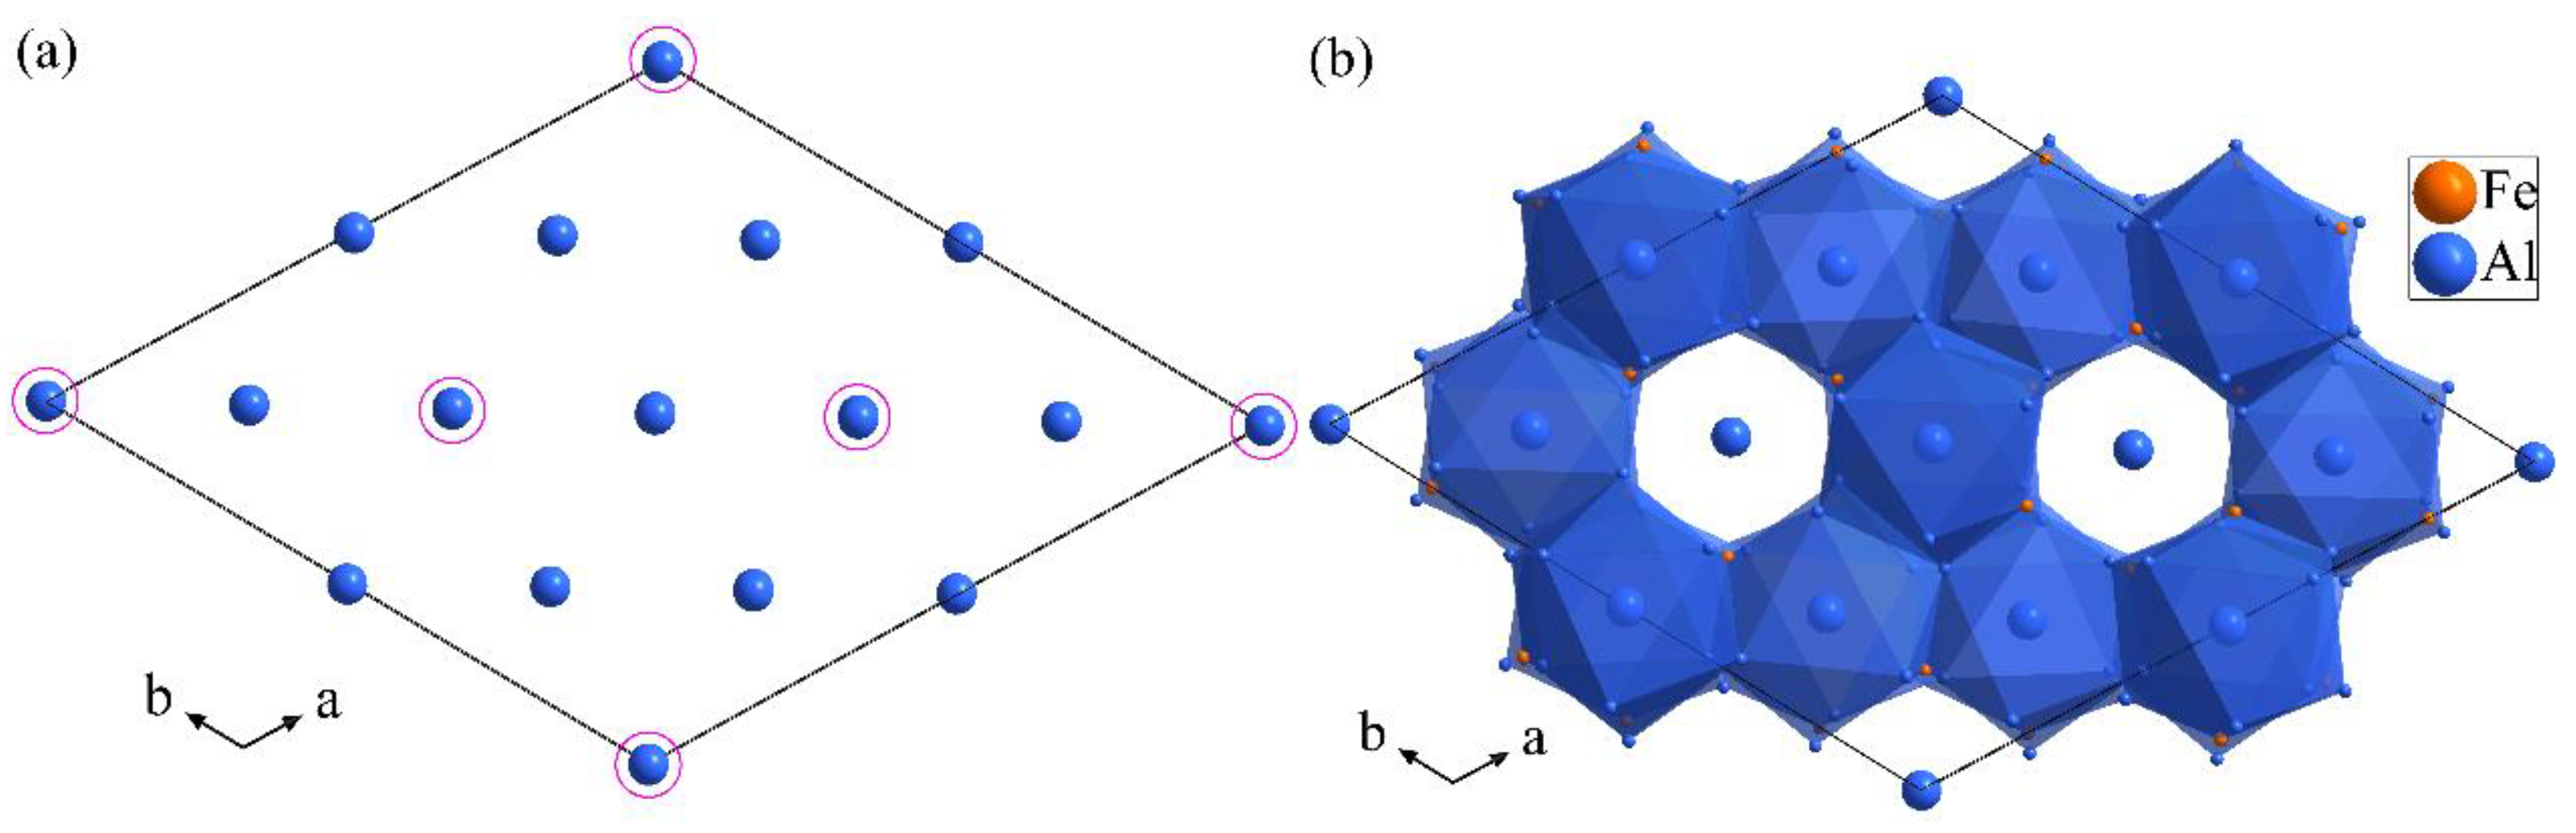
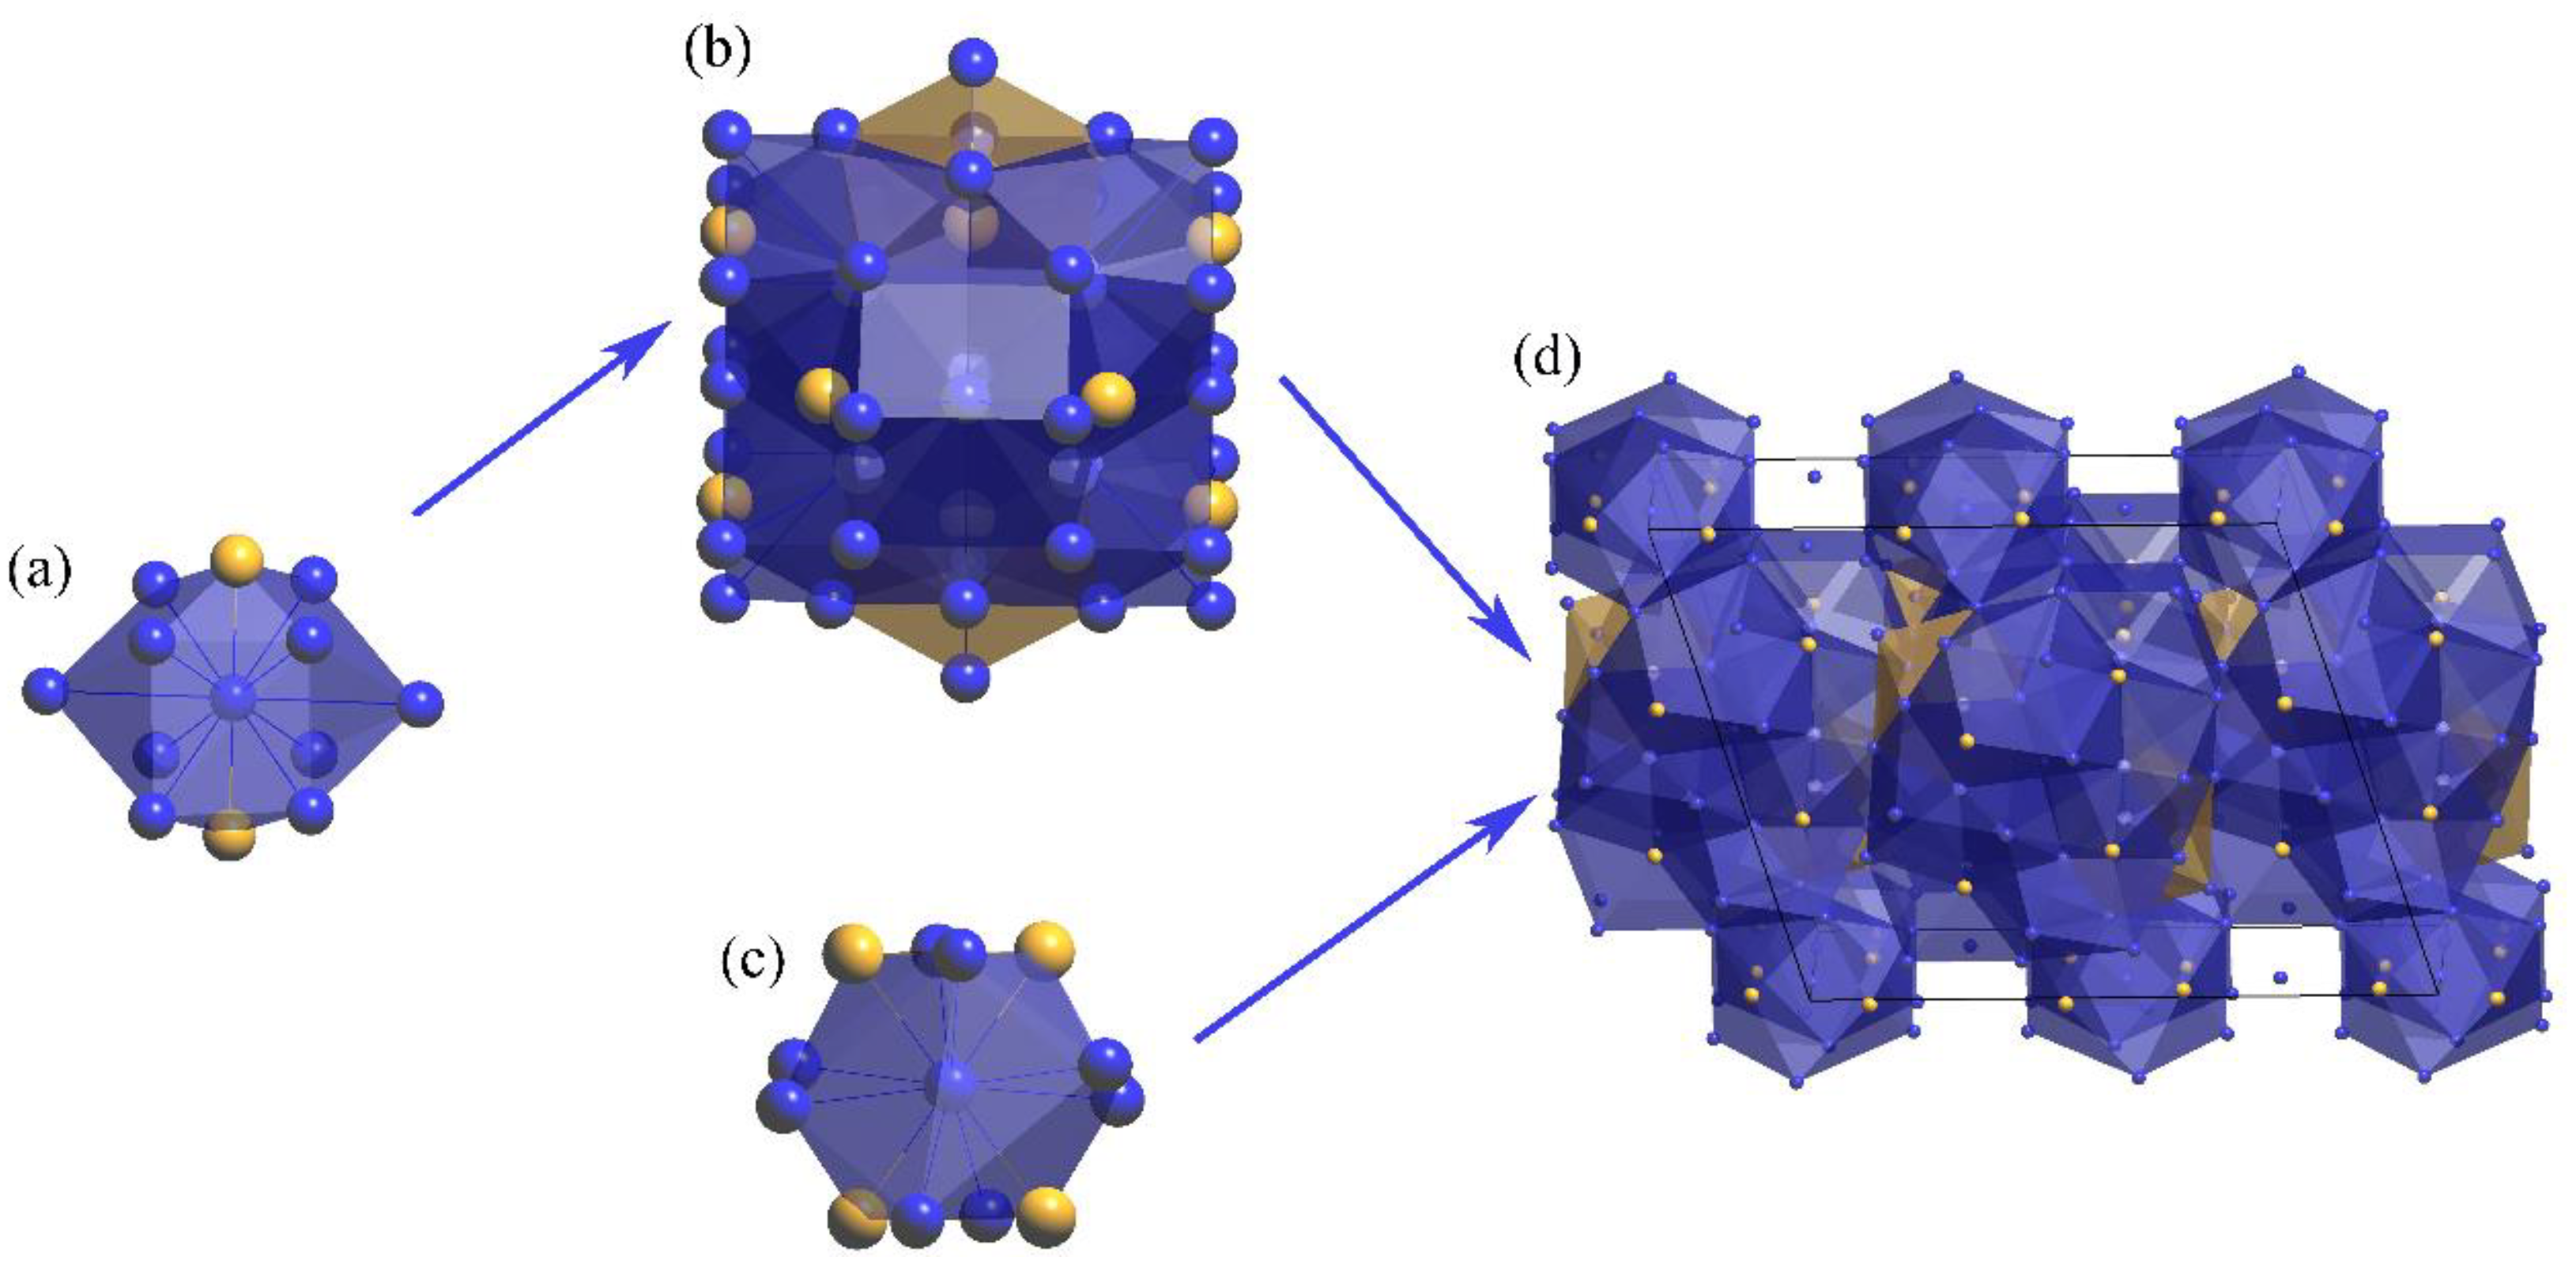
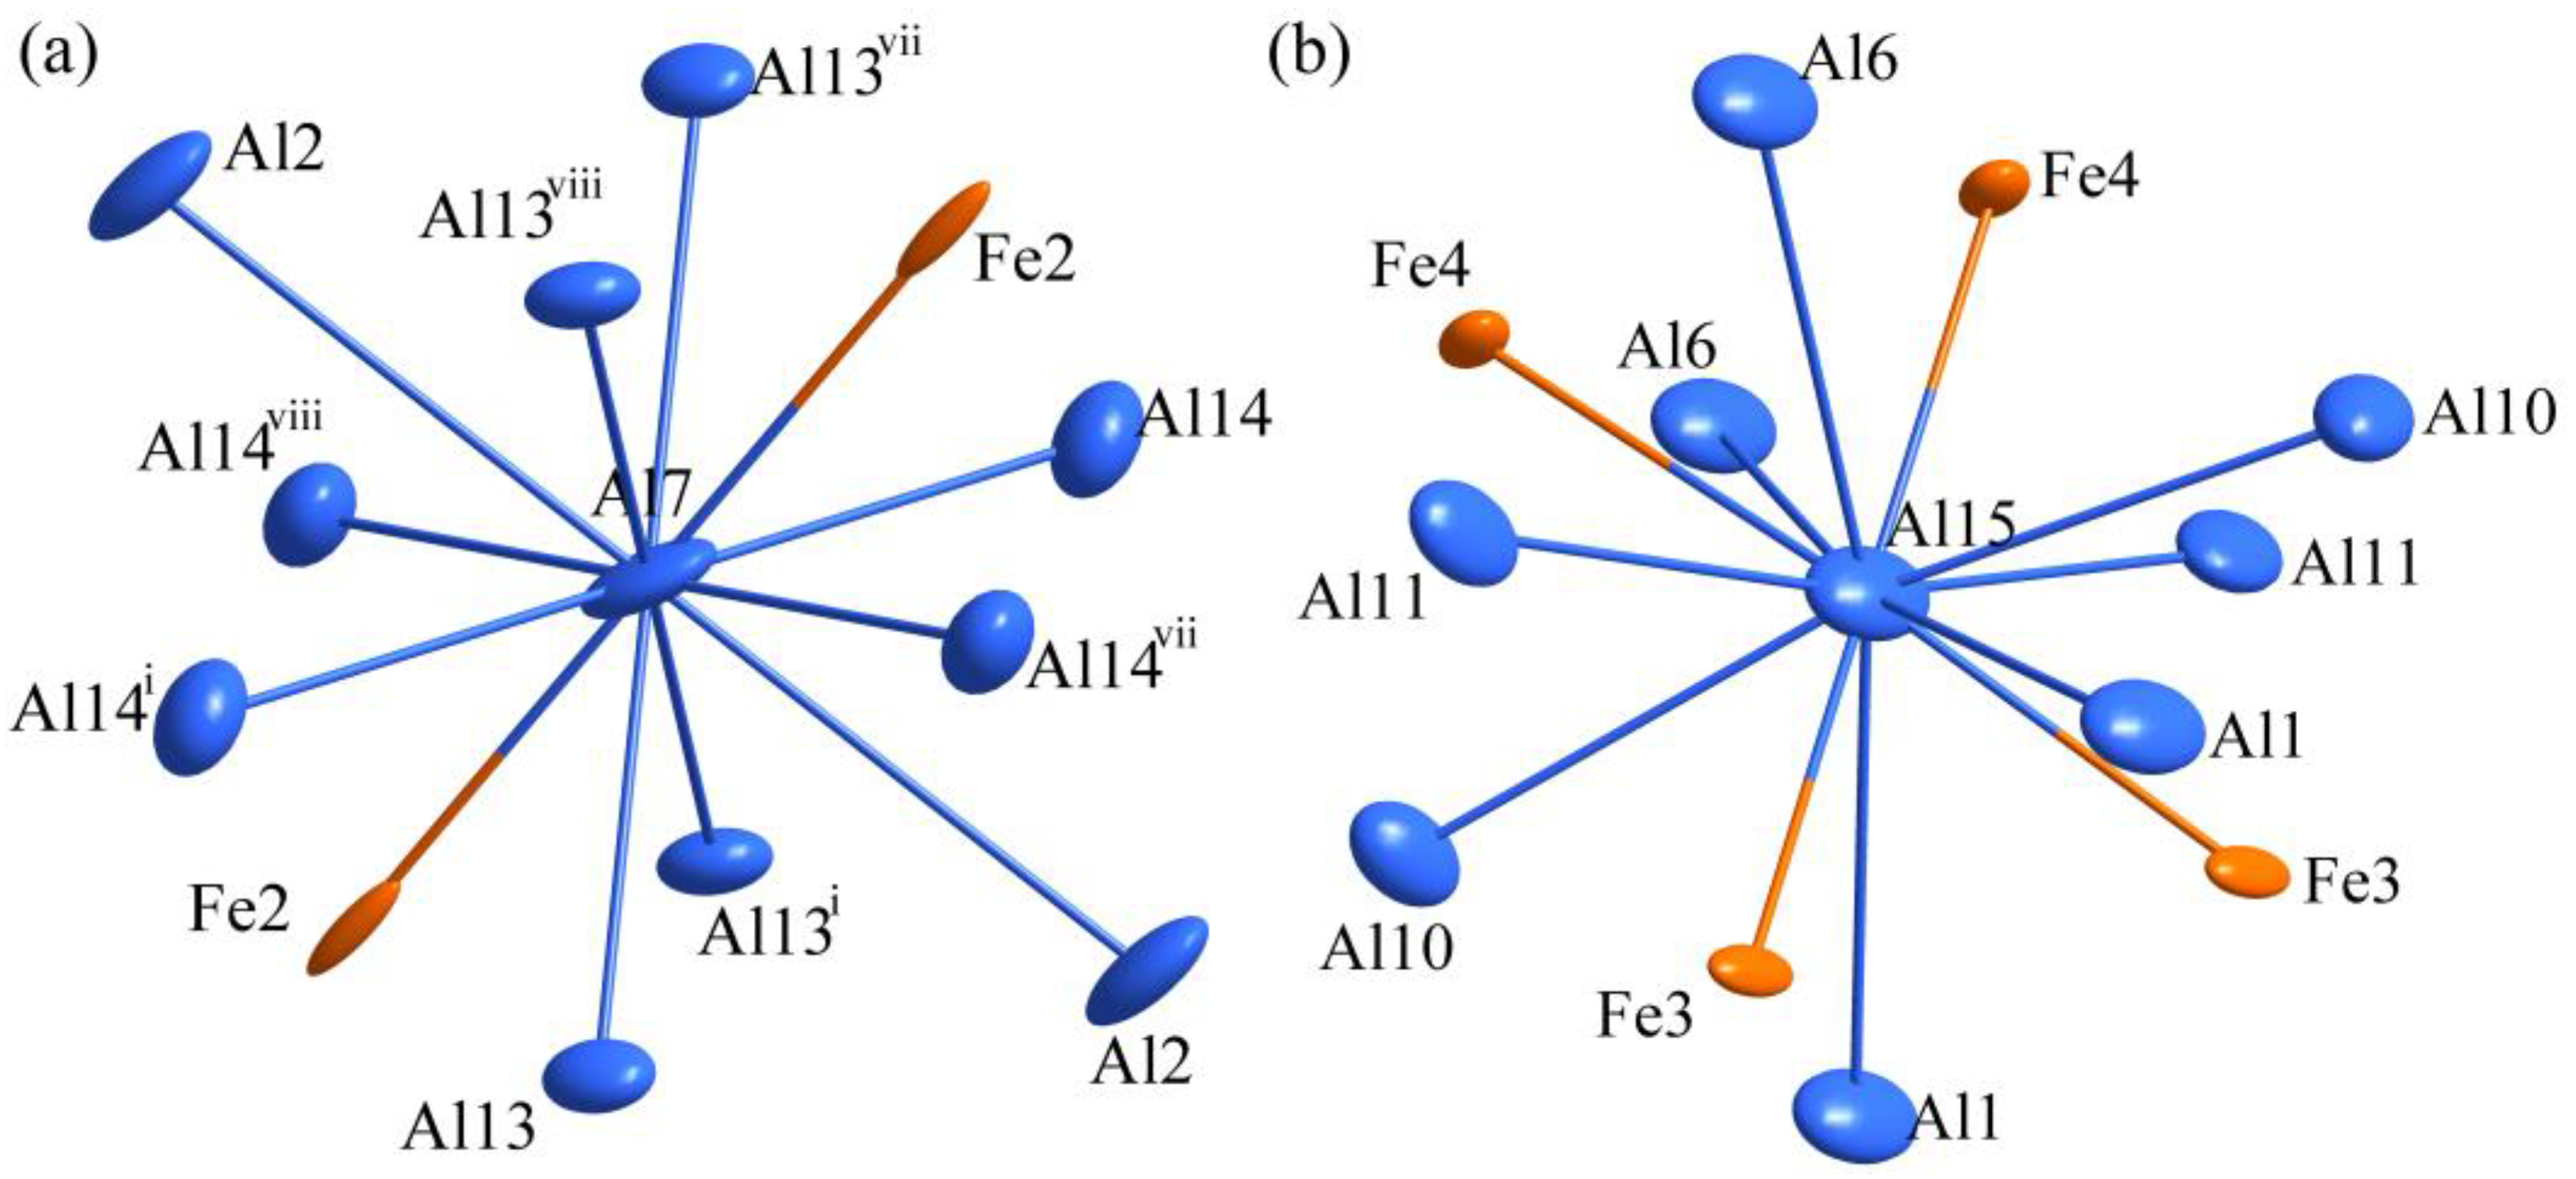
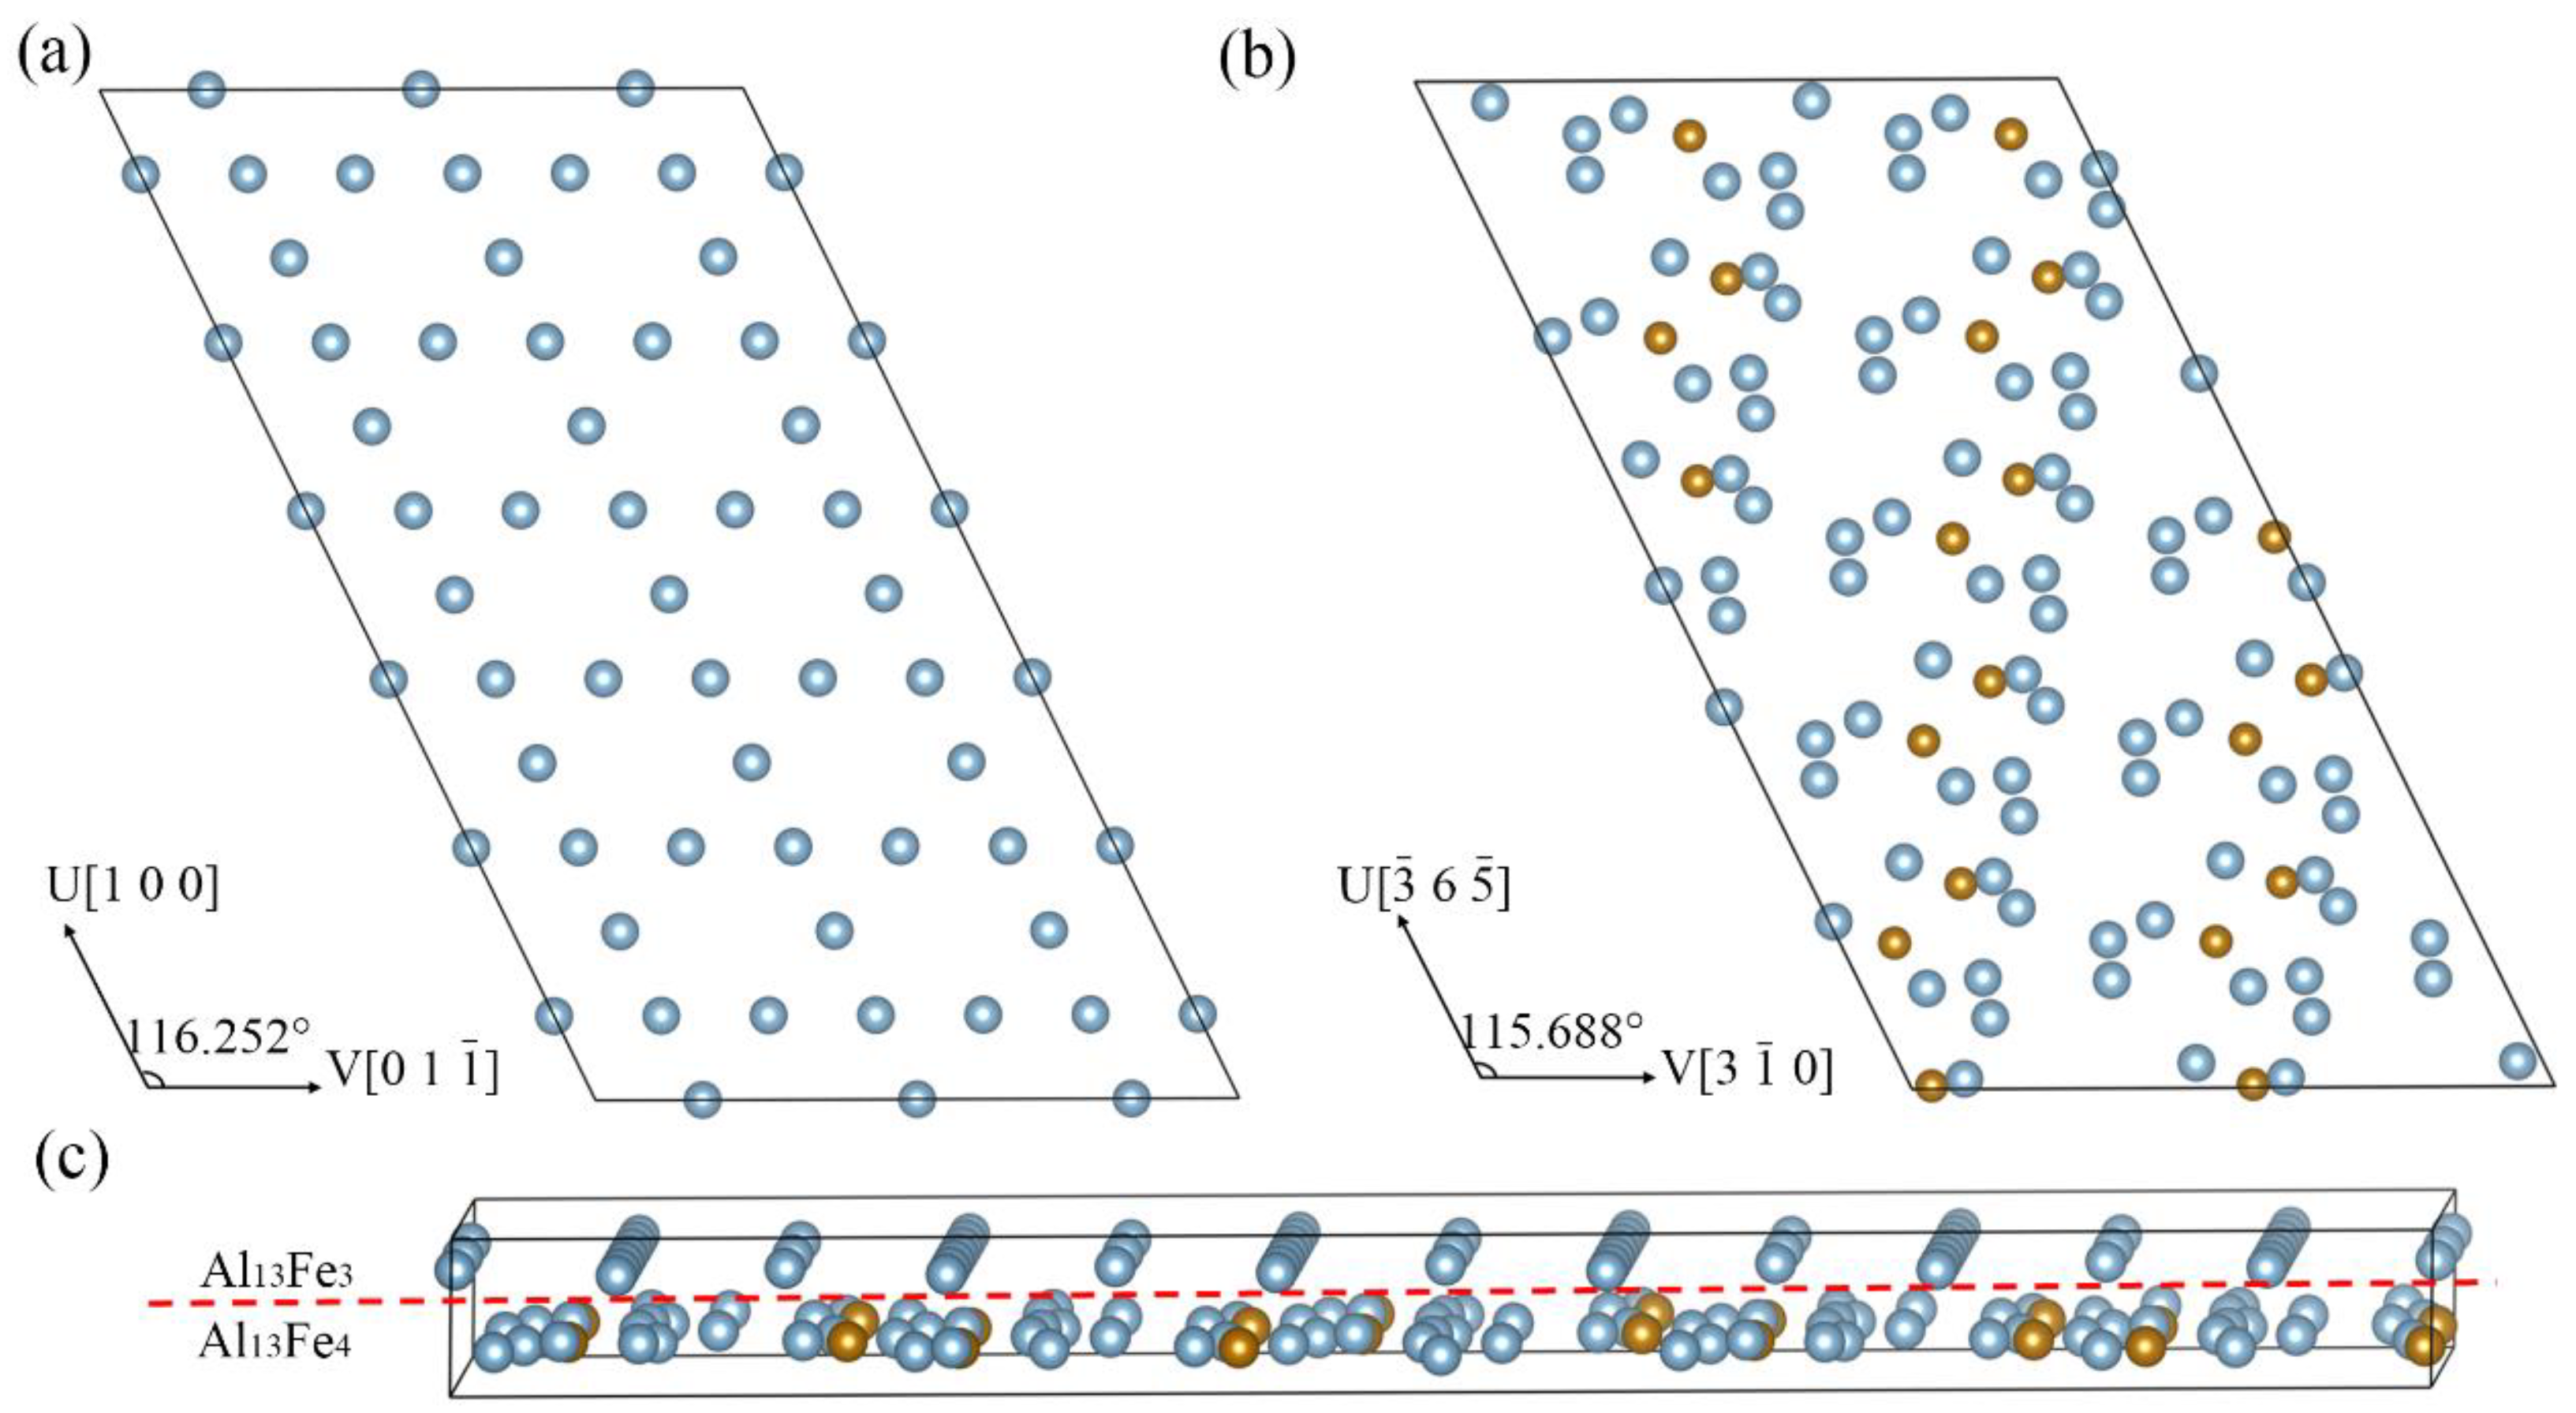
3.3. Structure Models of the Al13Fe3 and Al13Fe4 Intergrowth Phases in Real Space

The crystal structures of the Al13Fe3 and Al13Fe4 phases are provided in the section above. The orientation matrix of these two phases in reciprocal space was used to construct the real space orientation model, as described in this section. For the precise construction approach of the structural models for the intergrowth Al13Fe3 phase and Al13Fe4 phase in real space, please refer to Appendix A. First, the orientation matrix of three phases in reciprocal space was determined in APEX3 software (v2018.1−0). Next, utilizing the fundamental correspondence between reciprocal and real spaces, the orientation matrix of the three phases in real space was obtained, and finally, the orientation model of three-phase single-cell edges in real space was obtained. The cell edges of the Al13Fe3-1, Al13Fe3-2, and Al13Fe4 phases are depicted in Figure 9a as black, purple, and blue frames, respectively. Lastly, by adding atoms to the cell edges, the comprehensive orientated structural models of the Al13Fe3-1, Al13Fe3-2, and Al13Fe4 phases in real space were generated, as displayed in Figure 9b.

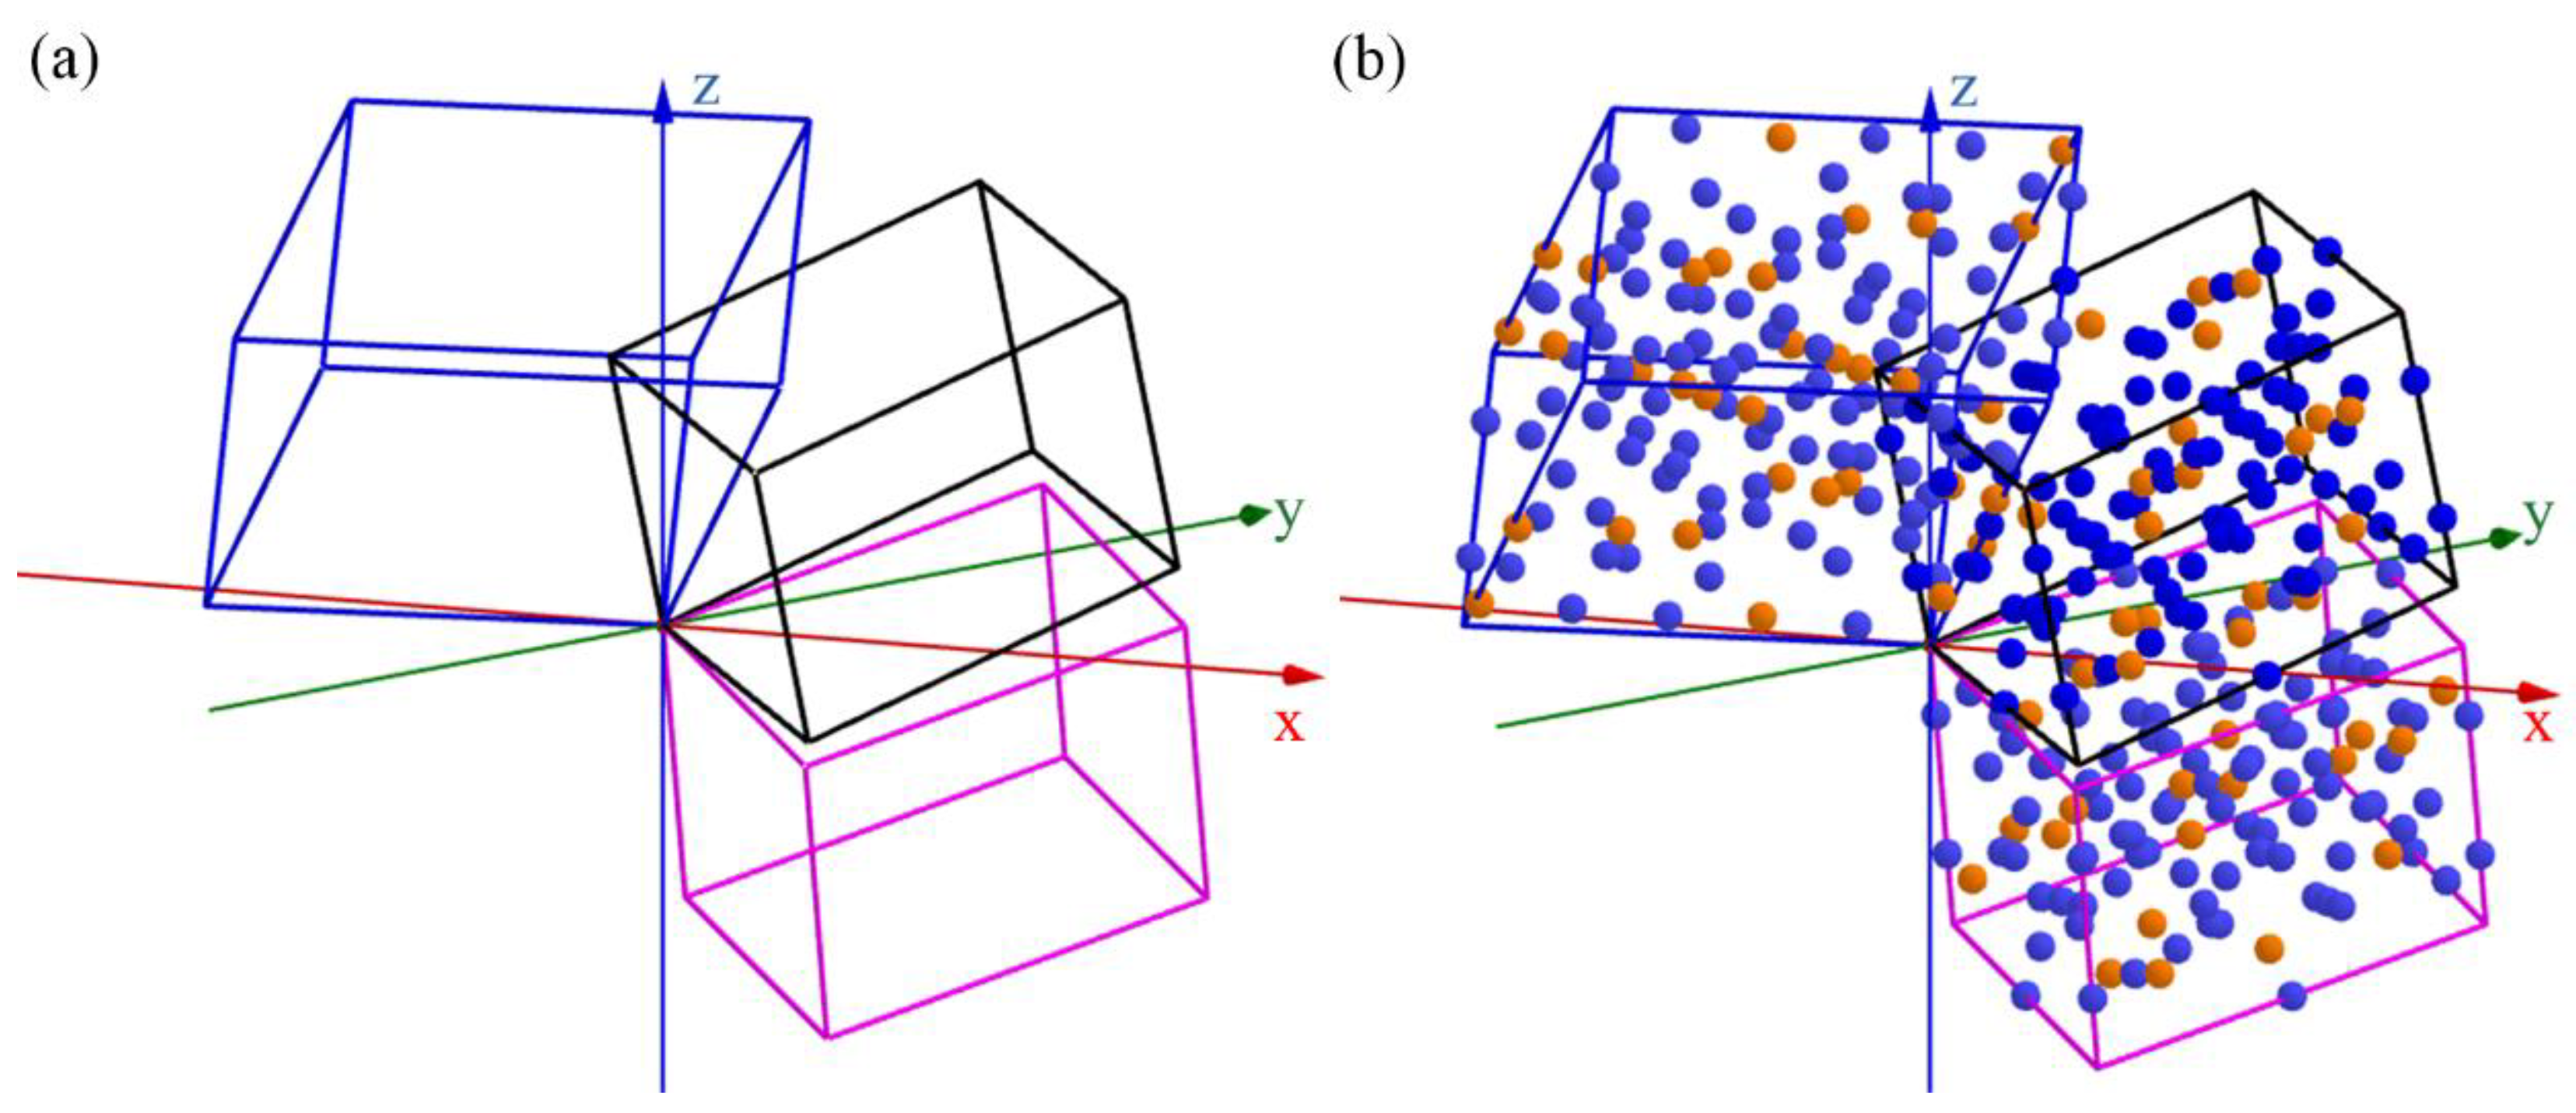
3.4. Interfaces between Al13Fe3 Phase and Al13Fe4 Phases

As described in the preceding section, the oriented structural models of the Al13Fe3 and Al13Fe4 phases were acquired. Nevertheless, the arrangement of atoms within the interfaces and the orientation of these interfaces remain ambiguous. To address these issues, the precession images obtained from the SXRD datasets were investigated, as depicted in Figure 10 and Figure 11. All precession images were generated using a resolution of 0.85 Å and a thickness of 0.02 Å−1.
Figure 10 and Figure 11 directly reveal the orientation relationships of the Al13Fe3 and Al13Fe4 phases represented by a pair of crystal planes. When two phases’ diffraction spots overlap, it indicates that the crystal planes they represent are parallel. In summary, by examining Figure 10e,f and Figure 11a,c–f, which are displayed in Table 4, seven orientation relationships with the names OR1, OR2, OR3, OR4, OR5, OR6, and OR7 can be found. The seven orientation relationships between Al13Fe3 and Al13Fe4, as described in Table 4, are illustrated in a stereoscopic projection diagram for improved comprehension, as depicted in Figure 12.
As mentioned above, seven crystallographic orientation relationships between the Al13Fe3 and Al13Fe4 phases can be identified from Figure 10 and Figure 11. The crystallographic symmetry principle suggests that a set of orientation relationships found through experimentation usually correspond to many variations. Assessing the equivalence of the seven crystallographic orientation relationships found in the present study is crucial. The experiment data are analyzed and discussed using the matrix method in the following.
The matrix method involves determining the conversion correlation between the crystal plane index and the crystal direction index of two phases through mathematical analysis. A detailed description of the matrix method can be found in our group’s prior research [52]. The conversion matrix between the seven orientation relationships can be obtained using this method, as demonstrated in Table 5 below, where matrix A represents the conversion matrix between crystal planes, and matrix B represents the conversion matrix between crystal directions. It can be determined that there are seven independent orientation relationships because the elements in the conversion matrices corresponding to the seven orientation relationships have different absolute values.
Moreover, an elementary model of the interface relationship was established, using the OR3 orientation relationship as an example. Specifically, the (033) surface of Al13Fe3 was considered, with the u and v directions aligned with [100] and [01 1 - ], respectively (as depicted in Figure 13a). The lattice parameters of this surface were found to be u = 14.596 Å, v = 16.499 Å, and θ = 116.252°. In contrast, the surface of ( 1 - 3 - 3 - ) Al13Fe4 was modeled with the u and v directions aligned with [ 3 - 6 5 - ] and [3 1 - 0], respectively (as shown in Figure 13b). The lattice parameters of this surface were determined to be u = 81.472 Å, v = 47.191 Å, and θ = 115.688°. Due to the significant mismatch between the (033) surface of Al13Fe3 and the ( 1 - 3 - 3 - ) surface of Al13Fe4 in the u and v directions, a supercell interface model must be constructed to satisfy the periodic boundary conditions. To reduce mismatches when constructing large supercells, relatively small mismatches can be achieved using 6(u) × 3(v) (033) Al13Fe3 and 1(u) × 1(v) ( 1 - 3 - 3 - ) Al13Fe4 surface models, resulting in δ(u) = 6.97% and δ(v) = 4.66% mismatches in the u and v directions, respectively. Figure 13c displays the atomic interface model of Al13Fe3(033)/Al13Fe4( 1 - 3 - 3 - ).
As can be seen from Figure 13, the surface of Al13Fe3(033) is composed of 63 Al atoms, while the surface of Al13Fe4( 1 - 3 - 3 - ) is composed of 111 atoms, including 20 Fe atoms and 91 Al atoms.

4. Conclusions

In summary, two typical approximate quasicrystalline phases Al13Fe3 and Al13Fe4 in the Al-Fe binary system were discovered to be intergrowth as a single crystal with a size of tens of micromeres, which was characterized by SXRD by combining SEM and EDX analysis. The first phase is refined to Al13Fe3 (space group R 3 ¯ c) with cell parameters a = b = 14.5956(9) Å, c = 7.6929(4) Å, α = β = 90°, and γ = 120°. The second phase is refined to Al13Fe4 (space group C2/m) with cell parameters: a = 15.498(4) Å, b = 8.0814(17) Å, c = 12.488(3) Å, β = 107.790(8)°. All atoms in these two phases are fully occupied. Topological analysis reveals that both phases have distorted icosahedrons as structural building units. Furthermore, structural models for coexistence of the Al13Fe3 and Al13Fe4 phases were obtained from analyzing the SXRD datasets in reciprocal space as well as the refined three models in real space.
The crystallographic orientation relationships of interfaces between the Al13Fe3 and Al13Fe4 phases were built by studying the synthesized precession planes from the SXRD datasets. Seven orientation relationships (named OR1 to OR7) were found by analyzing the (0kl), (h0l), and (hk0) planes of these phases. The distribution of atoms inside the interfaces is illustrated with a preliminary interface model of OR3.
The present research provides a protocol for analyzing the detailed crystal structures of three intergrowth phases and investigating their orientation relationships as well as interfaces between intergrowth phases, which will definitely stimulate further related works involving advanced scanning and transmission electron microscopy techniques and will shed light on clarifying the mechanism of multi-growth samples that are frequently found in the complex metallic alloys.

Supplementary Materials

The following supporting information can be downloaded at: https://www.mdpi.com/article/10.3390/met14040463/s1. The Supplementary Materials contain a stereographic projection illustrating the orientation relationships between Al13Fe3 and Al13Fe4, as well as SEM and EDX analysis of the single crystal sample. Additionally, precession images of the (1kl), (h1l), and (hk1) planes to (5kl), (h5l), and (hk5) planes are provided. Figure S1: scanning electron microscope (SEM) micrographs of single crystal sample. EDX analysis was performed for various locations as indicated in Table S1. Table S1: The EDX results conducted at every scanning location. Figure S2: The precession images of (a) Al13Fe3-1(0kl), (b) Al13Fe3-1(h0l), (c) Al13Fe3-1(hk0), (d) Al13Fe4(0kl), (e) Al13Fe4(h0l), (f) Al13Fe4(hk0); Figure S3: The precession images of intergrowth crystals: (a) Al13Fe3-2(0kl), (b) Al13Fe3-2(h0l), (c) Al13Fe3-2(hk0), (d) Al13Fe4(0kl), (e) Al13Fe4(h0l), (f) Al13Fe4(hk0). Figure S4: The precession images of (a) Al13Fe3-1(1kl), (b) Al13Fe3-1(h1l), (c) Al13Fe3-1(hk1), (d) Al13Fe4(1kl), (e) Al13Fe4(h1l), (f) Al13Fe4(hk1). Figure S5: The precession images of (a) Al13Fe3-1(2kl), (b) Al13Fe3-1(h2l), (c) Al13Fe3-1(hk2), (d) Al13Fe4(2kl), (e) Al13Fe4(h2l), (f) Al13Fe4(hk2). Figure S6: The precession images of (a) Al13Fe3-1(3kl), (b) Al13Fe3-1(h3l), (c) Al13Fe3-1(hk3), (d) Al13Fe4(3kl), (e) Al13Fe4(h3l), (f) Al13Fe4(hk3). Figure S7: The precession images of (a) Al13Fe3-1(4kl), (b) Al13Fe3-1(h4l), (c) Al13Fe3-1(hk4), (d) Al13Fe4(4kl), (e) Al13Fe4(h4l), (f) Al13Fe4(hk4). Figure S8: The precession images of (a) Al13Fe3-1(5kl), (b) Al13Fe3-1(h5l), (c) Al13Fe3-1(hk5), (d) Al13Fe4(5kl), (e) Al13Fe4(h5l), (f) Al13Fe4(hk5). Figure S9: The precession images of (a) Al13Fe3-2(1kl), (b) Al13Fe3-2(h1l), (c) Al13Fe3-2(hk1), (d) Al13Fe4(1kl), (e) Al13Fe4(h1l), (f) Al13Fe4(hk1). Figure S10: The precession images of (a) Al13Fe3-2(2kl), (b) Al13Fe3-2(h2l), (c) Al13Fe3-2(hk2), (d) Al13Fe4(2kl), (e) Al13Fe4(h2l), (f) Al13Fe4(hk2). Figure S11: The precession images of (a) Al13Fe3-2(3kl), (b) Al13Fe3-2(h3l), (c) Al13Fe3-2(hk3), (d) Al13Fe4(3kl), (e) Al13Fe4(h3l), (f) Al13Fe4(hk3). Figure S12: The precession images of (a) Al13Fe3-2(4kl), (b) Al13Fe3-2(h4l), (c) Al13Fe3-2(hk4), (d) Al13Fe4(4kl), (e) Al13Fe4(h4l), (f) Al13Fe4(hk4). Figure S13: The precession images of (a) Al13Fe3-2(5kl), (b) Al13Fe3-2(h5l), (c) Al13Fe3-2(hk5), (d) Al13Fe4(5kl), (e) Al13Fe4(h5l), (f) Al13Fe4(hk5).

Author Contributions

Conceptualization, C.F., R.F., B.W. and L.Z.; methodology, C.F.; investigation, Y.L. and Z.X.; resources, C.F., Z.X. and L.Z.; writing—original draft preparation, Y.L.; writing—review and editing, C.F., Z.X., R.F., B.W. and L.Z.; supervision, C.F., R.F. and L.Z.; funding acquisition, C.F., Z.X. and B.W. All authors have read and agreed to the published version of the manuscript.

Funding

This research was funded by the National Natural Science Foundation of China (grant No. 52173231; grant No. 51925105), Hebei Natural Science Foundation (grant No. E2022203182; grant No. E2020203158), Project of Hebei Provincial Department of Human Resources and Social Security (grant No. E2020100006), and Innovation Ability Promotion Project of Hebei supported by Hebei Key Lab for Optimizing Metal Product Technology and Performance (grant No. 22567609H).

Data Availability Statement

Data will be made available on request.

Acknowledgments

The authors express their gratitude to Qiang Ren from the High Steel Center at Yanshan University for providing support in conducting the SEM/EDX measurements.

Conflicts of Interest

The authors declare no conflicts of interest.

Appendix A

During the processing of data, the orientation matrix plays a crucial role as it is a 3 × 3 matrix that specifies the values and orientations of the three reciprocal axes based on the x, y, and z coordinates on the goniometer. This matrix holds the fundamental information that defines the reciprocal cell and its spatial orientation. In reciprocal space, the orientation matrix can be characterized as:
R = a x * b x * c x * a y * b y * c y * a z * b z * c z *
where a x * , a y * , and a z * represent the coordinate components of the reciprocity vector a * in the x, y, and z directions, respectively, based on the diffractometer coordinates. Similarly, the second and third columns represent the coordinate components of b * and c * , respectively.
According to Section 3.1, we know there are two sets of Al13Fe3. Now, the gray diffraction point corresponds to the Al13Fe3-1 phase and the yellow diffraction point corresponds to the Al13Fe3-2 phase. The orientation matrix of the Al13Fe3-1 phase, Al13Fe3-2 phase, and Al13Fe4 phase in reciprocal space can be found using the APEX3 software, where the orientation matrix in reciprocal space of the Al13Fe3-1 phase is:
+ 0.07726900 + 0.05223162 - 0.00936381 - 0.01660753 + 0.05673444 - 0.03000876 + 0.00178704 + 0.01739432 + 0.12599610
The orientation matrix in reciprocal space of the Al13Fe3-2 phase is:
+ 0.5312165 + 0.07719827 - 0.00363642 + 0.05774164 - 0.01607857 + 0.02432341 + 0.00946710 - 0.00524772 - 0.12749440
The orientation matrix in reciprocal space of the Al13Fe4 phase is:
+ 0.02463529 - 0.02672067 - 0.06323070 - 0.05067153 + 0.06340674 - 0.05297208 + 0.03764391 + 0.10283705 + 0.01623344
Starting from the fundamental correspondence between real space and reciprocal space:
a · a * = b · b * = c · c * = 1
The orientation matrix of these three phases in real space can be derived. The orientation matrix in real space of the Al13Fe3-1 phase is:
+ 10.91316436 - 9.59578453 - 1.47479968 + 2.90159188 + 13.87577253 + 3.52064947 - 0.55511139 - 1.77963193 7.47148199
The orientation matrix in real space of the Al13Fe3-2 phase is:
+ 3.10098452 + 14.06396551 + 2.58737191 + 10.82854274 - 9.60619433 - 2.13761384 - 0.216569920 + 1.44058379 - 7.57090465
The orientation matrix in real space of the Al13Fe4 phase is:
+ 9.64924243 - 9.04020620 + 8.08117528 - 1.74532373 + 4.14156070 + 6.71704330 - 11.31930567 - 5.27289202 + 0.30998032
It is achievable to build complete models of Al13Fe3-1, Al13Fe3-2, and Al13Fe4 described with cell edges in real space utilizing the orientation matrix for those phases in real space. as displayed in the main text’s Figure 9a.
By recognizing the experiment’s orientation matrix and the orientation matrix associated with the Crystallographic Information File (CIF), the particular atoms for both phases to the orientation models described with cell edges can be added. First, the real-space locations of the Al13Fe4 phase’s atoms are introduced. We designated matrix B as the experimental orientation matrix of the phase in real space. The Al13Fe4-related CIF-related orientation matrix is defined as follows:
A = 15.49800015 0 0 0 8.08139992 0 - 3.81544784 0 11.89085782
By utilizing matrix A and matrix B, it is possible to establish the transformation relationship between the two matrices. By setting AC = B, we can solve for matrix C:
C = + 0.62261210 - 0.58331437 + 0.52143342 - 0.21596799 + 0.51248060 + 0.83117323 - 0.75215445 - 0.63061031 + 0.19338238
The CIF of Al13Fe4 contains the Cartesian coordinates of its atoms, which are then transformed into the corresponding positions in real space by multiplying them with matrix C. This process is also applied to obtain the coordinate positions of the atoms in the Al13Fe3-1 and Al13Fe3-2 phases. By following this procedure, comprehensive oriented structural models of the Al13Fe3-1, Al13Fe3-2, and Al13Fe4 phases in real space were obtained and are presented in Figure 9b of the main text.

References

  1. Tcherdyntsev, V.V.; Kaloshkin, S.D.; Gunderov, D.V.; Afonina, E.A.; Brodova, I.G.; Stolyarov, V.V.; Baldokhin, Y.V.; Shelekhov, E.V.; Tomilin, I.A. Phase composition and microhardness of rapidly quenched Al–Fe alloys after high pressure torsion deformation. Mater. Sci. Eng. A 2004, 375, 888–893. [Google Scholar] [CrossRef]
  2. Sasaki, T.T.; Ohkubo, T.; Hono, K. Microstructure and mechanical properties of bulk nanocrystalline Al–Fe alloy processed by mechanical alloying and spark plasma sintering. Acta Mater. 2009, 57, 3529–3538. [Google Scholar] [CrossRef]
  3. Goulart, P.R.; Spinelli, J.E.; Cheung, N.; Garcia, A. The effects of cell spacing and distribution of intermetallic fibers on the mechanical properties of hypoeutectic Al–Fe alloys. Mater. Chem. Phys. 2010, 119, 272–278. [Google Scholar] [CrossRef]
  4. Akinlade, O.; Singh, R.N.; Sommer, F. Thermodynamics of liquid Al–Fe alloys. J. Alloys Compd. 2000, 299, 163–168. [Google Scholar] [CrossRef]
  5. Pariona, M.M.; Teleginski, V.; Santos, K.D.; Machado, S.; Zara, A.J.; Zurba, N.K.; Riva, R. Yb-fiber laser beam effects on the surface modification of Al–Fe aerospace alloy obtaining weld filet structures, low fine porosity and corrosion resistance. Surf. Coat. Technol. 2012, 206, 2293–2301. [Google Scholar] [CrossRef]
  6. Staley, J.T.; Liu, J.; Hunt, W.H., Jr. Aluminum alloys for aerostructures. Adv. Mater. Process. 1997, 152, 17–21. [Google Scholar]
  7. Zhou, B.; Liu, B.; Zhang, S. The advancement of 7xxx series aluminum alloys for aircraft structures: A review. Metals 2021, 11, 718. [Google Scholar] [CrossRef]
  8. Pariona, M.M.; Teleginski, V.; dos Santos, K.; dos Santos, E.L.R.; Riva, R. AFM study of the effects of laser surface remelting on the morphology of Al–Fe aerospace alloys. Mater Charact. 2012, 74, 64–76. [Google Scholar] [CrossRef]
  9. Pariona, M.M.; Teleginski, V.; dos Santos, K.; de Lima, A.A.; Zara, A.J.; Micene, K.T.; Riva, R. Influence of laser surface treated on the characterization and corrosion behavior of Al–Fe aerospace alloys. Appl. Surf. Sci. 2013, 276, 76–85. [Google Scholar] [CrossRef]
  10. Simon, P.; Beggs, P.D. A numerical performance comparison of a dual-phase steel and aluminium alloy bumper bar system. Int. J. Crashworthiness 2010, 15, 425–442. [Google Scholar] [CrossRef]
  11. Hirsch, J. Recent development in aluminium for automotive applications. Trans. Nonferrous Met. Soc. China 2014, 24, 1995–2002. [Google Scholar] [CrossRef]
  12. Karim, M.A.; Park, Y.D. A review on welding of dissimilar metals in car body manufacturing. J. Weld. Join. 2020, 38, 8–23. [Google Scholar] [CrossRef]
  13. Park, K.; Park, J.; Kwon, H. Fabrication and characterization of Al-SUS316L composite materials manufactured by the spark plasma sintering process. Mater. Sci. Eng. A 2017, 691, 8–15. [Google Scholar] [CrossRef]
  14. Mukai, T.; Suresh, S.; Kita, K.; Sasaki, H.; Kobayashi, N.; Higashi, K.; Inoue, A. Nanostructured Al–Fe alloys produced by e-beam deposition: Static and dynamic tensile properties. Acta Mater. 2003, 51, 4197–4208. [Google Scholar] [CrossRef]
  15. Liang, D.; Jie, W.; Jones, H. The effect of growth velocity on primary spacing of Al3Fe dendrites in hypereutectic Al-Fe alloys. J. Cryst. Growth 1994, 135, 561–564. [Google Scholar] [CrossRef]
  16. Senkov, O.N.; Froes, F.H.; Stolyarov, V.V.; Valiev, R.Z.; Liu, J. Microstructure of aluminum-iron alloys subjected to severe plastic deformation. Scr. Mater. 1998, 38, 1511–1516. [Google Scholar] [CrossRef]
  17. Medvedev, A.; Murashkin, M.; Enikeev, N.; Medvedev, E.; Sauvage, X. Influence of morphology of intermetallic particles on the microstructure and properties evolution in severely deformed Al-Fe alloys. Metals 2021, 11, 815. [Google Scholar] [CrossRef]
  18. Luo, S.X.; Shi, Z.M.; Li, N.Y.; Lin, Y.M.; Liang, Y.H.; Zeng, Y.D. Crystallization inhibition and microstructure refinement of Al-5Fe alloys by addition of rare earth elements. J. Alloys Compd. 2019, 789, 90–99. [Google Scholar] [CrossRef]
  19. Duchaussoy, A.; Sauvage, X.; Edalati, K.; Horita, Z.; Renou, G.; Deschamps, A.; De Geuser, F. Structure and mechanical behavior of ultrafine-grained aluminum-iron alloy stabilized by nanoscaled intermetallic particles. Acta Mater. 2019, 167, 89–102. [Google Scholar] [CrossRef]
  20. Guan, R.G.; Tie, D. A review on grain refinement of aluminum alloys: Progresses, challenges and prospects. Acta Metall. Sin. 2017, 30, 409–432. [Google Scholar] [CrossRef]
  21. Cubero-Sesin, J.M.; Horita, Z. Strengthening via Microstructure Refinement in Bulk Al–4 mass% Fe Alloy Using High-Pressure Torsion. Mater. Trans. 2012, 53, 46–55. [Google Scholar] [CrossRef]
  22. Fung, K.K.; Yang, C.Y.; Zhou, Y.Q.; Zhao, J.G.; Zhan, W.S.; Shen, B.G. Icosahedrally related decagonal quasicrystal in rapidly cooled Al-14-at.%-Fe alloy. Phys. Rev. Lett. 1986, 56, 2060–2063. [Google Scholar] [CrossRef] [PubMed]
  23. Cairney, J.M.; Munroe, P.R.; Sordelet, D.J. Microstructural analysis of a FeAl/quasicrystal-based composite prepared using a focused ion beam miller. J. Microsc. 2001, 201, 201–211. [Google Scholar] [CrossRef]
  24. Liu, Y.; Liu, H.; Fan, C.; Wen, B.; Zhang, L. Crystal structure of AlFe0.95. IUCrData 2023, 8, x231065. [Google Scholar] [CrossRef]
  25. Stein, F.; Vogel, S.C.; Eumann, M.; Palm, M. Determination of the crystal structure of the ɛ phase in the Fe–Al system by high-temperature neutron diffraction. Intermetallics 2010, 18, 150–156. [Google Scholar] [CrossRef]
  26. Burkhardt, U.; Grin, Y.; Ellner, M.; Peters, K. Structure refinement of the iron–aluminium phase with the approximate composition Fe2Al5. Acta. Crystallogr. B Struct. Sci. 1994, 50, 313–316. [Google Scholar] [CrossRef]
  27. Chumak, I.; Richter, K.W.; Ehrenberg, H. Redetermination of iron dialuminide, FeAl2. Acta Crystallogr. C 2010, 66, i87–i88. [Google Scholar] [CrossRef] [PubMed]
  28. Grin, J.; Burkhardt, U.; Ellner, M.; Peters, K. Refinement of the Fe4Al13 structure and its relationship to the quasihomological homeotypical structures. Z Krist. Cryst. Mater. 1994, 209, 479–487. [Google Scholar] [CrossRef]
  29. Xia, Z.; Liu, C.; Fan, C. Al13Fe3. IUCrData 2018, 3, x180593. [Google Scholar] [CrossRef]
  30. Black, P.J. The structure of FeAl3. II. Acta Crystallogr. 1955, 8, 175–182. [Google Scholar] [CrossRef]
  31. Saitoh, K.; Yokosawa, T.; Tanaka, M.; Tsai, A.P. Structural studies of monoclinic approximants of Al13Fe4 and τ2-inflated Al13Co4 by the high-angle annular dark-field method. Microscopy 1999, 48, 105–114. [Google Scholar]
  32. Yanson, T.I.; Manyako, N.B.; Bodak, O.I.; Cêrny, R.; Gladyshevskii, R.E.; Yvon, K. Crystal structure of Fe4Ti0.93Al12.07, a substitutional variant of the Fe4Al13 structure type. J. Alloys Compd. 1995, 219, 135–138. [Google Scholar] [CrossRef]
  33. Popčević, P.; Smontara, A.; Ivkov, J.; Wencka, M.; Komelj, M.; Jeglic, P.; Vrtnik, S.; Bobnar, M.; Jaglicic, Z.; Bauer, B.; et al. Anisotropic physical properties of the Al13Fe4 complex intermetallic and its ternary derivative Al13(Fe,Ni)4. Phys. Rev. B 2010, 81, 184203. [Google Scholar] [CrossRef]
  34. Liu, C.; Fan, C. Crystal structure of the λ-Al13Fe4-type intermetallic (Al,Cu)13(Fe,Cu)4. IUCrData 2018, 3, x180363. [Google Scholar] [CrossRef]
  35. Barbier, J.N.; Tamura, N.; Verger-Gaugry, J.L. Monoclinic Al13Fe4 approximant phase: A link between icosahedral and decagonal phases. J. Non. Cryst. Solids. 1993, 153, 126–131. [Google Scholar] [CrossRef]
  36. Osawa, A.; Murata, T. On the equilibrium diagram of iron-aluminium system. Sci. Rep. Tohoku Univ. 1933, 22, 803–823. [Google Scholar]
  37. Phragmen, G. On the phases occurring in alloys of aluminium with copper, magnesium, manganese, iron, and silicon. J. Inst. Met. 1950, 77, 489–551. [Google Scholar]
  38. Black, P.J. The structure of FeAl3. I. Acta Crystallogr. 1955, 8, 43–48. [Google Scholar] [CrossRef]
  39. Ma, X.L.; Liebertz, H.; Köster, U. Multiple Twins of Monoclinic Al13Fe4 Showing Pseudo-Orthorhombic and Fivefold Symmetries. Phys. Status Solidi A 1996, 158, 359–367. [Google Scholar] [CrossRef]
  40. Griger, A.; Stefániay, V.; Turmezey, T. Crystallographic data and chemical compositions of aluminium-rich Al-Fe intermetallic phases. Int. J. Mater. Res. 1986, 77, 30–35. [Google Scholar] [CrossRef]
  41. Chandrasekaran, M.; Lin, Y.P.; Vincent, R.; Staniek, G. The structure and stability of some intermetallic phases in rapidly solidified AlFe. Scr. Metall. 1988, 22, 797–802. [Google Scholar] [CrossRef]
  42. Tsuchimori, M.; Ishimasa, T.; Fukano, Y. Crystal structures of small Al-rich Fe alloy particles formed by a gas-evaporation technique. Philos. Mag. B 1992, 66, 89–108. [Google Scholar] [CrossRef]
  43. Lafaye, P.; Oishi, K.; Bourdon, M.; Harvey, J.P. Crystal chemistry and thermodynamic modelling of the Al13(Fe,TM)4 solid solutions (TM = Co, Cr, Ni, Pt). J. Alloys Compd. 2022, 920, 165779. [Google Scholar] [CrossRef]
  44. Lafaye, P.; Oishi, K.; Harvey, J.P. A comprehensive study on the thermodynamics of the Al13Fe4 solid solution in the Al-Fe-Mn ternary system. J. Alloys Compd. 2023, 944, 169054. [Google Scholar] [CrossRef]
  45. Sharma, A.; Morisada, Y.; Ushioda, K.; Fujii, H. Elucidation on the correlation between thermal stability of Al13Fe4 intermetallic phase and mechanical properties of the Al-Fe alloy fabricated via friction stir alloying. J. Alloys Compd. 2023, 967, 171732. [Google Scholar] [CrossRef]
  46. Cui, Y.; Gourlay, C.M. Growth twinning and morphology of Al45Cr7 and Al13Fe4. J. Alloys Compd. 2022, 893, 162318. [Google Scholar] [CrossRef]
  47. Pang, N.; Shi, Z.; Wang, C.; Li, N.; Lin, Y. Influence of Cr, Mn, Co and Ni Addition on Crystallization Behavior of Al13Fe4 Phase in Al-5Fe Alloys Based on ThermoDynamic Calculations. Materials 2021, 14, 768. [Google Scholar] [CrossRef]
  48. Song, Z.; Magdysyuk, O.V.; Tang, L.; Sparks, T.; Cai, B. Growth dynamics of faceted Al13Fe4 intermetallic revealed by high-speed synchrotron X-ray quantification. J. Alloys Compd. 2021, 861, 158604. [Google Scholar] [CrossRef]
  49. Sahu, M.; Paul, A.; Ganguly, S. Formation of mechanical property gradient along the sheet thickness due to the patterned Fe/Al IMC layers in the interface in dissimilar FSW of HSLA steel to AA 5083. Mater. Charact. 2023, 203, 113146. [Google Scholar] [CrossRef]
  50. Yang, Y.; Luo, Z.; Zhang, Y.; Su, J. Dissimilar welding of aluminium to steel: A review. J. Manuf. Process. 2024, 110, 376–397. [Google Scholar] [CrossRef]
  51. Chatelier, C.; Anand, K.; Gille, P.; De Weerd, M.C.; Ledieu, J.; Fournée, V.; Resta, A.; Vlad, A.; Garreau, Y.; Coati, A.; et al. Revealing the epitaxial interface between Al13Fe4 and Al5Fe2 enabling atomic Al interdiffusion. ACS Appl. Mater. Interfaces 2023, 15, 19593–19603. [Google Scholar] [CrossRef] [PubMed]
  52. Liu, Y.; Fan, C.; Wen, B.; Xu, Z.; Fu, R.; Zhang, L. Orientation Relationship of Intergrowth Al2Fe and Al5Fe2 Intermetallics Determined by Single-Crystal X-ray Diffraction. Metals 2024, 14, 337. [Google Scholar] [CrossRef]
  53. Bruker AXS Inc. APEX3, SAINT and SADABS. In Software for Data Reduction, Absorption Correction and Structure Solution; Bruker AXS Inc.: Madison, WI, USA, 2015. [Google Scholar]
  54. Krause, L.; Herbst-Irmer, R.; Sheldrick, G.M.; Stalke, D. Comparison of silver and molybdenum microfocus X-ray sources for single-crystal structure determination. J. Appl. Crystallogr. 2015, 48, 3–10. [Google Scholar] [CrossRef] [PubMed]
  55. Sheldrick, G.M. Crystal structure refinement with SHELXL. Acta Crystallogr. C Struct. Chem. 2015, 71, 3–8. [Google Scholar] [CrossRef] [PubMed]
  56. Sheldrick, G.M. SHELXT–Integrated space-group and crystal-structure determination. Acta Crystallogr. A 2015, 71, 3–8. [Google Scholar] [CrossRef] [PubMed]
  57. Putz, H.; Brandenburg, K. Diamond 4.2. 2–Crystal and Molecular Structure Visualization. Crystal. Impact. Kreuzherrenstr. 2017, 102, 53227. [Google Scholar]
  58. Blatov, V.A.; Shevchenko, A.P.; Proserpio, D.M. Applied topological analysis of crystal structures with the program package ToposPro. Cryst. Growth Des. 2014, 14, 3576–3586. [Google Scholar] [CrossRef]
  59. Akhmetshina, T.G.; Blatov, V.A. A fascinating building unit: Mackay cluster in intermetallics. Struct. Chem. 2017, 28, 133–140. [Google Scholar] [CrossRef]
  60. Sugiyama, K.; Obata, T.; Hiraga, K. The crystalline structure of O-AlFePd. Mater. Trans. 2012, 53, 1357–1362. [Google Scholar] [CrossRef]
Figure 1. Diffraction spots of the entire sample in the reciprocal space. (a) Projection of three sets of data in reciprocal space in a random direction; (b) projection of the Al13Fe3-1 phase and Al13Fe4 phase along the a* axis of the Al13Fe4 phase; (c) projection of the Al13Fe3-1 phase and Al13Fe3-2 phase along the a* axis of the Al13Fe3-1 phase; (d) projection of the Al13Fe3-2 phase and Al13Fe4 phase along the b* axis of the Al13Fe3-2 phase.
Metals 14 00463 g001
Figure 2. Reciprocal lattice patterns and crystal structure diagram of the Al13Fe3-1 phase projected in different directions: (a) a* axis; (b) b* axis; (c) c* axis; (d) c axis.
Metals 14 00463 g002
Figure 3. Reciprocal lattice patterns and crystal structure diagram of Al13Fe4 phase projected in different directions: (a) a* axis; (b) b* axis; (c) c* axis; (d) b axis.
Metals 14 00463 g003
Figure 4. Reciprocal lattice patterns and crystal structure diagram of the Al13Fe3-2 phase projected in different directions: (a) a* axis; (b) b* axis; (c) c* axis; (d) c axis.
Metals 14 00463 g004
Figure 5. Cluster assembly of the Al13Fe3 phase in a unit cell: (a) the central atoms and isolated atoms of the cluster; (b) cluster assembly model.
Metals 14 00463 g005
Figure 6. Atomic environment diagram: (a) Al4 atom; (b) Fe1 atom. Symmetry codes: (i) −x + 2/3, −x + y + 1/3, −z + 5/6; (ii) −y + 2/3, xy + 1/3, z + 1/3; (iii) y − 1/3, −x + y + 1/3, −z + 1/3; (iv) −y + 1, −x + 1, z + 1/2.
Metals 14 00463 g006
Figure 7. The cluster in the Al13Fe4 phase (The yellow atoms represent the Fe atoms and the blue atoms represent the Al atoms). (a) The inner shell of the Al7(2)(1@12@46) cluster; (b) the outer-shell of the Al7(2)(1@12@46) cluster; (c) the Al15(1)(1@12) cluster; (d) cluster assembly model in the Al13Fe4 unit cell.
Metals 14 00463 g007
Figure 8. Atomic environment diagram: (a) Al7 atom; (b) Al15 atom. Symmetry codes: (i) x, −y, z; (vii) −x + 1, y, −z + 1; (viii) −x + 1, −y, −z + 1.
Metals 14 00463 g008
Figure 9. The structural models in real space for the Al13Fe3 and Al13Fe4 phases are presented: the orientation of cell edges (a) and the unit cell (b) (The saffron yellow atoms represent the Fe atoms and the blue atoms represent the Al atoms).
Metals 14 00463 g009
Figure 10. The precession images of intergrowth crystals are presented as follows: (a) Al13Fe3-1(0kl), where the red and blue circles depict the crystal planes of the Al13Fe3-1 phase and Al13Fe4 phase, respectively. (b,c) show the same phase, with circles representing (b) Al13Fe3-1(h0l) and (c) Al13Fe3-1(hk0). Similarly, (d) Al13Fe4(0kl) is shown, where the red and blue circles depict the crystal planes of the Al13Fe4 phase and Al13Fe3-1 phase, respectively. (e,f) show the same phase, with circles representing (e) Al13Fe4(h0l) and (f) Al13Fe4(hk0).
Metals 14 00463 g010
Figure 11. The precession images of intergrowth crystals are presented as follows: (a) Al13Fe3-2(0kl), where the green and purple circles depict the crystal planes of the Al13Fe3-2 phase and Al13Fe4 phase, respectively. (b,c) show the same phase, with circles representing (b) Al13Fe3-2(h0l) and (c) Al13Fe3-2(hk0). Similarly, (d) Al13Fe4(0kl) is shown, where the red and blue circles depict the crystal planes of the Al13Fe4 phase and Al13Fe3-2 phase, respectively. (e,f) show the same phase, with circles representing (e) Al13Fe4(h0l) and (f) Al13Fe4(hk0).
Metals 14 00463 g011
Figure 12. Stereographic projection of the orientation relationships between Al13Fe3 and Al13Fe4 based on the Al13Fe3 phase: (a) the orientation relationships between crystal planes, (b) the orientation relationships between crystal directions.
Metals 14 00463 g012
Figure 13. (a): (033) surface of the Al13Fe3 phase; (b): ( 1 - 3 - 3 - ) surface of the Al13Fe4 phase; (c): the atomic interface model of Al13Fe3(033)/Al13Fe4( 1 - 3 - 3 - ) (The golden atoms represent the Fe atoms and the blue atoms represent the Al atoms).
Metals 14 00463 g013
Table 1. Crystallographic and experimental data of Al13Fe3 and Al13Fe4.
Chemical FormulaAl13Fe3Al13Fe4
a, b, c14.5956(9), 14.5956(9), 7.6929(4)15.498(4), 8.0814(17), 12.488(3)
α, β, γ90, 90, 12090, 107.790(8), 90
V/Å31419.27(19)1489.2(6)
Z124
Space groupR 3 ¯ c C2/m
Crystal systemTrigonalMonoclinic
DiffractometerBruker D8 Venture Photon 100 COMS
MonochromatorGraphite
Tmeas/K 300(2)
RadiationMo-Kα, λ = 0.71073 (Å)
Scan modeφ and ω scan
Time per step/s6
Absorption correction Multi-scan
F(000)14821638
θ range/°4.84~27.333.12~27.49
μ/mm−15.696.82
No. measured reflections192003922
No. unique reflections3671423
No. observed reflections (I > 2σ(I))341756
No. reflections used in refinement3671423
No. parameters used in refinement28128
Reflection range−18 ≤ h ≤ 18, −18 ≤ k ≤ 18, −9 ≤ l ≤ 9−18 ≤ h ≤ 11, −9 ≤ k ≤ 9, −16 ≤ l ≤ 13
Rint0.0770.102
R(σ)0.01520.178
Final R indices (Fobs > 4σ(Fobs))R1 = 0.033, ωR2 = 0.0710R1 = 0.080, ωR2 = 0.223
R indices (all data)R1 = 0.034, ωR2 = 0.0710R1 = 0.169, ωR2 = 0.223
Goodness of fit1.3261.07
The maximum residual electron densities0.52
(1.43 Å from Al3)
1.71
(0.94 Å from Al14)
The minimum residual electron densities−0.71
(0.72 Å from Al3)
−2.04
(0.89 Å from Al3)
Table 2. The equivalent isotropic displacement parameters (Å2), fractional atomic coordinates, and atomic occupancy of the Al13Fe3 phase.
LabelSitexyzOcc.Ueq
Fe118e0.3333330.49355 (6)0.41666710.0061 (2)
Al118e0.35988 (13)0.35988 (13)0.25000010.0110 (4)
Al26a0.3333330.6666670.41666710.0180 (8)
Al336f0.48065 (11)0.63616 (12)0.24732 (18)10.0188 (4)
Al418d0.1666670.3333330.33333310.0183 (5)
Table 3. The equivalent isotropic displacement parameters (Å2), fractional atomic coordinates, and atomic occupancy of the Al13Fe4 phase.
LabelSitexyzOcc.Ueq
Fe14i0.0855 (3)0.0000000.3823 (3)10.0043 (9)
Fe24i0.4019 (3)0.0000000.6228 (3)10.0065 (9)
Fe34i0.0908 (3)0.0000000.9885 (3)10.0056 (10)
Fe44i0.4028 (3)0.0000000.9863 (3)10.0046 (9)
Fe58j0.32011(18)0.2933 (3)0.27793(18)10.0068 (7)
Al14i0.0670 (6)0.0000000.1738 (6)10.0113 (18)
Al24i0.3213 (6)0.0000000.2812 (6)10.0112 (11)
Al34i0.2381 (6)0.0000000.5339 (6)10.0112 (11)
Al44i0.0734 (6)0.0000000.5801 (6)10.0111 (18)
Al54i0.2415 (6)0.0000000.9614 (7)10.0104 (17)
Al64i0.4786 (6)0.0000000.8297 (6)10.0112 (11)
Al72d0.5000000.0000000.50000010.011 (2)
Al84i0.3060 (6)0.0000000.7729 (6)10.0109 (17)
Al94i0.0862 (6)0.0000000.7888 (6)10.0098 (18)
Al108j0.1859 (4)0.2172 (7)0.1112 (4)10.0096 (14)
Al118j0.3673 (4)0.2116 (7)0.1101 (4)10.0103 (13)
Al128j0.1772 (4)0.2211 (7)0.3343 (4)10.0118 (13)
Al138j0.4920 (4)0.2328 (6)0.3296 (4)10.0082 (13)
Al148j0.3636 (4)0.2198 (7)0.4781 (4)10.0108 (13)
Al154g0.0000000.2495 (9)0.00000010.0086 (19)
Table 4. The seven crystallographic orientation relationships obtained from Figure 10 and Figure 11 between Al13Fe3 and Al13Fe4.
[uvw] Al13Fe3//[uvw] Al13Fe4(hkl) Al13Fe3//(hkl) Al13Fe4
OR1[ 17 -   23   65 ] Al13Fe3//[0 1 0] Al13Fe4( 7 - 8 -   1) Al13Fe3//( 6 -   0   13 ) Al13Fe4
OR2[8 9 3 - ] Al13Fe3//[0 0 1] Al13Fe4( 12 -   11   1 ) Al13Fe3//( 8 -   6   0) Al13Fe4
OR3[1 0 0] Al13Fe3//[3   6 -   5 ] Al13Fe4(0 3 3) Al13Fe3//( 1 -   3 -   3 - ) Al13Fe4
OR4[0 0 1] Al13Fe3//[8 15 4] Al13Fe4( 8 - 10 0) Al13Fe3//(8 4 -   1 - ) Al13Fe4
OR5[ 2 - 25 -   38 ] Al13Fe3//[1 0 0] Al13Fe4( 1 -   6 -   4 - ) Al13Fe3//(0 4 6) Al13Fe4
OR6[ 22   25 -   79 - ] Al13Fe3//[0 1 0] Al13Fe4( 7 -   3 -   1 - ) Al13Fe3//( 2 - 0 9) Al13Fe4
OR7[ 8 -   7 -   1 - ] Al13Fe3//[0 0 1] Al13Fe4(5 6 - 2) Al13Fe3//( 7 -   1 0) Al13Fe4
Table 5. The conversion matrices between seven orientation relationships of Al13Fe3 and Al13Fe4 interfaces.
Orientation RelationshipConversion Matrix BConversion Matrix A
OR1( 7 - 8 -   1) Al13Fe3//( 6 -   0   13 ) Al13Fe4
[ 17 -   23   65 ] Al13Fe3//[0 1 0] Al13Fe4
0.90 - 0.19 - 0.80 0.11 0.26 - 0.88 1.22 0.74 0.28 0.69 - 1.05 - 0.22 - 0.51 1.17 - 0.85 0.36 0.67 0.24
OR2( 12 -   11   1 ) Al13Fe3//( 8 -   6   0) Al13Fe4
[8 9 3 - ] Al13Fe3//[0 0 1] Al13Fe4
- 0.13 - 0.37 0.79 - 0.73 0.18 0.88 - 1.56 - 0.48 - 0.30 0.35 - 1.51 0.61 - 0.47 1.20 0.50 - 0.45 - 0.44 - 0.28
OR3(0 3 3) Al13Fe3//( 1 -   3 -   3 - ) Al13Fe4
[1 0 0] Al13Fe3//[3   6 -   5 ] Al13Fe4
0 . 80 - 0.43 0.11 0.89 - 0.21 - 0.78 - 1.21 - 0.77 - 0.20 0.54 - 1.08 0.90 0.16 0.02 - 1.09 - 0.35 - 0.70 - 0.21
OR4( 8 -   10   0 ) Al13Fe3//( 8 4 - 1 - ) Al13Fe4
[0 0 1] Al13Fe3//[8 15 4] Al13Fe4
- 0.60 0.07 0.96 0.32 - 0.35 0.67 1.29 0.75 0.12 - 0.52 0.79 0.66 0.68 - 1.25 0.52 0.36 0.68 0.18
OR5( 1 -   6 -   4 - ) Al13Fe3//(0 4 6) Al13Fe4
[ 2 - 25 -   38 ] Al13Fe3//[1 0 0] Al13Fe4
- 0.07 - 0.60 0.32 - 0.85 - 0.39 - 0.14 1.29 - 0.30 - 1.43 0.50 - 1.33 0.73 - 0.91 - 0.30 - 0.76 0.20 - 0.27 - 0.46
OR6( 7 -   3 -   1 - ) Al13Fe3//( 2 - 0 9) Al13Fe4
[ 22   25 -   79 - ] Al13Fe3//[0 1 0] Al13Fe4
0.09 0.21 - 0.91 0.86 - 0.23 - 0.78 - 1.28 - 0.75 - 0.15 - 0.52 1.08 - 0.91 0.68 - 1.12 - 0.19 - 0.36 - 0.68 - 0.19
OR7(5 6 - 2) Al13Fe3//( 7 -   1 0) Al13Fe4
[ 8 -   7 -   1 - ] Al13Fe3//[0 0 1] Al13Fe4
0.07 0.21 - 0.90 0.83 - 0.25 - 0.79 - 1.32 - 0.74 - 0.11 - 0.53 1.09 - 0.90 0.66 - 1.15 - 0.21 - 0.37 - 0.67 - 0.18
Disclaimer/Publisher’s Note: The statements, opinions and data contained in all publications are solely those of the individual author(s) and contributor(s) and not of MDPI and/or the editor(s). MDPI and/or the editor(s) disclaim responsibility for any injury to people or property resulting from any ideas, methods, instructions or products referred to in the content.

