Article

First Principles Study of the Effects of Si, P, and S on the ∑5 (210)[001] Grain Boundary of γ-Fe

1
College of Metallurgy and Energy, North China University of Science and Technology, Tangshan 063210, China
2
College of Materials Science and Engineering, North China University of Science and Technology, Tangshan 063210, China
3
State Key Laboratory of Metastable Materials Science and Technology, Yanshan University, Qinhuangdao 066004, China
*
Author to whom correspondence should be addressed.
Metals 2024, 14(4), 471; https://doi.org/10.3390/met14040471
Submission received: 20 February 2024 / Revised: 14 April 2024 / Accepted: 15 April 2024 / Published: 17 April 2024
(This article belongs to the Section Computation and Simulation on Metals)

Abstract

:
Solutes segregating at the grain boundary (GB) have a significant influence on the mechanical and chemical properties of steel. In this study, the segregation effects of Si, P, and S on γ-Fe ∑5 (210)[001] GB were systematically analyzed with solution energy, segregation energy, and tensile tests by using a first principles calculation. Si, P, and S are preferred to segregate at substitutional sites in the first layer near the GB. The variation in atomic configuration and electron distribution were investigated by the analysis of bond lengths, charge density, charge density difference, and density of states (DOS), which is caused by the atomic size and electronegativity of solute atoms. Through tensile tests, it was found that Si has a strengthening effect on GB, while P and S exhibit embrittlement effects at low concentration. As the concentration of solutes increase, the segregation sites of P are different from the others owing to the tendency to form Fe3P. The exhibited embrittlement effect is mitigated at first and then aggravated. However, in both cases Si and S show aggravating embrittlement effects on GB cohesion, while the effect of Si changes from strengthening to embrittlement. This work provides comprehensive insights into the effects of Si, P, and S, which will be a useful guidance in steel design.

Graphical Abstract

1. Introduction

Grain boundary engineering (GBE) was introduced to steel design to improve performance and has attracted considerable attention in recent years [1,2]. Grain boundary, as an indispensable part of steel, is closely related to the mechanical and chemical properties, such as mechanical strength and corrosion resistance [3,4,5,6,7]. Herein, it is significant to tailor the properties of steel through GBE, which has inspired substantial research efforts.
At present, there are two primary research directions for steel design using GBE: (1) increasing the proportion of the required GB by adjusting the processing technique [1]; (2) introducing heteroatoms to segregate at the GB to improve the performance [8]. Therefore, a key issue is to determine the segregation behavior and the effects of heteroatoms on the GB of steel. Although the segregation behavior of heteroatoms at the GB have been previously observed by atom probe tomography (APT) and transmission electron microscopy (TEM), it is hard to identify the segregation sites and atomic interaction experimentally [9]. The underlying atomic effects on the GB are still challenging to describe. However, a first principles calculation provides an effective way to represent the effect of heteroatoms at the atomic scale, which can predict the atomic change and the mechanical properties. Thus, much research has been performed to investigate the segregation behavior and effects of heteroatoms on the GB of steel by using a first principles calculation [8,10,11,12,13,14].
Many impurity elements in steel have been investigated through first principles calculations, which are mainly divided into metallic elements (Ti, Cr, Ni, Cu, Zr, Nb, Ta, W, Zn, and so on) and nonmetallic elements (H, B, C, N, O, Si, P, and S). Among metallic elements, Ti, Cu, Nb, and Mo are energetically favored to segregate at the GB of γ-Fe, while V, Ni, and Co depend on GB characteristics [15]. The segregation effects of Cr, Ni, Cu, Zr, Ta, and W on the Σ3 (111)[110] GB in α-Fe have also been systematically studied, and have verified that Zr, Ni, and Cu weaken the GB cohesion, while Cr, Ta, and W have a strengthening influence [8]. For metal impurities, liquid metal-induced brittleness is a serious problem in steel. The liquid metals, such as Zn, Sn, Pb, and Bi, segregate at the GB and cause embrittling by affecting the bond strength of the GB interface [6,12,13,16,17]. Investigating the effects of nonmetallic elements on the GB is another crucial issue, which has been extensively studied. The effects of nonmetallic elements (H, B, C, N, O, Si, P, and S) on the γ-Fe ∑5 (310)[001] GB have been comprehensively analyzed, and demonstrates that only B has a strengthening effect [18]. For nonmetallic elements, hydrogen embrittlement is a long-standing problem of steel. The trapping sites, diffusion behavior, and embrittlement effect of hydrogen have been systematically investigated through first principles calculations [10,19,20,21,22]. In order to reduce the harmful effects and improve performance, co-segregation effects of impurity elements were used in steel. Ahmadian et al. [23] found that the co-segregation of carbon and boron can induce aluminum depletion at the α-Fe Σ5 (310)[001] GB of Fe alloys, where B and C act as GB cohesion enhancers to alleviate the embrittlement effects of Al. The introduction of Cr can inhibit He segregation and diffusion at the Σ3(112) GB in α-Fe alloys [24]. The electron compensating effect appears to reduce the embrittlement effect of S on γ-Fe Σ5 (021) by the co-segregation of H [25]. B and C can mitigate the mechanical distortion by replacing the P to realize the de-embrittling effect [26]. Overall, the computational simulation can reveal the influence mechanism of the impurity element at the GB and predict the effect on the performance of the steel. Therefore, new steels can be designed, and their properties can be predicted according to the influence law.
Among nonmetallic elements, the segregation behavior and strengthening effects of P and S have been extensively studied [11,18,25,26,27,28,29]. It was found that P and S have a strong segregation tendency at the GBs of steel, and cause embrittlement even at very small concentrations. The main reason is that the bonds of S–Fe and P–Fe have large numbers of valence electrons, which strengthen the bonding of the first-neighbor and weaken the bonding of the second-neighbor. However, there are some disputes that still exist regarding segregation sites and strengthening effects. The interstitial sites are often used as segregation sites to accommodate P and S, while the substitutional sites are ignored. Also, Wang et al. [26] have found that the effects of P on the α-Fe Σ5(310) GB are closely related to concentration, and embrittlement only occurs beyond a critical content. In the case of S, the strengthening effect was observed on the α-Fe Σ5(310) GB by Verkhovykh et al. [27]. These results conflict with previous studies [11,18,25,28]. Meanwhile, there is little research that investigates the effects of Si on the GB of Fe. Therefore, it is necessary to systematically investigate the effects of impurity atoms of Si, P, and S on the GBs of steel by a first principles calculation. The stability, segregation behavior, and strengthening/embrittlement effects were analyzed through atomic configuration and electron distribution, which are the key influencing factors for variation. The influence of impurity elements on the GB provides a theoretical basis for steel design with high mechanical performance.

2. Methodology

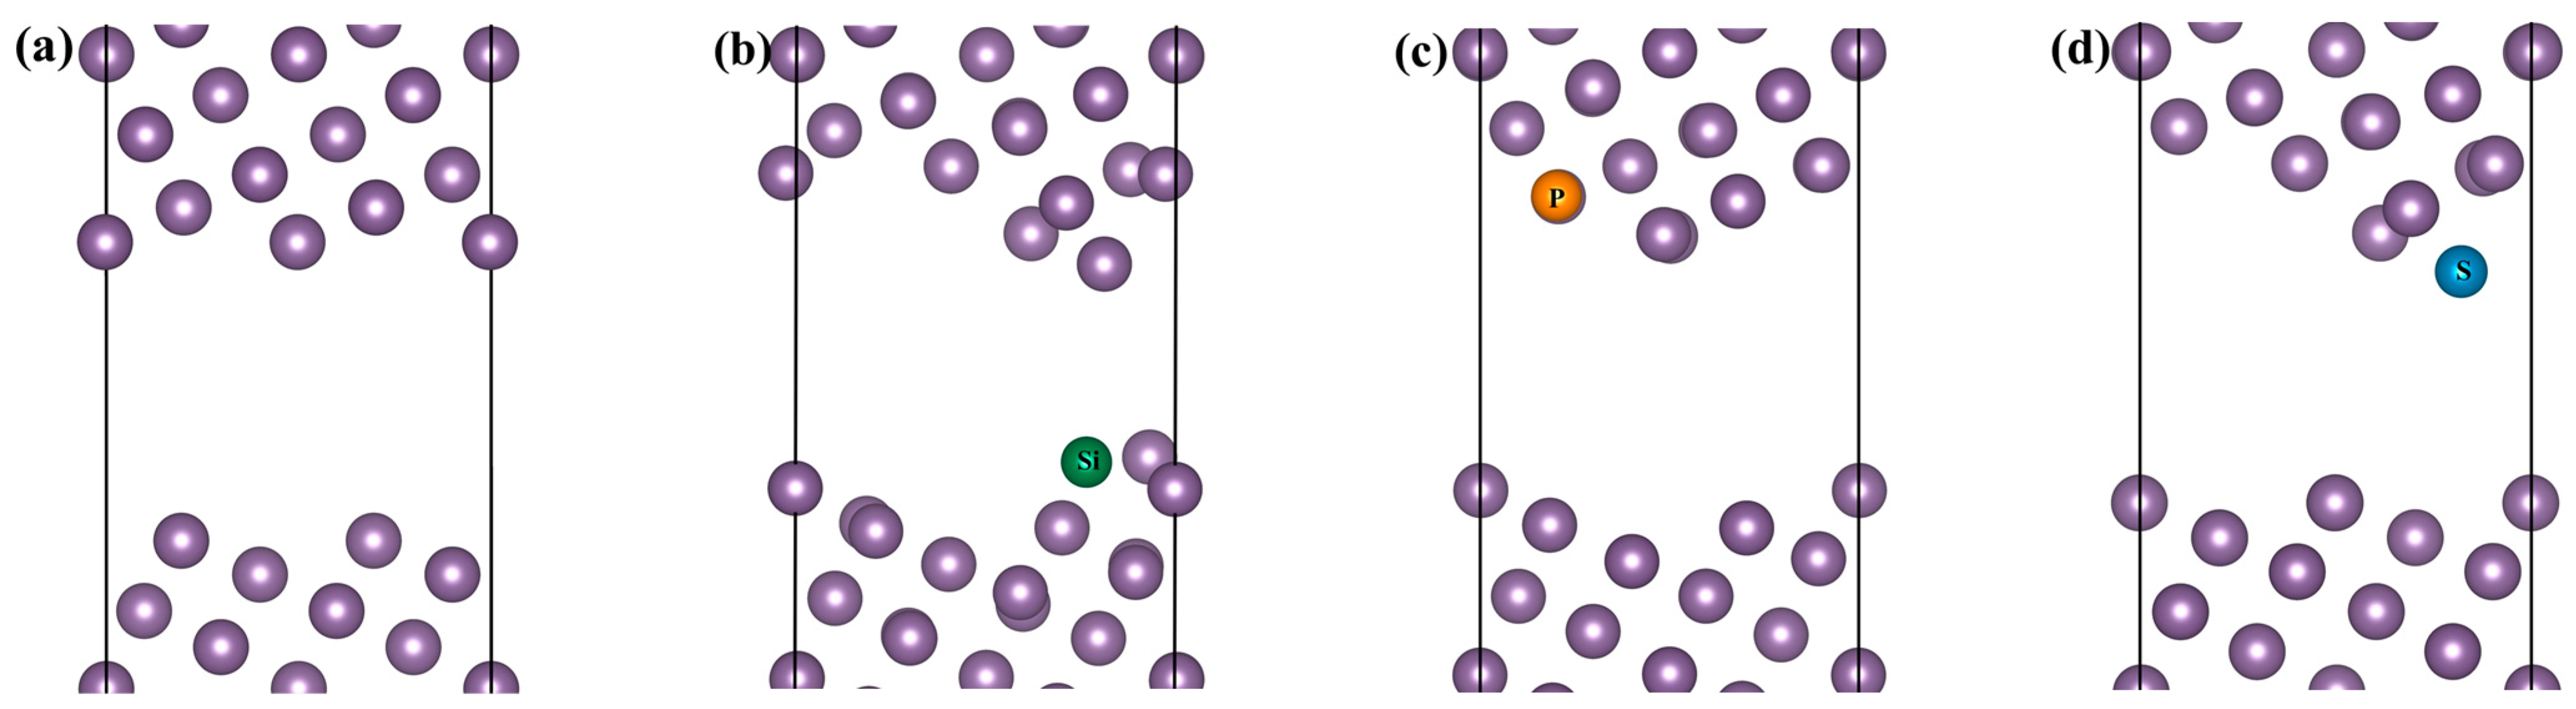
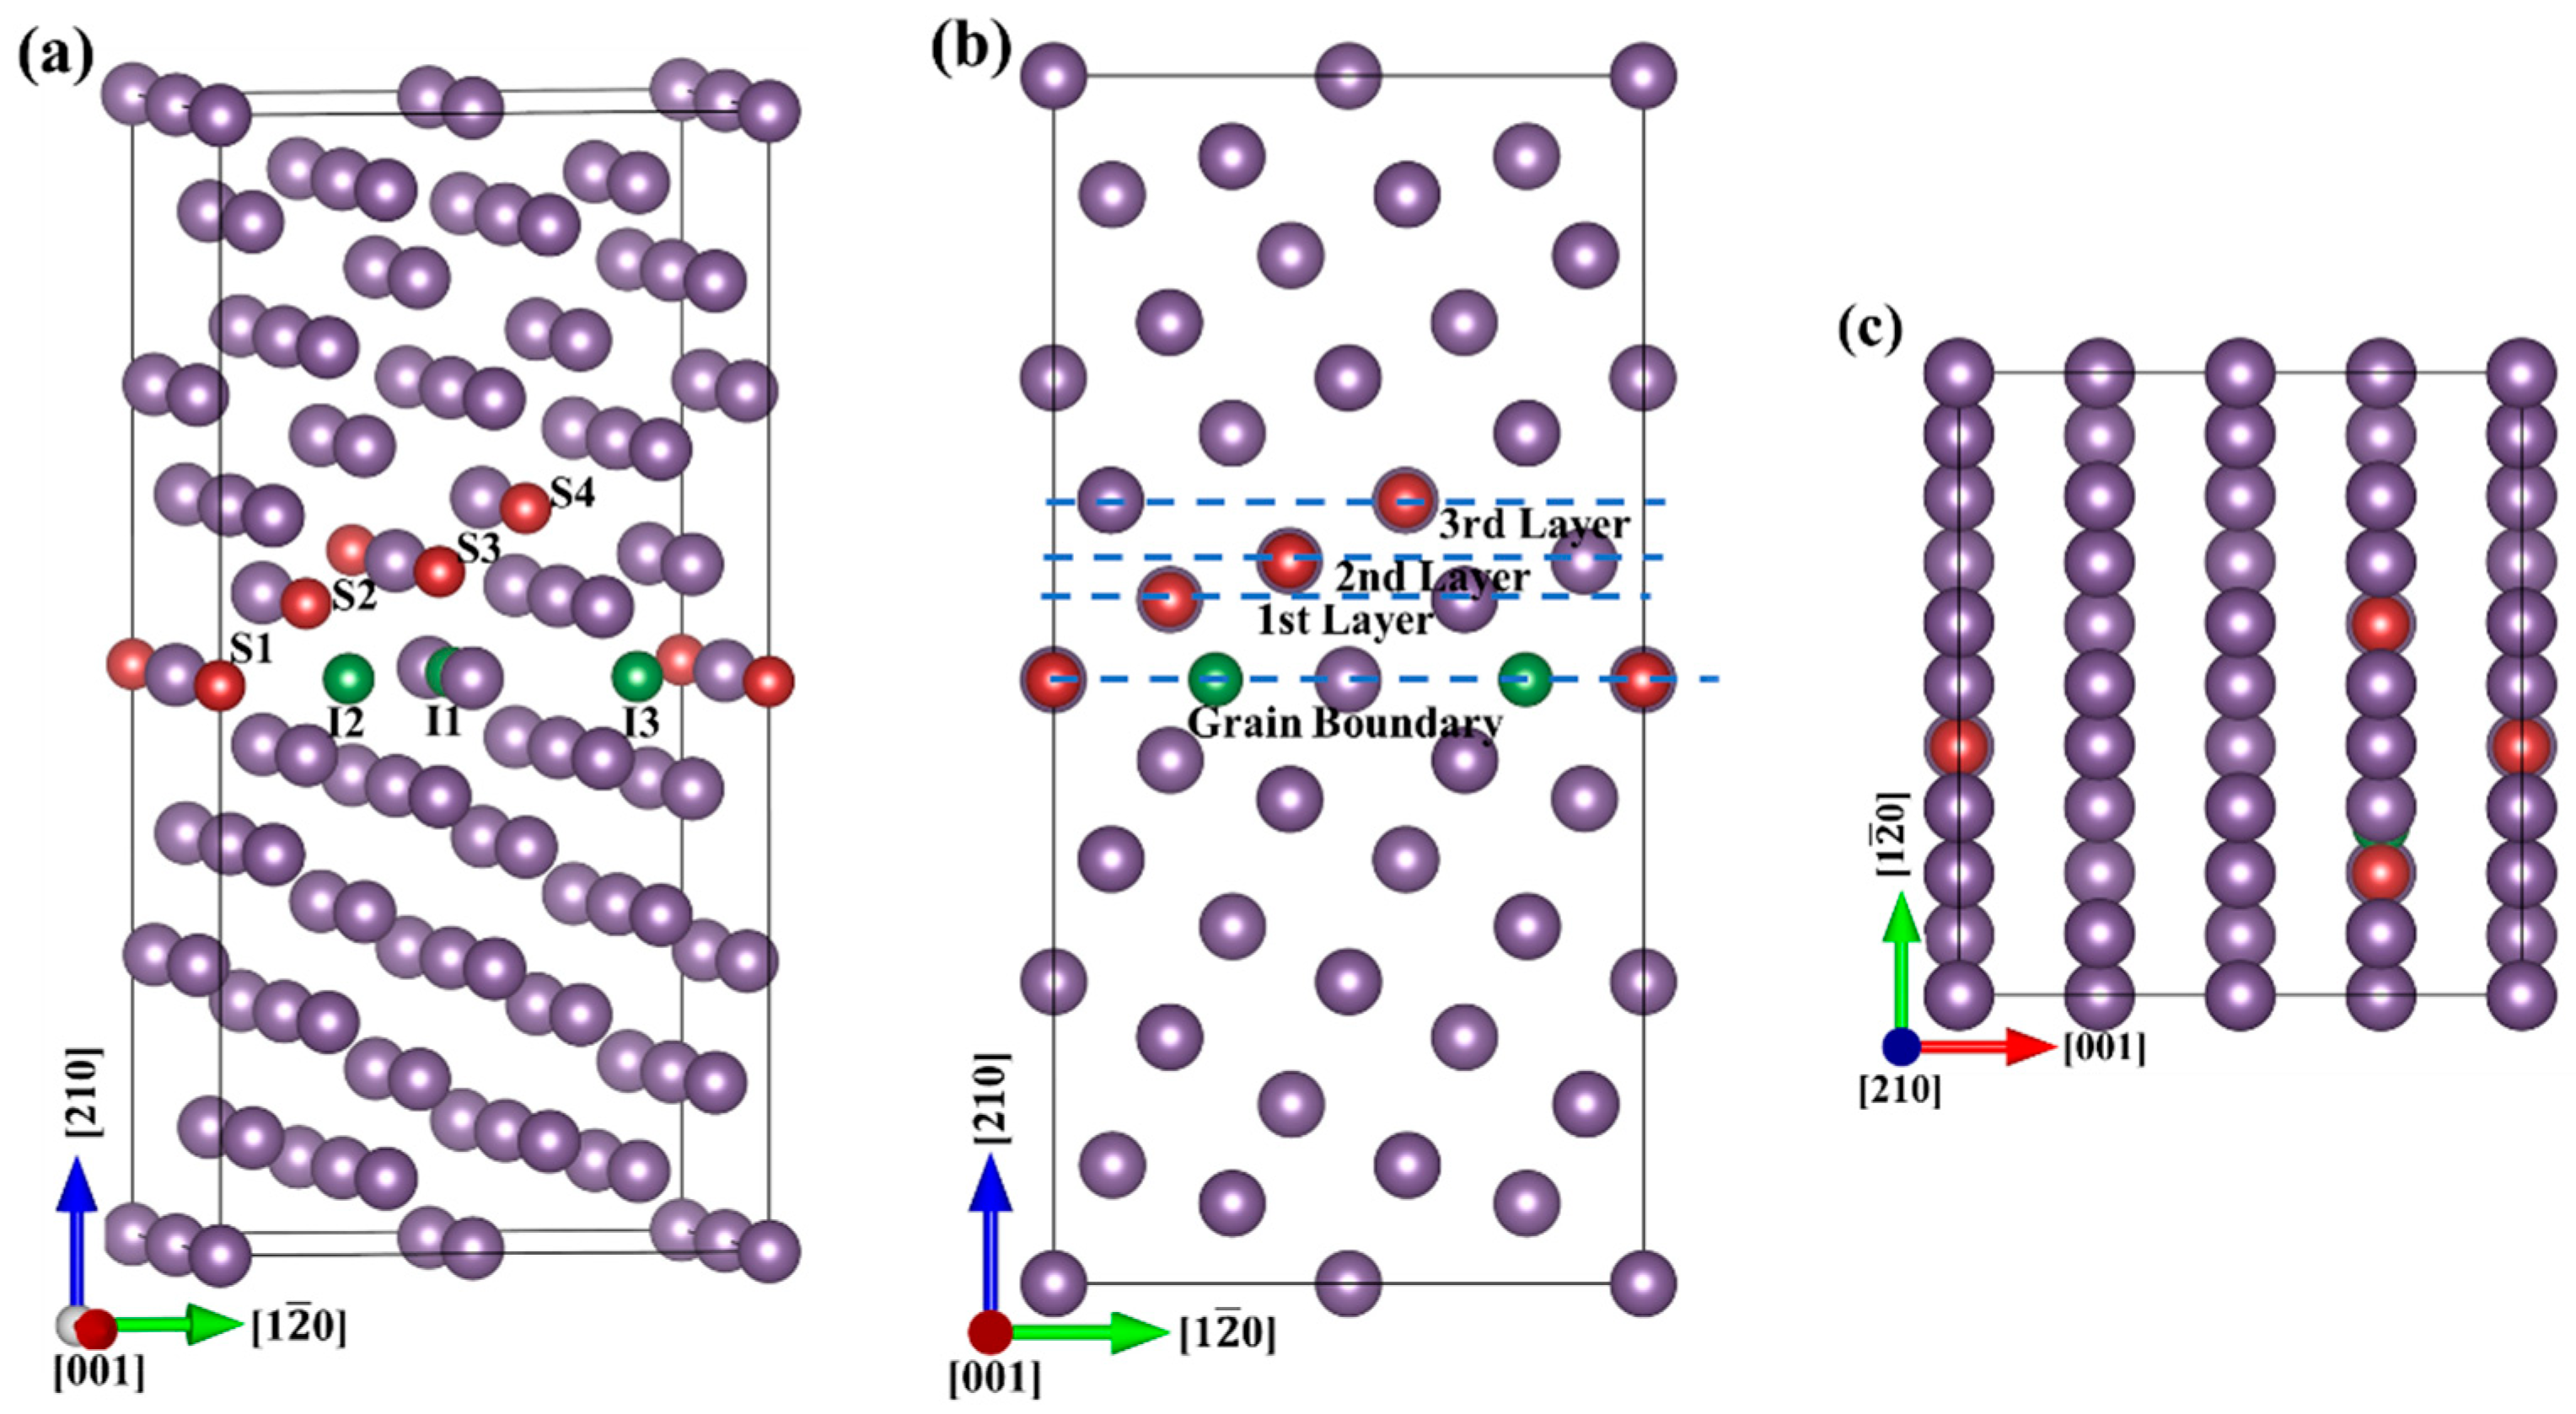
2.1. Computational Model

According to the coincidence site lattice (CSL) theory, the Σ5(210) GB supercell was constructed by rotating one grain 53.1° along the [001] tilt axis, where the habit plane is the face (210), as depicted in Figure 1. It contains 21 layers and 80 Fe atoms. A systematic investigation was performed to identify the location sites of Si, P, and S, which includes interstitial sites and substitutional sites. The possible interstitial sites were labeled by I1, I2, and I3 in Figure 1a. The GB and different layers near the GB are shown in Figure 1b. The possible substitutional sites were set in different atomic layers near the GB, S1 at the grain boundary layer, S2 in the first atomic layer, S3 in the second atomic layer, and S4 in the third atomic layer.

2.2. Computational Details

All calculations based on density functional theory were carried out by using the Cambridge Sequential Total Energy Package (CASTEP) [30]. The ion–electron interaction was described by using the ultrasoft pseudopotential (USPP) [31]. The generalized gradient approximation (GGA) [32] with the Perdew–Burke–Emzerhof (PBE) [33] exchange correlation function was applied to treat the exchange correlation interaction. The cutoff energy was set to 400 eV to yield convergence results. The convergence criteria of energy and force were less than 10−5 eV/atom and 0.03 eV/Å, respectively.
In general, solution energy is used to assess the stability of the system, which was calculated in Equation (1) [26].
E s o l F e + x = [ E G B F e + x E G B F e N x i + N x s ) E x + N x s E F e / N x i + N x s
where E G B F e + x and E G B F e represent the total energy of the GB supercell with and without impurity atoms x, E x and E F e are the atomic energies of the x atom and the Fe atom in their ground states, respectively. Cubic Si (material ID: mp-149), triclinic P (material ID: mp-1198724), monoclinic S (material ID:mp-96), and cubic Fe (material ID: mp-13) were used to calculate E x and E F e , which were obtained from the program of Materials Project. N x i and N x s are the number of impurity atoms located at interstitial sites and substitutional sites, respectively. The negative value of E s o l F e + x indicates that the introduction of impurity atom x can stabilize the GB model.
In order to estimate the segregation tendency of impurity atoms to the GB, the segregation energy was calculated, which is defined in the following Equation (2) [34].
E s e g x = E G B F e + x E G B F e E b u l k F e + x E b u l k F e
where E b u l k F e + x   and   E b u l k F e are the total energies of the Fe bulk system with and without the x impurity atoms. The higher the value of the segregation energy, the more difficult it is for the x atom to segregate to the GB. To further clarify the interaction mechanism of impurity atoms, the segregation energy can be decomposed into mechanical and chemical contributions, which can be defined by the following Equation (3) [8].
E s e g x = E s e g m e c + E s e g c h e m
where E s e g m e c is the mechanical contribution, which originates from strain distortion before and after the impurity atom segregation at the GB, while E s e g c h e m is closely related to the bond energies. The mechanical contribution can be calculated as Equation (4).
E s e g m e c = E G B m e c E G B F e E b u l k m e c E b u l k F e
where E G B m e c and E b u l k m e c are calculated through two steps: (1) the supercell containing the impurity atom is fully relaxed; (2) the impurity atom is removed from the relaxed supercell and the total energy of the treated supercell is calculated. The chemical contributions ( E b u l k c h e m ) were calculated by subtracting the E s e g m e c from E s e g x based on Equation (3), which can be used to analyze the bonding effect of impurity atoms.
To investigate the effect of an impurity element on the GB cohesion, the strengthening energy was calculated based on the Rice–Wang theory, which is described in Equation (5) [35].
E str = ( E G B F e + x E G B F e ) ( E F S F e + x E F S F e )
where E F S F e + x and E F S F e are the total energies of the free surface slab with and without the impurity atoms. A positive value of Estr means there is an embrittling effect of impurity atoms on the GB, while a negative Estr indicates that the impurity atom can enhance the GB cohesion.
The first principles tensile test is another effective way to evaluate the strengthening effect of impurity atoms. In the tensile test, a uniaxial strain was introduced into the GB supercell while ignoring the Poisson ratio. The GB supercell was stretched perpendicular to the GB interface with a small increment in strain ( ε ), which is defined in Equation (6).
ε = l ε l 0 / l 0
where   l ε and l 0 are the axial lengths after a strain of   ε and initial strength, respectively. At each stretching step, the atoms at both edges of the supercell were fixed, the structure optimization was performed with the dimensions fixed, and the residual atoms were relaxed. Based on the Nielsen–Martin method [25], the uniaxial stress σ was calculated as Equation (7).
σ = E ε / Ω
where E is the total energy of the system, while Ω is the volume after tensional strain.

3. Results and Discussion

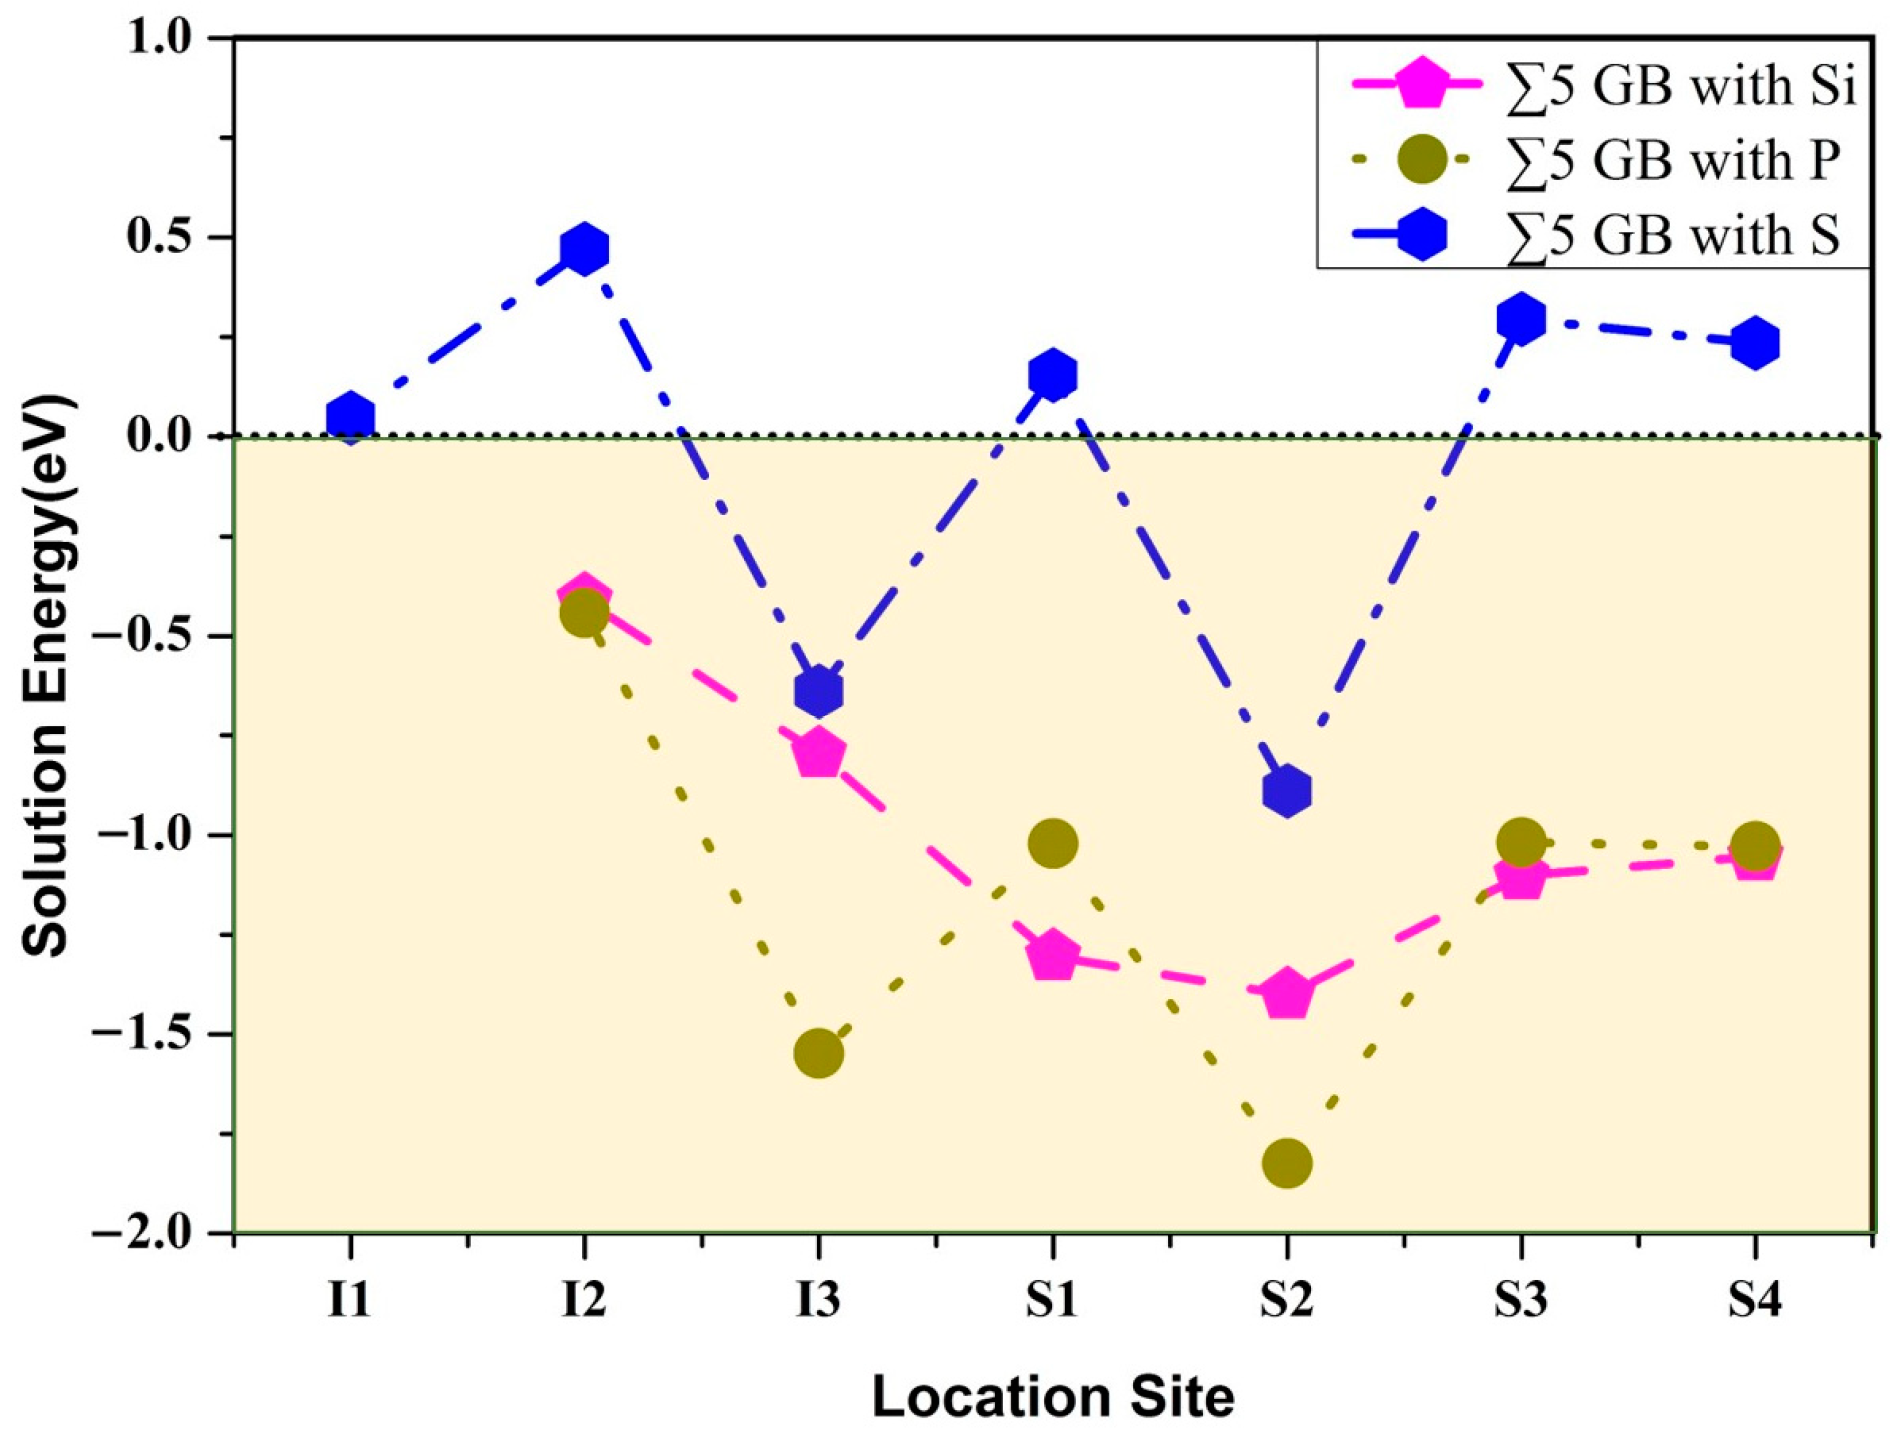
3.1. Site Preference

To verify the site preference of Si, P, and S at the GB, the solution energies were calculated, as illustrated in Figure 2. It can be seen that the solution energies of the I1 site are depleted for Si and P. The main reason is that Si and P cannot stably exist at the I1 site owing to their large atomic size, which jumps to the I3 site during the process of structure optimization. When Si, P, and S segregate at the interstitial sites of the GB, they are all preferentially located at the I3 site with the lowest solution energies being −0.80 eV, −1.55 eV, and −0.64 eV, respectively. In the case of S, the solution energies have positive values located at the I1 and the I2 site, indicating that for S, it is unstable when located at the I1 and the I2 sites. Among the substitution sites, it is also unstable for S to localize at the S1, S3 and S4 sites with a positive value of solution energy, while the others are stable with a negative value. In particular, Si, P, and S located at the first atomic layer (S2 site) near the GB have the smallest values, with −1.40 eV, −1.82 eV, and −0.89 eV, respectively. Compared with interstitial sites, it is demonstrated that the S2 site is the most stable position for Si, P, and S to be located among these possible sites, which is determined by the structural distortion and electron redistribution.

3.2. Segregation Behavior

As mentioned above, the S2 site is the most stable position to accommodate an impurity atom. Therefore, the segregation behavior of impurity atoms at the S2 site were investigated. The segregation energies of Si, P, and S at the S2 site were calculated, as shown in Table 1. It was found that the segregation energies all presented negative values with −0.14 eV, −0.80 eV, and −1.43 eV, respectively. This means Si, P, and S are apt to segregate to the S2 site in the GB. Meanwhile, the values of the segregation energies decrease, while the atomic number increases, which is closely correlated to the atomic size and electron distribution.
In order to shed light on the effect of atomic size and electronic distribution on segregation behavior, the mechanical contributions and chemical contributions were listed in Table 1. As seen from the results, both E s e g m e c and E s e g c h e m make contributions to the segregation energies, which have the same change trend as the segregation energies with the atomic number increasing. Mechanical contributions originate from the spatial mismatch, while chemical contributions are in related with the difference in electro-negativity. Compared with the absolute values of E s e g m e c and E s e g c h e m , it is evident that the values of   E s e g m e c are larger than   E s e g c h e m , which implies that the mechanical contribution is greater than the chemical contribution. Meanwhile, owing to the small difference in electro-negativity between Si (1.90) and Fe (1.83), E s e g c h e m of Si has a positive value of 0.52 eV, demonstrating a negative influence on the segregation behavior.

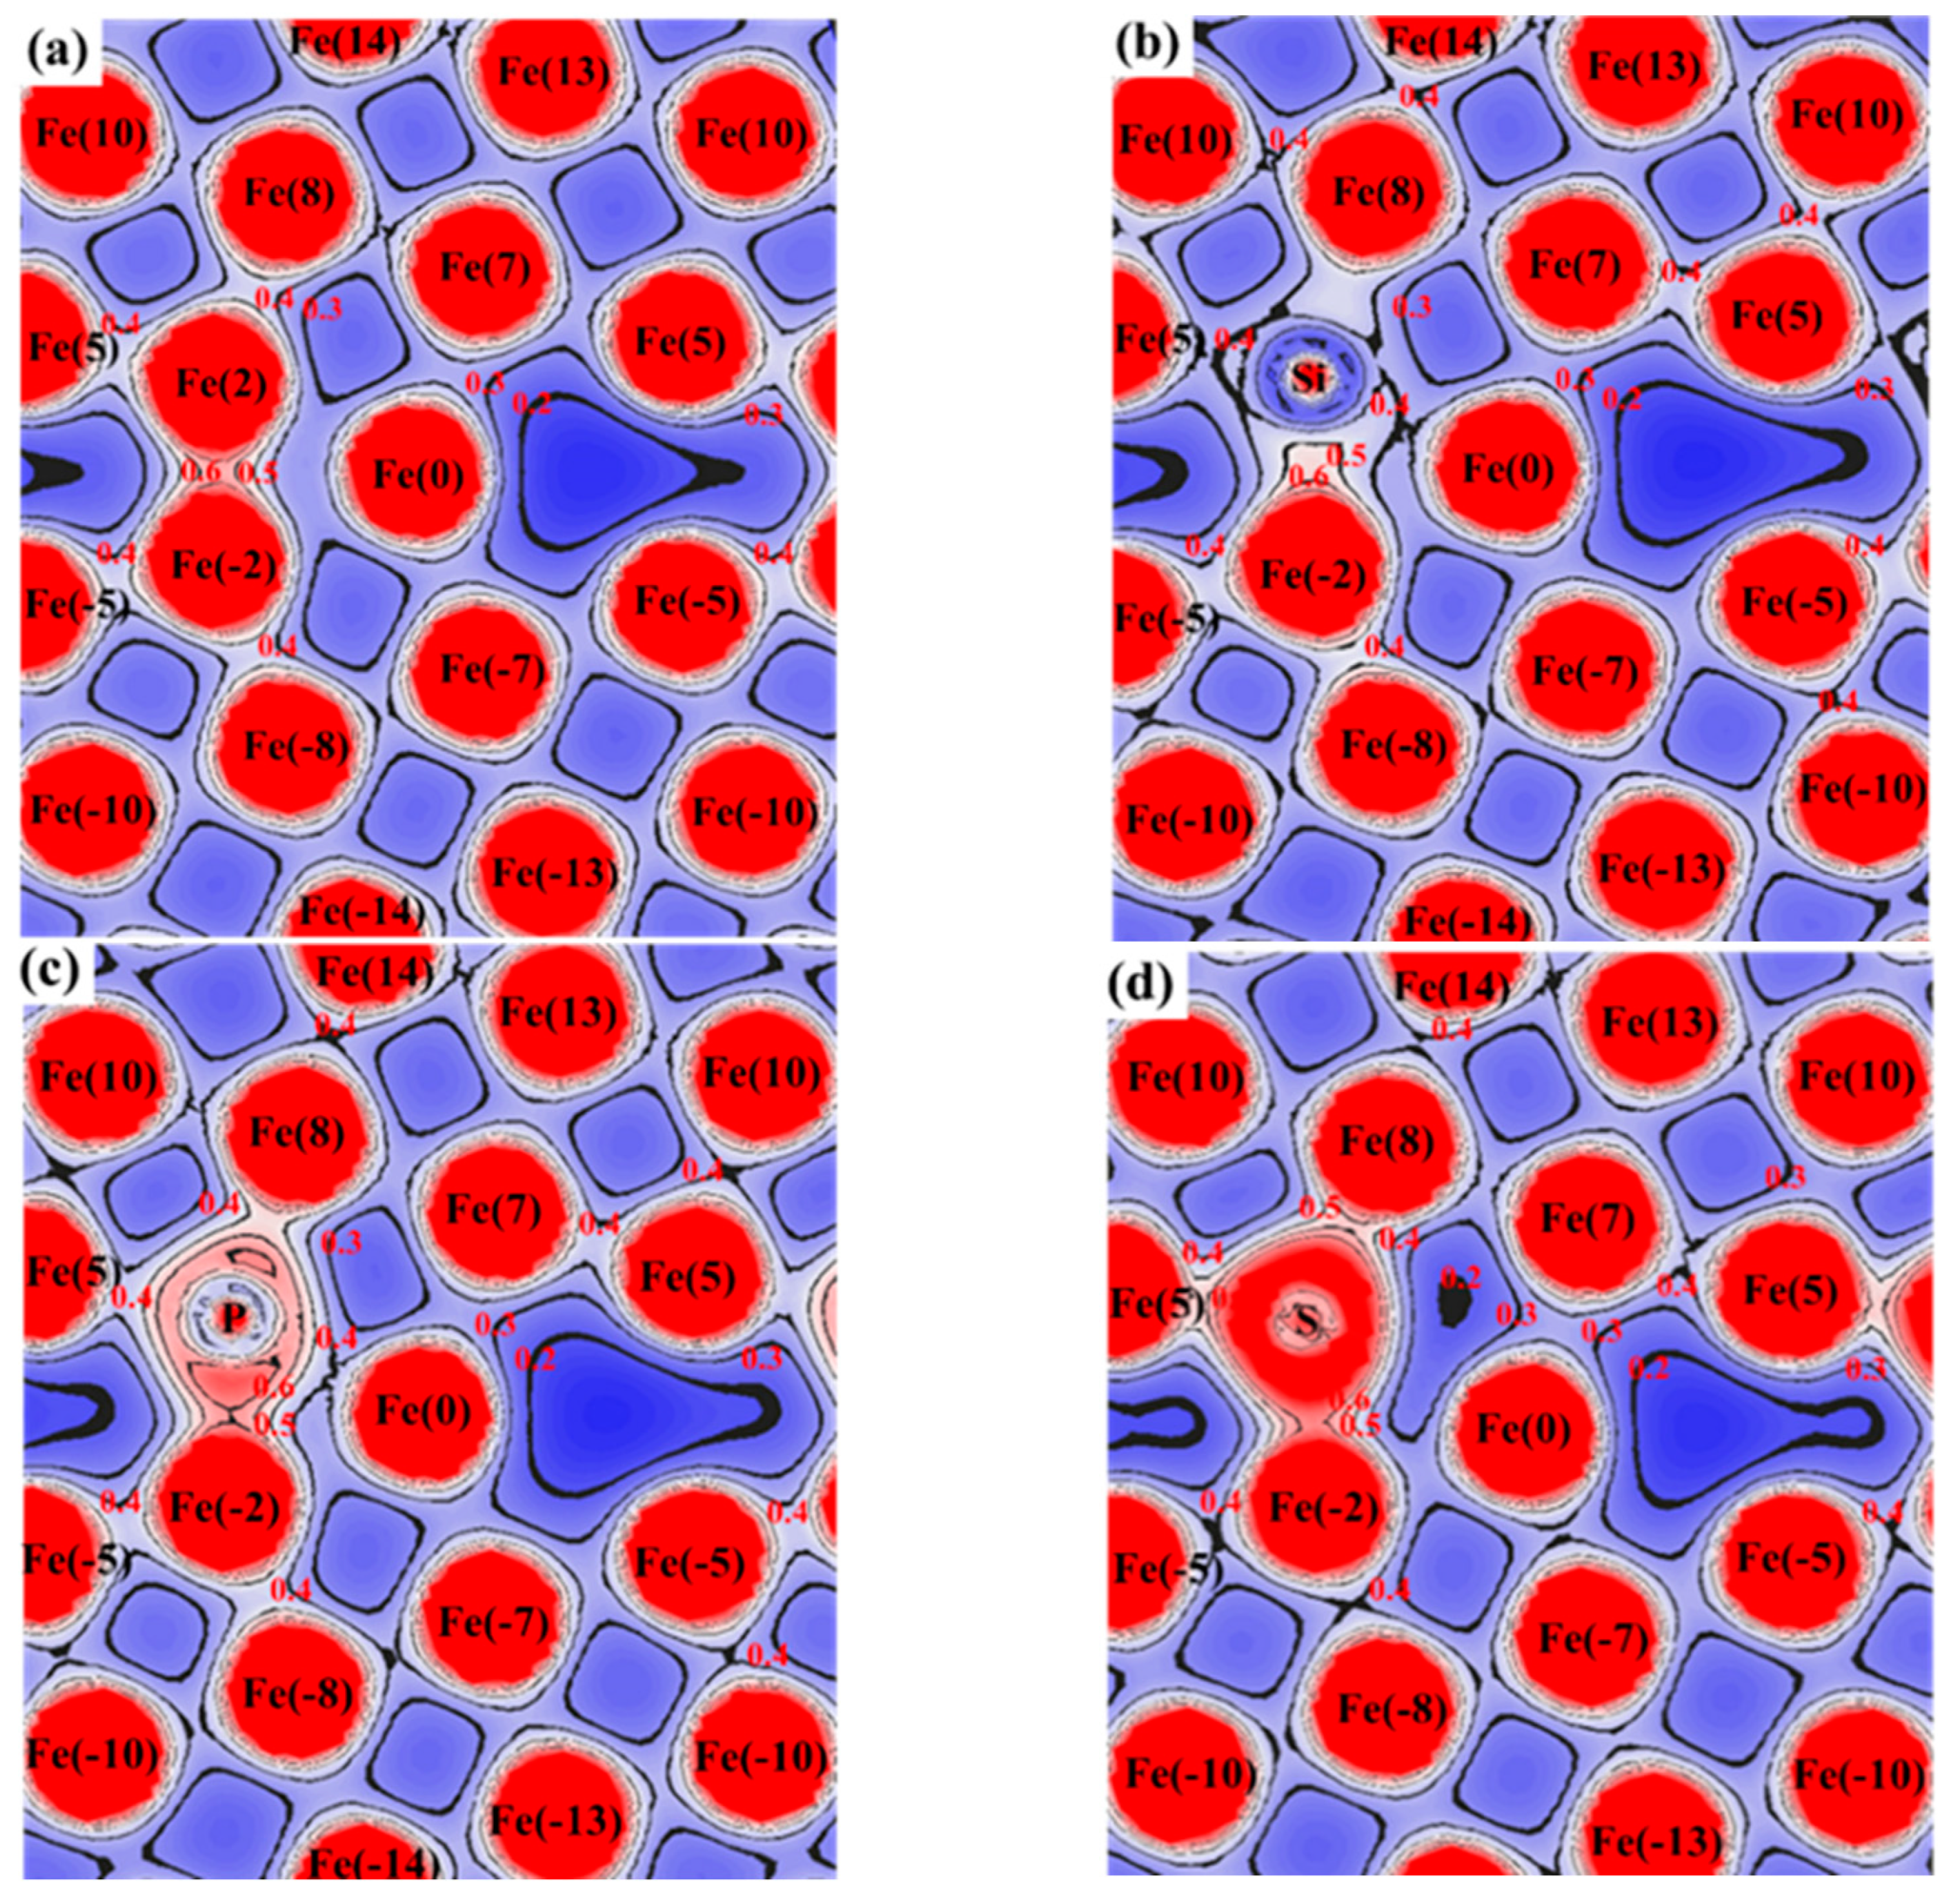
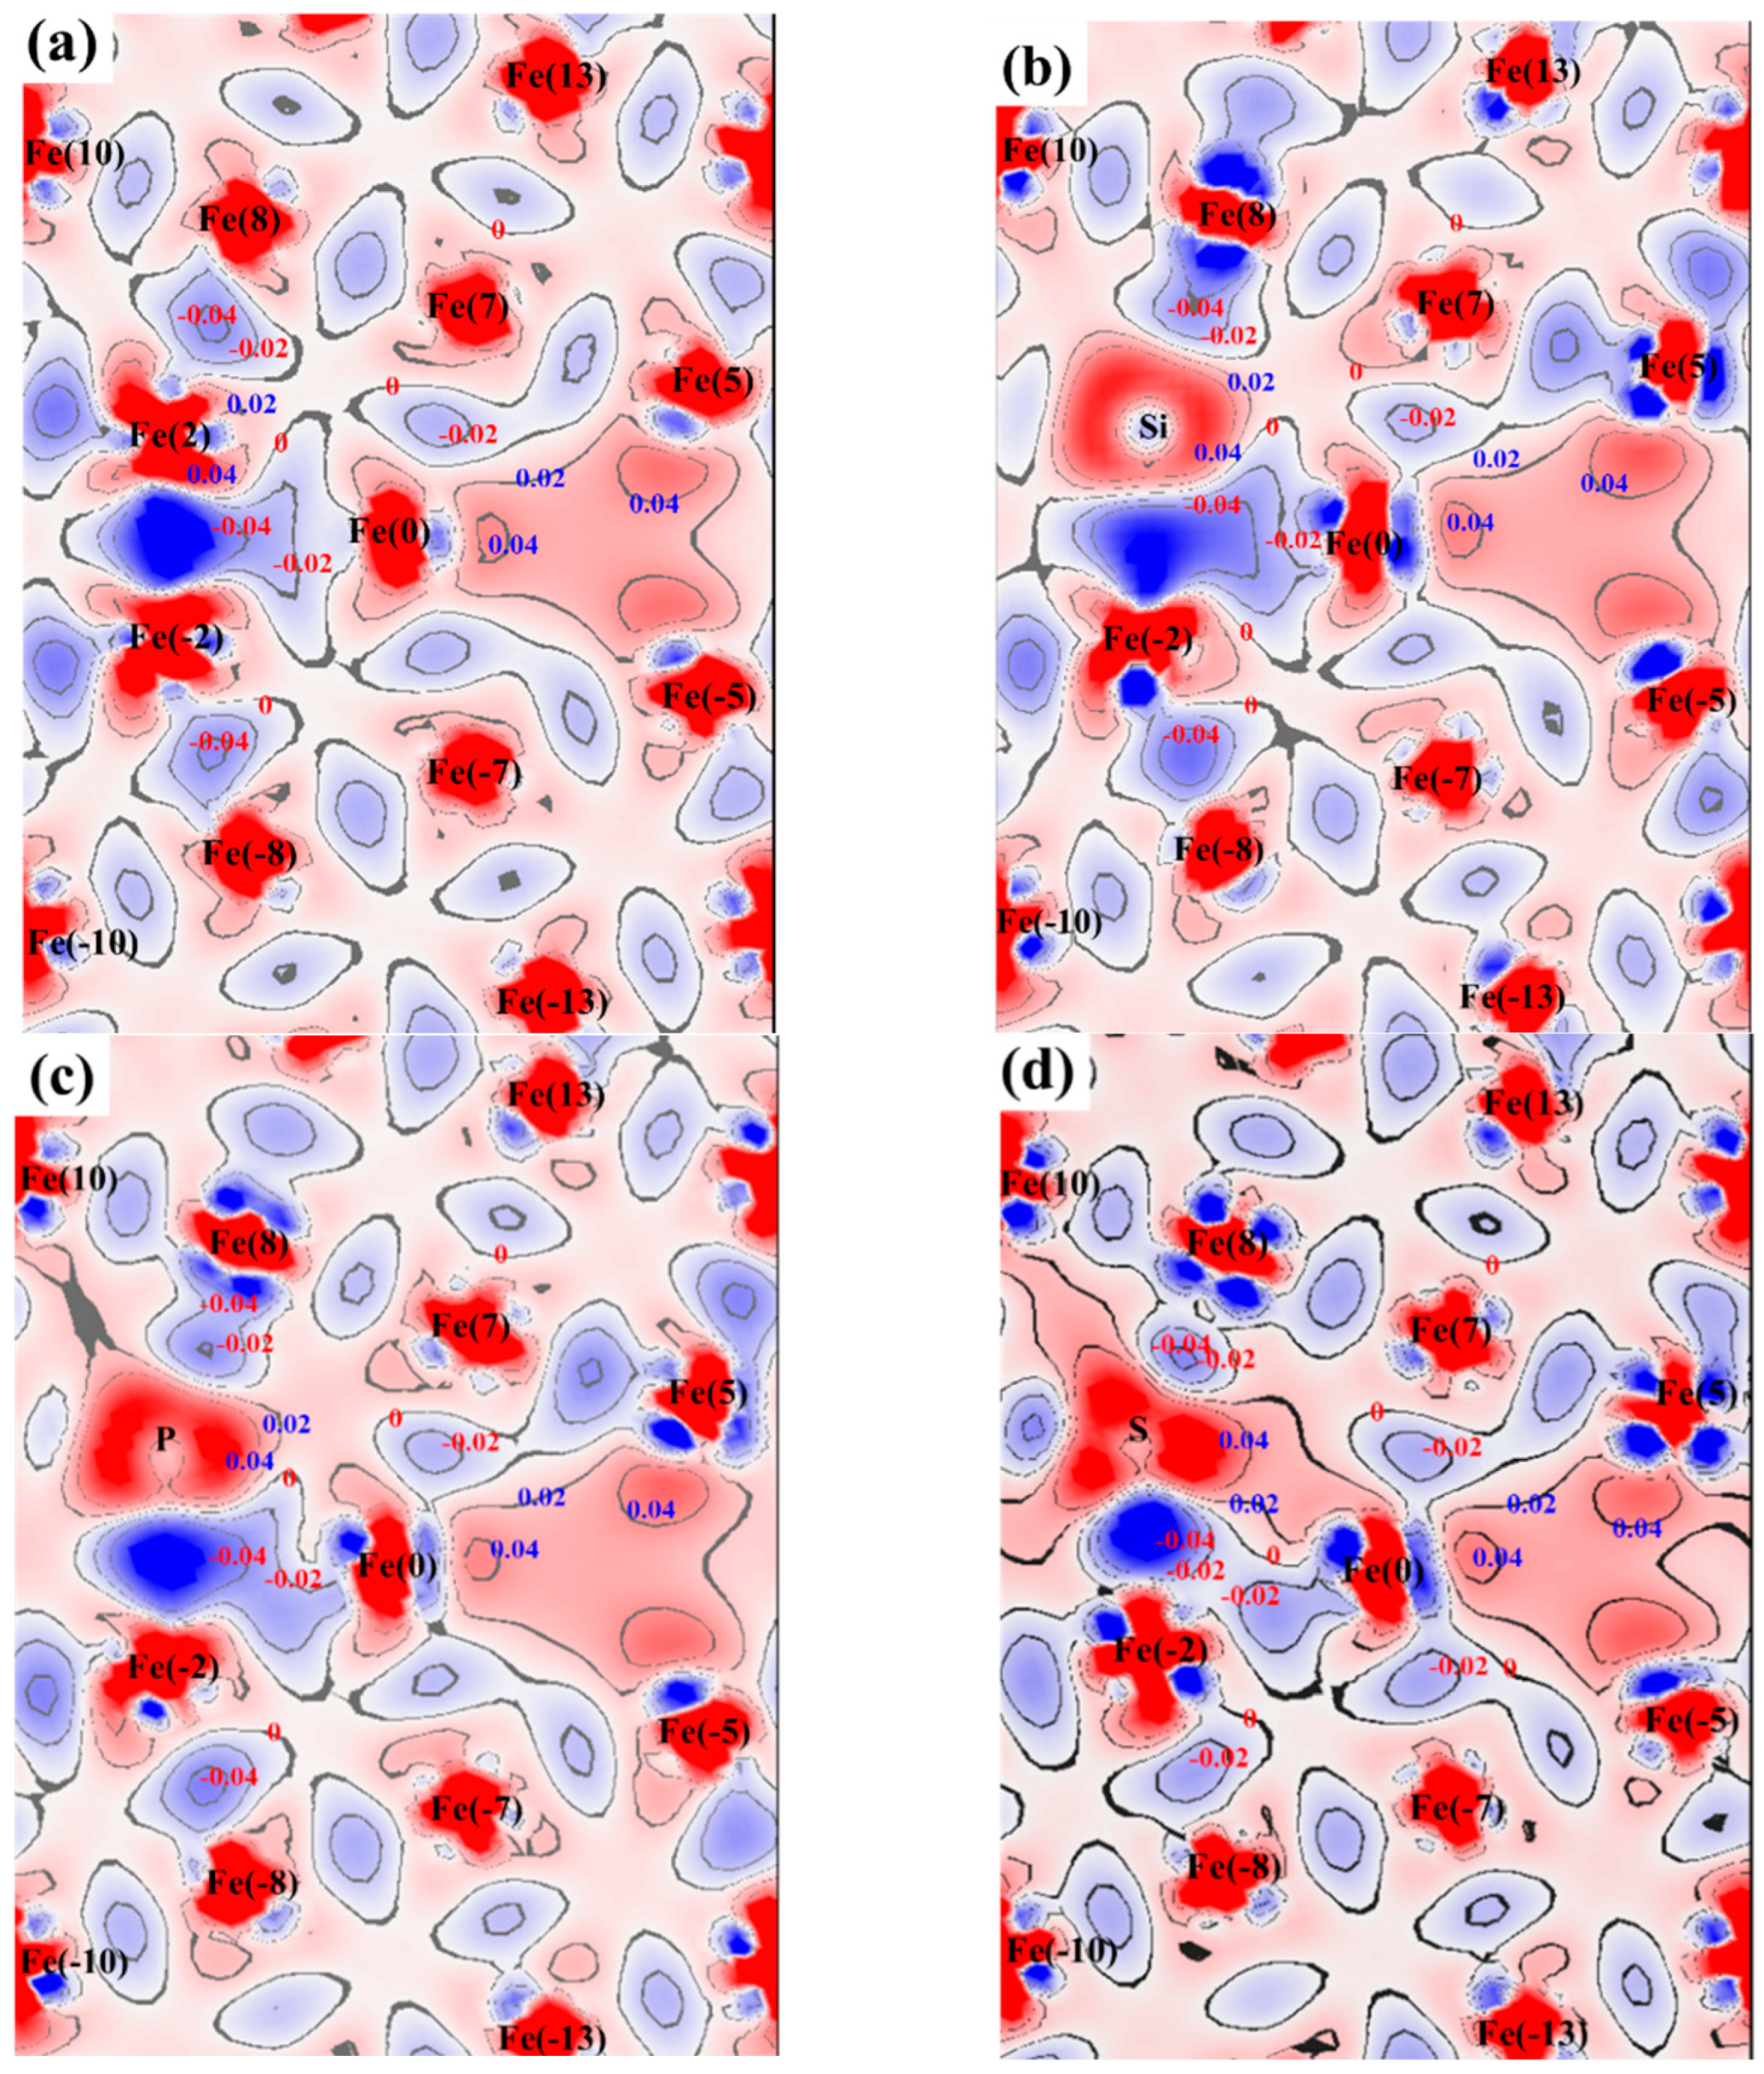
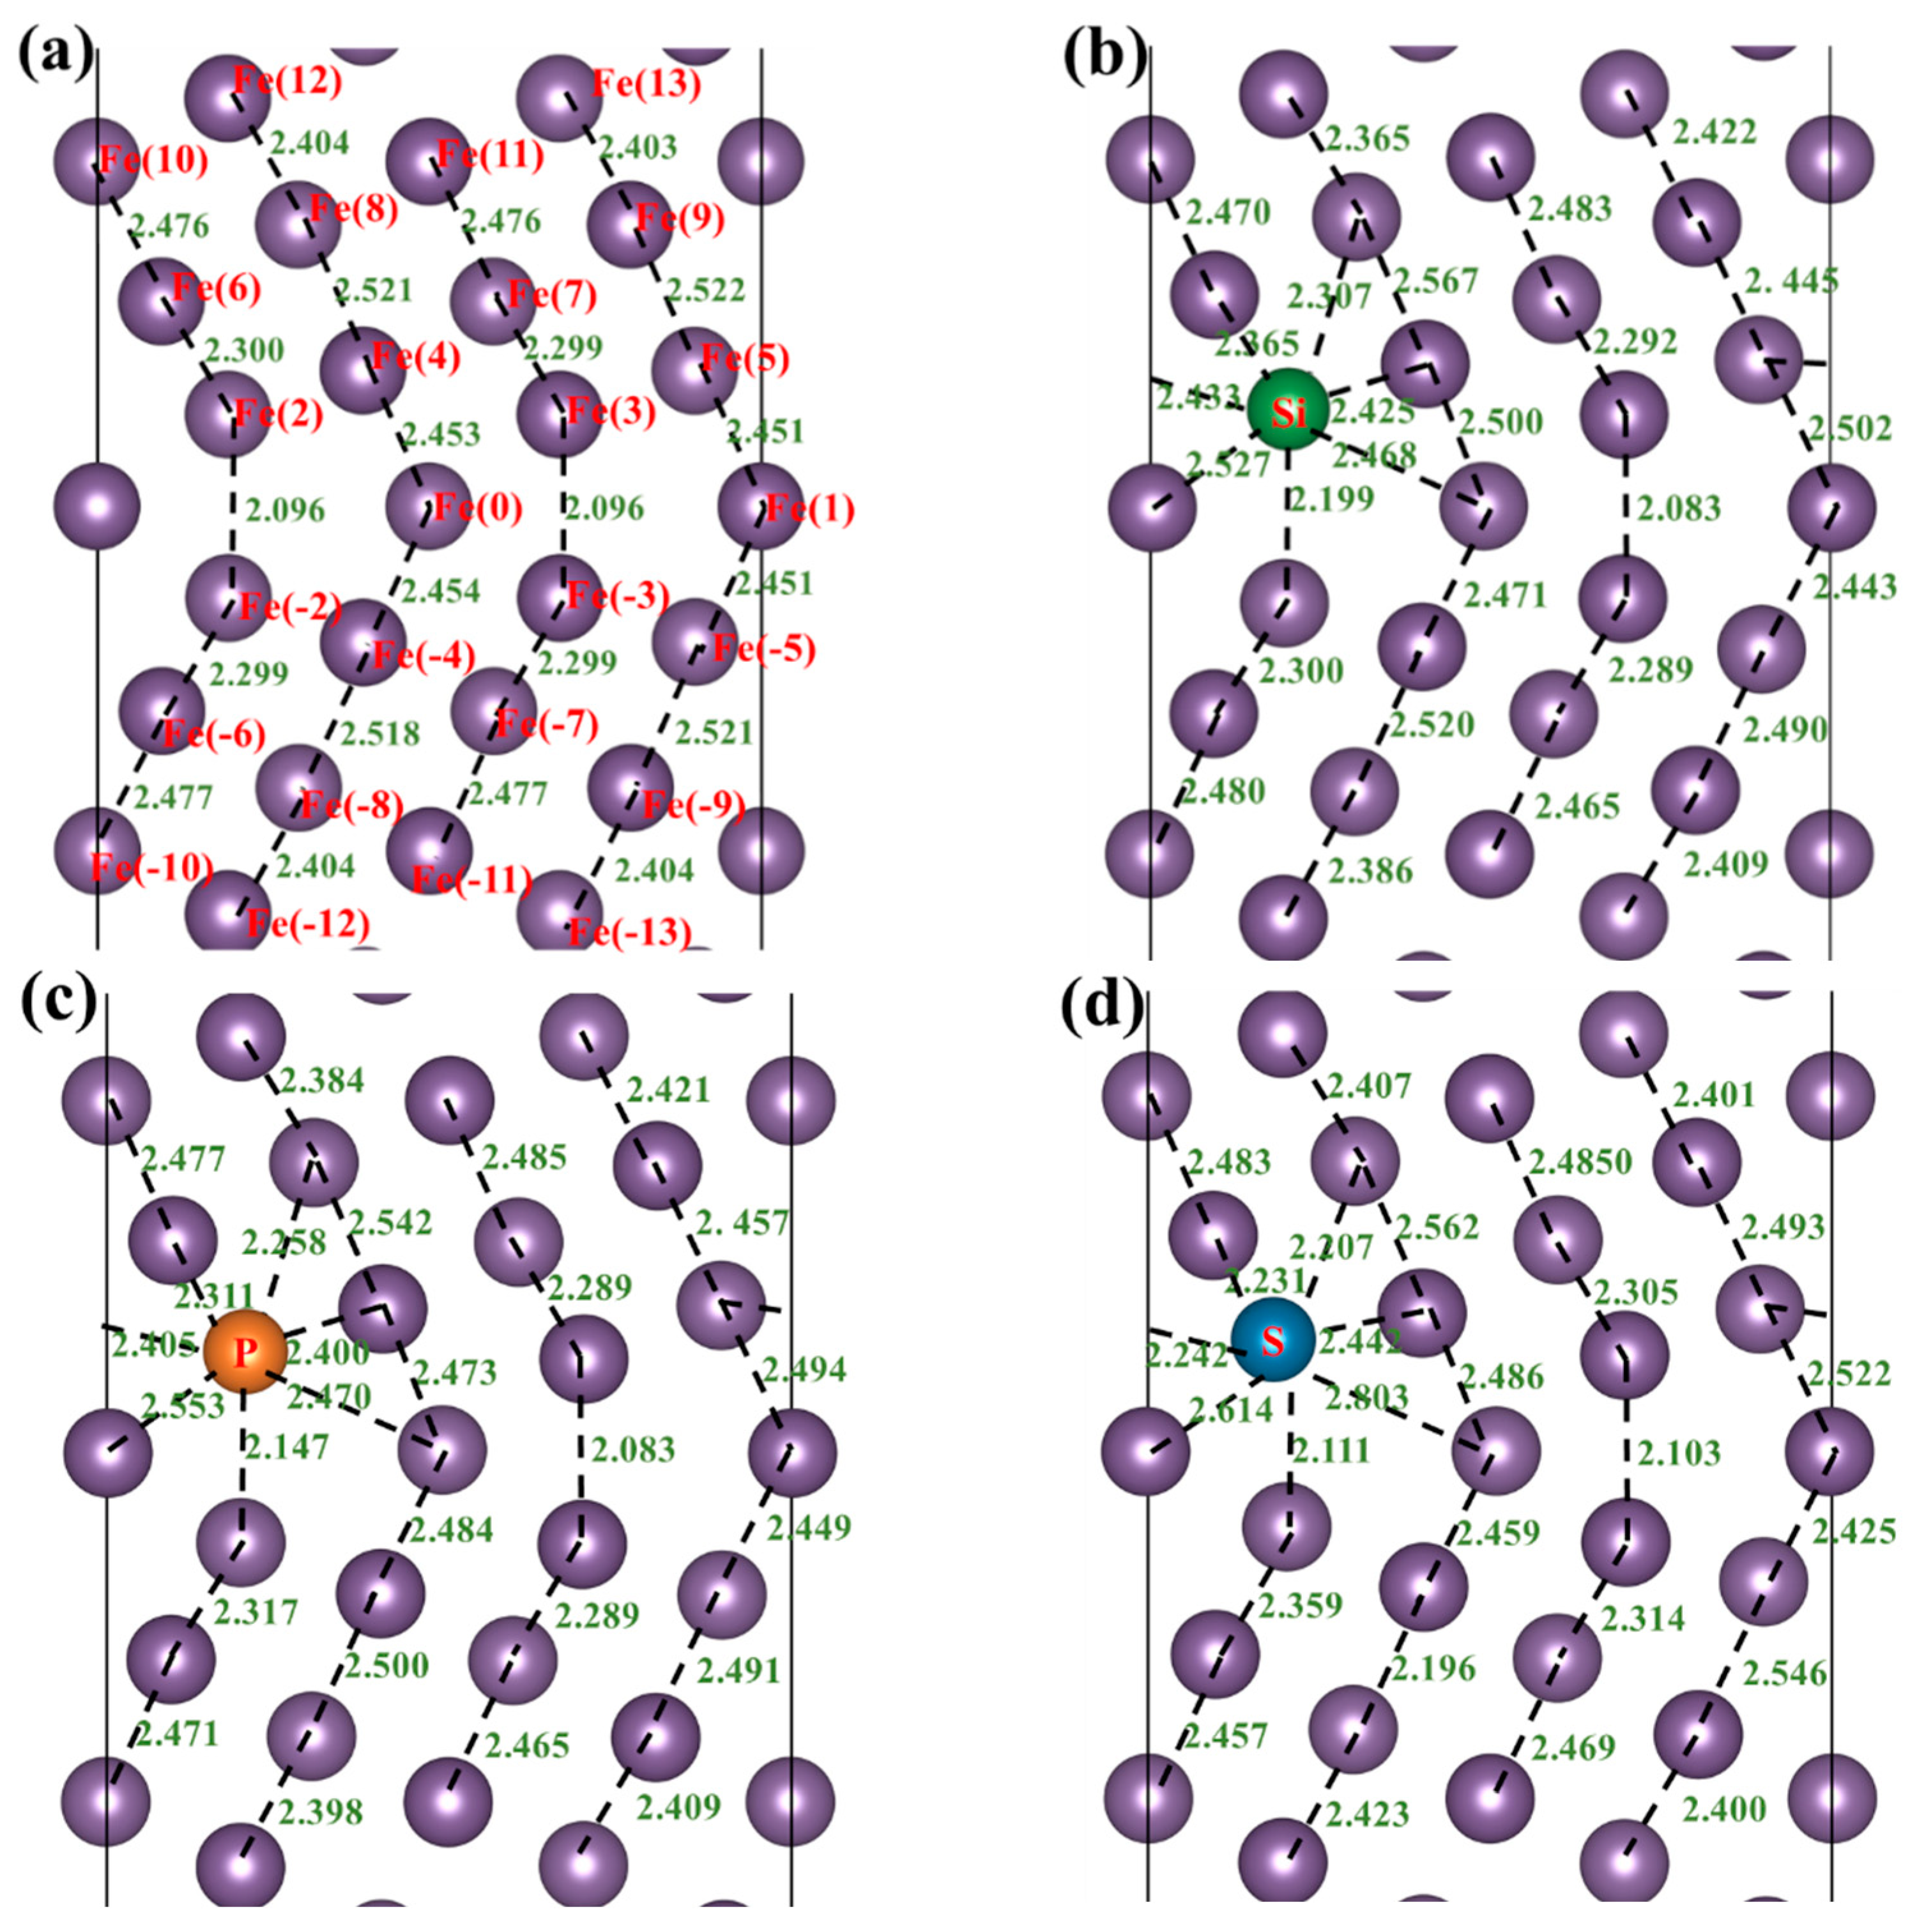
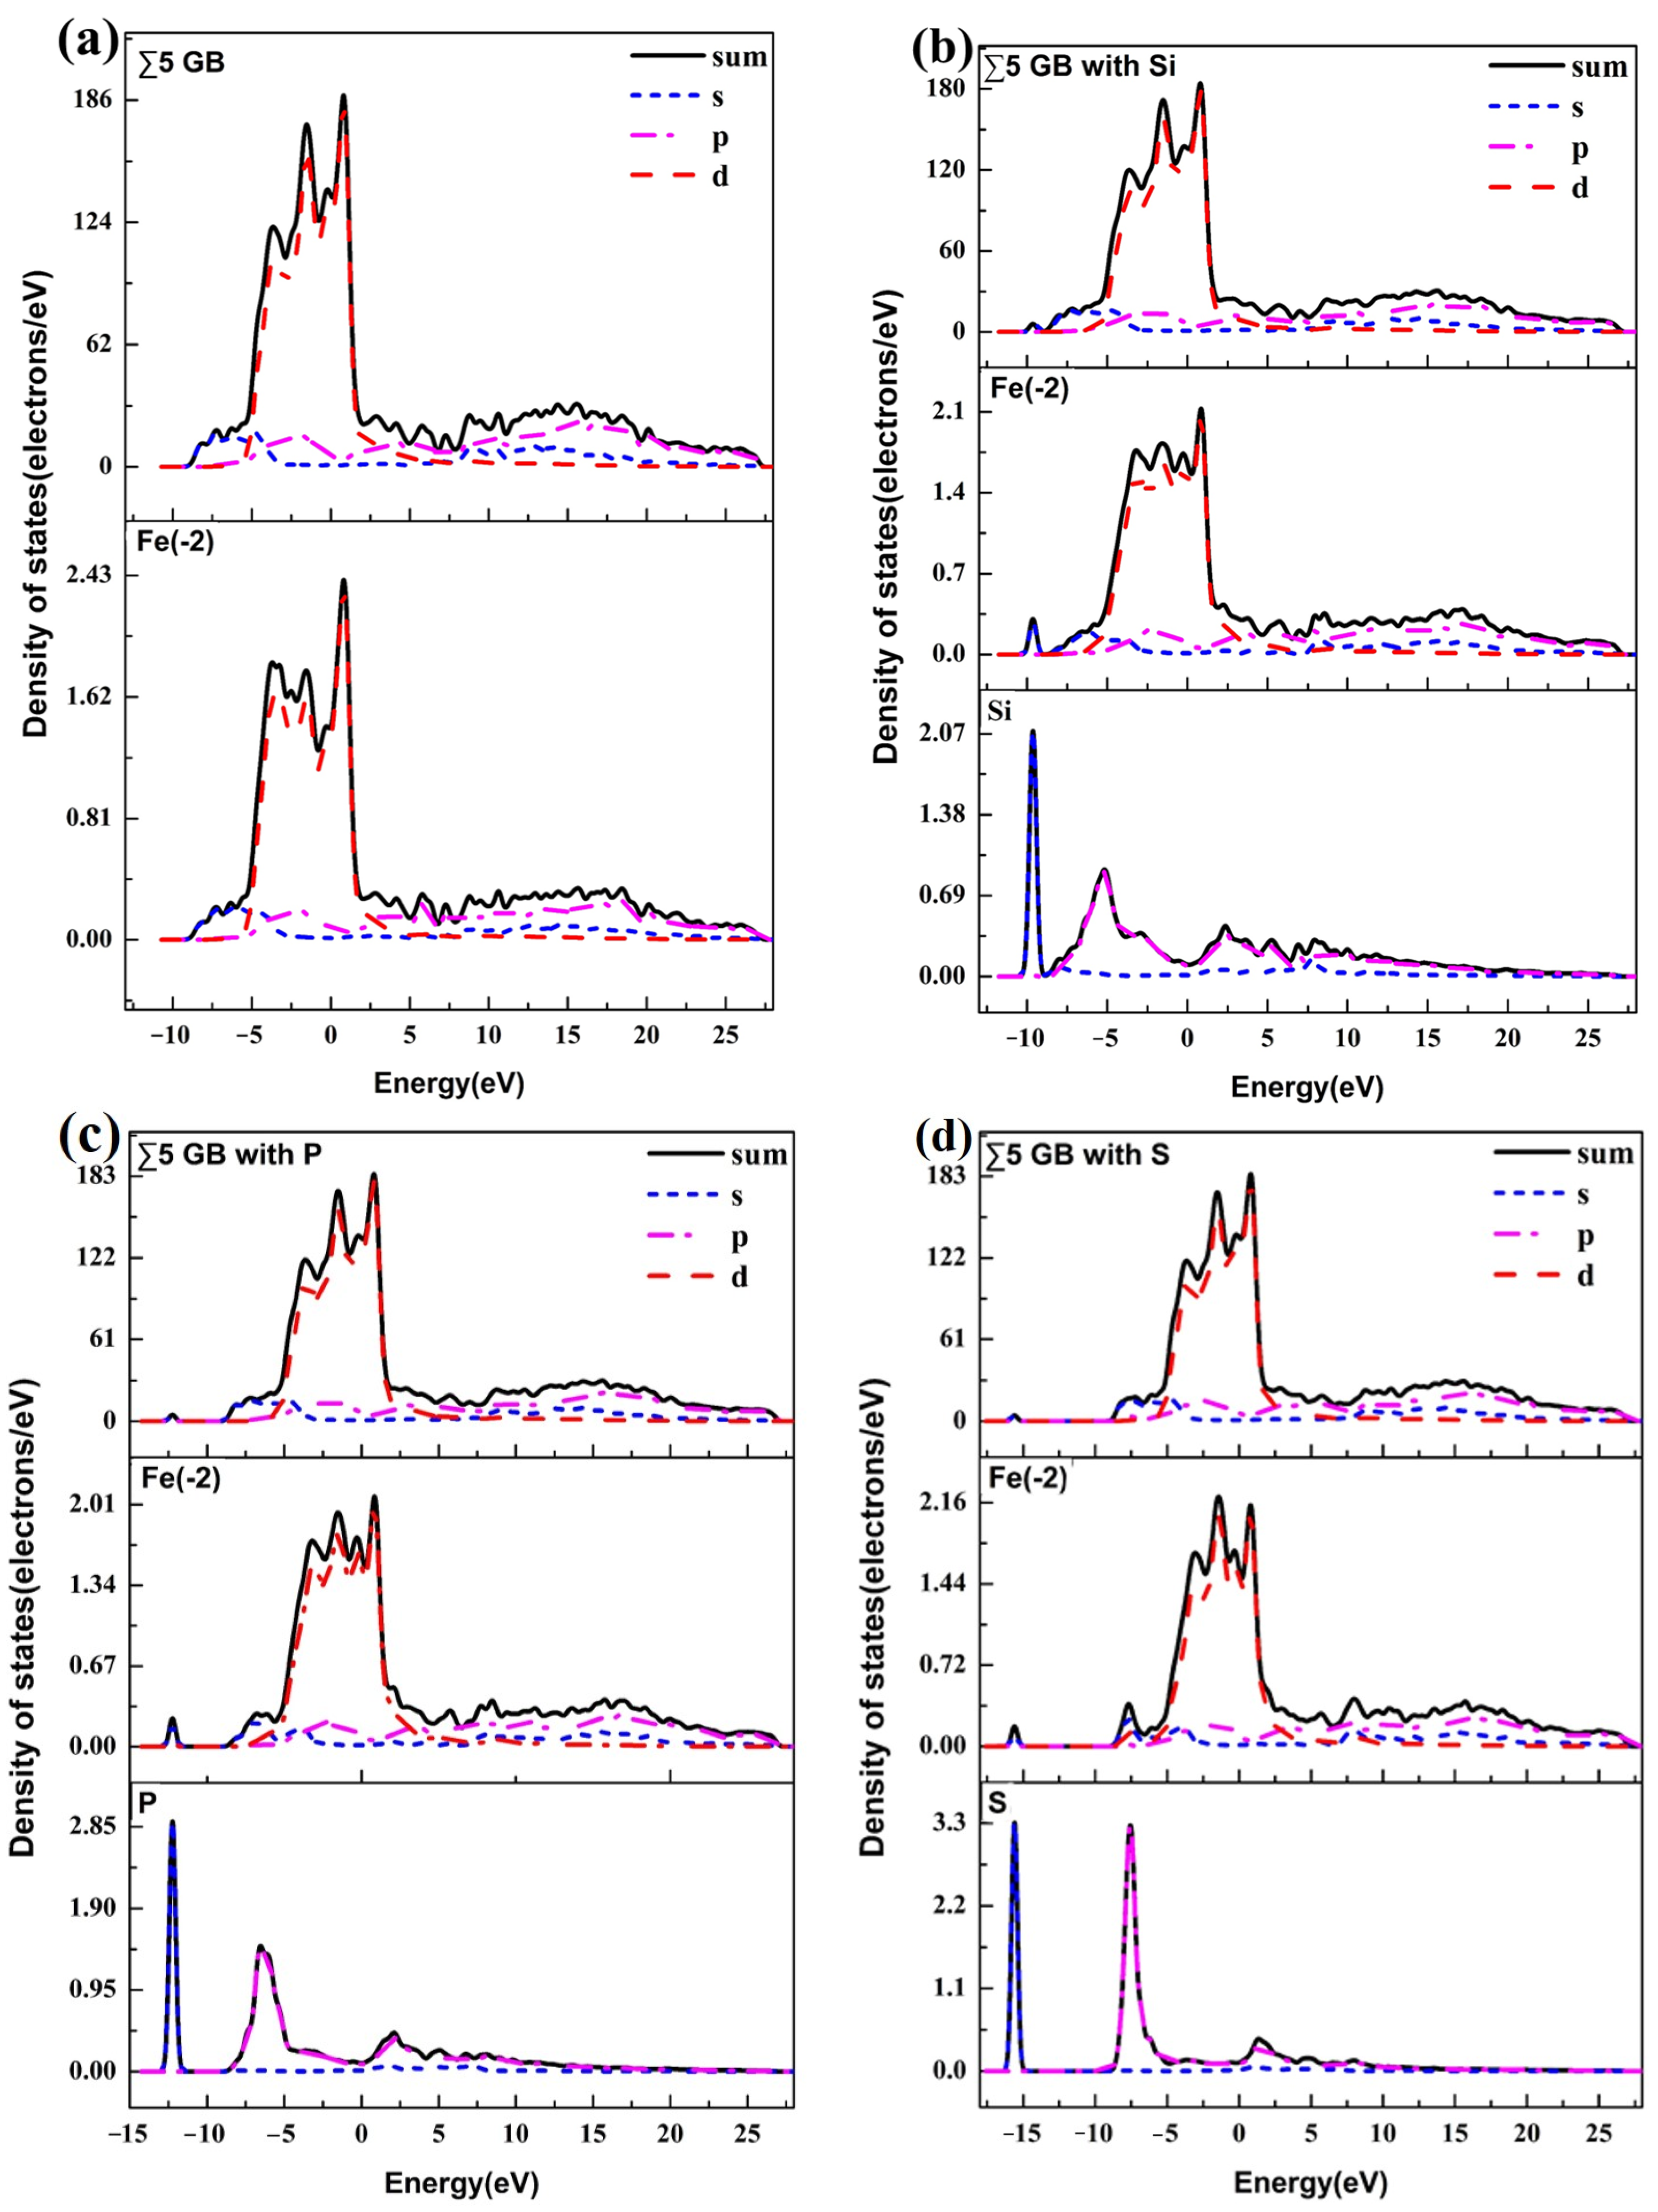
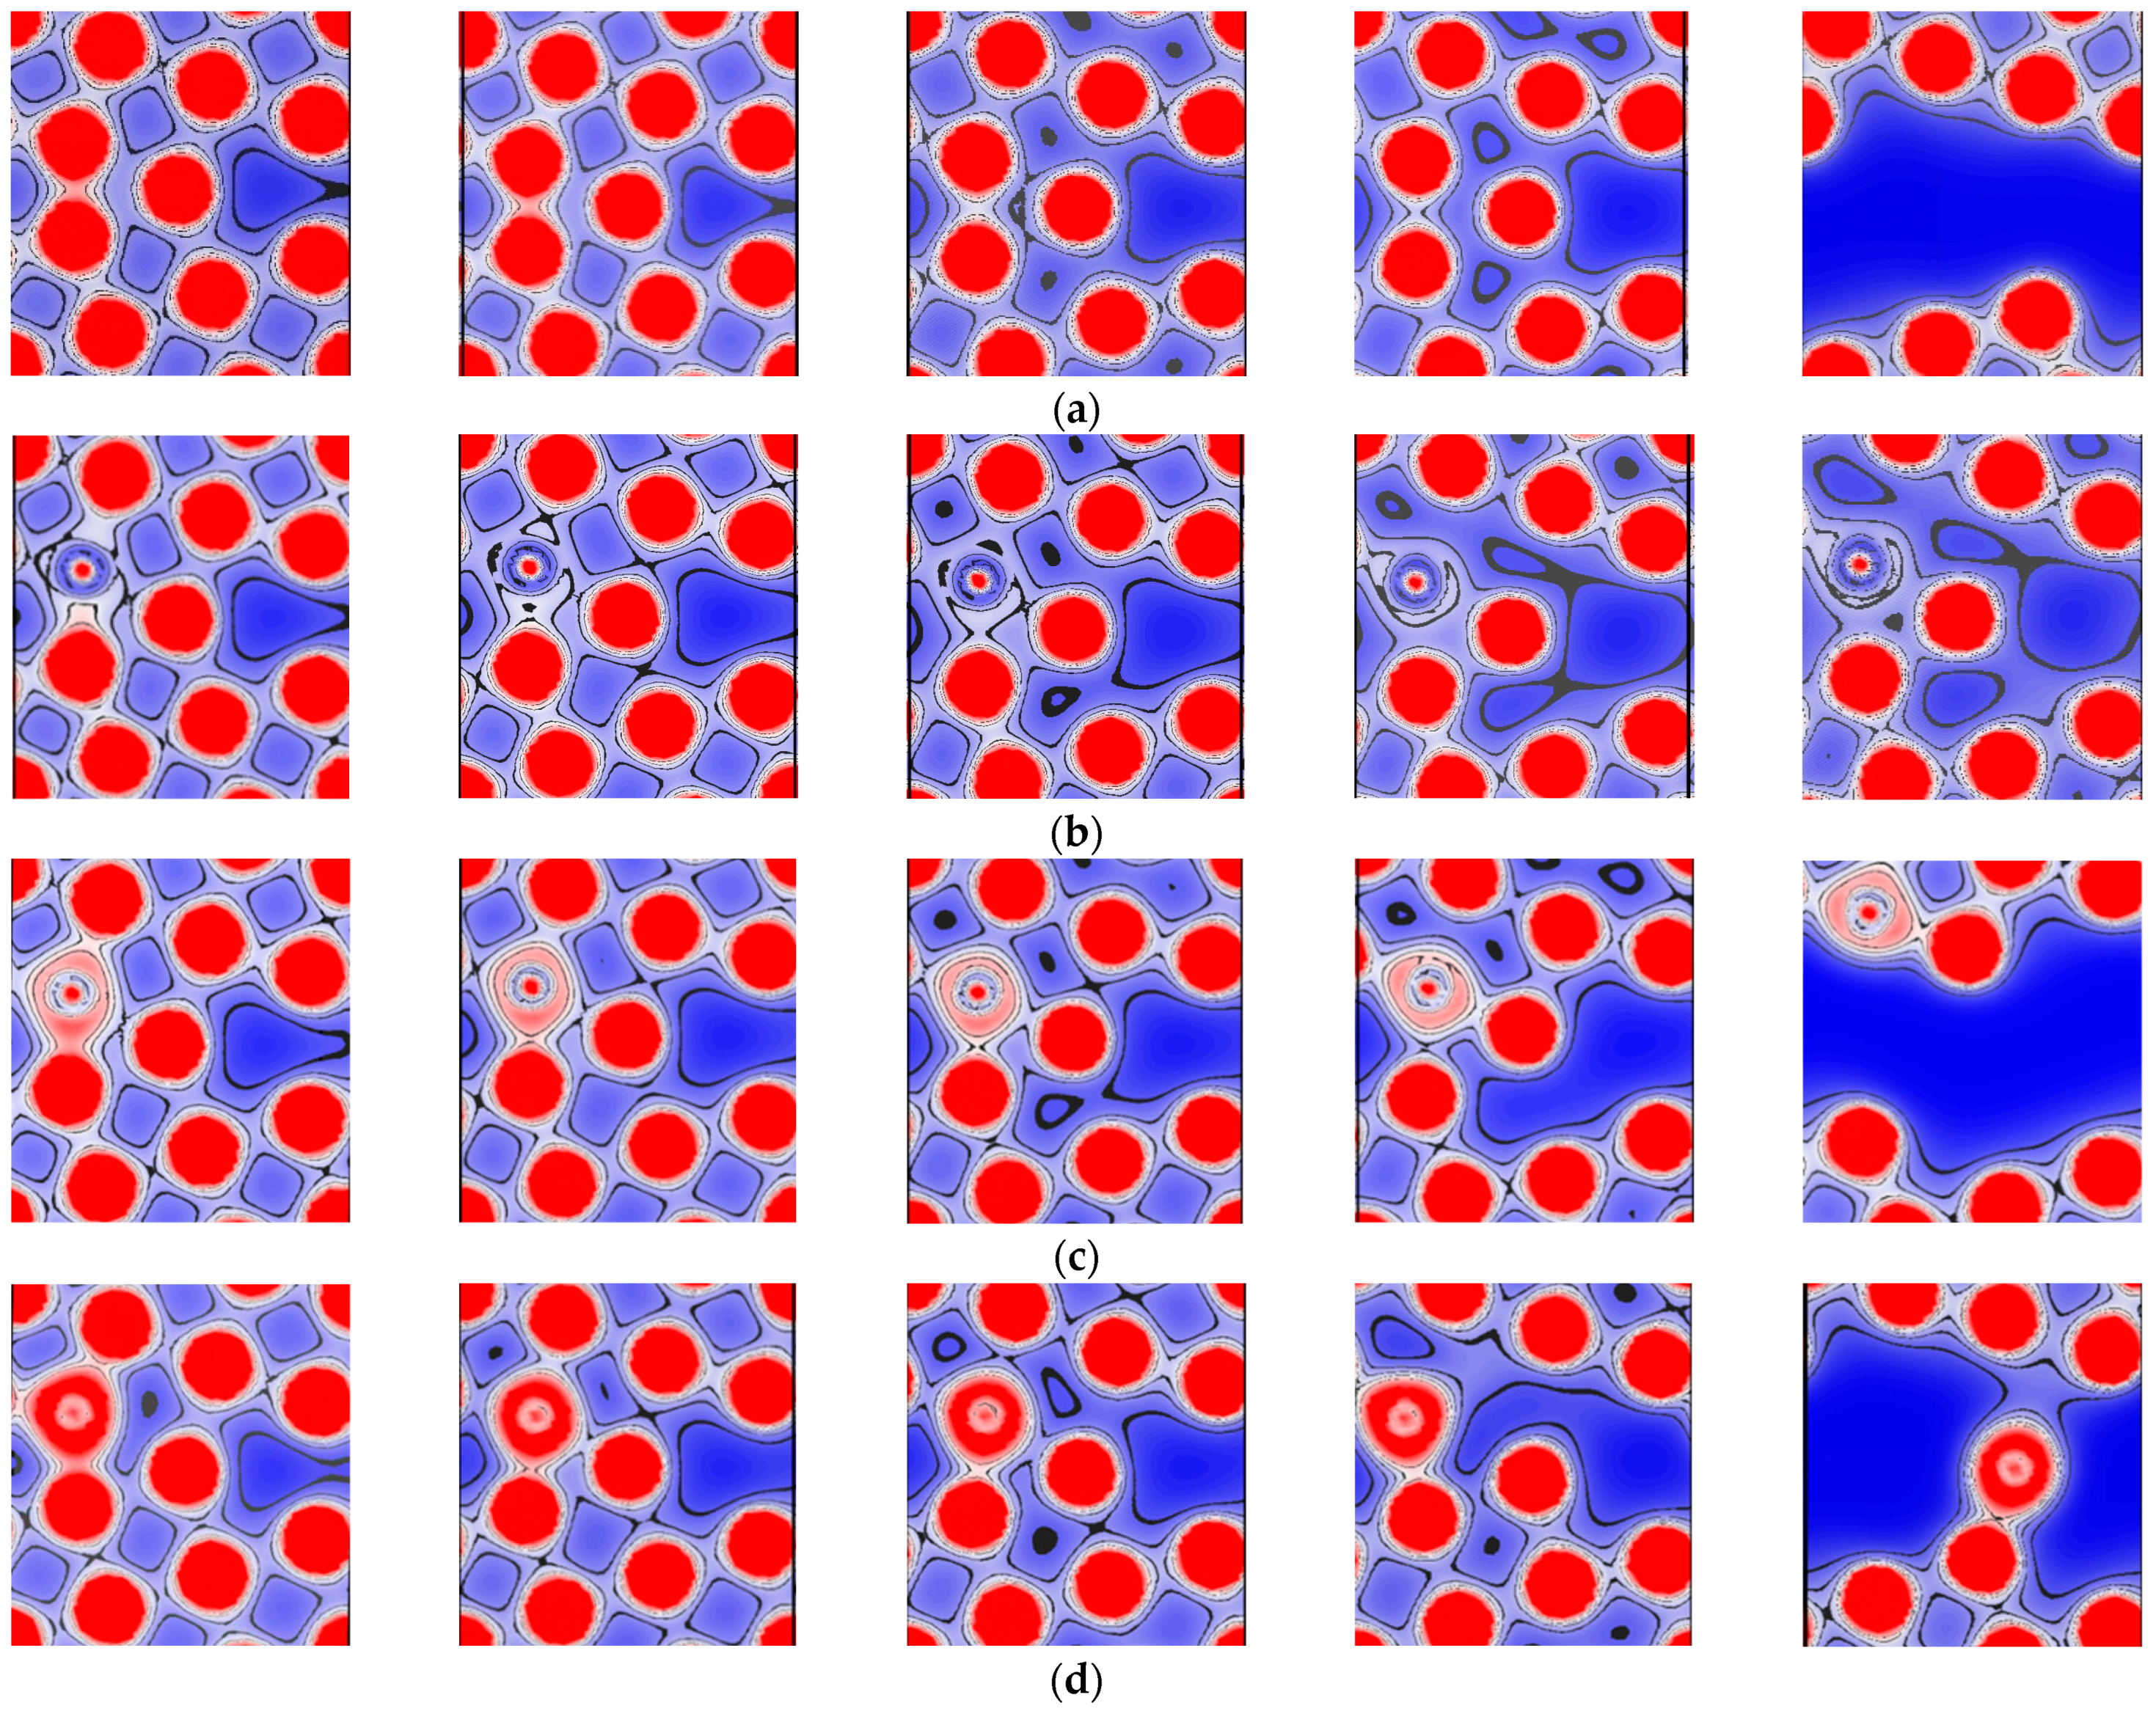
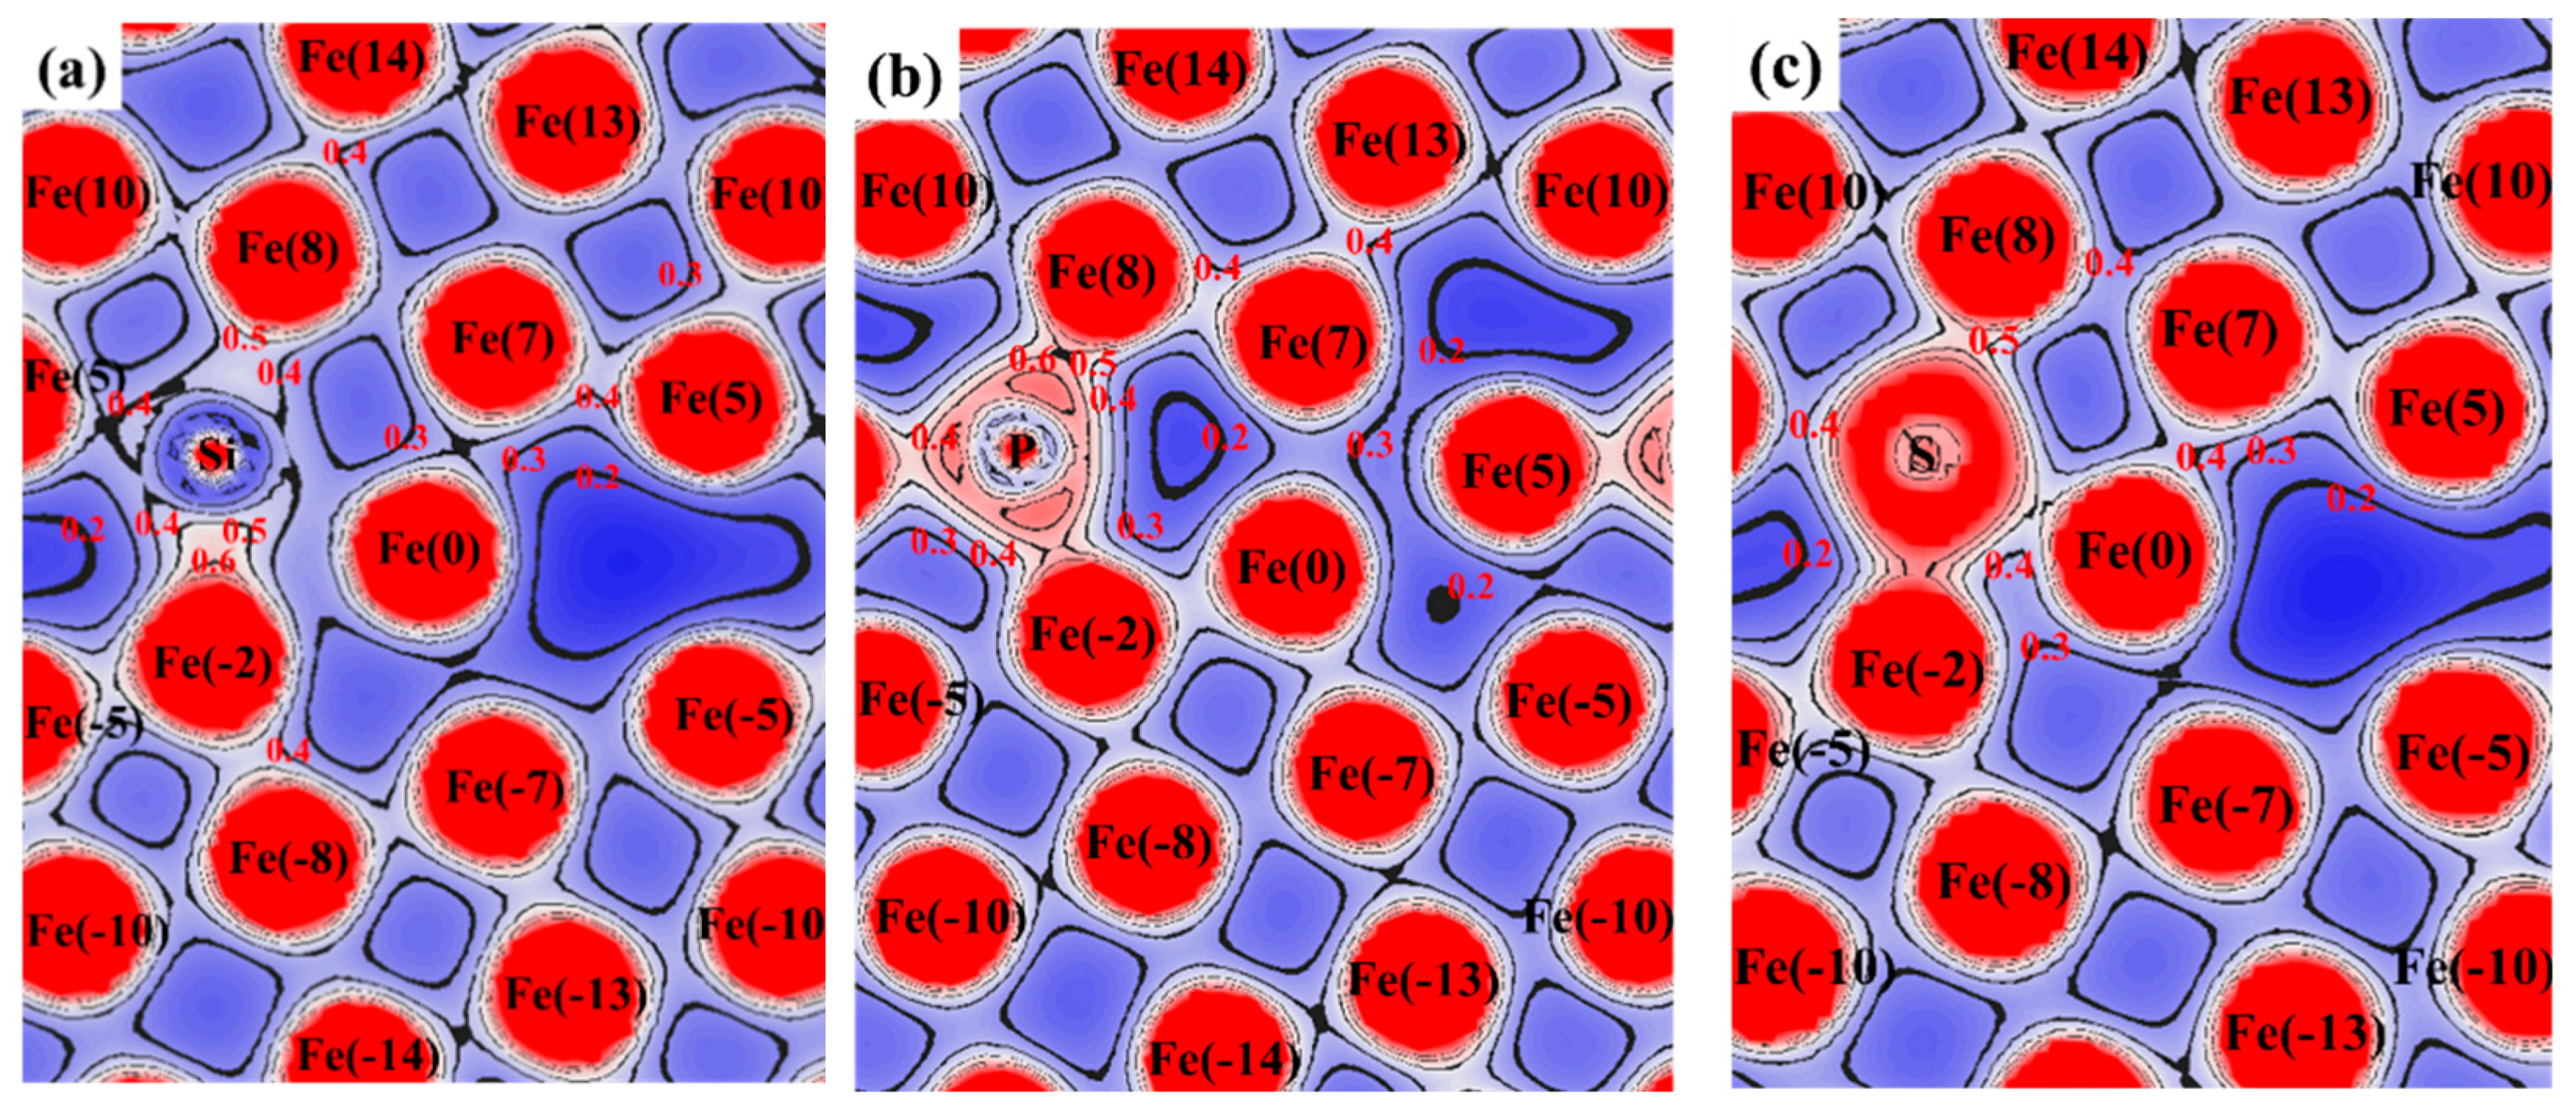
3.3. Atomic Configuration and Electron Distribution

The atomic configuration and electron distribution are the main factors that determine the effects of impurity atoms on the GB of steel, which can be analyzed by bond lengths and charge density. Figure 3 shows the atomic arrangement of pure GB and other GBs containing different solute atoms, and the bond lengths were determined for comparison. Clearly, there is a mirror symmetry that appeared in the pure GB, as depicted in Figure 3a. However, the mirror symmetry was destroyed by introducing solute atoms of Si, P, and S, which are displayed in Figure 3b–d. Along the GB, the short bonds of Fe(2)–Fe(-2) and Fe(3)–Fe(-3) are the main contributors to the GB strength, so it is important to investigate their change. When solute atoms segregate at Fe(2) for substitution, the related bond lengths become longer. The values of Fe(2)–Fe(-2), Si–Fe(-2), P–Fe(-2) and S–Fe(-2) are 2.096 Å, 2.199 Å, 2.147 Å, and 2.111 Å, respectively. The larger the atomic number, the shorter the bond length of x–Fe(-2). Compared with pure GB, the bond lengths of Fe(3)–Fe(-3) in the cases of Si and P become shorter, which have the same value of 2.083 Å. However, it becomes longer in the case of S. The main reason is that S has a greater ability to attract electrons with a larger electronegativity, which results in Fe(3)–Fe(-3) weakening. Meanwhile, the bond lengths of Fe(4)–Fe(0), Fe(4)–Fe(8), and Fe(5)–Fe(9) also have an obvious change due to the effects of solute atoms. From the atomic configuration, it can be seen that the segregation of S does indeed impair the GB bond of Fe(2)–Fe(-2) and Fe(3)–Fe(-3), demonstrating that S has a negative effect on the GB cohesion. Nevertheless, it is difficult to determine the effects of Si and P on the GB from the bond change.
As is well known, the valance charge density can well represent the interatomic bonding, which would greatly affect the mechanical properties. Therefore, the charge density was used to explore the effects of solute atoms on electron distribution, as depicted in Figure 4. For all cases with solute atoms, the areas of low charge density, below 0.2 e/a.u.3, are larger than the pure GB, which has a disadvantage in the GB cohesion. Strong bonds of Fe(2)–Fe(-2), Si–Fe(-2), P–Fe(-2), and S–Fe(-2) are formed, which are consistent with the analysis of bond lengths. In the case of Si and P, the bonds of Fe(8)–Fe(14), Fe(5)–Fe(10) and Fe(-5)–Fe(-10) are strengthened, and are beyond 0.4 e/a.u.3. And the effect of Si is greater than P on these bonds due to Si having a smaller electronegativity. These bonds are perpendicular to the GB interface and may be beneficial in the GB cohesion. At the same time, the interactions of Fe(0)–Si and Fe(0)–P are stronger than the Fe(2)–Fe(0) of the pure GB, which may be another factor that contributes to the GB strengthening. However, there is little effect on Fe(8)–Fe(14), Fe(5)–Fe(10), and Fe(-5)–Fe(-10) in the case of S. The main reason is that S has a strong ability to attract electrons with a large electronegativity, and the influence of S has a strong directionality. Meanwhile, the charge density between Fe(-2)–Fe(-5) and Fe(-2)–Fe(-8) appears to decrease owing to the strong bonding of S–Fe(-2). These are unfavorable for GB cohesion. Overall, the results of charge density are consistent with the change in bond lengths.
The maps of electron density differences provide information on charge accumulation and charge depletion in cases, which can be used to analyze atomic interactions. Figure 5 shows the planar projection of the electron density difference for the (001) plane in the pure GB and other GBs with solute atoms. The red area means a charge depletion, while the blue area represents a charge accumulation. From Figure 5, it can be seen that there exists a large area with charge accumulation at the GB for all cases, which is responsible for the GB cohesion. Obviously, the charge accumulation area beyond 0.04 e/a.u.3 for Si at the GB is larger than the pure GB. Meanwhile, the addition of impurity atoms increases the area of charge depletion around the S2 site, and the larger the atomic number, the larger the charge depletion areas appear, which is harmful for the GB cohesion. In addition, the localization and directivity of electron density differences are more and more obvious with the increase of atomic number, which is closely related to electronegativity. This is unfavorable for GB cohesion.
The DOS can be used to analyze the characteristics of the chemical bond, which is significant for GB binding, as shown in Figure 6. All cases show metallic characteristics with non-zero DOS at Fermi energy levels. Obviously, Fe-3d electrons are the primary contributors to the total DOS. The total DOS curves of different systems are essentially similar, indicating it is difficult to confirm the effects of impurities. Thereby, the partial density of states (PDOS) for Fe(-2) and impurity elements were investigated. In the range from −10 eV to 0 eV, the hybridization of x-p and Fe-d appear. It is evident that the peaks of p orbital electron density of the impurity element shift toward lower energy positions and become narrower with the increase in atomic number, which results in electron localization and weakening of GB binding. The primary reason for this is the increasing electronegativity of the solute elements that promotes the formation of ionic bonds.

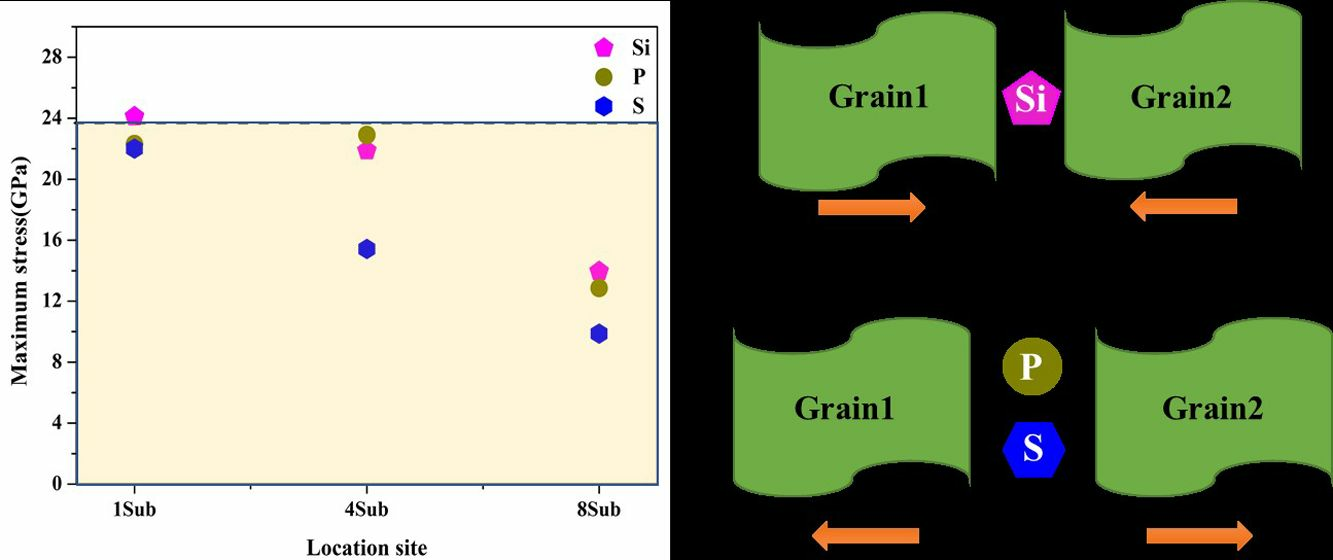
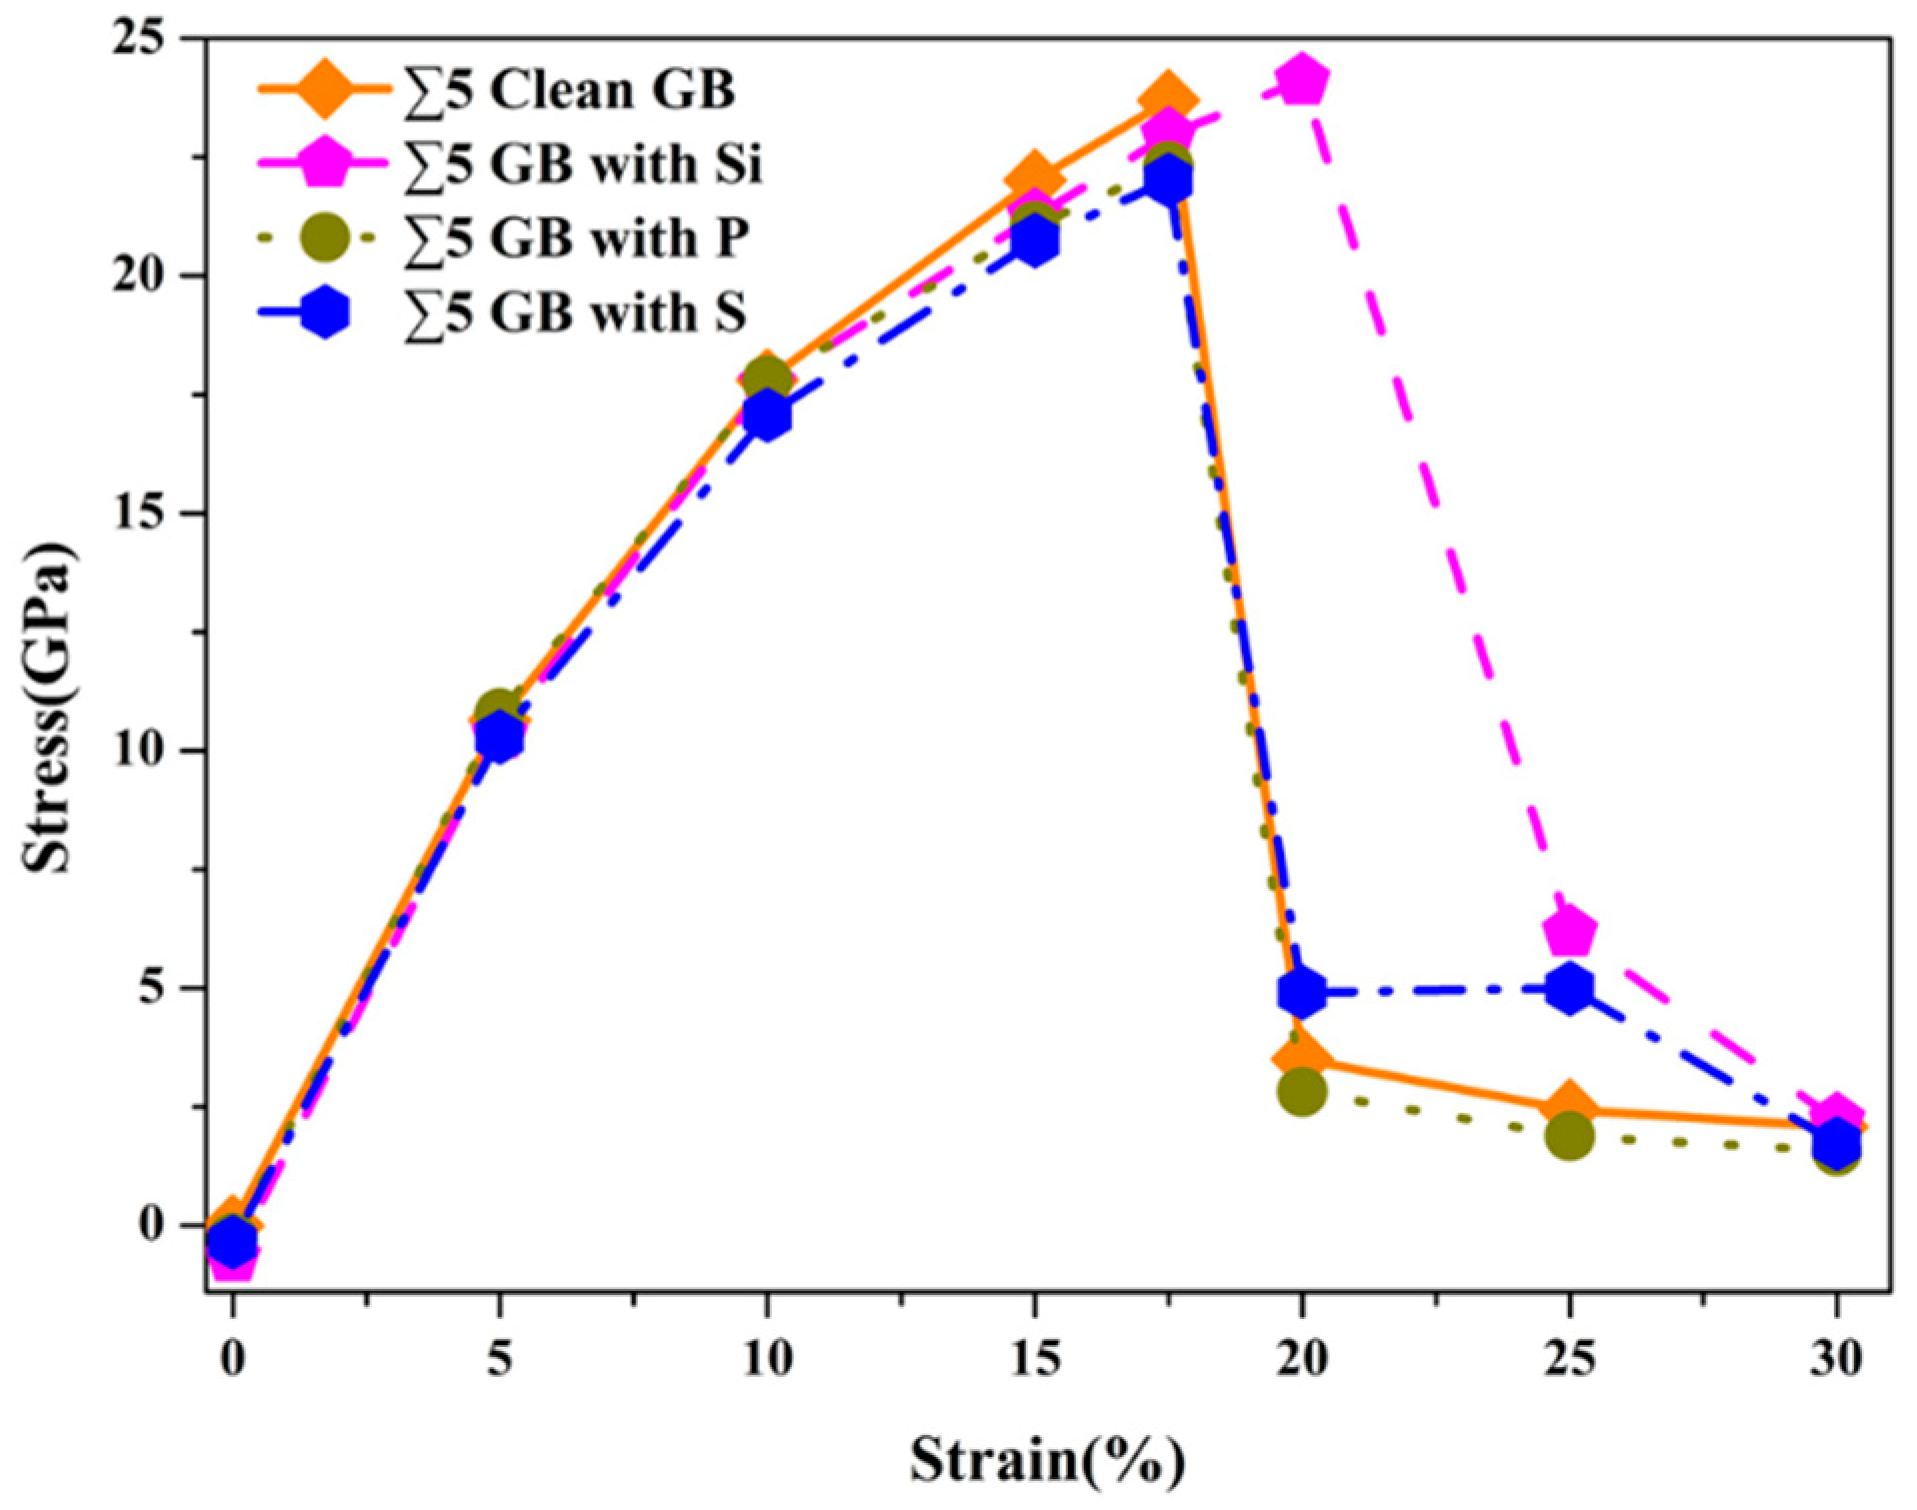
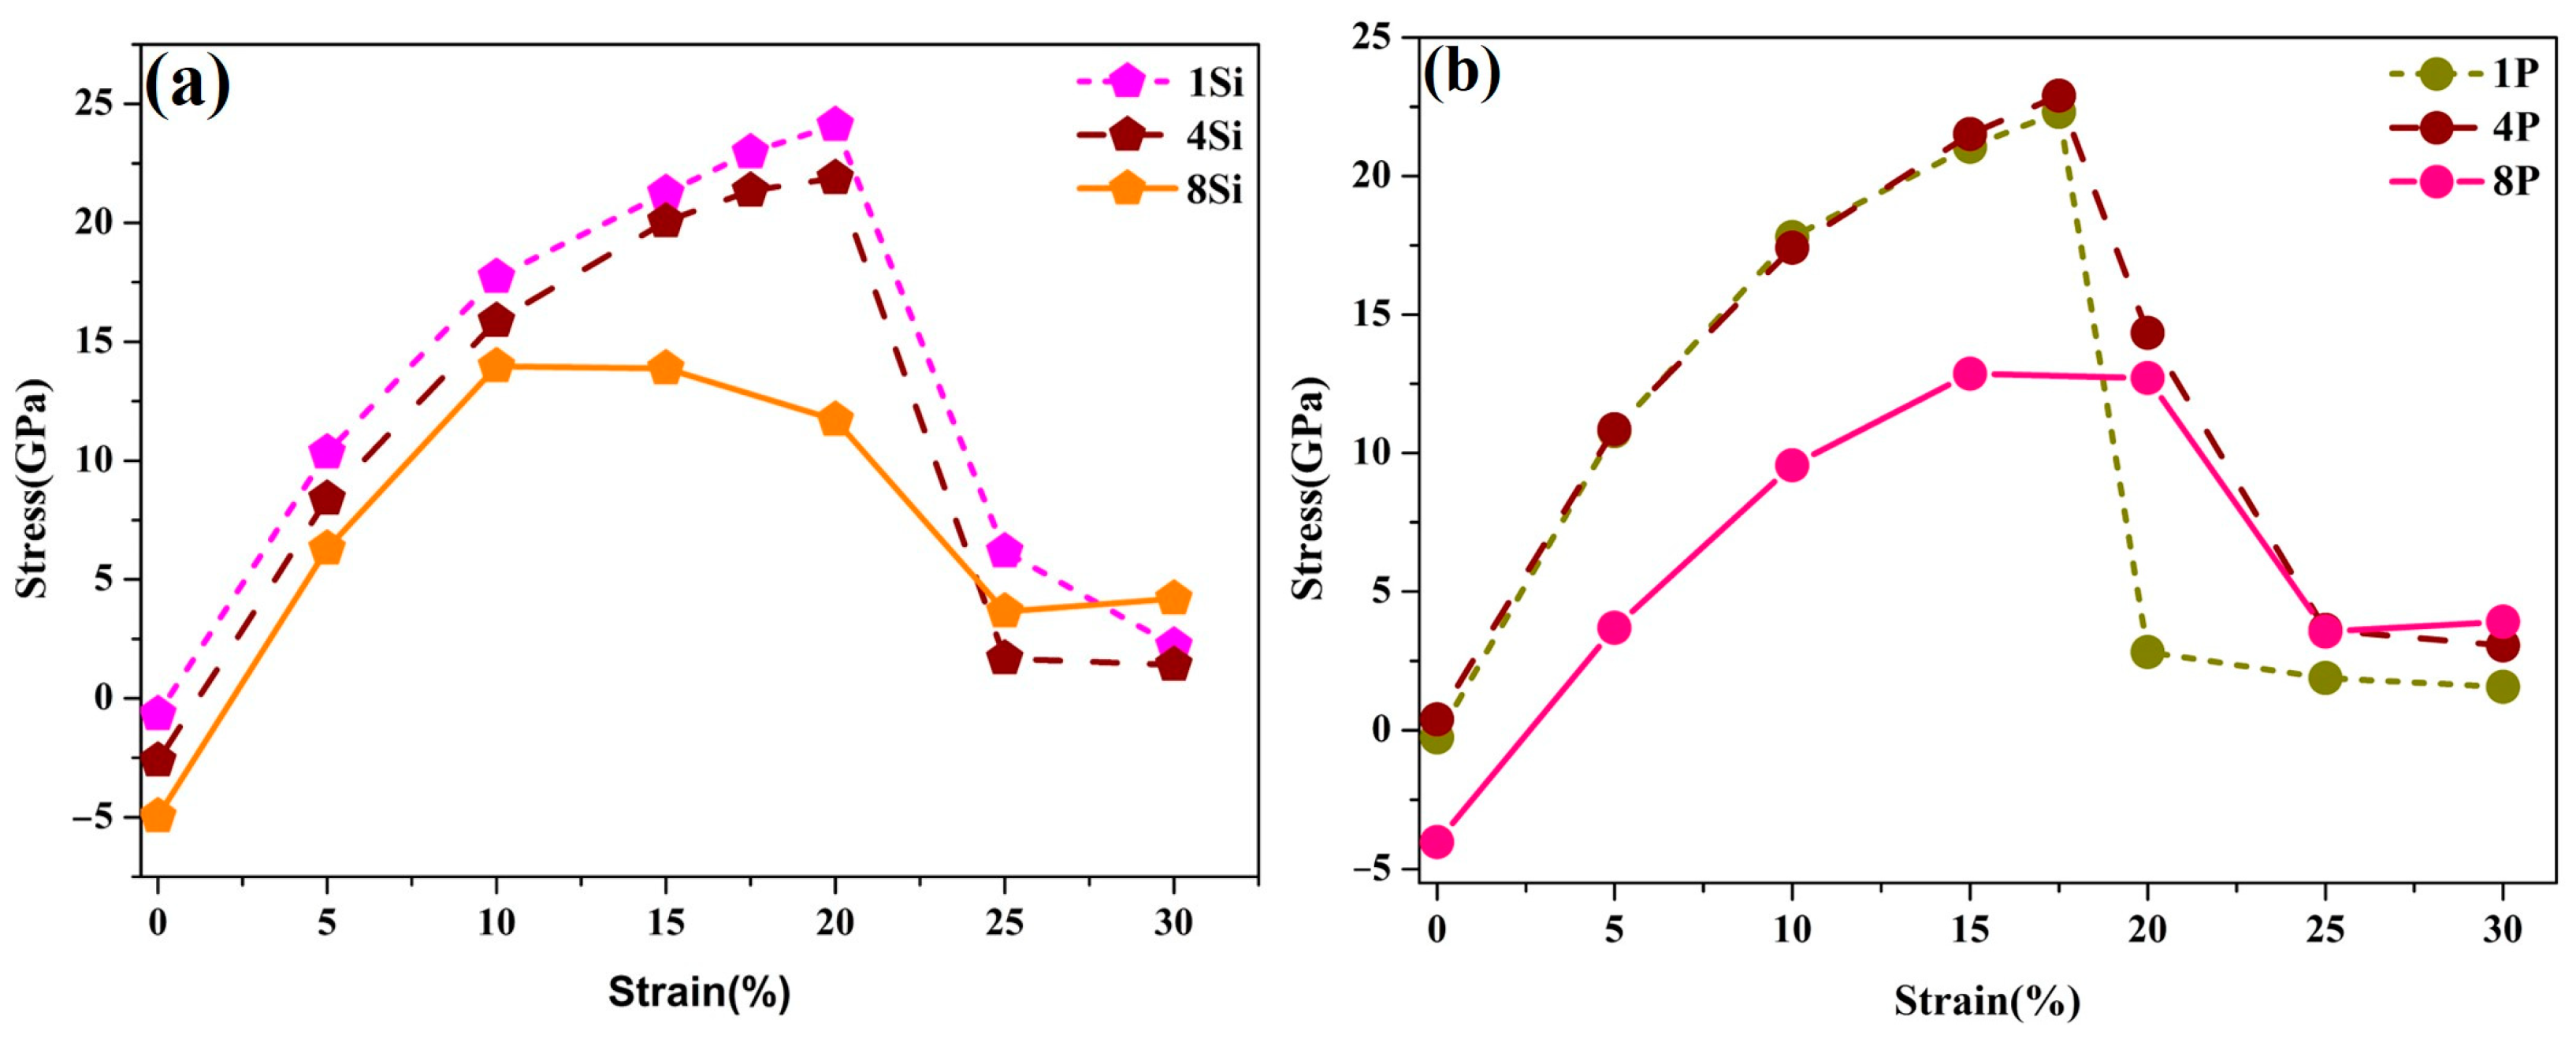
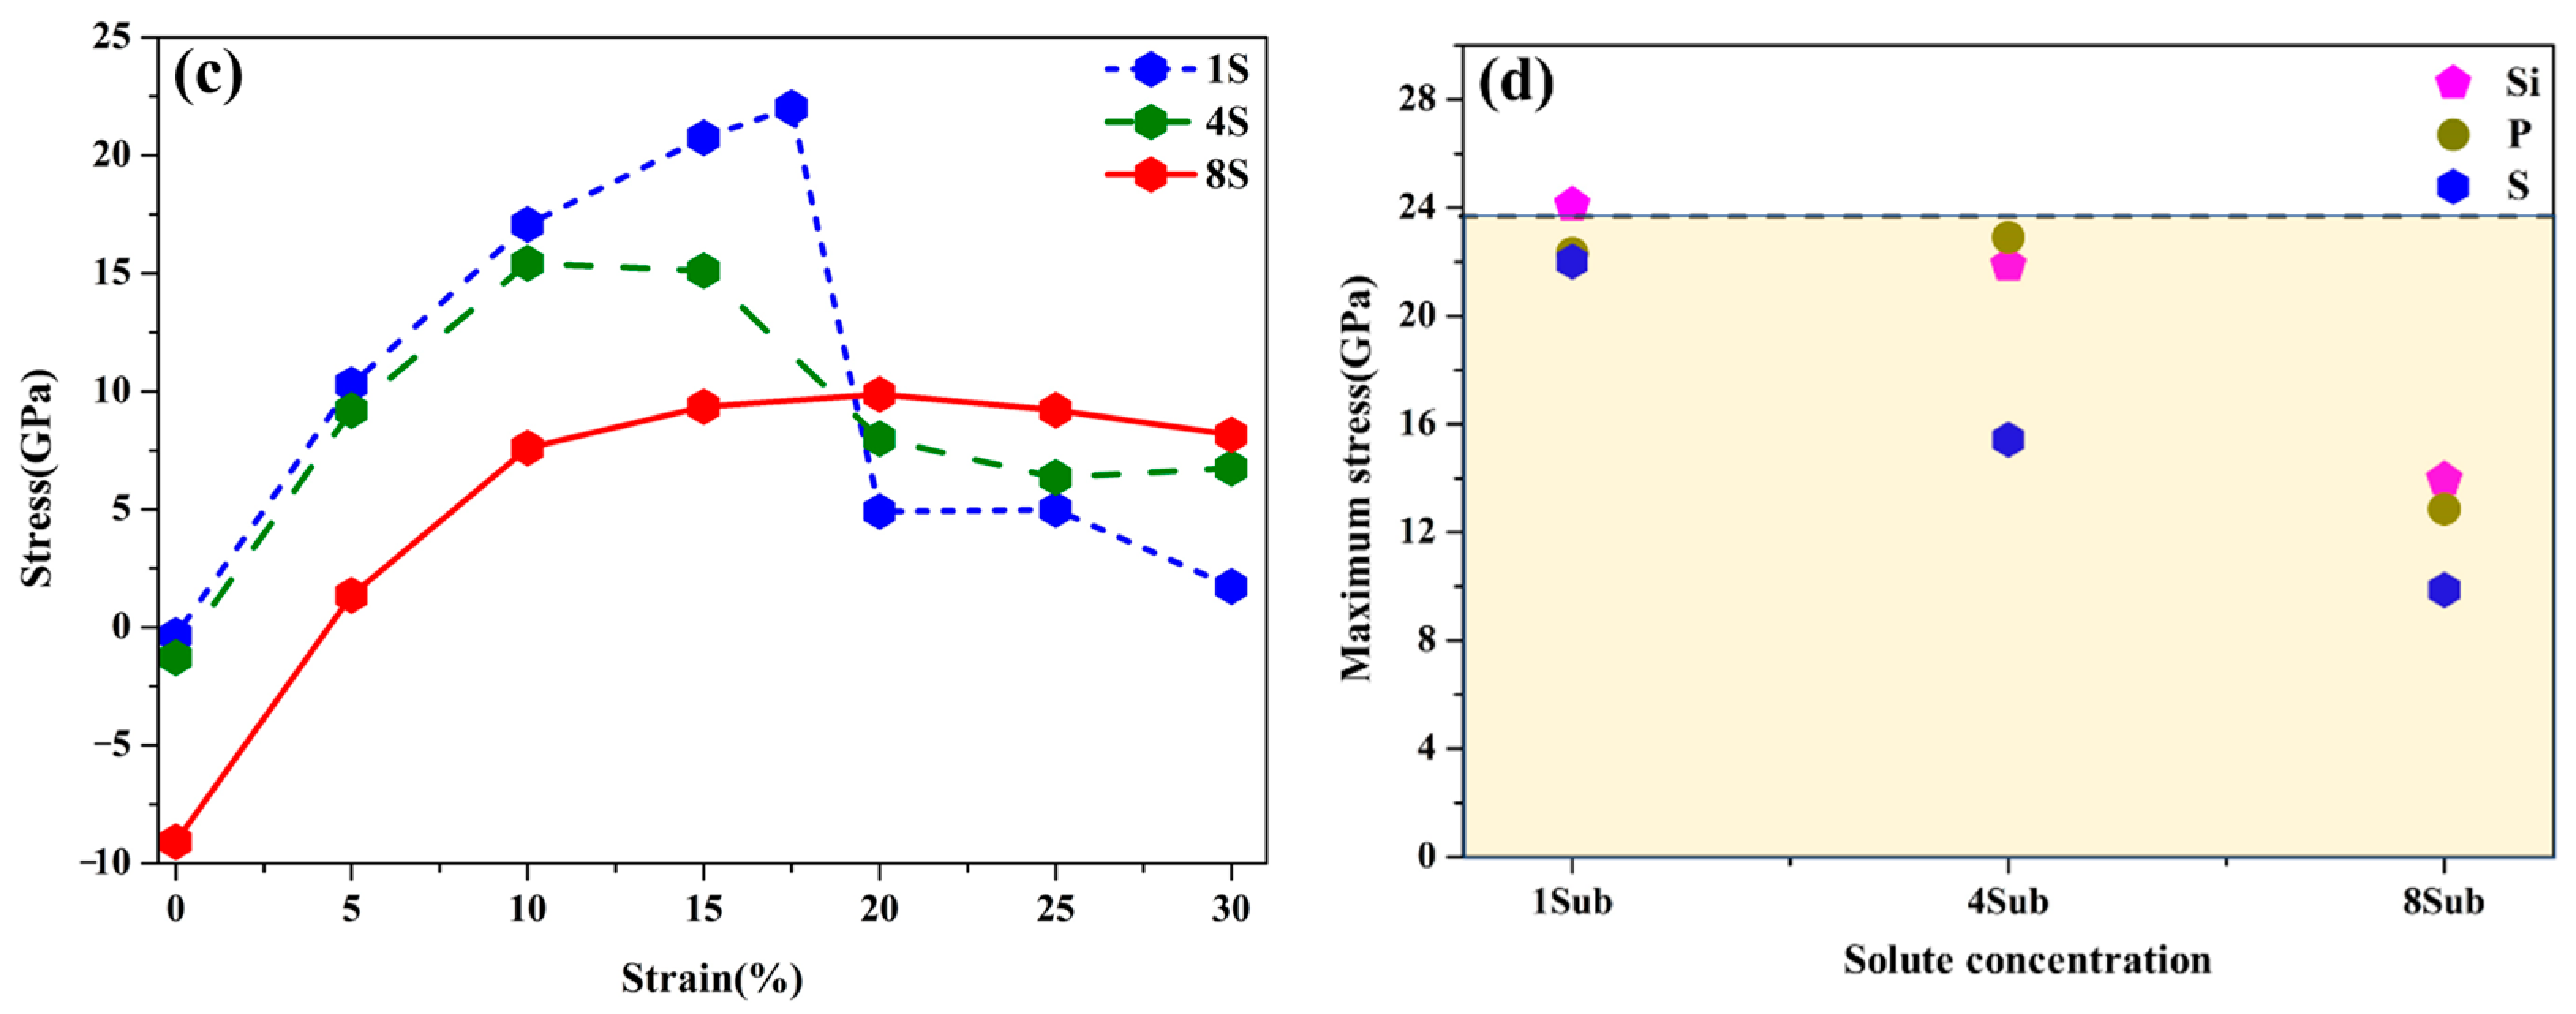
3.4. Strengthening Energies and Tensile Tests

To elucidate the strengthening/embrittling effect of Si, P, and S on GBs, the strengthening energies based on the Rice–Wang model were calculated with values of 0.80 eV, 0.95 eV, and 1.55 eV, respectively. This implies that the impurity elements all decrease the GB cohesion and result in an embrittling effect on the GB, which is in good agreement with previous literature [11,18,27,28,29]. During the process of calculation, a pre-crack was introduced in the fracture plane, which is critical to determine the effect of the impurity atom. For most cases, the GB interfaces are selected as separated planes where solute atoms segregate. This makes the results reasonable when using the Rice–Wang theory. But it is not suitable for other cases in which the fracture plane is not at the GB interface. Therefore, other methods should be used to validate the results.
To further confirm the results of strengthening energies, the first principles computational tensile test (FPCTT) was performed to explore the effects of Si, P, and S on the GB. During tensile tests, the atoms were fully relaxed except for both edges, while the dimensions were fixed. The stress–strain curves of pure GB and impurity atom doped GBs are depicted in Figure 7. For all cases, the tensile stress increases first with tensile strain increasing, which is consistent with Hooke’s law. Following this, the tensile stress reaches the maximum value and then decreases rapidly. Eventually, the tensile stress lowers to a small value. The theoretical tensile strength and the fracture elongation of the pure GB are 23.69 GPa and 20%. When Si segregates at the GB it could increase the tensile strength to 24.11 GPa, which has a strengthening effect on the GB. The tensile strengths in the case of P and S are 22.31 GPa and 22.01 GPa. This indicates that both impurity atoms have embrittlement effects on the GB. It is obvious that the result in the Si-doped case is in conflict with the conclusion from the Rice–Wang theory. The main reason is that the pre-crack plane is not reasonable, which is different from the fracture plane of the tensile test. As shown in Figure 8, the fracture planes of Si-doped GB, P-doped GB and S-doped GB are different from the pure GB, and the relative positions of Si and S change greatly, which is difficult to take into consideration when using the Rice–Wang theory.
To gain deep insights into the influencing mechanism of impurity atoms, the charge density distributions with strain change were investigated, as presented in Figure 9. With the strain increasing, the area of low charge density increases. The symmetry of the pure GB was well-kept during the tensile test. A sign of fracture occurs at a strain of 10%, and is totally separated at 20%. When solute atoms were introduced into the GB model, the signs of fracture appeared at 5%. The reason for this is that the solute atoms break the symmetry of the models and easily lead to stress concentration. For the case of Si, the GB area of charge density beyond 0.2 e/a.u.3 still exists even at a strain of 20%, demonstrating that the Si indeed has a strengthening effect on the GB. A solute atom of P is also totally separated at the strain of 20%. However, the S atom has a weak interaction between the two grains. From the changes in charge density, it is noteworthy that the fracture planes are different with solute atoms, and the solute atom may move with increasing strain.

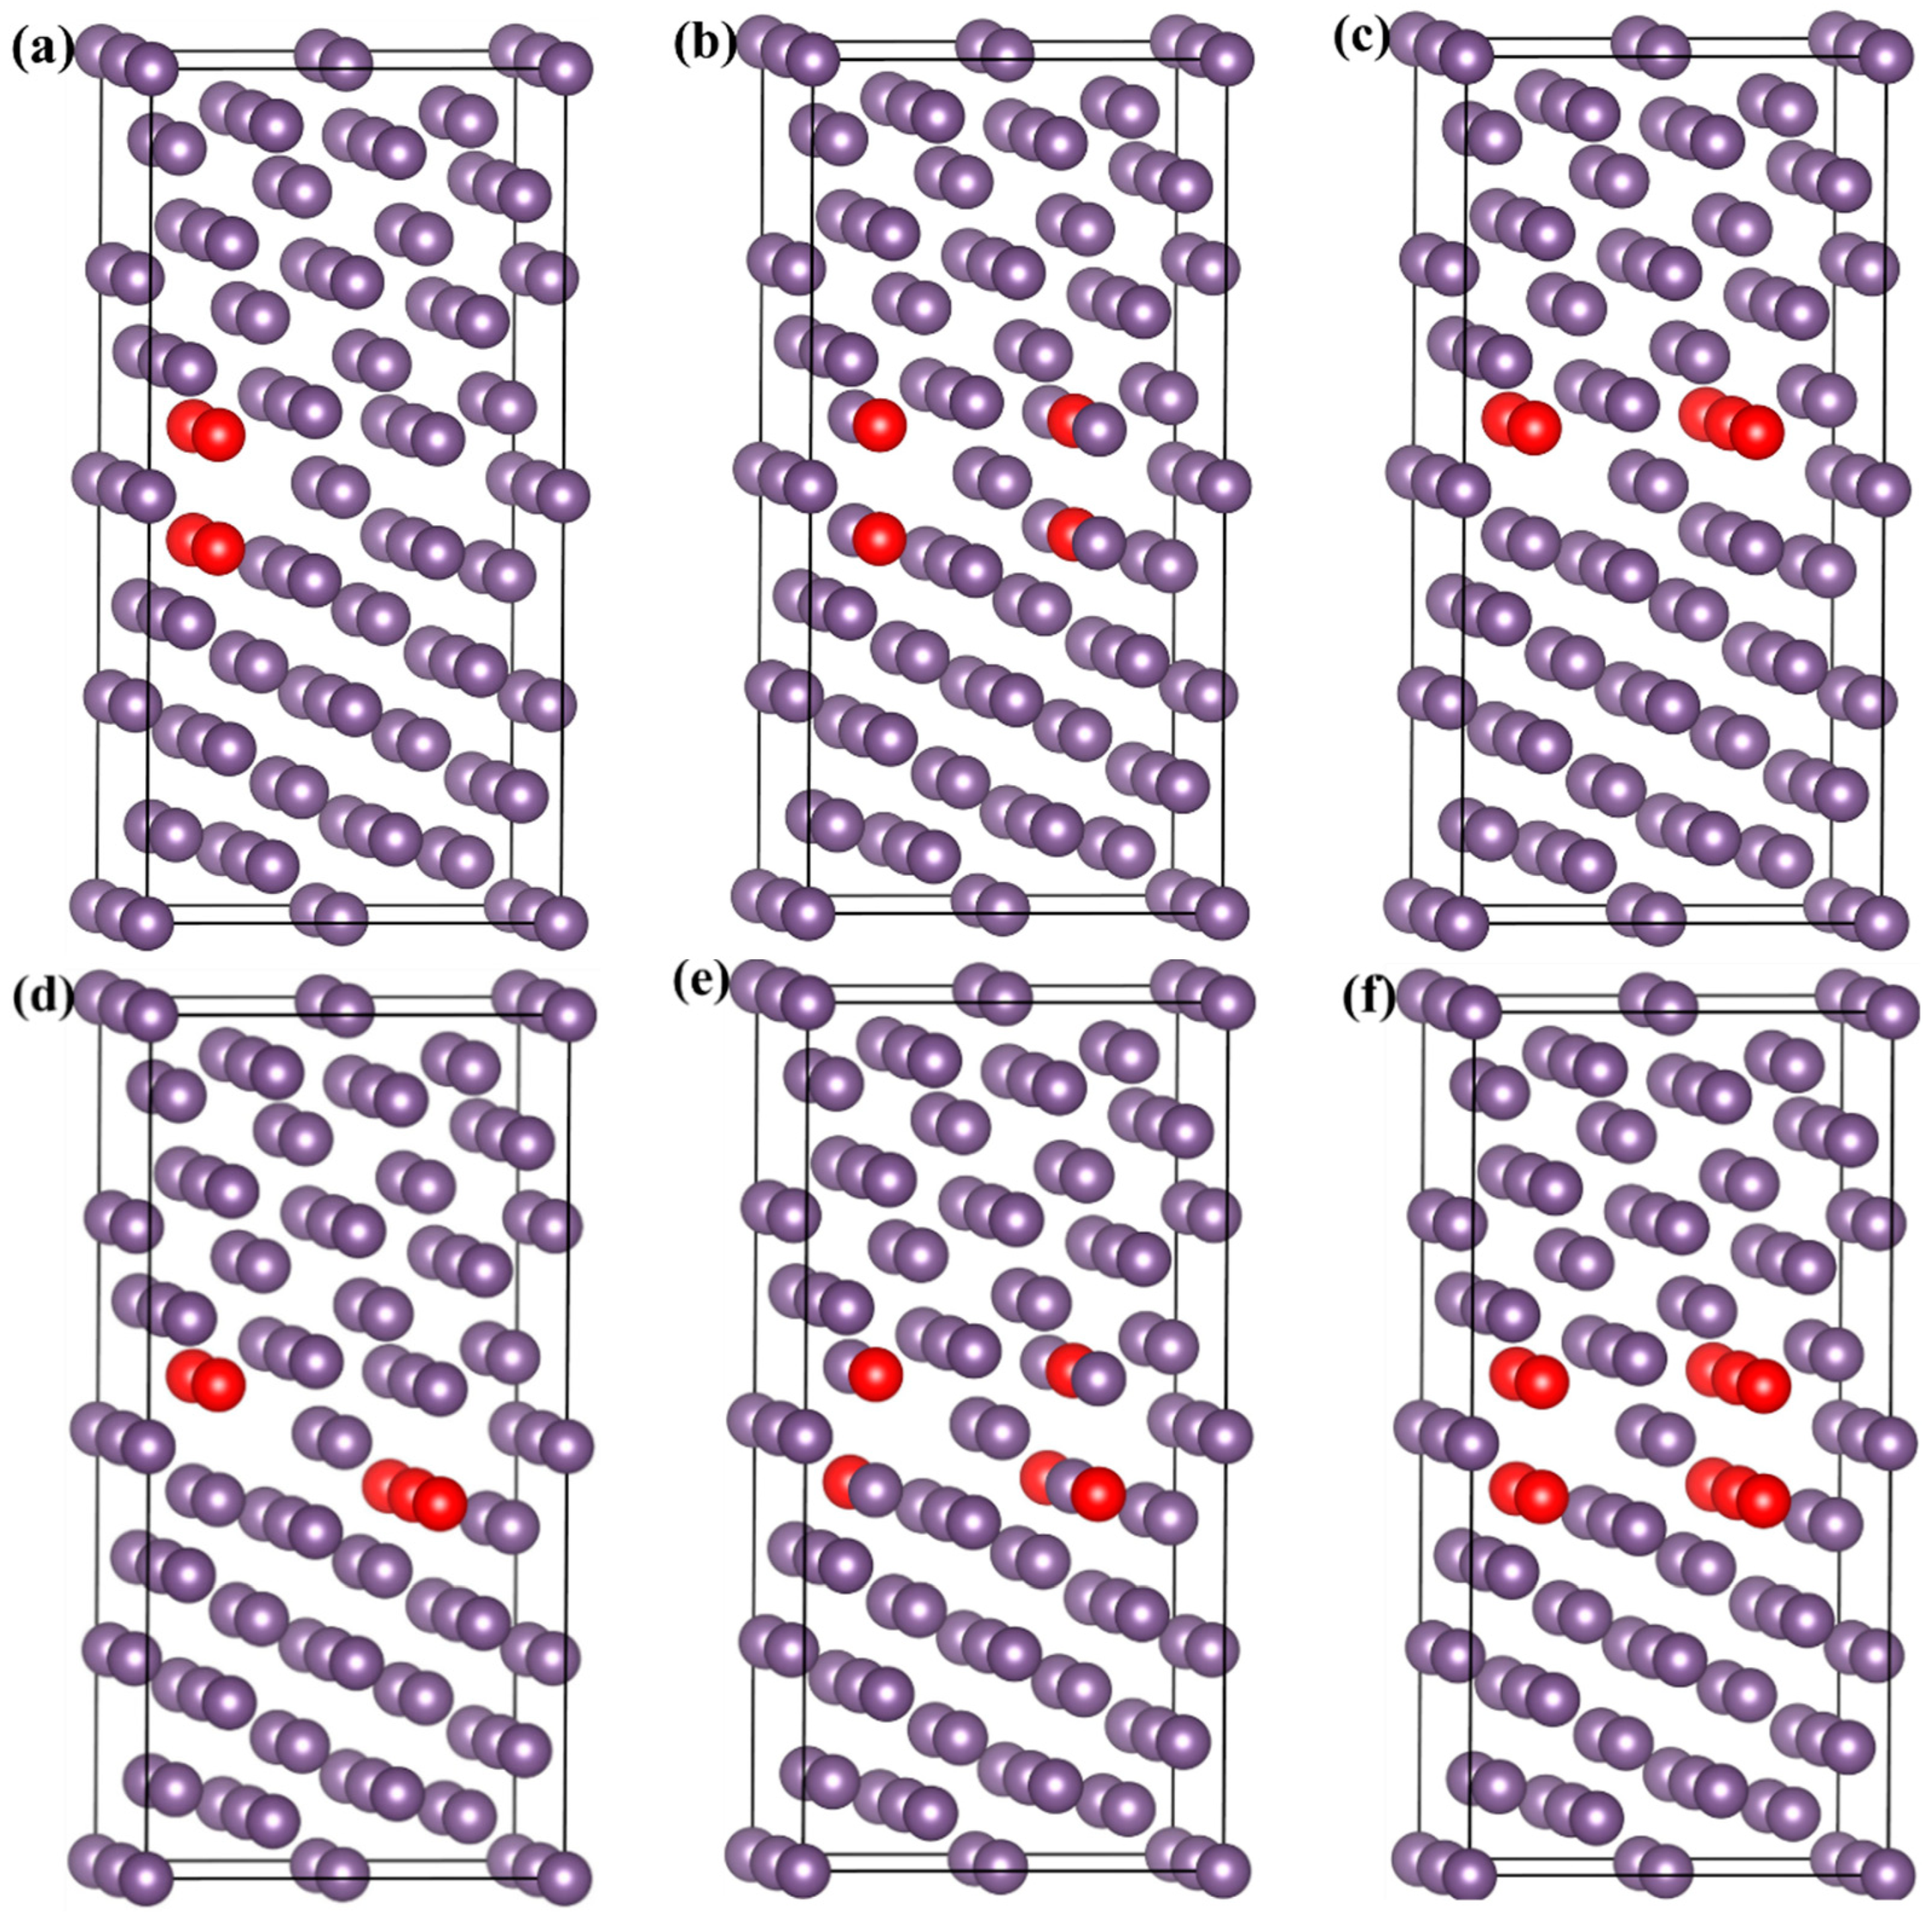
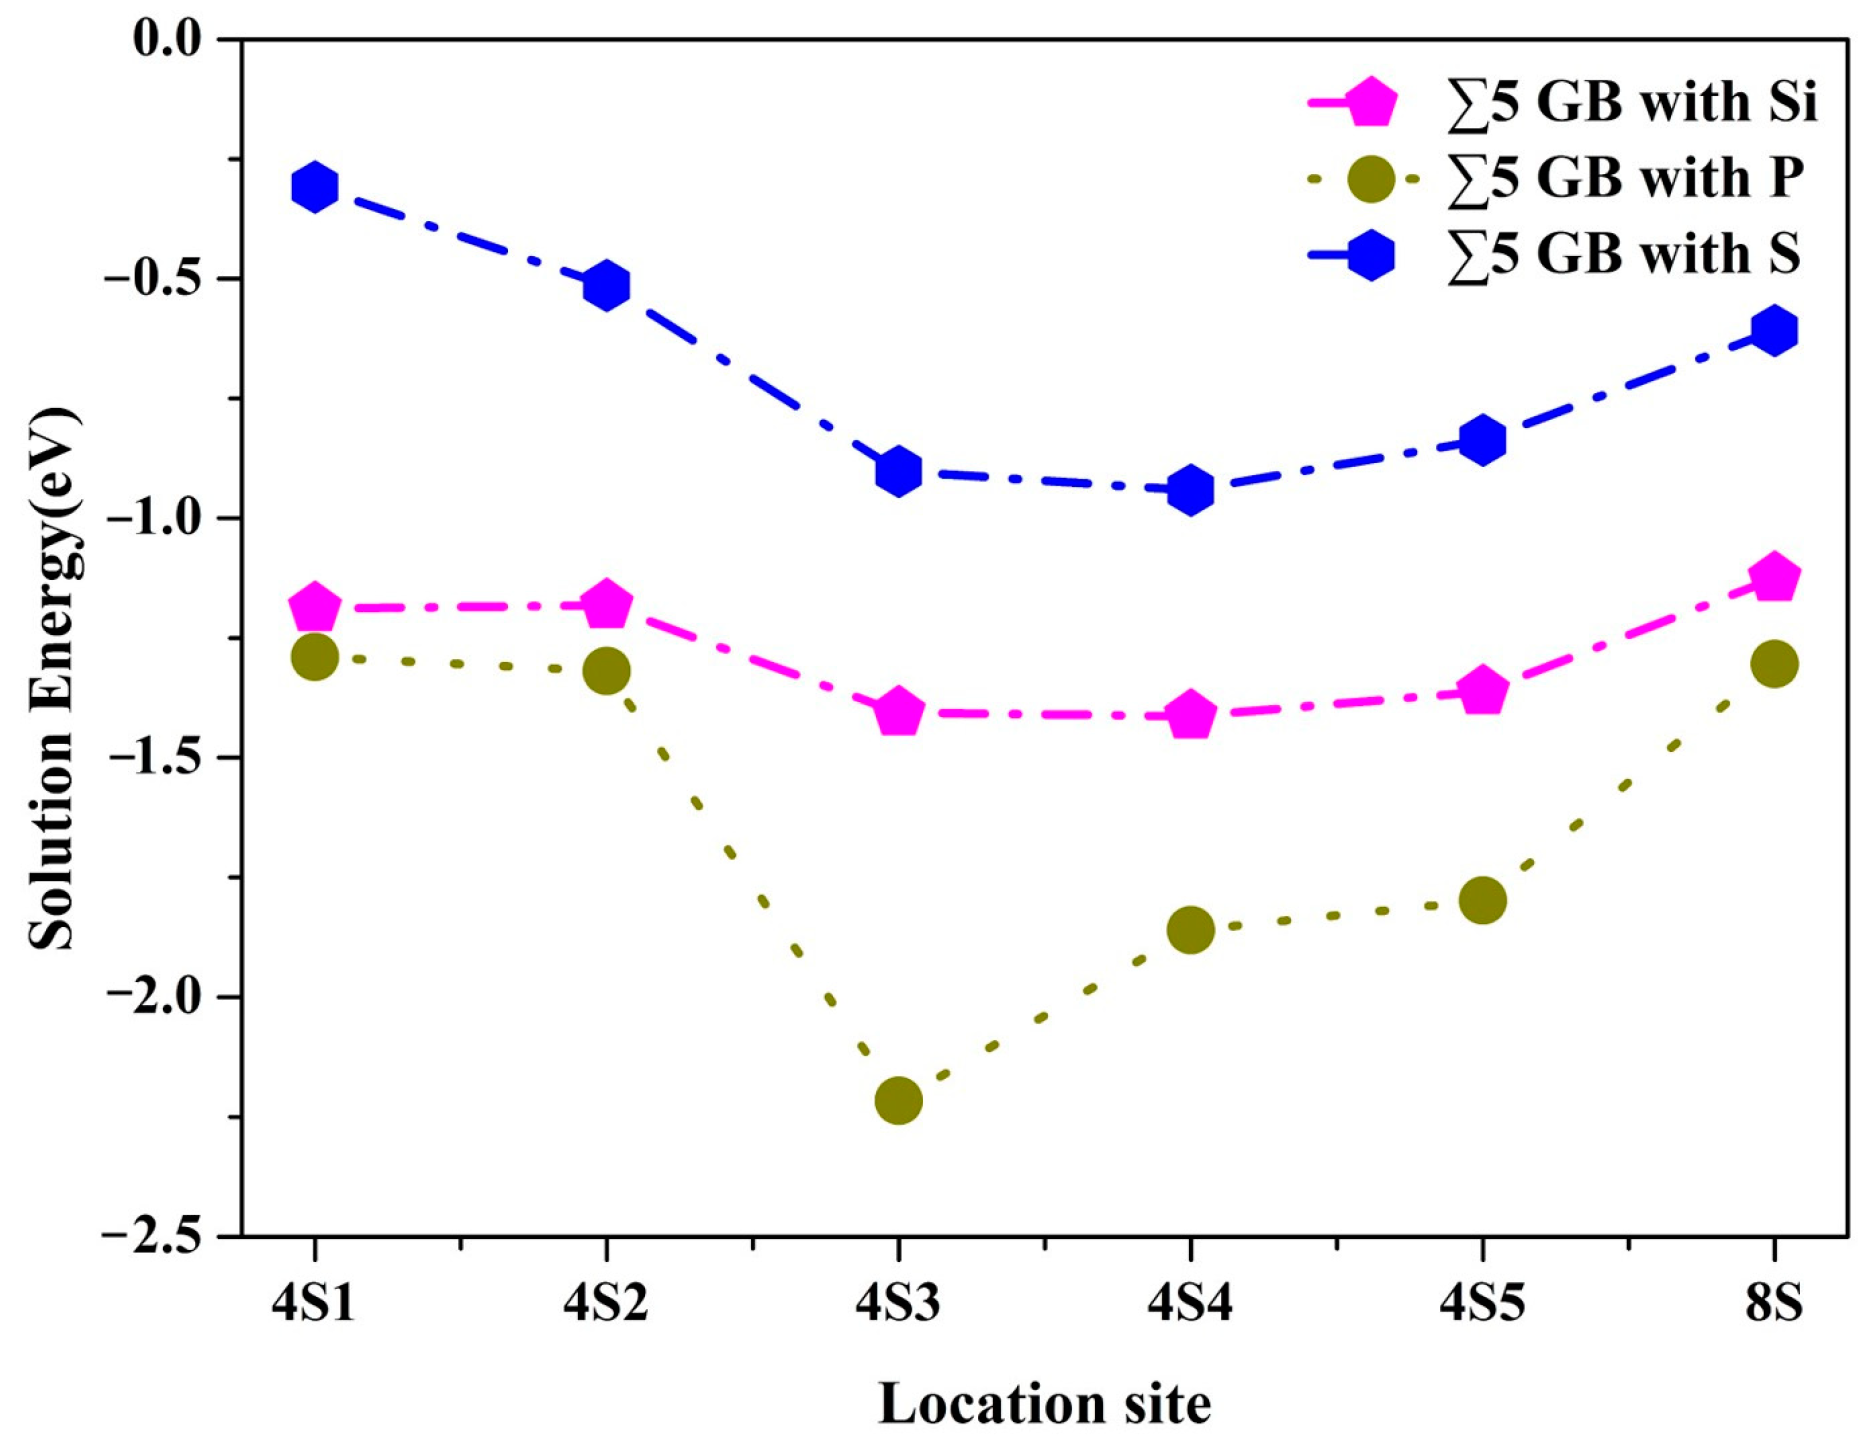
3.5. Effects of Si, P, and S Concentrations on the GB

According to previous studies, the concentration of solute atoms is another key factor that affects the GB cohesion, so the effects of impurities at different concentrations were investigated. Based on the above results, the possible GB models with four atoms and eight atoms were completely constructed, as depicted in Figure 10. There are five models with four impurity atoms and one model with eight impurity atoms. In order to confirm the stability of systems, the solution energies were calculated, as shown in Figure 11. The solution energies for all cases were negative values, indicating these structures are stable. The P cases are the most stable ones among the impurity types. For the GB with 4Si and 4S, the most stable model is type 4, as shown in Figure 10d. While the most stable model of P is type 3, as exhibited in Figure 10c, which is mainly determined by the electron distribution. In addition, the stability of cases decreases when the concentration of impurities increases.
In order to uncover the relationship between the atomic arrangement and the impurity type of the most stable GB models with four impurity atoms, charge densities were calculated, as depicted in Figure 12. Compared with the single doped impurity atom, there is no obvious change that occurs for Si and S. However, strong bonds were formed between P–Fe(8), P–Fe(-2), and P–Fe(5), which confirms the driving force is to form Fe3P [36]. Meanwhile, the low-density area below 0.2 e/a.u.3 was increased in the case of Si and S. While the low-density area less than 0.2 e/a.u.3 was divided into three parts in the case of P, which may be helpful in strengthening the GB cohesion.
In order to investigate the concentration of impurity atoms on the GB strengths, tensile tests were performed, as presented in Figure 13. Figure 13 shows the stress–strain curves of impurity atoms at different concentrations. It is obvious that the stress in models with high concentrations exhibits a negative value, which is caused by structural stress. With the strain increasing, the stress for cases follows the same trend with low concentrations. As shown in Figure 13d, the maximum stress in the case of 1Si has the largest value and is greater than the pure GB, which presents a strengthening effect on the GB cohesion. The value of other cases is less than the pure GB, indicating that an embrittlement effect occurs. In the cases of Si and S, it is shown that the maximum stresses decrease with the concentration increase. Meanwhile, the maximum stress of the 4P case is higher than the 1P case. The main reason for this is that P has a tendency to form Fe3P. Therefore, adding appropriate amounts of P does indeed improve the performance of the steel.

4. Conclusions

The effects of Si, P, and S on the γ-Fe ∑5 (210)[001] GB were systematically investigated by first-principle calculations. Compared with interstitial sites, Si, P, and S are energetically favored to locate at the substitutional sites in the first layer with the lowest solution energy. They easily segregate at the GB with negative values of segregation energy, and the mechanical contributions are greater than the chemical contributions. The strengthening energies based on the Rice–Wang theory show that Si, P, and S have an embrittlement effect on GB. However, Si shows a strengthening effect on GB in the tension test. The main reason for this is that the fracture plane does not always present at the GB interface. With solute concentration increasing, the maximum stresses of Si and S show a decrease, while P presents an increase at first and then a decrease due to the driving force to form Fe3P. These results provide a useful guidance in steel design.

Author Contributions

Y.X.: Conceptualization, Methodology, Visualization, Writing—Original draft preparation. W.C.: Data Curation, Methodology, Writing—Review and Editing. M.H.: Formal analysis, Visualization. F.Z.: Supervision, Resources, Validation. All authors have read and agreed to the published version of the manuscript.

Funding

The work is financially supported by National Key R&D Program of China (No. 2022YFB3705202) and National Natural Science Foundation of China (No. 51831008, 52171049, 52104330).

Data Availability Statement

The raw data supporting the conclusions of this article will be made available by the authors on request.

Conflicts of Interest

The authors declare that they have no known competing financial interests or personal relationships that could have appeared to influence the work reported in this paper.

References

  1. Tokita, S.; Kokawa, H.; Sato, Y.S.; Fujii, H.T. In situ EBSD observation of grain boundary character distribution evolution during thermomechanical process used for grain boundary engineering of 304 austenitic stainless steel. Mater. Charact. 2017, 131, 31–38. [Google Scholar] [CrossRef]
  2. Sabzi, H.E.; Hernandez-Nava, E.; Li, X.-H.; Fu, H.; San-Martín, D.; Rivera-Díaz-del-Castillo, P.E.J. Strengthening control in laser powder bed fusion of austenitic stainless steels via grain boundary engineering. Mater. Design 2021, 212, 110246. [Google Scholar] [CrossRef]
  3. Shimada, M.; Kokawa, H.; Wang, Z.J.; Sato, Y.S.; Karibe, I. Optimization of grain boundary character distribution for intergranular corrosion resistant 304 stainless steel by twin-induced grain boundary engineering. Acta Mater. 2002, 50, 2331–2341. [Google Scholar] [CrossRef]
  4. Shang, B.; Lei, L.; Wang, X.; He, P.; Yuan, X.; Dai, W.; Li, J.; Jiang, Y.; Sun, Y. Effects of grain boundary characteristics changing with cold rolling deformation on intergranular corrosion resistance of 443 ultra-pure ferritic stainless steel. Corros. Commun. 2022, 8, 27–39. [Google Scholar] [CrossRef]
  5. Zhuo, Z.; Xia, S.; Bai, Q.; Zhou, B. The effect of grain boundary character distribution on the mechanical properties at different strain rates of a 316L stainless steel. J. Mater. Sci. 2017, 53, 2844–2858. [Google Scholar] [CrossRef]
  6. Liu, T.; Hui, J.; Zhang, B.; He, X.; Liu, M.; Qiu, J.; Liu, W. Corrosion mechanism of lead-bismuth eutectic at grain boundary in ferritic steels and the effect of alloying elements: A first-principles study. J. Nucl. Mater. 2022, 569, 153915. [Google Scholar] [CrossRef]
  7. Peng, H.R.; Huo, W.T.; Zhang, W.; Tang, Y.; Zhang, S.; Huang, L.K.; Hou, H.Y.; Ding, Z.G.; Liu, F. Correlation between stabilizing and strengthening effects due to grain boundary segregation in iron-based alloys: Theoretical models and first-principles calculations. Acta Mater. 2023, 251, 118899. [Google Scholar] [CrossRef]
  8. Hu, Y.-J.; Wang, Y.; Wang, W.Y.; Darling, K.A.; Kecskes, L.J.; Liu, Z.-K. Solute effects on the Σ3 111[11-0] tilt grain boundary in BCC Fe: Grain boundary segregation, stability, and embrittlement. Comp. Mater. Sci. 2020, 171, 109271. [Google Scholar] [CrossRef]
  9. Niu, M.C.; Chen, C.J.; Li, W.; Yang, K.; Luan, J.H.; Wang, W.; Jiao, Z.B. Atomic-scale understanding of solute interaction effects on grain boundary segregation, precipitation, and fracture of ultrahigh-strength maraging steels. Acta Mater. 2023, 253, 118972. [Google Scholar] [CrossRef]
  10. Ito, K.; Tanaka, Y.; Tsutsui, K.; Omura, T. Effect of Mo addition on hydrogen segregation at α-Fe grain boundaries: A first-principles investigation of the mechanism by which Mo addition improves hydrogen embrittlement resistance in high-strength steels. Comp. Mater. Sci. 2023, 218, 111951. [Google Scholar] [CrossRef]
  11. Liu, S.; Zhang, Y.; Ren, J.; Dong, N.; Zhang, C.; Ma, J.; Jiang, Z.; Li, H.; Han, P. Effect of Mo and Cr on S-induced intergranular fracture in γ-Fe. Metals 2022, 12, 1606. [Google Scholar] [CrossRef]
  12. Ito, K.; Tanaka, Y.; Mitsunobu, T.; Kohtake, T.; Tsutsui, K.; Sawada, H. First-principles computational tensile test of γ-Fe grain boundaries considering the effect of magnetism: Electronic origin of grain boundary embrittlement due to Zn segregation. Phys. Rev. Mater. 2022, 6, 053604. [Google Scholar] [CrossRef]
  13. Peng, W.; Peng, H.; Wu, G.; Zhang, J. Effect of zinc-doping on tensile strength of Σ5 bcc Fe symmetric tilt grain boundary. Comp. Mater. Sci. 2020, 171, 109204. [Google Scholar] [CrossRef]
  14. Wang, J.; Yang, X.; Qian, R.; Rong, X.; Xie, Z.; Shang, C. First-Principles Study of B segregation at austenite grain boundary and its effect on the hardenability of low-alloy steels. Metals 2022, 12, 2006. [Google Scholar] [CrossRef]
  15. Ito, K.; Sawada, H. First-principles analysis of the grain boundary segregation of transition metal alloying elements in γ-Fe. Comp. Mater. Sci. 2022, 210, 111050. [Google Scholar] [CrossRef]
  16. Chen, Y.; Wang, C.; Xu, W. Effect of solutes on the performance of Zn-coating and Zn-inducing transgranular cracking in steel based on DFT calculations. J. Mater. Res. Technol. 2022, 21, 1519–1527. [Google Scholar] [CrossRef]
  17. Ding, C.; Peng, W.; Ma, Z.; Zhao, Y.; Teng, H.; Wu, G. Effect of Ni doping on the embrittlement of liquid Zinc at Σ5 Fe austenite grain boundary. Metals 2021, 12, 27. [Google Scholar] [CrossRef]
  18. Yue, Y.; Zhang, X.; Xu, D.; Qin, J.; Zhang, X.; Liu, R. Segregation behaviors of nonmetallic impurities on grain boundary of austenitic steel. Mater. Chem. Phys. 2023, 296, 127227. [Google Scholar] [CrossRef]
  19. Wang, R.; Cheng, L.; Yin, C.; Lou, W.; Wu, K. The effects of hydrogen and vacancy on the tensile deformation behavior of Σ3 symmetric tilt grain boundaries in pure Fe. Int. J. Hydrogen Energy 2023, 48, 30930–30948. [Google Scholar] [CrossRef]
  20. Li, Y.; Lin, J.; Li, J.; Ogata, S.; Geng, W. Friedel oscillations induce hydrogen accumulation near the Σ3 (111) twin boundaries in γ-Fe. Steel. Res. Int. 2022, 93, 2200324. [Google Scholar] [CrossRef]
  21. He, Y.; Su, Y.; Yu, H.; Chen, C. First-principles study of hydrogen trapping and diffusion at grain boundaries in γ-Fe. Int. J. Hydrogen Energy 2021, 46, 7589–7600. [Google Scholar] [CrossRef]
  22. Du, Y.A.; Ismer, L.; Rogal, J.; Hickel, T.; Neugebauer, J.; Drautz, R. First-principles study on the interaction of H interstitials with grain boundaries in α- and γ-Fe. Phys. Rev. B 2011, 84, 144121. [Google Scholar] [CrossRef]
  23. Ahmadian, A.; Scheiber, D.; Zhou, X.; Gault, B.; Liebscher, C.H.; Romaner, L.; Dehm, G. Aluminum depletion induced by co-segregation of carbon and boron in a bcc-iron grain boundary. Nat. Commun. 2021, 12, 6008. [Google Scholar] [CrossRef] [PubMed]
  24. Yang, Y.; Ding, J.; Zhang, P.; Mei, X.; Huang, S.; Zhao, J. The effect of Cr on He segregation and diffusion at Σ3(112) grain boundary in α-Fe. Nucl. Instrum. Meth. B 2019, 456, 7–11. [Google Scholar] [CrossRef]
  25. He, Y.; Zhao, X.; Yu, H.; Chen, C. Effect of S on H-induced grain-boundary embrittlement in γ-Fe by first-principles calculations. Int. J. Hydrogen Energy 2021, 46, 28346–28357. [Google Scholar] [CrossRef]
  26. Wang, J.; Enomoto, M.; Shang, C. First-principles study on the P-induced embrittlement and de-embrittling effect of B and C in ferritic steels. Acta Mater. 2021, 219, 117260. [Google Scholar] [CrossRef]
  27. Verkhovykh, A.V.; Mirzoev, A.A.; Dyuryagina, N.S. Ab Initio Modeling of Interactions of P, H, C, S with Grain Boundaries in α-Iron. Bull. South. Ural. Stat. 2021, 13, 57–68. [Google Scholar] [CrossRef]
  28. Ito, K.; Sawada, H.; Tanaka, S.; Ogata, S.; Kohyama, M. Electronic origin of grain boundary segregation of Al, Si, P, and S in bcc-Fe: Combined analysis of ab initio local energy and crystal orbital Hamilton population. Model. Simul. Mater. Sci. Eng. 2020, 29, 015001. [Google Scholar] [CrossRef]
  29. Yuasa, M.; Mabuchi, M. Grain Boundary Embrittlement of Fe Induced by P Segregation: First-Principles Tensile Tests. Adv. Mater. 2011, 409, 455–460. [Google Scholar] [CrossRef]
  30. Clark, S.J.; Segall, M.D.; Pickard, C.J.; Hasnip, P.J.; Probert, M.I.J.; Refson, K.; Payne, M.C. First principles methods using CASTEP. Z. Krist.—Cryst. Mater. 2005, 220, 567–570. [Google Scholar] [CrossRef]
  31. Vanderbilt, D. Soft self-consistent pseudopotentials in a generalized eigenvalue formalism. Phys. Rev. B 1990, 41, 7892–7895. [Google Scholar] [CrossRef] [PubMed]
  32. Perdew, J.P.; Chevary, J.A.; Vosko, S.H.; Jackson, K.A.; Pederson, M.R.; Singh, D.J.; Fiolhais, C. Atoms, molecules, solids, and surfaces: Applications of the generalized gradient approximation for exchange and correlation. Phys. Rev. B 1992, 46, 6671–6687. [Google Scholar] [CrossRef] [PubMed]
  33. Ropo, M.; Kokko, K.; Vitos, L. Assessing the Perdew-Burke-Ernzerhof exchange-correlation density functional revised for metallic bulk and surface systems. Phys. Rev. B 2008, 77, 195445. [Google Scholar] [CrossRef]
  34. Scheiber, D.; Pippan, R.; Puschnig, P.; Ruban, A.; Romaner, L. Ab-initio search for cohesion-enhancing solute elements at grain boundaries in molybdenum and tungsten. Int. J. Refract. Met. Hard Mater. 2016, 60, 75–81. [Google Scholar] [CrossRef]
  35. Rice, J.R.; Wang, J.-S. Embrittlement of interfaces by solute segregation. Mat. Sci. Eng. A 1989, 107, 23–40. [Google Scholar] [CrossRef]
  36. Yang, Y.; Chen, S.L. Thermodynamic and kinetic modeling of grain boundary equilibrium segregation of P in α-Fe. Calphad 2017, 57, 134–141. [Google Scholar] [CrossRef]
Figure 1. Schematic diagram of the γ-Fe Σ5(210)[001] GB model with the possible interstitial sites and substitutional sites of impurity atoms (a), front view (b) and top view (c) of the GB model. The purple balls represent Fe atoms, the green balls are interstitial sites, and the red balls indicate the substitutional sites.
Metals 14 00471 g001
Figure 2. Solution energies of Si, P, and S located at different sites in the γ-Fe Σ5 (210)[001] GB.
Metals 14 00471 g002
Figure 3. Local atomic configuration of pure GB (a), Si-doped GB (b), P-doped GB (c), and S-doped GB (d) after structure relaxation. The atomic distance is Å. The purple balls are Fe atoms, the green ball presents Si atom, the orange ball is P atom, and the blue ball is S atom.
Metals 14 00471 g003
Figure 4. Calculated charge density in the (001) plane for cases of the pure GB (a), Si-doped GB (b), P-doped GB (c), and S-doped GB (d). The unit is e/a.u.3. The color change from blue to red indicates the increase of charge density.
Metals 14 00471 g004
Figure 5. The planar projection of electron density differences for the (001) plane in the pure GB (a), Si-doped GB (b), P-doped GB (c), and S-doped GB (d). The unit is e/a.u.3. The red area means a charge depletion, while the blue area represents a charge accumulation.
Metals 14 00471 g005
Figure 6. The DOS of pure GB (a), Si-doped GB (b), P-doped GB (c), and S-doped GB (d).
Metals 14 00471 g006
Figure 7. The tensile strain–stress curves of pure GB, Si-doped GB, P-doped GB, and S-doped GB.
Metals 14 00471 g007
Figure 8. Local atomic configuration of pure GB (a), Si-doped GB (b), P-doped GB (c), and S-doped GB (d) at 30% strain-induced variations.
Metals 14 00471 g008
Figure 9. Charge density distribution in the (001) planes of the pure GB (a), Si-doped GB (b), P-doped GB (c), and S-doped GB (d) at 0%, 5%, 10%, 15%, and 20% strain-induced variations.
Metals 14 00471 g009
Figure 10. Atomic arrangement of GB models with four impurity atoms (ae) and eight impurity atoms (f). The purple balls are Fe atoms, and the red balls are possible substituted sites.
Metals 14 00471 g010
Figure 11. Solution energies of pure GB, Si-doped GB, P-doped GB, and S-doped GB with different concentrations.
Metals 14 00471 g011
Figure 12. Charge density of the most stable GB models with 4Si (a), 4P (b), and 4S (c).
Metals 14 00471 g012
Figure 13. The concentration effects of Si (a), P (b), and S (c) on the GB, and the maximum stress as a function of solute concentration (d).
Metals 14 00471 g013aMetals 14 00471 g013b
Table 1. The calculated segregation energies (Eseg), the mechanical contributions ( E s e g m e c ), and chemical contributions ( E s e g c h e m ) of Si, P, and S at the S2 site in the γ-Fe Σ5 (210)[001] GB.
ElementSiteEseg/eV
E s e g m e c / eV
E s e g c h e m / e V
SiS2−0.14−0.660.52
PS2−0.80−0.76−0.04
SS2−1.43−1.04−0.39
Disclaimer/Publisher’s Note: The statements, opinions and data contained in all publications are solely those of the individual author(s) and contributor(s) and not of MDPI and/or the editor(s). MDPI and/or the editor(s) disclaim responsibility for any injury to people or property resulting from any ideas, methods, instructions or products referred to in the content.

