Article

Investigations on the Johnson-Cook Constitutive and Damage-Fracture Model Parameters of a Q345C Steel

1
School of Materials and Energy, University of electronic Science and Technology of China, Chengdu 610054, China
2
MOE Key Laboratory of Impact and Safety Engineering, Ningbo University, Ningbo 315211, China
*
Author to whom correspondence should be addressed.
Metals 2024, 14(5), 509; https://doi.org/10.3390/met14050509
Submission received: 20 March 2024 / Revised: 12 April 2024 / Accepted: 23 April 2024 / Published: 26 April 2024

Abstract

:
Due to the rapid development of high-speed trains, the service safety of vehicle body materials and structures has become a focal point in transport and impact engineering. Numerical simulations on the collision resistance of vehicle materials and structures are crucial for the safety assessment and optimal structural design of high-speed trains but have not been fully investigated due to the lack of damage model parameters. This study focuses on the Johnson-Cook (J-C) constitutive and damage-fracture models of a typical vehicle material, Q345C steel. A series of mechanical tests are conducted on the Q345C steel, including the quasi-static and dynamic compression/tension tests, quasi-static tension tests at different temperatures, and fracture tests along different stress paths, using the material test system and the split Hopkinson pressure/tension bar. Then, the parameters of the Johnson-Cook constitutive and damage-fracture models are calibrated based on the experimental results. In terms of the damage parameters related to stress paths, a new method of combining experiments and simulations is proposed to obtain the real, local fracture strains of the Q345C steel samples. This method allows the measurements of equivalent plastic strain and stress triaxiality histories under nonlinear stress paths, which are hardly accessible from individual experiments, and facilitates the accurate calibration of stress-path-related damage parameters. In addition, a high-speed plate penetration test is used to validate the J-C parameters, which can be directly implemented in the commercial finite element software Abaqus. The projectile trajectories from the simulation and experiment agree well with each other, demonstrating the reliability of the model parameters for impact scenarios and the efficiency of the experimental procedures utilized for calibration.

1. Introduction

China has become the country with the most comprehensive high-speed railway system technology, the strongest integration capability, the longest operational mileage, the highest operating speed, and the largest scale under construction in the world [1,2,3,4,5]. With the increase in operational velocities and the expansion of construction projects, ensuring train safety against risks such as collision derailment and strong crosswinds emerges as a paramount concern in engineering science. The crashworthiness of vehicle materials and structures has been generally investigated through impact experiments [6,7] and numerical modeling [8]. Considering the expensive cost involved in the impact experiments (especially full vehicle testing [9]), large-scale numerical simulations are frequently employed to discuss the impact of collisions on the vehicle structures [10] or full vehicles [11] occurring during high-speed train operation. However, further development of the simulation studies is hindered due to the lack of reliable constitutive model parameters considering damage and fracture for the vehicle materials.
Vehicle materials like steel and aluminum alloys experience complex stress states and harsh environmental conditions during service, including extreme strain rates [12] and high and low temperatures [13]. Many current train collision simulations simplify the vehicles to a rigid body–spring–damper system [14,15,16], which mainly concerns the velocity and acceleration histories of vehicle bodies. Such simulations rarely consider the elastic-plastic deformation, damage, and fracture evolution processes of vehicle materials and structures, which differ significantly from real service conditions and hinder the precise assessment of train safety and design optimization. Therefore, studying the dynamic constitutive and damage-fracture models of Q345C steel with consideration of the strain rate, temperature, and deformation/damage effects is critical for accurate train collision simulation and human–vehicle safety assessment.
The Johnson-Cook model (J-C model) is currently the most widely used material constitutive model, proposed by Johnson and Cook in 1983 [17]. It has been studied quite extensively, with numerous publications in the international community [18,19,20,21,22]. It contains a deformation model and a damage model, which decouples the work-hardening effects, strain rate effects, temperature effects, and loading path effects of materials with a relatively simple equation form that is convenient for engineering applications. The J-C model is embedded in many large commercial finite element software packages such as Abaqus and Ansys [23] and has widely been used in various fields, including material processing, automobile crashworthiness testing, high-speed vehicle safety testing, and bird strike aircraft simulation [24,25,26,27], providing valuable technical parameters and mechanism information for engineering structural design. However, the predictive capability of numerical simulations depends largely on the accuracy of constitutive model parameters; hence, meticulous experimental calibration of J-C model parameters is necessary. Most of the literature and technical materials focus on obtaining and verifying parameters of the J-C constitutive model [28,29,30], with less research on the J-C damage-fracture model [31]. The main reason is that the parameter acquisition process of the J-C damage model is more complicated, which needs to carry out fracture tests under different stress triaxiality, different strain rates and different temperatures, as well as precise measurements of local fracture strains of specimens. Therefore, extensive research work is still needed to identify suitable test procedures to calibrate and validate the J-C damage parameters and then obtain reliable damage parameters of vehicle materials like Q345C steel.
Q345C steel has been widely used as high-load welded structural components in high-speed trains, ships, and lifting and transportation machinery [32,33,34] due to its excellent mechanical properties (like good low-temperature toughness), high corrosion resistance, and good weldability. Research on the crashworthiness of Q345 steel has been widely conducted via numerical simulations and/or experiments [35,36,37] and yielded useful information for structural optimization of multiple equipment (construction machinery, offshore wind turbines, subway vehicles, etc.). However, the constitutive model parameters of the Q345 steel in these numerical simulations were all obtained from previous literature, and the damage and fracture of materials were not considered in the numerical simulations. Therefore, the crash simulations of Q345C steel structures have not been fully investigated due to the lack of reliable damage parameters. In this study, a series of mechanical performance tests were conducted on the Q345C steel, and parameters of the J-C constitutive and damage models were calibrated using massive experimental data. Finally, the model parameters obtained were validated using high-speed plate penetration experiments and simulations. The simulation and experimental results matched well, indicating the efficiency of the experimental techniques to calibrate the parameters, as well as the reliability of the obtained model parameters in this study.

2. Experimental Results and Discussion

2.1. Johnson-Cook Constitutive Model

The J-C constitutive model decouples the work-hardening effect, strain rate effect, and temperature effect on the plastic deformation of materials, as shown in the following equation [17]:
σ e q = A + B ε e q n 1 + C ln ε ˙ e q 1 T m
The three terms on the right side of Equation (1) deal with the effects of work-hardening, strain rate, and temperature on the equivalent stress σ e q , respectively, where A, B, C, n, and m are the model parameters. ε e q   represents the equivalent plastic strain, ε ˙ e q = ε ˙ e q / ε ˙ 0 represents the dimensionless equivalent plastic strain rate, ε ˙ e q represents the equivalent plastic strain rate, ε ˙ 0 represents the reference strain rate, T = T T r / T m T r   represents the dimensionless specimen temperature, T represents the ambient temperature, T r   represents the reference temperature, and T m   represents the material melting point (1530 °C for the Q345C steel [38]). The physical significance of the parameters of the constitutive model and the calibration process have been described in detail in the literature [18,26,39] and are not repeated here.

2.2. Johnson-Cook Damage-Fracture Model

The J-C model comes with a damage-fracture criterion, and its damage-fracture model is shown in the following equation [40]:
ε e q f = D 1 + D 2 exp D 3 σ 1 + D 4 ln ε ˙ e q 1 + D 5 T
The three terms on the right-hand side of Equation (2) represent the influence of stress triaxiality, strain rate, and temperature on the fracture strain of the material. Due to different strain states within the specimen under different stress paths, the fracture strain in this paper is uniformly measured using the equivalent plastic strain. The term ε e q f represents equivalent plastic strain at fracture, σ = σ H / σ e q represents stress triaxiality, σ H is the mean stress, σ e q is the Mises equivalent stress, and ε ˙ e q and T have already been defined from Equation (1). Parameters D 1 D 3 describe the influence of the stress path on material fracture strain, and parameters D 4 and D 5 are the strain rate sensitivity index and temperature sensitivity index, respectively, characterizing the influence of strain rate and temperature on material fracture characteristics.
The calibration process of parameters D 4 and D 5 is relatively conventional. To derive parameter D 4 , the tensile stress–strain curves of materials under quasi-static and dynamic loading are firstly obtained using the material test system (MTS) and the split Hopkinson tension bar (SHTB), respectively, to quantify the fracture strains as a function of strain rate. Then, linear fitting is performed between the normalized fracture strain and the logarithm of the strain rate, and the slope is the parameter D 4 . For parameter D 5 , the tensile stress–strain curves at different temperatures are obtained through the MTS implemented with an environmental chamber to quantify the fracture strains as a function of temperature. Then, power-law fitting is performed between the normalized fracture strain and the normalized temperature, and the power is the parameter D 5 . However, there is some controversy regarding the calibration process for D 1 D 3 in the literature. In some studies, the apparent or nominal fracture strain quantified from the stress–strain curves was used to derive D 1 D 3 , which underestimates the real fracture strain of materials due to the existence of localization like necking and shear banding. In fact, the local fracture strain at the fracture region should be used to derive D 1 D 3 . This study combines experiments with numerical simulations and proposes a new parameter calibration method. Its feature lies in designing non-standard specimens to change the loading paths, i.e., stress triaxiality, namely 0° shear (0), 45° shear (0.197), uniaxial tension (0.333), single-notch tension (0.395), and double-notch tension (0.515), to obtain the relationship between material fracture strain and stress triaxiality. The theoretical triaxiality for the above experiments is given in parentheses. All these experiments can be completed on a material test system. It is worth noting that the fracture strain in the first term of the J-C damage model is an absolute value, so parameter calibration must use local fracture strain. The nominal fracture strain shown in the stress–strain curve of uniaxial tension experiments is much smaller than the local fracture strain in the necking zone and cannot be used to calibrate parameters D 1 D 3 . Only force–displacement curves can be obtained from the 0° and 45° shear experiments as well as single- and double-notch experiments. Therefore, the local fracture strain of specimens in all five types of experiments needs to be obtained from the combined experiment and simulation method, and the specific process is described in Section 3.2. It is worth mentioning that the need for a hybrid experimental–numerical approach lies in the choice of the experimental test campaign where necking-induced fracture occurs under triaxial stress states. Experiments that involve appreciable bending and high through-thickness stress gradients tend to suppress tensile instabilities such that fracture occurs on the outer surface and can be measured in the experiment with digital image correlation (DIC) [41]. In the J-C damage model, the second and third terms both involve normalized strains, requiring only that the fracture strain be unified as the nominal fracture strain or the real local strain. The calibration process for D 4 and D 5 in the following text, all use the nominal fracture strain shown in the true stress–strain curve.

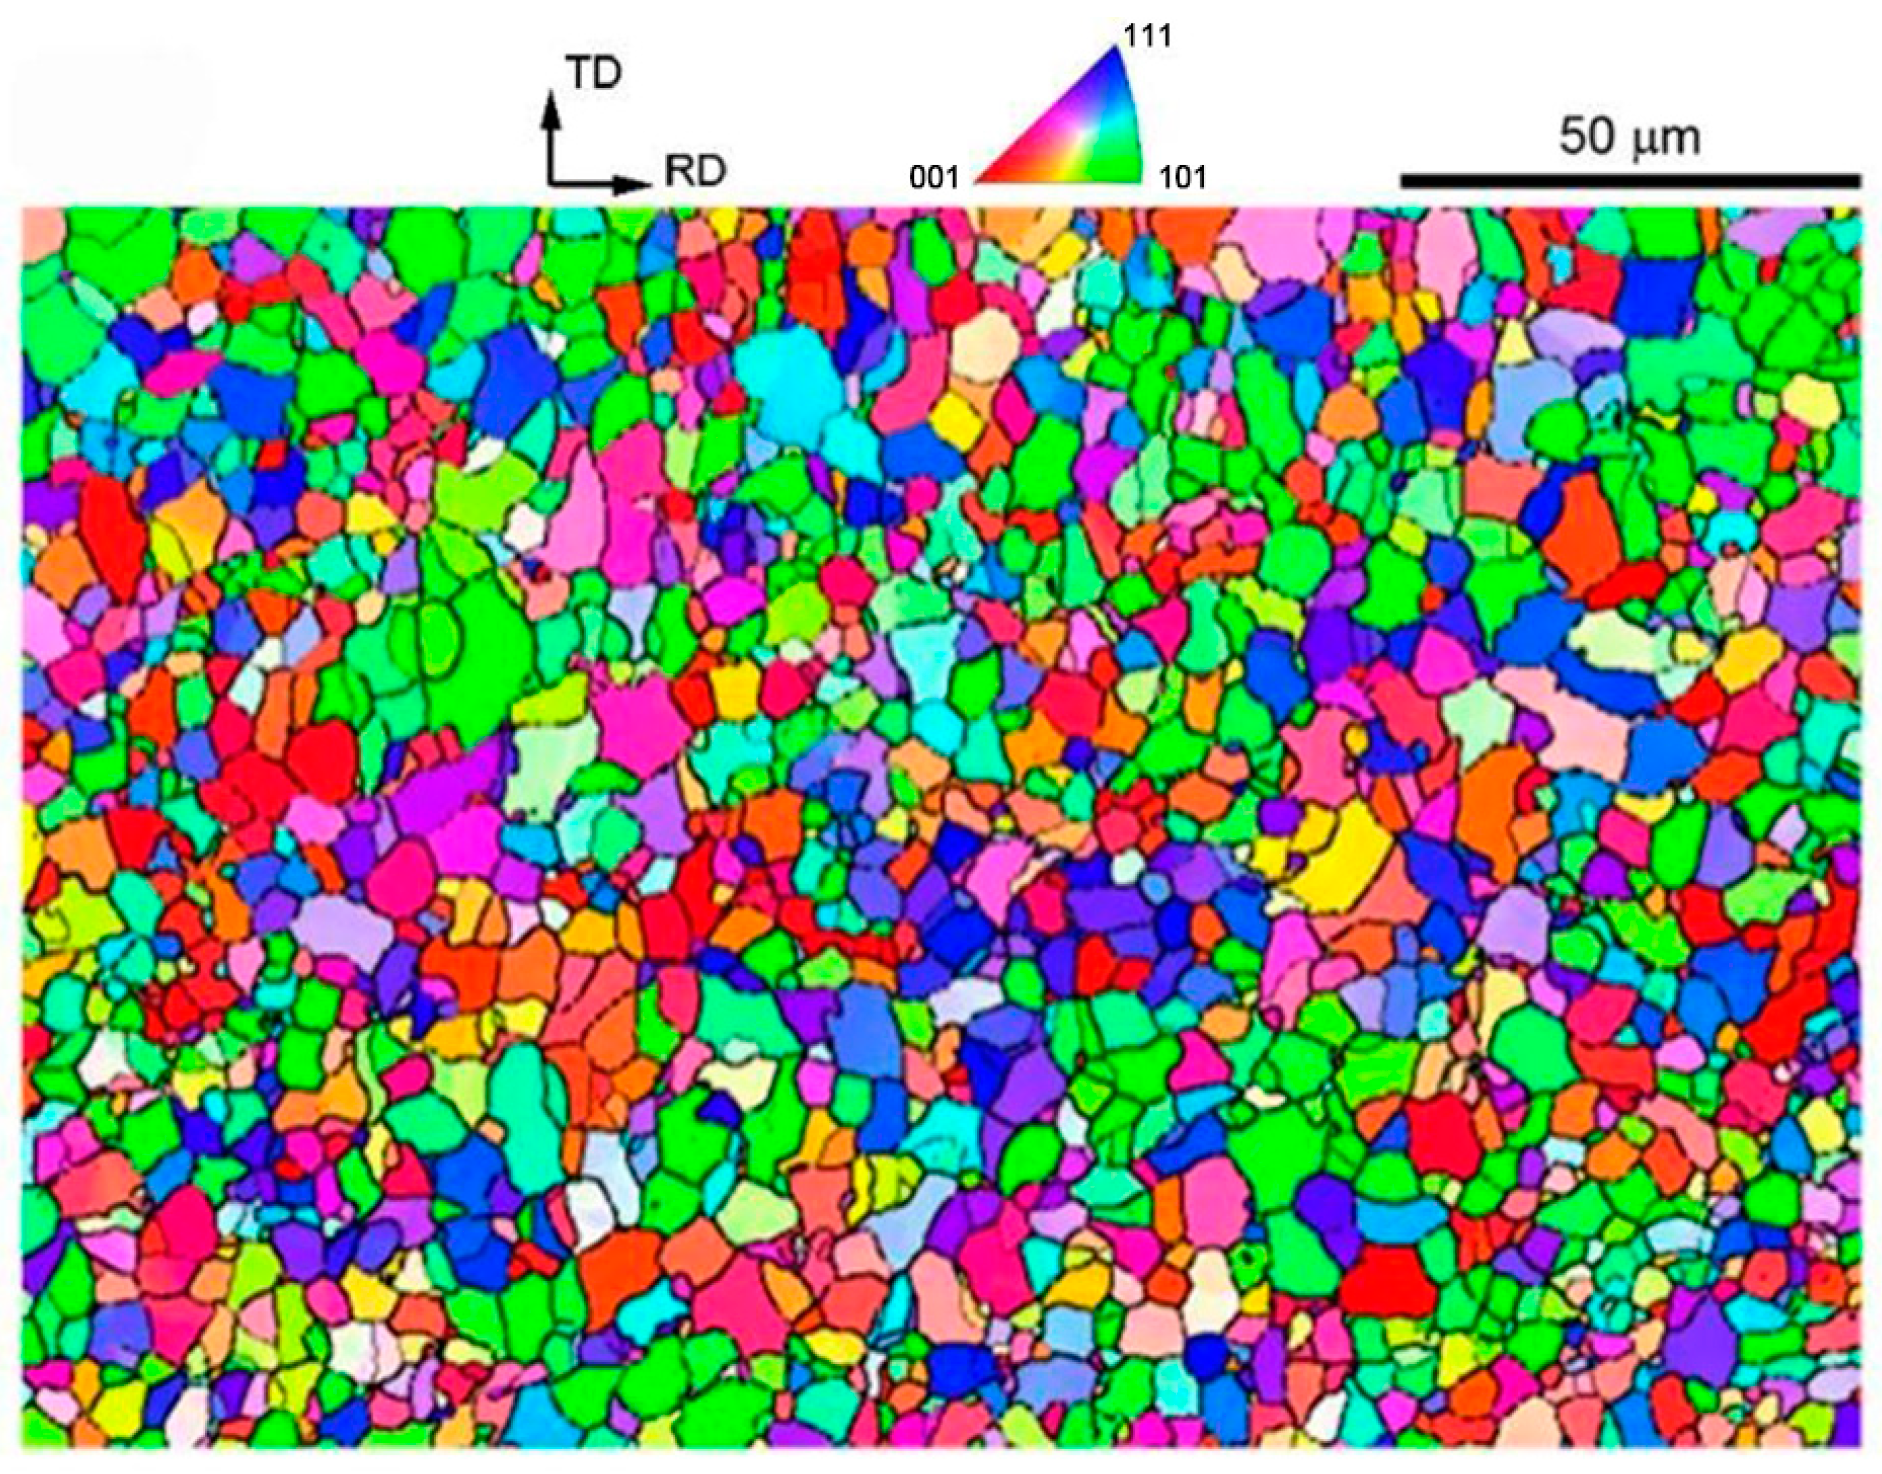
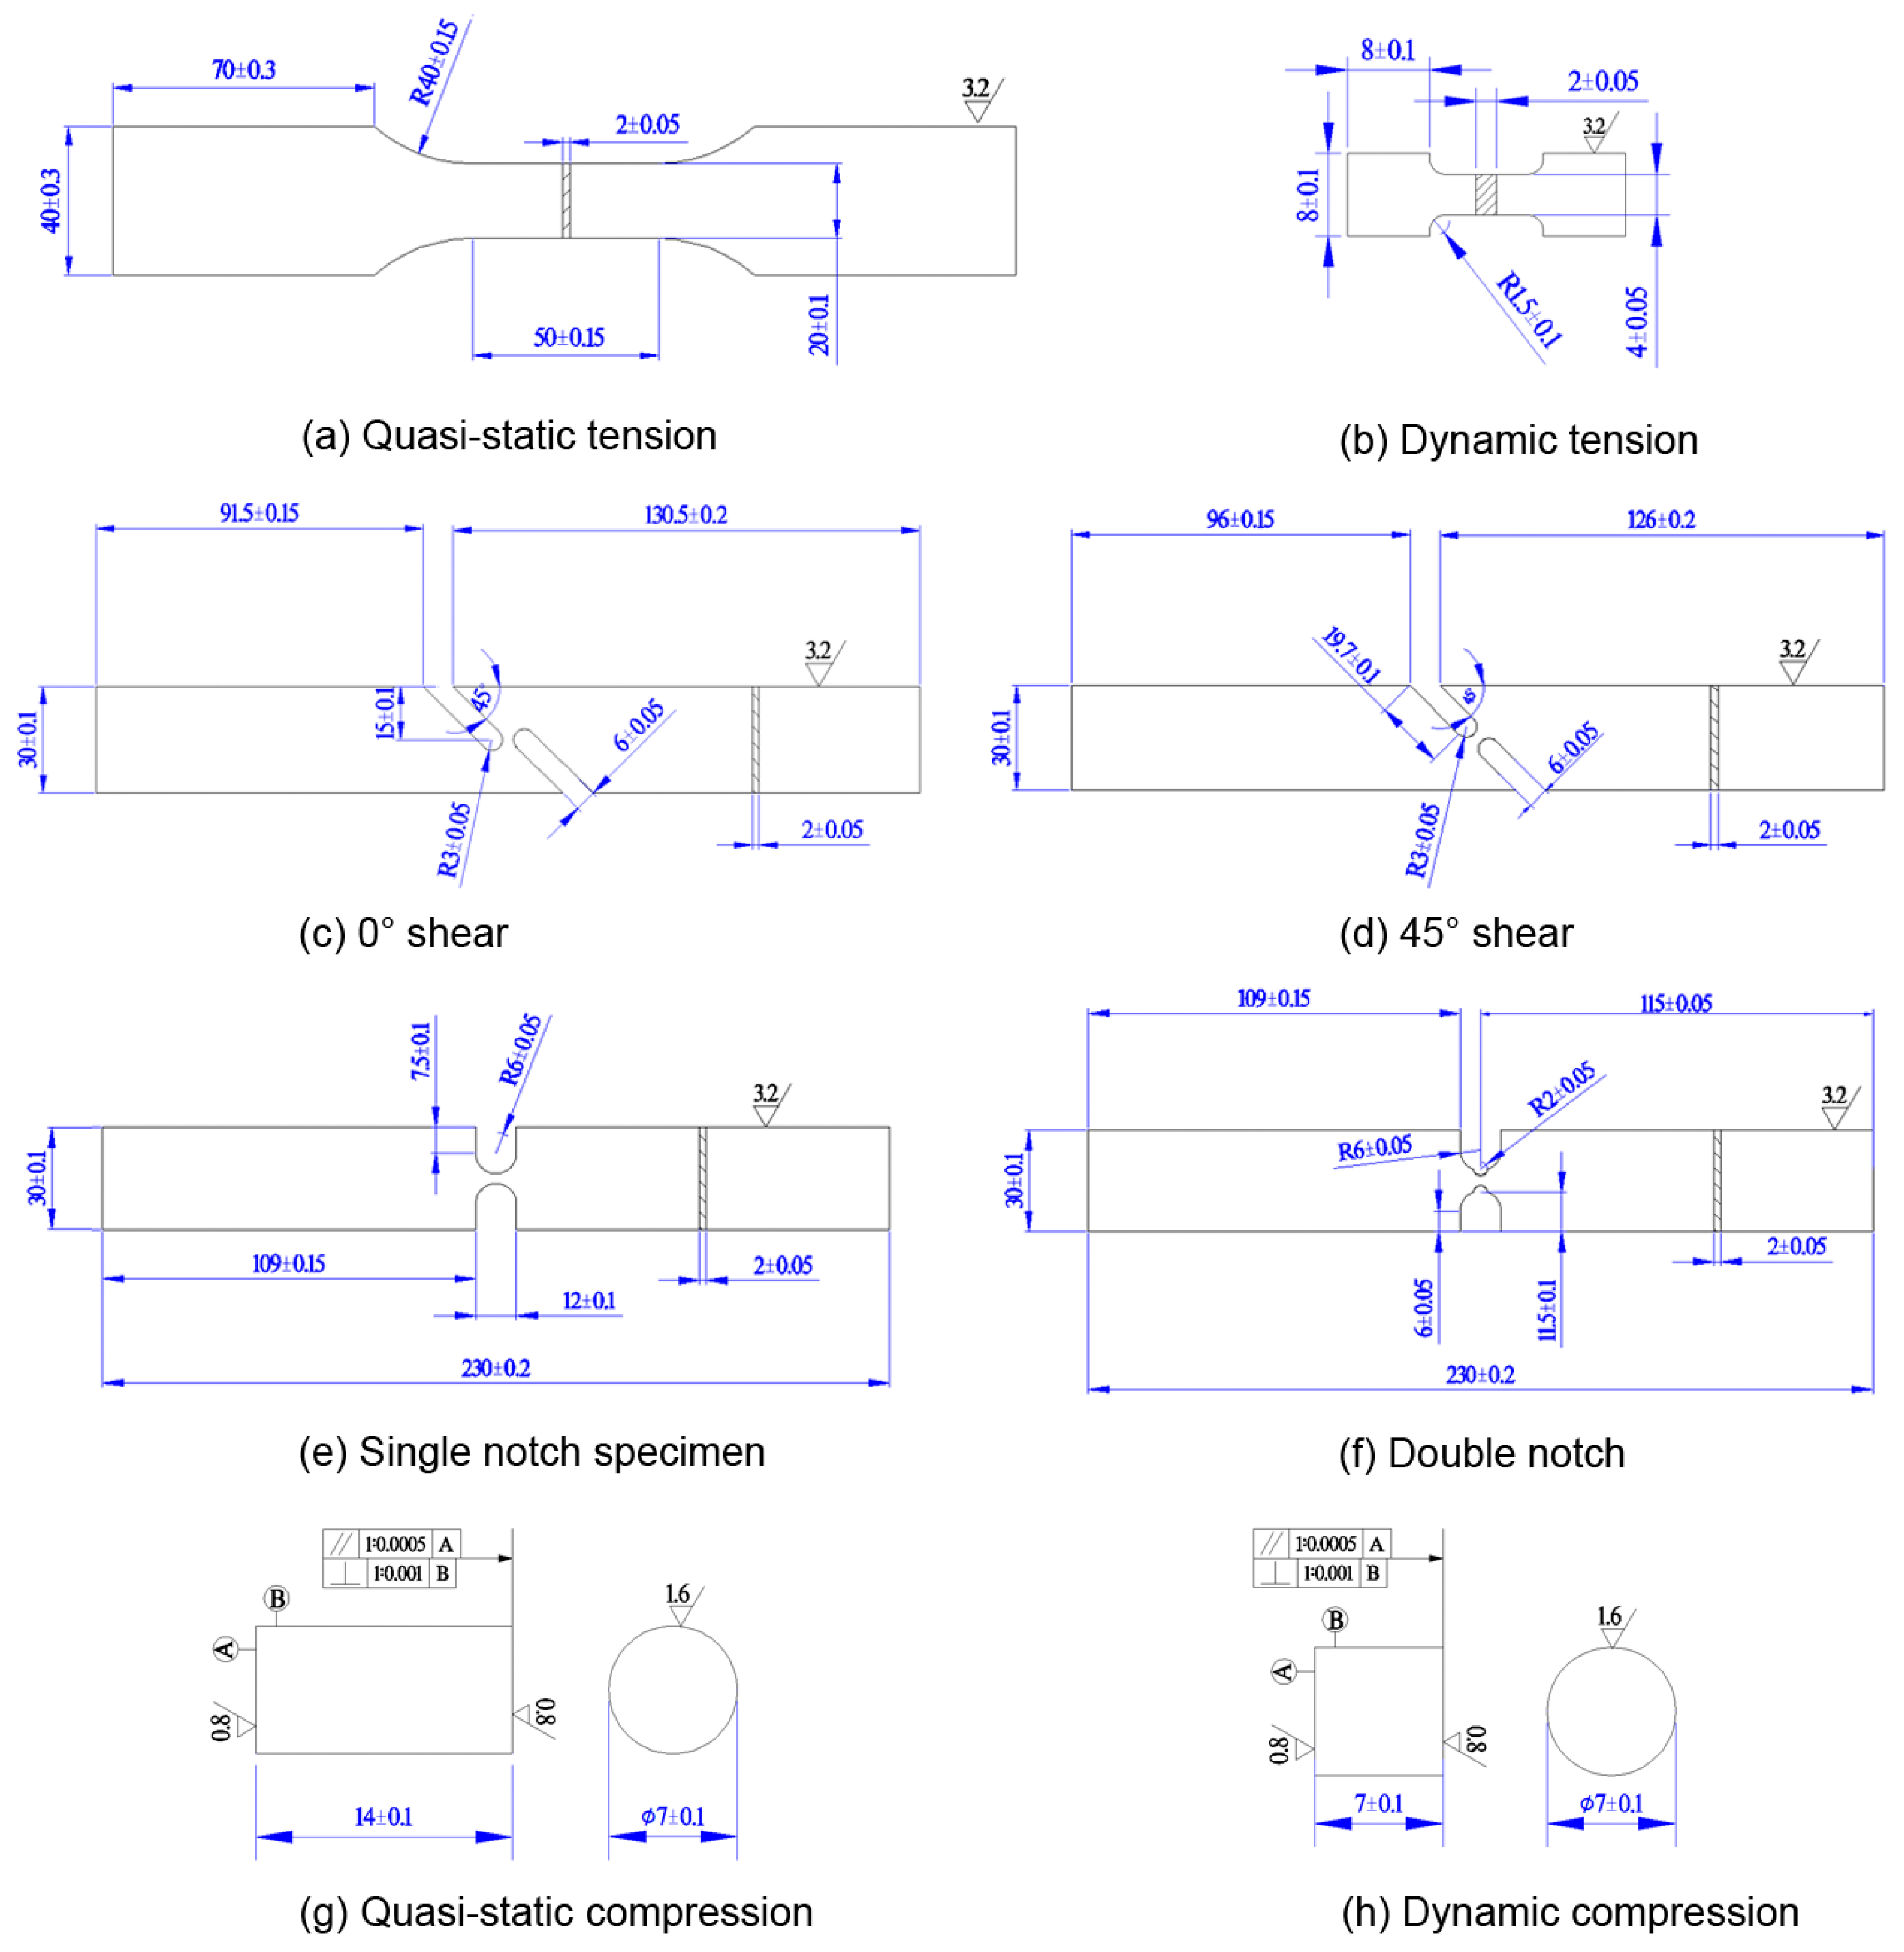
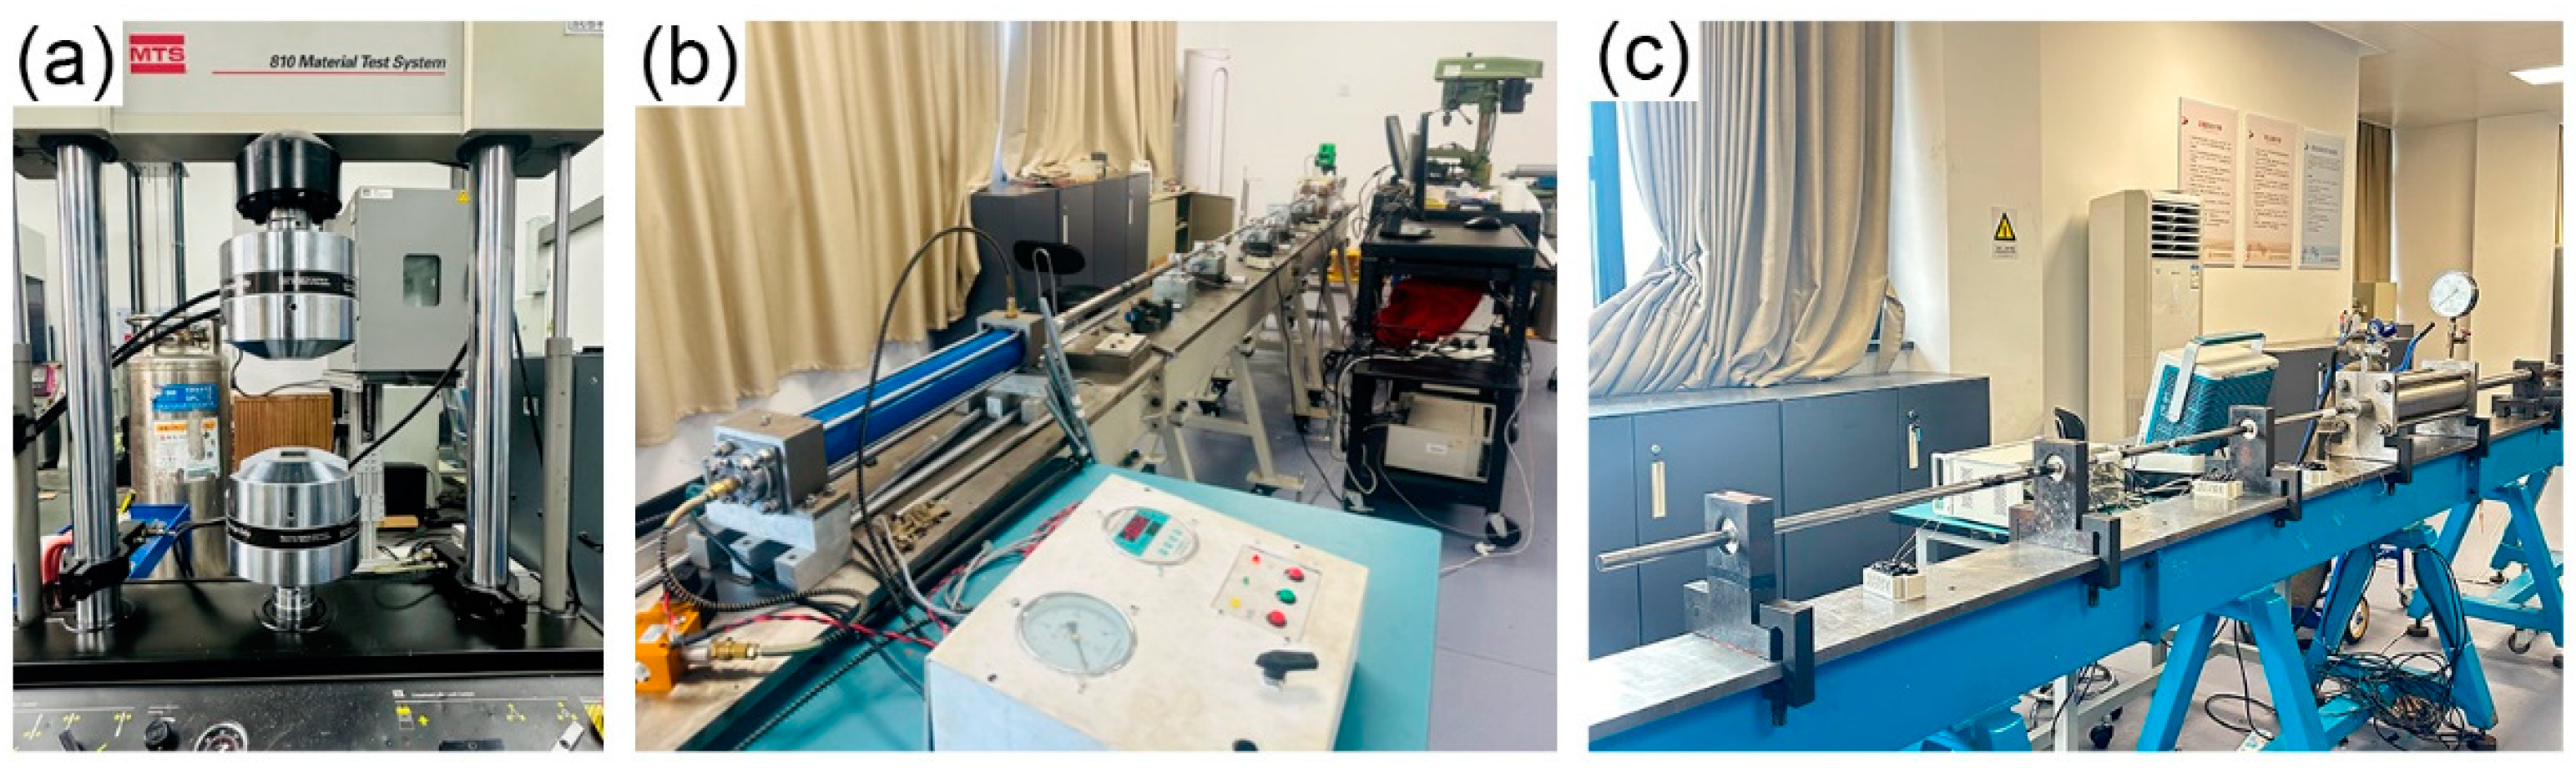
2.3. Experimental Materials, Samples, and Setups

The material used in this experiment was Q345C steel. The initial state of the material is hot-deformed, and the chemical composition is given in Table 1. The initial microstructure of the material was characterized via electron backscatter diffraction (EBSD) using a scanning electron microscope (FEI Quanta 250 FEG-SEM, Portland, OR, USA). Diffraction data were collected using an Oxford EBSD probe (working voltage of 20 kV, Oxford, UK); then, post-processing was performed using the HKL channel 5 2019 software package to obtain the microstructure morphology and analyze texture evolution. Figure 1 shows the EBSD orientation imaging of the initial Q345C steel material. The initial grain size of the material shown in the figure is about 5 μm.
The quasi-static compressive and tensile tests in this study were conducted on a 50 kN servo-hydraulic (MTS 810, Eden Prairie, MN, USA), as shown in Figure 2a. The high-temperature test was conducted by the MTS and implemented in an environmental chamber. Before loading, the tensile sample was placed in the chamber, heated to the preset temperature by radiating heating, and then kept in the chamber for about one hour to ensure a homogeneous temperature throughout the sample. After that, tensile testing was performed to obtain the tensile data of samples. The dynamic compressive and tensile tests were conducted using the split Hopkinson pressure bar (SHPB, Figure 2b) and the SHTB (Figure 2c), respectively. The basic principles of the SHPB/SHTB have been documented in previous literature [42,43] and are not repeated here. The striker, incident bar, and transmitted bar of the SHPB and SHTB are all made of high-strength steel, with a diameter of 16 mm and 19 mm, respectively. The lengths of the striker, incident bar, and transmitted bar are 300 mm, 1000 mm, and 1000 mm for the SHPB and 500 mm, 2500 mm, and 1500 mm for the SHTB, respectively.
Figure 3 shows the shapes and dimensions of eight experimental specimens involved in the calibration process. The sample size and machining accuracy shall comply with the Chinese national standardGB/T 228.1-2021 [44]. All experimental situations were repeated three times, and the average value was taken. For quasi-static tension (Figure 3a) and compression (Figure 3g), the test speed was 0.05 mm s−1 and 0.014 mm s−1, respectively, resulting in a nominal strain rate of 0.001 s−1. The force–displacement data were measured by the force and displacement sensors embedded in the loading platens and were used to derive the engineering and true stress–strain curves. For 0° shear (Figure 3c), 45° shear (Figure 3d), single-notch tension (Figure 3e), and double-notch tension (Figure 3f), the test speed was set as 0.23 mm s−1. In these tests, only the force–displacement curves were obtained from the MTS, and the stress–strain data were calculated from the simulations. For dynamic loading, the incident wave, reflected wave, and transmitted wave signals were collected by the strain gauges, ultra-dynamic strainometer, and oscilloscope. The engineering stress, strain, and strain rate histories were derived through the two-wave technique [45] as follows:
ε ˙ t = 2 C 0 L s ε i t ε t t
ε t = 2 C 0 L s 0 t ε i t ε t t d t
σ t = A 0 A s E 0 ε t t
where σ t ,   ε ˙ t , and ε t are the stress, strain rate, and strain histories, respectively. t refers to time. ε i t and ε t t are the strain amplitude of the incident wave and transmitted wave, respectively. C 0 and E 0 denote the wave velocity and elastic modulus of the bar. A 0 and A s are the cross-sectional area of the bar and the specimen, respectively. L s is the initial specimen length.

3. Results and Discussions

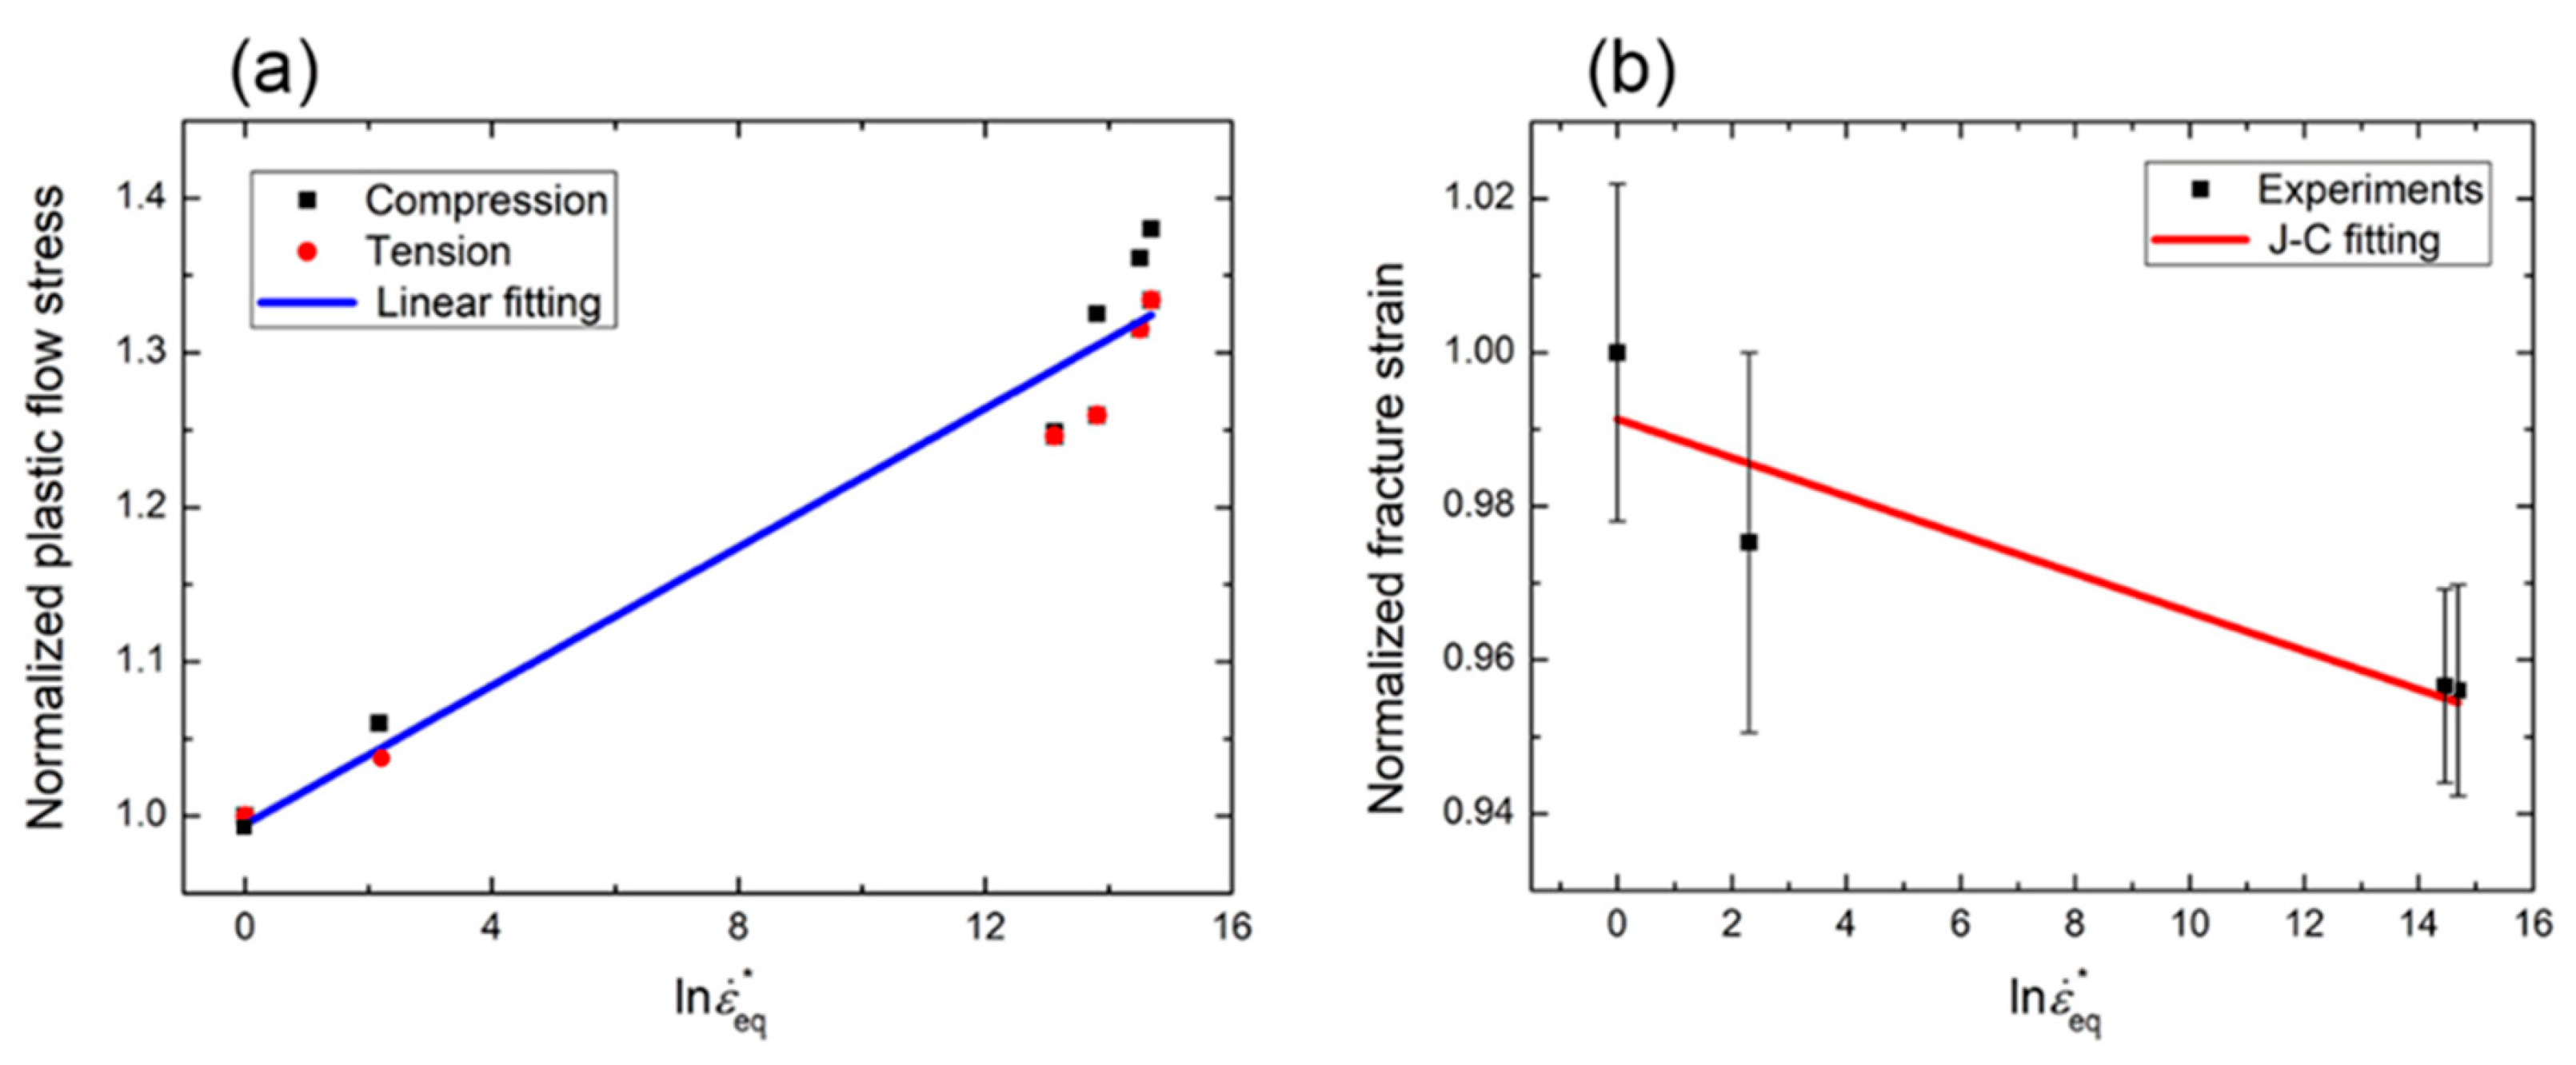
3.1. Strain Rate Effect and A, B, n, C, and D 4

The tensile and compressive stress–strain curves of the Q345C steel at different strain rates are shown in Figure 4. The tensile and compressive symmetry of the Q345C steel is good, and we use the quasi-static compression data to fit the elastic–plastic parameters A, B, and n of the J-C constitutive model through least squares minimization, which is applied for all fitting work in this study. The obtained elastic–plastic parameters of the Q345C steel are A = 374 MPa, B = 510 MPa, and n = 0.41.
Figure 5a shows the relationship between the variation of 5% flow stress with strain rate and the corresponding J-C fitting results for Q345C steel. The strain rate sensitivity factor of flow stress (C) is 0.052, and the results indicate that the Q345C steel has an obvious strain rate hardening effect. Figure 5b shows the variation in fracture strain with strain rate and the corresponding J-C fitting results for Q345C steel. The strain rate sensitivity factor ( D 4 ) of fracture strain is −0.006, which indicates that the fracture strain of Q345C steel decreases with increasing strain rate. Therefore, the Q345C steel exhibits pronounced brittleness under dynamic loading, which is similar to most of the metal materials in terms of their dynamic mechanical properties [46].

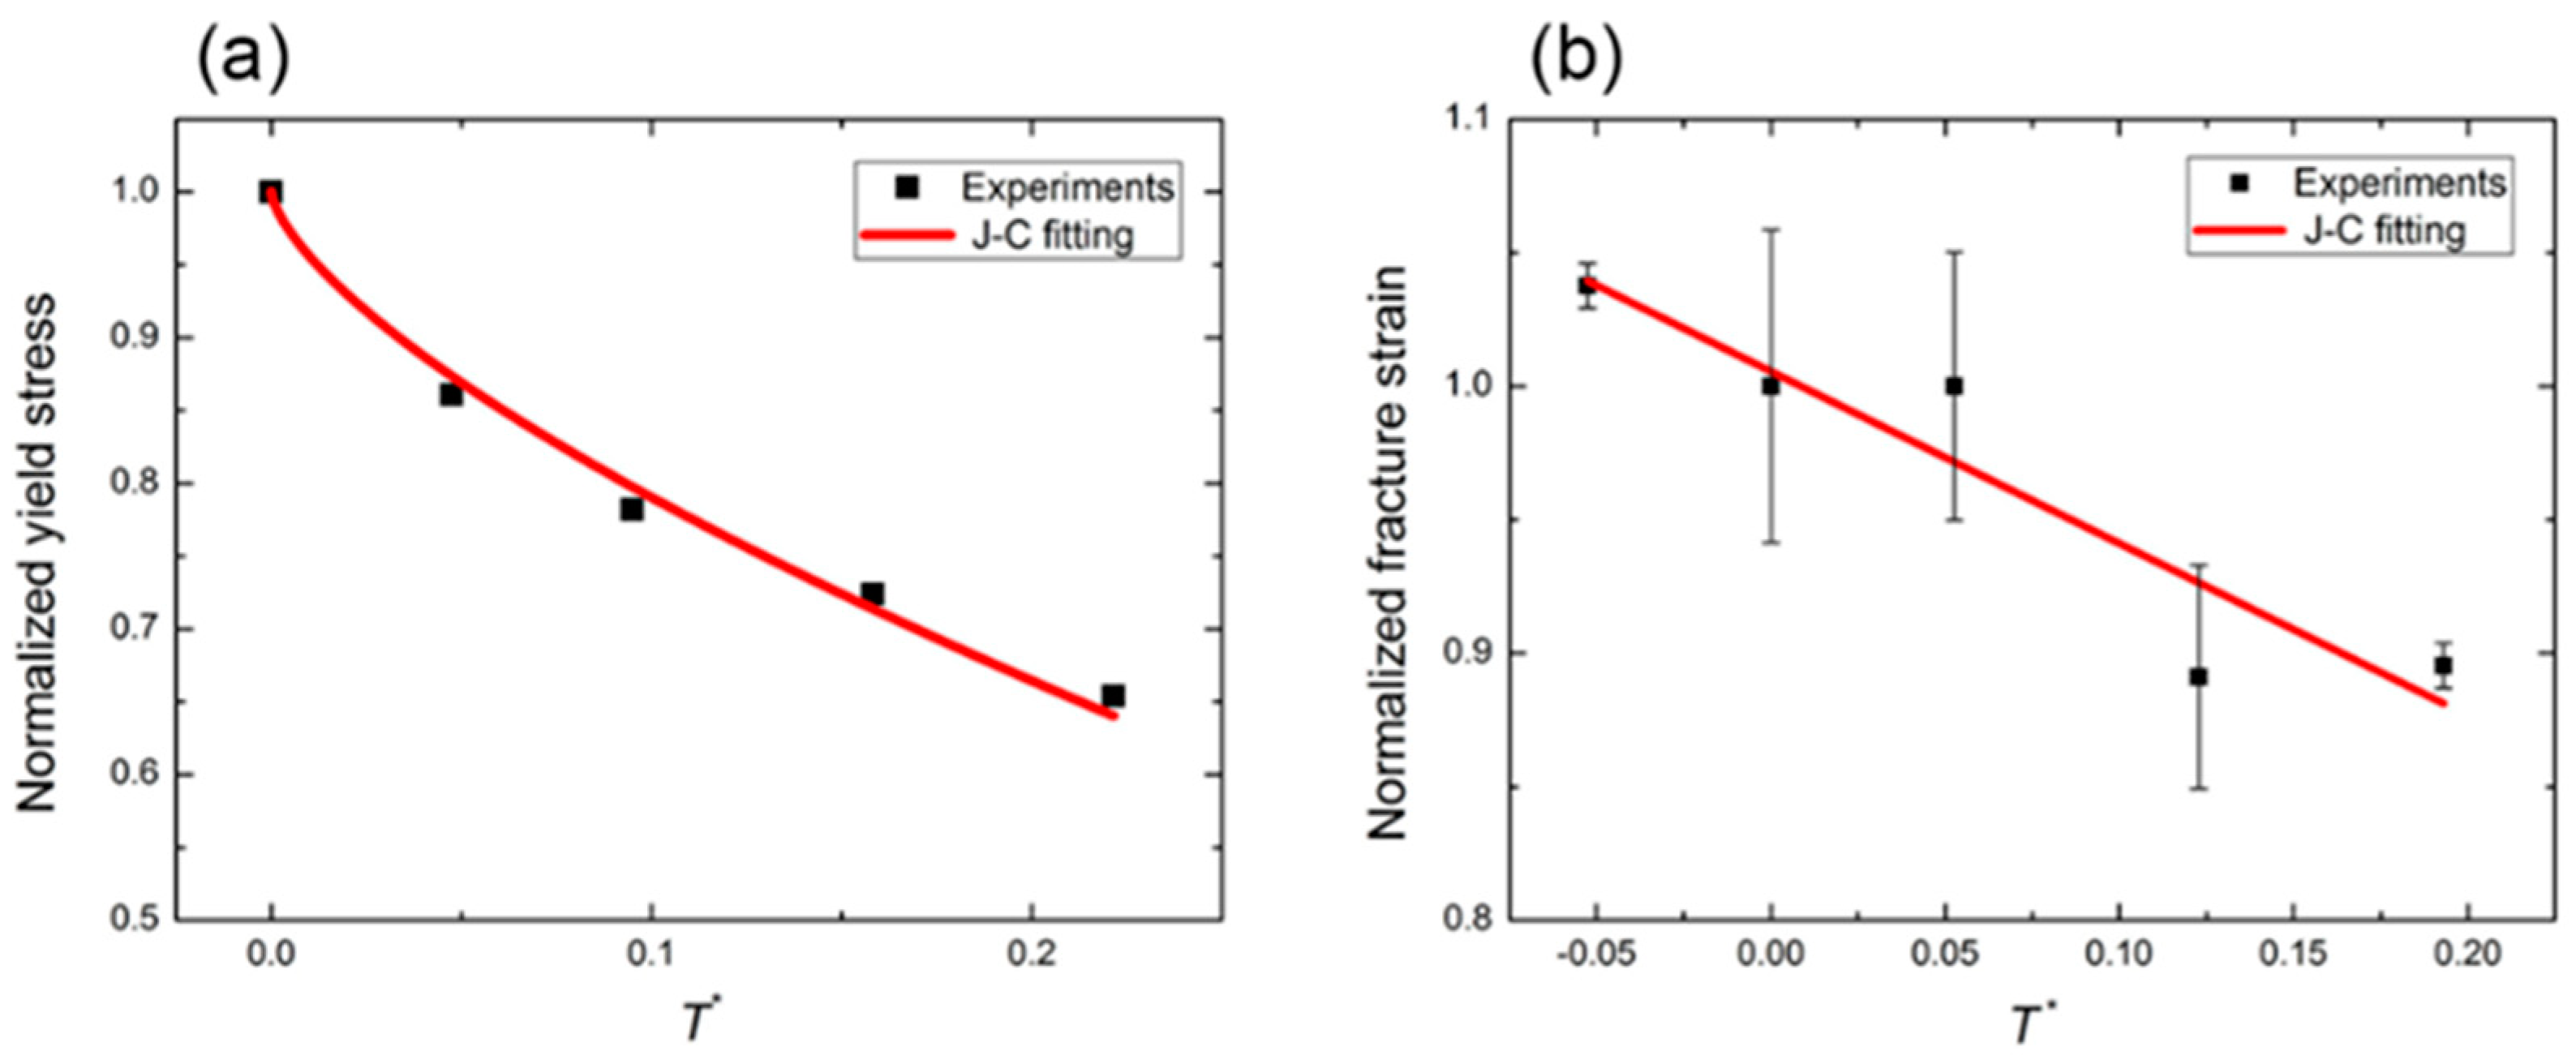
3.2. Temperature Effect and m,
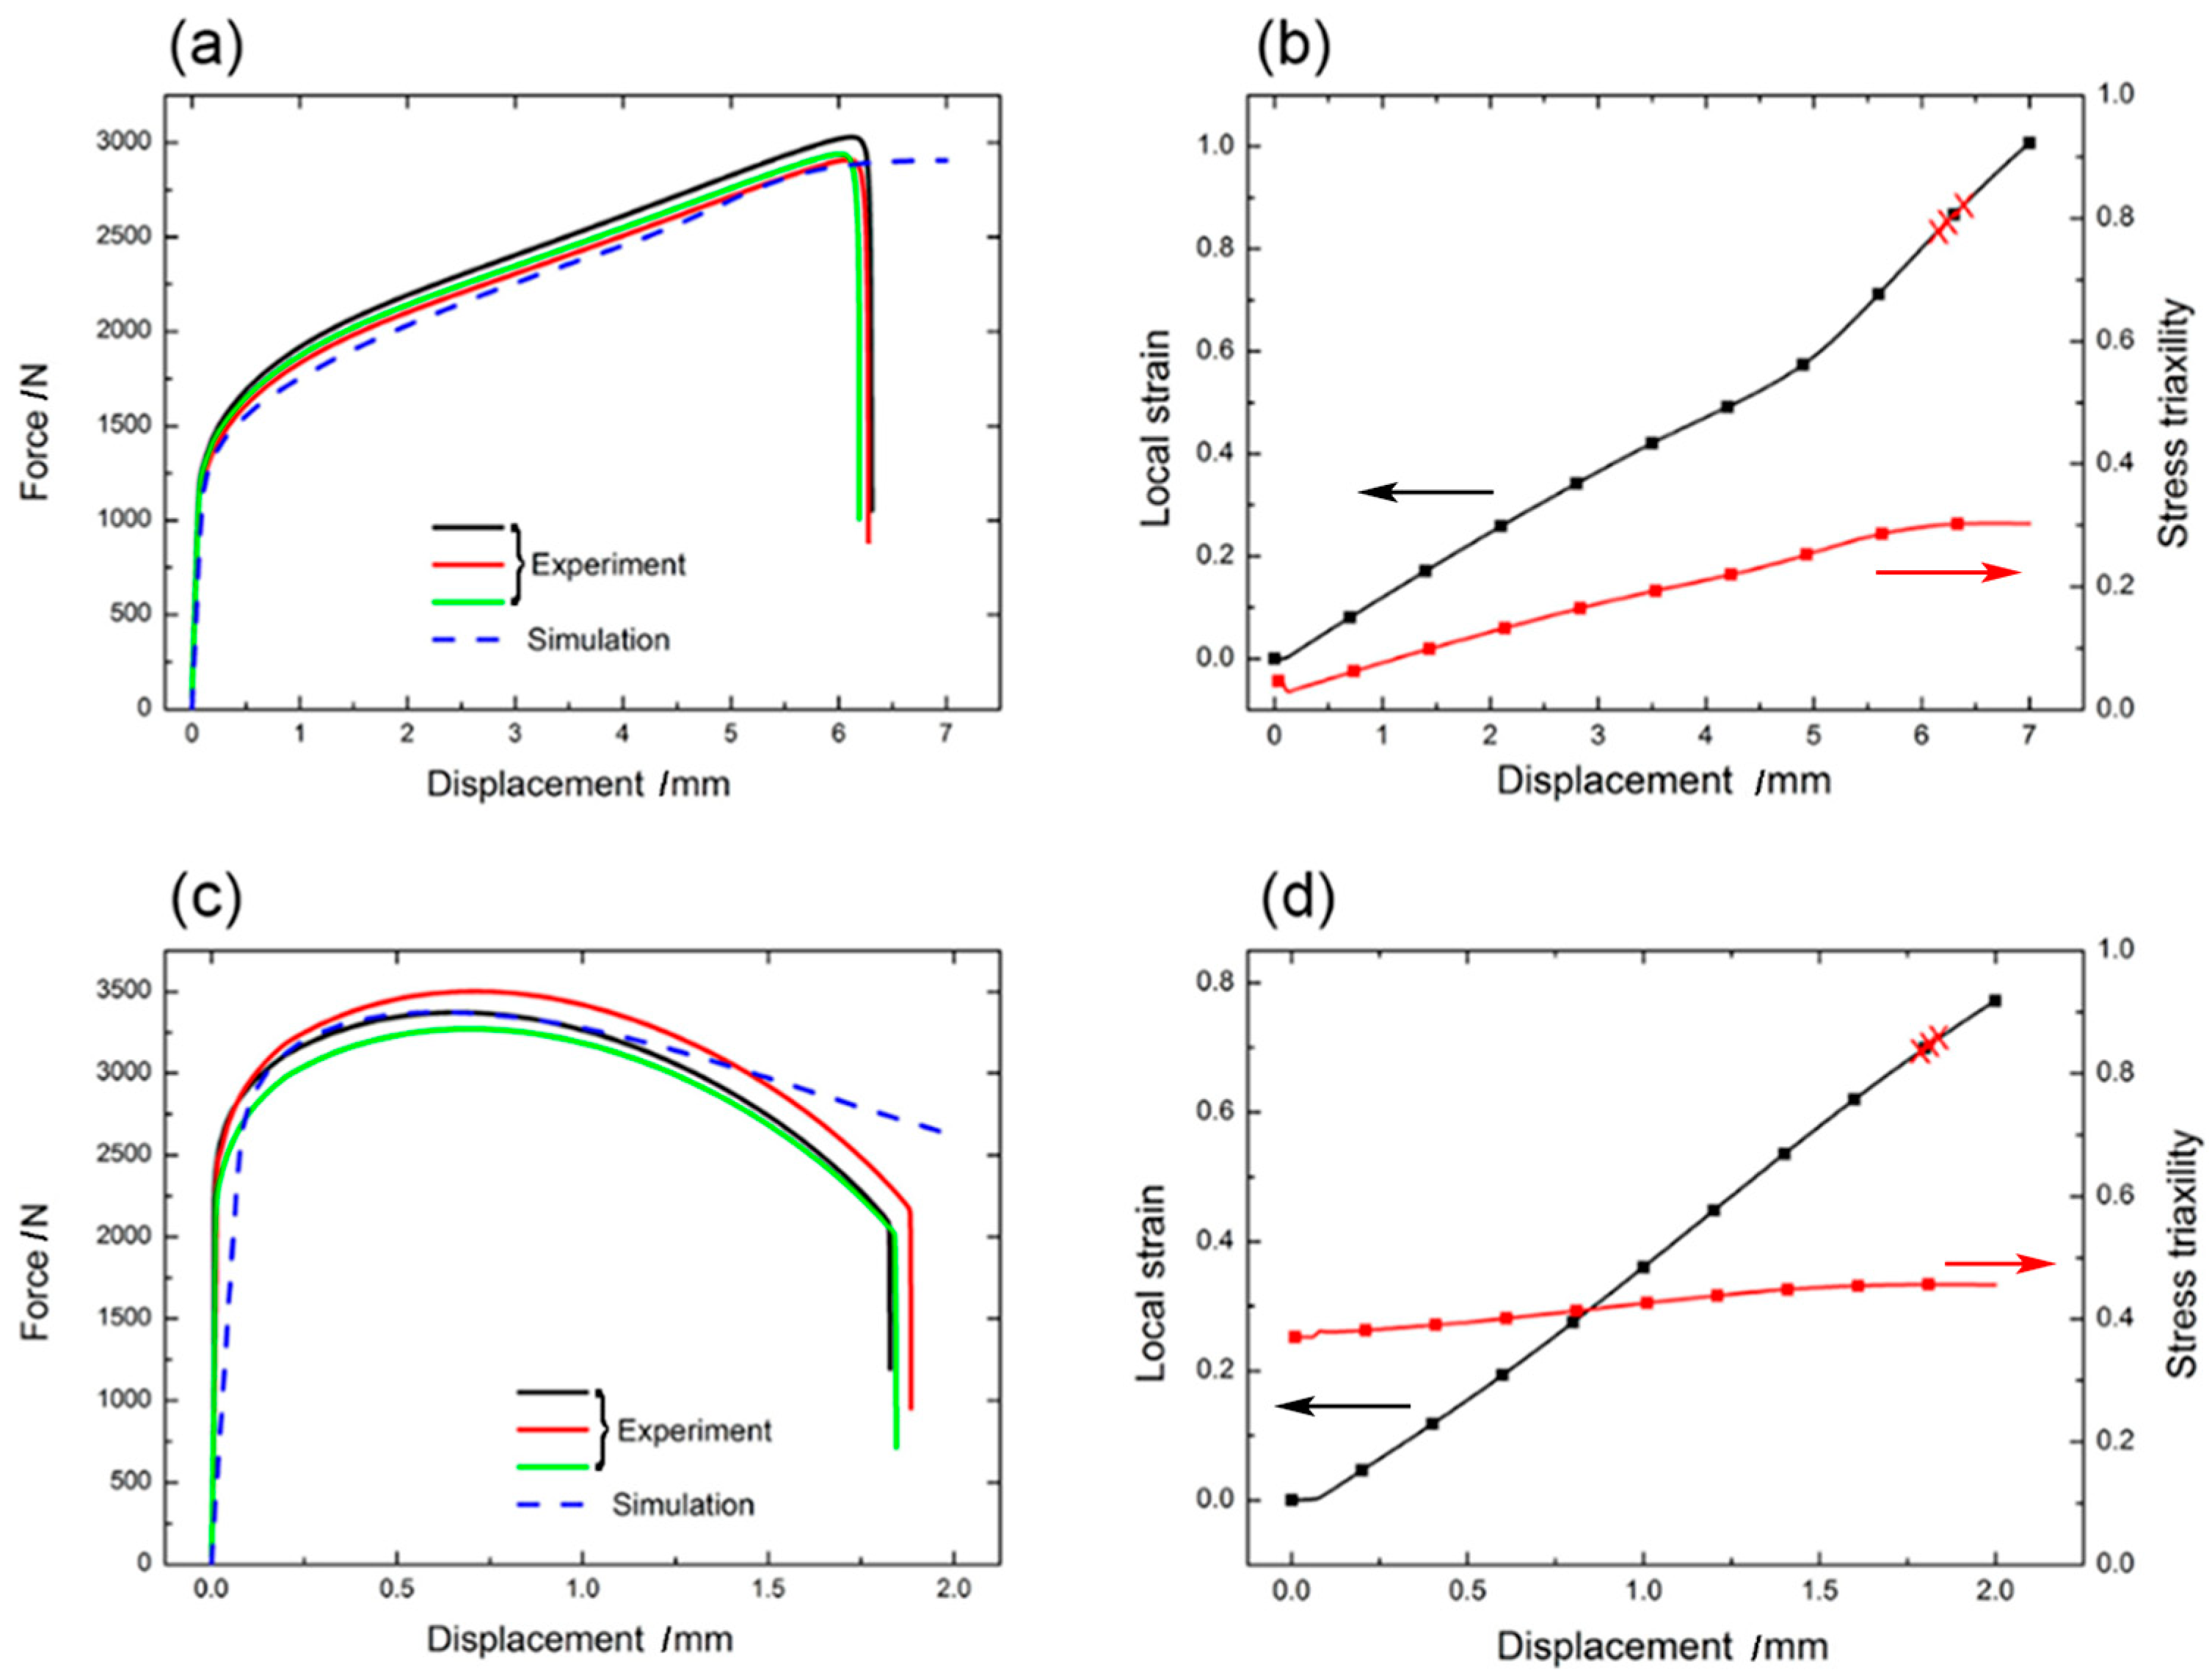
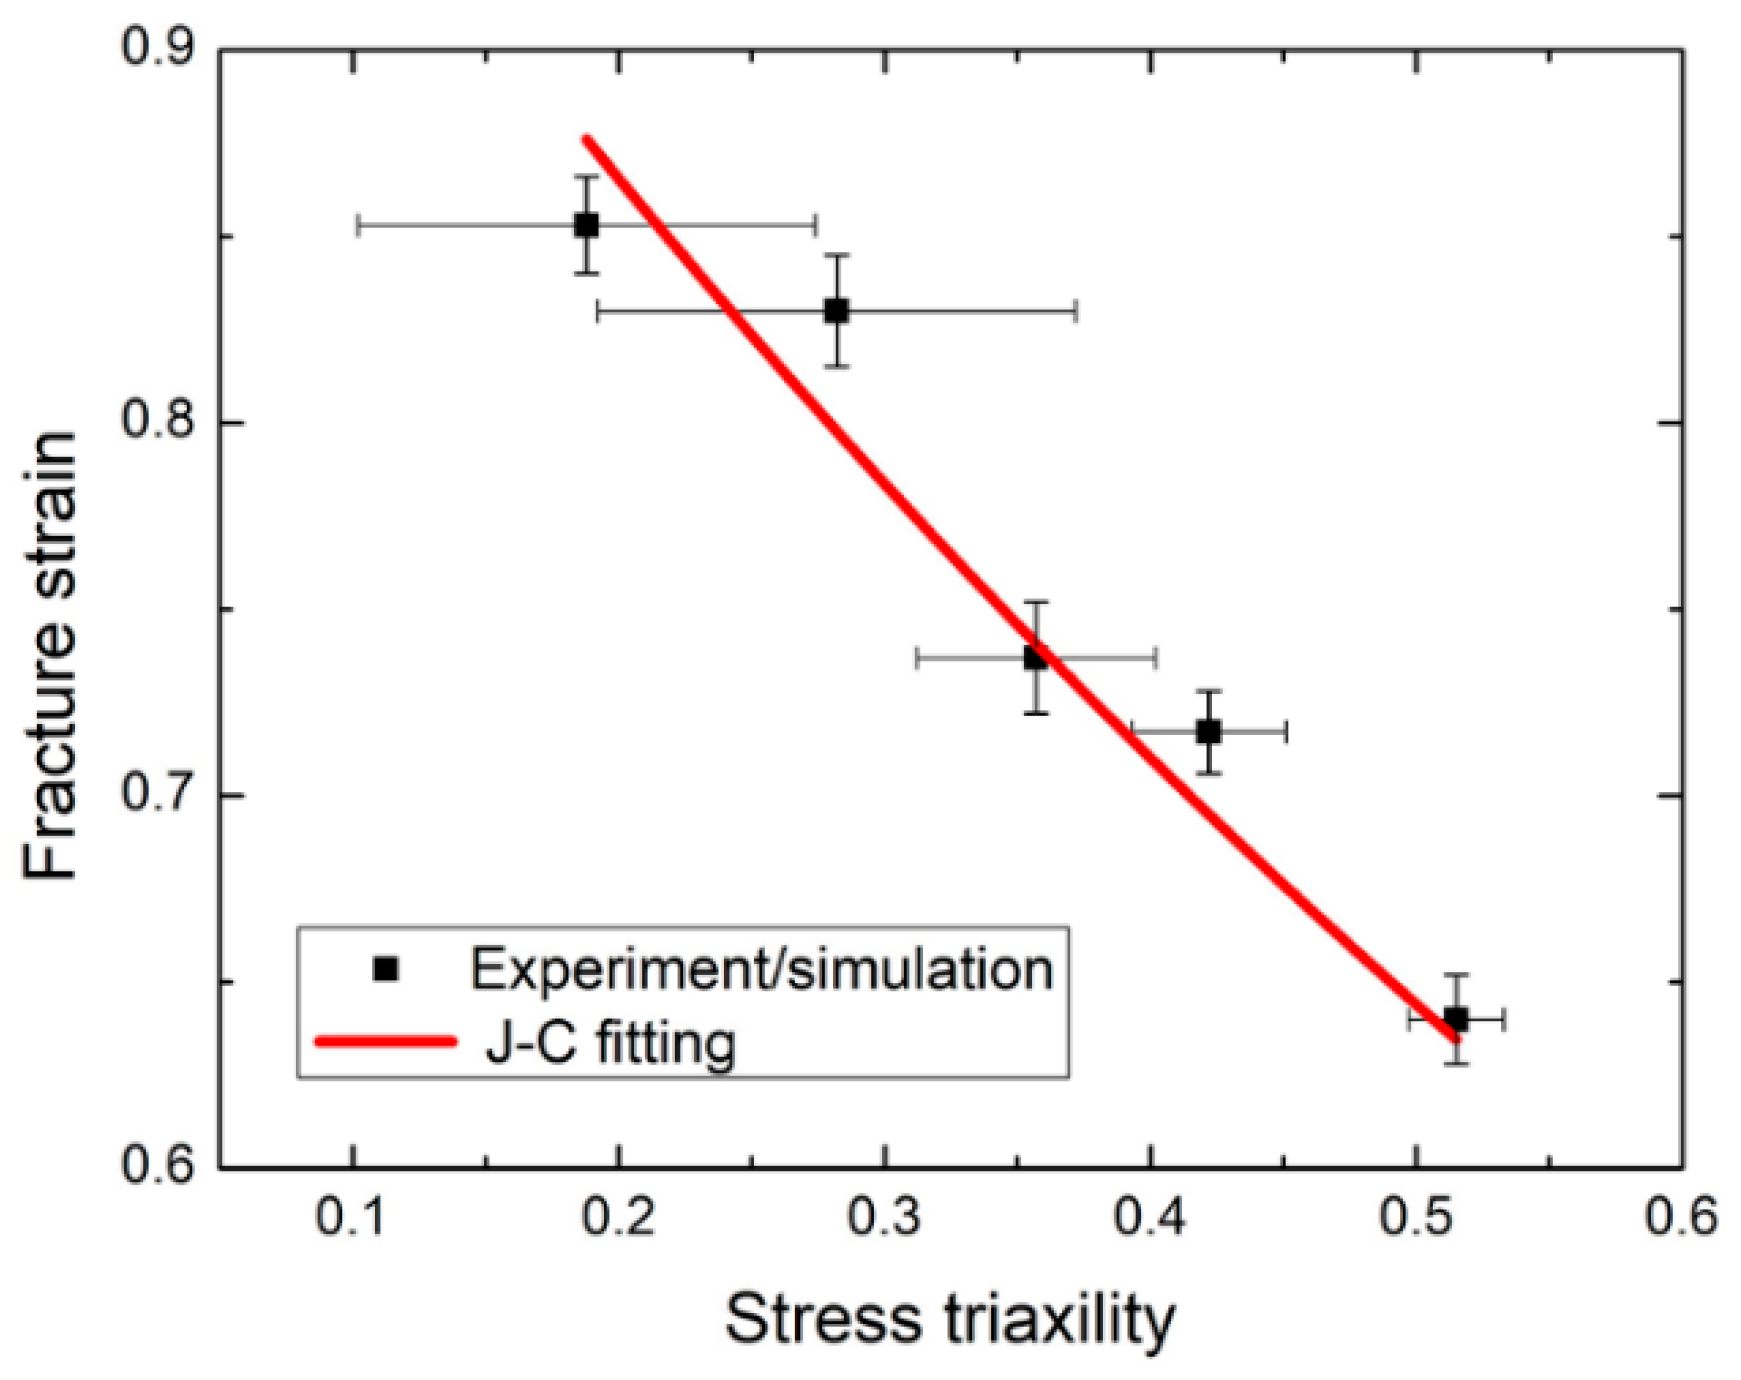
 D 5

The stress–strain curves of the Q345C steel at different temperatures are shown in Figure 6. The offset at the origin is to clearly show the elastic stage of the stress–strain curves. The figure demonstrates that the yield stress of the Q345C steel decreases with increasing temperature, and the curves at 25 °C and 100 °C appear to have a yield point elongation. However, the flow stress curves at 25 °C and 300 °C are similar and higher than the 100 °C and 200 °C curves. In addition, the fracture strain remains approximately constant at the temperature range of −50–100 °C but decreases continuously at the temperature range of 200–300 °C, indicating that the Q345C steel becomes brittle at around 300 °C temperatures, unlike general metal materials at high temperatures. A review of the previous literature [47,48] indicates that many alloy steels with a ferrite pearlite structure exhibit a decrease in toughness at around 300 °C as the temperature increases. It occurs in the temperature range where there is a blue oxide film on the surface of steel and hence is called blue brittleness. The reason for blue brittleness is the deformation aging of carbon and nitrogen interstitial atoms. When deformed within the temperature range of 150–350 °C, dislocations that have already activated are quickly anchored by diffusible carbon and nitrogen atoms, forming a Coriolis gas mass [49,50]. In order for further deformation, new dislocations must be activated, resulting in an increase in dislocation density of the steel at given strain levels, leading to an increase in strength and a decrease in toughness.
The relationship between yield strength and temperature variation is depicted in Figure 7a, and the J-C fitting results are provided as well. The temperature softening factor (m) of the Q345C steel is 0.679. The relationship between the fracture strain and temperature variation is shown in Figure 7b, with the J-C fitting results included. The temperature sensitivity index ( D 5 ) of the fracture strain of the Q345C steel obtained by J-C fitting is −0.644.

3.3. Loading Path Effect and D 1 D 3

To investigate the influence of stress triaxiality, we conducted five types of experiments under room temperature quasi-static loading, namely 0° shear, 45° shear, uniaxial tension, single-notch tension, and double-notch tension. We used finite element simulation along with calibrated J-C constitutive parameters (A, B, and n) combined with force–displacement curves obtained from experiments to calculate the local fracture strain of specimens. Next, we will focus on how to use the combined simulation–experiment method to calculate the local fracture strain for the five types of experiments. Due to space constraints and the similarity in methods and results, we will only use the examples of 0° shear and single-notch tension experiments under room temperature quasi-static loading to illustrate the aforementioned method and show the corresponding results. The method is as follows: firstly, we established the material’s elastoplastic model based on the Abaqus 2019 finite element software to simulate the 0° shear and single-notch tension experiments under room temperature and quasi-static loading, utilizing the calibrated constitutive model parameters A, B, and n (compression) from Section 3.1. The element type is selected as 3D stress in an explicit dynamic mode. The mesh size in the large deformation zone is set to 0.2 mm. However, the mesh size in the other areas is 0.2–0.5 mm and increases with increasing distance away from the deformation zone. The element type is hexahedral-dominated. A mesh size convergence study has been applied to the specimen, and it indicates that the mesh sizes above lead to stable simulation results. Then, we compared the force–displacement curves obtained from simulation with experimental curves, as shown in Figure 8a,c. From the figures, it can be seen that the simulation and experimental results match well, indicating that the stress–strain state in the simulated specimen is comparable to the experiment. Since the simulation does not include a fracture criterion, we can only determine the specimen’s fracture point based on the experimental curve. Additionally, the figures also depict the evolution of stress triaxiality in the deformation zone with macroscopic deformation, as shown in Figure 8b,d.
The relationship between the localized fracture strain of the Q345C steel and the evolution of stress triaxiality is shown in Figure 9. The error bars on the vertical axis indicate the standard deviation of the three fracture strain experimental data points. Due to multiple factors affecting the specimen’s fracture behavior, even with precise control over loading conditions and sample processing, the location and timing of specimen fracture still exhibit some randomness (material heterogeneity, initial defects, thermal fluctuations, etc. [31]). The error bars on the horizontal axis in the figure represent the degree to which stress triaxiality in the deformation zone deviates from the mean during the loading process. The combined simulation/experiment method provides stronger comparability among fracture strain data under various stress triaxialities, leading to higher credibility in fitting parameters. Figure 9 also provides the fitting results of the J-C fracture model. The parameters that describe the effect of the loading path on material fracture strain are D 1 = 0.028, D 2 = 1, and D 3 = −0.916.

3.4. Parameter Validation

Thus far, we have obtained all the J-C model parameters for the Q345C steel. The parameters of the J-C constitutive model are A = 374 MPa, B = 510 MPa, n = 0.41, C = 0.052, and m = 0.679, and the parameters of the J-C damage-fracture model are D 1 = 0.028, D 2 = 1, D 3 = −0.916, D 4 = −0.006, and D 5 = −0.644.
We carried out a plate penetration test using a one-stage light gas gun to verify the accuracy of the above parameters and the reliability of the parameter calibration method. The schematic diagrams of the test setup and projectiles are presented in Figure 10. Upon loading, the projectile was first launched into the target chamber using a 14 mm light gas gun (Figure 10a). The projectile velocity was measured by laser shielding. Then, the projectile was separated from the sabot by the forced shell remover. Finally, the projectile impacted and penetrated into the Q345C target. During the experiment, a high-speed camera was used to capture the penetration process, and a pulsed xenon lamp was used as the flash light source. The frame rate was set as 100,000 Hz, and the exposure time was 10 μs. The camera and the flash light source were both triggered by laser signals. In this study, the projectile was made of 45 steel, and the projectile shape and dimensions are shown in Figure 10b. The target plate was machined into a rectangular plate with a cross-sectional area of 100 × 100 mm 2 and a thickness of 2 mm. The steel projectile penetrated the target plate at a speed of 240 m/s. After the experiment, the target plate was recovered to observe its destructive morphology.
Meanwhile, the finite element program Abaqus 2019 was used to simulate the plate penetration process under the same conditions as those of the test, using the J-C model parameters of Q345C and those of 45 steel found in the literature [51,52] (see Table 2). It was also used to obtain the evolution of target plate penetration damage under the same projectile velocity as well as the destruction of the penetration morphology. The initial morphology of the simulation is shown in Figure 11 at the moment of 0 μs. In the simulation, the contact between the projectile and the target plate is set as follows: the normal direction is set as a hard contact, the tangential direction is set as a penalty contact, and the coefficient of friction is set as 0.3. The element type is selected as 3D stress in an explicit dynamic mode. The mesh size for the projectile is set to 1 mm, and the element type is hexahedral predominant. The elements of the target plate are divided into two parts. The mesh size of the penetration area (17.5 mm × 17.5 mm square area in the center) is set to 0.5 mm, while that of the other areas is set to 1 mm. The element types of the target are all hexahedral. A mesh size convergence study has been applied to the projectile and target, and it indicates that the mesh sizes above lead to stable simulation results.
A comparison of the penetration and fracture process of the Q345C steel target plate in the experiments and simulations is shown in Figure 11. The moment when the projectile impacts the target is selected as time zero. The position and remaining velocity of the projectile and the deformation and damage morphology of the target plate in the experiment and simulation are compared at a series of moments of 25–185 μs. The experimental and simulation curves on the projectile position (and thus the remaining velocity) are in good agreement. In addition, the bulging shape, especially the maximum bulging height (the distance between the two lines in each image), of the target plate is also compared between the experiment and simulation. The bulging shape of the target appears similar throughout the penetration process, and the maximum bulging height is approximately consistent at the same moment, indicating that the deformation and fracture morphology of the plate are similar in the experiment and simulation. Therefore, the J-C constitutive and damage-fracture model parameters obtained above are reliable, and the experimental procedures used to calibrate the model parameters are efficient, at least from a global point of view.

4. Conclusions

This study aims to obtain the Johnson-Cook (J-C) constitutive and damage-fracture models of fine-grained Q345C steel and establish a robust experimental procedure for calibrating J-C model parameters. A series of mechanical experiments were carried out on the Q345C steel using the material test system with an environmental chamber and the split Hopkinson pressure/tension bar. The parameters of the Johnson-Cook (J-C) constitutive and damage-fracture models were derived from the experimental data. To calibrate the damage model parameters related to stress paths, a new method of combining experiments and simulations was proposed to obtain the real, local fracture strains of the Q345C steel samples. This method allows the measurements of equivalent plastic strain and stress triaxiality histories under complex stress paths and facilitates the accurate calibration of stress-path-related damage parameters. In addition, a high-speed plate penetration test was adopted to validate the J-C model parameters, which can be directly implemented in the commercial finite element software Abaqus 2019. The projectile trajectories and target morphologies in the simulation and experiment agree well with each other, demonstrating the reliability of the model parameters for impact scenarios and the efficiency of the experimental procedures used for calibration, at least from a global point of view. In addition, regarding the mechanical properties of Q345C steel, the following conclusions can be drawn. The Q345C steel exhibits good tensile–compressive symmetry. The strain rate shows a significant influence on the flow stress and fracture strain of the Q345C steel. The flow stress increases while the fracture strain decreases with increasing strain rate, indicating considerable hardening and brittleness of the Q345C steel under dynamic loading. The yield stress of the Q345C steel decreases with increasing temperature from −50–300 °C, and the curves at 25 °C and 100 °C appear to have a yield point elongation. However, the flow stress curves at 25 °C and 300 °C are similar and higher than the 100 °C and 200 °C curves. In addition, the fracture strain remains approximately constant at the temperature range of −50–100 °C but decreases continuously at the temperature range of 200–300 °C, indicating that the Q345C steel becomes brittle at around 300 °C temperatures due to the blue brittleness phenomenon resulting from deformation aging of carbon and nitrogen interstitial atoms. As the stress triaxiality increases, the fracture strain of the Q345C steel decreases significantly, consistent with the theoretical predictions of the J-C model.

Author Contributions

Conceptualization, F.H. and Y.X.; methodology, Y.X.; software, X.L. and B.W.; validation, Y.X. and F.H.; formal analysis, X.L. and B.W.; investigation, F.H. and B.W.; writing—original draft, F.H.; writing—review and editing, F.H., X.L. and B.W. All authors have read and agreed to the published version of the manuscript.

Funding

This research received no external funding.

Data Availability Statement

The raw data supporting the conclusions of this article will be made available by the authors upon request.

Conflicts of Interest

The authors declare no conflicts of interest.

References

  1. Mengge, Y.; Jiye, Z.; Weihua, Z. Operational Safety Reliability of High-Speed Trains under Stochastic Winds. Chin. J. Theor. Appl. Mech. 2013, 45, 483–492. [Google Scholar]
  2. Chunlan, W.; Yuxin, S.; Chen, L. Safety Assessment and Risk Control of High-Speed Trains Passenger Transportation. China Saf. Sci. J. 2019, 29, 150. [Google Scholar]
  3. Guo, W.; Xia, H.; Karoumi, R.; Zhang, T.; Li, X. Aerodynamic Effect of Wind Barriers and Running Safety of Trains on High-Speed Railway Bridges under Cross Winds. Wind Struct. 2015, 20, 213–236. [Google Scholar] [CrossRef]
  4. Jin, X.; Xiao, X.; Ling, L.; Xiong, J. Study on Safety Boundary for High-Speed Train Running in Severe Environments. Int. J. Rail Transp. 2013, 1, 87–108. [Google Scholar] [CrossRef]
  5. Cai, C.; Zhao, C.; Luo, Q.; Xie, Y.; Xia, H.; Li, G.; Song, X.; Zhai, W. Basic scientific issues on dynamic performance evolution of the high-speed railway infrastructure and its service safety. Sci. Sin.-Tech. 2014, 44, 645–660. [Google Scholar] [CrossRef]
  6. Wu, W.; Liu, Q.; Zong, Z.; Sun, G.; Li, Q. Experimental Investigation into Transverse Crashworthiness of CFRP Adhesively Bonded Joints in Vehicle Structure. Compos. Struct. 2013, 106, 581–589. [Google Scholar] [CrossRef]
  7. Zhu, T.; Xiao, S.-N.; Hu, G.-Z.; Yang, G.-W.; Yang, C. Crashworthiness Analysis of the Structure of Metro Vehicles Constructed from Typical Materials and the Lumped Parameter Model of Frontal Impact. Transport 2019, 34, 75–88. [Google Scholar] [CrossRef]
  8. Chen, Y.; Cheng, X.; Fu, K. Multi-Material Design of a Vehicle Body Considering Crashworthiness Safety and Social Effects. Int. J. Crashworthiness 2019, 25, 517–526. [Google Scholar] [CrossRef]
  9. Temel, S.; Vuran, M.C.; Lunar, M.M.; Zhao, Z.; Salam, A.; Faller, R.K.; Stolle, C. Vehicle-to-Barrier Communication during Real-World Vehicle Crash Tests. Comput. Commun. 2018, 127, 172–186. [Google Scholar] [CrossRef]
  10. Basith, M.A.; Reddy, N.C.; Uppalapati, S.; Jani, S. Crash Analysis of a Passenger Car Bumper Assembly to Improve Design for Impact Test. Mater. Today Proc. 2021, 45, 1684–1690. [Google Scholar] [CrossRef]
  11. Zhou, D.; Li, R.; Wang, J.; Guo, C. Study on Impact Behavior and Impact Force of Bridge Pier Subjected to Vehicle Collision. Shock Vib. 2017, 2017, 7085392. [Google Scholar] [CrossRef]
  12. Nanda, T.; Singh, V.; Singh, G.; Singh, M.; Kumar, B.R. Processing Routes, Resulting Microstructures, and Strain Rate Dependent Deformation Behaviour of Advanced High Strength Steels for Automotive Applications. Archiv. Civ. Mech. Eng. 2021, 21, 7. [Google Scholar] [CrossRef]
  13. Jia, N.; Zhang, H.; Liu, X.; Cai, M. Research on Fire Resistance of Stainless Steel Car Body Floor Structure in Urban Rail Vehicles. In Proceedings of the IMECE2020, International Mechanical Engineering Congress and Exposition, Online, 16 November 2020. Volume 6: Design, Systems, and Complexity. [Google Scholar]
  14. Song, I.-H.; Kim, J.-W.; Koo, J.-S.; Lim, N.-H. Modeling and Simulation of Collision-Causing Derailment to Design the Derailment Containment Provision Using a Simplified Vehicle Model. Appl. Sci. 2019, 10, 118. [Google Scholar] [CrossRef]
  15. Tang, Z.; Zhu, Y.; Nie, Y.; Guo, S.; Liu, F.; Chang, J.; Zhang, J. Data-Driven Train Set Crash Dynamics Simulation. Veh. Syst. Dyn. 2017, 55, 149–167. [Google Scholar] [CrossRef]
  16. Cole, C.; Spiryagin, M.; Wu, Q.; Sun, Y.Q. Modelling, Simulation and Applications of Longitudinal Train Dynamics. Veh. Syst. Dyn. 2017, 55, 1498–1571. [Google Scholar] [CrossRef]
  17. Johnson, G. A Constitutive Model and Date for Metals Subject to Large Strains, High Strain Rate and High Temperatures. In Proceedings of the 7th International Symposium on Ballistics, The Hague, The Netherlands, 19–21 April 1983. [Google Scholar]
  18. Kumar Reddy Sirigiri, V.; Yadav Gudiga, V.; Shankar Gattu, U.; Suneesh, G.; Mohan Buddaraju, K. A Review on Johnson Cook Material Model. Mater. Today Proc. 2022, 62, 3450–3456. [Google Scholar] [CrossRef]
  19. Jutras, M. Improvement of the Characterisation Method of the Johnson-Cook Model. Master’s Thesis, Université Laval, Québec, QC, Canada, 2008. [Google Scholar]
  20. Zhu, H.; Zhang, C.; Chen, S.; Wu, J. A Modified Johnson-Cook Constitutive Model for Structural Steel after Cooling from High Temperature. Constr. Build. Mater. 2022, 340, 127746. [Google Scholar] [CrossRef]
  21. Li, H.; Li, F.; Zhang, R.; Zhi, X. High Strain Rate Experiments and Constitutive Model for Q390D Steel. J. Constr. Steel Res. 2023, 206, 107933. [Google Scholar] [CrossRef]
  22. Zhang, D.-N.; Shangguan, Q.-Q.; Xie, C.-J.; Liu, F. A Modified Johnson–Cook Model of Dynamic Tensile Behaviors for 7075-T6 Aluminum Alloy. J. Alloys Compd. 2015, 619, 186–194. [Google Scholar] [CrossRef]
  23. Yu, W.; Zhao, J.; Shi, J. Dynamic Mechanical Behaviour of Q345 Steel at Elevated Temperatures: Experimental Study. Mater. High Temp. 2010, 27, 285–293. [Google Scholar] [CrossRef]
  24. Sahu, S.; Pada Mondal, D.; Dass Goel, M.; Mohd, Z.A. Finite Element Analysis of AA1100 Elasto-Plastic Behaviour Using Johnson-Cook Model. Mater. Today Proc. 2018, 5, 5349–5353. [Google Scholar] [CrossRef]
  25. Saxena, A.; Dwivedi, S.P.; Kumaraswamy, A.; Srivastava, A.K.; Maurya, N.K. Influence of SD Effect on Johnson–Cook Hardening Constitutive Material Model: Numerical and Experimental Investigation for Armor Steel. Mech. Adv. Mater. Struct. 2022, 29, 285–302. [Google Scholar] [CrossRef]
  26. Shrot, A.; Bäker, M. Determination of Johnson–Cook Parameters from Machining Simulations. Comput. Mater. Sci. 2012, 52, 298–304. [Google Scholar] [CrossRef]
  27. Korkmaz, M.E. Verification of Johnson-Cook Parameters of Ferritic Stainless Steel by Drilling Process: Experimental and Finite Element Simulations. J. Mater. Res. Technol. 2020, 9, 6322–6330. [Google Scholar] [CrossRef]
  28. Zhou, J.; Liu, J.; Zhang, X.; Yan, Y.; Jiang, L.; Mohagheghian, I.; Dear, J.P.; Charalambides, M.N. Experimental and Numerical Investigation of High Velocity Soft Impact Loading on Aircraft Materials. Aerosp. Sci. Technol. 2019, 90, 44–58. [Google Scholar] [CrossRef]
  29. Liu, P.; Quan, Y.; Ding, G. Dynamic Mechanical Characteristics and Constitutive Modeling of Rail Steel over a Wide Range of Temperatures and Strain Rates. Adv. Mater. Sci. Eng. 2019, 2019, 6862391. [Google Scholar] [CrossRef]
  30. Zhao, G.; Tian, Y.; Song, Y.; Li, J.; Li, H.; Zhang, J. A Comparative Study of Three Constitutive Models Concerning Thermo-Mechanical Behavior of Q345 Steel during Hot Deformation. Crystals 2022, 12, 1262. [Google Scholar] [CrossRef]
  31. Wang, X.; Shi, J. Validation of Johnson-Cook Plasticity and Damage Model Using Impact Experiment. Int. J. Impact Eng. 2013, 60, 67–75. [Google Scholar] [CrossRef]
  32. He, B.L.; Yu, Y.X.; Liu, J. Research and Prospects of Improving the Fatigue Life of Wleded Train Bogie Structure. Adv. Mater. Res. 2011, 189, 3292–3295. [Google Scholar]
  33. Qin, Y.; Yao, X.; Wang, Z.; Wang, Y. Experimental Investigation on Damage Features of Stiffened Cabin Structures Subjected to Internal Blast Loading. Ocean Eng. 2022, 265, 112639. [Google Scholar] [CrossRef]
  34. Wu, Y.S.; Liu, Y.J. Study on Ductile Brittle Transition Temperature of Q345C Steel MAG Welded Joints. Key Eng. Mater. 2016, 703, 155–159. [Google Scholar]
  35. Ma, C.; Fu, H.; Lu, P.; Lu, H. Multi-Objective Crashworthiness Design Optimization of a Rollover Protective Structure by an Improved Constraint-Handling Technique. AIMS Press 2023, 31, 4278–4302. [Google Scholar] [CrossRef]
  36. Liu, C.; Hao, E.; Zhang, S. Optimization and Application of a Crashworthy Device for the Monopile Offshore Wind Turbine against Ship Impact. Appl. Ocean Res. 2015, 51, 129–137. [Google Scholar] [CrossRef]
  37. Wang, D.; Xu, P.; Yang, C.; Yao, S.; Liu, Z. Crashworthiness Performance of Gradient Energy-Absorbing Structure for Subway Vehicles under Quasi-Static Loading. AIMS Press 2023, 31, 3568–3593. [Google Scholar] [CrossRef]
  38. Sun, H.; Ma, Y.; Cai, Q.; Zhou, G.; Duan, Y.; Zhang, M. Study on the Effect of Impact on the Macro-and Micro-Structure of Q345 Steel Plate. J. Mater. Eng. Perform. 2023, 1–15. [Google Scholar] [CrossRef]
  39. Lin, Z.; Zihao, W.; Heming, W. On the Accuracy of the Johnson-Cook Constitutive Model for Metals. Chin. J. High Press. Phys. 2019, 33, 1. [Google Scholar]
  40. Johnson, G.R.; Cook, W.H. Fracture Characteristics of Three Metals Subjected to Various Strains, Strain Rates, Temperatures and Pressures. Eng. Fract. Mech. 1985, 21, 31–48. [Google Scholar] [CrossRef]
  41. Quanjin, M.; Rejab, M.; Halim, Q.; Merzuki, M.; Darus, M. Experimental Investigation of the Tensile Test Using Digital Image Correlation (DIC) Method. Mater. Today Proc. 2020, 27, 757–763. [Google Scholar] [CrossRef]
  42. Wang, L.; Hu, S.; Yang, L.; Sun, Z.; Zhu, J.; Lai, H.; Ding, Y. Development of Experimental Methods for Impact Testing by Combining Hopkinson Pressure Bar with Other Techniques. Acta Mech. Solida Sin. 2014, 27, 331–344. [Google Scholar] [CrossRef]
  43. Dou, Q.; Wu, K.; Suo, T.; Zhang, C.; Guo, X.; Guo, Y.; Guo, W.; Li, Y. Experimental Methods for Determination of Mechanical Behaviors of Materials at High Temperatures via the Split Hopkinson Bars. Acta Mech. Sin. 2020, 36, 1275–1293. [Google Scholar] [CrossRef]
  44. GB/T 228.1-2021; Metallic Materials—Tensile Testing—Part 1: Method of Test at Room Temperature. Standards Press of China: Beijing, China, 2021.
  45. Wu, X.; Wang, X.; Wei, Y.; Song, H.; Huang, C. An Experimental Method to Measure Dynamic Stress–Strain Relationship of Materials at High Strain Rates. Int. J. Impact Eng. 2014, 69, 149–156. [Google Scholar] [CrossRef]
  46. Wang, Y.; Zhou, H.; Shi, Y.; Chen, H. Study on Fracture Toughness Indices of Chinese Structural Steel and Weld Metal. In Proceedings of the ISOPE International Ocean and Polar Engineering Conference, Beijing, China, 20–25 June 2010; p. ISOPE-I. [Google Scholar]
  47. Gutiérrez, I. Effect of Microstructure on the Impact Toughness of Nb-Microalloyed Steel: Generalisation of Existing Relations from Ferrite–Pearlite to High Strength Microstructures. Mater. Sci. Eng. A 2013, 571, 57–67. [Google Scholar] [CrossRef]
  48. Wang, M.; Zhang, F.; Yang, Z. Effects of High-Temperature Deformation and Cooling Process on the Microstructure and Mechanical Properties of an Ultrahigh-Strength Pearlite Steel. Mater. Des. 2017, 114, 102–110. [Google Scholar] [CrossRef]
  49. Liu, W.; Lian, J. Stress-State Dependence of Dynamic Strain Aging: Thermal Hardening and Blue Brittleness. Int. J. Miner. Metall. Mater. 2021, 28, 854–866. [Google Scholar] [CrossRef]
  50. Song, Y.; Wang, S.; Zhao, G.; Li, Y.; Juan, L.; Jian, Z. Hot Deformation Behavior and Microstructural Evolution of 2205 Duplex Stainless Steel. Mater. Res. Express 2020, 7, 046510. [Google Scholar] [CrossRef]
  51. Gang, C.; Chen, Z.; Tao, J.; Niu, W.; Zhang, Q.; Huang, X. Investigation and Validation on Plastic Constitutive Parameters of 45 Steel. J. Vib. Shock 2005, 25, 451–456. [Google Scholar]
  52. Gang, C.; Chen, Z.; Xu, W.; Chen, Y.; Huang, X. Investigation on the J-C Ductile Fracture Parameters of 45 Steel. J. Vib. Shock 2007, 27, 131–135. [Google Scholar]
Figure 1. EBSD orientation map of the initial Q345C steel. RD in the figure indicates the rolling direction of the material plate.
Metals 14 00509 g001
Figure 2. Pictures of the experimental setups: (a) servo-hydraulic material test system, (b) split Hopkinson pressure bar, and (c) split Hopkinson tension bar.
Metals 14 00509 g002
Figure 3. Configuration and geometry of the test samples for (a) quasi-static tension, (b) dynamic tension, (c) 0° shear, (d) 45° shear, (e) single-notch tension, (f) double-notch tension, (g) quasi-static compression, and (h) dynamic compression. The sizes are all in the units of millimeters.
Metals 14 00509 g003
Figure 4. Summary of the tensile and compressive stress–strain curves of the Q345C steel under different strain rates: (a) tensile; (b) compressive.
Metals 14 00509 g004
Figure 5. (a) Relationship between the normalized 5% flow stress and logarithm of strain rate. (b) Relationship between the normalized fracture strain and logarithm of strain rate.
Metals 14 00509 g005
Figure 6. Summary of the tensile stress–strain curves of the Q345C steel at different temperatures.
Metals 14 00509 g006
Figure 7. (a) Relationship between the normalized yield stress and normalized temperature. (b) Relationship between the normalized fracture strain and normalized temperature.
Metals 14 00509 g007
Figure 8. Comparison of the simulation and test force–displacement curves for the (a) 0-degree shear test and (c) single-notch tensile test. The history curves of the equivalent strain and stress triaxiality in the deformation zone in the simulation for the (b) 0-degree shear test and (d) single-notch tensile test. Symbols ‘x’ in the equivalent strain history curves in figures (b,d) mark the fracture points of specimens.
Metals 14 00509 g008
Figure 9. Relationship between the local fracture strain of the Q345C steel and stress triaxiality.
Metals 14 00509 g009
Figure 10. Schematic diagrams of the test setup (a) and projectile (b) in the penetration test. Symbols C and C-C refer to the section line and sectional surface, respectively.
Metals 14 00509 g010
Figure 11. Comparison of the test and simulation results on the penetration failure process of the Q345C steel target. (a) Experimental images and simulation configurations of the projectile and target. Color coding represents the particle velocity. (b) Projectile position and maximum bulging height of target in the experiment and simulation.
Metals 14 00509 g011
Table 1. Chemical composition of the Q345C steel.
Composition (wt. %)CSiMnPSVTi
0.180.451.450.030.020.180.12
Table 2. Summary of Q345C steel and 45 steel J-C constitutive and damage-fracture model parameters.
MaterialA/MPaB/MPanCmD1D2D3D4D5
Q345C steel3745100.410.0520.6790.0281−0.916−0.006−0.644
45 steel5073200.280.0641.060.1000.761.570.005−0.84
Disclaimer/Publisher’s Note: The statements, opinions and data contained in all publications are solely those of the individual author(s) and contributor(s) and not of MDPI and/or the editor(s). MDPI and/or the editor(s) disclaim responsibility for any injury to people or property resulting from any ideas, methods, instructions or products referred to in the content.

