Abstract
Estimates of physical and mechanical characteristics of materials at high strain rates play a key role in enhancing the accuracy of prediction of the stress–strain state of structures operating in extreme conditions. This article presents the results of a combined experimental–numerical study on the mechanical response of a thin-sheet rolled Ti-5Al-2.5Sn alloy to dynamic penetration. A specimen of a titanium alloy plate underwent punching with a hemispherical indenter at loading rates of 10, 5, 1, and 0.5 m/s. The evolution of the rear surface of specimens and crack configuration during deformation were observed by means of high-speed photography. Numerical simulations were performed to evaluate stress distribution in a titanium plate under specified loading conditions. To describe the constitutive behavior and fracture of the Ti-5Al-2.5Sn alloy at moderate strain rates, a physical-based viscoplastic material model and damage nucleation and growth relations were adopted in the computational model. The results of simulations confirm a biaxial stress state in the center of specimens prior to fracture initiation. The crack shapes and plate deflections obtained in the calculations are similar to those observed in experiments during dynamic punching.
1. Introduction
Alpha-titanium alloys exhibit excellent oxidation resistance and good weldability, but are extremely difficult to cut [1,2,3]. Among the different titanium alloys, the Ti-5Al-2.5Sn alloy possesses relatively high fracture toughness and is attractive to use as a material for structures operating both at extremely low and elevated temperatures up to 753 K [4]. Therefore, the production of thin-walled structural elements from the Ti-5Al-2.5Sn alloy using forging methods covers high rate loading modes [5]. High-speed forming technologies are currently used in the manufacture of structural elements from rolled sheets of alpha- and pseudo-alpha-titanium alloys, including advanced technologies such as electromagnetic forming, electrohydraulic forming, explosive forming, and impact hydroforming. Dynamic stamping has also become a promising technological area for the manufacture of thin-walled titanium structural elements [6,7]. Stamping process stability depends on many factors, including the strain rate, stress state, and the distribution of plastic strain across the thickness of the sheet, as well as the occurrence of macrocracks and the development of microvoids and microdamage.
The relatively high processing costs of titanium alloys require the improvement of calculation methods, constitutive models, and algorithms for their implementation in computer-aided engineering packages. The results of recent studies show that tests carried out under complex stress states allow one to obtain more comprehensive information on the mechanical behavior of materials and industrial products during their manufacture and operation [8,9,10]. A series of mechanical characteristics, including tensile and compressive yield strengths, ultimate strain, strain hardening capacity, and fracture toughness, are used in the computer-aided design of lightweight and robust structures. To date, there is no uniform approach to determine these properties of materials under complex stress states and in wide ranges of strain rates and temperatures [9,10,11,12,13,14].
It is well known that the motion of dislocations takes place along certain crystallographic planes in the material grain, which causes the negligible sensitivity of plastic flow to the pressure value in alloys [15]. On the other hand, processes of deformation localization and the development of damage at the mesoscopic level are sensitive to the pressure. The data from uniaxial experiments on the forces and displacements of the gauge section of samples do not enable to split the contributions of pressure sensitive processes to the integral macroscopic response of the material. The tension–compression asymmetry can be associated both with the features of material texture influencing the formation of dislocation substructures and the effects of plastic flow instability. Therefore, advanced calibration data, obtained with varying the stress state and the specimen’s angles to the rolling direction, do not guarantee the adequacy and increased accuracy of engineering analyses.
In a number of recent studies, the mechanical behavior of light alloys under high strain rates was studied using the inverse modeling method involving the dynamic punch test with a hemispherical indenter [9,16,17]. Quasi-static and dynamic punch tests using hemispherical indenters are carried out on thin samples of metals and alloys in accordance with accepted standards (ASTM E3205, BS EN 10371, CWA 15627, GOST 10510-80, and GB/T 29459) [18,19]. The application of a combination of hemispherical indenters and thin plates of metals and alloys in punch tests allows one to study the mechanical behavior of materials under stress state close to equal-biaxial tension [20,21]. Such loading conditions acquire particular importance for the manufacturing industry, because titanium alloys, including Ti-5Al-2.5Sn, are prone to plastic anisotropy [22,23]. In this regard, the dynamic punch test is of particular importance as high stress states taking place at high strain rates activate additional dislocation glide systems which influence the effects of plastic anisotropy. Experimental studies at high strain rates of the Ti6Al4V alloy using a split Hopkinson bar showed a significant decrease in the influence of plastic anisotropy on the mechanical behavior at strain rates above 100 s–1 [24]. Therefore, the use of high-speed stamping and forming modes of products from sheet hcp alloys with a certain deformation anisotropy can increase not only productivity, but also the quality of topological parameters of the resulting products. The contribution of these effects is difficult to isolate from general material response obtained under uniaxial loading conditions due to the localization of plastic deformation. Therefore, the dynamic punch test technique coupled with numerical simulation becomes highly informative for material characterization at high strain rates.
The results of punch tests can be used to validate constitutive models developed on the basis of data obtained from uniaxial experiments [9,16,25,26,27]. The test results can also be used in the development of methods for modeling technological processes of dynamic stamping, predicting stamping modes, springback effects, plastic deformation, and the occurrence of damage.
The relevance of studies of the Ti-5Al-2.5Sn alloy under dynamic influences is due to the need to prevent the occurrence of microdamage in the process of manufacturing thin-walled tanks and vessels.
The aim of this work was to investigate the mechanical behavior of the Ti-5Al-2.5Sn alloy using a high-speed punch test with a hemispherical indenter. The data obtained complement the results of previously conducted studies of the mechanical behavior of titanium alloys at high strain rates with varying the stress triaxiality parameter [8,28].
2. Materials and Methods
2.1. Experimental methods
Experimental studies were performed on industrial thin-sheet Ti–5Al–2.5Sn (analogous to the VT5-1 alloy). The Ti–5Al–2.5Sn alloy had the following chemical composition (wt. %): 5.311 Al, 2.51 Sn, 0.211 Fe, 0.0116 Si, 0.864 V, 0.2786 Zr, Ti—balance. The mechanical properties of the Ti-5Al- 2.5Sn alloy at 295 K were as follows: shear modulus µ = 47.7 GPa; Young’s modulus E = 125 GPa; Poisson ratio υ = 0.31; mass density ρ = 4.462 g/cm; yield strength σ0.2 = 750 MPa; ultimate tensile strength UTS = 850 МРа; and heat capacity Сp = 0.502 J/(kg K).
The alloy had a homogeneous fine-grained polycrystalline structure, as shown in Figure 1a. The grains were equiaxed with an average size of ~40 μm. Test specimens were produced from a sheet with a thickness of 1.2 ± 0.05 mm in the as-received condition using the electrical discharge method on a DK7732 CNC machine (Taizhou Terui CNC Machine Co., Ltd, Taizhou, China), which ensured high geometric precision. The supplier reported that the rolled sheets were annealed to relieve residual stresses and significantly reduce the strain anisotropy of the alloy in the thin sheets. The surfaces of specimens were polished to reduce the coefficient of friction in the contact between the specimen and the indenter. The geometric dimensions of the specimen for high-speed testing were consistent with INSTRON recommendations and ASTM E643-09 and ISO 8490-86 standards [29,30]. Figure 1b,c show the scheme of the punch test setup. The sample diameter d was 60 ± 0.1 mm. The diameter at the bottom of clamping device D was 42 ± 0.1 mm.
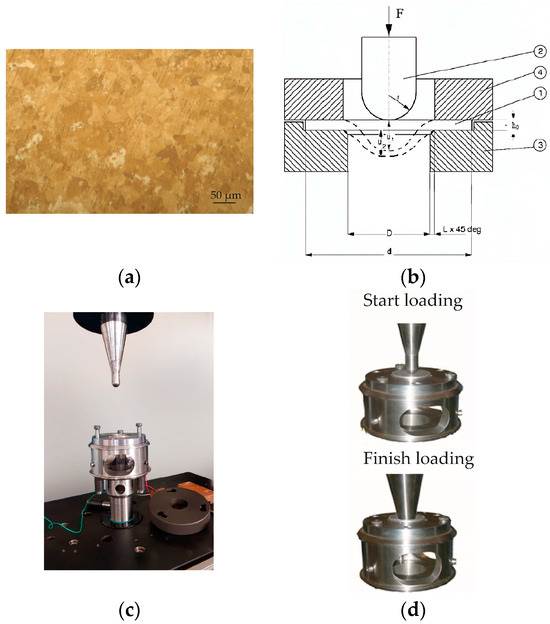
Figure 1.
(a) Micrograph of grain structure of Ti–5Al–2.5Sn. (b) The sectional scheme of punch test setup: 1—specimen; 2—hemispherical punch; 3, 4 are the lower and the upper parts of the support matrix, respectively. (c) Photos of Instron VHS 40/50-20 punching device. (d) Photos of punch positions at the start and end of the punching test process at the Instron VHS 40/50-20 servo-hydraulic bench.
Constant speed punch tests were performed on an Instron VHS 40/50-20 high-speed test rig (Instron, High Wycombe, UK) with a 50 kN load cell.
Figure 1d shows photographs of the positions of the indenter before and after the punching process. Forces and displacements were recorded until specimen failure with high temporal resolution. The force measurement accuracy was 0.25% from 1% to 100% of the Kistler sensor’s nominal load. The punching speed was calculated in tests by integrating the data from the acceleration cell using the HV 8800 software (Instron Bluehill Bluehill Central, Lab Management Software from Instron, Norwood, MA, USA). Data on deflections were calculated in the HV 8800 program using readings of the positioning sensor data.
The force sensor was installed in the indenter, and the specimen was fixed in the clamping device moving at a precise speed. The tests were performed in the constant speed mode at the initial values of longitudinal velocities: 0.5 ± 0.001, 1 ± 0.01, 5 ± 0.01, and 10 ± 0.1 m/s. IPF ER-3 (Gazpromneft LLC—lubricants, Moscow, Russia) grease was used between the punch and the sample surface. This lubricant reduces friction during stamping and has excellent extreme pressure properties; it is intended for use in friction units of technological equipment operating under conditions of high loads and temperatures.
It is worth noting that the dynamics of specimen fracture and the nature of crack formation during punching depend on the geometric parameters of the indenter and the specimen [21]. Therefore, the evolution of the specimens’ rear surface was captured during deformation using high-speed video technology. A Phantom V711 high-speed camera (Vision Research—AMETEK Co, Wayne, NJ, USA) was employed to record the deformation and failure of the specimens. The surface of the specimens during high-speed testing was illuminated using two 5 W halogen lamps. The shooting was carried out at a speed of 13,000 fps and an exposure of 10 μs. The camera settled down vertically parallel to the movement of the piston. The deformation and fracture of the specimens were observed through a mirror installed in a movable clamping device.
2.2. Numerical Modeling of Plastic Flow and Damage Development of Titanium Alloy during Dynamic Punch Tests
The computational models were developed using the framework of continuum mechanics with damage.
The change in temperature during the development of plastic flow due to energy dissipation was computed in the adiabatic approximation [20]:
where T0 is the initial temperature, β~0.9 is the parameter representing the fraction of plastic work converted into heat, and is the equivalent stress. The equivalent stress was assumed in two forms: von Mises stress, and anisotropic quadratic Hill’s stress , , increment of equivalent plastic strain, are the plastic strain rate components, and is the equivalent plastic strain. The specified numerical values were used in the simulations: F = 0.144, G = 0.299, H = 0.701, L = M = N = 2.23 [31].
The temperature dependence of the specific heat capacity of the alpha-titanium alloy Ti-5Al-2.5Sn on temperature T in the range from 293 to 1115 K is described by the phenomenological relation [32]
The temperature dependence of the shear modulus of the alpha-titanium alloy was accounted by the relation [33]:
μ(T, ρ) = μ0[1 + μ1 p(ρ0/ρ) − μ2(T − 295)]
The flow stress of the damage free phase of the alloy was described using the following constitutive relation [34]:
where , , , are material parameters, and is a parameter normalizing the plastic strain rate.
Calculations were performed with the following numerical values of the parameters: , , K−1, K−1, = 1 s−1, = 1875 K.
The GTN model was used as the plastic potential [34,35]:
A kinetic model of damage accumulation was used to describe the nucleation and growth of voids during plastic deformation [6]. The rate of void growth is determined according to the law of conservation of mass and is associated with the increase in volumetric plastic deformation. The nucleation of voids is induced by the equivalent plastic strain and follows a normal void size distribution.
The magnitude of stress relaxation associated with the nucleation of new voids is controlled by the parameter fN. The damage development completes by the coalescence of voids into a macroscopic crack. The linking of voids leads to stress relaxation and the acceleration of the growth rate of damage parameter f* until the erosion of the finite element (when the void concentration fF reaches a critical value fc).
where in which q1, q2, and q3 are constants of the model.
The model parameters for the Ti-5Al-2.5Sn alloy were obtained in semi-inverse numerical simulations of a uniaxial tensile test at strain rates of 0.1, 100, and 1000 s–1 [8,29]. The following set of coefficients were used in simulations: q1 = 1.0, q2 = 0.7, q3 = 1.0, f0 = 0.003, fN = 0.1156, fc = 0.117, fF = 0.260, εN = 0.25, sN = 0.05. The discretization of the computational domain of the sample was performed using 3D linear Lagrangian hexagonal elements. The convergence of the numerical results of the calculations was ensured by selecting the spatial grid step. A fine mesh with a characteristic size of 0.3 mm was used in simulations. The computational domain of the titanium plate consisted of ~200,000 elements. The computational domains of the indenter and clamping device were described using a model of a rigid body and divided into 2D elements. The boundary conditions were set similarly to [16]: constant velocity was applied on the rigid body indenter, as seen in Figure 2.
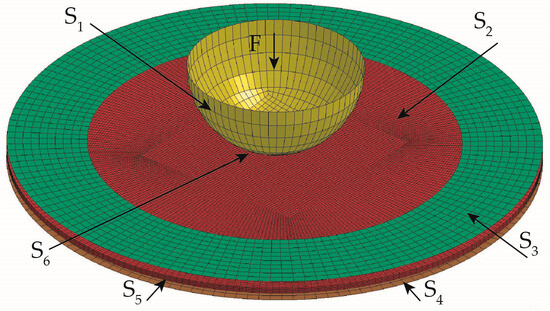
Figure 2.
Surface numbering in the computational domain.
The boundary conditions had the form:
where are the components of the particle velocity vector on the surface Sk, k = 1…6, σij are the components of the stress tensor, p is the pressure, V0 is the velocity of the rigid punch, the S6 surface corresponds to the contact area, and S3 and S4 are the surfaces of the clamping device.
The numerical simulations were performed using the explicit solver (ANSYS WB 15.2, ANSYS, Inc., Canonsburg, PA, USA). The constitutive model has been adopted in the LS DYNA solver via UMAT subroutine. The integration algorithm for plasticity models using Gurson’s yield potential can be found in [35,36]. The calculations were carried out using a finite-difference scheme of second-order accuracy. Contact elements of automatic_surface_to_surface card of LS DYNA were used to model contacts between the indenter and the specimen, and the clamping device and the specimen. The specified parameters of the friction coefficient FS = 0.2 and damping coefficient VDC = 30 ensured the absence of parasitic oscillations of forces in the contact zone.
3. Results
3.1. Experimental Results
Experimental F(uz) “force–displacement” diagrams were obtained by punching samples of the Ti-5Al-2.5Sn alloy at speeds of (a) 10 m/s, (b) 5 m/s, (c) 1 m/s, and (d) 0.5 m/s.
The test results indicate the good reproducibility of peak force values and ultimate deflections in a series of five tests for each punching speed. Figure 3 shows diagrams with maximum, minimum, and one of the average force amplitudes for the studied punching speeds. The obtained diagrams of the force F(uz) versus the plate deflection indicate the ductile nature of the fracture at indenter speeds of up to 10 m/s. The peak force was varied from 9 to 12 kN with regard to the increase in the indenter speed from 0.5 to 10 m/s. As the punching speed increases, the slope of the deformation curves becomes sharper and the peak force values increase. This indicates that the Ti-5Al-2.5Sn alloy exhibits a sufficient strain rate sensitivity. The results indicate that there is no embrittlement of the Ti-5Al-2.5Sn alloy under biaxial stress state conditions.
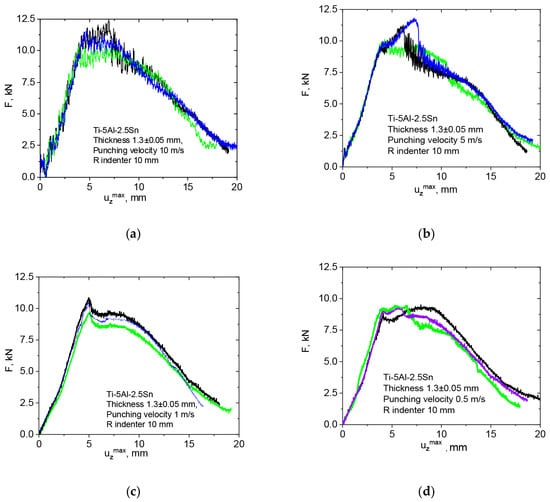
Figure 3.
«Force–displacement» diagrams after the punching of alloy Ti-5Al-2,5Sn at velocities of (a) 10 m/s, (b) 5.0 m/s., (с) 1.0 m/s, and (d) 0.5 m/s. Each color on a diagram corresponds to a specific specimen.
The “punching force–specimen deflection” diagrams do not have a clearly defined point corresponding to the onset of crack formation. By comparing data on the time of punching and video frames with an incipient crack, it was possible to determine the value of deflection at which a visible violation of the continuity of the specimen occurred. Video frames shown in Figure 4 indicate that macroscopic cracks originated at the center of the rear surface of the specimen.
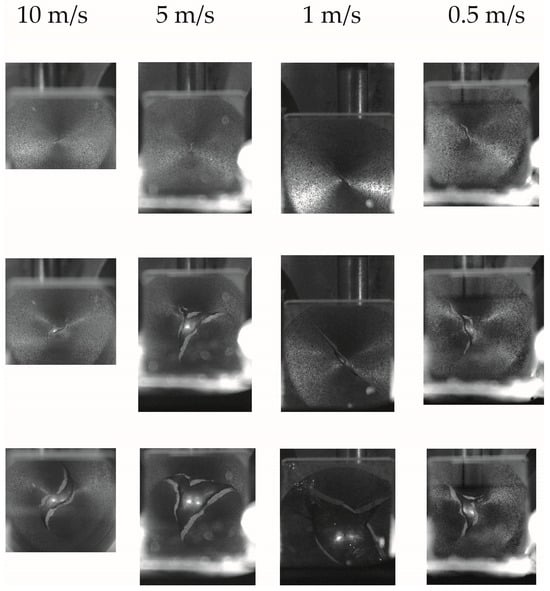
Figure 4.
Video frames of Ti-5Al-2.5Sn specimens during punching at speeds of 0.5, 1.0, 5.0, and 10 m/s, containing subsequent moments of crack opening.
At the moment of nucleation, the macrocrack had from two to three radial branches. The opening of cracks with increasing deflection was intermittent, which confirms the preservation of a high-stress state in the zone of fracture formation. The initiation of cracks occurred after extensive plastic deformation. The periodic inhibition of a crack and its initiation in the center of the contact area indicates the sensitivity of the ultimate plastic strains of the Ti-5Al-2.5Sn alloy to the stress triaxiality parameter.
Figure 5 shows photographs of the fracture surfaces of Ti-5Al-2.5Sn alloy specimens after punching at speeds of 10, 5.0, and 0.5 m/s obtained using optical microscopy. On the fracture surface, pits and relief from the surface of mesoscopic voids with sizes ranging from 50 to –300 microns are observed. The average sizes of mesoscopic voids decreased with increasing punch speed. In the upper zones, traces of friction against the cone-shaped part of the punching device are visible. Cleavage formation was not observed. The analysis of the fracture surface formed under biaxial tension allows us to consider the fracture of the alloy as ductile. The angle between the normal to the fracture surface and the sample plane was close to 45° and changed slightly with increasing punch speed from 0.5 to 10 m/s. Furthermore, the specimen thickness in the crack formation zone decreases due to high degrees of plastic deformation. The orientation of the crack at an angle to the specimen surface does not allow the use of the relationship for determining the equivalent strain to failure εf recommended by the ASTM E3205-20 standard [37].
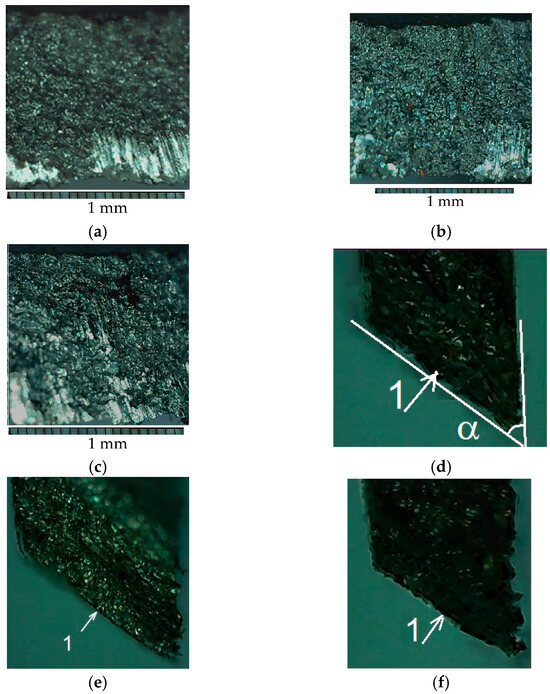
Figure 5.
Photos of the fracture surfaces of specimens after punching at a velocity of (a) 10 m/s, (b) 5 m/s, and (c) 0.5 m/s, and photos of the fracture surface (1) relative to the sample plane caused by punching at a velocity of (d) 10 m/s, (e) 5 m/s, and (f) 0.5 m/s.
3.2. Numerical Simulation Results
Numerical simulations of the punch test were carried out to study the regularities of the processes of the deformation, damage development, and fracture of the Ti-5Al-2.5Sn. alloy. Figure 6 shows the calculated and experimental force–deflection diagrams obtained by punching the Ti-5Al-2.5Sn alloy with indenter speeds of 10 and 0.5 m/s. Line 1 shows the calculation results, and line 2 the experimental data.
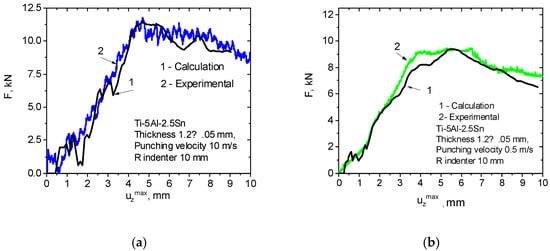
Figure 6.
The velocity of the punch is 15 m/s. Comparison of calculated and experimental “force–deflection” diagrams obtained during the punching of the Ti-5Al-2.5Sn alloy (a) at a punching speed of 10 m/s, and (b) at a punching speed of 0.5 m/s.
The obtained modeling results showed good agreement between the calculated and experimental “force versus deflection” curves under dynamic loading, which makes it possible to analyze the plastic strain and stresses that took place during the punching process.
Figure 7 shows the contours of the effective strain rate in the rear surface of a Ti-5Al-2.5Sn plate at a punch speed of 10 m/s before and after crack initiation.
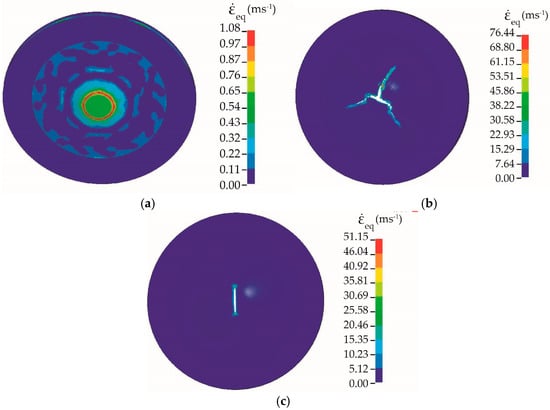
Figure 7.
(a) Contours of the equivalent strain rate in a Ti-5Al-2.5Sn specimen at a punching speed of 10 m/s, (b) calculated equivalent strain rate in the head of a crack in the Ti-5Al-2.5Sn alloy during punching at a speed of 10 m/s using the von Mises-GTN model, and (c) using Hill-GTN model.
The strain rate in the inelastic deformation zone varied over a wide range (from 100 s–1 to 4000 s–1). The region of maximum values of the strain rate had a circular shape and corresponded to the contours of the contact area. When the sample failed, the strain rate at the crack tip significantly exceeded these values. The simulation results indicate that the accumulation of damage resulted in the non-uniform development of plastic deformation on the rear surface.
The contours of equivalent stress in a Ti-5Al-2.5Sn plate during punching are shown in Figure 8. High-stress areas coincide with the highest strain rate region as the strain rate sensitivity of the material was incorporated into the material model. Additional contribution to stress relaxation in the center of the specimen’s rear surface was associated with damage development after the equivalent strain reached its overcritical values.
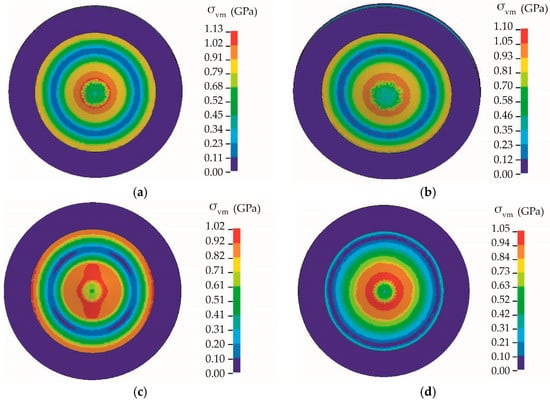
Figure 8.
Contours of equivalent von Mises stress in a Ti-5Al-2.5Sn plate under punching (a) at 10 m/s, (b) at 5m/s, (c) at 1 m/s, and (d) at 0.5 m/s.
Figure 9 shows the calculated “equivalent stress–equivalent strain” diagrams at the central point of the back surface of Ti-5Al-2.5Sn alloy samples.
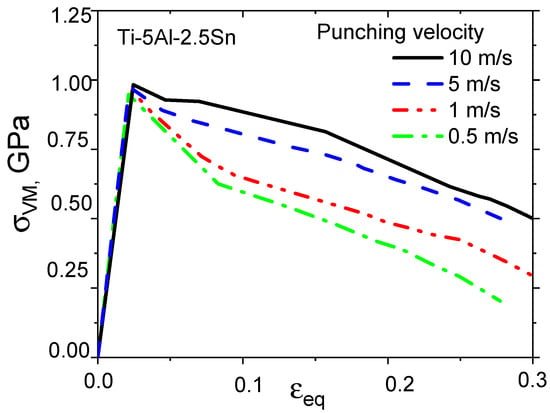
Figure 9.
Calculated “equivalent von Mises stress–equivalent strain” diagrams at the center of the back surface of Ti-5Al-2.5Sn specimens at punching velocities of 0.5, 1, 5, and 10 m/s.
The different shapes of obtained stress–strain curves at loading rates below 1 m/s and at loading rates above 5m/s might be associated with different contributions of damage development and viscous effects. It is interesting to note that the maximum values of plastic strain obtained in simulations significantly exceeded the values of the macroscopic elongation δ before the failure of the Ti-5Al-2.5Sn alloy which are available in the literature. At the same time, the calculated values of equivalent stresses are consistent with the experimental values of flow stresses obtained for the Ti-5Al-2.5Sn alloy at high strain rates [8]. Thus, fairly high equivalent stresses can be realized in thin plates under relatively small deflections during dynamic stamping, which leads to changes in the triaxial stress state parameter η = –p/σeq. The calculated distributions of the stress triaxiality parameter η in the section of the deformable plate are presented in Figure 10.
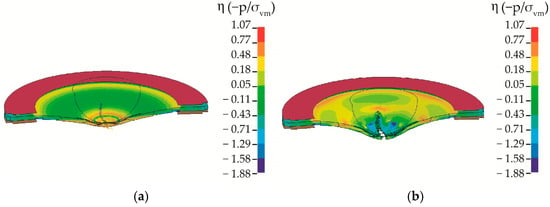
Figure 10.
The velocity of the punch is 15 m/s. Calculated distributions of the stress triaxiality parameter η in the section of a Ti-5Al-2.5Sn plate (a) during deformation at a rate of 10 m/s and (b) during crack opening.
The simulation results indicate that the stress state of pure shear was realized on the contours of the contact area, while in the center of the specimen on the rear surface, the values of the stress triaxiality parameter were close to 0.65, which corresponds to equal-biaxial tension. The process of crack formation due to the accumulation of damage in the punching zone was accompanied by a spatially inhomogeneous change in the stress triaxiality parameter η. Therefore, to improve the accuracy of the engineering analysis of the dynamic stamping of titanium alloys, it is necessary to take into account the influence of the stress triaxiality parameter on the ultimate strain.
The distributions of the calculated displacements of the deflection uz and the damage parameter f* in the rear surface of specimens during the opening of cracks are presented in Figure 11.
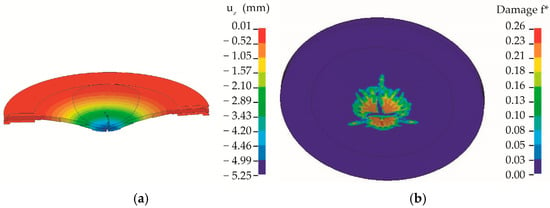
Figure 11.
Calculated distribution of displacements uz in the cross section of a Ti-5AL-2.5Sn specimen at time 0.42419 ms; (b) distribution of the damage parameter.
4. Discussion
The technique of testing metallic materials during punching coupled with numerical simulation allowed us to estimate the ultimate strain under equal-biaxial tension. Post-critical parts of “force–displacement” diagram were used to validate the damage kinetics in the model. Figure 12 shows a comparison of the crack configurations observed in the experiment and those obtained in numerical simulations. The qualitative coincidence of the calculated configurations and trajectories of developing cracks and those observed in experiments confirms the adequacy of the proposed model and the ability to predict the fracture of alpha-titanium alloys at high strain rates under equal-biaxial tension. Asymmetry of cracks occurred when a plate was exposed to a hemispherical indenter, and was caused by the localization of high-speed plastic deformation. The results of the video recording of the punching of the Ti-5Al-2.5Sn alloy (with an equiaxial texture) indicate that incipient radial cracks were stochastically oriented to the rolling direction in most specimens. The corresponding configuration of fractured specimens was obtained in calculations using an isotropic plasticity model. A radial crack in the rolling direction was observed only in one of the five specimens of the Ti-5Al-2.5Sn alloy at a loading rate of 1 m/s. The use of Hill’s model made it possible to mimic radial cracking and to provide agreement between the calculated and experimental configurations.
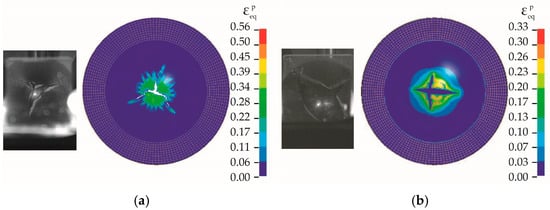
Figure 12.
Comparison of calculated and experimental configurations of cracks in a Ti-5Al-2.5Sn specimen after punching at a speed of (a) 10 m/s and (b) 1 m/s.
An increase in strain rate promotes the formation of localized shear bands, as shown in Figure 11b and Figure 12a. The formation of localization bands is associated with the instability of the plastic flow process and is accompanied by changes in the structure of the alloy [38,39,40,41]. The susceptibility to adiabatic shear band formation is associated with the relatively high yield strength and low degree of strain hardening of the Ti-5Al-2.5Sn alloy.
Therefore, the probability of the formation of localized shears in titanium alloys during stamping increases with increasing loading rate. As a result, radial localization bands are formed in the plate. Structural changes occurring in localized deformation bands weaken the effects of plastic anisotropy characteristic of titanium alloys [20]. Thus, increasing the stamping speed above a certain threshold makes it possible to increase the formability of alpha-titanium alloys at room temperature. The results of previous research on the formability of the Ti-6Al-4V alloy also indicate significant improvement after the loading rate exceeds a certain threshold [42]. It is worth noting that the yield strength of the material decreases with increasing temperature, which leads to an increase in the loading rate threshold for the formation of localized shear bands.
The obtained results on the general regularities of deformation and fracture of titanium alloys with hcp crystal lattice can be used to justify constitutive relationships, damage, and fracture criteria for other hcp alloys based on Zr, Be, Hf, and others [43].
5. Conclusions
The mechanical behavior of the Ti-5Al-2.5Sn alloy was studied using a punch test with a hemispherical indenter of a 20 mm diameter.
The tests were performed on an Instron VHS 40/50-20 servo-hydraulic stand with constant loading rates of 0.5, 1, 5, and 10 m/s. The stress state in the center of the indenter–sample contact area corresponded to equal-biaxial tension. An analysis of the development of plastic deformations and crack formation was carried out using numerical simulations.
The results can be summarized as follows:
- The maximum values of plastic strain obtained in simulations exceeded the values of the macroscopic elongation δ before the failure of the Ti-5Al-2.5Sn alloy which are available in the literature.
- High strain rates promote the formation of localized shear bands under biaxial stress state.
- The values of the stress triaxiality parameter at the indenter–sample contact area vary unsteadily and spatially inhomogeneously during the accumulation of damage.
- The results indicate the ductile nature of the fracture of the Ti-5Al-2.5Sn alloy under biaxial tension at room temperature and at strain rates up to 104 s−1.
The experimental data on the deformation and fracture of the Ti-5Al-2.5Sn alloy obtained in dynamic punch testing can be used in the design of thin-sheet titanium parts and the technology of its manufacture by stamping.
Author Contributions
Conceptualization, V.V.S. and V.A.S.; methodology, V.V.S. and V.A.S.; software, V.V.S.; validation, V.V.S., V.A.S.; formal analysis, V.A.S.; investigation, V.V.S.; resources, V.V.S.; data curation, V.V.S.; writing—original draft preparation, V.V.S. and V.V.S.; writing—review and editing, V.V.S. and V.A.S.; visualization, V.V.S. and V.A.S.; supervision, V.A.S.; project administration, V.V.S.; funding acquisition, V.V.S. All authors have read and agreed to the published version of the manuscript.
Funding
This research was funded by the Russian Science Foundation (RSF), grant No. 22-79-00162.
Data Availability Statement
The raw data supporting the conclusions of this article will be made available by the authors on request.
Acknowledgments
The authors are grateful for the support of this research.
Conflicts of Interest
The authors declare no conflicts of interest.
References
- Jayaprakash, M.; Ping, D.H.; Yamabe-Mitarai, Y. Enhanced yielding strength of near-α Ti–Al–Zr–Sn high temperature alloys. Mater. Sci. Eng. A 2015, 625, 131–139. [Google Scholar] [CrossRef]
- Lu, Z.; Zhang, X.; Ji, W.; Wei, W.; Yao, C.; Han, D. Investigation on the deformation mechanism of Ti–5Al-2.5Sn ELI titanium alloy at cryogenic and room temperatures. Mater. Sci. Eng. A 2021, 818, 141380. [Google Scholar] [CrossRef]
- Tan, M.J.; Chen, G.W.; Thiruvarudchelvan, S. High temperature deformation in Ti–5Al–2.5Sn alloy. J. Mater. Process. Technol. 2007, 192–193, 434–438. [Google Scholar] [CrossRef]
- Ghosh, A.K.; Hamilton, C.H. Superplastic Forming and Diffusion Bonding of Titanium Alloys; Woodhead Publishing: Cambridge, UK, 1986; Volume 36, pp. 153–177. [Google Scholar]
- Tabie, V.M.; Li, C.; Saifu, W.; Li, J.; Xu, X. Mechanical properties of near alpha titanium alloys for high-temperature applications—A review. Aircr. Eng. Aerosp. Technol. 2020, 92, 521–540. [Google Scholar] [CrossRef]
- Luscher, D.J.; Buechler, M.A.; Walters, D.J.; Bolme, C.A.; Ramos, K.J. On computing the evolution of temperature for materials under dynamic loading. Int. J. Plast. 2018, 111, 188–210. [Google Scholar] [CrossRef]
- Li, H.; Chen, S.-F.; Zhang, S.-H.; Xu, Y.; Song, H.-W. Deformation characteristics, formability and springback control of Titanium alloy sheet at room temperature: A review. Materials 2022, 15, 5586. [Google Scholar] [CrossRef] [PubMed]
- Skripnyak, V.V.; Skripnyak, E.G.; Skripnyak, V.A. Fracture of titanium alloys at high strain rates and under stress triaxiality. Metals 2020, 10, 305. [Google Scholar] [CrossRef]
- Spulak, N.; Seidt, J.; Gilat, A. Ductile fracture of 2024 aluminum under unequal biaxial in-plane tension and out-of-plane compression. Mech. Mater. 2024, 179, 104585. [Google Scholar] [CrossRef]
- Seidt, J.D.; Park, C.; Buyuk, M.; Lowe, R.L.; Wang, L.; Carney, K.S.; Du Bois, P.; Gilat, A.; Kan, C. An Experimental Investigation of the Influence of the State of Stress on the Ductile Fracture of 2024-T351 Aluminum. ASME J. Eng. Mater. Technol. 2022, 144, 041006. [Google Scholar] [CrossRef]
- Cadonia, E.; Dottaa, M.; Fornia, D.; Riganti, G. Combined effects of high strain rate, elevated temperature, and triaxiality on a commercial tungsten alloy. Procedia Struct. Integr. 2023, 47, 268–273. [Google Scholar] [CrossRef]
- Huang, B.; Lin, L.; Xu, T.; Xiao, X.; Wang, J. A Study of the dynamic mechanical properties of Q460D steel. Metals 2023, 13, 1609. [Google Scholar] [CrossRef]
- Sartora, T.; Lopes da Silva, J.V.; Guanc, Z.; Santiagod, R.C. Influence of stress triaxiality on the fracture behaviour of Ti6Al4V alloy manufactured by electron beam melting. Lat. Am. J. Solids Struct. 2022, 19, e469. [Google Scholar] [CrossRef]
- Peng, J.; Zhou, P.; Wang, Y.; Dai, Q.; Knowles, D.; Mostafavi, M. Stress triaxiality and Lode angle parameter characterization of flat metal specimen with inclined notch. Metals 2021, 11, 1627. [Google Scholar] [CrossRef]
- Frost, H.J.; Ashby, M.F. Deformation-Mechanism Maps: The Plasticity and Creep of Metals and Ceramics; Pergamon Press: Oxford, UK, 1982; 166p. [Google Scholar]
- Skripnyak, V.V.; Iohim, K.V.; Skripnyak, V.A. Mechanical behavior of titanium alloys at moderate strain rates characterized by the punch test technique. Materials 2023, 16, 416. [Google Scholar] [CrossRef] [PubMed]
- Huang, T.; Zhan, M.; Wang, K.; Chen, F.; Guo, J.; Li, Y.; Song, Z.; Bai, L. Forming limit stress diagram prediction of pure titanium sheet based on GTN Model. Materials 2019, 12, 1783. [Google Scholar] [CrossRef] [PubMed]
- Norris, S.D.; Parker, J.D. Deformation processes during disc bend loading. Mater. Sci. Technol. 1996, 12, 163–170. [Google Scholar] [CrossRef]
- Vorlicek, V.; Exworthy, L.F.; Flewitt, P.E.J. Evaluation of a miniaturized disc test for establishing the mechanical properties of low-alloy ferritic steels. J. Mater. Sci. 1995, 30, 2936–2943. [Google Scholar] [CrossRef]
- Dabboussi, W.; Nemes, J.A. Modeling of ductile fracture using the dynamic punch test. Int. J. Mater. Sci. 2005, 47, 1282–1299. [Google Scholar] [CrossRef]
- Hammer, J.T.; Liutkus, T.J.; Seidt, J.D.; Gilat, A. DIC in Dynamic Punch Testing. In Dynamic Behavior of Materials; Song, B., Casem, D., Kimberley, J., Eds.; Conference Proceedings of the Society for Experimental Mechanics Series; Springer: Cham, Switzerland, 2015; Volume 1. [Google Scholar] [CrossRef]
- Zhang, Q.-D.; Cao, Q. Planar anisotropy of commercially pure titanium sheets. Rare Met. 2013, 32, 1–4. [Google Scholar] [CrossRef]
- Nixon, M.E.; Cazac, O.; Lebensohn, R.A. Anisotropic response of high-purity a-titanium: Experimental characterization and constitutive modeling. Int. J. Plast. 2010, 26, 516. [Google Scholar] [CrossRef]
- Corallo, L.; Revil-Baudard, B.; Cazacu, O.; Verleysen, P. Role of anisotropy on strain localization at high-strain rates in Ti6Al4V. Eur. J. Mech. A Solids 2022, 97, 104856. [Google Scholar] [CrossRef]
- Lancaster, R.J.; Jeffs, S.P.; Haigh, B.J.; Barnard, N.C. Derivation of material properties using small punch and shear punch test methods. Mater. Des. 2022, 215, 110473. [Google Scholar] [CrossRef]
- Abendroth, M.; Kuna, M. Determination of deformation and failure properties of ductile materials by means of the small punch test and neural networks. Comput. Mater. Sci. 2003, 28, 633–644. [Google Scholar] [CrossRef]
- Li, X.; Guo, G.; Xiao, J.; Song, N.; Li, D. Constitutive modeling and the effects of strain-rate and temperature on the formability of Ti–6Al–4V alloy sheet. Mater. Des. 2014, 55, 325–334. [Google Scholar] [CrossRef]
- Skripnyak, V.V.; Skripnyak, V.A. Mechanical behavior of alpha titanium alloys at high strain rates, elevated temperature, and under stress triaxiality. Metals 2022, 12, 1300. [Google Scholar] [CrossRef]
- ASTM E643; Test Method for Ball Punch Deformation of Metallic Sheet Material. Annual Book or ASTM Standards. American Society for Testing and Materials: West Conshohocken, PA, USA, 2021.
- ISO 8490; Metallic Materials—Sheet and Strip—Modified Erichsen Cupping Test. ISO: Geneva, Switzerland, 1986.
- Revil-Baudard, B.; Cazacu, O.; Massoni, E. Room-temperature plastic behavior and formability of a commercially pure titanium: Mechanical characterization, modeling, and validation. Int. J. Solids Struct. 2021, 228, 111121. [Google Scholar] [CrossRef]
- Zhang, J.; Zhao, Y.; Hixson, R.S.; Gray, G.T.; Wang, L.; Utsumi, W.; Takanori, H. Thermal equations of state for titanium obtained by high pressure—Temperature diffraction studies. Phys. Rev. B 2008, 78, 054119. [Google Scholar] [CrossRef]
- Steinberg, D.J.; Cochran, S.G.; Guinan, M.W. A constitutive model for metals applicable at high-strain rate. J. Appl. Phys. 1980, 51, 1498–1504. [Google Scholar] [CrossRef]
- Armstrong, R.W. Constitutive Relations for Slip and Twinning in High Rate Deformations: A Review and Update. J. Appl. Phys. 2021, 130, 245103. [Google Scholar] [CrossRef]
- Bettaieb, M.B.; Lemoine, X.; Duchêne, L.; Habraken, A.M. On the numerical integration of an advanced Gurson model. Int. J. Numer. Methods Eng. 2010, 85, 1049–1072. [Google Scholar] [CrossRef]
- Becker, R. Ring fragmentation predictions using the Gurson model with material stability conditions as failure criteria. Int. J. Solids Struct. 2002, 39, 3555–3580. [Google Scholar] [CrossRef]
- ASTM E3205-20; Standard Test Method for Small Punch Testing of Metallic Materials. Annual Book or ASTM Standards. American Society for Testing and Materials: West Conshohocken, PA, USA, 2021.
- Meyer, L.W.; Pursche, F. Experimental Methods; Dodd, B., Bai, Y., Eds.; Adiabatic Shear Locatization; Elsevier: Waltham, MA, USA, 2012; pp. 21–109. [Google Scholar]
- Sharkeev, Y.; Vavilov, V.; Skripnyak, V.A.; Belyavskaya, O.; Legostaeva, E.; Kozulin, A.; Chulkov, A.; Sorokoletov, A.; Skripnyak, V.V.; Eroshenko, A.; et al. Analyzing the deformation and fracture of bioinert titanium, zirconium and niobium alloys in different structural states by the use of infrared thermography. Metals 2018, 8, 703. [Google Scholar] [CrossRef]
- Roessig, K.M.; Mason, J.J. Adiabatic shear localization in the dynamic punch test, Part I: Experimental investigation. Int. J. Plast. 1999, 15, 241–262. [Google Scholar] [CrossRef]
- Bai, Y.; Dodd, B. Adiabatic Shear Localization: Occurrence, Theories and Applications, 1st ed.; Pergamon Press: Oxford, UK, 1992; p. 378. [Google Scholar]
- Li, F.-Q.; Mo, J.-H.; Li, J.-J.; Huang, L.; Zhou, H.-Y. Formability of Ti–6Al–4V titanium alloy sheet in magnetic pulse bulging. Mater. Des. 2013, 52, 337–344. [Google Scholar] [CrossRef]
- Skripnyak, V.V.; Skripnyak, V.A. Hexagonal close packed (hcp) alloys under dynamic impacts. J. Appl. Phys. 2022, 131, 16–19. [Google Scholar] [CrossRef]
Disclaimer/Publisher’s Note: The statements, opinions and data contained in all publications are solely those of the individual author(s) and contributor(s) and not of MDPI and/or the editor(s). MDPI and/or the editor(s) disclaim responsibility for any injury to people or property resulting from any ideas, methods, instructions or products referred to in the content. |
© 2024 by the authors. Licensee MDPI, Basel, Switzerland. This article is an open access article distributed under the terms and conditions of the Creative Commons Attribution (CC BY) license (https://creativecommons.org/licenses/by/4.0/).