Abstract
The exploration of the relationship between process parameters and grain evolution during the thermal deformation of rare-earth magnesium alloys using simulation software has significant implications for enhancing research and development efficiency and advancing the large-scale engineering application of high-performance rare-earth magnesium alloys. Through single-pass hot compression experiments, this study obtained high-temperature flow stress curves for rare-earth magnesium alloys, analyzing the variation patterns of these curves and the softening mechanism of the materials. Drawing on physical metallurgical theories, such as the evolution of dislocation density during dynamic recrystallization, recrystallization nucleation, and grain growth, the authors of this paper establish a cellular automaton model to simulate the dynamic recrystallization process by tracking the sole internal variable—the evolution of dislocation density within cells. This model was developed through the secondary development of the DEFORM-3D finite element software. The results indicate that the model established in this study accurately simulates the evolution process of grain growth during heat treatment and the dynamic recrystallization microstructure during the thermal deformation of rare-earth magnesium alloys. The simulated results align well with relevant theories and metallographic experimental results, enabling the simulation of the dynamic recrystallization microstructure and grain size prediction during the deformation process of rare-earth magnesium alloys.
1. Introduction
Magnesium alloys, the lightest metallic structural materials in engineering applications, assume a crucial role in fulfilling lightweight design objectives in diverse sectors, including automotive, aerospace, and electronics. However, the significant limitation of inadequate mechanical properties markedly impedes their widespread utilization [1,2]. Studies conducted domestically and internationally [3] have shown that the strategic addition of rare earth elements, in conjunction with thermal deformation processes, facilitates the effective control of dynamic recrystallization behavior. This strategy aims to optimize the microstructure of magnesium alloys, thereby enhancing their strength, ductility, and processability.
Magnesium alloys, when compared to other alloys, exhibit characteristics such as low stacking fault energy (60–78 J/mol), ease of dislocation slip due to their close-packed hexagonal structure, and rapid grain boundary diffusion, making them more susceptible to initiating dynamic recrystallization. The process of dynamic recrystallization, which serves as a significant organizational evolution characteristic during the thermal deformation of rare-earth magnesium alloys, is intricately influenced by the interplay of processing parameters, including the deformation temperature, strain rate, and deformation magnitude. These factors exert substantial impacts on both the microstructure and mechanical properties across different stages of material deformation [4,5]. However, depending solely on experimental techniques for ascertaining the optimal forming process parameters proves to be both expensive and time-intensive. Recently, researchers have started harnessing computer technology to integrate theoretical models into finite element software for further development, facilitating the numerical simulation of microstructural evolution [6,7]. This innovative method, enabling the scientific, efficient, and rapid quantitative characterization of forming process parameters, microstructural evolution, and product performance, surpasses traditional experimentation and emerges as the leading effort in thoroughly simulating the thermal deformation process of materials.
Na et al. [8] developed a series of microstructural evolution models to forecast the evolution of grain size during the forging process of nickel–chromium–iron-based 718 alloy blades. Subsequently, these models were incorporated into three-dimensional finite element software through secondary development. Utilizing a blend of three-dimensional finite element simulation software and a microstructure module, the evolution of grain structure during the two-step forging process of 718 alloy blades was simulated. The accuracy of the microstructure prediction was validated through a comparison of simulated grain structures with experimental blade forgings. Wang et al. [9] formulated a unified viscoplastic constitutive equation to delineate the impact of recrystallized volume fractions, dislocation strengthening, and grain size on the plastic flow stress of steel. This constitutive equation, incorporated into the commercial finite element software MARC solver via a user-defined subroutine (uvscpl), was employed to construct finite element models and the associated numerical computation procedures for simulating the microstructural evolution process during steel plate rolling. A series of finite element simulation studies examining the influence of rolling parameters on material microstructural evolution offered a foundation for the selection of hot rolling parameters. Ma et al. [10] explored the deformation behavior and microstructural evolution of multi-pass large forgings by formulating a constitutive equation that accounts for both strain hardening and dynamic softening of the IN718 alloy. Rotary forging was simulated to investigate the deformation behavior and microstructural evolution, predicting changes in the flow stress, equivalent strain, temperature, damage, and grain size at each pass.
Cellular automata (CA), well-known for their facility in implementing the evolutionary rules of physical phenomena, have steadily become one of the predominant techniques for simulating the microstructural evolution of materials. They adeptly capture the dynamic recrystallization behavior of materials within finite element simulations, reliably replicating the microstructural evolution during thermal deformation processes [11,12,13]. This study first acquired high-temperature flow stress curves of the Mg-13Gd-4Y-2Zn-0.5Zr alloy through Gleeble thermal simulation experiments and extracted the relevant material data accordingly. Subsequently, utilizing these data, the user subroutine of the DEFORM V11.0-3D software was extended, incorporating it with the CA module inherent in the finite element software to establish a numerical simulation platform integrating the thermal, mechanical, and microstructural aspects. Finally, numerical simulations of thermal deformation experiments on rare-earth magnesium alloy specimens were performed using the DEFORM-3D software. By comparing the simulation results with the experimental data, the reliability of the software’s CA module in forecasting microstructural evolution during thermal deformation processes was confirmed.
2. Experimental Materials and Method
The experimental material chosen for this investigation was as-cast rare-earth magnesium alloy, identified as Mg-13Gd-4Y-2Zn-0.5Zr, and its principal chemical composition is detailed in Table 1.

Table 1.
Chemical composition of the as-cast Mg-13Gd-4Y-2Zn-0.5Zr (wt.%).
The initial blanks were shaped into cylindrical hot compression specimens measuring Φ8 × 12 mm using numerical control wire cutting. To approximate the material’s pre-processing conditions, the raw specimens underwent a solution treatment in a box-type resistance furnace: the furnace was first heated to 520 °C and held for 30 min to achieve a uniform temperature. Subsequently, the furnace door was promptly opened, and the specimens were placed inside for 12 h of insulation before being withdrawn for air cooling.
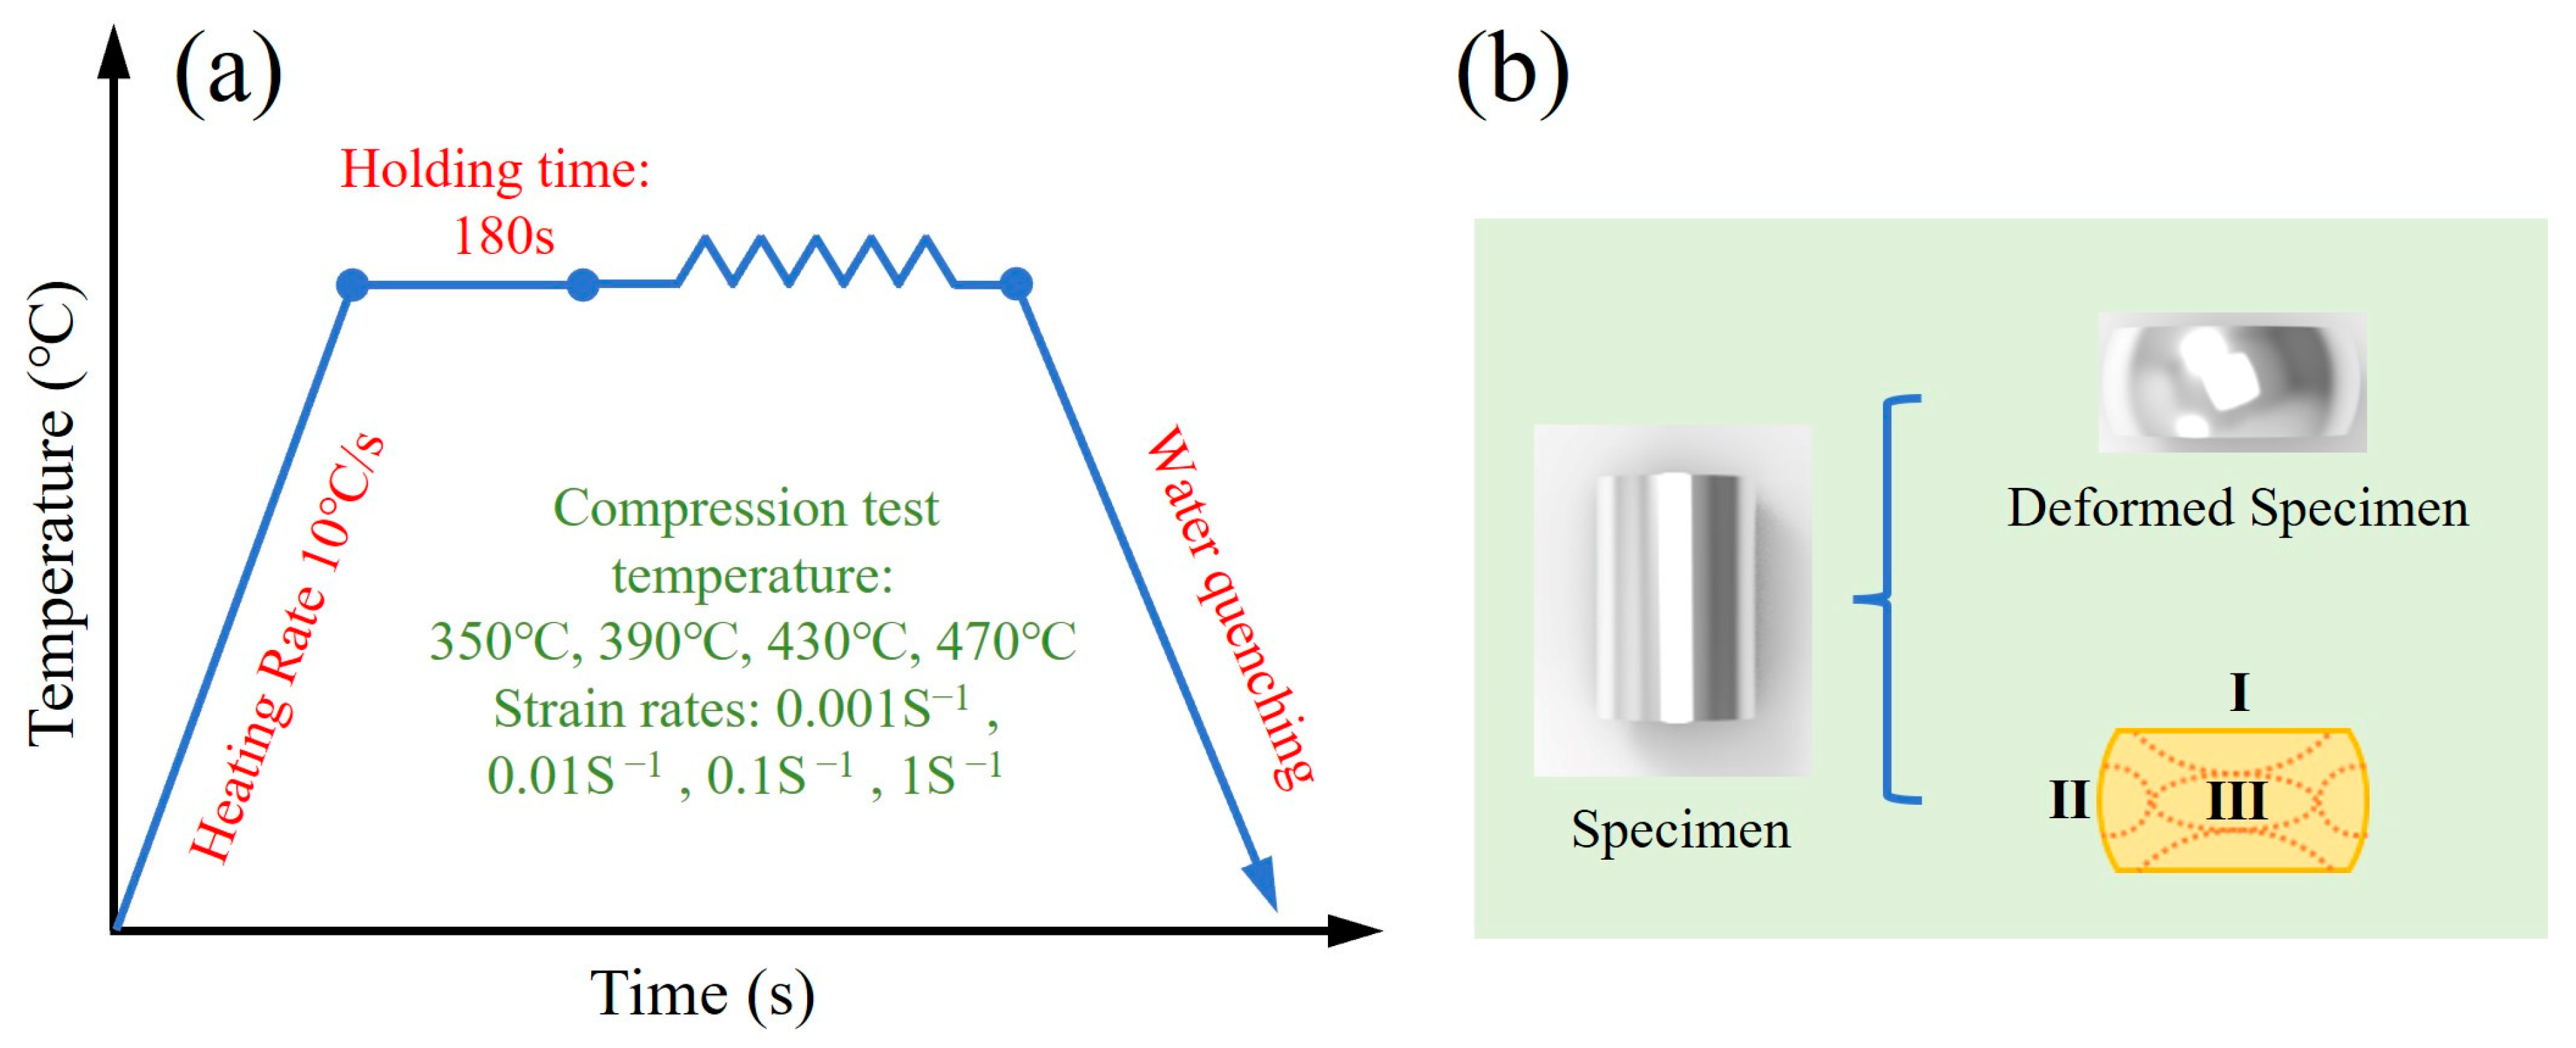
The specimens were heated at a rate of 10 °C/s to different deformation temperatures, then held for 3 min to eradicate temperature gradients, thus ensuring uniform temperature distribution internally and externally. Following this, the specimens underwent single-pass compression deformation under varying conditions (temperatures: 350 °C, 390 °C, 430 °C, and 470 °C; strain rates: 0.001 s−1 to 1 s−1) utilizing the Gleeble-3800 thermal simulation testing machine (Poestenkill, NY, USA). After deformation, the specimens were promptly water-cooled to retain their microstructure resulting from the high-temperature deformation. Throughout the deformation process, the testing machine system recorded data such as load, displacement, deformation temperature, etc., and automatically calculated the true stress and the true strain through the program. The specific deformation experimental procedures are illustrated in Figure 1.
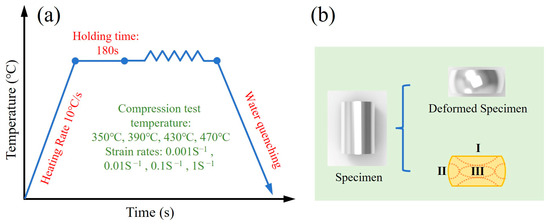
Figure 1.
(a) Hot compression experimental process curve and (b) schematic illustration of the longitudinal section of the deformed area of the specimen: Region I denotes the region of difficult deformation, Region II represents the lateral area, and Region III indicates the compression deformation area.
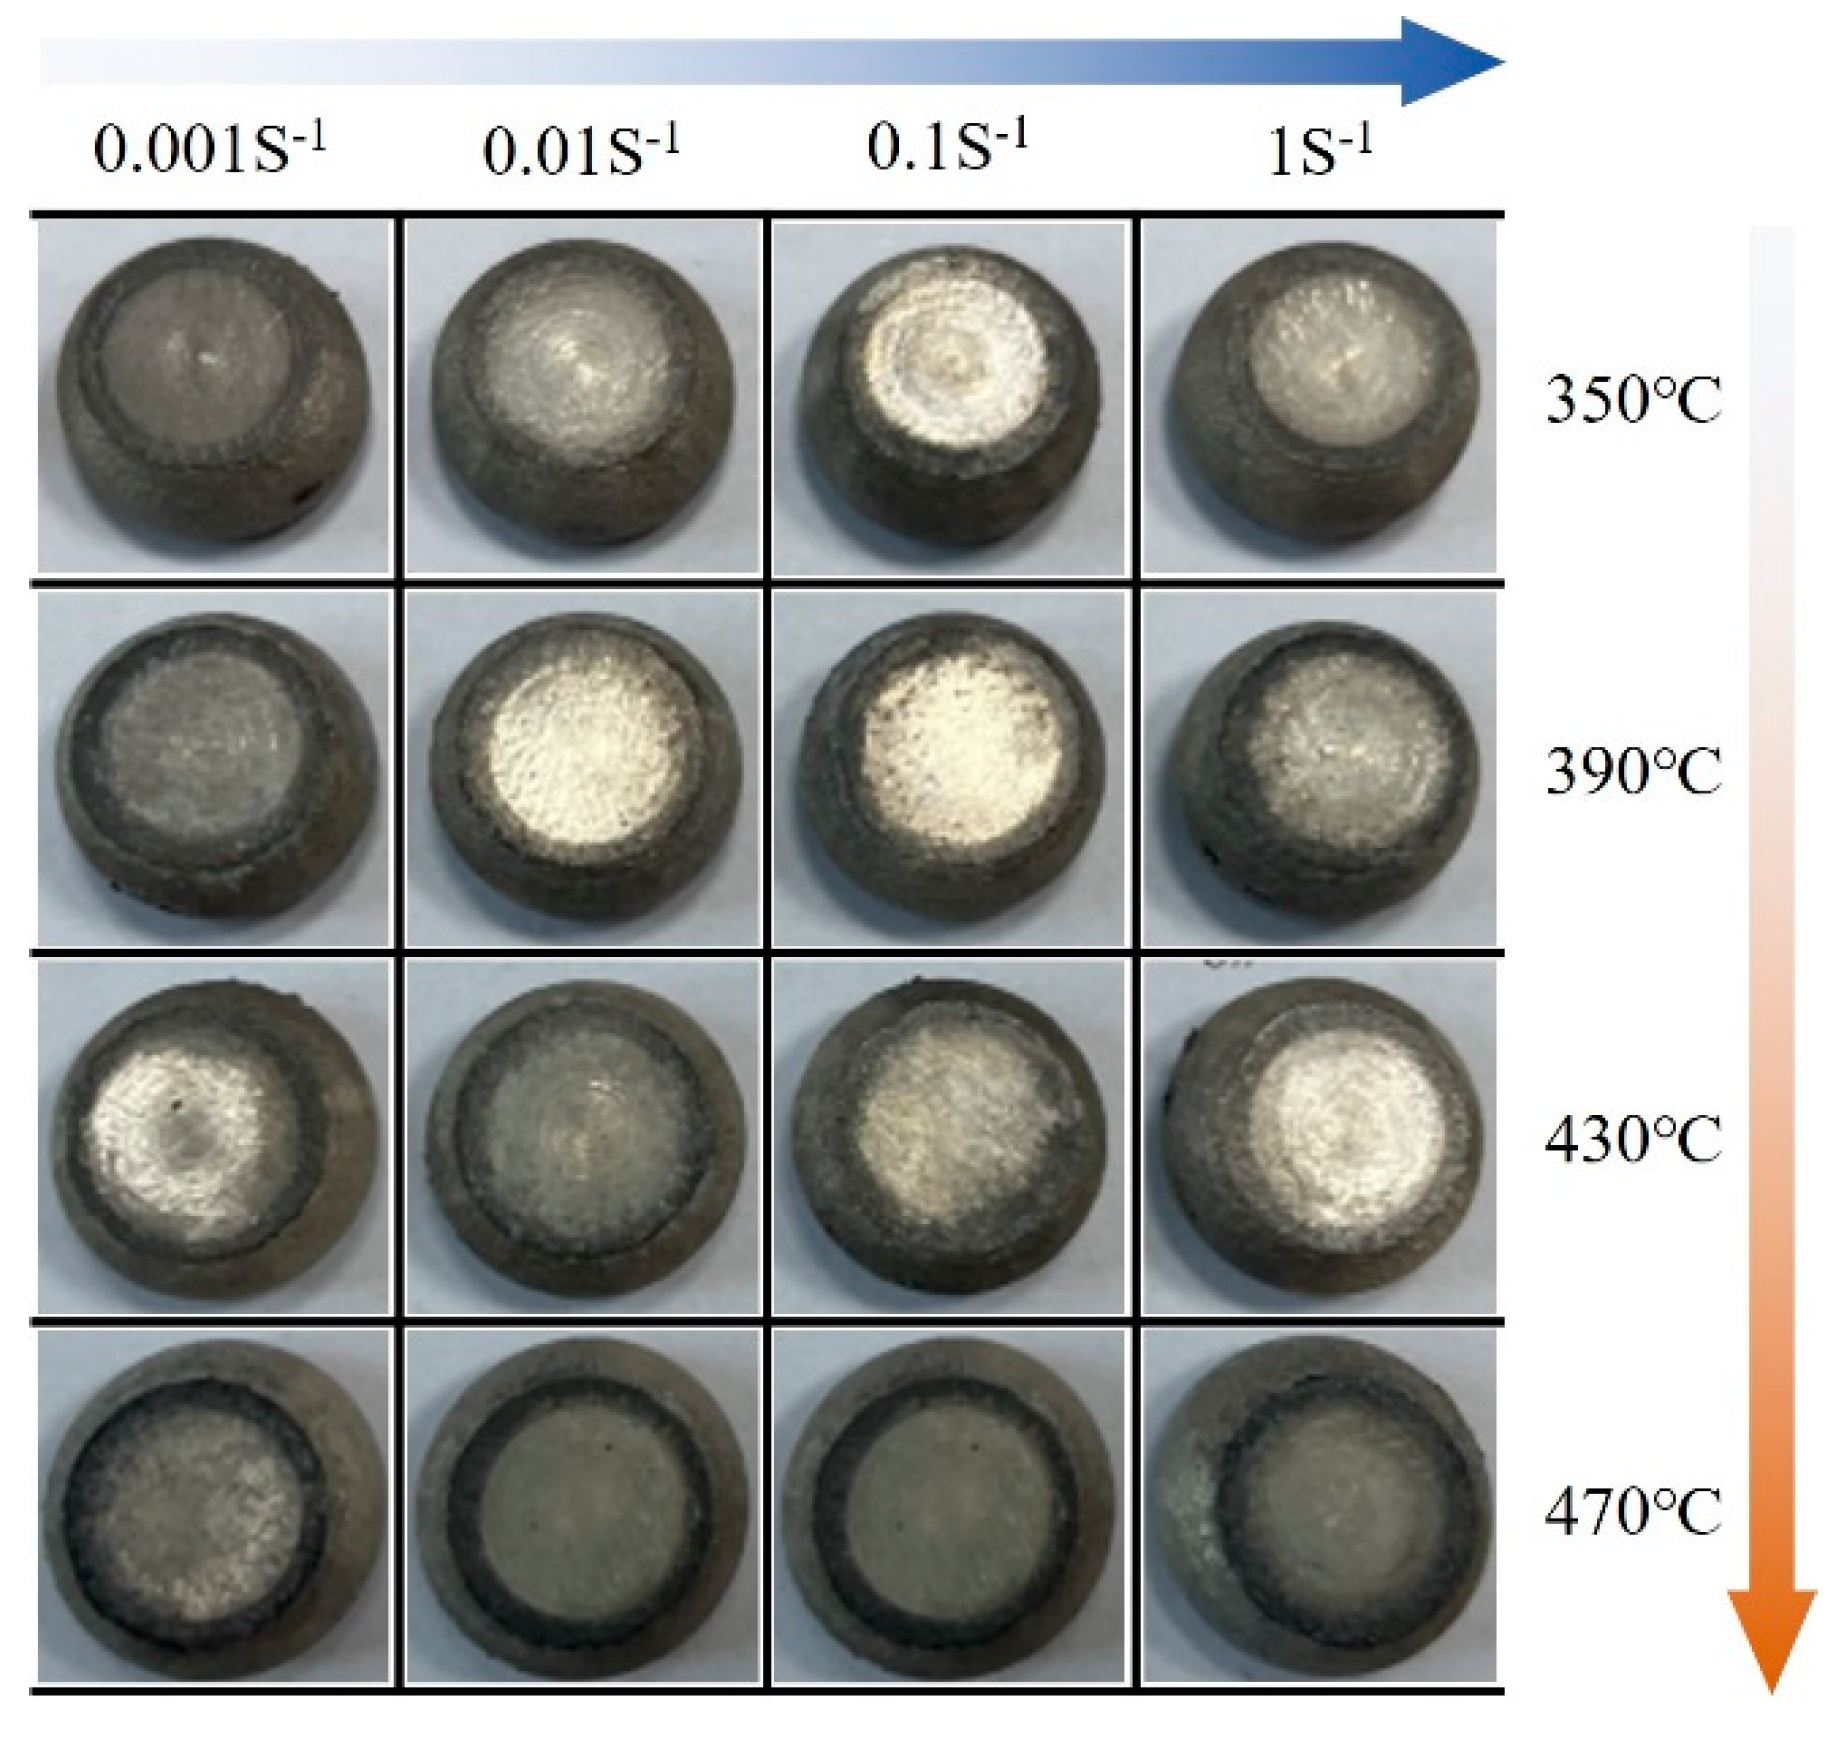
Following the completion of the hot compression tests, the specimens were longitudinally sectioned along the axis of compression (Figure 2). They were then subjected to polishing and etching procedures to enable the observation of the microstructure post-deformation, employing scanning electron microscopy (SEM) and electron backscatter diffraction (EBSD). Given the potential for non-uniform deformation to induce diverse microstructural evolution in various specimen regions, this investigation concentrated on observing Region III.
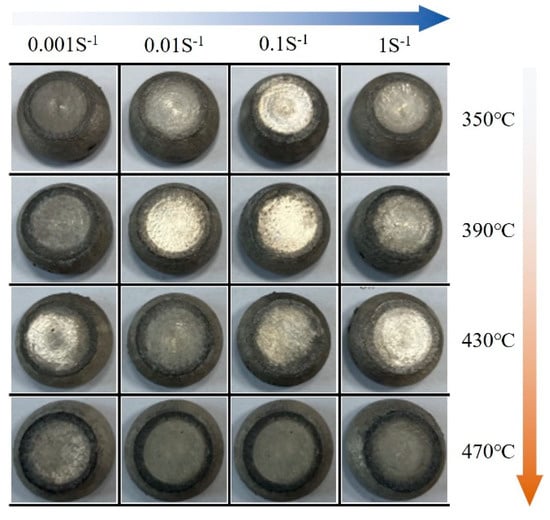
Figure 2.
Specimens of hot compression deformation under various experimental conditions.
3. Modeling
The cellular automaton (CA) module integrated into the DEFORM-3D finite element software for simulating microstructural evolution is based on dislocation density theory, dynamic recovery theory, and theories regarding the nucleation and growth of dynamic recrystallization. It is crucial to compute the pertinent models tailored to the experimental alloy and subsequently integrate them into the finite element software to ensure the attainment of precise simulation results.
3.1. Dislocation Density Model
Throughout the thermal deformation of metal materials, escalation in the strain progressively elevates the dislocation density. Once surpassing a critical threshold, dynamic recrystallization ensues. Plastic deformation in metal materials fundamentally entails the proliferation, mobility, and elimination of dislocations. Consequently, to comprehensively consider the hardening and softening effects during the thermal deformation of metal materials, the Laasraoui–Jonas (L-J) model regards the dislocation density within a domain as a function of the strain. The expression [14] can be delineated as follows:
In the equation, “h” represents the coefficient governing strain hardening, while “r” symbolizes the coefficient pertaining to dynamic recovery, and “ρ” stands for dislocation density. Additionally, both “h” and “r” can be articulated as follows:
Among these parameters, “h0” signifies the constant related to work hardening, “r0” denotes the constant associated with dynamic recovery, “” represents the constant used for strain rate calibration, “R” is the gas constant, “m” indicates the coefficient of the strain rate sensitivity, and “Q” stands for the activation energy required for self-diffusion.
3.2. Recovery Model
Dynamic recovery is recognized as a softening mechanism observed in metal thermal deformation, occurring simultaneously with a reduction in the dislocation density. DEFORM-3D software utilizes the recovery model proposed by Goetz et al. [15], where a specific number of cells (denoted as N) are randomly selected at each time step, resulting in a halving of their dislocation density.
Therefore, the distribution of the dislocation density among the cells becomes non-uniform. N is determined by the following equation:
In the equation, M0 represents the total number of cells in the cellular automaton (CA) model, K is a constant fixed at 6030 [15,16], and signifies the rate of dislocation density growth.
3.3. Model of DRX Nucleation
In the pursuit of accurately simulating microstructural evolution during thermal deformation, this study employed the following two criteria for dynamic recrystallization nucleation: (1) saturation position nucleation, where recrystallization is initiated only when the deformation temperature, strain rate, and strain surpass specific thresholds; (2) dislocation density threshold nucleation, where nucleation occurs solely when the dislocation density exceeds a critical threshold (denoted as ).
We started by employing the following dynamic recrystallization model introduced by Ding and Guo (2001, 2002) [17]:
In the equation, both C and m are constants, where m is conventionally assigned a value of 0.9, and represents the activation energy necessary for nucleation.
The critical dislocation density [18] is as follows:
In the equation, “M” symbolizes the mobility of grain boundaries, “γ” embodies the energy attributed to grain boundaries, “τ” signifies the energy of line dislocations, “l” denotes the average dislocation mean free path, while “b” stands for the Burgers vector.
3.4. Kinetics Model of Grain Growth
After the initiation of dynamic recrystallization grain nucleation, a notable difference in the dislocation density emerges between the newly formed grains and the matrix grains. This difference triggers the migration of grain boundaries from grains with a lower dislocation density to those with a higher dislocation density, thereby serving as the driving force for the growth of recrystallized grains.
The growth velocity of recrystallized grain i is governed by the following relationship with its driving force F [19]:
wherein denotes the driving force for dynamic recrystallization grain growth and stands for the average radius of the dynamic recrystallization grains. The expression for M is as follows (Ding et al.) [20]:
wherein represents the grain boundary self-diffusion coefficient; denotes the diffusion activation energy; stands for the average thickness of the grain boundaries; k represents the Boltzmann constant, .
At the same time, the growth of dynamic recrystallized grains can be articulated as follows:
where τ represents the line dislocation energy, denotes the dislocation density of the recrystallized grain, stands for the dislocation density of the parent phase grains, and signifies the interface energy, which is determined by the orientation difference between adjacent grains. According to the Read–Shockley equation [21], it is expressed as follows:
In the equation, represents the misorientation between the recrystallized grains and adjacent grains, while and , respectively, denote the misorientation and grain boundary energy (assumed to be 15°) for high-angle grain boundaries. The value of can be calculated using the following equation:
In the equation, v denotes the Poisson’s ratio and μ represents the shear modulus.
4. Results and Discussion
4.1. Experimental Results
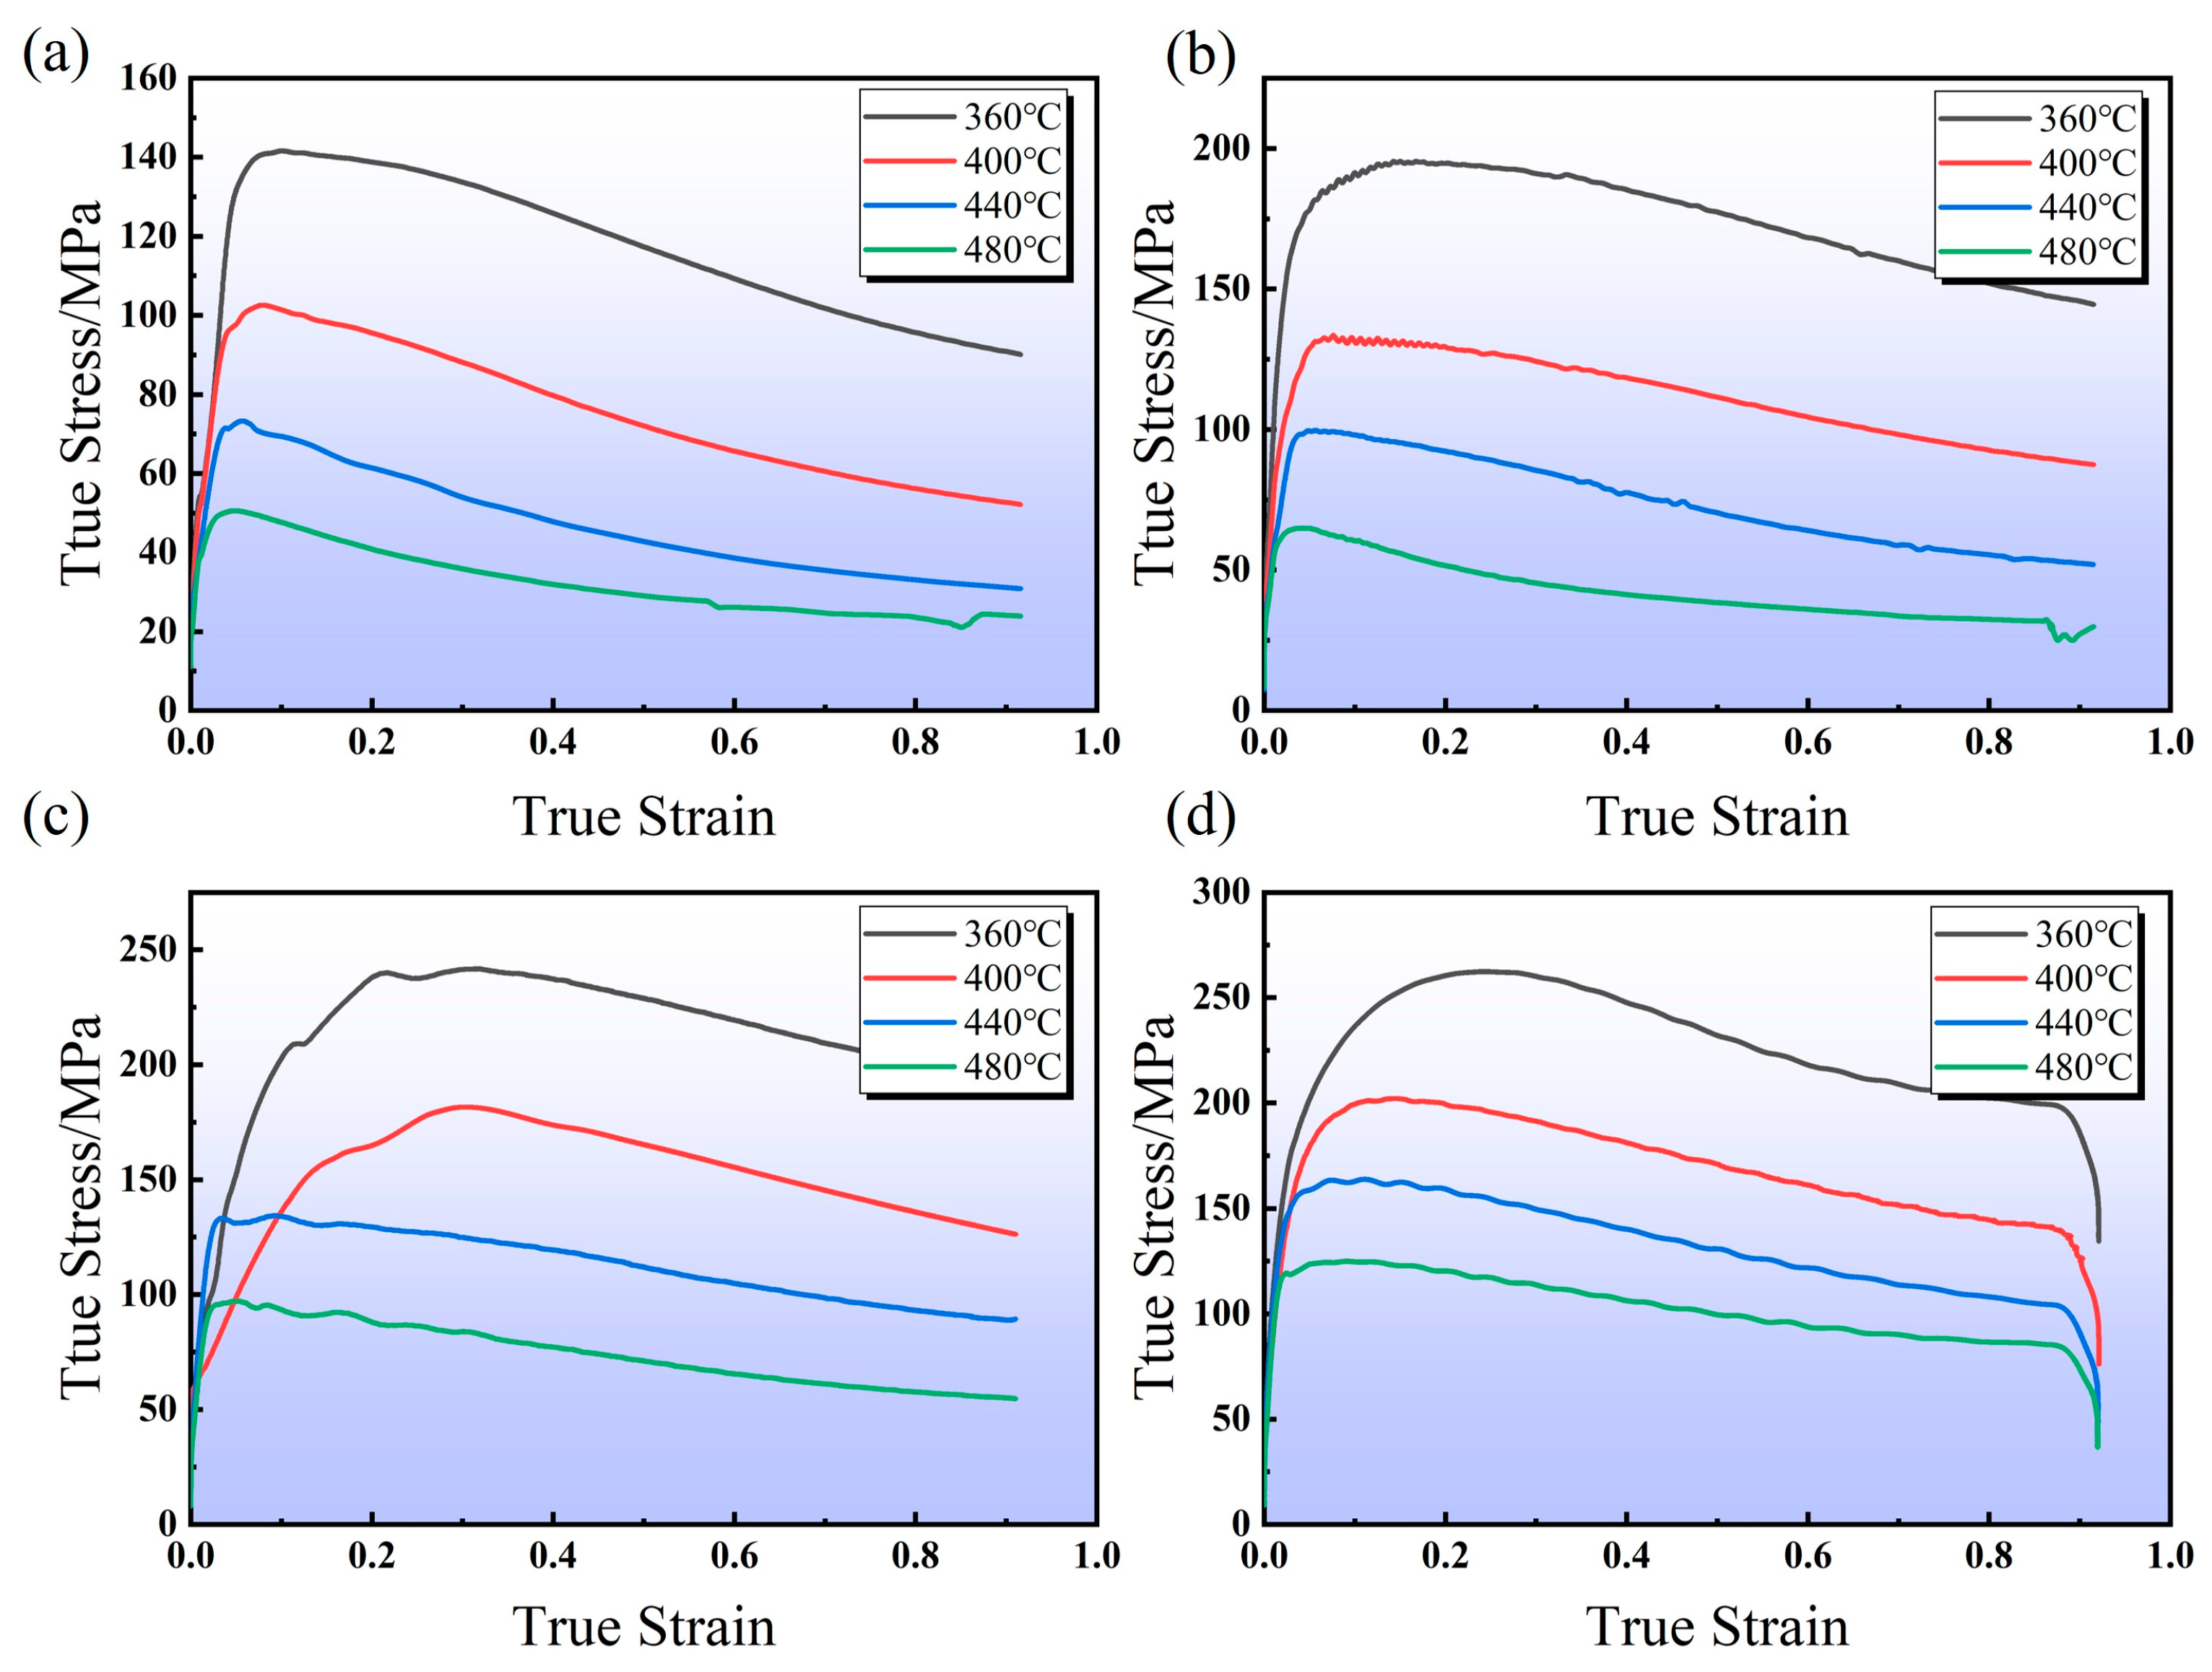
Figure 3 illustrates the stress–strain curves of the Mg-13Gd-4Y-2Zn-0.5Zr alloy under various deformation conditions. The alloy displays the characteristic behaviors of work hardening and dynamic softening during hot processing. Initially, during its deformation, the flow stress experienced a sharp increase with the strain, nearly linearly, owing to the work hardening generated by material deformation. Deformation, dislocation climb, and cross slip prompted the dynamic recovery of the material, subsequently reducing the increasing rate of flow stress. Upon reaching the peak stress, the flow stress began to decline, as the substantial accumulated plastic strain energy within the material was released through phenomena like dynamic recrystallization, marking a phase where strain-softening mechanisms, including dynamic recrystallization, reduce the flow stress. Consequently, the entire hot compression curve exhibited a rapid rise followed by a gradual decline. Comparing the curve results between different temperatures and strain rates, it is evident that the temperature and strain rate directly influence the magnitude of peak stress and the sequence of its occurrence. This is mainly because the coupled effects of different deformation conditions influenced the duration and extent of softening mechanisms. At higher strain rates, the duration of softening is shorter, resulting in a lower softening extent and higher peak stress.
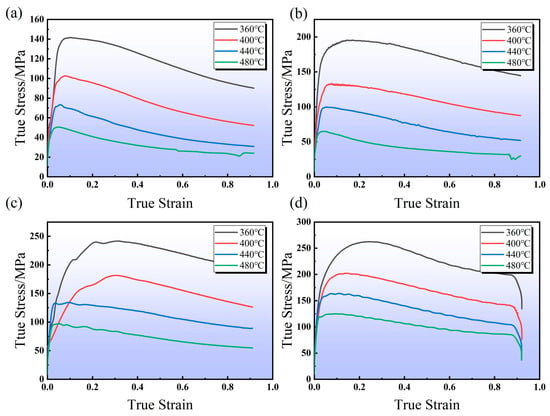
Figure 3.
Stress–strain curves of Mg-13Gd-4Y-2Zn-0.5Zr alloy under various deformation conditions: (a) 0.001 S−1; (b) 0.01 S−1; (c) 0.1 S−1; (d) 1 S−1.
When the deformation temperature remained constant, the flow stress increased with the strain rate for a given deformation level, and the peak stress was observed at a later stage. This behavior is attributed to the shorter durations of processes like dynamic recovery and dynamic recrystallization at higher strain rates, resulting in reduced softening effects and higher flow stress.
Conversely, at a constant strain rate, the flow stress decreased as the temperature rose for the same deformation level. This trend is due to the stronger thermal activation effect at higher deformation temperatures, leading to an increased atomic diffusion rate. Consequently, more dislocation climb and cross slip occurred during the deformation, enhancing the softening effect of the dynamic recovery and reducing the flow stress. Moreover, the recrystallization process, involving nucleation and growth, was influenced by temperature. Higher temperatures promoted the nucleation of the deformed structure, intensifying the softening effect induced by dynamic recrystallization and resulting in a decline in the flow stress curve.
In summary, the flow stress curve of the Mg-13Gd-4Y-2Zn-0.5Zr alloy exhibits typical characteristics of a dynamic recrystallization-type curve. The thermal processing parameters, such as the deformation temperature and strain rate, significantly influenced the dynamic recrystallization behavior of the alloy, with higher temperatures and lower strain rates favoring dynamic recrystallization [4].
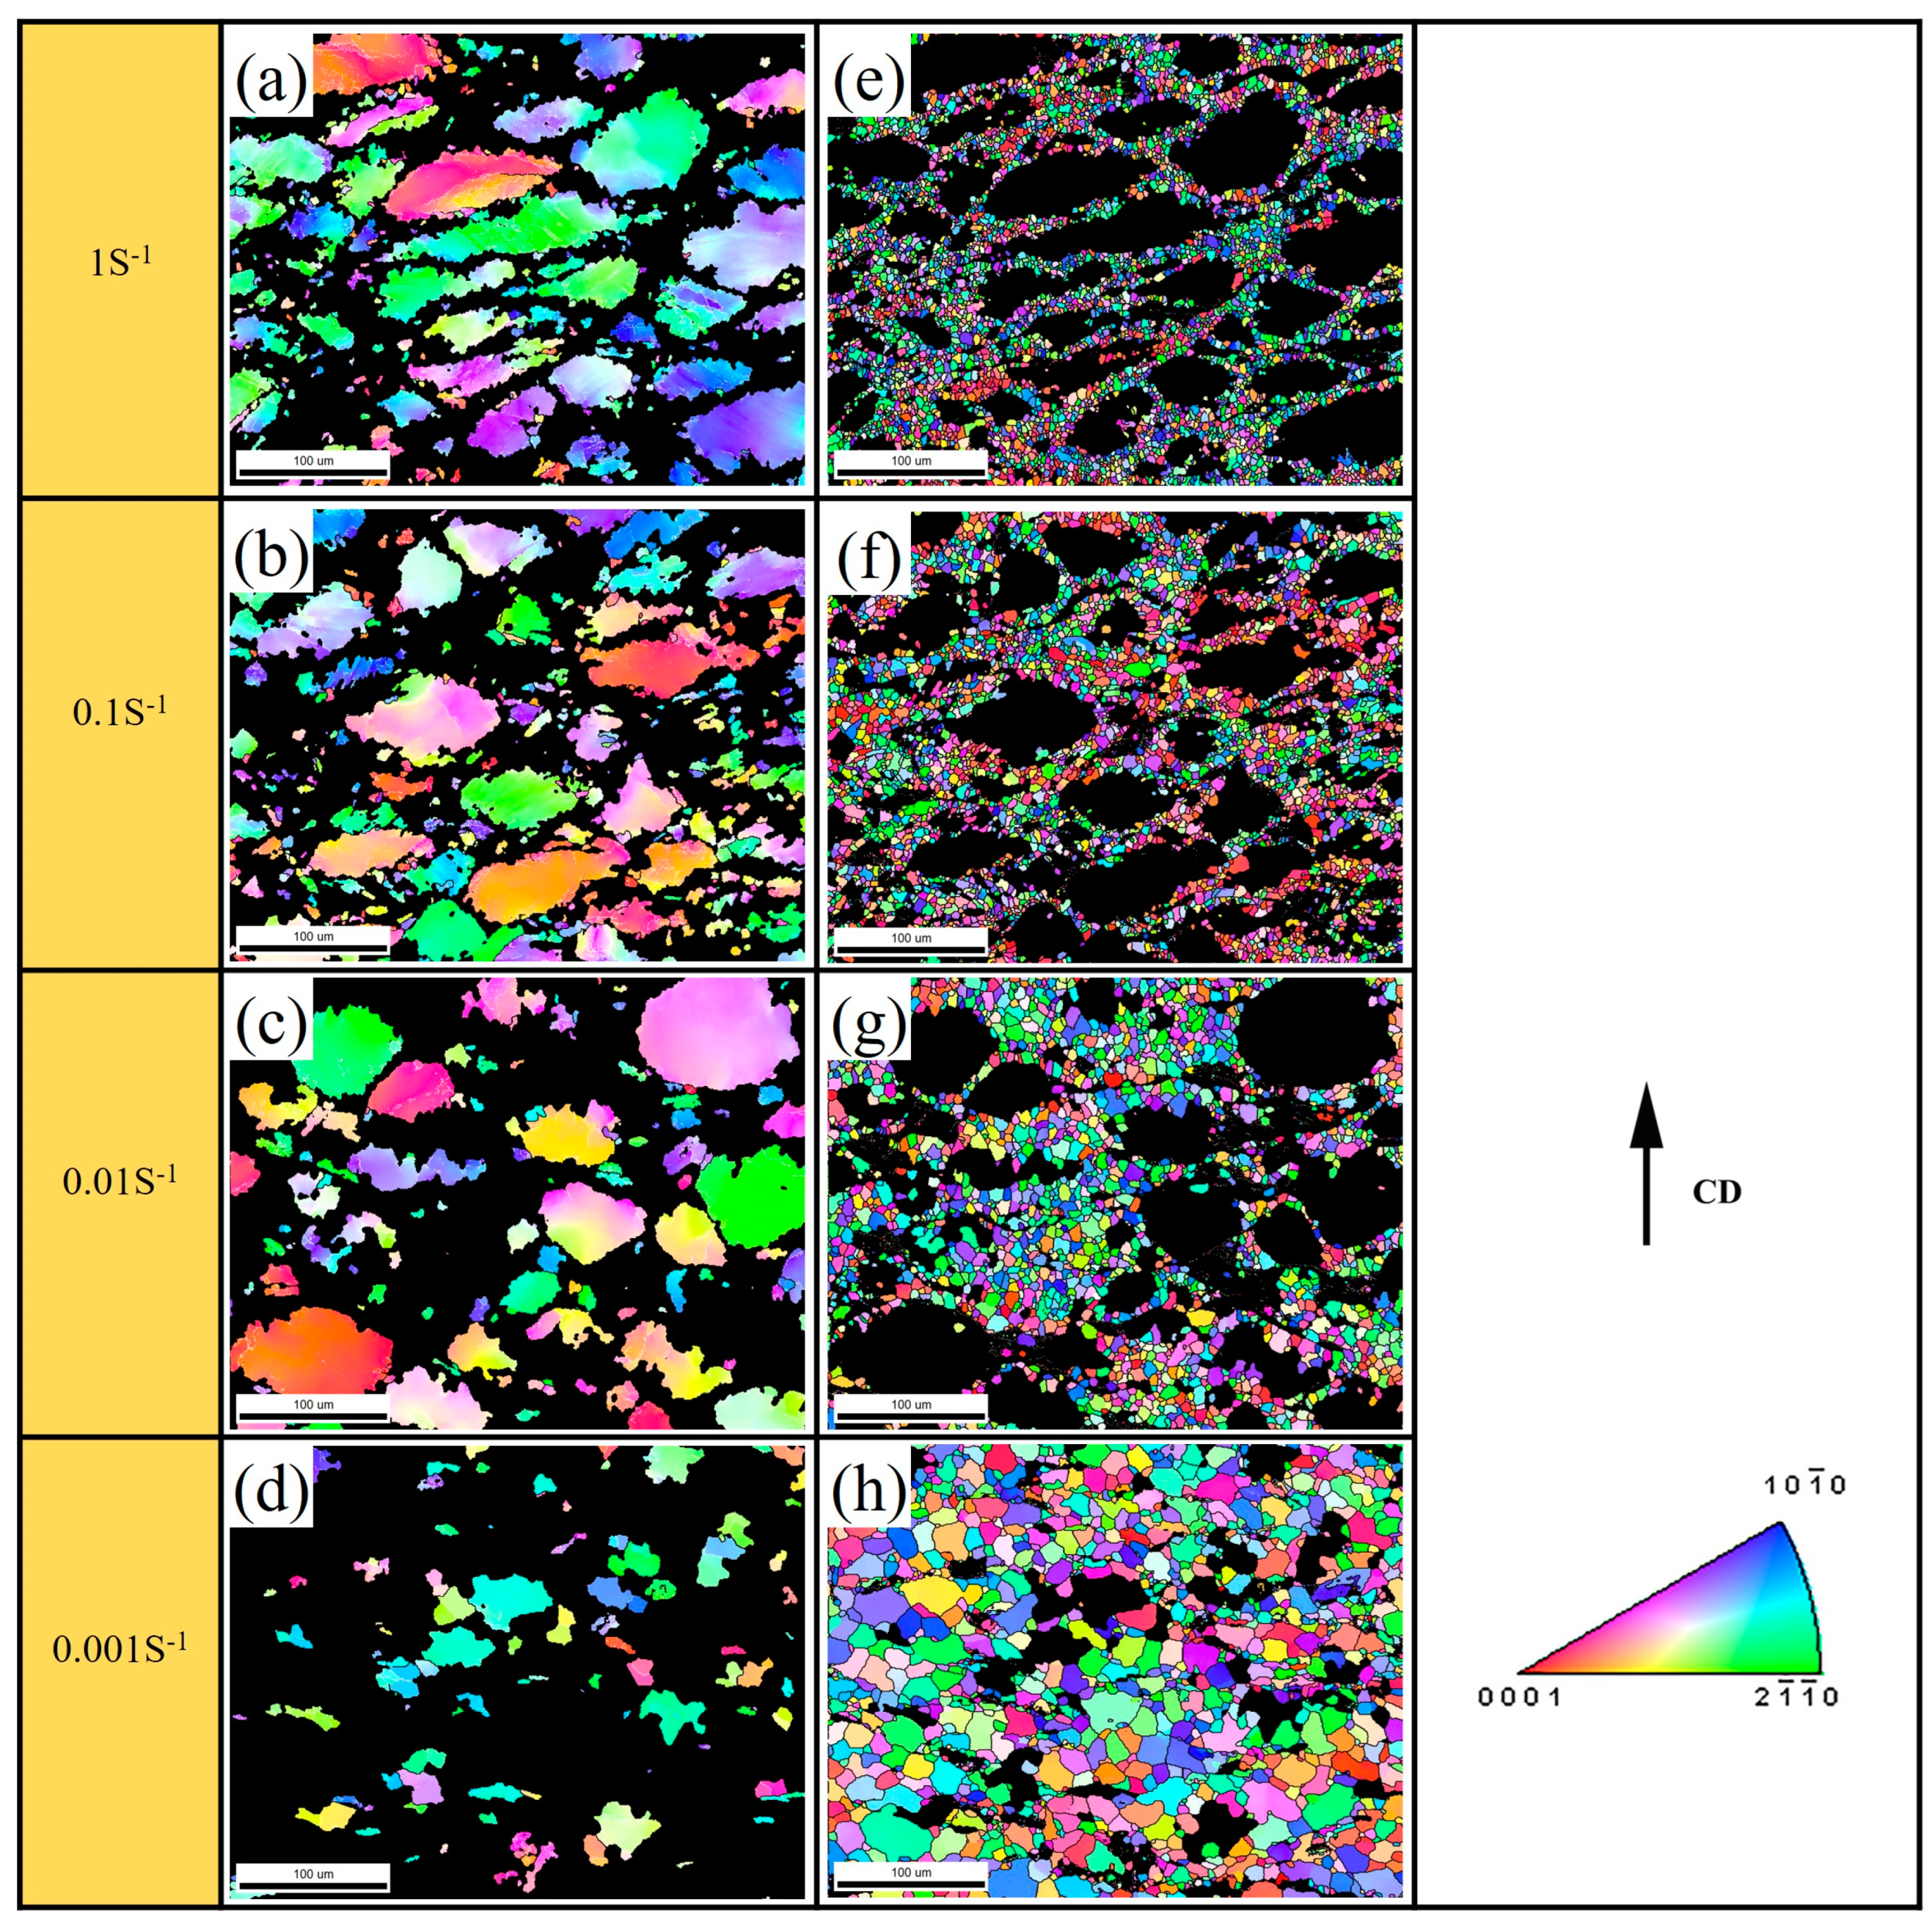
The impact of the strain rate on the dynamic recrystallization microstructural evolution is depicted in Figure 4. During hot processing, the strain rate primarily modulated the nucleation frequency, (i.e., the occurrence rate of dynamic recrystallization throughout the entire hot deformation process) and the duration of grain growth [22], thus refining the microstructure. It is apparent that, at lower strain rates, a greater number of recrystallized grains emerged along the original grain boundaries. At a constant deformation temperature (470 °C), a lower strain rate corresponded to a smaller average grain size and a higher recrystallized fraction, as depicted in Table 2. This phenomenon arose from the reduced deformation time at higher strain rates, resulting in fewer nucleation events and the inadequate growth of dynamic recrystallized grains within shorter growth cycles, thereby reducing the proportion of dynamic recrystallized grains relative to the overall microstructure. Conversely, as the strain rate decreased, a prolonged duration was necessary to complete the deformation process under the same deformation level. Given a constant nucleation probability, this led to an increased number of recrystallization grains. Concurrently, the initial recrystallized grains underwent prolonged growth periods, resulting in coarser recrystallized grains at lower strain rates. However, from a statistical standpoint, the abundance of new dynamic recrystallization grain nuclei tends to yield smaller average grain sizes at lower strain rates.
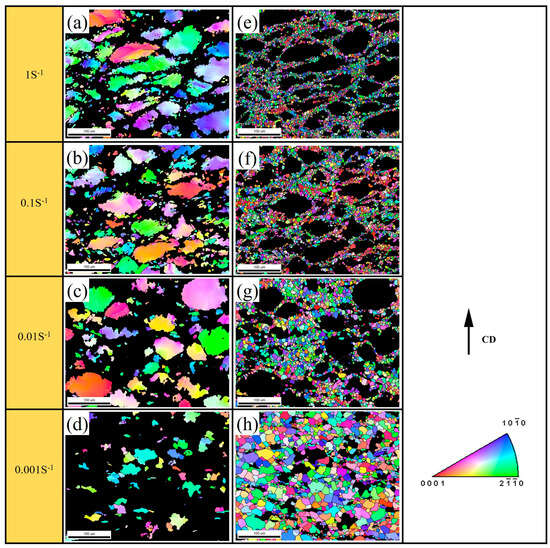
Figure 4.
The influence of different strain rates at 470 °C on the dynamic recrystallization microstructure of Mg-13Gd-4Y-2Zn-0.5Zr alloy: (a,e) 1 S−1; (b,f) 0.1 S−1; (c,g) 0.01 S−1; (d,h) 0.001 S−1. Herein, CD denotes the compression direction, where (a–d) represent the parent phase grains under corresponding strain rates, while (e–h) denote dynamically recrystallized grains matching them.

Table 2.
Dynamic recrystallization rate (DRX/%), average grain size (GS-1/μm), and dynamic recrystallization average grain size (GS-2/μm) of alloy during hot compression deformation.
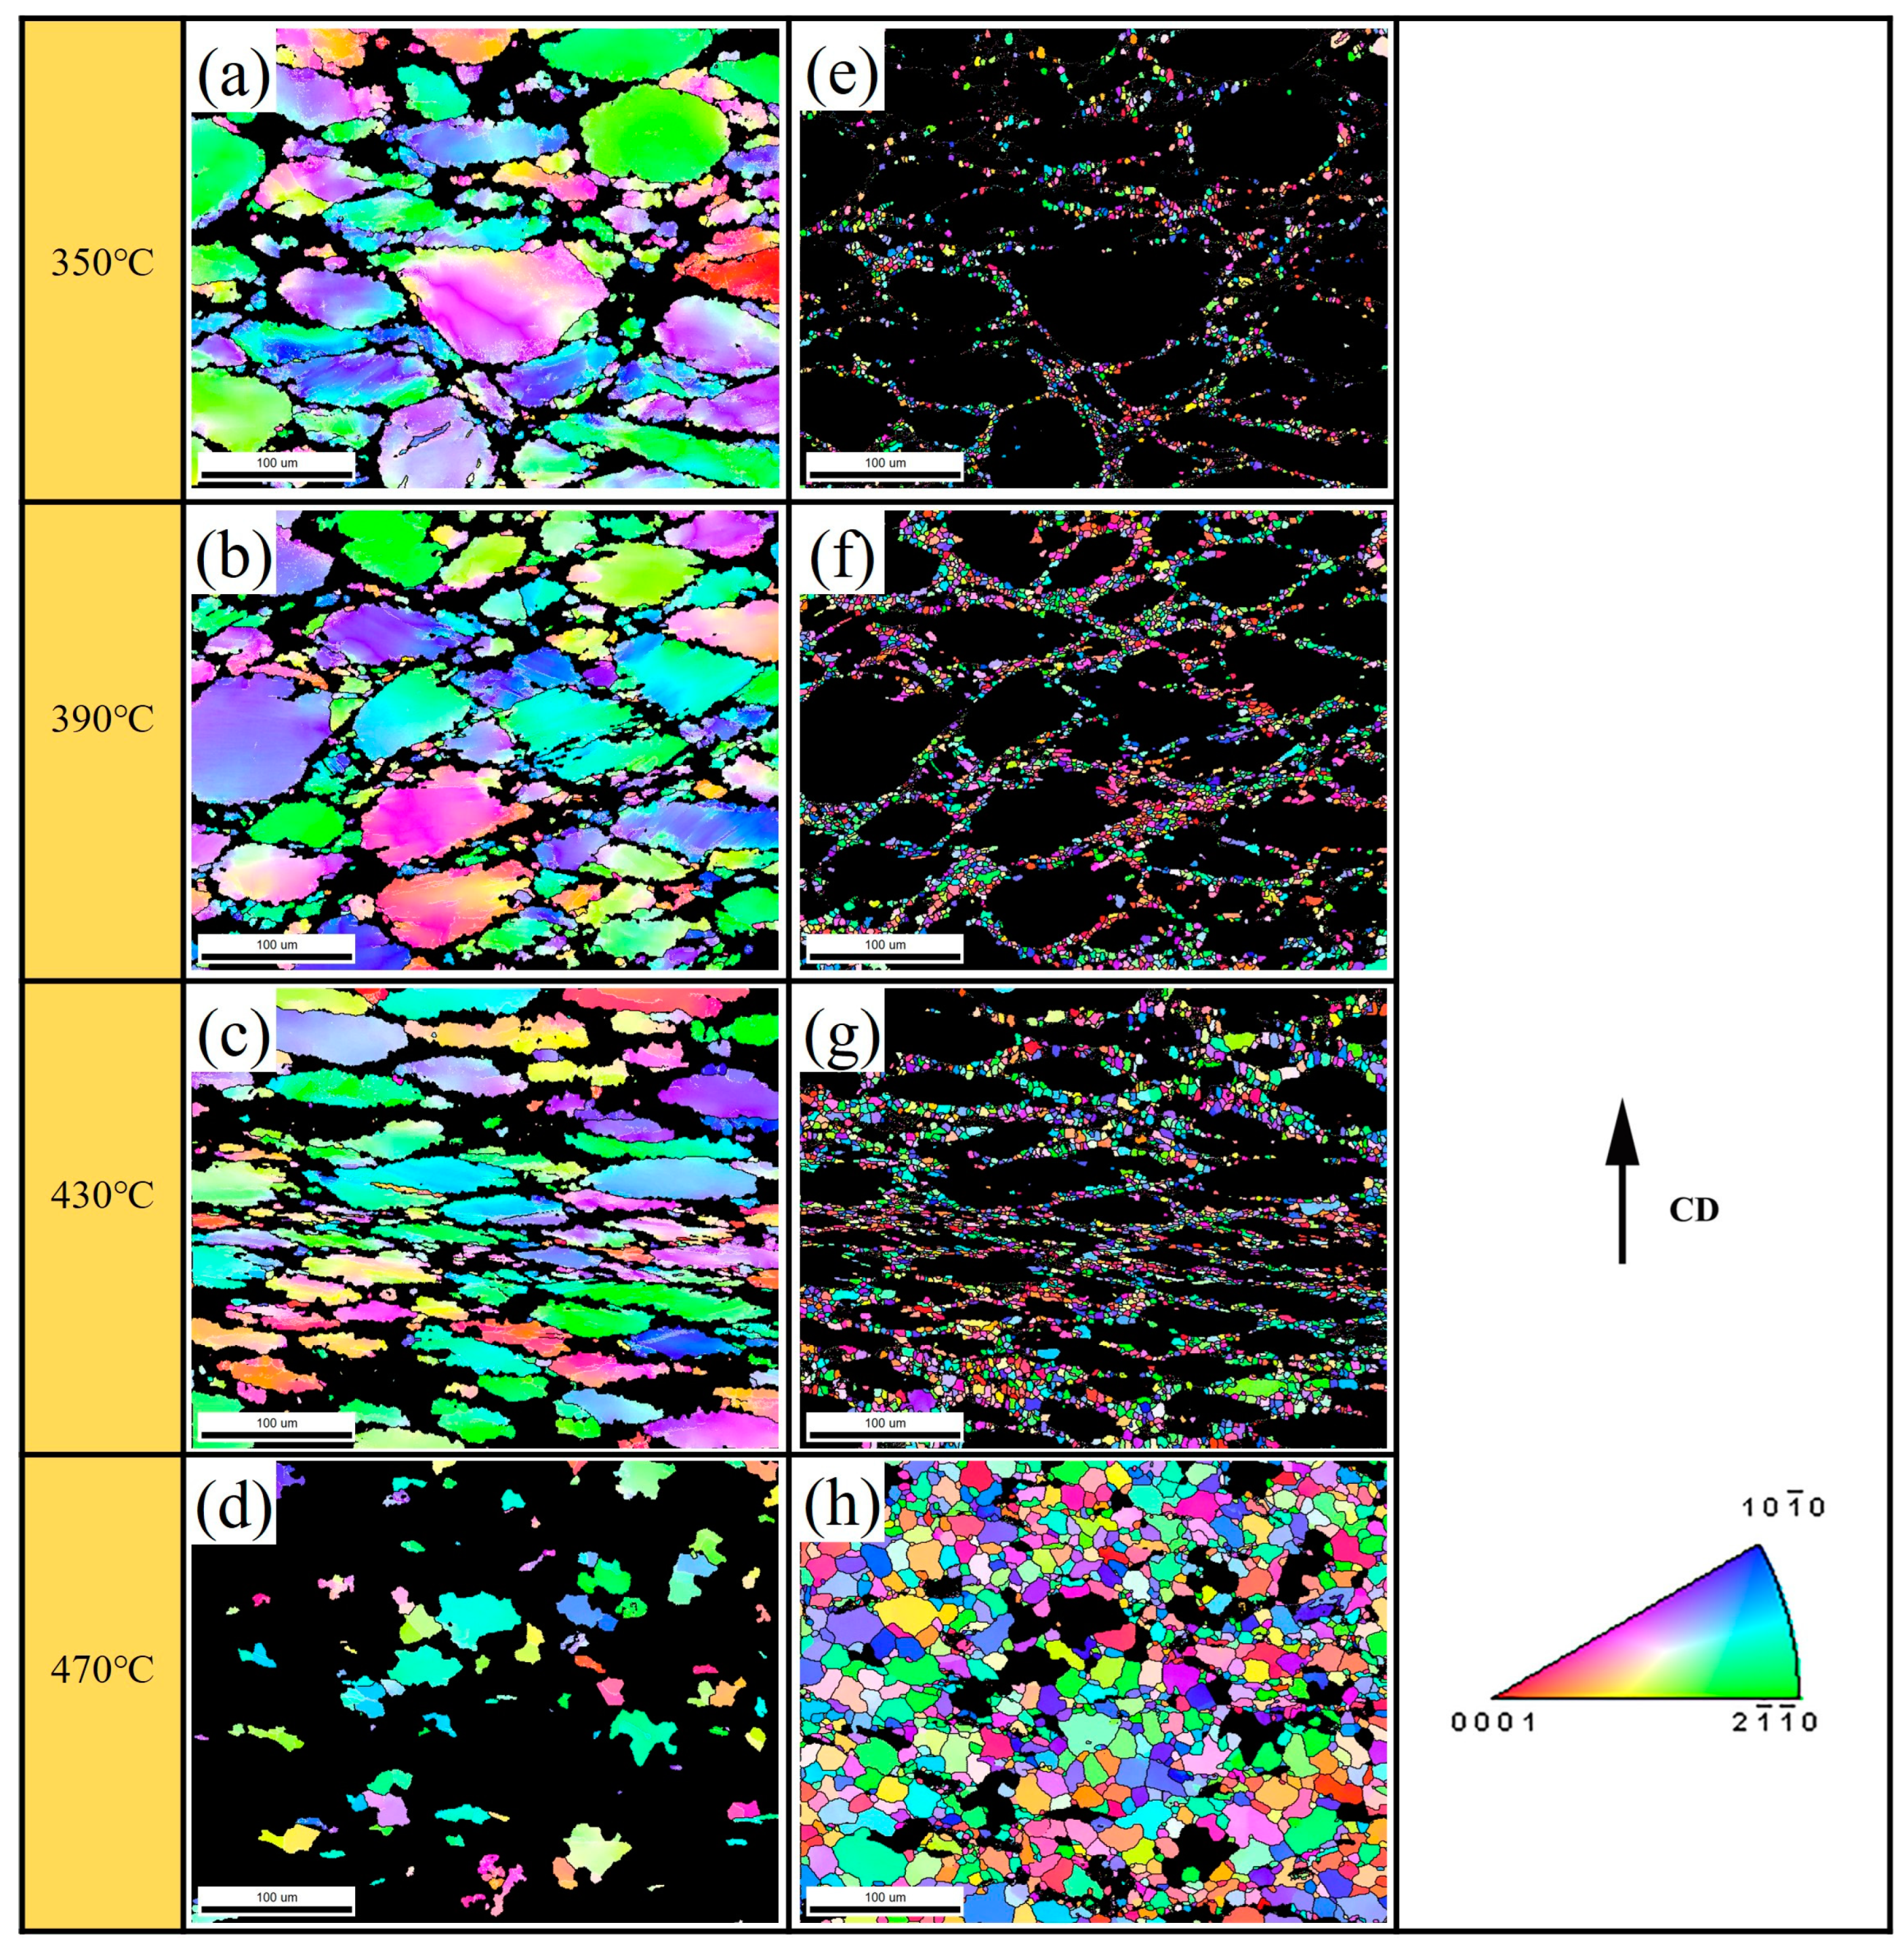
Temperature plays a pivotal role in influencing the microstructural evolution during hot deformation processes. At higher temperatures, the activation energy of atoms changes, making it easier for them to transition into new states, thereby influencing the nucleation and growth processes. Figure 5 delineates the dynamic recrystallization microstructural morphology of the Mg-13Gd-4Y-2Zn-0.5Zr alloy compression specimens subjected to 60% deformation and a strain rate of 0.001 S−1 at various deformation temperatures. Table 3 presents the disparities in the average grain size and dynamic recrystallization fractions among the different temperatures. As depicted in Figure 5, it is evident that, at 470 °C, there was a significant increase in the number of newly formed dynamic recrystallized grains, accompanied by an elevated dynamic recrystallization fraction. Additionally, visually, the grain size appeared to be larger. This phenomenon can be attributed to several factors relevant to nucleation processes. Firstly, elevated temperatures prompt heightened atomic instability, facilitating the surmounting of energy barriers, and thereby promoting a greater frequency of nucleation events for recrystallization. Furthermore, the prevailing viewpoint [23] suggests that the gestation cycle is primarily correlated with changes in the dislocation density within the matrix. With increasing temperatures, the activity of substructures represented by dislocations intensifies, facilitating climb and annihilation, and thereby reducing the rate of dislocation accumulation. Consequently, elevated temperatures can shorten the gestation period necessary for dynamic recrystallization in materials while simultaneously increasing the frequency of nucleation events for recrystallization. When it comes to the growth of grains, higher temperatures induce grain coarsening, while the enlargement of recrystallized grains tends to overlay the initial matrix structure. Considering these factors collectively, it is evident that higher temperatures lead to microstructures with higher dynamic recrystallization fractions, while the increased number of newly formed recrystallized grains contributes to smaller average grain sizes.
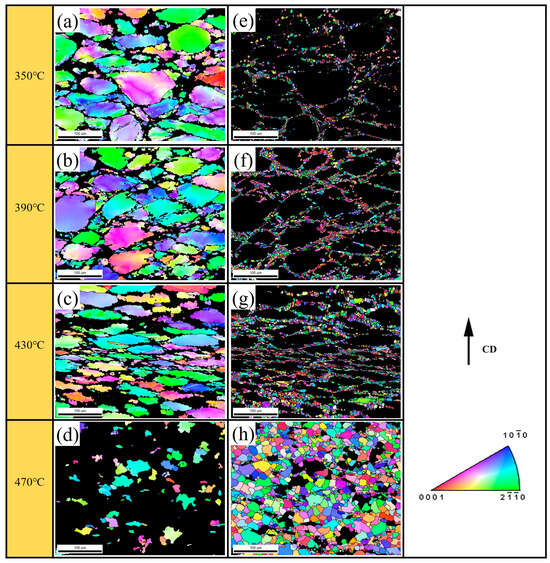
Figure 5.
The influence of different temperatures at 0.001 S−1 on the dynamic recrystallization microstructure of Mg-13Gd-4Y-2Zn-0.5Zr alloy: (a,e) 350 °C; (b,f) 390 °C; (c,g) 430 °C; (d,h) 470 °C. Herein, CD denotes the compression direction, where (a–d) represent the parent phase grains under corresponding temperatures, while (e–h) denote dynamically recrystallized grains matching them.

Table 3.
Dynamic recrystallization rate (DRX/%), average grain size (GS-1/μm), and dynamic recrystallization average grain size (GS-2/μm) of alloy during hot compression deformation.
4.2. Simulation Results and Discussion
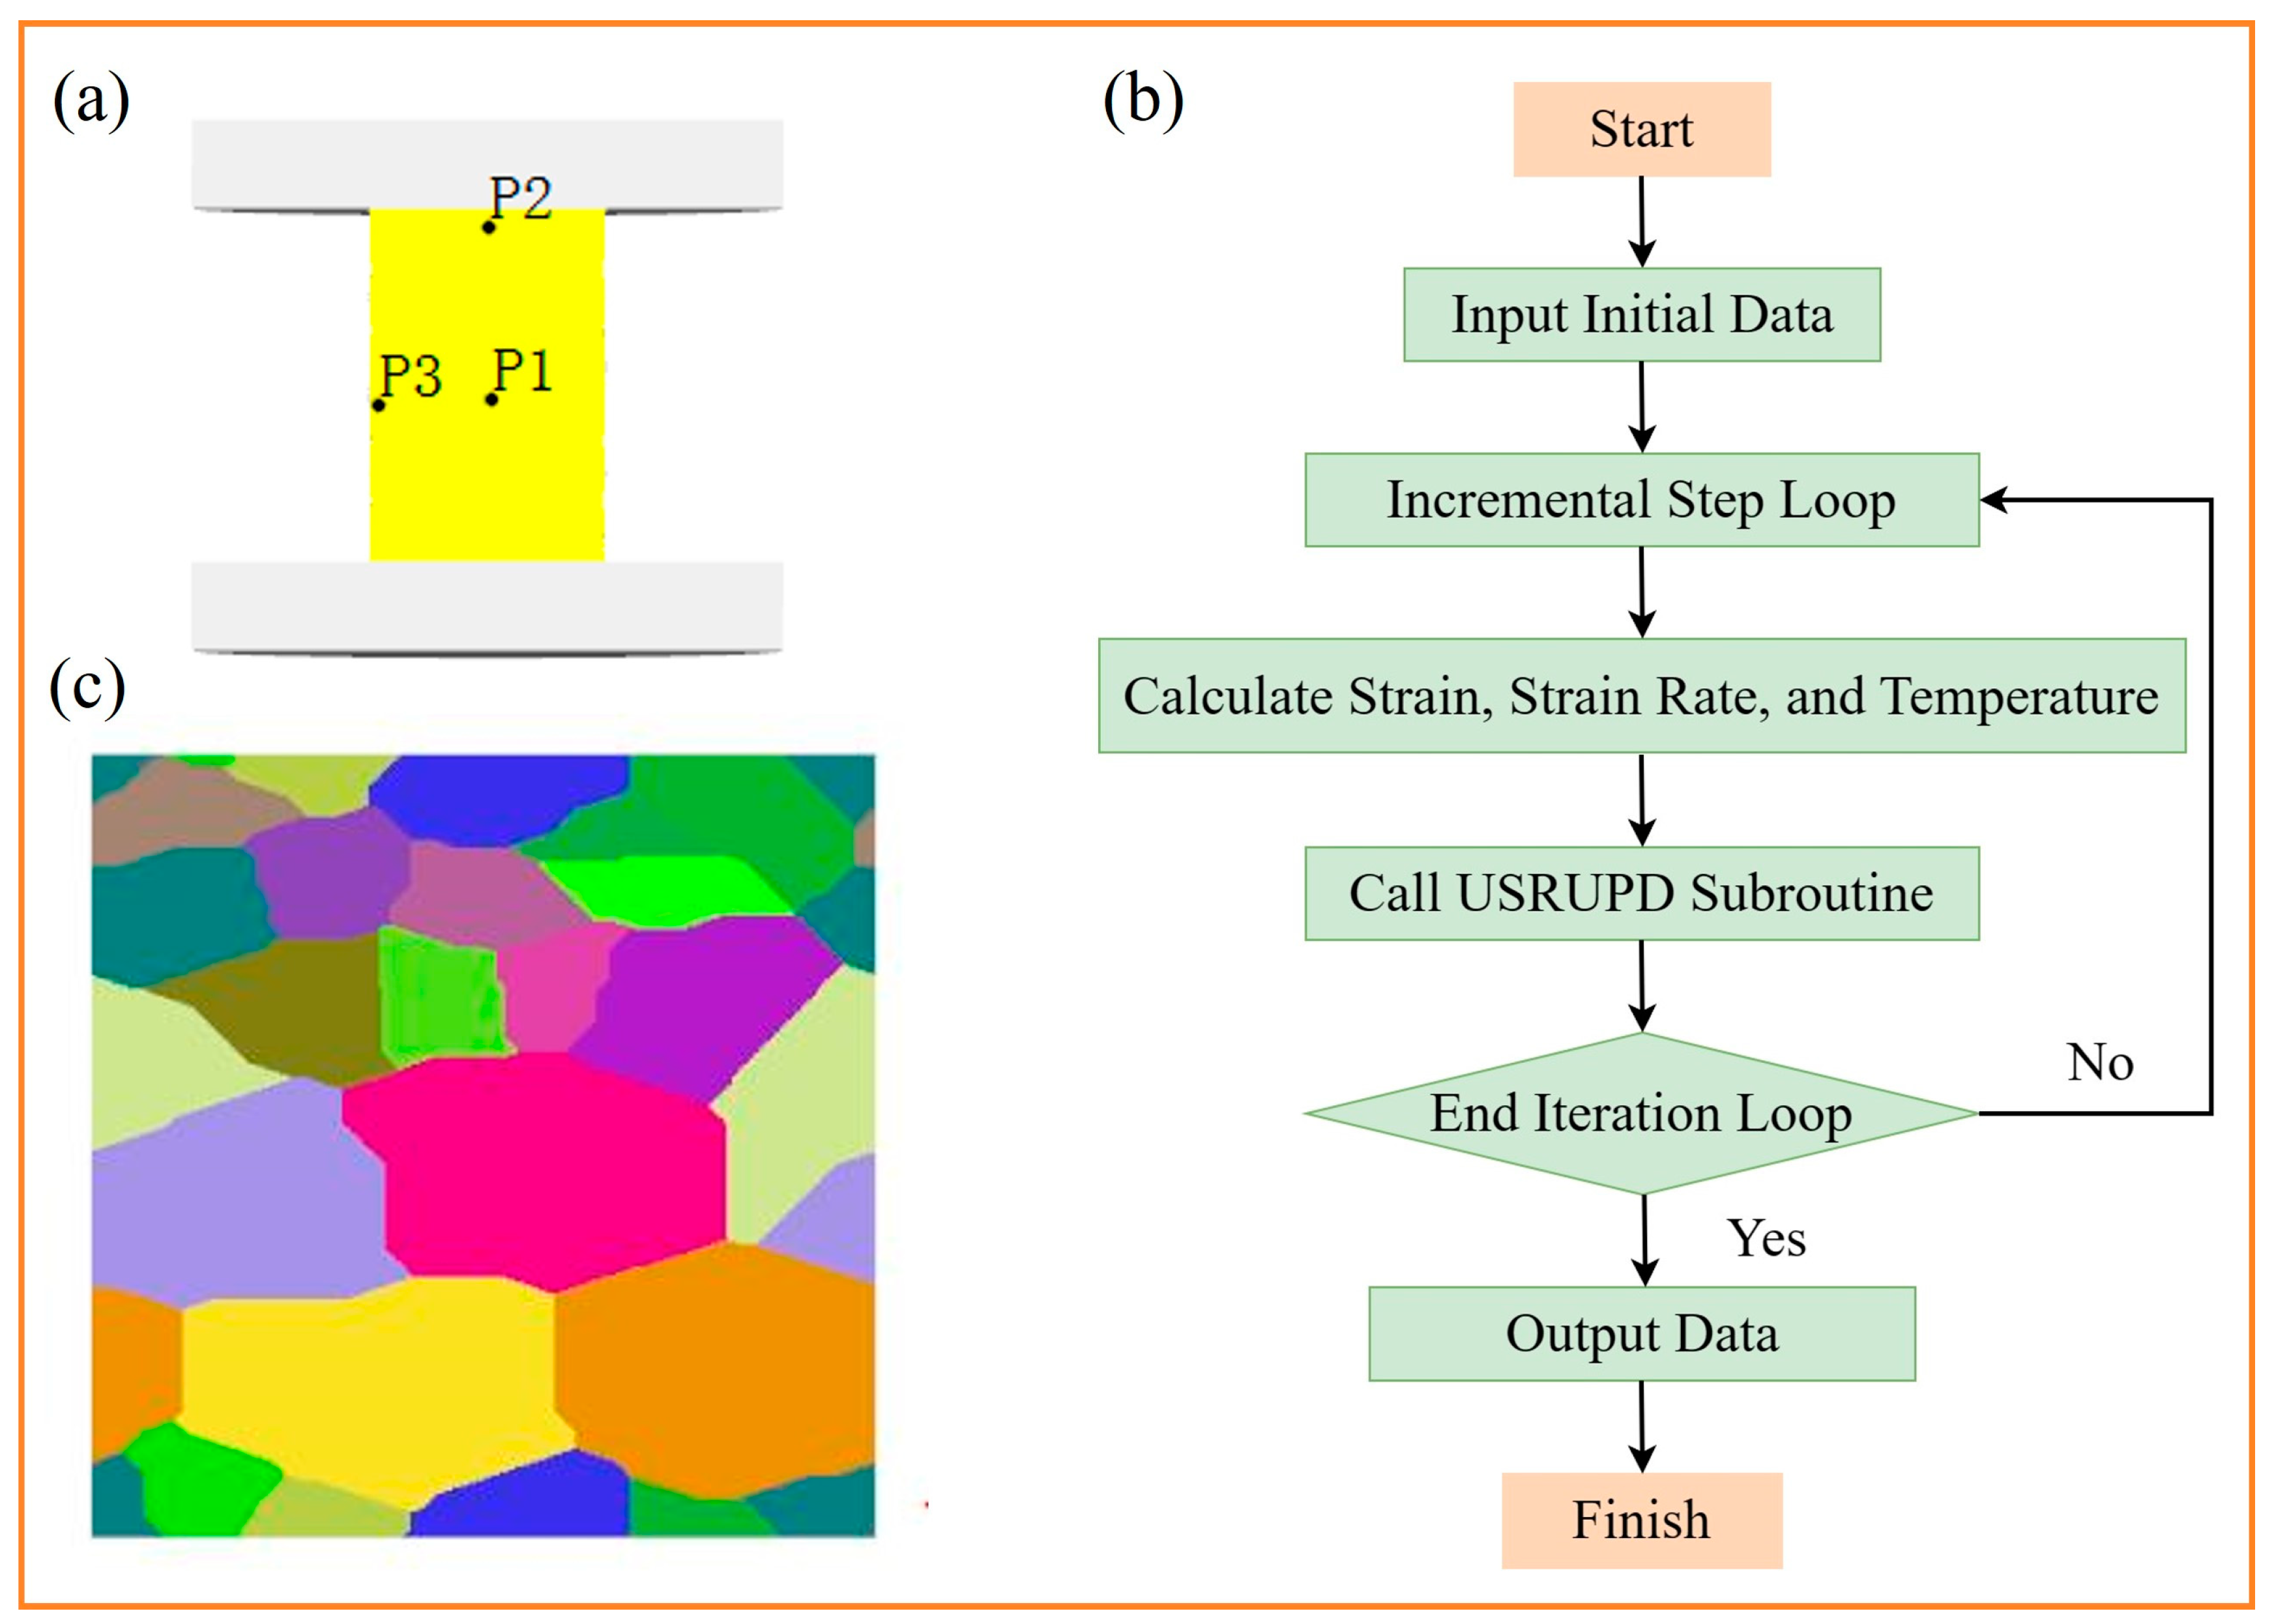
DEFORM-3D facilitates users in defining the plastic flow behavior of materials by inputting rheological stress data under various process conditions. In this investigation, a rheological stress model was selected. Utilizing available experimental data, multiple data points at different temperatures and deformation rates were carefully selected and evenly distributed to ensure precision. These data points were then entered into the software’s data table, and the software automatically interpolated them to generate stress–strain curves. Subsequently, upon accessing the sub-menu, each physical property parameter of the material was systematically and meticulously included and stored, thereby establishing the alloy’s material repository. Through analysis of the results of the hot compression experiments, the various models mentioned earlier were calculated. Furthermore, the user subroutine of DEFORM-3D underwent further development, wherein the relevant models were incorporated into the software’s subroutine using the FORTRAN 11.0 language. The computational procedure of the dynamic recrystallization subroutine within the software is depicted in Figure 6b.
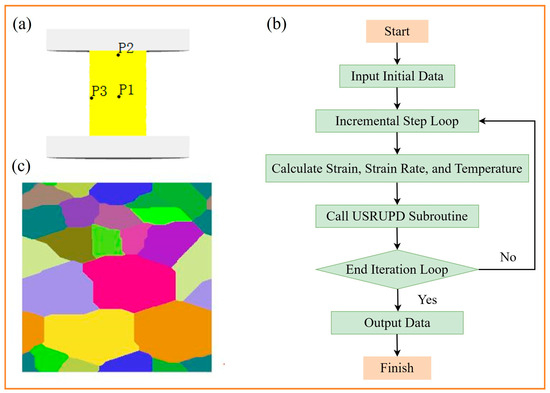
Figure 6.
Preset conditions for simulating microstructural evolution in DEFORM software. (a) The selection of deformation characteristic points on the workpiece; (b) the computational process of the dynamic recrystallization subroutine within the software; (c) a parent phase microstructure diagram generated by the cellular automaton (CA) model.
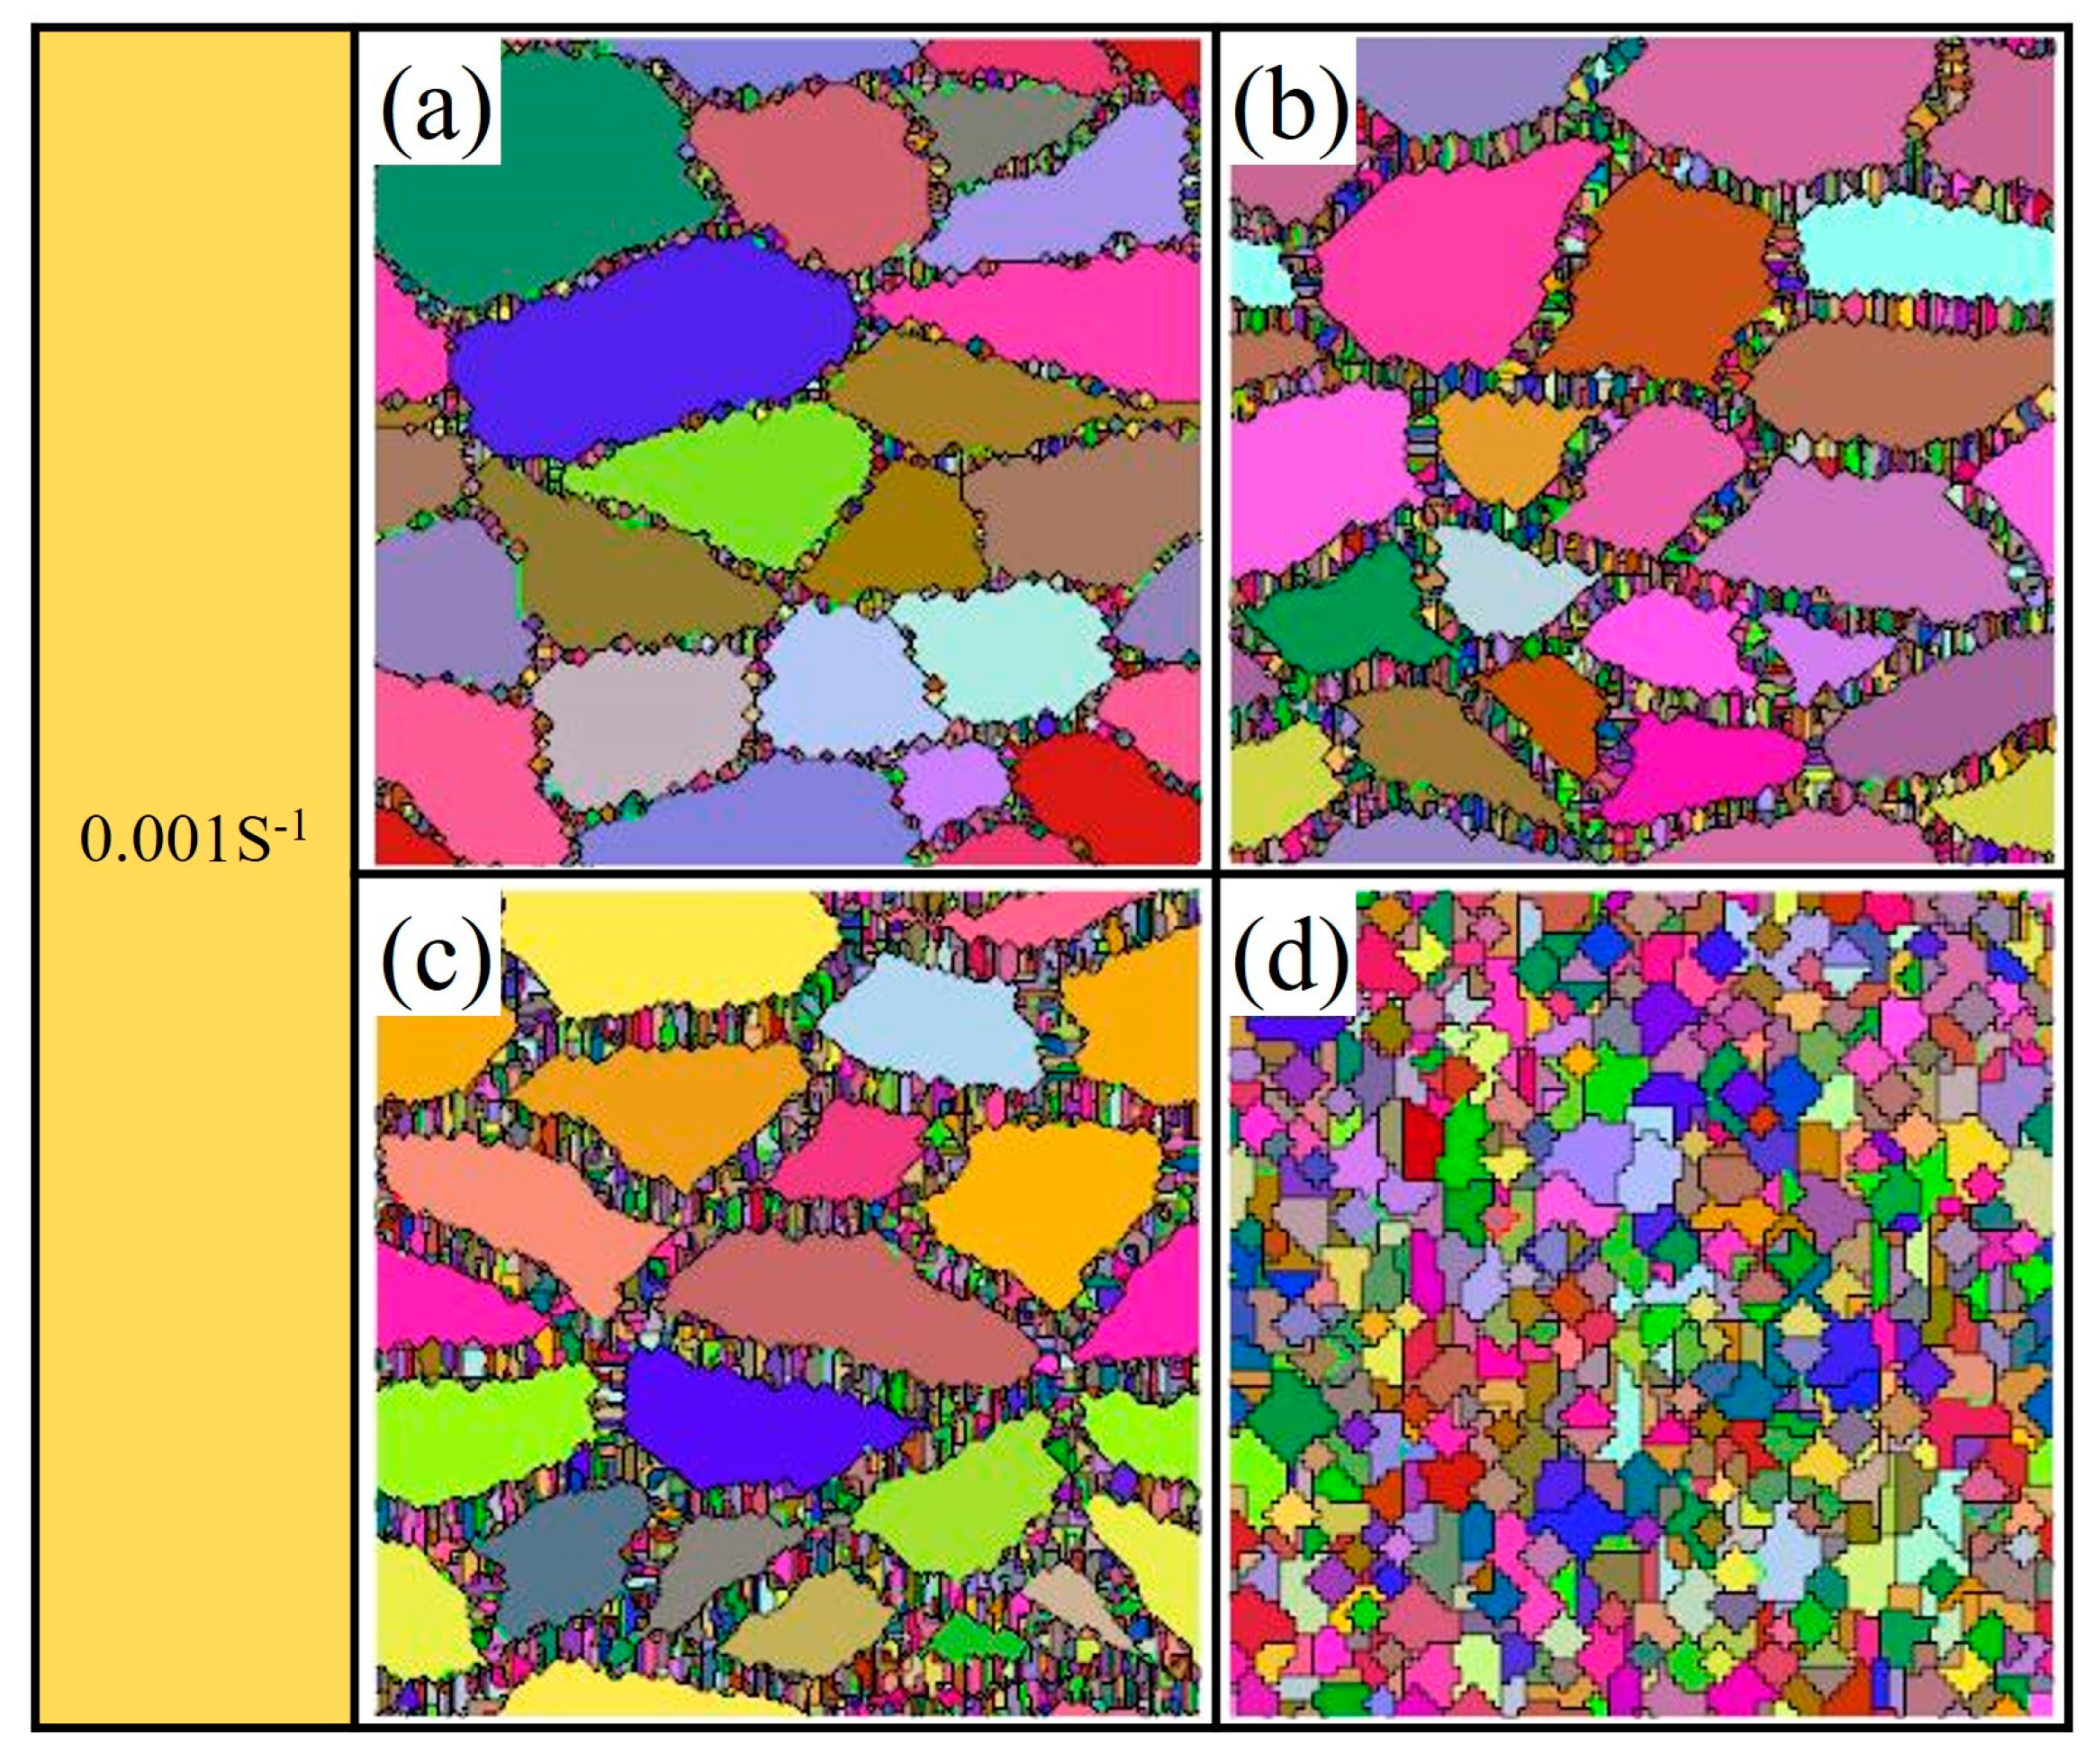
Following the secondary development, simulations of microstructural evolution during hot deformation were conducted using the CA module of DEFORM software. This model facilitated the quantitative analysis and dynamic visualization of microstructural changes during the high-temperature deformation. Employing periodic boundary conditions, the CA model in DEFORM represents an infinite space, with neighbor types determined using the Moore eight-neighbor criterion. The selected area was subdivided into quadrilateral cells measuring 210 rows by 210 columns, each with a side length of 2 μm, effectively representing an actual sample area of 420 μm by 420 μm. Throughout the simulation of microstructural evolution, the initial dislocation density of the cells was set to 0.01 μm−2. Across the entire hot deformation stage, the dislocation density within the cells fluctuated with the level of deformation, conforming to the classical KM equation. Cells positioned at the grain boundaries underwent recrystallization nucleation only under specific conditions. Following nucleation, the dislocation density of the cells reverted to its initial value, and the newly nucleated cells grew according to the previously described recrystallized grain growth model. With an extended simulation time, the recrystallized grains persisted in nucleating and growing, gradually encasing the original matrix structure. The dislocation density within the newly formed recrystallized grains continued to evolve in accordance with the KM model.
During deformation, when the critical strain is reached or exceeded, nucleation occurs randomly at the grain boundaries of the parent phase. The newly formed nuclei grow outward through grain boundary migration, consuming the parent phase. Simultaneously, nucleation and grain growth continue, resulting in a chain-like distribution of new recrystallized grains surrounding the parent phase. This process leads to the formation of new grain boundaries between the parent phase and the newly formed recrystallized grains, as well as among different recrystallized grains. When the predetermined strain threshold is reached, the dynamic recrystallization process concludes, with most of the parent phase being replaced by smaller dynamic recrystallized grains. The dynamic recrystallization process was vividly portrayed in the cellular automaton simulations, closely aligning with the foundational principles of classical theoretical descriptions.
During the thermal compression simulation, cylindrical specimens matching the specifications (Φ8 × 12 mm) of physical experiments were utilized, ensuring complete consistency in the deformation conditions. The billet model was defined as a plastic body, with a finite element mesh comprising 50,000 elements, while both upper and lower dies were set as rigid bodies. Owing to the non-uniformity of deformation, resulting in varied equivalent strains across specimen regions, representative points P1, P2, and P3 (as depicted in Figure 6a) were initially chosen for analysis. Subsequently, microstructural evolution was simulated based on these analyses. Figure 6c illustrates the microstructure generated using the CA method, exhibiting a grain distribution pattern largely in line with the actual scenario, with notable agreement in grain morphology. Statistical analyses based on electron backscatter diffraction (EBSD) observations determined the initial average grain size of the parent phase to be 85 μm for simulation purposes.
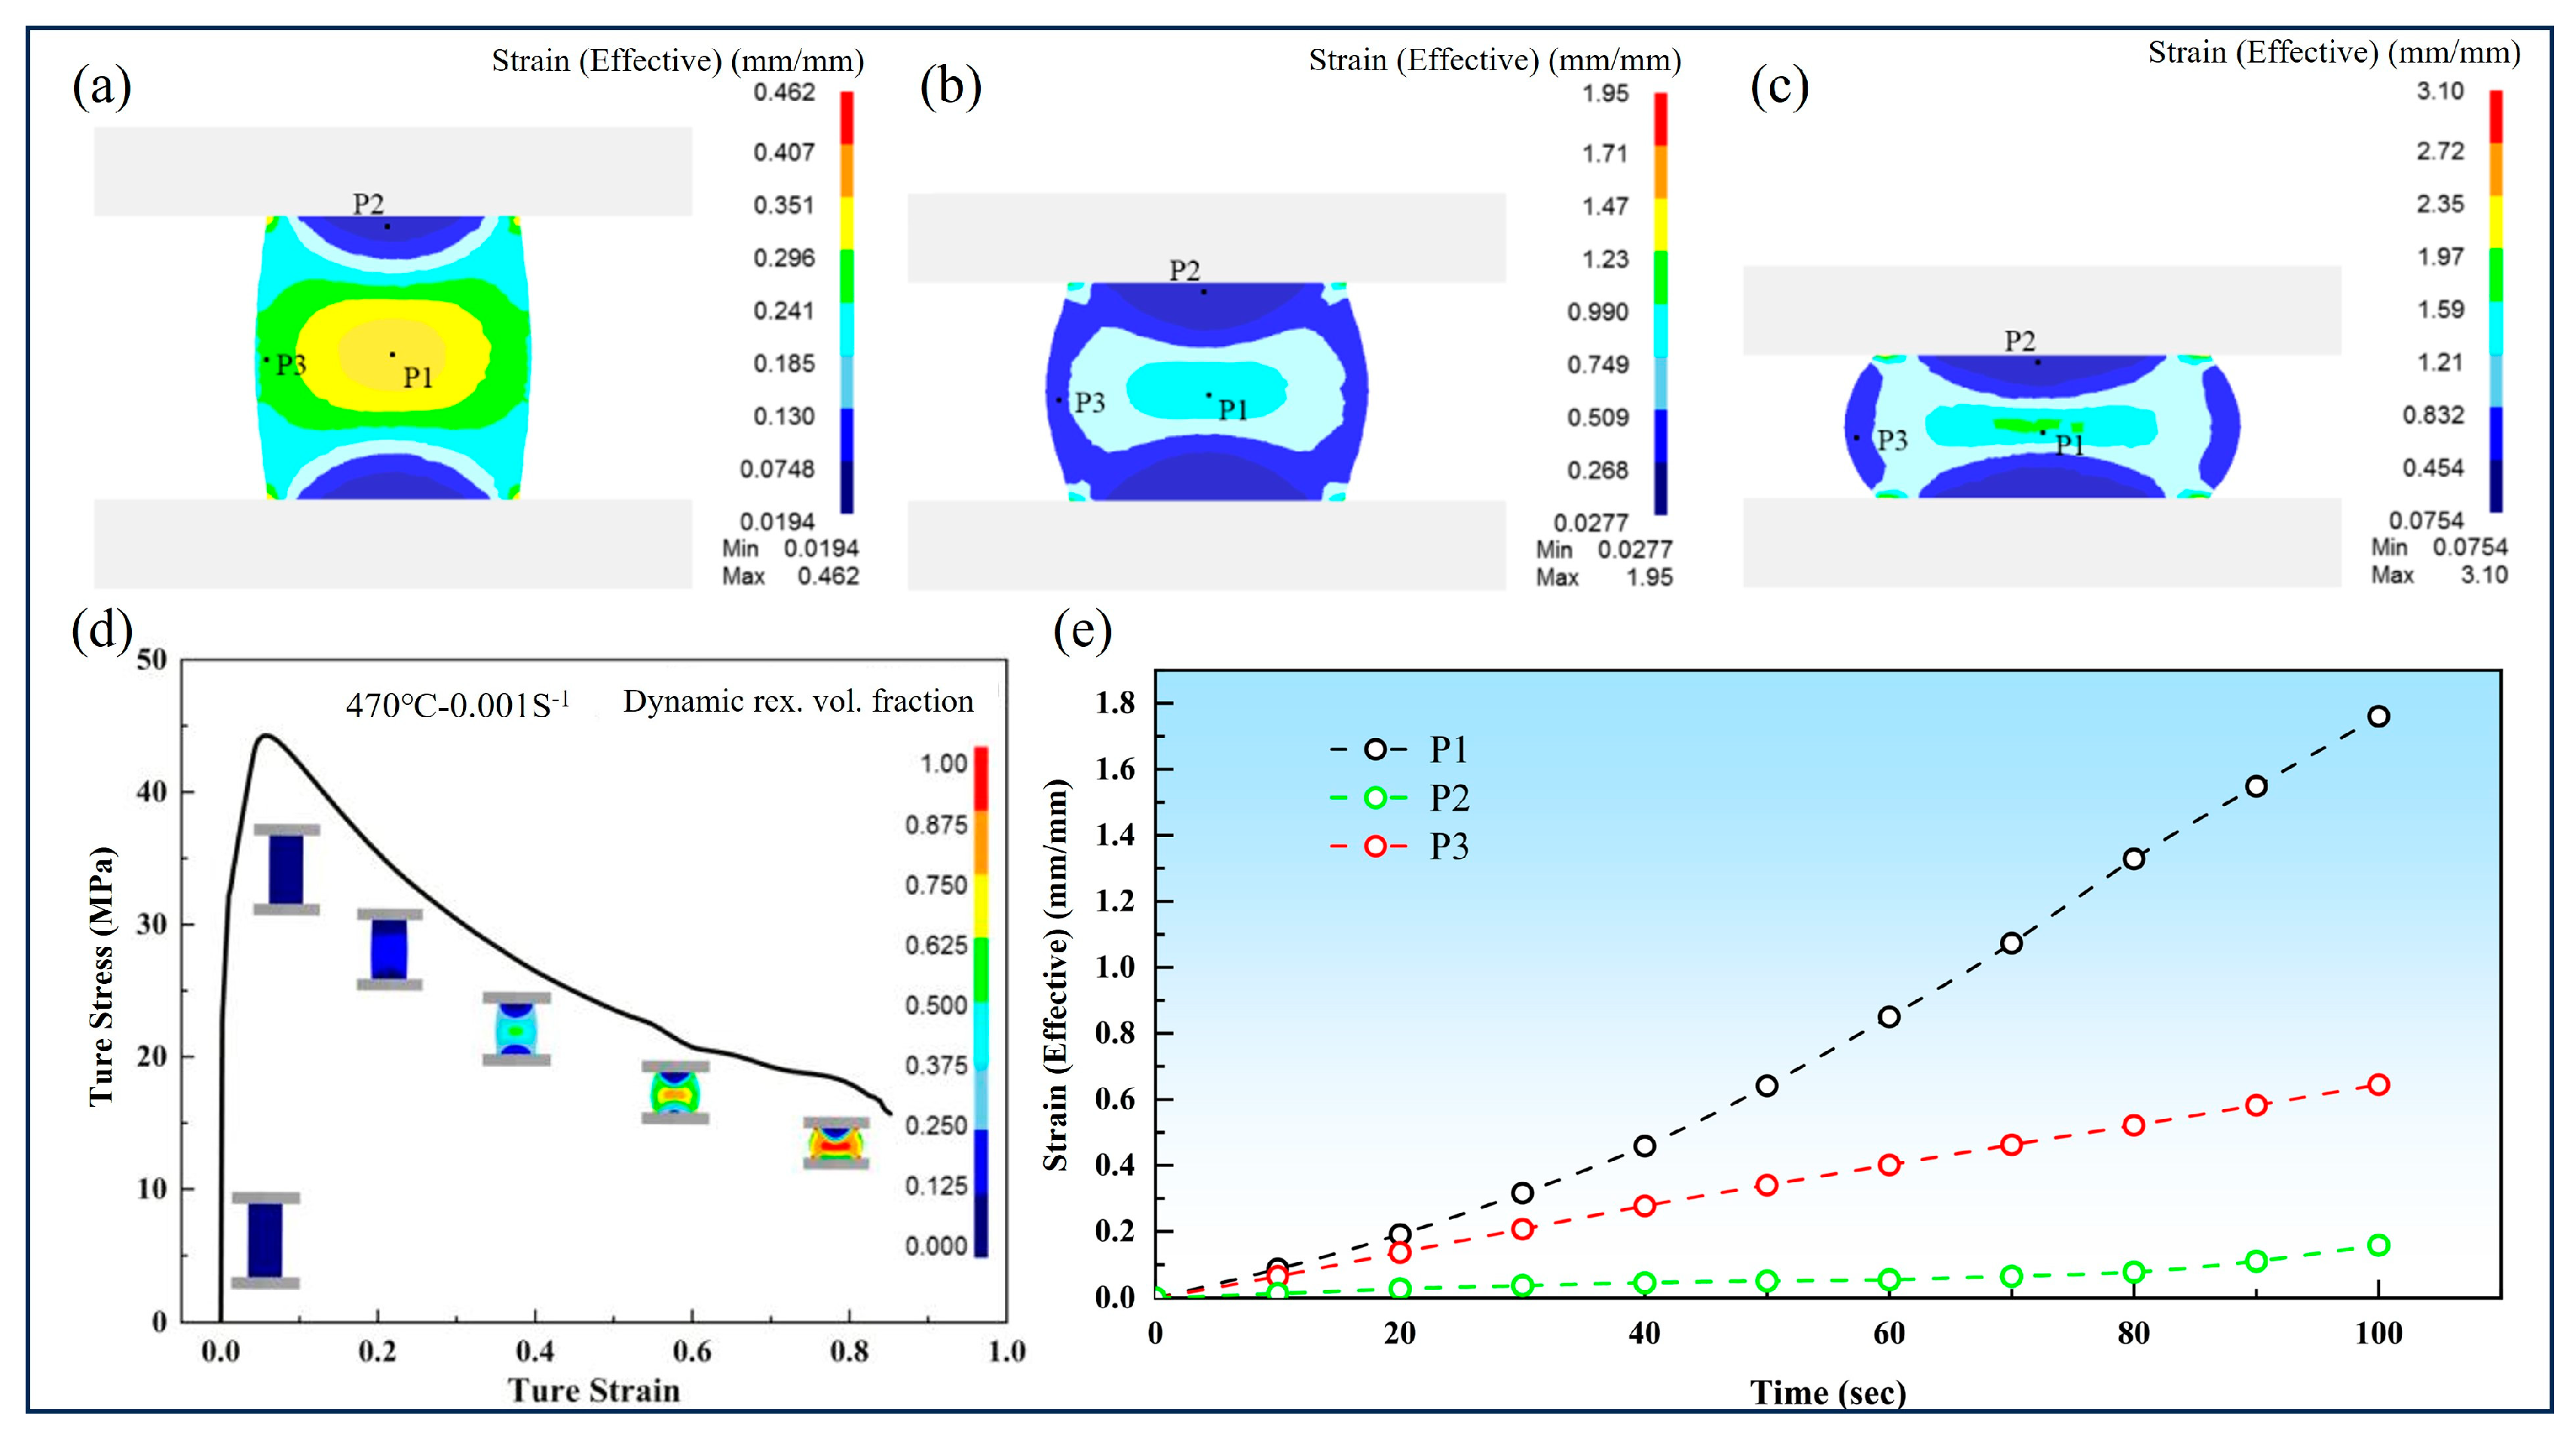
From the evolution curves and contour maps of the equivalent strain (Figure 7), it is evident that the distribution of the equivalent strain in the high-temperature alloy billet at the end of hot compression varied significantly across different locations. The following three primary regions emerged: the central zone displayed the highest equivalent strain, while the bulging area exhibited a lower equivalent strain compared to the central region, with the regions in contact with the upper and lower dies showing the least equivalent strain. The evolution curves further demonstrate a progressive rise in the equivalent strain at points P1, P2, and P3 over the deformation time. However, due to its location in a difficult deformation zone and its contact with the upper die, point P2 experienced frictional forces during deformation, hindering radial metal flow. Mechanically, P2 was subjected to compressive stress, posing difficulties in meeting the plastic deformation requisites. Conversely, point P1, located in a heavily deformed area and experiencing minimal frictional forces, was more conducive to plastic deformation compared to P2, and thus, displayed the highest equivalent strain. Point P3, situated in a zone of unrestricted deformation, exhibited an equivalent strain between that of points P1 and P2.
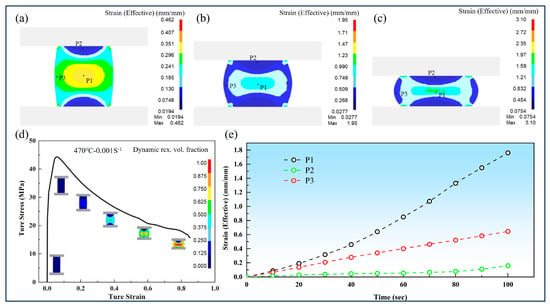
Figure 7.
Finite element simulation of the thermal deformation process. (a–c) Equivalent strain cloud maps at different stages of deformation. (d) Cloud maps of dynamic recrystallization volume fraction at different stages of deformation. (e) Variation curves of equivalent strain at different characteristic points over simulation time steps.
The hot deformation simulation results indicate that P1 was situated in a highly deformed region, P2 in a difficult deformation zone, and P3 in a region of free deformation. Consequently, for the dynamic recrystallization evolution simulation, point P1, corresponding to the consistently observed strain levels in the experiments, was selected.
During deformation, once the strain reaches or exceeds the critical strain, nucleation occurs randomly at the grain boundaries of the parent phase microstructure. The newly formed nuclei grow and consume the parent phase by migrating along the grain boundaries; this nucleation process proceeds concurrently with grain growth. Observations reveal that the newly recrystallized grains exhibit a chain-like distribution surrounding the parent phase. Consequently, new grain boundaries form between the parent phase and the newly recrystallized grains, as well as among different recrystallized grains. When the prescribed strain level is reached, the dynamic recrystallization process concludes, with the majority of the parent phase replaced by smaller dynamically recrystallized grains. The results of cellular automaton simulations vividly replicate the dynamic recrystallization process, closely aligning with classical theoretical descriptions.
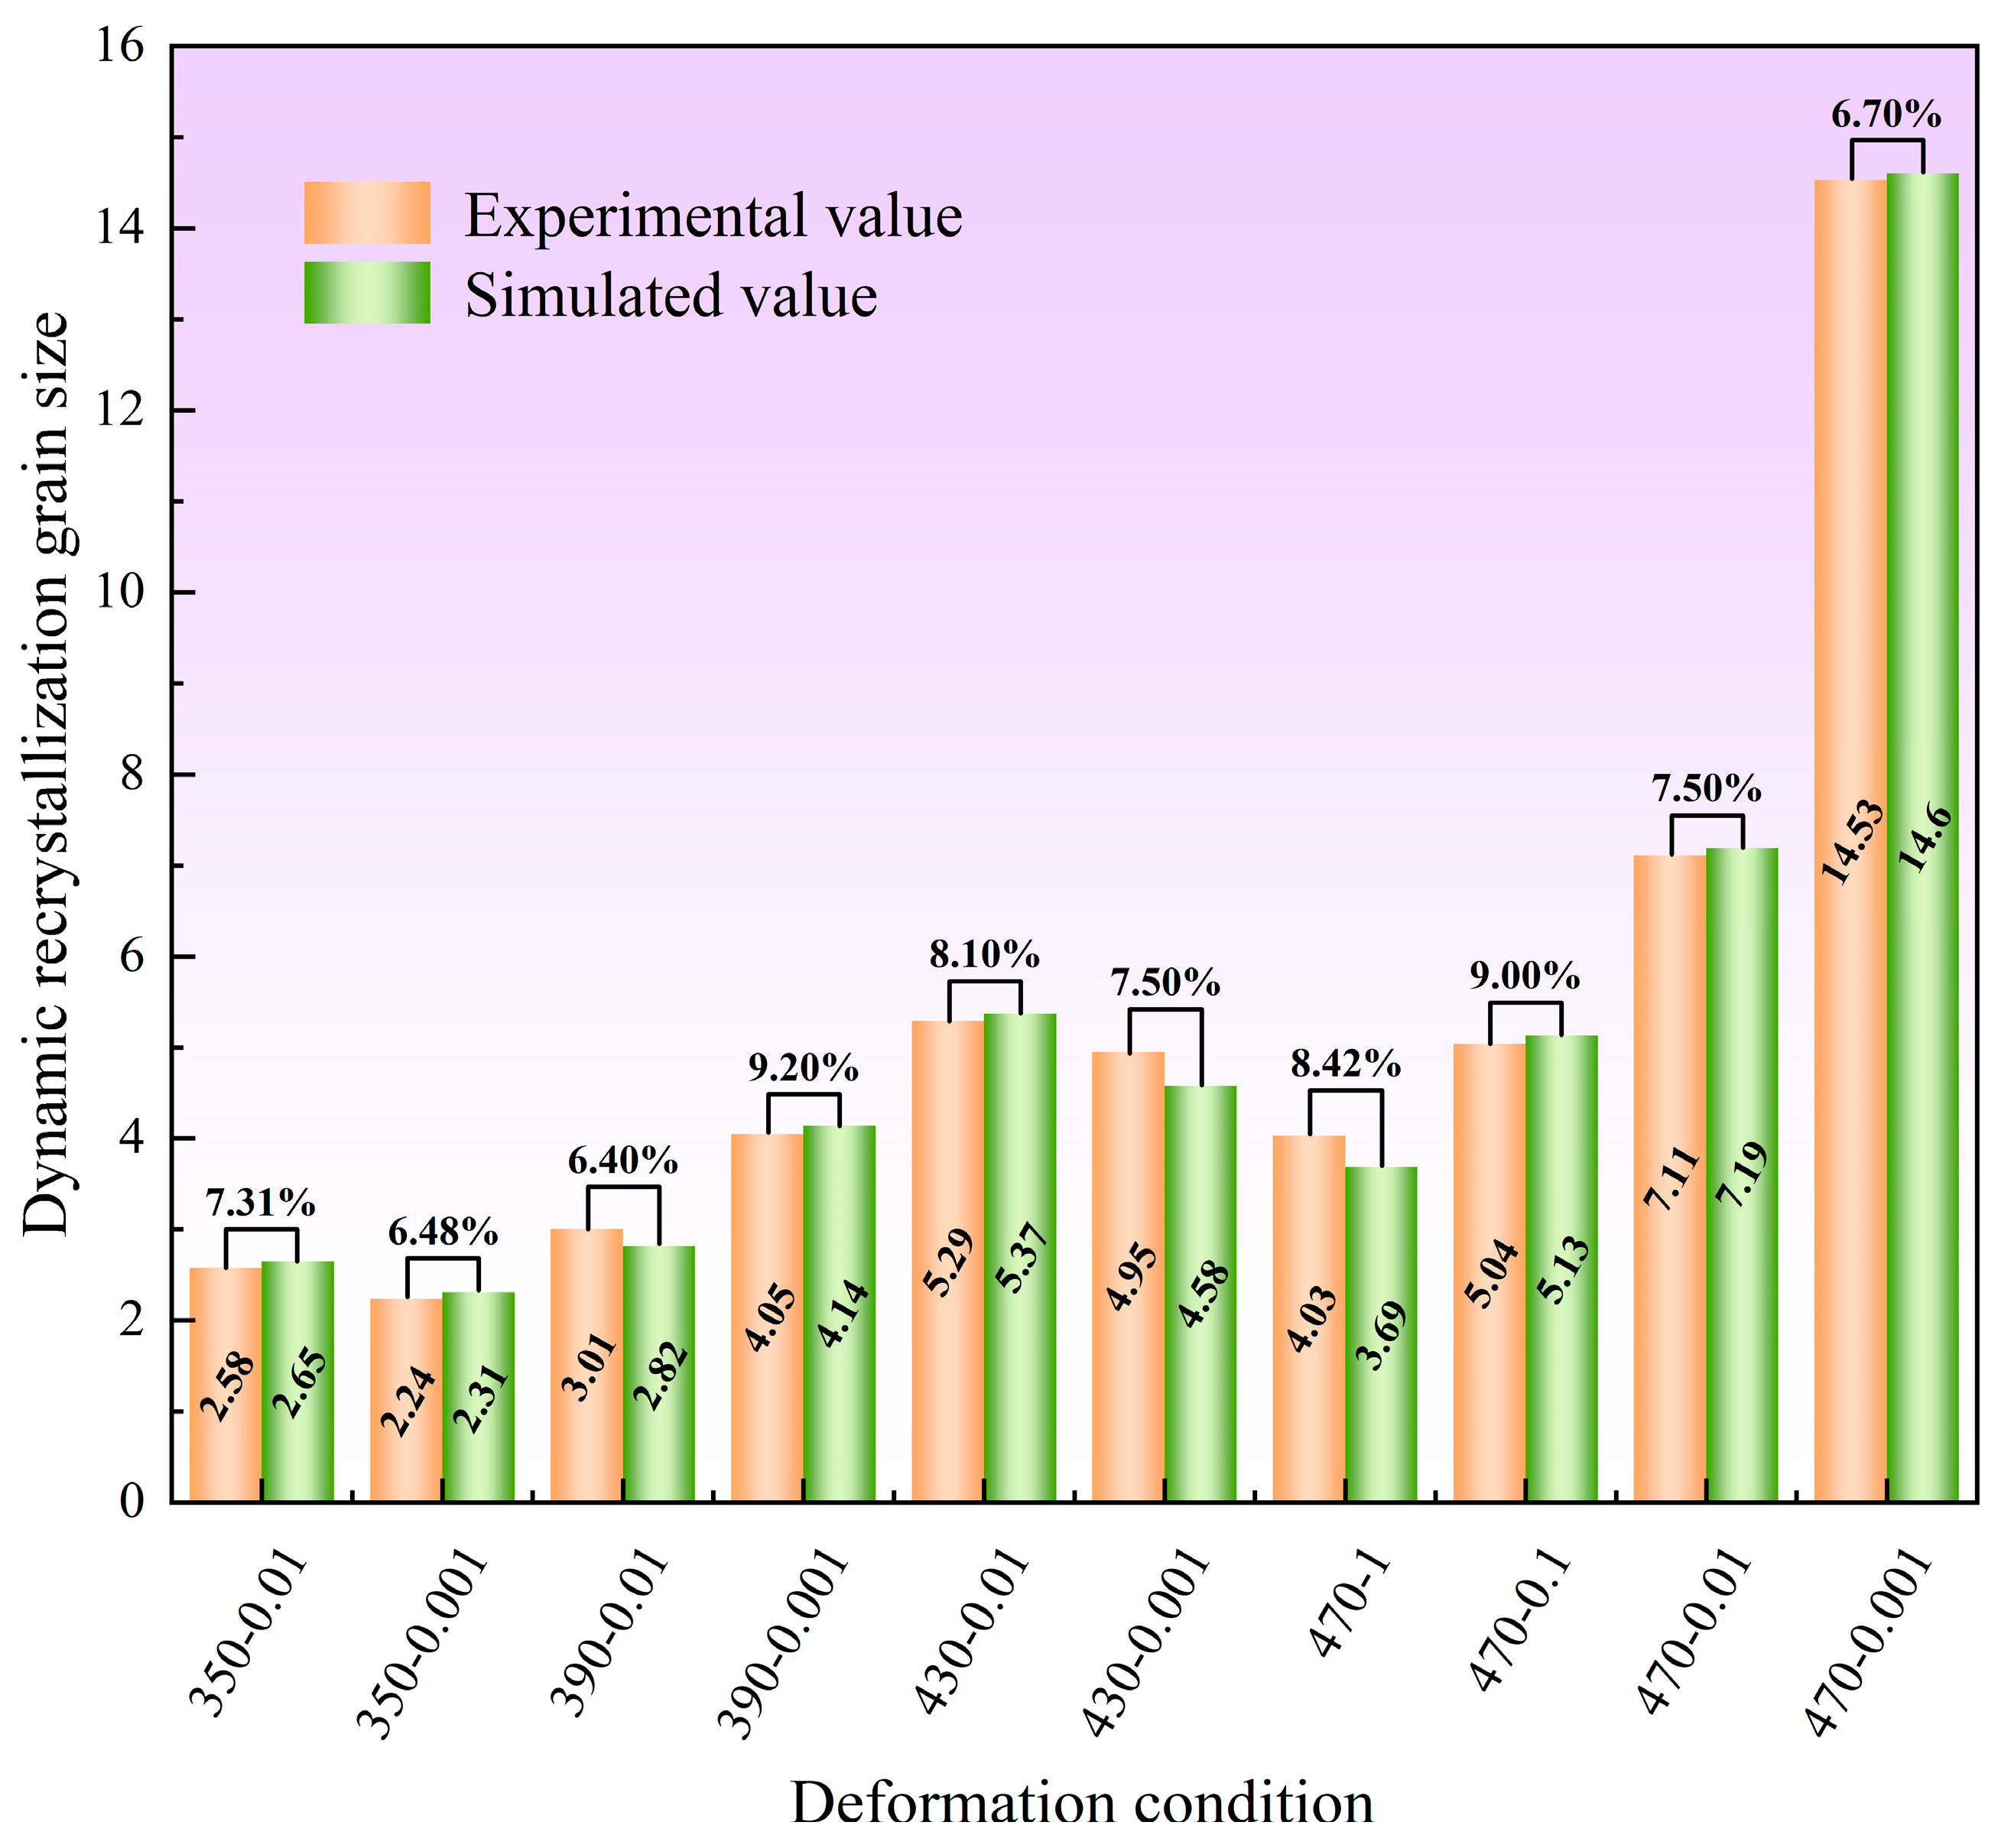
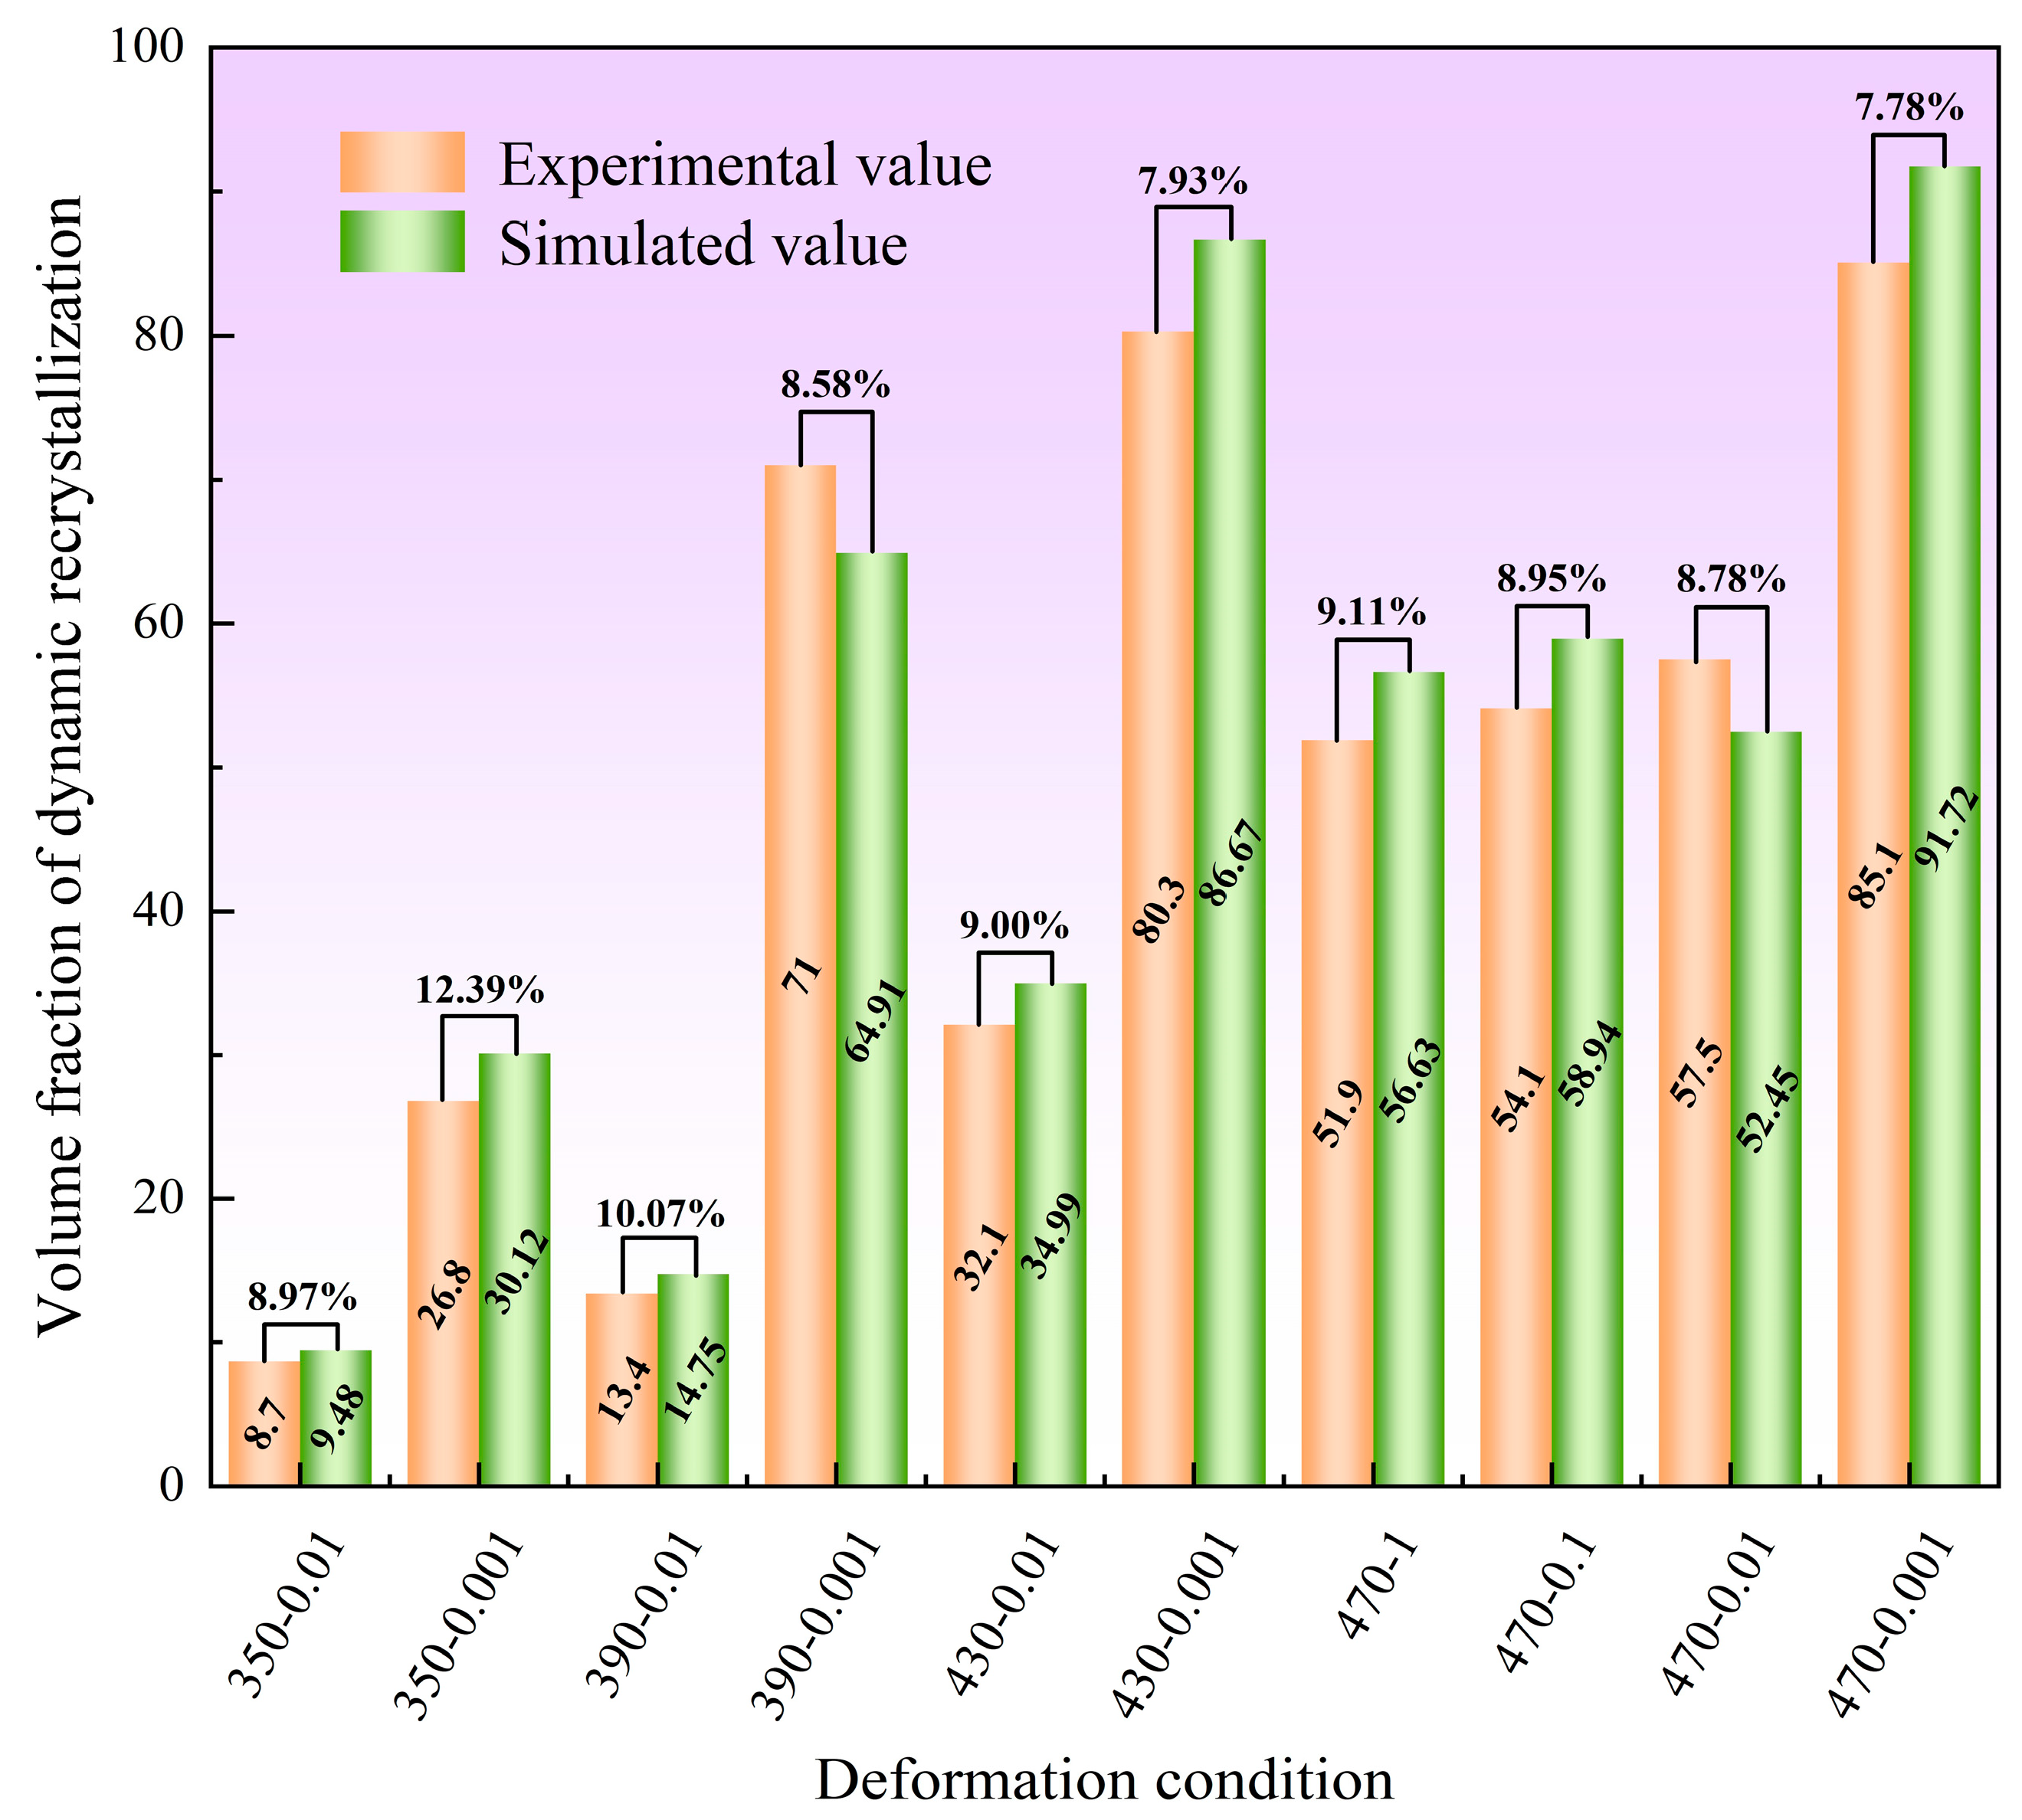
Figure 8 demonstrates that, at a temperature of 470 °C, an increase in the strain rate led to a reduction in the size of the dynamically recrystallized grains. As the deformation rate escalated from 0.001 S−1 to 1 S−1, the size of the recrystallized grains diminished from 14.6 μm to 3.69 μm, accompanied by a decrease in the volume fraction of recrystallization from 91.72% to 56.63% (as depicted in Figures 10 and 11). Lower strain rates, under consistent deformation temperature conditions, resulted in diminished stored energy and driving force within the alloy. Lower strain rates, under consistent deformation temperature conditions, resulted in diminished stored energy and driving force within the alloy. Consequently, the nucleation of alloy grains occurred sporadically in areas with energy fluctuations, leading to a decreased nucleation rate. Moreover, ample time was afforded for grain boundary migration, facilitating the growth of recrystallized nuclei, and thus, augmenting the volume fraction of recrystallization and relatively enlarging the recrystallized grain size. Conversely, higher strain rates prompted rapid dislocation accumulation and insufficient stress concentration release, thereby impeding the growth of recrystallized grains. Additionally, an increase in the strain rate resulted in a larger peak strain, corresponding to a larger critical strain, which made it more difficult for dynamic recrystallization to initiate and slowed down the process. Furthermore, the reduction in the recrystallized grain size resulted in a decreased overall volume of the recrystallized region. Consequently, both the size of the dynamically recrystallized grains and the volume fraction of recrystallization were diminished. In conclusion, while increasing the strain rate decelerated the rate of recrystallization, it enhanced the refinement effect of recrystallization on the microstructure.
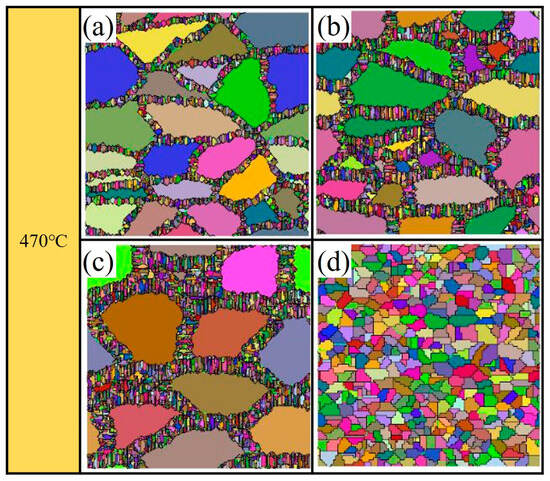
Figure 8.
Microstructure after deformation simulated by cellular automaton at different strain rates: (a) 1 S−1; (b) 0.1 S−1; (c) 0.01 S−1; (d) 0.001 S−1.
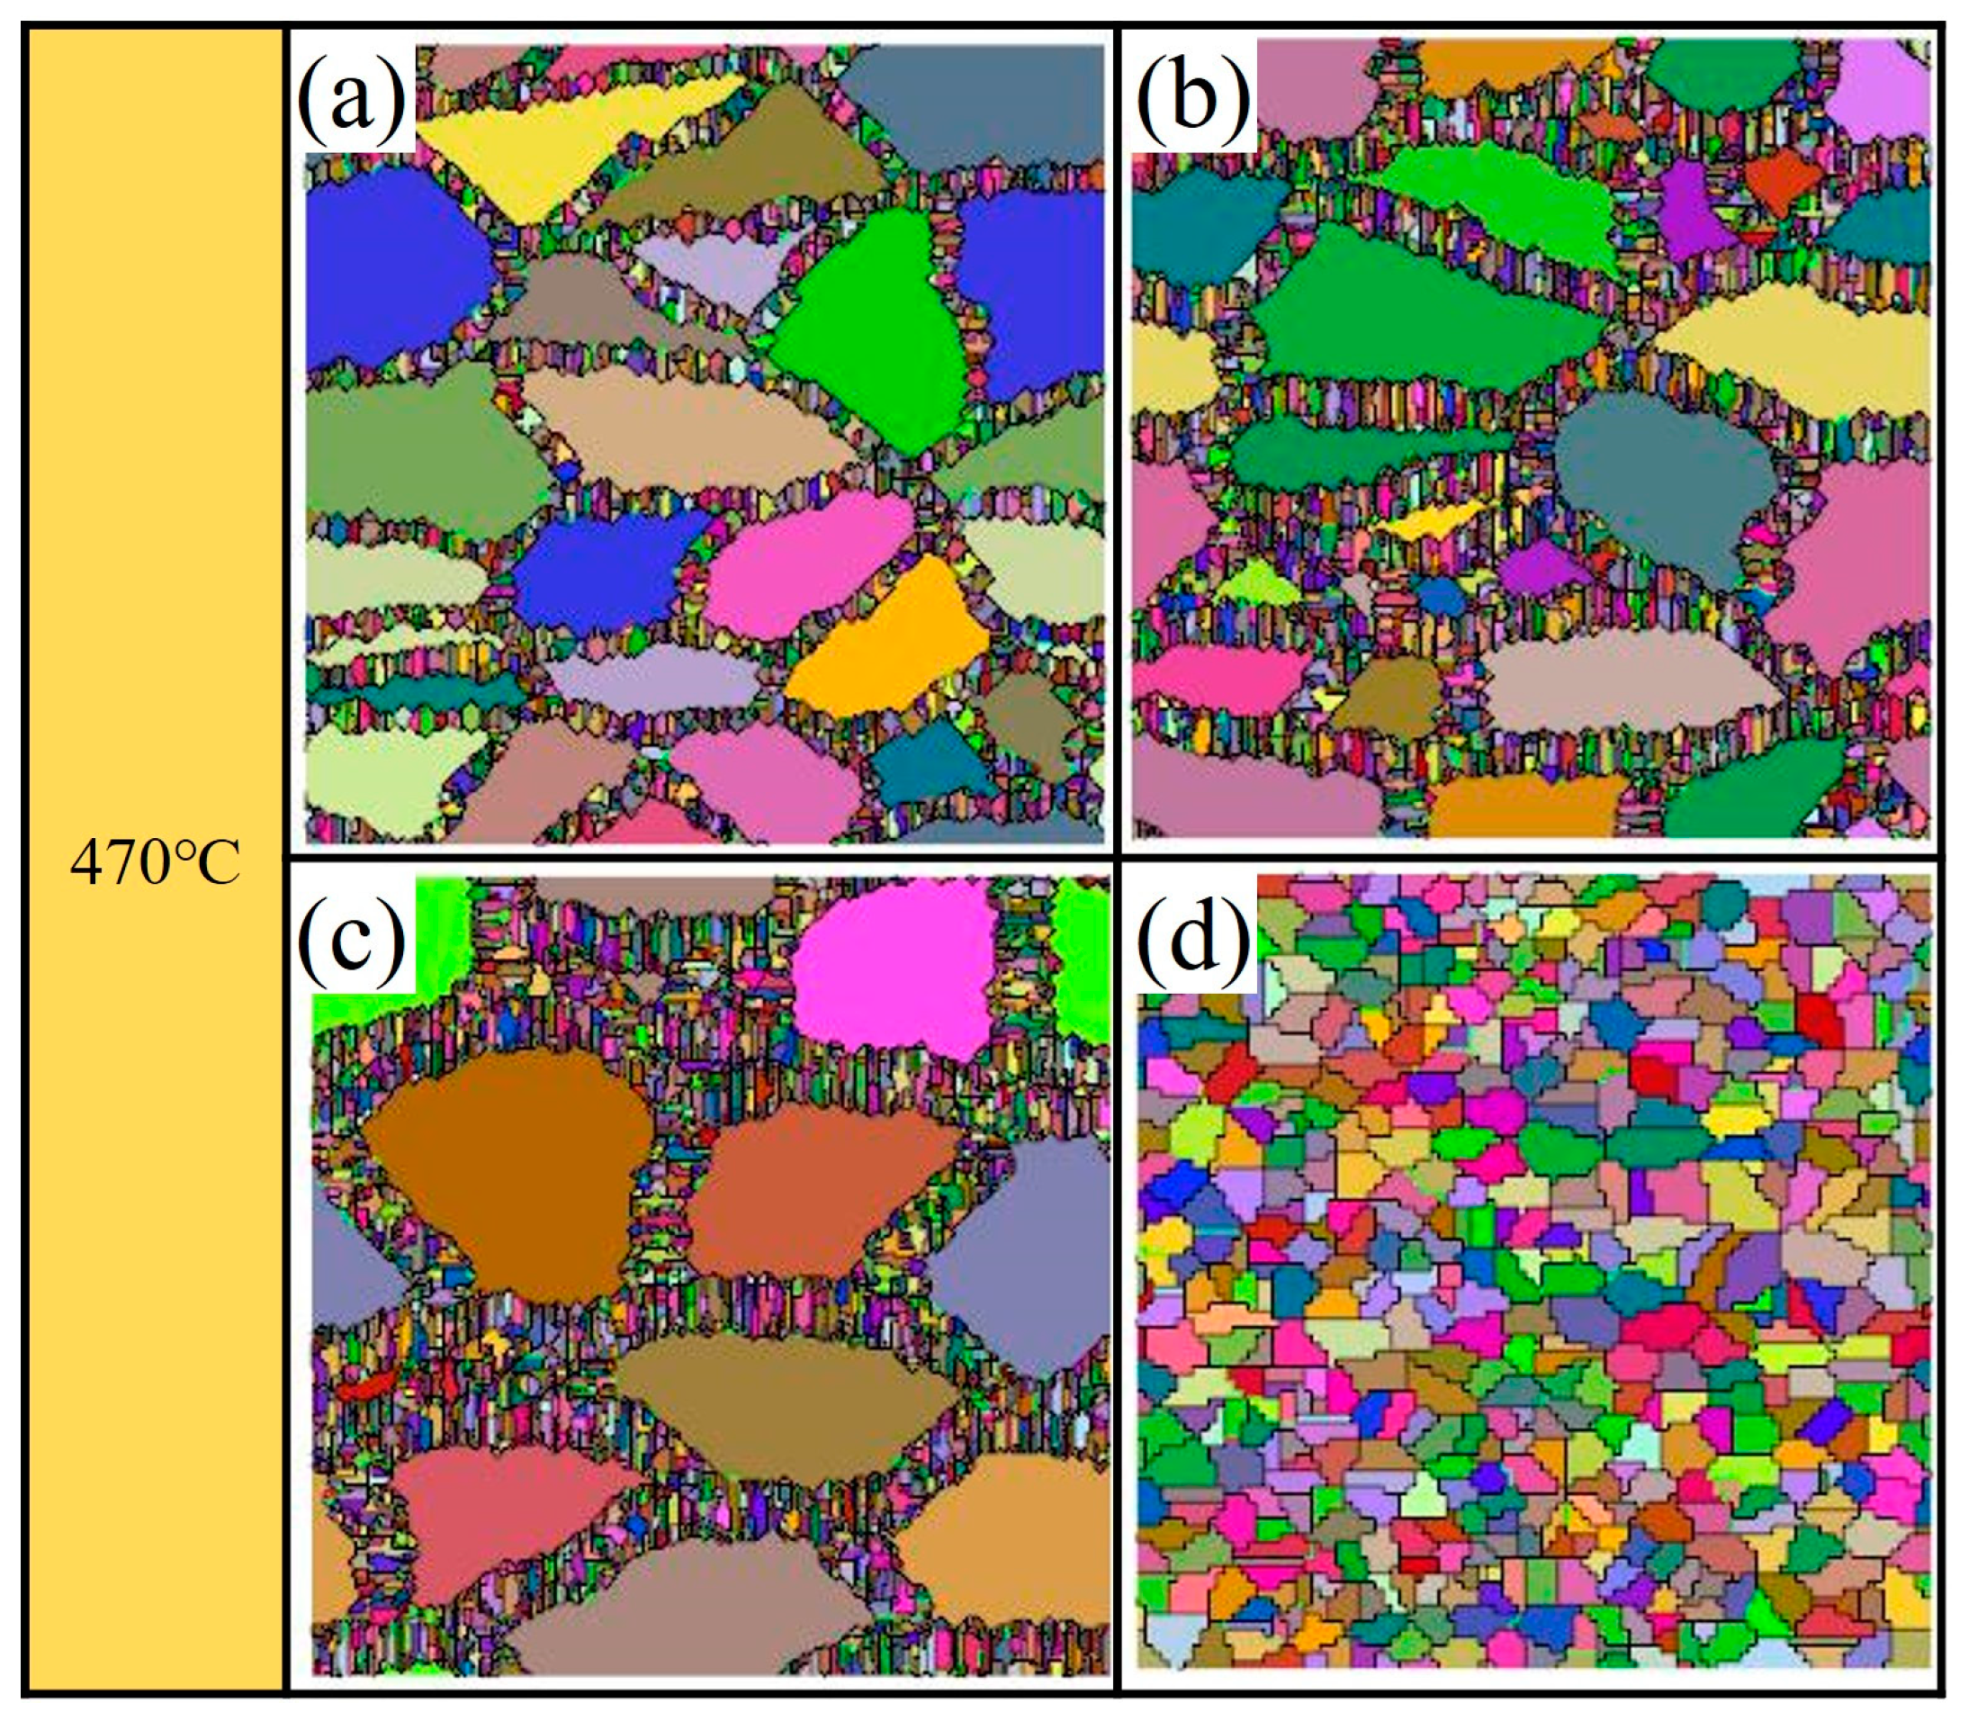
Figure 9 illustrates the microstructure after deformation termination under different deformation temperatures with a strain rate of 0.001 S−1. The figure clearly demonstrates that, with an ascent in the deformation temperature from 430 °C to 470 °C, the dimensions of the dynamically recrystallized grains escalated from 2.31 μm to 14.6 μm (Figure 10), concomitant with a marked augmentation in the recrystallization volume fraction (Figure 11). This phenomenon arose from the ratio of the nucleation rate to the growth rate, denoted as N/G, dictating the dimensions of the dynamically recrystallized grains during the thermal deformation [23]. It is widely acknowledged that heightened deformation temperatures expedite the growth rate of dynamically recrystallized grains, fostering a more exhaustive recrystallization process, and thereby augmenting the volume fraction of recrystallization. At the stage of stable deformation under elevated temperatures, the comparatively reduced dislocation density within the grains engendered a diminished nucleation rate, with the nucleation rate, N, declining while the growth rate, G, escalated. Consequently, the N/G ratio diminished, fostering an augmentation in the dimensions of the dynamically recrystallized grains. Furthermore, at elevated deformation temperatures, vigorous atomic oscillation in high-temperature alloys accelerate atomic diffusion, significantly heightening the migratory capacity of the dislocations and grain boundaries. The diminished strain rate allows ample time for this phenomenon, facilitating a more comprehensive and uniform growth of dynamically recrystallized grains over the same temporal span.
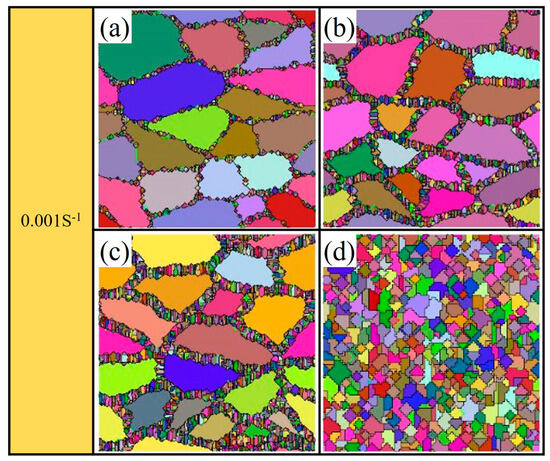
Figure 9.
Microstructure after deformation simulated by cellular automaton at different temperatures: (a) 350 °C; (b) 390 °C; (c) 430 °C; (d) 470 °C.
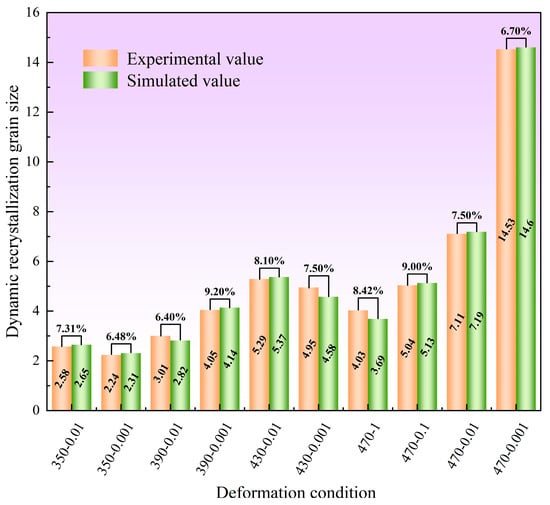
Figure 10.
Comparison of dynamic recrystallization grain sizes under different deformation conditions.
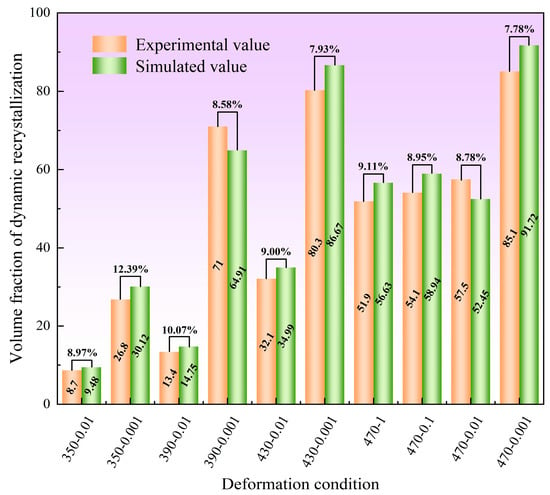
Figure 11.
Comparison of dynamic recrystallization volume fractions under various deformation conditions.
The preceding analysis indicates that increases in the deformation temperature led to a progressive enlargement in the size of the dynamically recrystallized grains. Conversely, with the escalation of the deformation rate, the dimensions of the dynamically recrystallized grains gradually decreased. Consequently, elevated temperatures in conjunction with low strain rates foster the advancement of grain growth in dynamic recrystallization, whereas low temperatures coupled with high strain rates hinder the expansion of dynamically recrystallized grains.
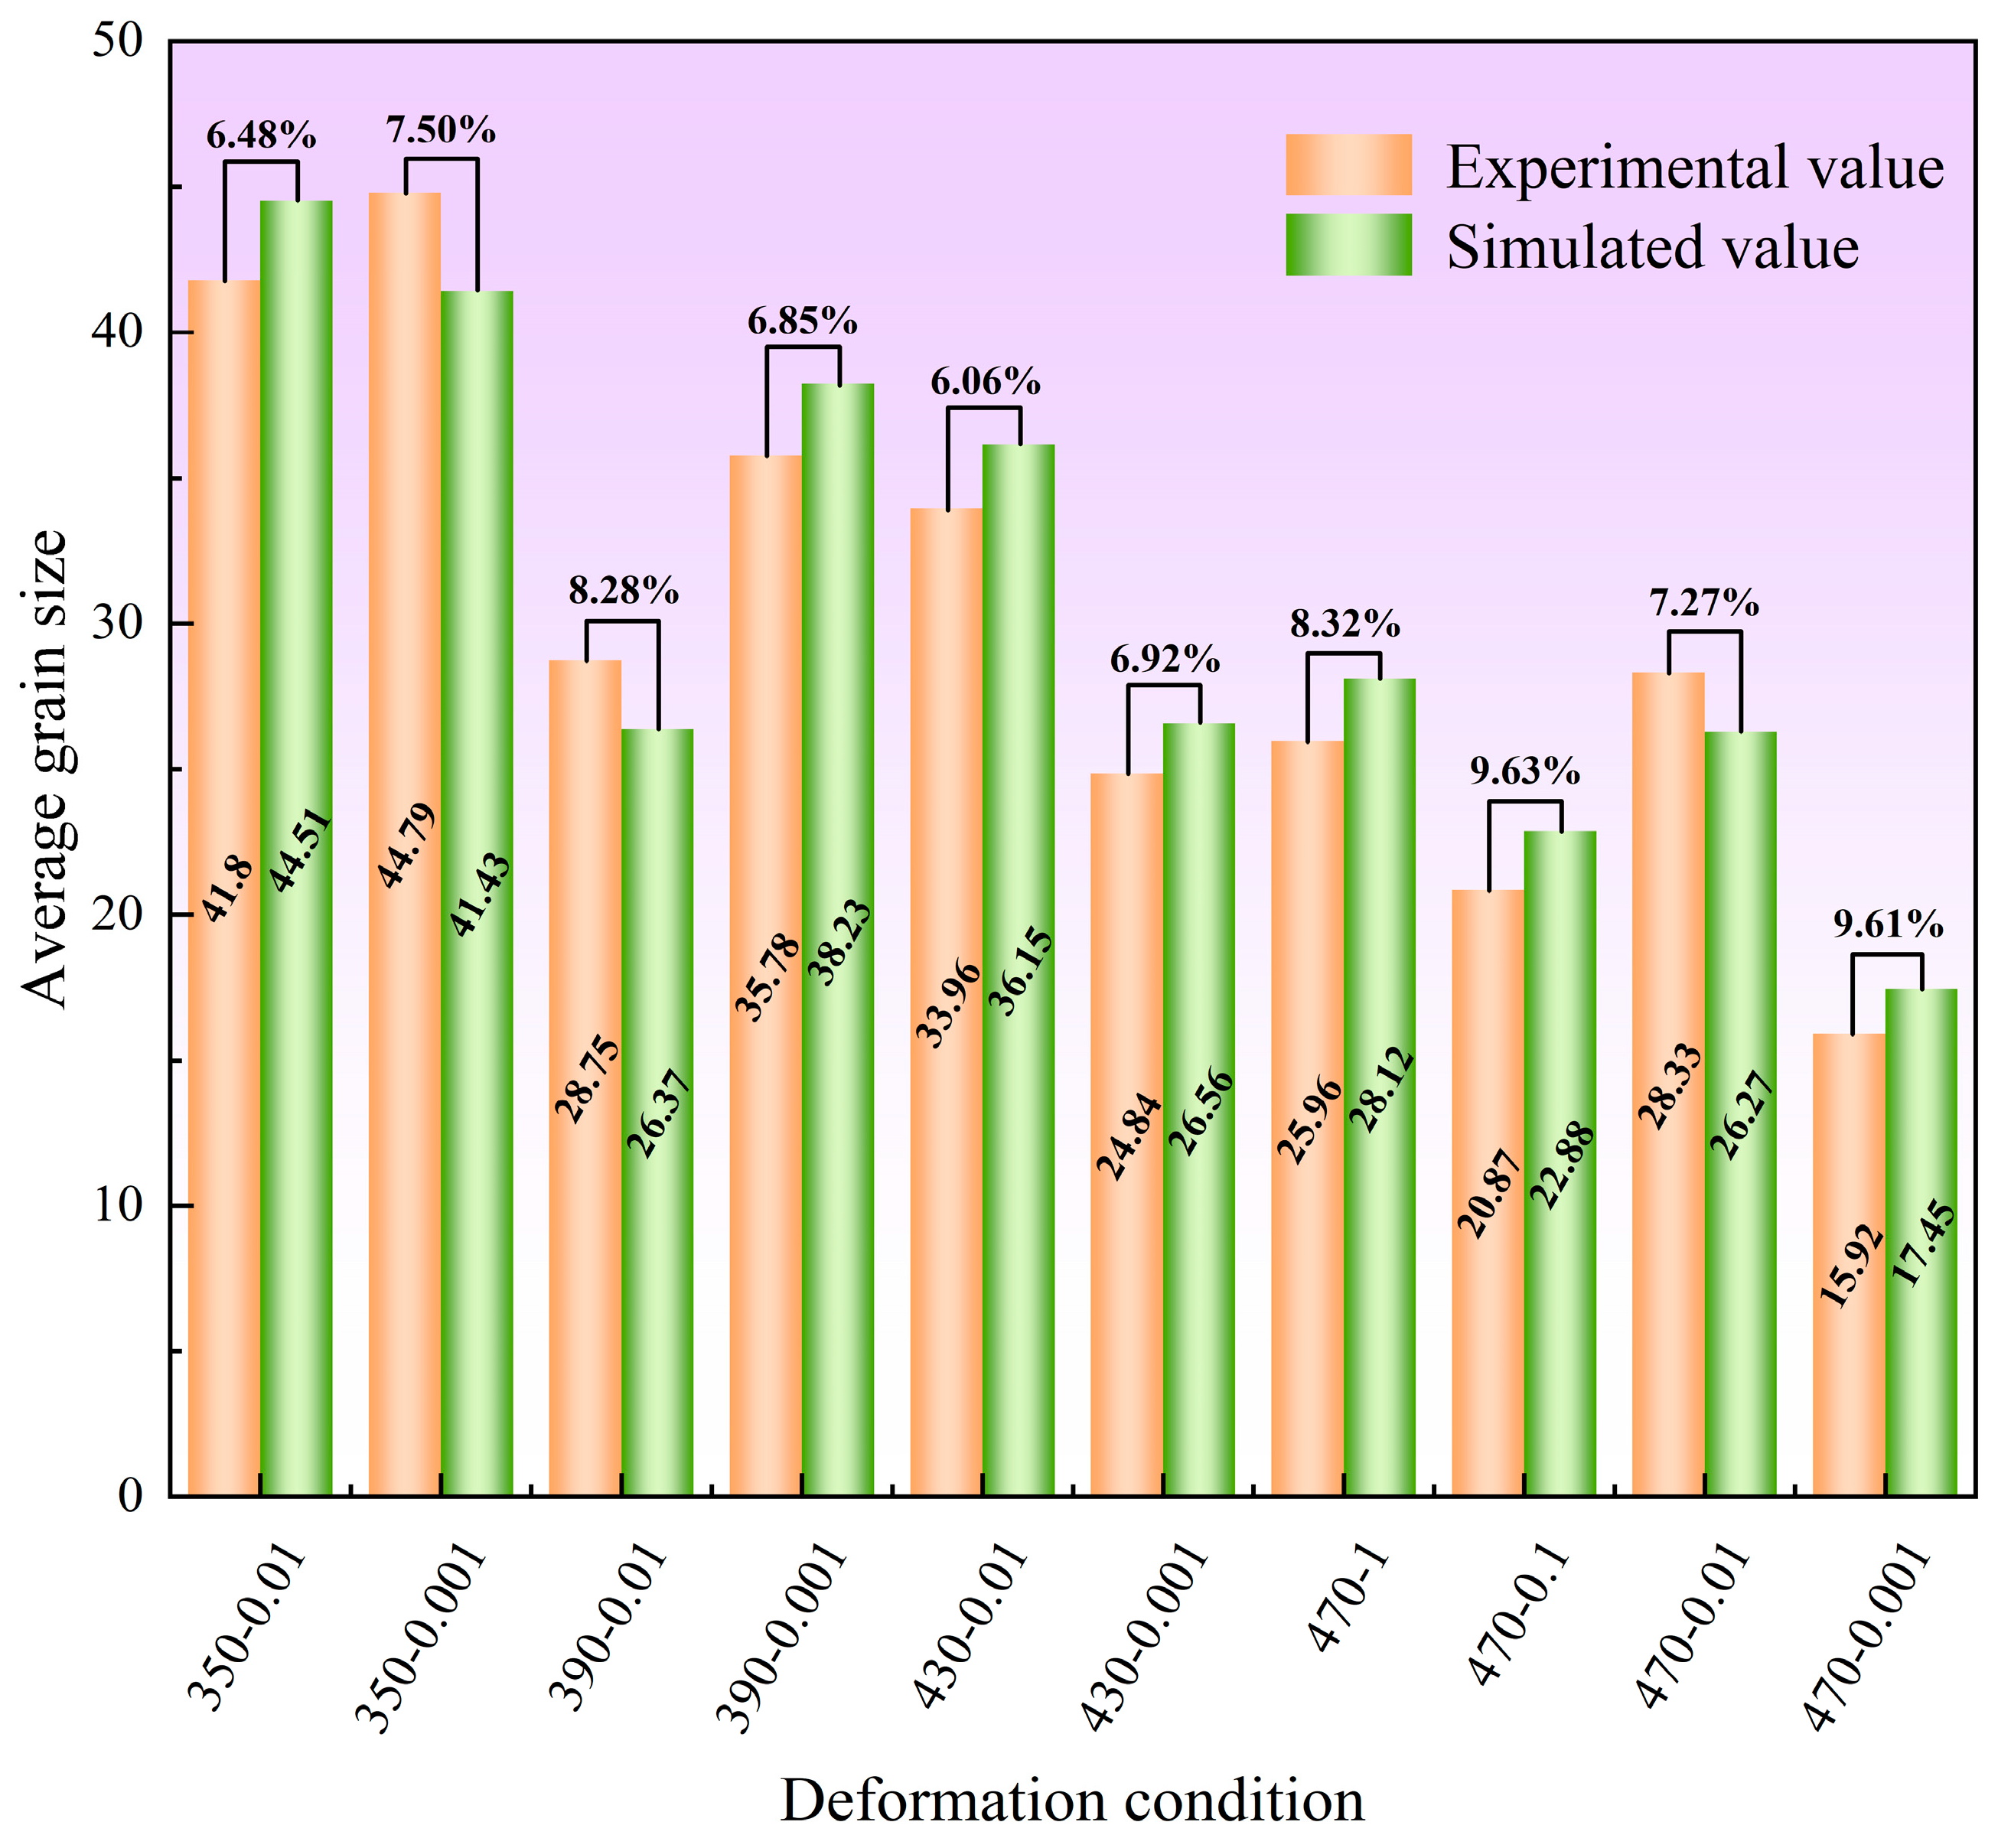
The average grain size is also highly sensitive to both the deformation temperature and strain rate. However, their respective influences on the average grain size were rather intricate (Figure 12). In the absence of complete dynamic recrystallization, as the deformation temperature rose, the average grain size gradually decreased, while, with increasing strain rate, the average grain size gradually increased. Conversely, in cases where complete dynamic recrystallization occurred partially, multiple scenarios of average grain size variations were observed with changes in the deformation temperature and strain rate. It is worth noting that Figure 10, Figure 11 and Figure 12 delineate the comparison between the simulated and experimental values of the dynamic recrystallized grain size, dynamic recrystallization volume fractions, and average grain size under various processing conditions. The figures reveal a maximum disparity of 12.39% and a minimum disparity of 6.06%. This finding emphasizes the significant concordance between the simulated outcomes and the experimental data, affirming the robustness of the cellular automaton (CA) model devised to depict the microstructural changes in rare-earth magnesium alloys during thermal deformation. This model was refined through the secondary development of the user subroutine in the finite element software DEFORM-3D.
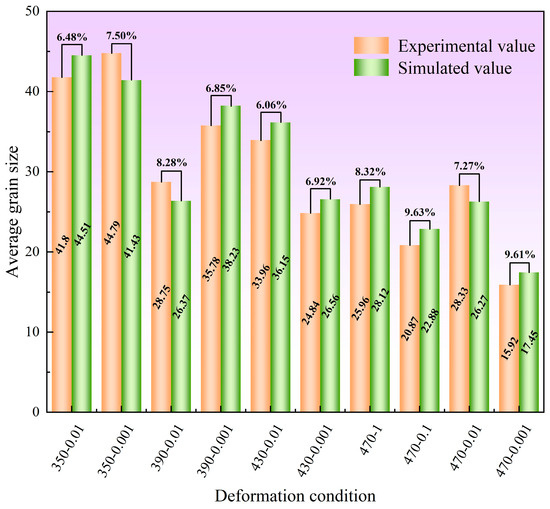
Figure 12.
Comparison of average grain sizes under different deformation conditions.
5. Conclusions
(1) The thermal compression behavior of the Mg-13Gd-4Y-2Zn-0.5Zr alloy was investigated, revealing a stress–strain curve characteristic of the “dynamic recrystallization type”, with the flow stress increasing as the temperature decreased and the strain rate increased.
(2) The DEFORM-3D cellular automaton model, refined through secondary development, adeptly simulated the dynamic recrystallization process, capturing fluctuations in the grain size and recrystallization fraction of the Mg-13Gd-4Y-2Zn-0.5Zr alloy. The maximum relative error between the simulated and experimental values is 12.39%, confirming the credibility of this microstructural simulation platform.
(3) This numerical simulation platform aptly elucidates the influence of the temperature and strain rate on microstructural evolution. Under constant strain conditions, the volume fraction of dynamically recrystallized grains and their size exhibited direct proportionality to the deformation temperature but was inversely correlated with the strain rate. Higher strain rates result in less thorough recrystallization processes.
(4) The impact of the temperature and strain rate on the average grain size is complex and intricately linked to the extent of complete dynamic recrystallization taking place within the specimens.
Author Contributions
Conceptualization, M.C. and Z.Z.; methodology, M.C.; software, X.W.; formal analysis, X.W.; resources, Z.Z.; investigation, X.W.; data curation, X.W.; visualization, X.W.; writing—original draft preparation, M.C. and X.W.; writing—review and editing, M.C.; funding acquisition, Z.Z. All authors have read and agreed to the published version of the manuscript.
Funding
This research received no external funding other than the statutory research of a particular scientific unit.
Data Availability Statement
The original contributions presented in the study are included in the article, further inquiries can be directed to the corresponding author.
Conflicts of Interest
The authors declare no conflicts of interest.
References
- Song, J.; She, J.; Chen, D.; Pan, F. Latest research advances on magnesium and magnesium alloys worldwide. J. Magnes. Alloys 2020, 8, 1–41. [Google Scholar] [CrossRef]
- Yang, Y.; Xiong, X.; Chen, J.; Peng, X.; Chen, D.; Pan, F. Research advances in magnesium and magnesium alloys worldwide in 2020. J. Magnes. Alloys 2021, 9, 705–747. [Google Scholar] [CrossRef]
- Song, J.; Chen, J.; Xiong, X.; Peng, X.; Chen, D.; Pan, F. Research advances of magnesium and magnesium alloys worldwide in 2021. J. Magnes. Alloys 2022, 10, 863–898. [Google Scholar] [CrossRef]
- Mirzadeh, H. Grain refinement of magnesium alloys by dynamic recrystallization (DRX): A review. J. Mater. Res. Technol. 2023, 25, 7050–7077. [Google Scholar] [CrossRef]
- Biswas, S.; Gautam, P.C.; Shukla, A.J.; Chouhan, D.K. Dynamic recrystallization and its effect on microstructure and texture evolution in magnesium alloys. Encycl. Smart Mater. 2022, 5, 476–481. [Google Scholar]
- Razali, M.K.; Joun, M.S. A new approach of predicting dynamic recrystallization using directly a flow stress model and its application to medium Mn steel. J. Mater. Res. Technol. 2021, 11, 1881–1894. [Google Scholar] [CrossRef]
- Joun, M.S.; Razali, M.K.; Chung, S.H.; Irani, M. A direct method of calculating flow-related dynamic recrystallization parameters for generality and accuracy in predicting microstructural evolution. J. Mater. Res. Technol. 2022, 18, 3894–3907. [Google Scholar] [CrossRef]
- Na, Y.-S.; Yeom, J.-T.; Park, N.-K.; Lee, J.-Y. Simulation of microstructures for Alloy 718 blade forging using 3D FEM simulator. J. Mater. Process. Technol. 2003, 141, 337–342. [Google Scholar] [CrossRef]
- Wang, F.; Zhu, Q.; Lin, J.; Dean, T. Prediction of microstructural evolution in hot rolling. J. Mater. Process. Technol. 2006, 177, 530–533. [Google Scholar] [CrossRef]
- Ma, Q.; Lin, Z.-Q.; Yu, Z.-Q. Prediction of deformation behavior and microstructure evolution in heavy forging by FEM. Int. J. Adv. Manuf. Technol. 2009, 40, 253–260. [Google Scholar] [CrossRef]
- Liu, L.; Wu, Y.; Ahmad, A.S. A novel simulation of continuous dynamic recrystallization process for 2219 aluminium alloy using cellular automata technique. Mater. Sci. Eng. A 2021, 815, 141256. [Google Scholar] [CrossRef]
- Babu, K.A.; Prithiv, T.S.; Gupta, A.; Mandal, S. Modeling and simulation of dynamic recrystallization in super austenitic stainless steel employing combined cellular automaton, artificial neural network and finite element method. Comput. Mater. Sci. 2021, 195, 110482. [Google Scholar] [CrossRef]
- Azarbarmas, M. Modeling the Dynamic Recrystallization by Using Cellular Automaton: The Current Status, Challenges and Future Prospects. Iran. J. Mater. Sci. Eng. 2020, 17, 103–129. [Google Scholar]
- Laasraoui, A.; Jonas, J.J. Prediction of steel flow stresses at high temperatures and strain rates. Metall. Trans. A 1991, 22, 1545–1558. [Google Scholar] [CrossRef]
- Goetz, R.; Seetharaman, V. Static recrystallization kinetics with homogeneous and heterogeneous nucleation using a cellular automata model. Metall. Mater. Trans. A 1998, 29, 2307–2321. [Google Scholar] [CrossRef]
- Goetz, R.; Seetharaman, V. Modeling dynamic recrystallization using cellular automata. Scr. Mater. 1998, 38, 405–413. [Google Scholar] [CrossRef]
- Ding, R.; Guo, Z. Coupled quantitative simulation of microstructural evolution and plastic flow during dynamic recrystallization. Acta Mater. 2001, 49, 3163–3175. [Google Scholar] [CrossRef]
- Read, W.T.; Shockley, W. Dislocation models of crystal grain boundaries. Phys. Rev. 1950, 78, 275. [Google Scholar] [CrossRef]
- Ning, Y.; Wang, T.; Fu, M.; Li, M.; Wang, L.; Zhao, C. Competition between work-hardening effect and dynamic-softening behavior for processing as-cast GH4720Li superalloys with original dendrite microstructure during moderate-speed hot compression. Mater. Sci. Eng. A 2015, 642, 187–193. [Google Scholar] [CrossRef]
- Ding, R.; Guo, Z.X. Microstructural modelling of dynamic recrystallisation using an extended cellular automaton approach. Comput. Mater. Sci. 2002, 23, 209–218. [Google Scholar] [CrossRef]
- Roberts, W.; Ahlblom, B. A nucleation criterion for dynamic recrystallization during hot working. Acta Metall. 1978, 26, 801–813. [Google Scholar] [CrossRef]
- Jonas, J.J.; Quelennec, X.; Jiang, L.; Martin, É. The Avrami kinetics of dynamic recrystallization. Acta Mater. 2009, 57, 2748–2756. [Google Scholar] [CrossRef]
- McQueen, H. Development of dynamic recrystallization theory. Mater. Sci. Eng. A 2004, 387, 203–208. [Google Scholar] [CrossRef]
Disclaimer/Publisher’s Note: The statements, opinions and data contained in all publications are solely those of the individual author(s) and contributor(s) and not of MDPI and/or the editor(s). MDPI and/or the editor(s) disclaim responsibility for any injury to people or property resulting from any ideas, methods, instructions or products referred to in the content. |
© 2024 by the authors. Licensee MDPI, Basel, Switzerland. This article is an open access article distributed under the terms and conditions of the Creative Commons Attribution (CC BY) license (https://creativecommons.org/licenses/by/4.0/).

