Abstract
We investigated the reaction kinetics and initial chemical conditions in the production of silicon alloys, employing aluminum as the reductant for calcium silicate slag, to enhance process economics and scalability to industrial levels. The apparent kinetics and transient chemical conditions were studied by immersing solid aluminum into molten slag, allowing the reaction to proceed for varying durations without external agitation, before quenching the reaction for chemical and microscopic analyses of the resulting silicon alloy and slag. The majority of the conversion was observed within the first 15 s at 1650 °C, driven by significant chemical interactions and interfacial turbulence introduced upon aluminum immersion. For Al-SiO2 stoichiometries ranging from 0.5 to 1.2, the slag phase reaction conformed to first-order kinetics during the initial two minutes, when it approached equilibrium. The mass transfer coefficients for Al2O3 were estimated at 1–2 × 10⁻⁴ m/s, comparable to those for SiO2 and CaO. A constant mass transfer coefficient could not be established for stoichiometries of 1.6 and 2, as these deviated from the standard slag mass transfer relationship and did not adhere to established relationships. Despite near-complete reactions, alloy–slag mixing was extensive, decreasing with lower stoichiometry values.
1. Introduction
Silicon serves as a key element in aluminum alloys and is crucial for the manufacture of transistors, semiconductors, and solar panels. In an era where innovation and environmental sustainability are accelerating, the demand for these critical components is projected to surge at a compound annual growth rate (CAGR) of 5.1% by 2030 []. Silicon’s versatility and electrical properties make it indispensable in the technological advancement of renewable energy solutions, particularly as solar power becomes increasingly integral to global energy strategies. This growing reliance underscores the urgency for more efficient and environmentally conscious methods of silicon production. The current industrial process for producing silicon (Si) from silica (SiO2) using carbon (C) resources as reductant is an energy-intensive metallurgical production method per ton produced, characterized by significant CO2, NOx, SOx, polycyclic aromatic hydrocarbon (PAH) and other hazardous gas emissions. An alternative more environmentally friendly approach for Si production involves reacting liquid aluminum (Al) with liquid calcium silicate slag (CaO-SiO2), described on an overall level by the equilibrium established between the following equations []:
The reaction between the metallic Al source and CaO-SiO2 slag produces a Si alloy (Si-Ca-Al) that rests above a CaO-SiO2-Al2O3 slag. Ultimately, the Si yield and the composition of both the metal and the slag are largely dictated by the initial stoichiometry of the metal-slag mixture and the specific compositions of the metal and slag. It should be noted that the above equations serve as a general description of the overall reactions. In particular, the actual reaction forming Ca(l) involves several intermediate phases, cf. [,].
This novel method leverages the abundant Al-rich by-products from aluminum production, which have shown promising results in pilot-scale tests []. The potential advantages of this metallothermic reduction include (i) the use of secondary Al and silica resources, along with calcium silicates, without stringent impurity and particle size requirements; (ii) lower operational temperatures leading to reduced energy consumption compared to the conventional carbothermic process; (iii) reduced amount of problematic contaminants, notably phosphorus (P) and boron (B); (iv) no direct emissions of hazardous CO2, NOx, SOx, and PAH; (v) production of calcium aluminate slag alongside Si, offering a valuable resource, either for Al2O3 extraction or in the steel or cement industries; and (vi) diminish the dependence on global imports of carbon.
However, the economic viability of this novel process is contingent upon understanding its process kinetics. Presently, the rate of reaction remains unquantified, though indications suggest it is relatively fast [,]. To effectively scale up from pilot to industrial scale, knowledge of the kinetics is crucial to optimize resource and energy use. Laboratory experiments facilitate the determination of the apparent rate constant, essential for estimating reaction times for larger-scale operations.
For producers, an important consideration is the identification of optimal initial and transient chemical properties of metal and slag, specifically in terms of kinetics. Previous studies have highlighted the sensitivity of process economics to energy costs [], underscoring the importance of comprehending and optimizing the kinetics. Furthermore, the process has demonstrated flexibility in raw material selection, resulting in relatively consistent metal and slag compositions [,,,]. However, the impact of these compositional variations on the process remains to be fully understood. This study aims to further assess the process flexibility, with a focus on determining the apparent kinetics in various chemical conditions derived from different initial stoichiometries. The stoichiometry is defined by the molar Al-SiO2 relationship outlined in Equation (1), where a ratio of 4/3 moles of Al to 1 mole of SiO2 corresponds to a stoichiometry of 1. Low initial stoichiometry results in a purer Si alloy with higher Si content, whereas high stoichiometries yield a cleaner slag with lower SiO2 content, both of which are advantageous for subsequent refining processes. The influence of stoichiometry on the distribution coefficient of calcium (Ca) between the alloy and slag remains uncertain. Additionally, other parameters such as the metal–slag weight ratio (impacting transport distance), viscosity, and interfacial tension, which are associated with stoichiometry and transient chemical properties of the system, could potentially affect kinetics.
Equilibrium calculations, such as those performed using FactSageTM 8.1 [], have been reasonably accurate in predicting the properties of the produced metal and slag at 1600–1650 °C, assuming adequate reaction time. However, discrepancies from thermodynamic equilibrium have been observed in several studies [,,,]. It is thus essential to discern whether these deviations are due to thermodynamic or kinetic factors and how they may be attributed to the inherent reaction mechanism.
Previous research conducted under controlled, non-agitated conditions suggests that the process is likely governed by mass transfer within the slag phase []. In addition, a calcium aluminate product layer at the alloy–slag interface was formed. The reaction rate was found to correlate with transient slag properties such as viscosity, electrical conductivity, or surface tension, dependent on holding temperature. The observed reaction phenomena comprised interfacial turbulence, interfacial depression, spontaneous emulsification, coalescence, and a subsequent return to high interfacial tension. These are dynamic interfacial phenomena, driven by the movement of elements across the interface [,,,]. The reaction leads to a spontaneous expansion of surface area while as the reaction attenuates and approaches equilibrium, the surface area tends to revert to its original state. Several theories have been suggested to account for these observations, yet none have comprehensively clarified the underlying phenomena. Commonly, these theories suggest a reduction in interfacial tension, which is attributed to various capillary actions. These include solutocapillarity, which involves surface-active agents, electrocapillarity, which arises from electrical charge disparities, and thermocapillarity linked to differences in local temperatures.
Several researchers have observed spontaneous emulsion caused by the reaction between oxidizable elements (such as Al, Ti, Cr, and Si) in Fe when it comes into contact with slag [,,]. During the reaction, the metal undergoes flattening, indicating a temporary reduction in interfacial tension. Concurrently, the metal and slag can spontaneously emulsify into smaller micro- and millimeter-sized droplets, leading to a significant increase in the interfacial area. As the reaction intensity decreases, these droplets gradually recoalesce. White and Sichen [] found that the emulsification of Si droplets in CaO-SiO2 slag is enhanced by stirring, which facilitates the transfer of Ca across the interface. Rhamdhani et al. [,] reported that in the reaction between Fe-(3.5–5)Al and CaO-SiO2-Al2O3 slag at 1650 °C, the metal–slag interfacial area increased 4–6 times compared to its initial state, with a greater increase corresponding to higher initial Al content. This dynamic interfacial change during the reaction was described by a first-order relationship. The change in the interfacial area demonstrated a linear relationship between the initial reaction rate and the change in free energy resulting from the chemical reaction. This effect is likely to further accelerate the reaction rate, as the increase in interfacial area combined with reduced mass transfer distances, due to the emulsification of metallic droplets in slag, enhances the reaction process.
White and Sichen also noted that in a similar system of Si metal refining with a Ca content of <0.5 wt.%, the interfacial phenomena induced by Ca transfer were reported to accelerate the reaction rate. Moreover, these authors found that emulsification of the metallic phase in slag was directly proportional to the metal–slag interfacial area, which varied over time []. While low interfacial tension can benefit reactions, it may reduce metal-slag separation yield due to decreased efficiency in metal–slag separation.
Given the current system’s higher driving force due to the use of pure Al with similar slag compositions, it is expected that the interfacial increase might be even more significant compared to previous studies on Fe-slag systems. In previous studies by the authors, interfacial turbulence and spontaneous emulsion were observed only during a limited reaction time, during which the resulting Si alloy was characterized by a spherical shape and smooth surface, indicating low interfacial area to minimize interfacial energy. At this stage, emulsified micro-droplets in slag are likely to have a negligible effect on the overall interfacial area [].
In most studies investigating reactions between Fe-Al and slag, the mass transfer coefficient for Al in the liquid metal is derived from a metal-control model. However, research that determines the mass transfer coefficients for the current slag compounds in the CaO-SiO2-Al2O3 slag phase is limited. The magnitude of the mass transfer coefficient depends on various factors, including vessel geometry, mixing conditions, fluid properties such as viscosity and density, and the diffusivity of the solute []. Taira et al. [] examined the dissolution rate of sintered Al2O3 in CaO-SiO2-Al2O3 slag, finding that the mass transfer coefficient for Al2O3 in a similar slag with a comparable CaO content but a higher SiO2/Al2O3 ratio (compared to the present study) ranged from 10−3 to 10−4 cm/s, based on extrapolating their results from 1580 °C to 1650 °C. Park et al. [] proposed a kinetic model that used a derived mass transfer coefficient of 10−3 cm/s for inductively stirred melts, calculated from the known diffusivity of Al in the metal phase (10−2 cm/s), with satisfactory results. Jamieson et al. [] explored the silicothermic reduction of MnO in MnO-CaO-SiO2-Al2O3 slag with a CaO:SiO2:Al2O3 ratio of 2:2:1 at 1550–1650 °C. They observed intense agitation due to significant reaction and mass transfer across the interface, with the mass transfer coefficient for MnO determined to be around 10−2 cm/s.
The authors conducted laboratory kinetic studies on varying metal–slag properties under inductive stirring, along with pilot-scale studies using both inductive stirring and gas purging [,]. These studies achieved conversion levels close to those predicted by equilibrium calculations. In laboratory-scale experiments, a 20-min holding time at 1650 °C was sufficient for a 1:1 CaO:SiO2 ratio and an Al-SiO2 stoichiometry of 1 [], while a 10-min holding time at 1600 °C sufficed for refining this alloy to MG-Si, despite its lower driving force []. In pilot-scale studies, the reaction time ranged from 1 to 6 h at 1600–1650 °C, depending on when the Al source was charged []. A later study showed that under non-agitated conditions, the reaction degree was significantly lower and far from equilibrium []. In all previous studies, reaction kinetics were investigated in terms of minutes. The present study complements previous work by focusing on the reaction rate within a 2-min timeframe. In this study, Al metal was immersed into the slag melt without additional stirring to understand the energy dynamics induced by the metal’s impact and its effect on the reaction. After varying holding times, the samples were quenched in argon and then analyzed microscopically. The large compositional transitions in the slag were systematically measured by assessing the gradient of SiO2, CaO, and Al2O3 perpendicular from the alloy–slag interface to the bulk. Instead of relying on static thermodynamic equilibrium values, the study used dynamic composition at the interface as the saturated value, acknowledging that this value changes with time. This allowed the researchers to incorporate the dynamic change in mass transfer characteristics of the slag into the kinetic equation. The paper aims to determine apparent kinetic constants for industrial application, identify the rate-limiting medium for reactions between Al and CaO-SiO2 slag, and further explore the impact of various stoichiometries on reaction kinetics.
2. Materials and Method
All trials used a specific aluminum (Al) metal and a calcium silicate (CaO-SiO2) slag as the reactants. The slag composition determined by X-ray Fluorescence (XRF) outlined in Table 1 was pre-fused for homogenization by the supplier and finely milled. To estimate the wt.% of silicon carbide (SiC), it was assumed that all analyzed carbon (C) was in the form of SiC. The SiC content was then calculated by using the analyzed wt.% C and subtracting moles from SiO2. The Al metal composition was analyzed by XRF to be 99.6% Al, 0.06% Si, and 0.29% Fe, with other elements making up 0.05%. The mass was standardized across trials by manually grinding the Al metal on a rotating grinding machine using SiC paper. The metal was then cleaned with water, ethanol, and acetone.

Table 1.
Initial slag composition (wt.%).
The study was divided into two main sections. The first part focused on determining the kinetic model, involved 12 experiments: three parallel trials at 0.25 and 0.5 min, two parallels at 1 and 2 min, and single trials at 5 and 20 min. The second part, which investigated the effect of stoichiometry, had 11 experiments: two parallel trials for stoichiometries 0.8, 1, 1.2, 1.6, and 2, and a single trial for stoichiometry 0.5. These stoichiometries are abbreviated as S0.5, S0.8, S1, S1.2, S1.6, and S2. For each experiment, individual masses and surface areas were used in the kinetic equation and for other calculations. In the first part, the inserted Al metal had a mass of 1.279 ± 0.016 g, and the slag had a mass of 1.671 ± 0.021 g, resulting in a stoichiometry of 1.0256 ± 0.000731. In the second part, the Al metal mass was 1.226 ± 0.044 g, while the slag masses for S0.5 through S2 were 8.419, 5.023 ± 0.0928, 4.329 ± 0.0266, 3.463 ± 0.0977, 2.537 ± 0.667, and 2.123 ± 0.1129 g, respectively. Thermodynamic equilibrium (t.e.), density, viscosity, and other properties were calculated for each individual product composition. The plotted compositions for the product alloy and slag were the averages of parallel trials (where applicable) from the averaged parallel Energy Dispersive Spectroscopy (EDS) measurements. The error bars for parallel trials represent plus/minus one standard deviation. The initial surface area of the Al metal used in the kinetic equation was measured using a caliper.
Both the slag and the Al metal were dried in a Multitherm air circulation furnace at 90 °C for at least 12 h before the kinetic experiments began. The slag, measured according to the desired Al-SiO2 molar stoichiometry, was placed in an air-flushed IG-15 grade graphite crucible with dimensions OD30, ID16, and H34 (mm). The crucible was covered with a graphite lid with a small hole to control the Al metal’s falling speed and prevent splashing when it hit the lid and entered the liquid slag. The slag-filled crucible was placed in a custom-made resistance tube furnace. It was flushed with argon (>99.999% purity) and vacuumed twice to about 0.3 mbar before being filled with argon to create an overpressure of 1060–1070 mbar. The furnace was flushed with 0.01 L/min argon during heating and with 0.05 L/min during the reaction and cooling. A calibrated thermocouple was positioned on top of the crucible’s lid, along with a second thermocouple at the bottom, ensuring a consistent temperature of 1650 °C. The furnace was heated to 1600 °C at 38 °C/min, held at 1600 °C for 10 min, and then heated again to 1650 °C at 7 °C/min where the slag was held for 15 min to ensure complete melting without risking evaporation. The slag liquidus was calculated at 1517 °C []. This was confirmed by a preliminary test conducted with slag alone. At time zero, the Al metal was dropped through a molybdenum pipe into the furnace, hitting the side of the graphite lid and then falling into the melt (Figure 1). The crucible was quenched in argon by lowering it to the bottom of the furnace, resulting in a cooling rate of approximately 25 s to 1450 °C, or about 8 °C/s on average. The 1450 °C mark is significant because it corresponds to the solidus temperature of the product slag.
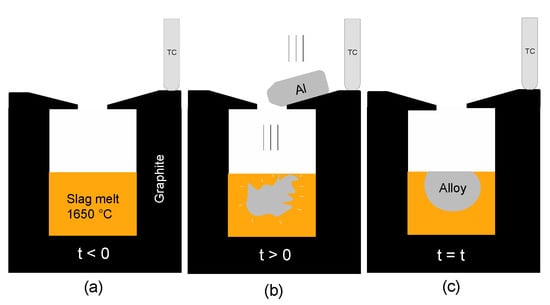
Figure 1.
Schematic illustration of the experimental procedure. (a) slag held at 1650 °C for 15 min to ensure complete melting, (b) drop of Al metal onto the lid and then into the slag, and (c) alloy and product slag after specific reaction time.
After the experiments, the crucible was cut vertically through the middle. The cut sample was then mounted in epoxy, ground, and polished to prepare it for analysis in the Electron Probe Microanalyzer (EPMA) (EOL JXA-8500F, JEOL Ltd., Tokyo, Japan. To determine the alloy composition, an average of 4–6 analyses were performed using Energy Dispersive Spectroscopy (EDS) on the surface. For slag analysis, three EDS measurements were taken near the interface, followed by one EDS measurement every 2 mm perpendicular to the interface until the crucible wall was reached (Figure 2). The total average was calculated from all slag measurements, while the weighted average was determined based on the weighted distances between the measurement points.
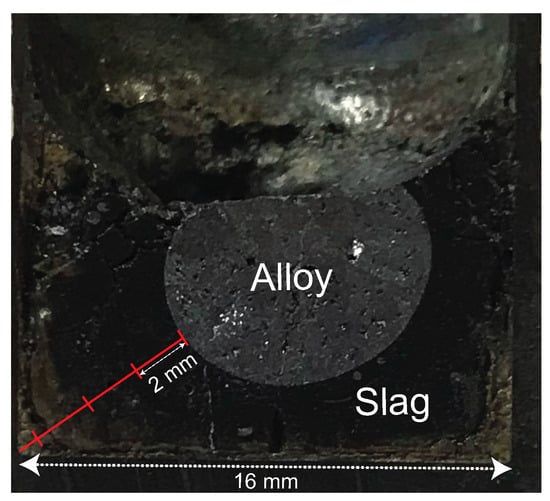
Figure 2.
Example image of EDS analysis every 2 mm perpendicular from the alloy–slag interface to the crucible wall in EPMA.
The thermodynamic equilibrium (referred to as t.e.) for the various conditions was calculated using FactSage 8.1 []. The Equilibrium module was used with FTlite and FToxid databases for alloy and slag analysis, respectively. The thermodynamic data for slag with and without SiC were presented to demonstrate the impact that carbon might have on the system e.g., due to the difficulty of completely avoiding contamination from the graphite crucible. The dynamic viscosity of the slag was calculated using the Viscosity module in FactSage, which models the property based on the melt’s structural characteristics. The slag density was determined using Mills’ calculator (7 March 2011, Ken Mills and Rodney Jones, Randburg, South Africa) []. This calculator employs a partial molar approach, utilizing specific equations to estimate the molar volumes of SiO2 and Al2O3 [].
3. Results and Discussion
The results are presented and discussed in two parts. In part one, the kinetic equation is derived using six reaction times for the intermediate stoichiometry (S1) while the second part focuses on two selected reaction times, 0.5 min and 2 min, with six stoichiometries (S0.5, S0.8, S1, S1.2, S1.6 and S2).
3.1. Kinetic Equation
The change in wt.% of the main elements (Al, Si, Ca) in the alloy and slag (Al2O3, SiO2, CaO) for reaction times (min) 0.25, 0.5, 1, 2, 5, and 20 min can be seen in Figure 3a–c and Figure 4. A comparison of the conversion degree of Al, Si, and Ca relative to t.e. based on the composition of the alloy is shown in Figure 3d, which was calculated using the formula:
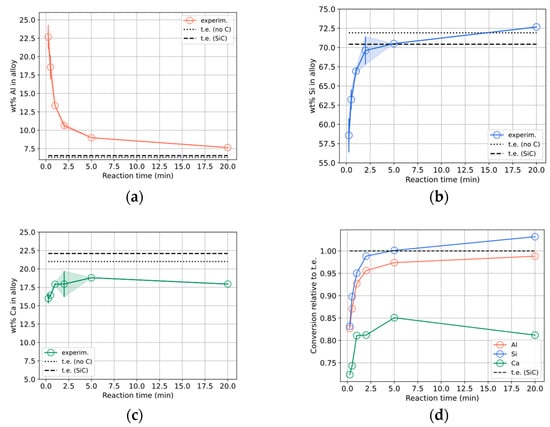
Figure 3.
Measured wt.% of (a) Al, (b) Si, and (c) Ca. (d) conversion of alloy components for different reaction times and calculated thermodynamic equilibrium (t.e.) considering carbon-free and SiC-containing slag (a–c) and SiC only (d). Total length of error bar equals two standard deviations.
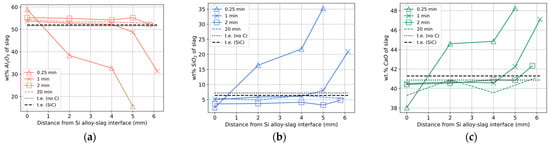
Figure 4.
Spatial distribution of measured wt.% of (a) Al2O3, (b) SiO2, and (c) CaO in slag with time and calculated thermodynamic equilibrium (t.e.) considering carbon-free or SiC-containing slag.
For the alloy, the expected conversion degrees relative to t.e. were 72% for Ca and 83% for both Si and Al after just 15 s of reaction time, as illustrated in Figure 3d. After this point, the reaction rate begins to gradually decrease over time. While Al tends to converge toward t.e., Si exceeds it. The “excess” Si produced must be offset by reduced Ca content, as confirmed in Figure 3c. Although the slag tends to homogenize after 2 min (Figure 4), signaling equilibrium, the Ca content in the alloy remains low. This indicates that the t.e. model might be incorrect, possibly due to unaccounted Ca evaporation. A similar deviation in Ca partitioning has been noted in previous studies [,,].
For the slag, the composition changes with distance from the alloy–slag interface, as illustrated in Figure 4a–c. Unlike the relatively homogeneous composition of the alloy, which has an average standard deviation of 1.15 wt.% Al in parallel EDS measurements, the slag shows a gradient perpendicular to the interface. This gradient decreases over time, stabilizing after approximately 2 min, indicating that approximate equilibrium has been reached. The composition of the slag closest to the interface demonstrates a reduction in SiO2 and CaO and a corresponding increase in Al2O3, suggesting a higher reaction rate compared to the rate of mass transfer away from it. The final compositions of the alloy and slag after extended reaction times align closely with results from similar conditions observed in previous studies [,].
Although the compositional gradient in the slag phase approaches zero after 2 min of reaction time, suggesting the system has reached equilibrium or approximate equilibrium, some alloy droplets mixed in the slag can still be seen, as illustrated in Figure 5. Metallic phases, such as Si and Si2Ca, appear near the interface, with Si2Ca being the dominant entrapped phase in the slag, similar to what has been observed in previous studies with longer holding times [,]. The emulsion may be due to Kelvin–Helmholtz instability caused by turbulence at the interface, as discussed by the authors in a previous paper []. The shorter reaction times in this study, compared to longer times in previous studies, might not provide sufficient time for the slag droplets to fully diffuse through the slag. Despite these instabilities, the alloy–slag interface remained smooth across all reaction times, indicating attenuated mass transfer because most expected reactions had already occurred. A notable piece of evidence for intense interfacial phenomena is the absence of a solid calcium aluminate interfacial product layer, which has been observed in experiments with stagnant flow [].
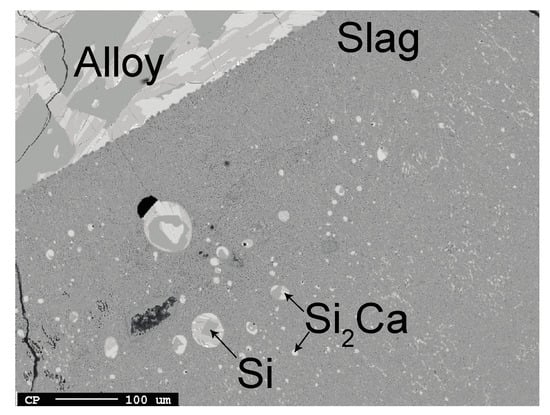
Figure 5.
Emulsion of metallic phase in slag near the alloy–slag interface after 2 min reaction with stoichiometry 1.
A common approach for modeling the reaction between liquid iron, manganese, or silicon and molten slag is to use a first-order kinetic equation. This equation describes the rate at which the concentration changes over time.
Xj,t is the averaged measurement between the interface and the crucible wall of mass fraction of component j at time t representing “the average bulk”, Xj,sat,t the saturated mass fraction of component j at the interface at the same time t, where the difference between these two correspond to the driving force for mass transport; kj the mass transfer coefficient (cm/s) of j; the density of the liquid slag (g/cm3); At is the initial interfacial area (cm2); and ms,t the mass of the slag. Integrating using X(0) = X0 yields
The first-order kinetic equation was applied to describe compositional changes in the slag, while no satisfactory fit was found for the Al content in the alloy. This observation suggests that mass transport in the alloy phase is unlikely to be the limiting factor in the conversion process. Multiple models were considered, including nucleation, diffusion, order-based, and geometrical contraction models. Among these, the first-order, Ginstling–Brounshtein, and spherical contraction models provided the best fit. The first-order kinetic equation was ultimately selected because it yielded the most accurate results, was the simplest to interpret, and is widely used in published studies on liquid metal–slag reactions.
Previous kinetics models for similar metallothermic reactions did not account for dynamic changes in , and as the metal and slag compositions were relatively constant. However, in the current system, these properties can vary significantly with reaction and time, especially . To account for these variations, the alloy–slag interfacial compositions were analyzed at each time step, the dynamic density of the slag was calculated using the Mills calculator [], and the mass of slag was assumed to be the same as the initial slag mass for each trial, given that it varied by less than 2% from equilibrium. These calculations were incorporated for consistency and help to account for variability in these dynamic factors while providing a more robust model for the metallothermic reaction process. To simplify practical applications at different production scales, the apparent calculated mass transfer coefficient was derived as a function of the initial surface area of the Al metal. However, it should be noted that the surface area can change drastically during intense metal–slag reactions [], which can affect the accuracy of the model.
Quantifying kinetics under transient conditions, especially when interfacial area and melt convection vary, presents significant challenges, particularly given the relatively large conversions observed in this study [,]. The dynamic interfacial area is even more difficult to measure when reaction rates are rapid and convection is induced by mass transfer across the interface. For stagnant flow, the mass transfer coefficient is typically defined as the diffusivity divided by the effective film thickness of the boundary layer. However, in the current scenario with changing interfacial areas, the film thickness also varies, indicating that the mass transfer coefficient cannot be constant. It must change with both time and spatial position to accurately reflect the dynamic nature of the system. Consequently, the derived kinetic constant is referred to as average and “apparent” because it is suitable for engineering purposes but should be interpreted cautiously in scientific contexts. These variations underscore the complexities of accurately modeling and understanding kinetic behavior in dynamic conditions.
When plotting the left side of Equation (6) against time, as illustrated in Figure 6a,b, the slope provides an estimate for kAl2O3. A similar pattern is observed when using SiO2 and CaO data. The linear fit is quite accurate within the time range of 0.5 to 2 min, suggesting consistent behavior during this period. However, for times up to 0.25 min, the coefficient is slightly higher, likely due to an increase in interfacial area driven by turbulence from significant mass transfer across the interface. This phenomenon has been previously discussed in an earlier paper by the authors []. This behavior aligns with findings by [], indicating that interfacial turbulence is notable during the first moments of contact when the driving force for the reaction is at its peak. As the time approaches 2 min, the interface becomes more stable, e.g., as seen in Figure 2, leading to a better linear fit. Beyond 2 min, the mass transfer coefficient seems to decrease, suggesting the reaction might be approaching equilibrium, or other factors might limit the reaction rate. The former is supported by a near-zero concentration gradient in the slag after 2 min, as shown in Figure 4. The data point at 5 min could be due to measurement error, or the reaction is no longer limited by mass transfer in the slag phase. Given that approximate equilibrium is achieved within 2 min, this period is crucial due to the significant conversions occurring. This suggests that the reaction is primarily controlled by mass transfer in the slag phase, which aligns with previous studies by the authors [].
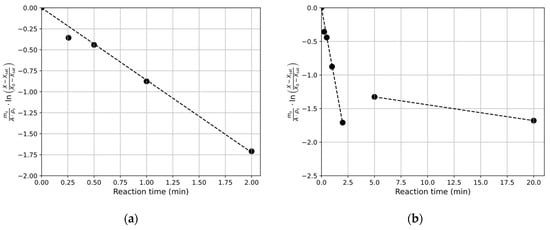
Figure 6.
The slope equals the mass transfer coefficient calculated using first-order for Al2O3 data (a) up to 2 min and (b) up to 20 min.
The mass transfer coefficients obtained from the experiments are presented in Table 2 using the best fit of k for the time range 0–2 min from Figure 6a. These mass transfer coefficients were used to model the mass fraction with time (Figure 7) compared to calculated t.e. In Table 2, statistical metrics are shown that assess the model’s fit over the whole dataset in Figure 7. The R2 value indicates the goodness of fit to the data, demonstrating that the model explains a significant portion of the variance in the outcome variable. The mean absolute error (MAE) measures the average deviation of the predicted values from the observed data. It is relatively insensitive to outliers, giving equal weight to all errors. Norm. MAE is the value normalized by the total change in mass fraction. These statistical measures suggest a robust fit, with similar values observed when considering the weighted average composition of the slag from the interface to the bulk, shown in “()”. This alignment supports the validity of the model and underscores the consistency of the experimental data with the model’s predictions.
Table 2.
Apparent mass transfer coefficient (k) assuming mass transfer controlled in the slag for total average and weighted average in “()”, respectively, and statistical indicators of the model shown in Figure 7.
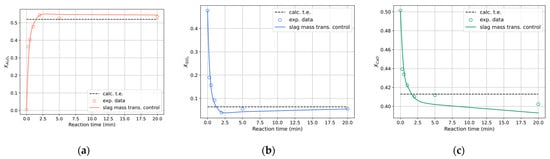
Figure 7.
First-order mass transfer controlled with measured mass fraction of (a) Al2O3, (b) SiO2 and (c) CaO.
The mass transfer coefficients for Al2O3, SiO2, and CaO are within the same order of magnitude. The k represents the average mass transfer coefficient during the initial 2 min of contact under the current experimental conditions. This finding aligns with the mass transfer of MnO (Mn2+) in reactions between Fe-Si and MnO-SiO2-CaO-Al2O3 slags within a temperature range of 1550–1650 °C []. This study also suggests that turbulence is induced by intense interfacial reactions driven by high Gibbs free energy of reaction. This is supported by the similar initial “jump” in the mass transfer coefficient observed in the first few seconds of the reaction, suggesting an analogous behavior.
At the same temperature range, the Fe–Al system in contact with similar slags has been reported to have a mass transfer coefficient one to two orders of magnitude higher [,,]. This discrepancy is likely due to a lower Gibbs free energy of reactants and fewer moles crossing the interface, leading to less agitation in the melt. In contrast, the current reaction exhibits significant turbulence due to a high driving force and a larger number of moles crossing the interface relative to its volume. Details about these interfacial phenomena in the current system were previously discussed by the authors [].
The reduced predictability of modeled CaO can be attributed to its behavior between 5 and 20 min. During this period, there is a persistent difference between the average wt.% CaO and the saturated wt.% CaO. This constant discrepancy indicates that equilibrium has not been achieved. As a result, the model anticipates a continued decrease in CaO concentration from 5 to 20 min.
Using the calculated mass transfer coefficient for Al2O3 from Table 2 and pilot-scale data from reference [], the mass fraction of Al2O3 over time was derived and is presented in Figure 8. This calculation employed the average dynamic slag densities from the current study, with the initial interfacial area estimated by assuming a spherical shape for the liquid Al. In the pilot-scale experiments, the combined weight of metal and slag was approximately 0.5 tons. Around 5 kg of aluminum metal blocks were added, with a total of 21 blocks inserted over a span of 90 min. A similar approach was assumed for an industrial-scale scenario, assuming a total weight of 50 tons and the addition of 10 kg Al pieces each. The reaction times from the pilot experiments [] fall within the same range as the calculations. The discrepancy between the model’s predictions and experimental results is partly attributed to the kinetic equation’s omission of continuous Al addition. The kinetic equation reflects a global reaction rate, and without accounting for the ongoing addition of Al. The reaction times for pilot and industrial were calculated as 58 min and 73 min for 100% completion and 28 min and 35 min for 95% completion, respectively. The results should be interpreted as indicating the lower bound of the reaction rate. Since the reaction in the slag phase is mass-transfer controlled, vigorous stirring should enhance the rate of mass transfer. Under constant stoichiometry and stirring, these reaction times depend solely on the initial Al surface area. While a larger surface area of inserted Al reduces reaction time, in practice, the energy from the dropped Al can catalyze interfacial phenomena and induce convection, which can influence reaction time. Furthermore, the exothermic nature of the overall reaction may depend on the mass and surface area of the inserted Al metal, as these factors could accelerate the initial reaction rate by locally increasing the temperature at the reaction interface. These effects should be considered in more detail when scaling up.
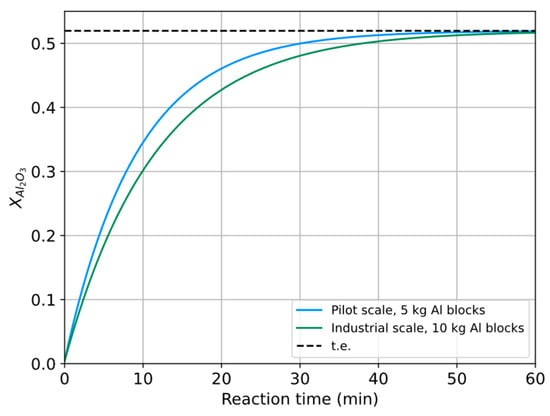
Figure 8.
Estimated time for reaction in upscaling scenarios.
3.2. Kinetics for Varying Al-SiO2 Stoichiometry
Figure 9a–c illustrates the change in alloy composition with stoichiometry for holding times of 0.5 and 2 min. The final composition of the alloys is generally close to t.e., even for a reaction time of 0.5 min. Stoichiometries of 0.5 and 2 are the closest to computed t.e., and these are the only stoichiometries that converge to t.e. within 0.5 min. Figure 9d displays the conversion relative to t.e. for alloy components with varying stoichiometries. Deviation from t.e. increases as stoichiometry rises from 0.5 to 1.2, then shifts to decreasing deviation as stoichiometry increases from 1.2 to 2. Ca deviates from t.e. somewhat more than Al and Si, aligning with previous studies on stoichiometries of 1 and 1.2 [,], hence, particularly, the Ca activity coefficient should be a subject of further research.
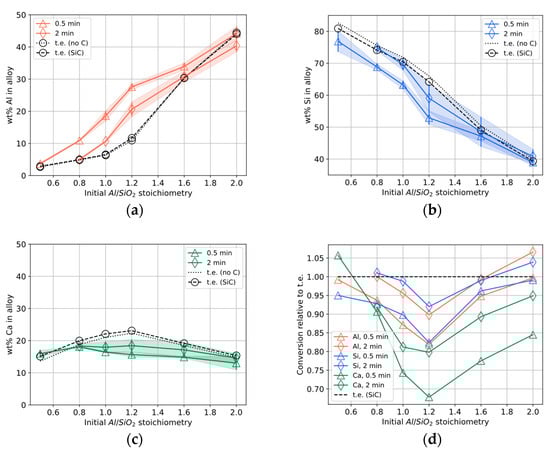
Figure 9.
(a–c) Alloy composition and (d) conversion, with initial Al-SiO2 stoichiometries for holding times 0.5 and 2 min and calculated t.e. excluding C and including SiC. The total error bar and background colors equal two standard deviations.
For all stoichiometries, the measured concentration gradients between the alloy–slag interface and the slag bulk indicated time-dependent transport of slag components (Al2O3, SiO2, and CaO). This indicates mass transport limitations in the slag phase. Al2O3, which is produced at the interface, decreases in concentration with distance into the bulk. Conversely, SiO2 and CaO, which are reduced components, increase in concentration with distance toward the bulk. Figure 10a–r shows the concentration changes for Al2O3, SiO2, and CaO from the alloy–slag interface to the bulk slag for reaction times of 0.5 and 2 min. The lowest conversion relative to t.e. occurred for stoichiometry 1.6, while the highest conversion occurred for stoichiometry 0.8.
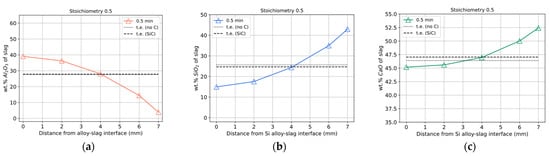
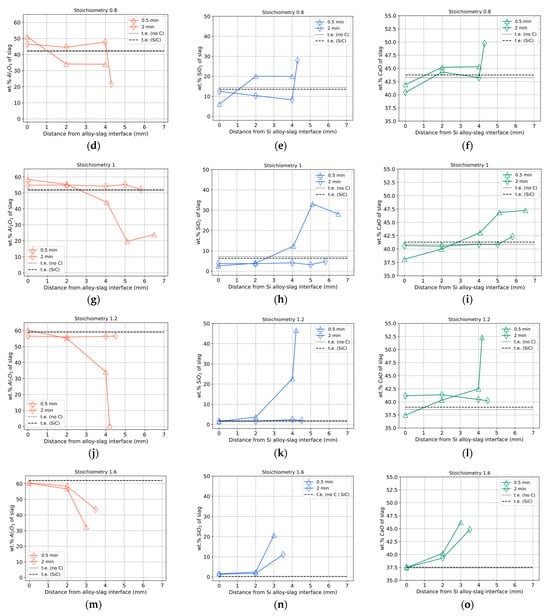
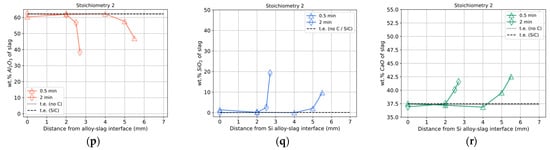
Figure 10.
(a–r) Weight percent of slag components (Al2O3, SiO2, CaO) in the slag phase with distance perpendicular from the alloy–slag interface to the bulk slag for reaction times 0.5 and 2 min and calculated t.e. for stoichiometries 0.5 (a–c), 0.8 (d–f), 1 (g–i), 1.2 (j–l), 1.6 (m–o), 2 (p–r).
The accumulated Al2O3 content near the interface tends to increase its positive deviation from t.e. as stoichiometry decreases, which correlates with the expected number of moles that should cross the interface. This implies that a higher number of reacting moles also necessitates a higher number of moles to be transported through the slag bulk. This relationship supports that the reaction in the slag phase is controlled by mass transfer.
For stoichiometries of 1.2, 1.6, and 2, the saturated Al2O3 content tends to reach its maximum and stabilize at around 60 wt.% at the beginning of the reaction (0.5 min). This level is significantly lower than the 78 wt.% Al2O3 concentration in the solid CaAl4O7 product layer reported for stagnant flow conditions []. This indicates that dissolution occurs quickly and that the mass transport of compounds in the slag is rapid due to the interfacial phenomena observed in the present study.
By comparing the alloy compositional deviation from t.e. with that of the slag, two interesting patterns emerge. In the mid-stoichiometry ranges (1 and 1.2), the alloy deviates significantly from t.e. after 2 min, while the slag appears relatively homogenous from the interface to the crucible wall. This observation suggests either that the system is at equilibrium but the calculated t.e. for the alloy is incorrect, or that the reaction is no longer controlled by the concentration gradient in the slag phase. This flattening trend is less pronounced for S1.6, while the opposite trend between 0.5 and 2 min is observed for S2. This is likely because the alloy reached equilibrium with the slag approximately 2 mm into the slag bulk, leaving no chemical driving force for further reaction, only the driving force for mixing, which is constrained by less significant turbulence due to relatively fewer moles of reactants crossing the interface to that of the lower stoichiometries. Additionally, both S1.6 and S2 displayed a similar trend where the mass transfer coefficient appeared high between 0 and 0.5 min and then low between 0.5 and 2 min. This may be attributed to S1.6 and S2 experiencing the largest compositional changes in the slag and coupled with the highest viscosity, as shown in Figure 11, may indicate complex kinetic behavior dependent on the slag phase.
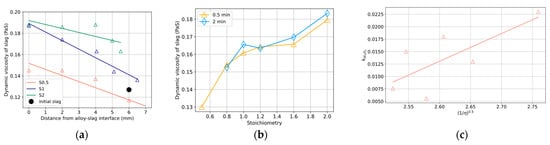
Figure 11.
(a) Dynamic viscosity with distance perpendicular from the alloy–slag interface to the crucible wall after 0.5 min. Lines are the linear predictions of the data points (triangles). (b) Total average dynamic viscosity with varying stoichiometries (abbreviated “S”). (c) Shows the relationship between dynamic viscosity and estimated mass transfer coefficient of kAl2O3 reacted at different stoichiometries. Line is the linear prediction of the data points (triangles).
Since the mass transfer coefficient was estimated with reasonable accuracy between 0 and 2 min using a first-order equation (Equation (6)), this same time range was selected to examine the kinetic behavior for various stoichiometries. The same method was applied to the stoichiometry series, with the results presented in Table 3 for weighted average composition. The linear fit was notably less accurate for stoichiometries 1.6 and 2, as reflected by poorer performance metrics. The compositional gradient in the slag tends to vanish after approximately 2 min of reaction time for all stoichiometries except 1.6 and 2. For stoichiometries 1.2 and lower, the concentration gradient continues to drive diffusion up until this time, following the first-order relationship in Equation (6), providing further evidence that the reaction in the slag phase is mass-transfer controlled.
Table 3.
Rough estimation of mass transfer coefficient (k) of Al2O3 (cm/s) and statistical metrics for different stoichiometries.
As stoichiometry increases, the alloy-to-slag mass ratio rises from about 1/6 for S0.5 to 1/2 for S1.6 and S2. This change in ratio suggests that the relatively shorter transport distance in the slag could decrease the influence of mass transfer control in the slag while increasing its significance in the alloy. To validate this, the same model was tested under the assumption of mass transfer control in the alloy, as well as mixed control (in both the alloy and slag), using the equation derived in reference []. However, neither assumption resulted in a satisfactory fit. Both stoichiometries displayed a similar trend: the coefficient was high between 0 and 0.5 min, then attenuated between 0.5 and 2 min.
Figure 11a shows the dynamic viscosities at varying distances perpendicular to the alloy–slag interface for some stoichiometries and initial slag viscosity after a reaction time of 0.5 min. The viscosity tends to decrease with distance from the alloy–slag interface to the bulk slag due to the relative increase in Al2O3, which gives a higher viscosity compared to CaO and SiO2. As the reaction progresses and mass transfer homogenizes the slag, the change in viscosity with distance from the interface decreases. Using these values for 0.5-min and 2-min reaction times, the calculated total averages are displayed in Figure 11b. The average dynamic viscosity is generally lower with lower stoichiometries, reflecting the lower reduction degrees of CaO and SiO2 relative to the total volume (see Figure 12b).
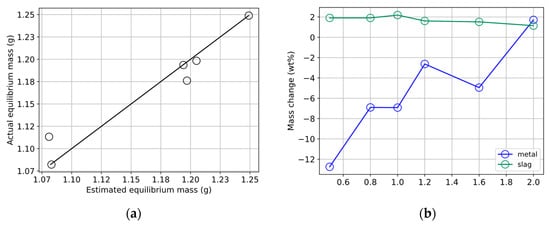
Figure 12.
(a) Validation of metal mass prediction (line) using equilibrium data (circles) and (b) calculated predictions of the real metal–alloy mass change and slag mass change in experiments for all stoichiometries.
Considering the mass transport limitation in the slag, it is reasonable to quantify the relationship between the mass transfer coefficient and the average viscosity of the slag. According to the surface renewal model for mass transfer [], the mass transfer coefficient is given by:
where ks is the mass transfer coefficient in the slag phase, D is the diffusivity of the component, and tc is the reaction time. Assuming that the Stokes–Einstein relation is valid for this system, i.e., diffusivity is inversely proportional to dynamic viscosity, the following relationship is obtained, and the result is shown in Figure 11c.
This figure displays the apparent mass transfer coefficient of Al2O3 plotted against the square root of the inverse viscosity, using the total average viscosity after 0.5 min (with similar results for 2 min). The best-fit linear line, representing Equation (8), is shown. This outcome provides further evidence that the rate of reaction is controlled by mass transfer in the slag phase. However, the scattered data points suggest that viscosity alone is not the only significant factor in kinetics, especially given the turbulent interfacial phenomena.
The mass of the alloy and the slag was not measured in this study, and accurate measurement in practice is challenging due to issues such as liquid spills or the mixing of solid phases. Since the stoichiometry varied, the number of moles crossing the interface also changed. This variable must be controlled to understand the kinetics and the deviating behavior of the alloy shown in Figure 9d. Equation (9) provides a reasonable estimate of the alloy mass produced for different stoichiometries, based on the known alloy composition and the initial metal mass.
where nAl,react., nAl,0, nSi,prod., nalloy, Mi, and xi are initial guess reacted moles of Al, actual initial moles Al in the metal, guessed moles Si produced, molar weights for component i, and final molar fractions of component i, respectively.
This equation assumes that only the stoichiometric relationship from reaction Equation (1) is relevant to the mass produced. The validity of the equation was evaluated by using calculated equilibrium values for fractions and mass of the final alloy, with the results shown in Figure 12a. The deviation from the actual equilibrium mass of the alloy ranged from 0.003% to 2.88%. The highest deviations were observed for stoichiometries 0.5 (−2.88%) and 1.2 (+1.81%) relative to the actual equilibrium alloy mass. This equation was then used to estimate the real mass of the alloy produced in experiments and on larger production scales (Figure 12b). The graph demonstrates that the relative alloy mass decreases with increased Si content (low stoichiometry) and increases with higher Ca and Al content (medium and high stoichiometries). Ignoring weight loss due to evaporation, the weight change of the slag was calculated and is also shown in the same figure, varying by only 1–2 wt.% for these stoichiometries.
In addition to viscosity, turbulence at the interface induced by the reaction was examined as a potential factor affecting kinetics. Turbulence is a function of the reaction degree, which is tied to the number of moles crossing the interface due to the reaction. Using the predicted alloy mass, the number of oxidized moles of Al to Al2O3, normalized by the initial moles of Al, was calculated and is shown in Figure 13a. The number of moles of Al consumed, normalized by the initial total mass of metal and slag, is shown in Figure 13b. Although relatively more moles cross the interface with decreasing stoichiometry, leading to greater interfacial turbulence (Figure 13a), this effect is mitigated by the larger slag mass content, where the composition changes less due to less reduction in SiO2 and CaO. Interfacial turbulence and viscosity seem to work in favor of each other under these conditions. Despite lower stoichiometries involving fewer moles being converted in the total system, interfacial turbulence remains high, and the lower viscosity allows relatively fast mass transfer in the relatively larger volume of slag. However, these relationships do not fully explain the deviation between experimental results and t.e. in the alloy (Figure 9d), prompting further investigation into the underlying chemistry.
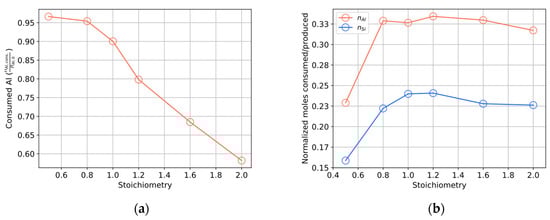
Figure 13.
(a) Calculated consumed moles of Al normalized by initial moles of Al with varying stoichiometries after 2 min (0.5 min for stoichiometry 0.5) and (b) calculated consumed moles of Al and produced moles of Si normalized by total initial moles of metal and slag with varying stoichiometries after 2 min (0.5 min for stoichiometry 0.5).
The deviation from t.e. in the alloy, as illustrated in Figure 9d, was analyzed using the activities of the main reacting components, aAl and aSiO2, which represent equilibrium activities calculated in FactSage 8.1 []. The equilibrium activities of Al and SiO2 have an inverse relationship with stoichiometry. For stoichiometries 0.5 to 1, the deviation from t.e. increases, indicating less reaction than expected, as aSiO2 decreases relative to aAl. However, the trend reverses for stoichiometries of 1.2 and above, showing a decreasing deviation as aAl increases, while aSiO2 remains relatively constant, as indicated in Table 4. This relationship can be visualized in Figure 14 using Equations (10) and (11), which show Al conversion relative to t.e. as a function of the equilibrium activities aAl and aSiO2.
where constants A and B are 0.074 and 1.12 for the 0.5-min data and 0.082 and 1.18 for the 2-min data. The exponents could be related to the molar relationship in Equation (1). This model represents the best fit obtained by varying both the exponents and the constants in front of each activity. The relatively good fit indicates that the observed deviations from t.e. with respect to stoichiometries could be attributed to the inter-relationship between the activities of the main components. This understanding is valuable for predicting process outcomes, given that a larger deviation from t.e. for S1.2 was observed in pilot-scale studies [].
Table 4.
Relative conversion model using 2-min data.
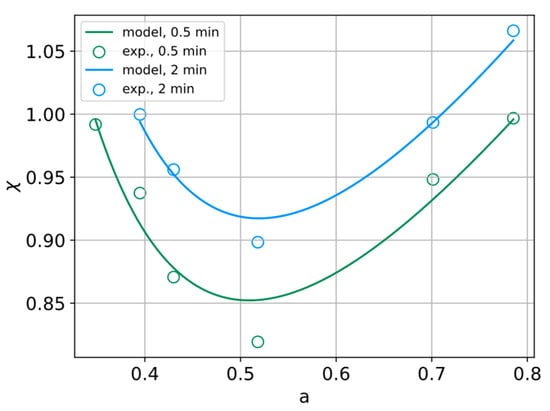
Figure 14.
Model describing Al conversion relative to t.e. () as a function of aAl and aSiO2 plotted with experimental data obtained at 0.5 min and 2 min.
The metallic content in the slag tends to decrease with reaction time, as quantified in a Si metal refining study []. It was found that emulsion levels increase with CaO content due to more reaction between Ca and SiO2. Previous studies by the authors [], as well as studies with varying initial CaO/SiO2 ratios in the slag [], have shown that the Si2Ca phase is the most prominent metallic phase entrapped in the slag. These findings align with the present results, indicating that the metallic phase entrapped in slag decreases with decreasing stoichiometry and exhibits a higher degree of coalescence (with larger droplets), as seen in Figure 15a–c. This pattern is due to the increased CaO reduction to Si2Ca with stoichiometry, which may result from either slower mass transfer of the metallic phase in the slag due to higher viscosity or reduced interfacial turbulence due to less mass transfer across the interface (Figure 13a). These factors proved to be more critical than reaction time. The separation between alloy and slag was observed to be most satisfactory for stoichiometries 0.5 and 0.8. Stoichiometry 2 had fewer entrapped alloy droplets than stoichiometries 1–1.6, likely due to reduced Ca content in the alloy, as expected from t.e. Although the alloy and slag are in approximate equilibrium for higher stoichiometries, the potential loss of metal in slag must be considered when assessing the overall kinetics at pilot and industrial scales.
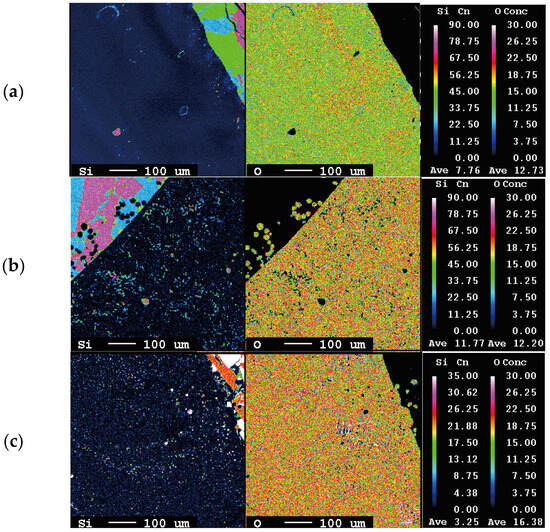
Figure 15.
Alloy entrapment in slag for stoichiometries (a) S0.5-0.5 min, (b) S1-0.5 min, and (c) S1.6-0.5 min.
4. Conclusions
- For an Al-SiO2 stoichiometry of 1, with solid Al metal dropped into a non-agitated liquid CaO-SiO2 slag at 1650 °C, the conversion relative to thermodynamic equilibrium within 15 s was 72%, 83%, and 83% for Ca, Si, and Al, respectively. The reaction was driven by significant interfacial turbulence induced by the high thermodynamic driving force and induced energy from aluminum immersion. This turbulence accelerates the reaction rate by increasing the interfacial area. However, as the reaction gradually decelerates, the resulting silicon alloy quickly transitions to a smaller and more stable interfacial area, and at this point, further reaction is primarily limited by mass transport in the slag phase.
- The first-order equation for mass transfer control in the slag provided a reasonable prediction of the apparent reaction kinetics when Al metal was immersed in an approximate 1:1 CaO-SiO2 slag. The mass transfer coefficient for Al2O3 was calculated to be in the range of 1–2 × 10⁻² cm/s for stoichiometries 0.5–1.2. However, a constant mass transfer coefficient could not be determined for stoichiometries 1.6 and 2, as these deviated from the typical slag mass transfer behavior and did not conform to either metal or mixed control relationships.
- The discrepancy between analyzed alloy composition and thermodynamic equilibrium, particularly Ca, was consistent with previous work and most prominent for mid-range stoichiometries. Because the slag was close to homogenous in contact with the alloy, this suggests that the activity coefficients should be the subject of further research.
- Stoichiometries of 0.5 and 0.8 facilitated better alloy–slag separation due to reduced reduction of CaO, resulting in less Si2Ca phase being entrapped in the slag. For higher stoichiometries, entrapped Si2Ca likely faces challenges in coalescing and diffusing to the bulk Si alloy, attributed to relatively lower interfacial turbulence and higher viscosity.
Author Contributions
Conceptualization, H.G.R.P., M.W. and K.E.E.; methodology, H.G.R.P.; formal analysis, H.G.R.P.; writing—original draft preparation, H.G.R.P.; review and editing, H.G.R.P., M.W. and K.E.E.; supervision, M.W. and K.E.E. All authors have read and agreed to the published version of the manuscript.
Funding
The project has received funding from the European Union’s Horizon 2020 research and innovation program under Grant Agreement N° 869268 and from the Norwegian University of Science and Technology (NTNU).
Data Availability Statement
The raw data supporting the conclusions of this article will be made available by the authors on request.
Acknowledgments
The authors wish to thank Morten Peder Raanes for supplying the EPMA image collection.
Conflicts of Interest
The authors declare no conflicts of interest.
References
- Silicon Market Size—Global Industry, Share, Analysis, Trends and Forecast 2022–2030. Acumen Research and Consulting. Available online: https://www.acumenresearchandconsulting.com/silicon-market (accessed on 15 January 2024).
- Bale, C.W.; Bélisle, E.; Chartrand, P.; Decterov, S.A.; Eriksson, G.; Gheribi, A.E.; Hack, K.; Jung, I.H.; Kang, Y.B.; Melançon, J. Reprint of: FactSage thermochemical software and databases, 2010–2016. Calphad 2016, 55, 1–19. [Google Scholar] [CrossRef]
- Philipson, H.; Blandhol, K.; Engvoll, K.; Djupvik, V.; Wallin, M.; Tranell, G.; Haarberg, T. Preliminary Techno-Economic Considerations of the Sisal Process—Closing Materials Loops through Industrial Symbiosis. In Proceedings of the Silicon for the Chemical & Solar Industry XVI, Trondheim, Norway, 14–16 June 2022. [Google Scholar]
- Jacob, K.; Srikanth, S. Physical chemistry of the reduction of calcium oxide with aluminum in vacuum. High Temp. Mater. Process. 1990, 9, 77–92. [Google Scholar] [CrossRef]
- Philipson, H.; Wallin, M.; Einarsrud, K.E. Investigation of Liquid–Liquid Reaction Phenomena of Aluminum in Calcium Silicate Slag. Materials 2024, 17, 1466. [Google Scholar] [CrossRef] [PubMed]
- Philipson, H.; Wallin, M.; Einarsrud, K.E.; Tranell, G. Kinetics of silicon production by aluminothermic reduction of silica using aluminum and aluminum dross as reductants. In Proceedings of the 16th International Ferro-Alloys Congress (INFACON XVI), Trondheim, Norway, 27–29 September 2021. [Google Scholar]
- Philipson, H.; Solbakk, G.L.; Wallin, M.; Einarsrud, K.E.; Tranell, G. Innovative Utilization of Aluminum-Based Secondary Materials for Production of Metallurgical Silicon and Alumina-Rich Slag. In Light Metals 2022. The Minerals, Metals & Materials Series; Eskin, D., Ed.; Springer: Cham, Switzerland, 2022; pp. 1038–1045. [Google Scholar]
- Zhu, M.; Philipson, H.; Blandhol, K.; Djupvik, V.; Engvoll, K.; Safarian, J.; Tang, K.; Wallin, M.; Tranell, G. Pilot Scale Aluminothermic Production of Silicon Alloy and Alumina-rich Slag. ACS Sustain. Chem. Eng. 2024; under final revision. [Google Scholar]
- Solbakk, G.L. The Effect of Varying CaO/SiO2 Ratios and Reductant Addition in Silicon Production by Aluminothermic Reduction of Silica Based Slags. Master’s Thesis, Norwegian University of Science and Technology (NTNU) Department of Materials Science and Engineering, Trondheim, Norway, 2021. [Google Scholar]
- Gaye, H.; Lucas, L.D.; Olette, M.; Riboud, P.V. Metal-slag interfacial properties: Equilibrium values and “dynamic” phenomena. Can. Metall. Q. 1984, 23, 179–191. [Google Scholar] [CrossRef]
- Riboud, P.; Lucas, L. Influence of mass transfer upon surface phenomena in iron and steelmaking. Can. Metall. Q. 1981, 20, 199–208. [Google Scholar] [CrossRef]
- Chung, Y.; Cramb, A.W. Dynamic and equilibrium interfacial phenomena in liquid steel-slag systems. Metall. Mater. Trans. B 2000, 31, 957–971. [Google Scholar] [CrossRef]
- Kozakevitch, P.; Urbain, G.; Sage, M. Sur la tension interfaciale fonte/laitier et le mécanisme de désulfuration. Rev. Metall 1955, 52, 161–172. [Google Scholar] [CrossRef]
- Ooi, H.; Nozaki, T.; Yoshii, H. The effect of chemical reactions on the interfacial tension between iron and CaO-SiO2-Al2O3 slag. Trans. Iron Steel Inst. Jpn. 1974, 14, 9–16. [Google Scholar] [CrossRef]
- Chung, Y.; Cramb, A.W. Direct observation of spontaneous emulsification and associated interfacial phenomena at the slag–steel interface. Philos. Trans. R. Soc. London. Ser. A Math. Phys. Eng. Sci. 1998, 356, 981–993. [Google Scholar] [CrossRef]
- White, J.F.; Sichen, D. Mass transfer in slag refining of silicon with mechanical stirring: Transient kinetics of Ca and B transfer. Metall. Mater. Trans. B 2015, 46, 135–144. [Google Scholar] [CrossRef]
- Rhamdhani, M.A.; Coley, K.S.; Brooks, G. Analysis of the source of dynamic interfacial phenomena during reaction between metal droplets and slag. Metall. Mater. Trans. B 2005, 36, 591–604. [Google Scholar] [CrossRef]
- Rhamdhani, M.A.; Coley, K.; Brooks, G. Kinetics of metal/slag reactions during spontaneous emulsification. Metall. Mater. Trans. B 2005, 36, 219–227. [Google Scholar] [CrossRef]
- White, J.F.; Sichen, D. Mass transfer in slag refining of silicon with mechanical stirring: Transient interfacial phenomena. Metall. Mater. Trans. B 2014, 45, 96–105. [Google Scholar] [CrossRef]
- Richardson, F.D. Physical Chemistry of Melts in Metallurgy, Academic Press: London, UK; New York, NY, USA, 1974; Volume 2, pp. 411–498.
- Taira, S.; Nakashima, K.; Mori, K. Kinetic behavior of dissolution of sintered alumina into CaO-SiO2-Al2O3 slags. ISIJ Int. 1993, 33, 116–123. [Google Scholar] [CrossRef]
- Park, J.; Sridhar, S.; Fruehan, R.J. Kinetics of Reduction of SiO2 in SiO2-Al2O3-CaO Slags by Al in Fe-Al(-Si) Melts. Metall. Mater. Trans. B 2014, 45, 1380–1388. [Google Scholar] [CrossRef]
- Jamieson, B.; Tabatabaei, M.; Barati, M.; Coley, K.S. Kinetic modeling of the silicothermic reduction of manganese oxide from slag. Metall. Mater. Trans. B 2019, 50, 192–203. [Google Scholar] [CrossRef]
- Sørli, F. Refining Kinetics of the SisAl Silicon Alloy. Master’s Thesis, Norwegian University of Science and Technology (NTNU) Department of Materials Science and Engineering, Trondheim, Norway, 2023. [Google Scholar]
- Ken Mills—Slag Modelling. 2011. Available online: https://www.pyrometallurgy.co.za/KenMills/ (accessed on 3 February 2024).
- Mills, K. The estimation of slag properties. S. Afr. Pyrometallurgy 2011, 7, 35–42. [Google Scholar]
- Ji, F.; Rhamdhani, M.; Subagyo Barati, M.; Coley, K.I.S.; Brooks, G.A.; Irons, G.A.; Nightingale, S. Treatment of transient phenomena in analysis of slag-metal-gas reaction kinetics. High Temp. Mater. Process. 2003, 22, 359–368. [Google Scholar] [CrossRef]
- Maroufi, S.; Amini, S.; Jahanshahi, S.; Ostrovski, O. Diffusion coefficients and structural parameters of molten slags. In Advances in Molten Slags, Fluxes, and Salts, Proceedings of the 10th International Conference on Molten Slags, Fluxes and Salts 2016, Seattle, WA, USA, 22–25 May 2016; Springer: Berlin/Heidelberg, Germany, 2016. [Google Scholar]
- Kim, M.-S.; Park, M.-S.; Kang, E.-K.; Park, J.-K.; Kang, Y.-B. A reaction between high Mn–high Al steel and CaO–SiO2-type molten mold flux: Reaction mechanism change by high Al content ([pct Al]0 = 5.2) in the steel and accumulation of reaction product at the reaction interface. ISIJ Int. 2018, 58, 686–695. [Google Scholar] [CrossRef]
- Engh, T.A.; Sigworth, G.K.; Kvithyld, A. Principles of Metal Refining and Recycling; Oxford University Press: Oxford, UK, 2021; p. 260. [Google Scholar]
- Higbie, R. The Rate of Absorption of Pure Gas into a Still Liquid during Short Periods of Exposure. Trans. Am. Inst. Chem. Eng. 1935, 31, 365–389. [Google Scholar]
Disclaimer/Publisher’s Note: The statements, opinions and data contained in all publications are solely those of the individual author(s) and contributor(s) and not of MDPI and/or the editor(s). MDPI and/or the editor(s) disclaim responsibility for any injury to people or property resulting from any ideas, methods, instructions or products referred to in the content. |
© 2024 by the authors. Licensee MDPI, Basel, Switzerland. This article is an open access article distributed under the terms and conditions of the Creative Commons Attribution (CC BY) license (https://creativecommons.org/licenses/by/4.0/).