


Study and Optimization of the Punching Process of Steel Using the Johnson–Cook Damage Model
 , , , ,
  ,
,
Abstract
:1. Introduction
2. Materials and Methods
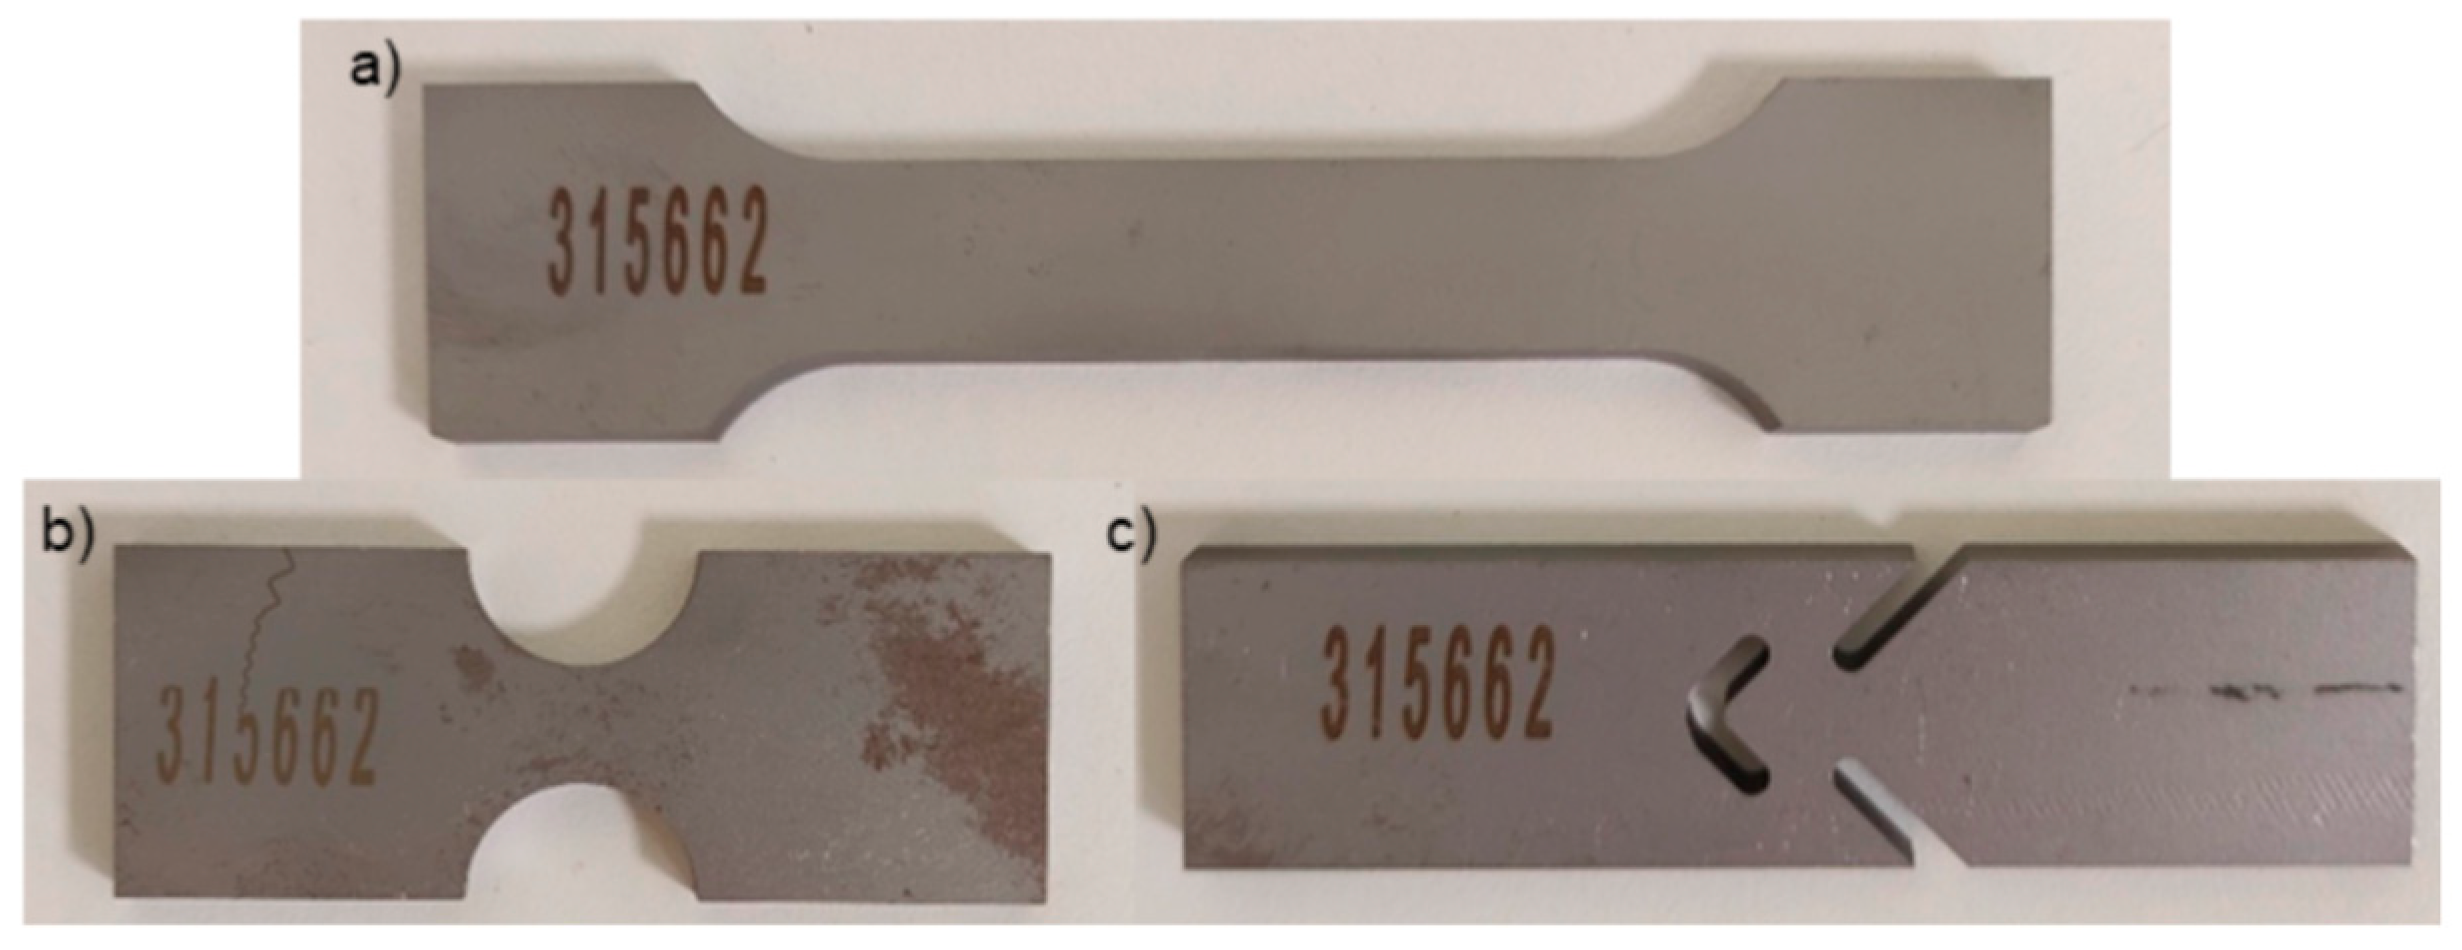
2.1. Materials
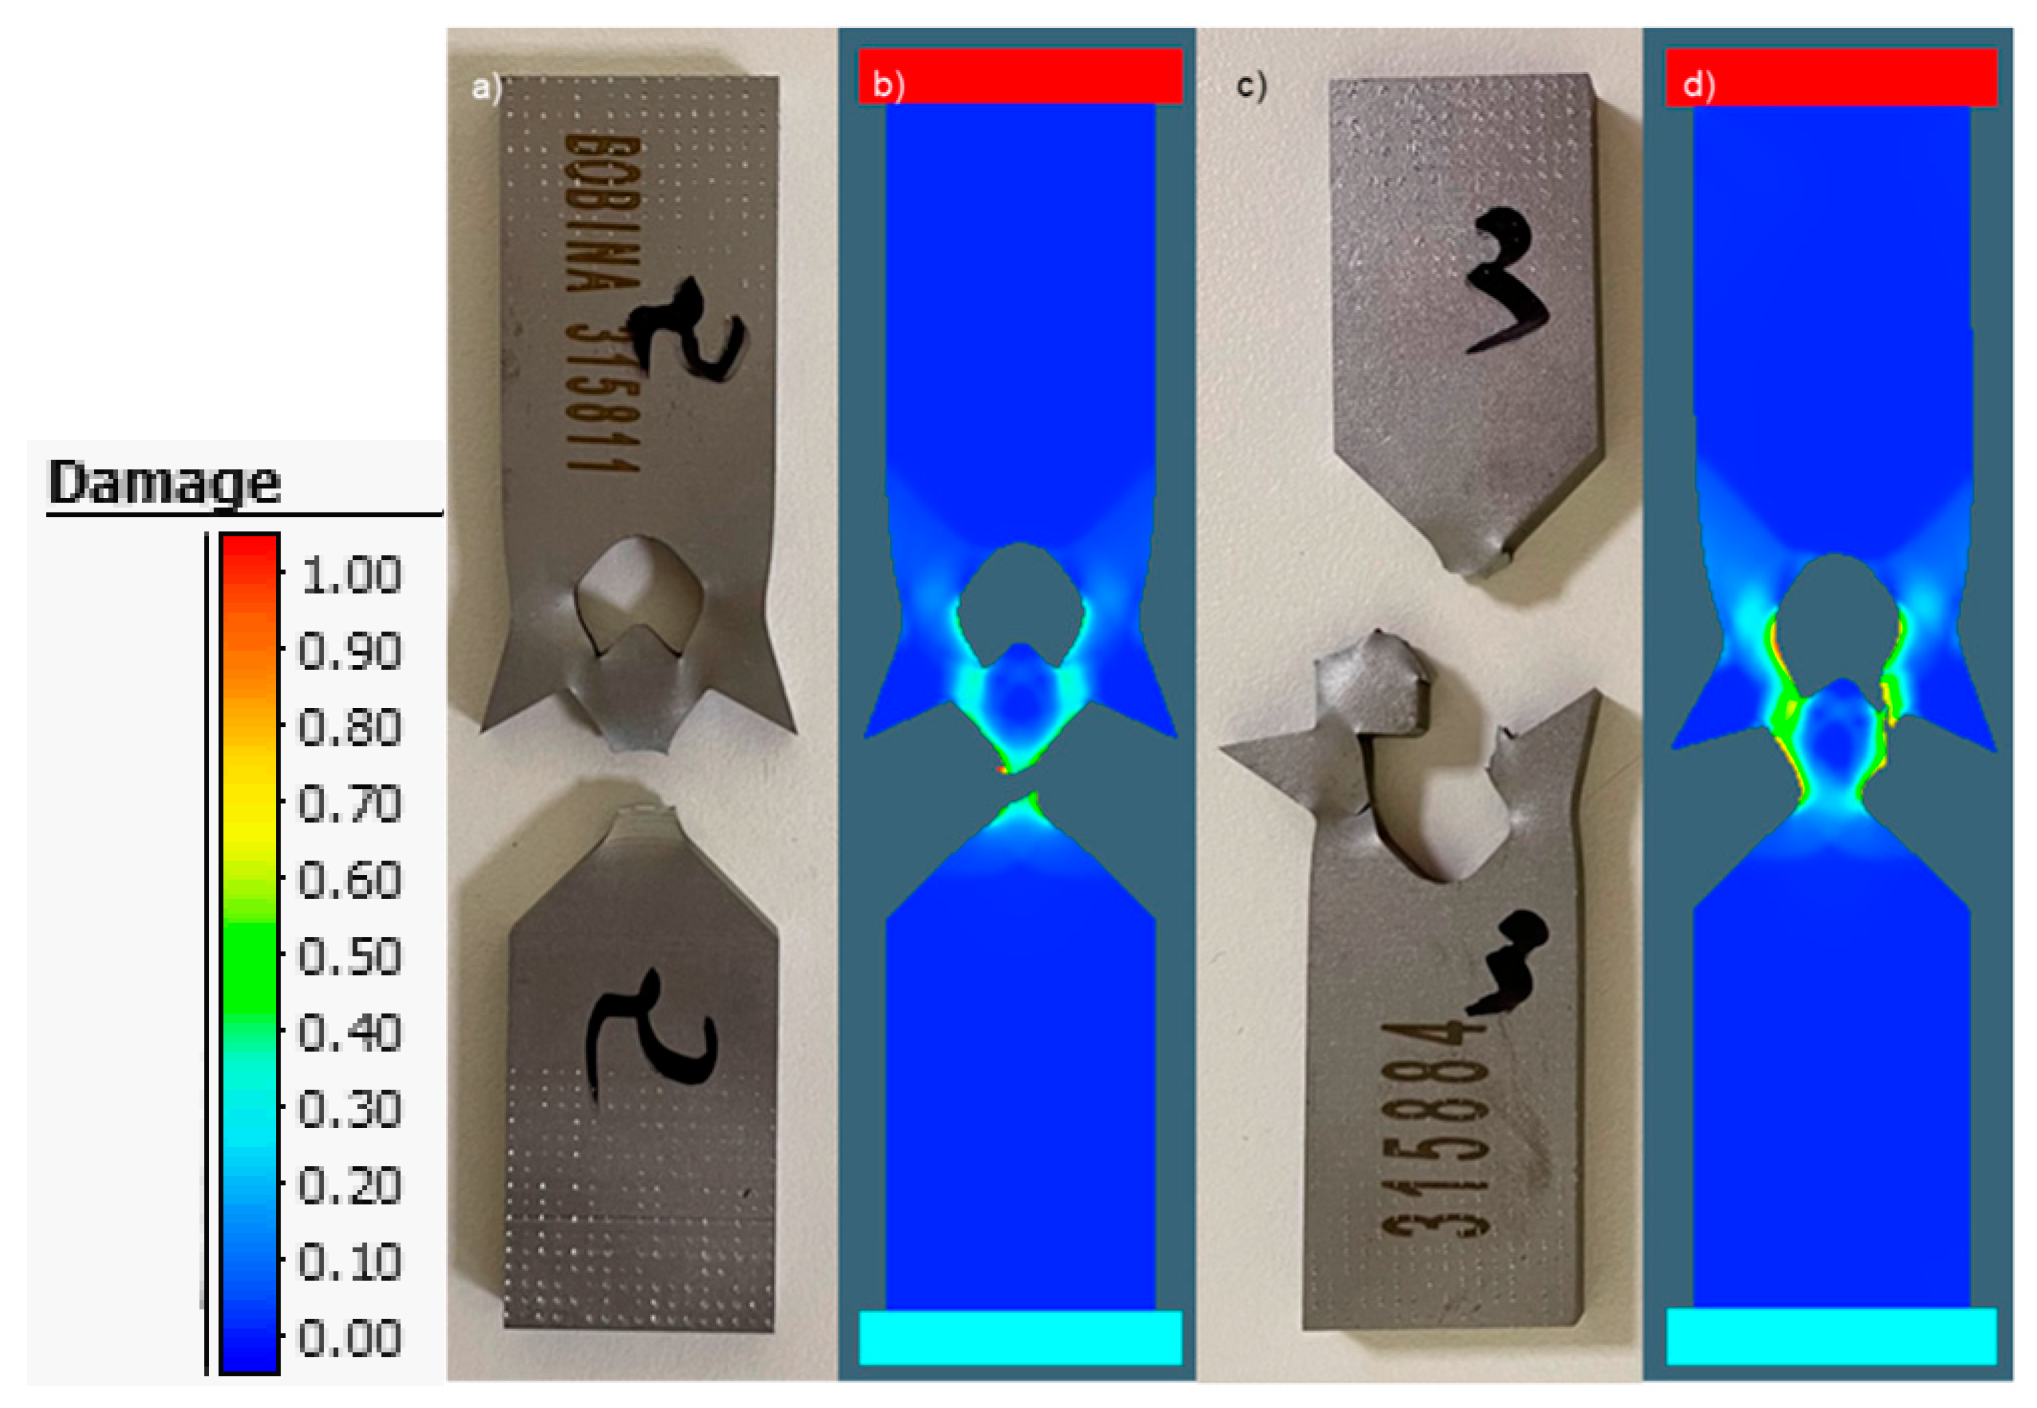
- Shear test sample → Pure shear stress: η = 0
- Conventional tensile test → Pure traction: η = 1/3
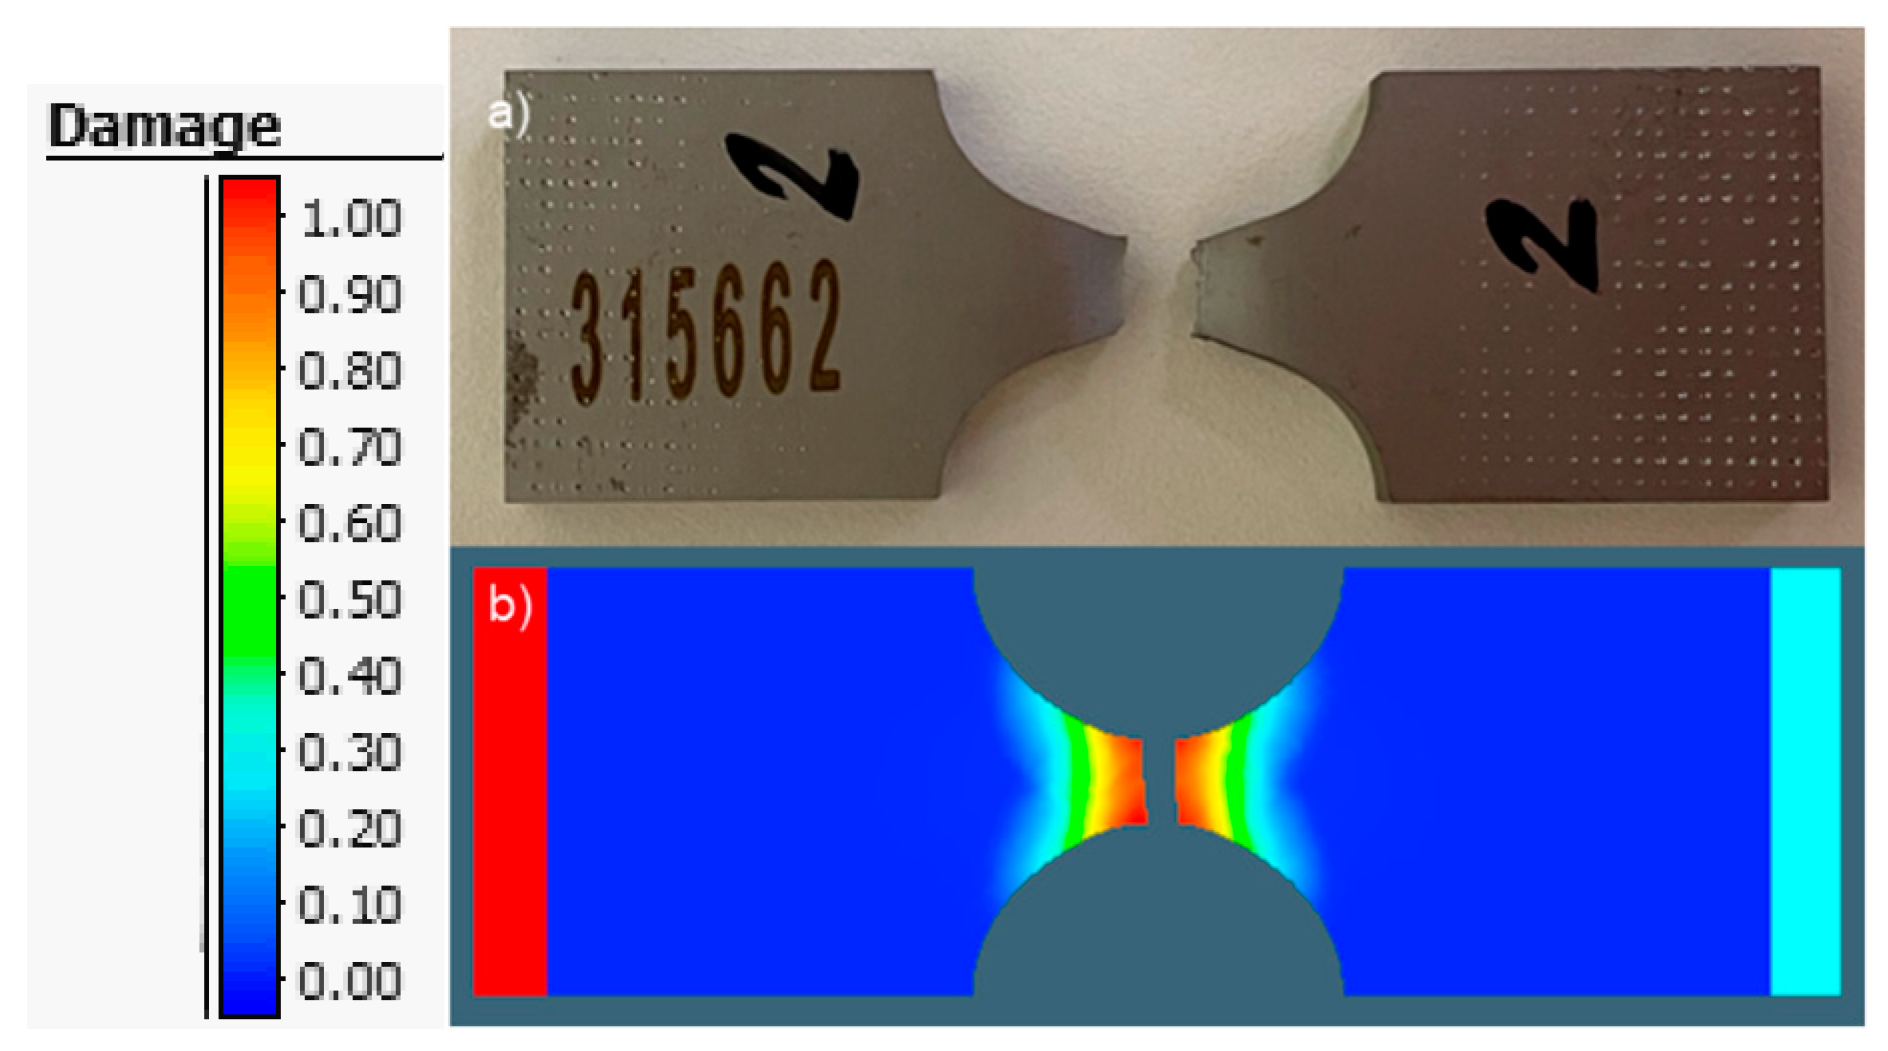
- Notched test sample → Tensile test with notch: η = 2/3
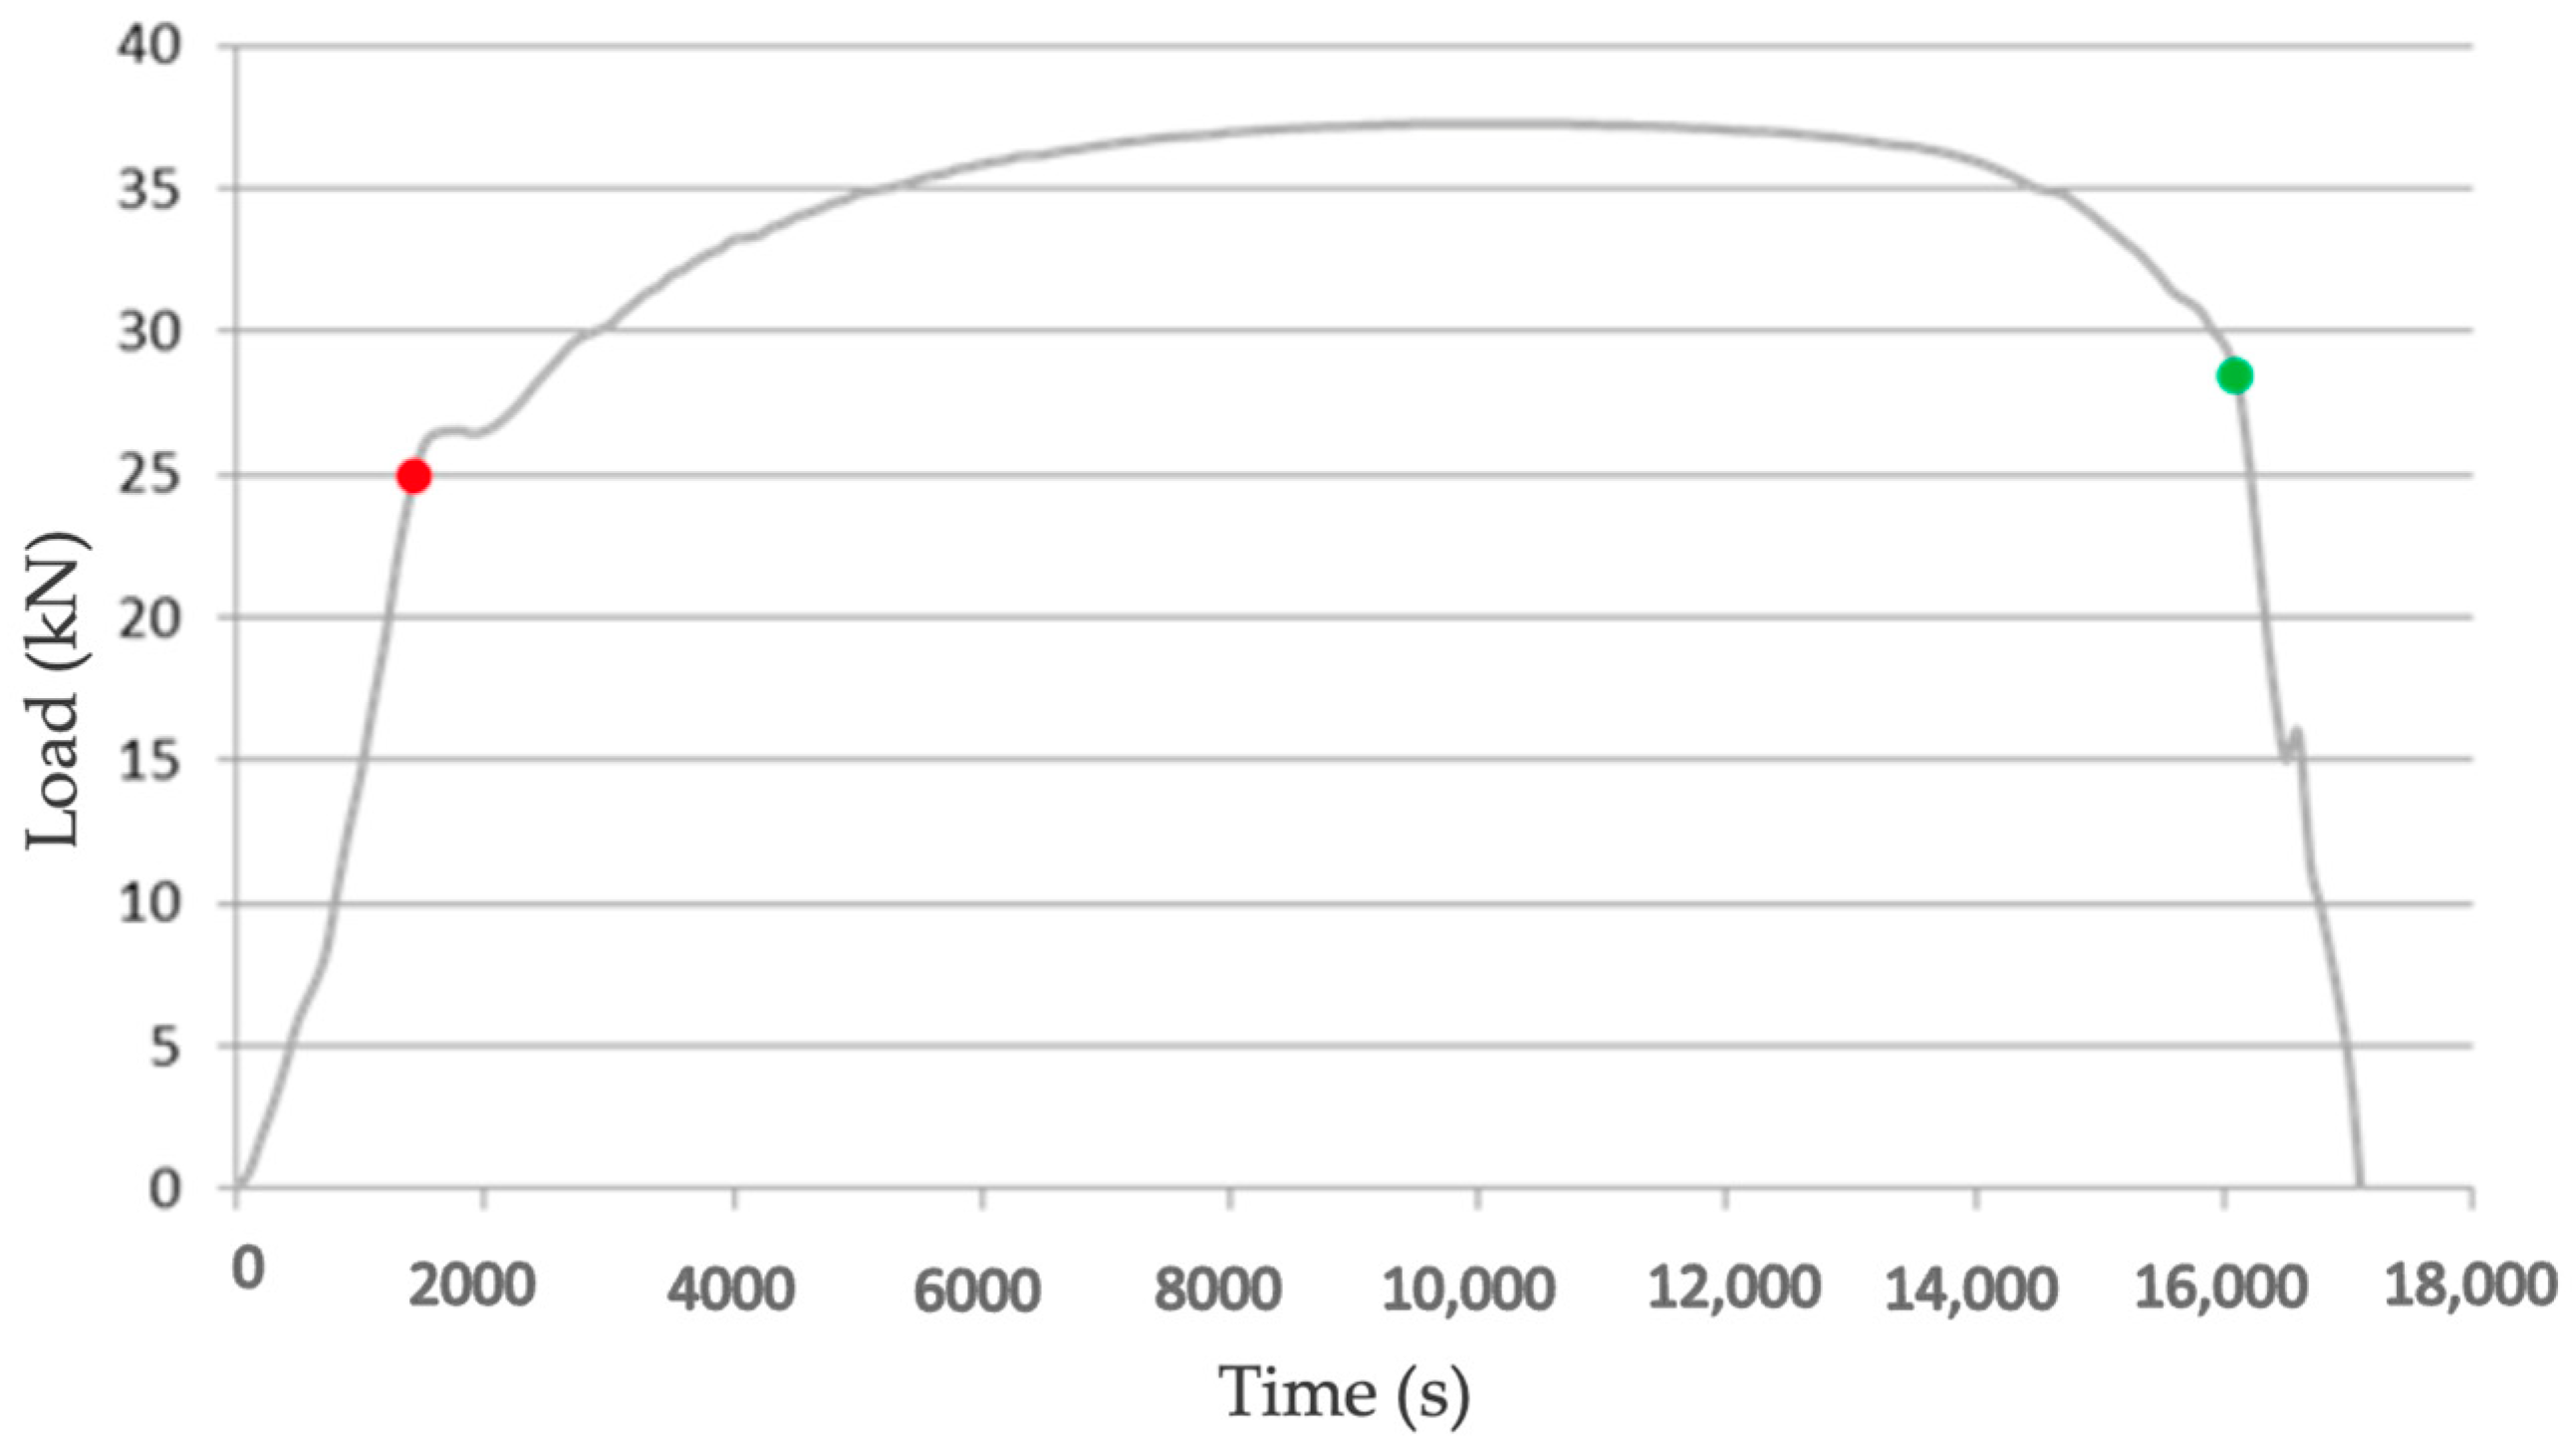
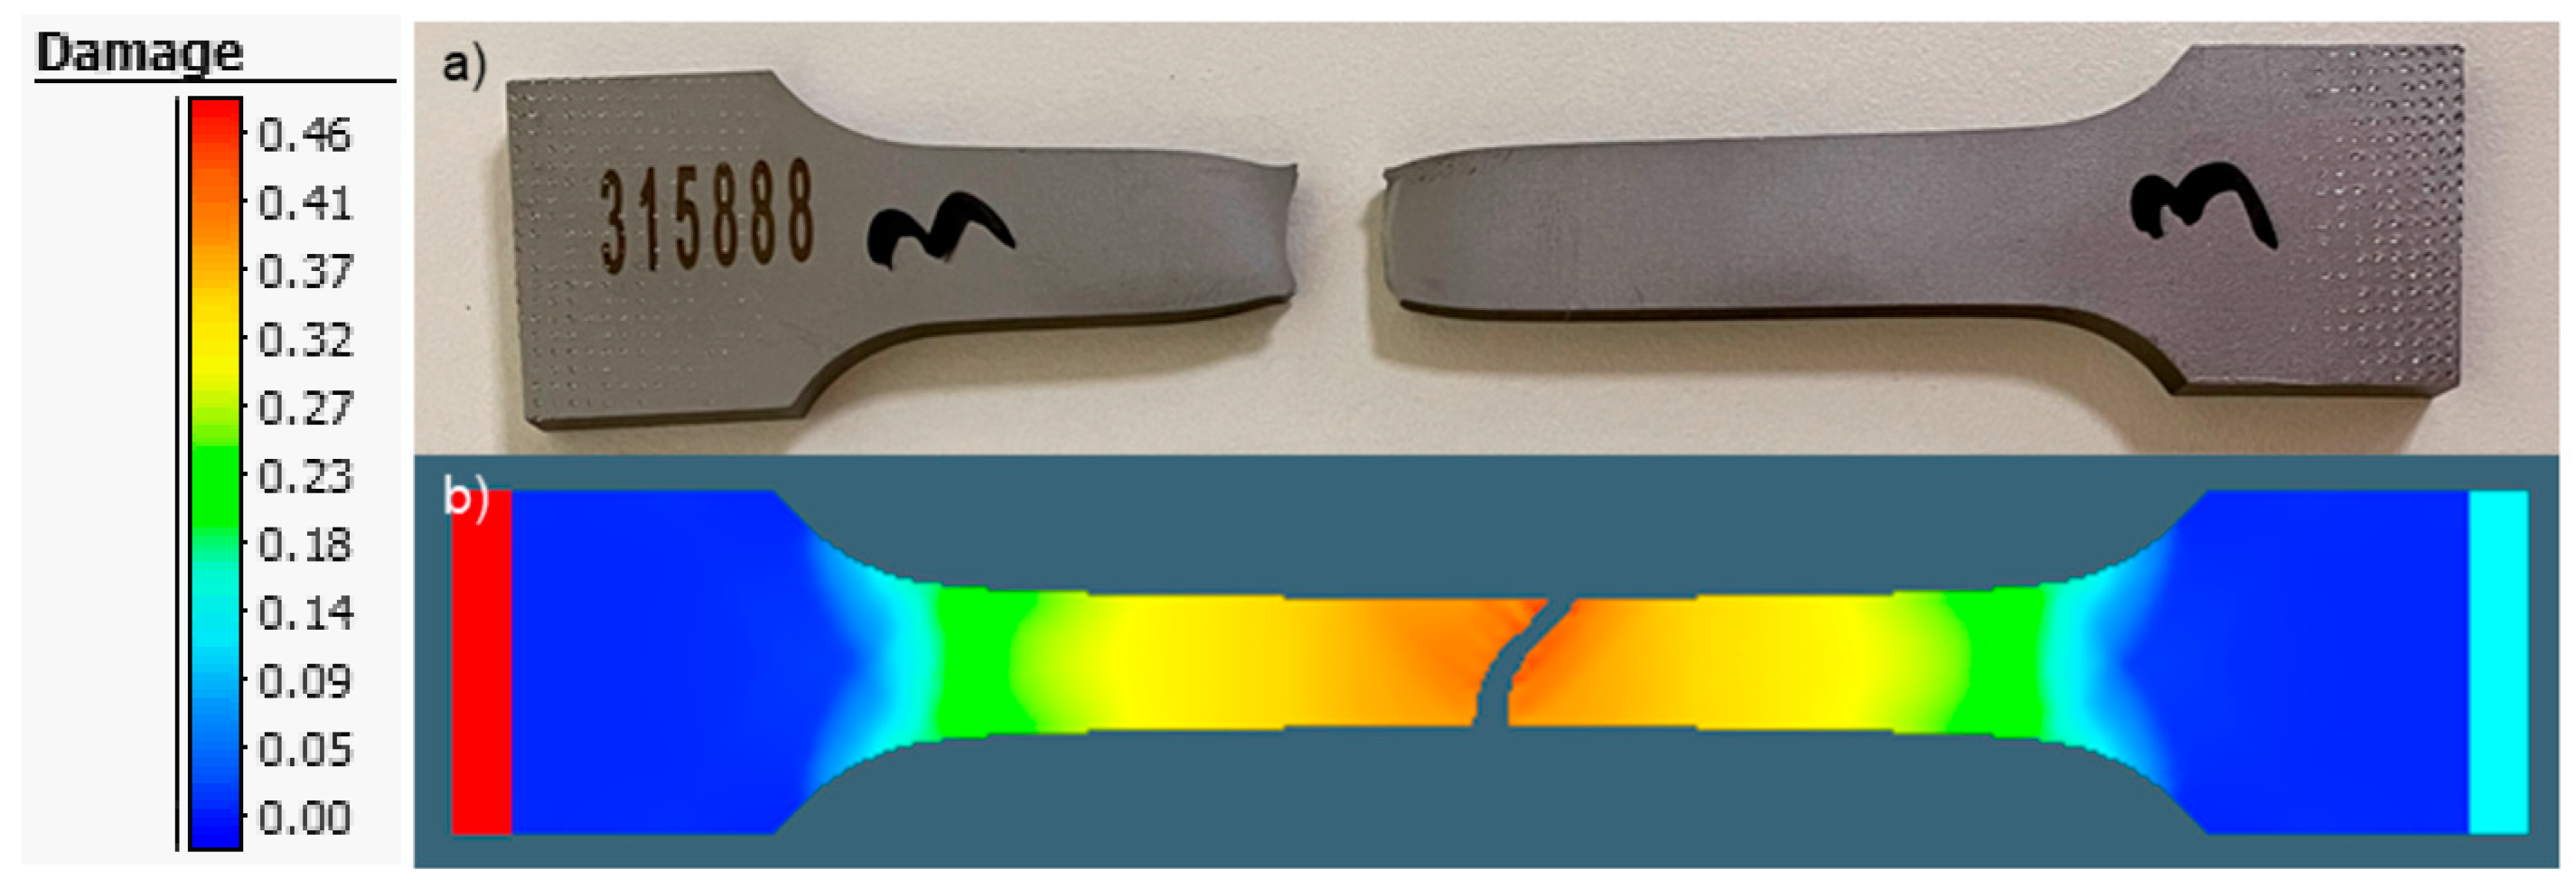
2.2. Tensile Tests
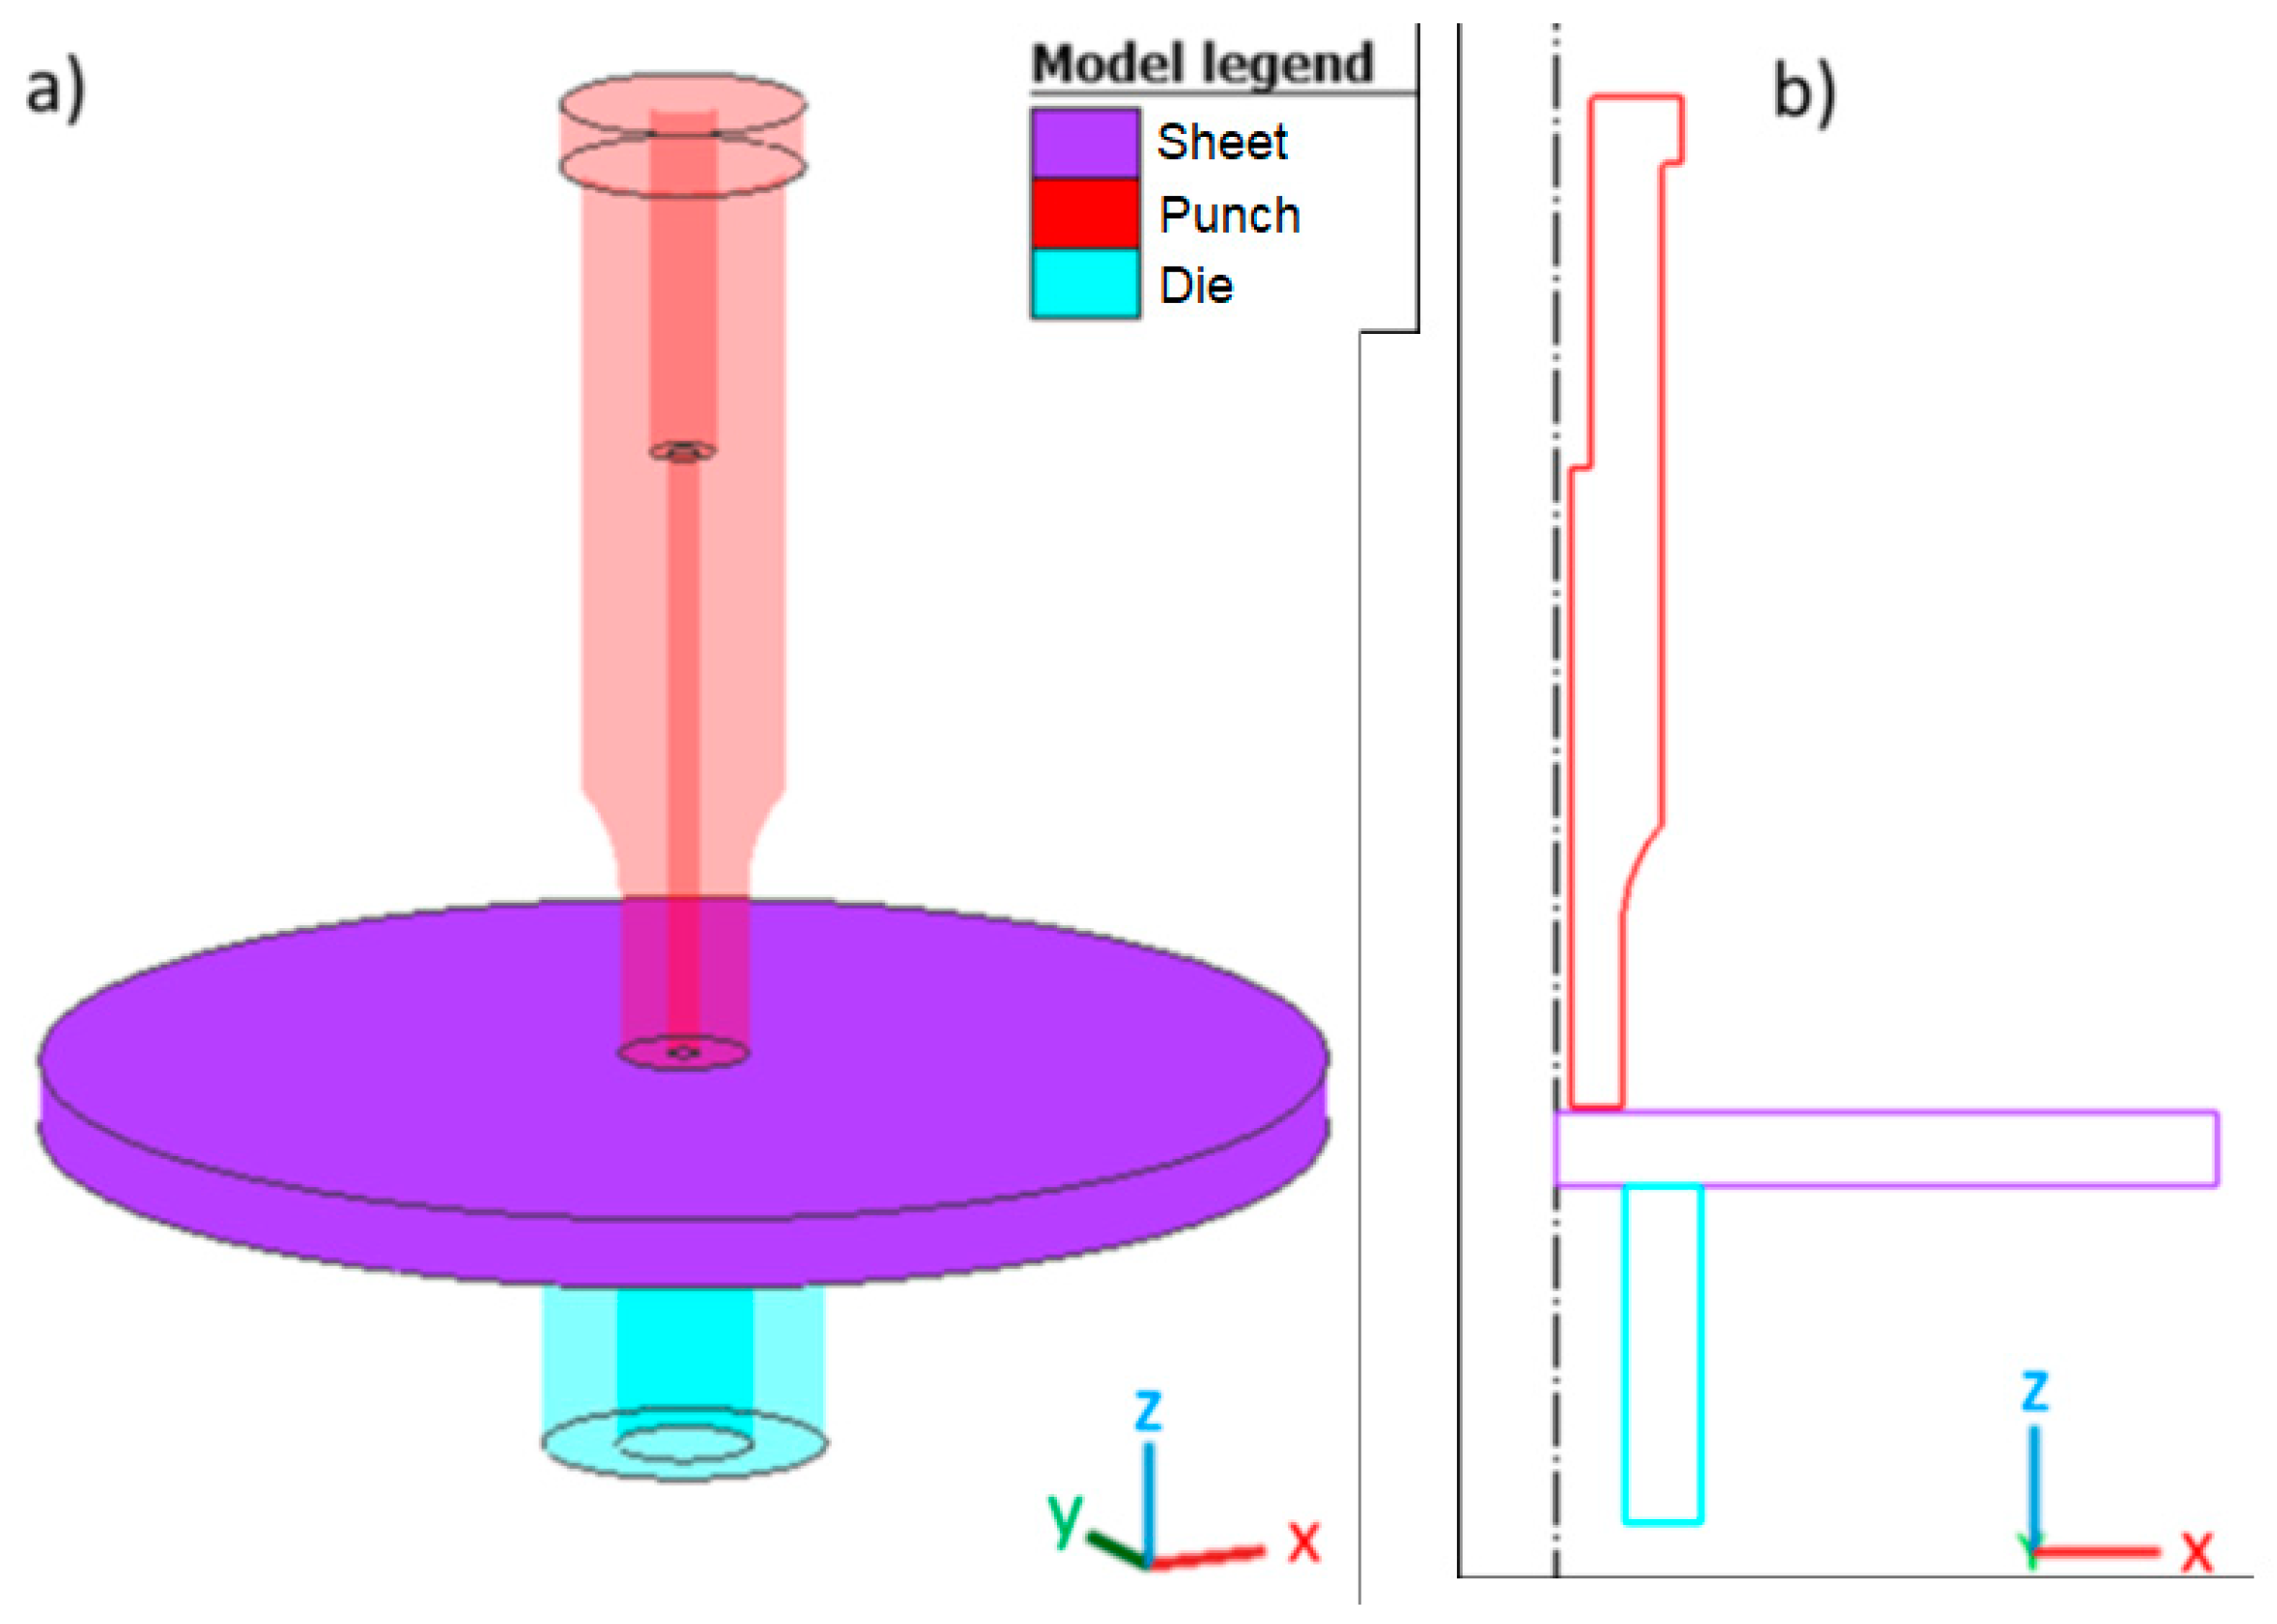
2.3. Simulations
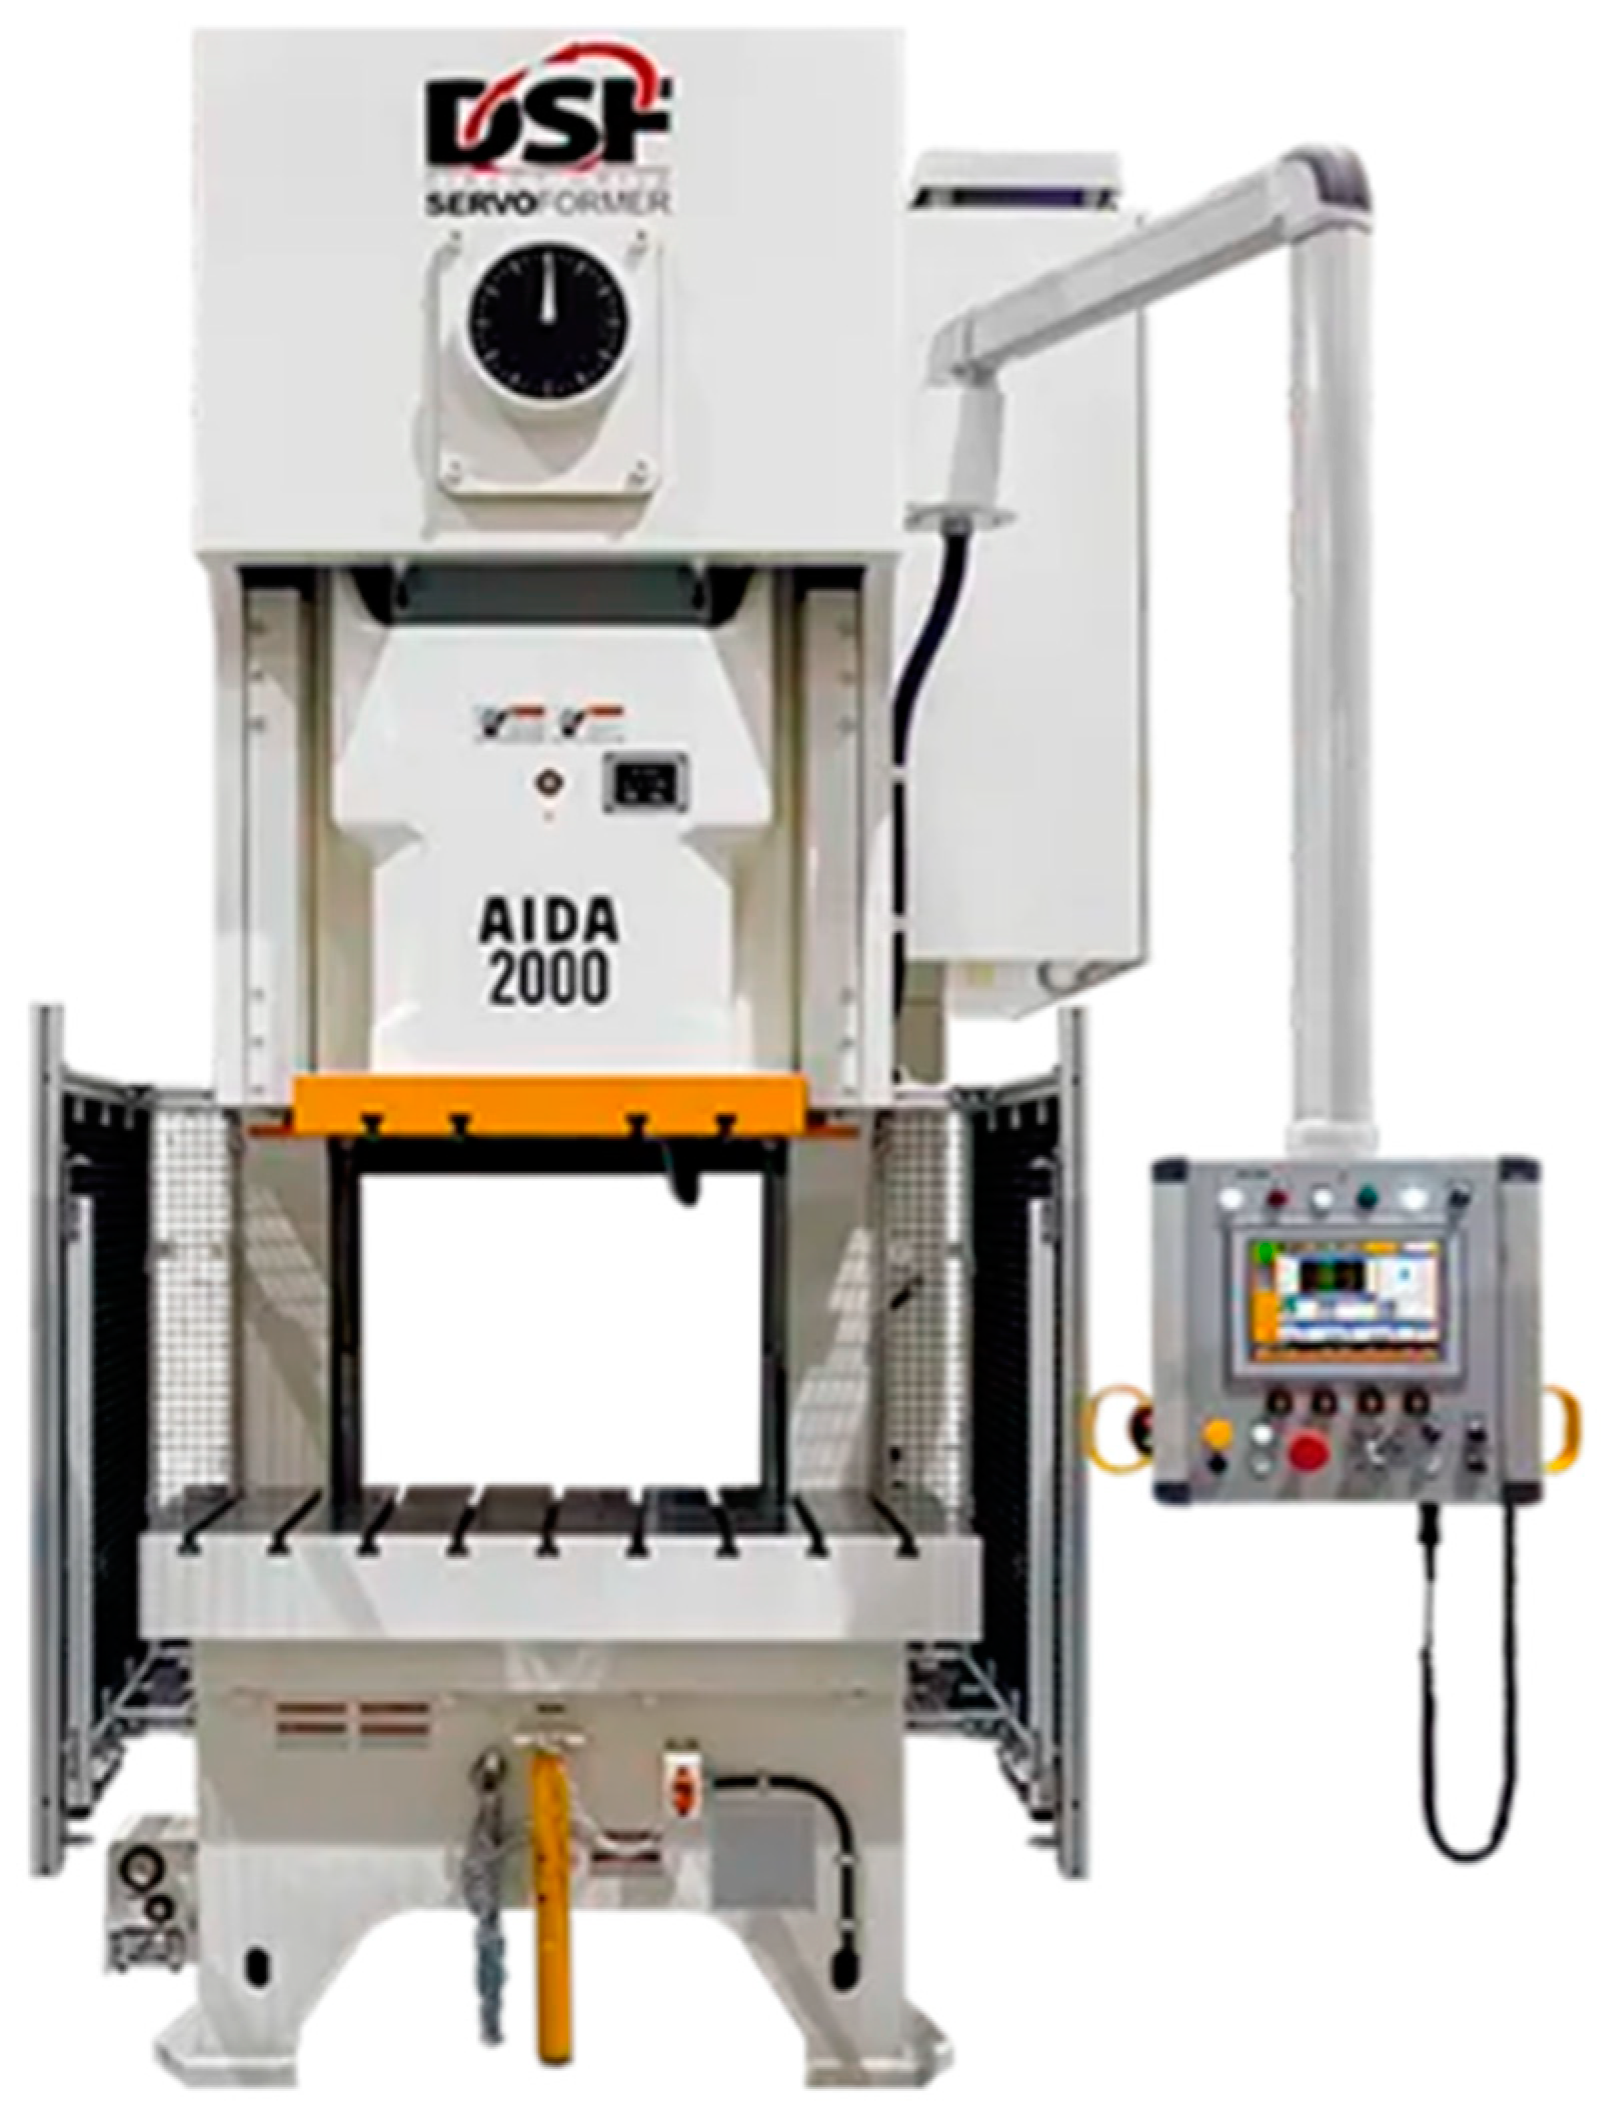
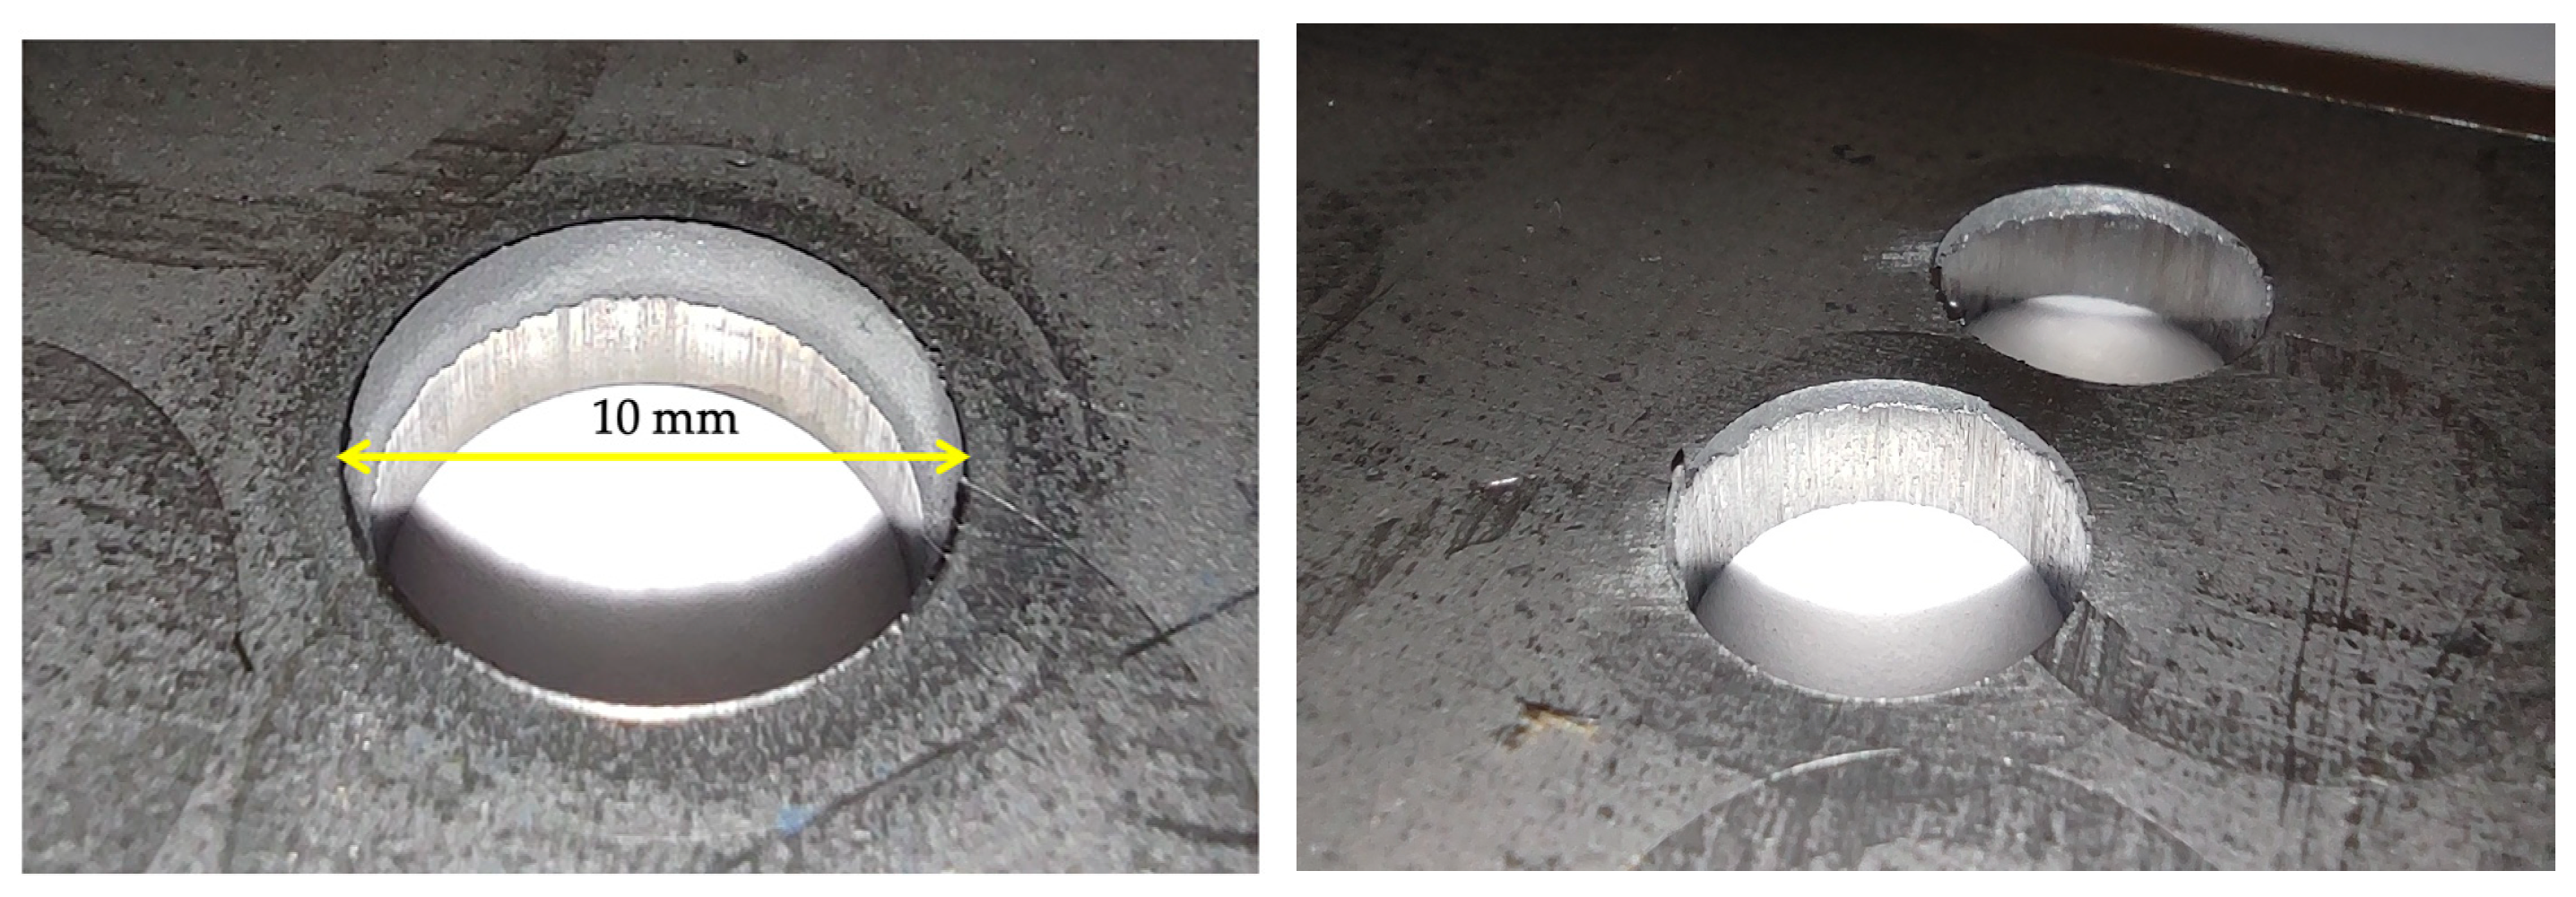
2.4. Experimental Punching Tests
3. Characterization (K, n and Damage Parameters)
3.1. Tensile Tests
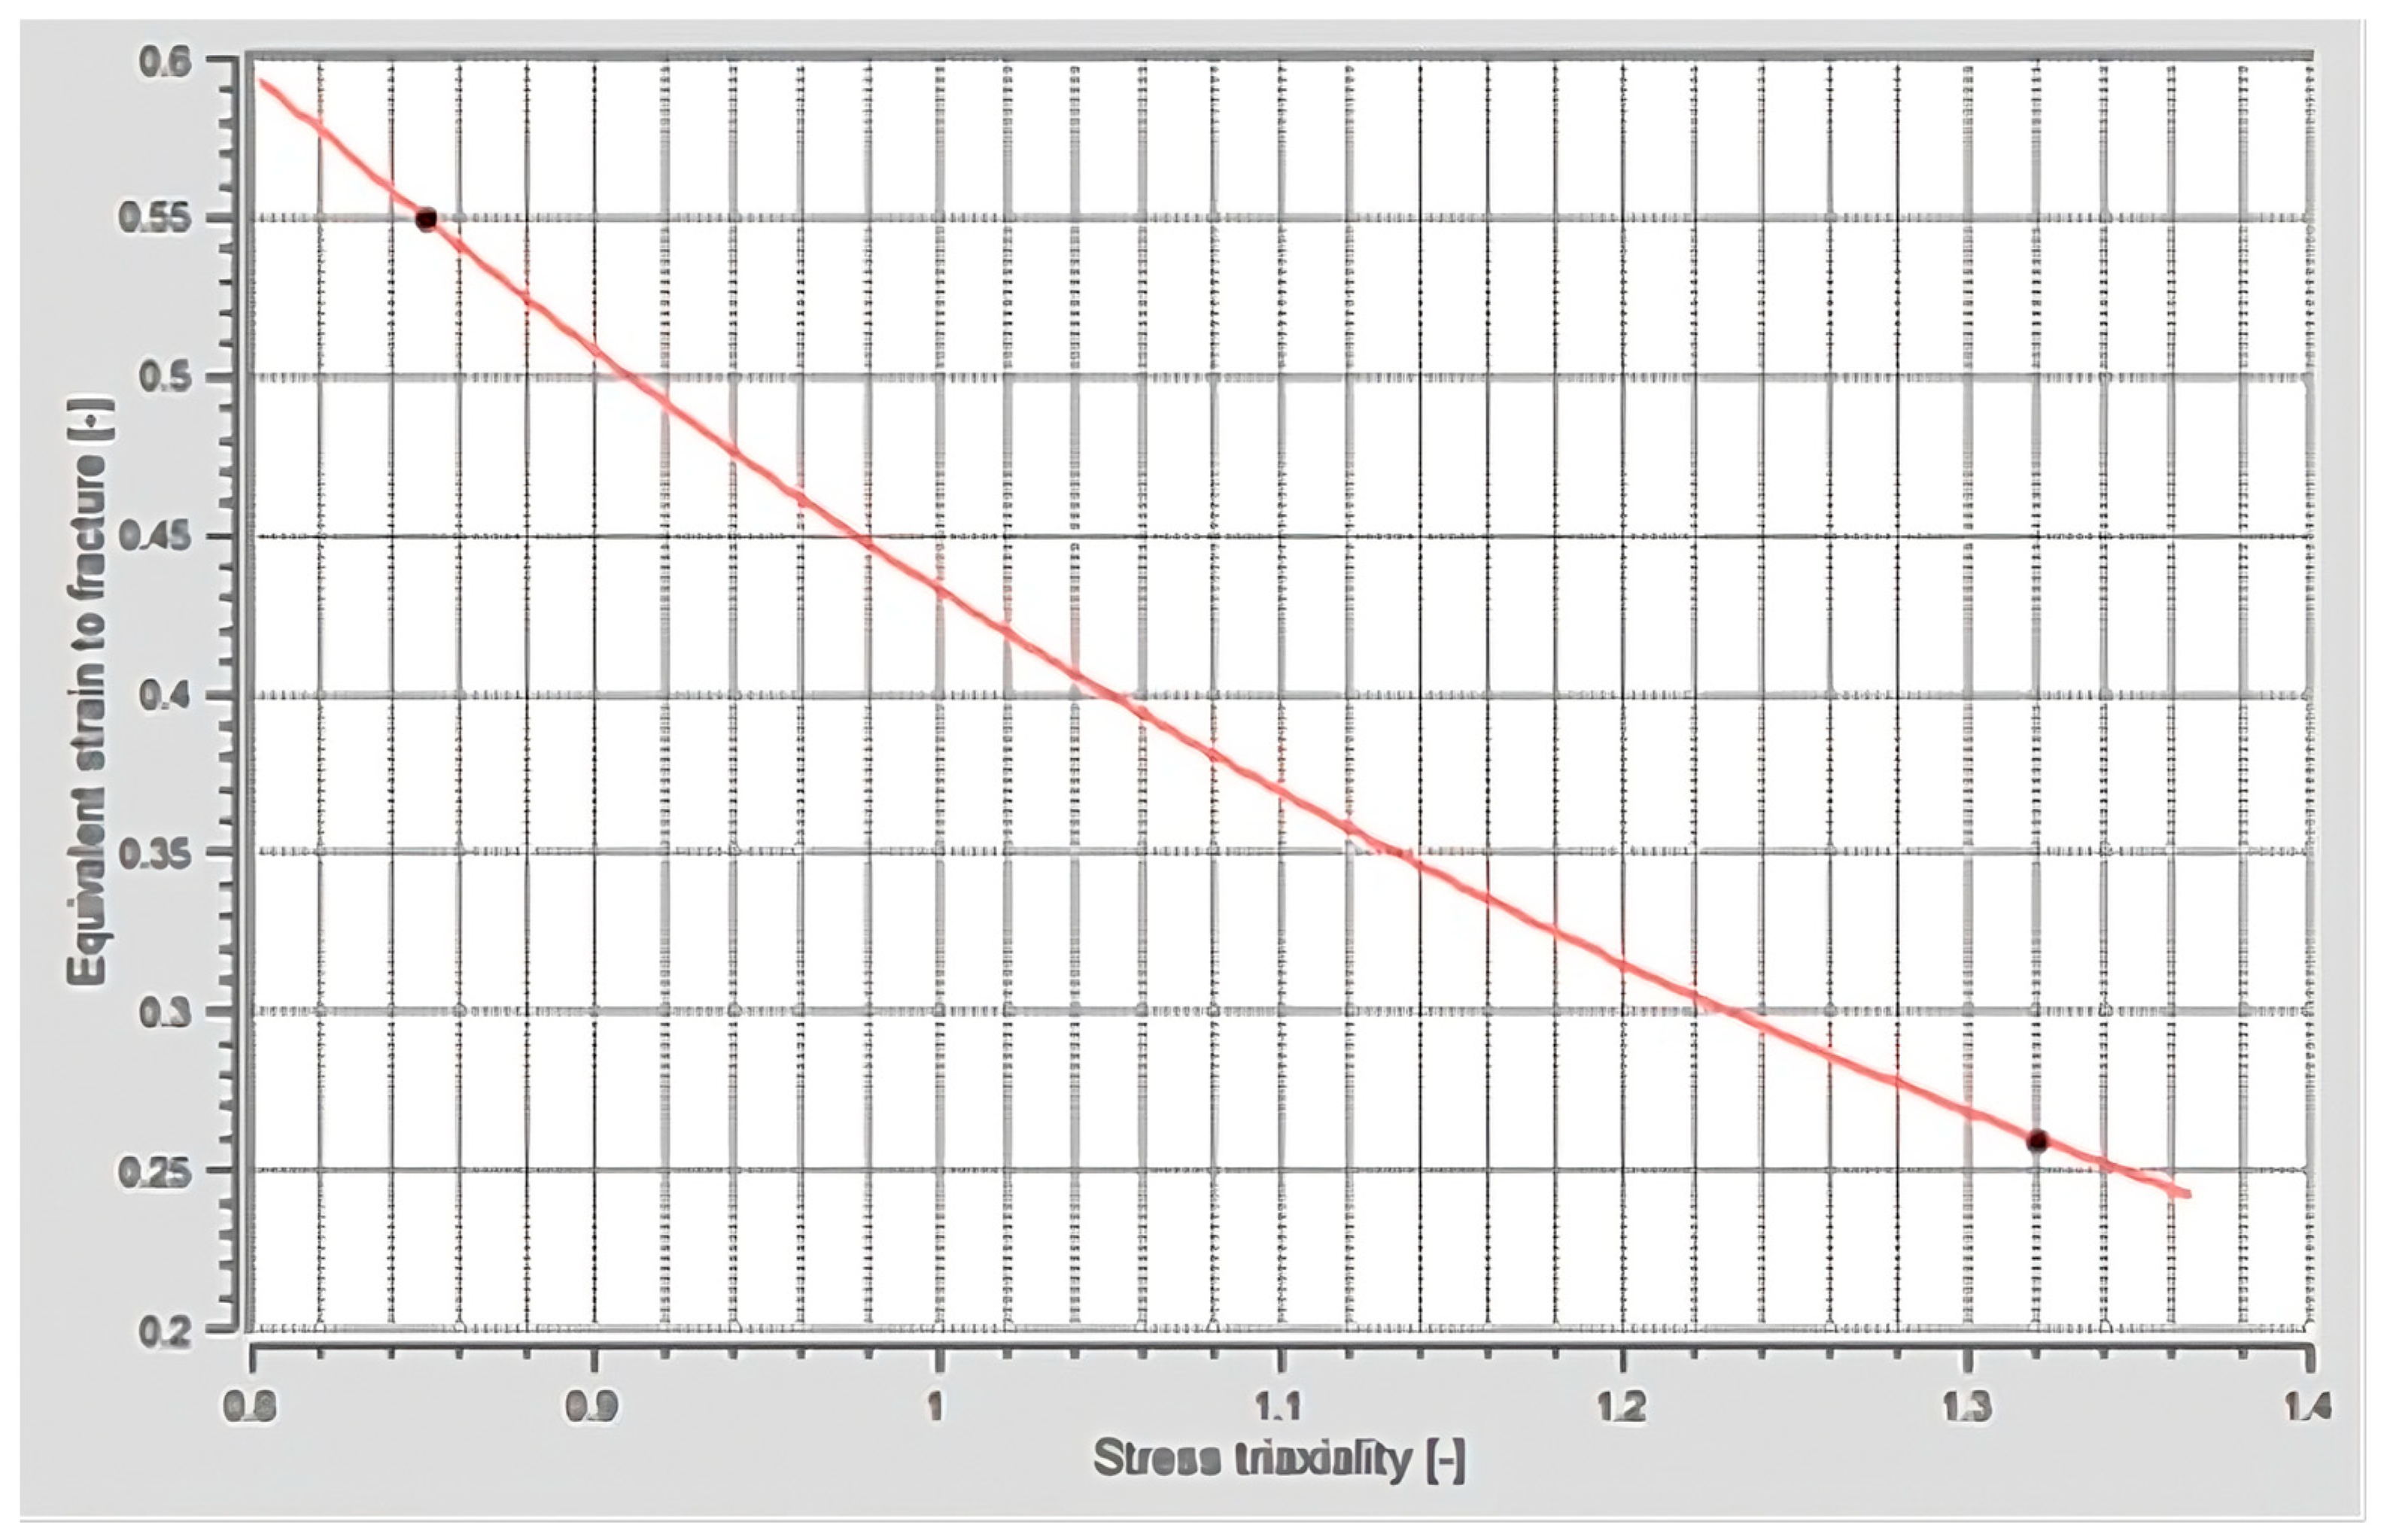
3.2. Damage Model
3.2.1. Geometry and Meshing
3.2.2. Definition of the Damage Model
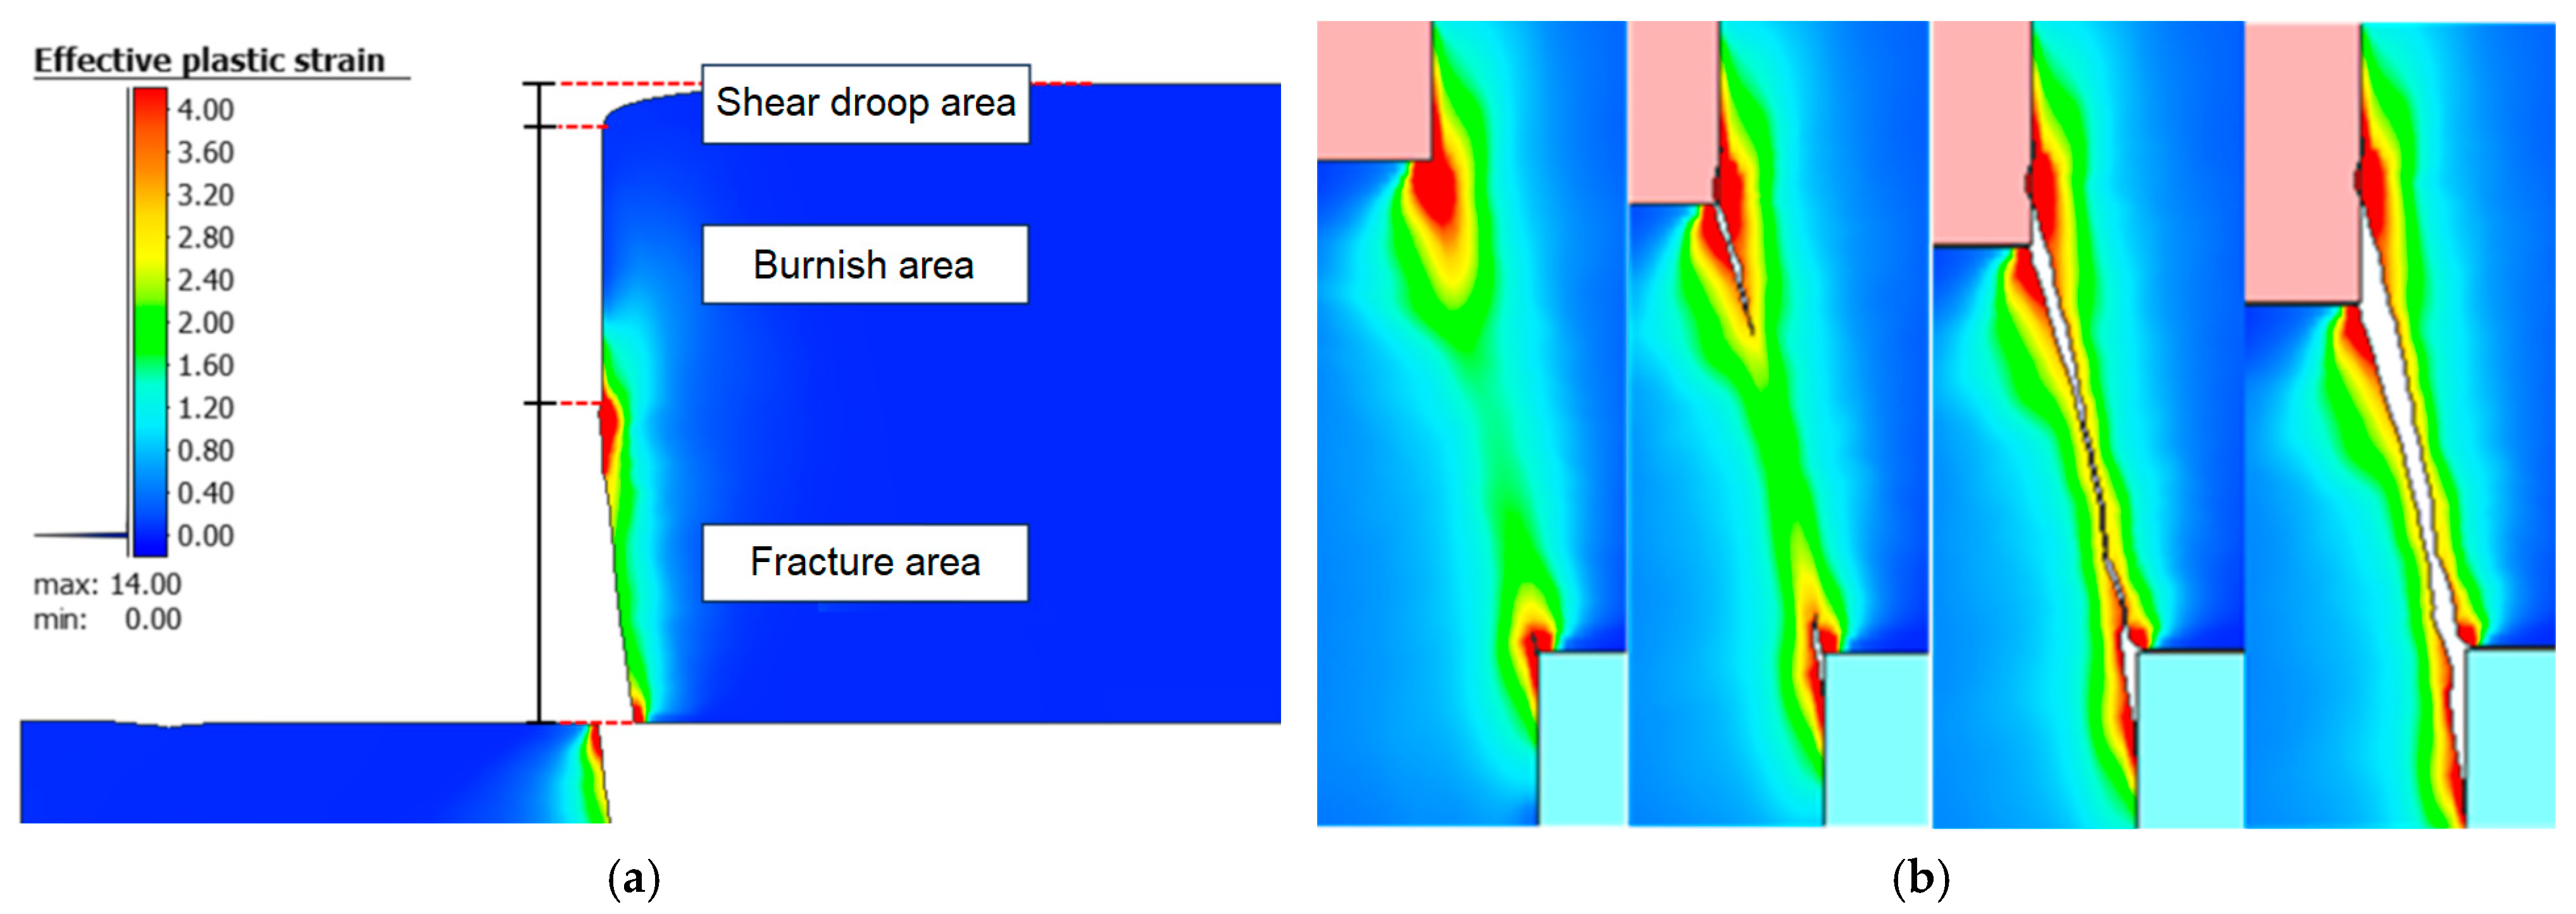
3.2.3. Damage
3.2.4. Simulation: Mesh Spacing Criteria
4. Results
4.1. Experimental Results
4.2. FEM
4.3. Comparison of Results
5. Discussion
- −
- The Johnson–Cook model was defined using the equivalent strain and triaxiality values obtained from the tensile tests performed for the three different sample geometries.
- −
- The results for the damage and fracture obtained from the mesh spacing criteria simulation in the tension tests were very similar to those obtained in the real tests.
- −
- Particularly relevant was to check the differences between the rupture zones in the shear samples for the different materials. It was observed how, with different materials, these zones varied both in the experimental tests and in the simulations. Furthermore, the critical rupture zone and the geometric deformation of the specimens could be predicted.
- −
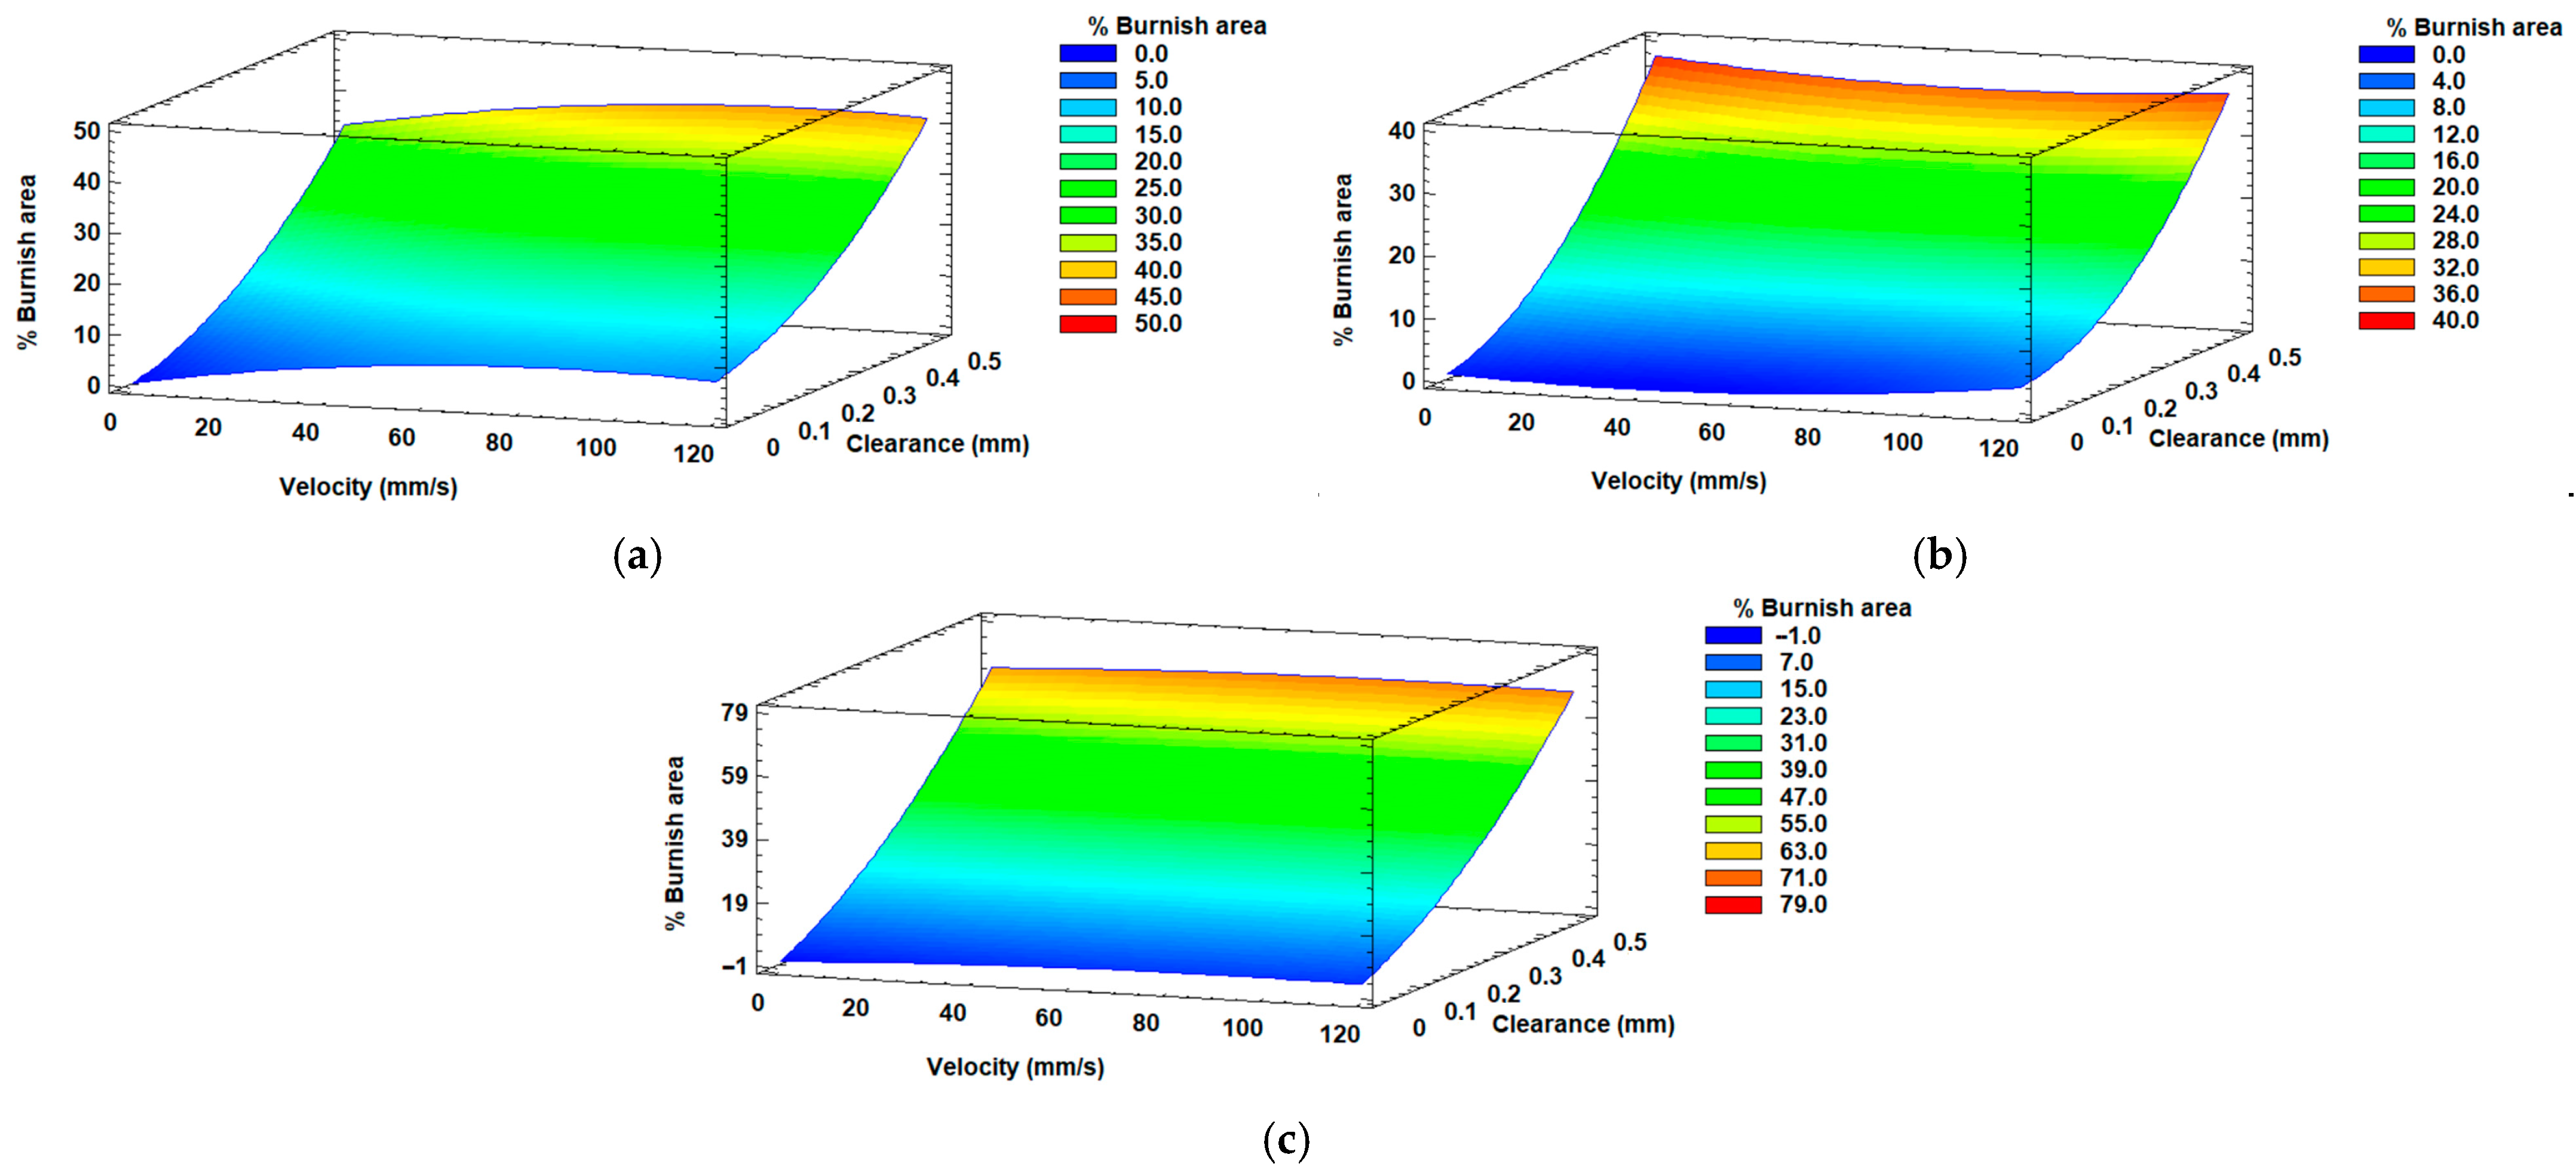
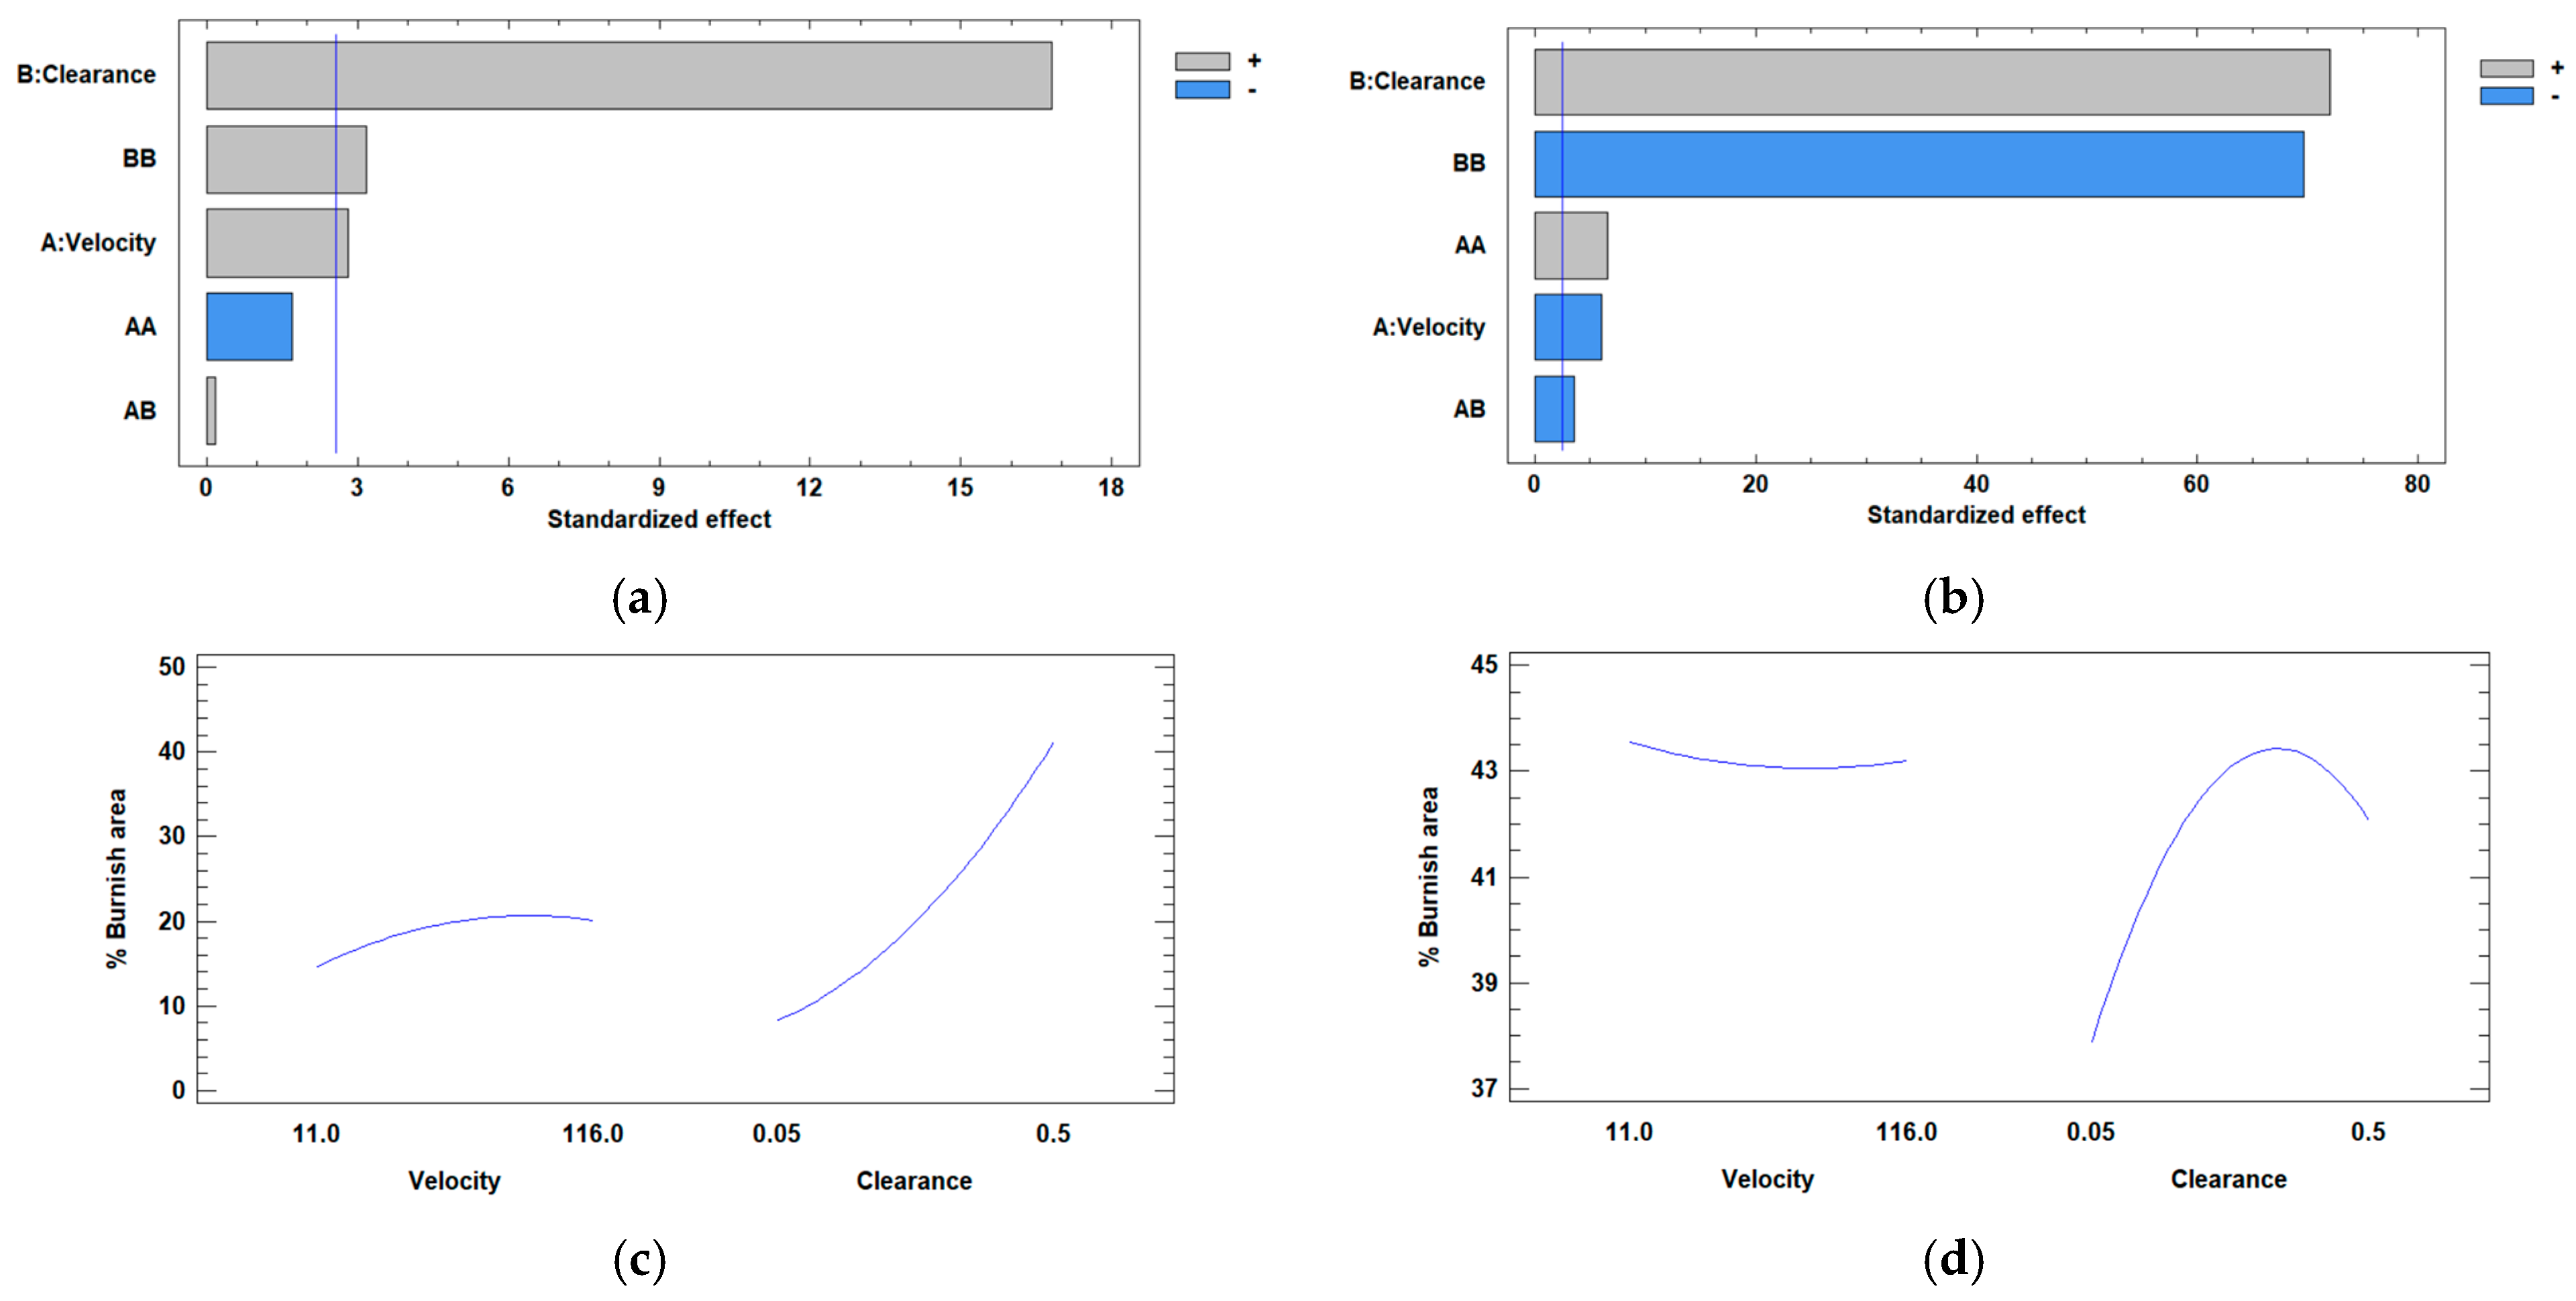
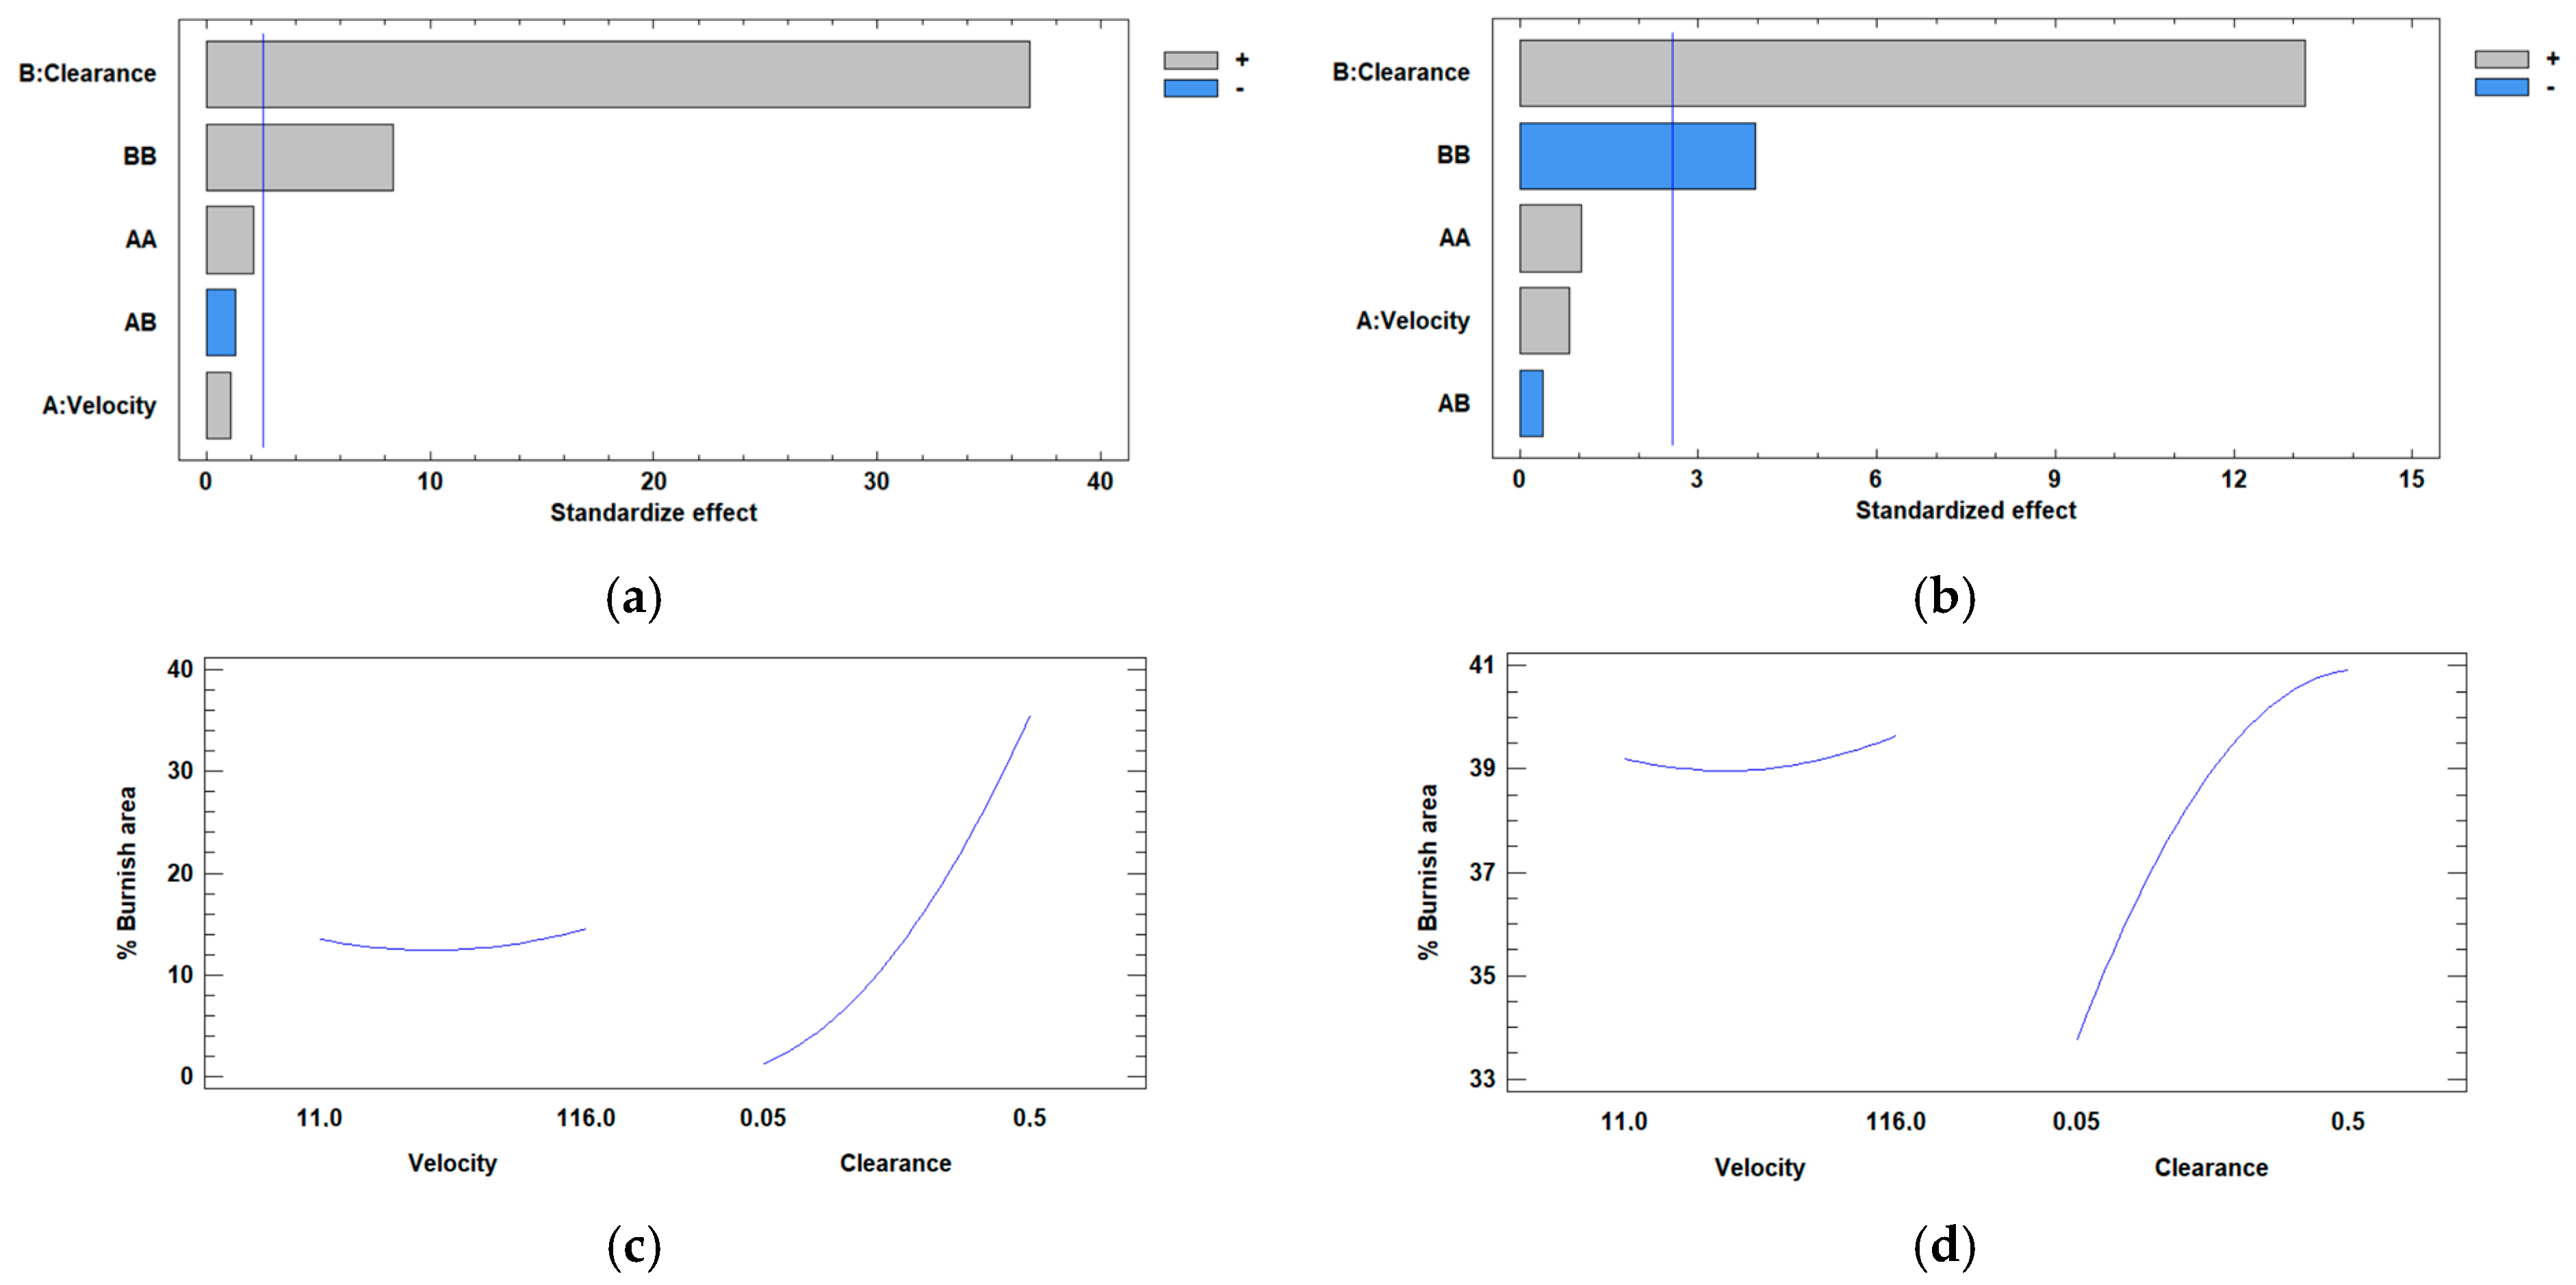
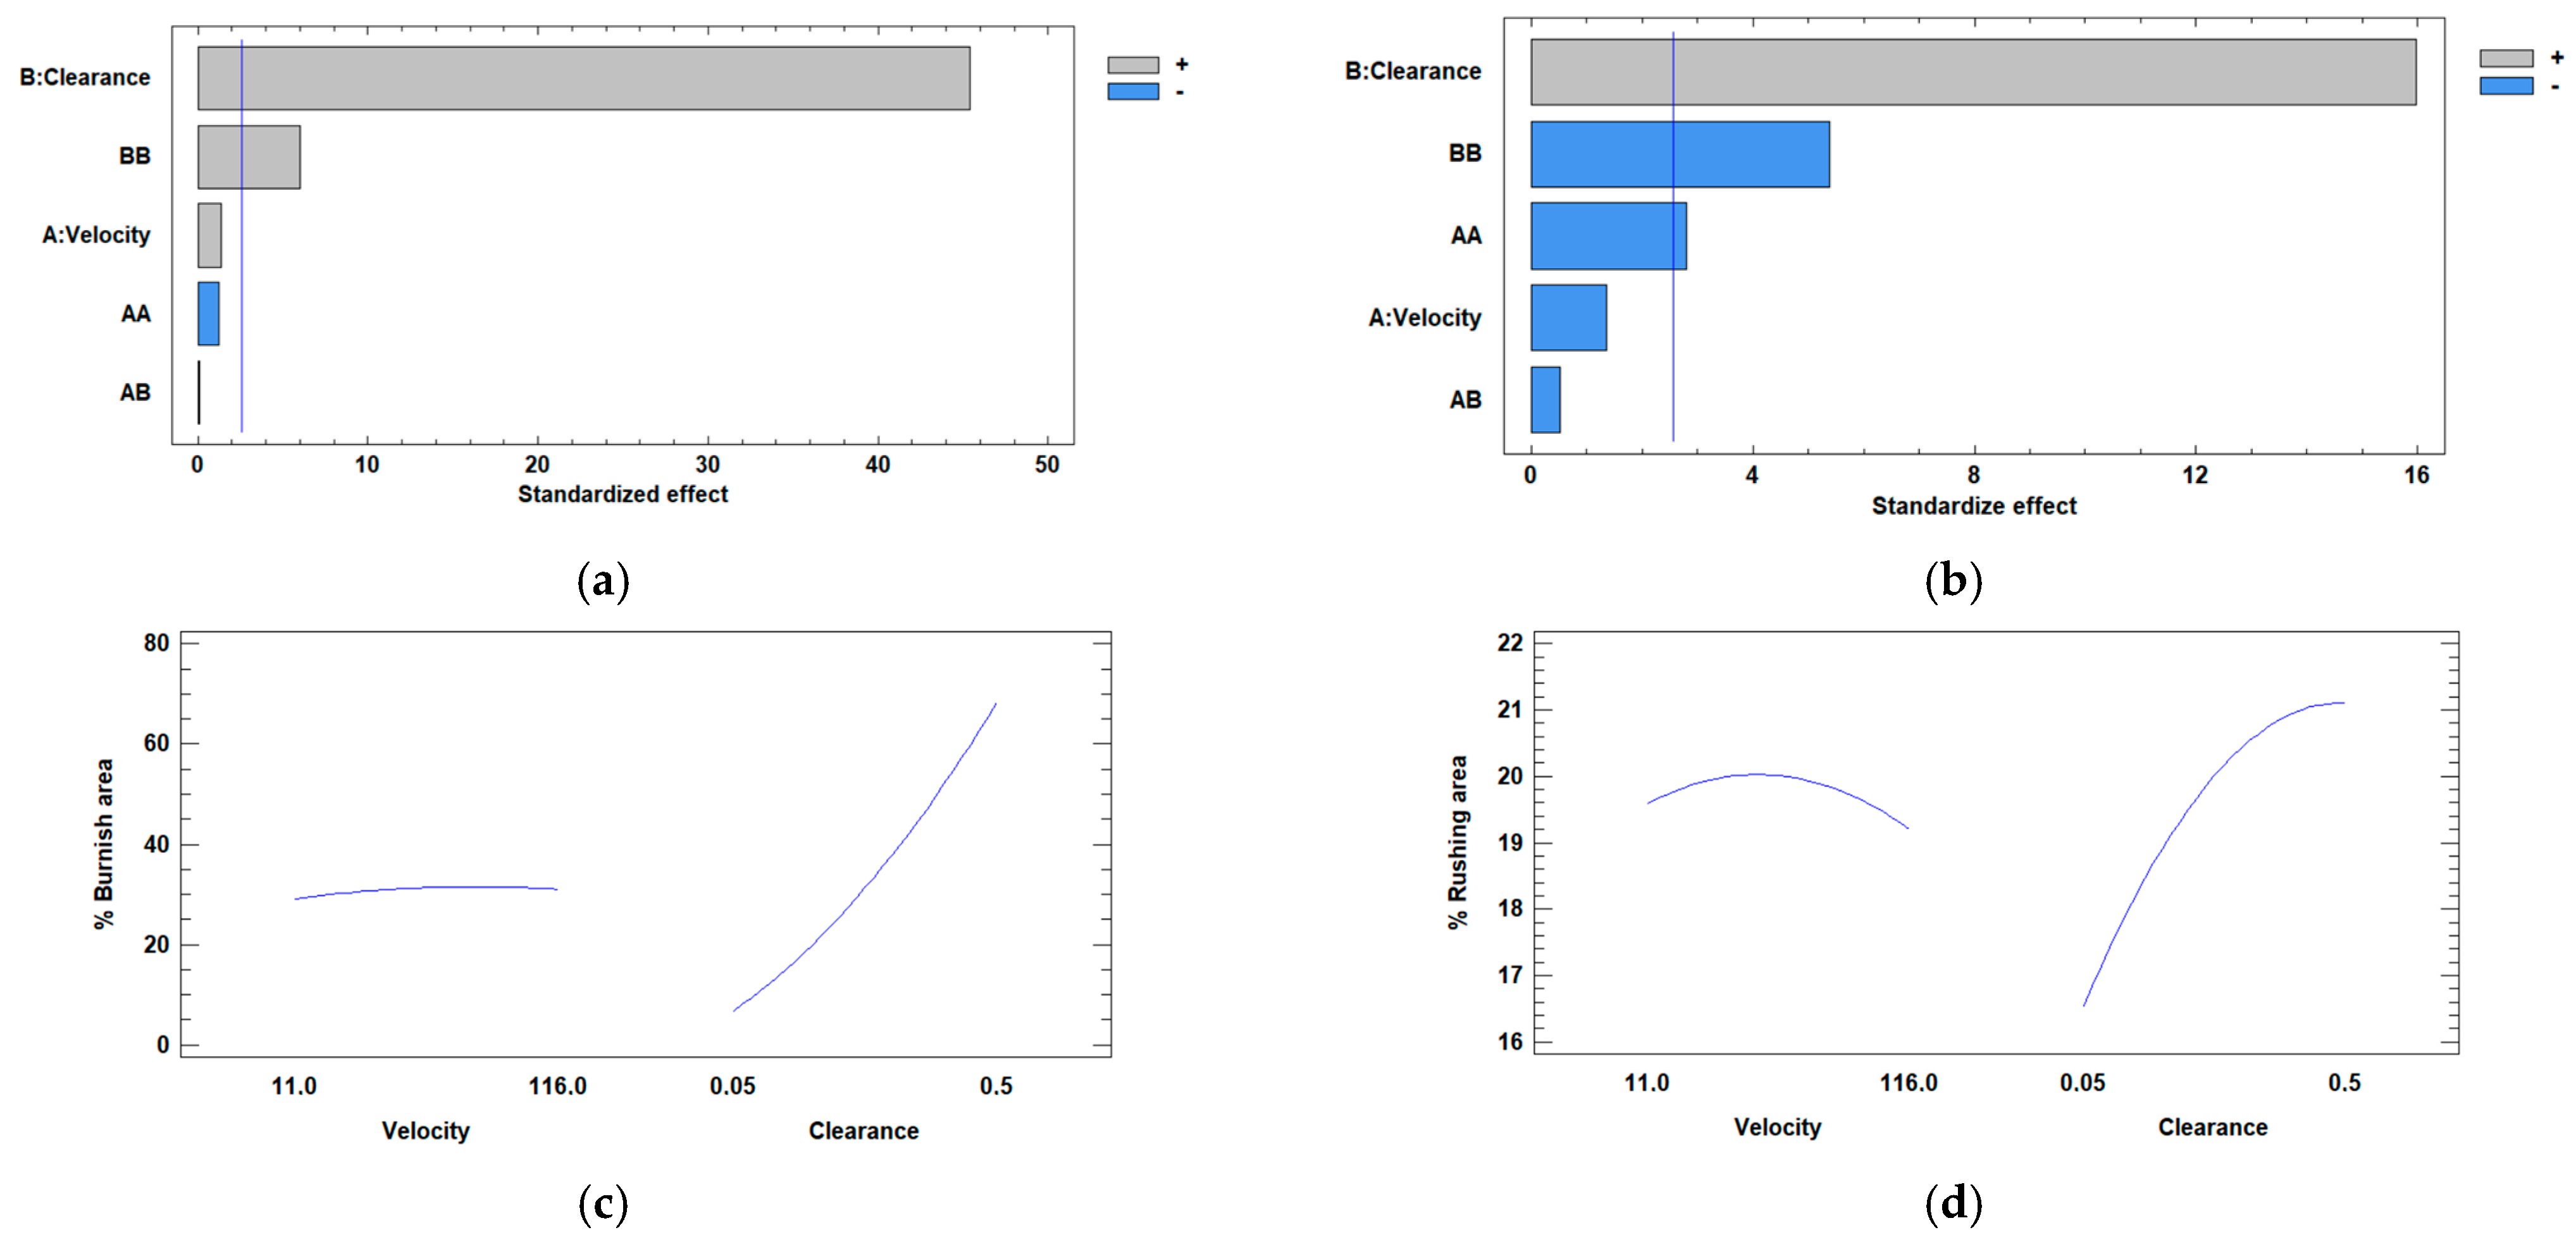
- The influence of processing speed is much less significant than that of clearance within the studied intervals.
- −
- The differences observed in the comparisons show that it is necessary to adjust the simulations as much as possible to the real process. In real processes, many factors are in play, resulting in discrepancies with the theoretical models. Therefore, it is crucial to try to take into account all the variables and possible factors involved in the processes.
- −
- The minimum percentage of burnish area was observed for the minimum values of clearance in all the cases.
- −
- The variation in the burnish area as a function of clearance is much higher in the experimental cases than in the simulations.
6. Conclusions
- Some simulations performed in this study showed that the percentage of burnish area increases as the clearance between the die and the punch decreases, while others showed a trend completely opposite to what was expected.
- The lowest percentage of fracture area was observed with the minimum clearance value.
- According to the literature, the more ductile the material, the higher the percentage of burnish area. In this case, steel 2 was the most ductile of all, followed by steel 1, while steel 3 was the most brittle. Observing the burnish area percentage results, values of around 20% were obtained for steel 3 and values of about 40% were obtained for steels 1 and 2.
- The results for the damage and fracture obtained from the simulations in the tension tests were very similar to those obtained in the real tests.
- With different materials, the rupture zones in the shear samples varied both in the experimental tests and in the simulations. Furthermore, the critical rupture zone and the geometric deformation of the specimens could be predicted.
- The clearance has more influence than the processing speed, and the minimum burnish area percentage was observed for the minimum values of clearance for all the cases.
- In the experimental case, a greater variation in the burnish area as a function of clearance was observed than in the simulation.
Author Contributions
Funding
Data Availability Statement
Conflicts of Interest
References
- Badgujar, T.Y.; Wani, V.P. Stamping Process Parameter Optimization with Multiple Regression Analysis Approach. Mater. Today Proc. 2018, 5, 4498–4507. [Google Scholar] [CrossRef]
- Paetzold, I.; Feistle, M.; Golle, R.; Volk, W.; Frehn, A.; Ilskens, R. Determination of the Minimum Possible Damage Due to Shear Cutting Using a Multi-Stage Shear Cutting Process. IOP Conf. Ser. Mater. Sci. Eng. 2018, 418, 012070. [Google Scholar] [CrossRef]
- Maiti, S.K.; Ambekar, A.A.; Singh, U.P.; Date, P.P.; Narasimhan, K. Assessment of Influence of Some Process Parameters on Sheet Metal Blanking. J. Mater. Process. Technol. 2000, 102, 249–256. [Google Scholar] [CrossRef]
- Pätzold, I.; Stahl, J.; Golle, R.; Volk, W. Reducing the Shear Affected Zone to Improve the Edge Formability Using a Two-Stage Shear Cutting Simulation. J. Mater. Process. Technol. 2023, 313, 117872. [Google Scholar] [CrossRef]
- Xie, Y.; Feng, K.; Du, M.; Wang, Y.; Li, L. Robust Optimization of Stamping Process Based on Bayesian Estimation. J. Manuf. Process. 2023, 101, 245–258. [Google Scholar] [CrossRef]
- Mitsomwang, P.; Nagasawa, S. Effects of Shearing Parameters on Cutting Characteristics of Polycarbonate Sheet Subjected to Straight Punch/Die Shearing. J. Mater. Process. Technol. 2015, 220, 46–57. [Google Scholar] [CrossRef]
- Cabrera, V.H.; Quillupangui, W.; Juiña, L.; Valdez, M. Cutting Parameters in Dies for Sheet Metal through Inclined, Concave, and Convex Shapes in Round Punches. Mater. Today Proc. 2022, 49, 28–34. [Google Scholar] [CrossRef]
- Hambli, R.; Reszka, M. Fracture Criteria Identification Using an Inverse Technique Method and Blanking Experiment. Int. J. Mech. Sci. 2002, 44, 1349–1361. [Google Scholar] [CrossRef]
- Nishad, R.; Totre, A.; Bodke, S.; Chauhan, A. An Overview of the Methodologies Used in the Optimization Processes in Sheet Metal Blanking. Int. J. Mech. Eng. Robotic Res. 2013, 2, 307–314. Available online: https://www.ijmerr.com/show-117-93-1.html (accessed on 1 March 2024).
- Hambli, R.; Richir, S.; Crubleau, P.; Taravel, B. Prediction of Optimum Clearance in Sheet Metal Blanking Processes. Int. J. Adv. Manuf. Technol. 2003, 22, 20–25. [Google Scholar] [CrossRef]
- Gustafsson, E.; Oldenburg, M.; Jansson, A. Experimental Study on the Effects of Clearance and Clamping in Steel Sheet Metal Shearing. J. Mater. Process. Technol. 2016, 229, 172–180. [Google Scholar] [CrossRef]
- Boljanovic, V. Sheet Metal Forming Processes and Die Design, Angewandte Chemie International ed.; Industrial Press: New York, NY, USA, 2004; Volume 6, pp. 951–952. [Google Scholar]
- Nasheralahkami, S.; Golovashchenko, S.; Pan, K.; Brown, L.; Gugnani, B. Characterization of Trimmed Edge of Advanced High Strength Steel. In SAE Technical Papers; SAE International: Warrendale, PA, USA, 2016. [Google Scholar] [CrossRef]
- Optimization of Blanking Processes Using Neural Network Simulation. Available online: https://www.researchgate.net/publication/270749492_Optimization_of_blanking_processes_using_neural_network_simulation (accessed on 1 March 2024).
- Hambli, R. Design of Experiment Based Analysis for Sheet Metal Blanking Processes Optimisation. Int. J. Adv. Manuf. Technol. 2002, 19, 403–410. [Google Scholar] [CrossRef]
- Tavares, A.F.; Lopes, A.P.O.; Mesquita, E.A.; Almeida, D.T.; Souza, J.H.C.; Costa, H.L. Effect of Transfer Layers on Friction and Wear Mechanisms in Strip Drawing Tests of Commercially Coated Forming Tools. Wear 2021, 476, 203733. [Google Scholar] [CrossRef]
- Liang, H.; Yang, X.; Yue, C.; Zhao, G.; Zhang, J.; Wang, Y. A Comparative Friction and Wear Study of Diamond and Diamond-like Carbon Films against Cu. Tribol. Int. 2024, 193, 109344. [Google Scholar] [CrossRef]
- Klocke, F.; Sweeney, K.; Raedt, H.W. Improved Tool Design for Fine Blanking through the Application of Numerical Modeling Techniques. J. Mater. Process. Technol. 2001, 115, 70–75. [Google Scholar] [CrossRef]
- Amaral, R.; Teixeira, P.; Azinpour, E.; Santos, A.D.; Cesar De Sa, J. Evaluation of Ductile Failure Models in Sheet Metal Forming. MATEC Web Conf. 2016, 80, 03004. [Google Scholar] [CrossRef]
- Li, X.Y.; Zhang, Z.H.; Cheng, X.W.; Liu, X.P.; Zhang, S.Z.; He, J.Y.; Wang, Q.; Liu, L.J. The Investigation on Johnson-Cook Model and Dynamic Mechanical Behaviors of Ultra-High Strength Steel M54. Mater. Sci. Eng. A 2022, 835, 142693. [Google Scholar] [CrossRef]
- UNE-EN ISO 6892-1:2020; Metallic Materials—Tensile Testing—Part 1: Method of Test at Room Temperature (ISO 6892-1:2019). UNE Normalización Española: Madrid, Spain, 2020.
- ASTM B831; Standard Test Method for Shear Testing of Thin Aluminum Alloy Products. ASTM International: West Conshohocken, PA, USA, 2023.
- Jansen, J. Ein Werkstoffmodell Für Eine Aluminium-Druckgusslegierung Unter Statischen Und Dynamischen Beanspruchungen. University Thesis, Fraunhofer-IRB-Verl, Stuttgart, Germany, 2007. Available online: https://d-nb.info/98552524X (accessed on 16 May 2024).
- Khare, S.; Kumar, K.; Choudhary, S.; Singh, P.K.; Verma, R.K.; Mahajan, P. Determination of Johnson–Cook Material Parameters for Armour Plate Using DIC and FEM. Met. Mater. Int. 2021, 27, 4984–4995. [Google Scholar] [CrossRef]
- Tekkaya, A.E.; Bouchard, P.O.; Bruschi, S.; Tasan, C.C. Damage in Metal Forming. CIRP Ann. 2020, 69, 600–623. [Google Scholar] [CrossRef]
- Barba, E.; Salcedo, D.; Claver, A.; Luri, R.; Garcia, J.A.; Barba, E.; Salcedo, D.; Claver, A.; Luri, R.; Garcia, J.A. Influence of Friction Coefficient on the Performance of Cold Forming Tools. Metals 2023, 13, 960. [Google Scholar] [CrossRef]
- Soares, J.A.; Gipiela, M.L.; Lajarin, S.F.; Marcondes, P.V.P. Study of the Punch-Die Clearance Influence on the Sheared Edge Quality of Thick Sheets. Int. J. Adv. Manuf. Technol. 2013, 65, 451–457. [Google Scholar] [CrossRef]
- Mahmudah, A.; Kiswanto, G.; Priadi, D. Analysis of Shear Edge Quality for Different Punch Velocities in Micro-Blanking Process. Int. J. Mech. Eng. Robot. Res. 2017, 6, 279–284. [Google Scholar] [CrossRef]
- Mitsomwang, P.; Nagasawa, S. Effect of Mechanical Conditions on Cutting Characteristics of Polycarbonate Sheet Subjected to Straight Punch/Die Shearing. Procedia Eng. 2014, 81, 1145–1150. [Google Scholar]
- Hexagon, A.B. Simufact Forming 2022.1 Application. Examples of All Applications. Available online: https://hexagon.com/products/simufact-forming (accessed on 16 May 2024).
- Banerjee, A.; Dhar, S.; Acharyya, S.; Datta, D.; Nayak, N. Determination of Johnson cook material and failure model constants and numerical modelling of Charpy impact test of armour steel. Mater. Sci. Eng. A 2015, 640, 200–209. [Google Scholar] [CrossRef]


| Structural Steel | %C | %Mn | %Si | %P | %S | %Al | %Ni | %Cr |
|---|---|---|---|---|---|---|---|---|
| Steel 1 | 0.106 | 0.500 | - | 0.011 | 0.014 | - | - | |
| Steel 2 | 0.066 | 0.319 | 0.009 | 0.016 | 0.014 | 0.052 | 0.011 | 0.029 |
| Steel 3 | 0.158 | 0.582 | 0.030 | 0.011 | 0.013 | 0.049 | 0.016 | - |
| Structural Steel | σy (MPa) | Rm (MPa) | e (%) |
|---|---|---|---|
| Steel 1 | 351 | 418 | 33.5 |
| Steel 2 | 302 | 392 | 39.0 |
| Steel 3 | 311 | 463 | 26.8 |
| Test | Punch Velocity (mm/s) | Clearance (mm) |
|---|---|---|
| 1 | 63.5 | 0.275 |
| 2 | 63.5 | 0.275 |
| 3 | 63.5 | 0.275 |
| 4 | 11.0 | 0.275 |
| 5 | 116.0 | 0.050 |
| 6 | 116.0 | 0.500 |
| 7 | 116.0 | 0.275 |
| 8 | 11.0 | 0.050 |
| 9 | 63.5 | 0.500 |
| 10 | 11.0 | 0.500 |
| 11 | 63.5 | 0.050 |
| Structural Steel | n | ±Δn | K | ±ΔK |
|---|---|---|---|---|
| Steel 1 | 0.350 | 0.009 | 851.058 | 7.053 |
| Steel 2 | 0.363 | 0.007 | 846.882 | 9.308 |
| Steel 3 | 0.353 | 0.009 | 972.652 | 20.811 |
| Stroke (mm) | Steel 1 | Steel 2 | Steel 3 |
|---|---|---|---|
| Conventional tensile test | 24.4 ± 0.2 | 25.3 ± 0.7 | 21.3 ± 1.0 |
| Notched samples | 3.4 ± 1.2 | 4.4 ± 0.03 | 3.6 ± 0.3 |
| Shear samples | 8.3 ± 0.1 | 8.6 ± 0.3 | 4.8 ± 0.3 |
| Equivalent Strain | Triaxiality | |||||
|---|---|---|---|---|---|---|
| Sample | Tensile | Notched | Shear | Tensile | Notched | Shear |
| Steel 1 | 0.33 | 0.55 | 0.26 | 0.58 | 0.85 | 1.32 |
| Steel 2 | 0.33 | 0.57 | 0.33 | 0.58 | 0.85 | 1.30 |
| Steel 3 | 0.28 | 0.44 | 0.55 | 0.58 | 0.85 | 0.20 |
| Sample | D1 | D2 | D3 |
|---|---|---|---|
| Steel 1 | 0.005 | 2.154 | −1.618 |
| Steel 2 | 0.000 | 1.600 | −1.215 |
| Steel 3 | 0.000 | 0.598 | −0.343 |
| Steel 1 | Steel 2 | Steel 3 | |
|---|---|---|---|
| Damage | 0.143 | 0.170 | 0.335 |
| Steel 1 | Steel 2 | Steel 3 | ||
|---|---|---|---|---|
| Stroke conventional tensile test | Real test (mm) | 24.42 | 25.34 | 21.34 |
| Simulation (mm) | 32.80 | 34.61 | 29.50 | |
| Difference (%) | 34.34 | 36.59 | 38.25 | |
| Stroke notched samples | Real test (mm) | 4.26 | 4.43 | 3.57 |
| Simulation (mm) | 4.12 | 4.32 | 4.11 | |
| Difference (%) | −3.25 | −2.53 | 15.02 | |
| Stroke shear samples | Real test (mm) | 8.30 | 8.59 | 4.78 |
| Simulation (mm) | 10.40 | 9.42 | 4.91 | |
| Difference (%) | 25.33 | 9.00 | 2.88 |
| Test | Steel 1 | Steel 2 | Steel 3 |
|---|---|---|---|
| % Burnish Area | % Burnish Area | % Burnish Area | |
| 1 | 20.48 ± 11.96 | 12.14 ± 7.75 | 31.13 ± 6.04 |
| 2 | 20.48 ± 11.96 | 12.14 ± 7.75 | 31.13 ± 6.04 |
| 3 | 20.48 ± 11.96 | 12.14 ± 7.75 | 31.13 ± 6.04 |
| 4 | 15.06 ± 13.57 | 12.92 ± 11.67 | 27.50 ± 3.26 |
| 5 | 10.54 ± 4.65 | 2.92 ± 0.10 | 5.89 ± 2.19 |
| 6 | 41.31 ± 20.47 | 36.55 ± 13.89 | 66.37 ± 3.93 |
| 7 | 18.10 ± 11.33 | 16.01 ± 4.76 | 33.21 ± 8.14 |
| 8 | 4.23 ± 4.88 | 1.43 ± 0.54 | 5.77 ± 2.25 |
| 9 | 42.98 ± 6.08 | 35.30 ± 9.87 | 69.46 ± 8.17 |
| 10 | 34.11 ± 20.82 | 38.04 ± 1.88 | 66.55 ± 2.89 |
| 11 | 4.88 ± 4.69 | 2.56 ± 0.90 | 6.25 ± 6.39 |
| Test | Steel 1 | Steel 2 | Steel 3 |
|---|---|---|---|
| % Burnish Area | % Burnish Area | % Burnish Area | |
| 1 | 43.075 | 38.687 | 19.978 |
| 2 | 43.075 | 38.687 | 19.978 |
| 3 | 43.075 | 38.687 | 19.978 |
| 4 | 43.493 | 40.175 | 19.742 |
| 5 | 38.068 | 34.515 | 16.073 |
| 6 | 42.054 | 41.530 | 20.015 |
| 7 | 43.260 | 39.593 | 19.138 |
| 8 | 38.219 | 33.291 | 16.167 |
| 9 | 41.995 | 41.239 | 21.584 |
| 10 | 42.722 | 40.830 | 20.481 |
| 11 | 37.960 | 34.369 | 16.157 |
Disclaimer/Publisher’s Note: The statements, opinions and data contained in all publications are solely those of the individual author(s) and contributor(s) and not of MDPI and/or the editor(s). MDPI and/or the editor(s) disclaim responsibility for any injury to people or property resulting from any ideas, methods, instructions or products referred to in the content. |
© 2024 by the authors. Licensee MDPI, Basel, Switzerland. This article is an open access article distributed under the terms and conditions of the Creative Commons Attribution (CC BY) license (https://creativecommons.org/licenses/by/4.0/).
Share and Cite
Claver, A.; Acosta, A.H.; Barba, E.; Fuertes, J.P.; Torres, A.; García, J.A.; Luri, R.; Salcedo, D. Study and Optimization of the Punching Process of Steel Using the Johnson–Cook Damage Model. Metals 2024, 14, 616. https://doi.org/10.3390/met14060616
Claver A, Acosta AH, Barba E, Fuertes JP, Torres A, García JA, Luri R, Salcedo D. Study and Optimization of the Punching Process of Steel Using the Johnson–Cook Damage Model. Metals. 2024; 14(6):616. https://doi.org/10.3390/met14060616
Chicago/Turabian StyleClaver, Adrián, Andrea Hernández Acosta, Eneko Barba, Juan P. Fuertes, Alexia Torres, José A. García, Rodrigo Luri, and Daniel Salcedo. 2024. "Study and Optimization of the Punching Process of Steel Using the Johnson–Cook Damage Model" Metals 14, no. 6: 616. https://doi.org/10.3390/met14060616
APA StyleClaver, A., Acosta, A. H., Barba, E., Fuertes, J. P., Torres, A., García, J. A., Luri, R., & Salcedo, D. (2024). Study and Optimization of the Punching Process of Steel Using the Johnson–Cook Damage Model. Metals, 14(6), 616. https://doi.org/10.3390/met14060616