
Microstructural Evolution and Mechanical Behavior of Pure Aluminum Ultra-Thin Strip under Roller Vibration
Abstract
:
1. Introduction
2. Experimental Procedures
2.1. Materials and Methods
2.2. Microstructural Characterization
2.3. Tensile Test
3. Results and Discussion
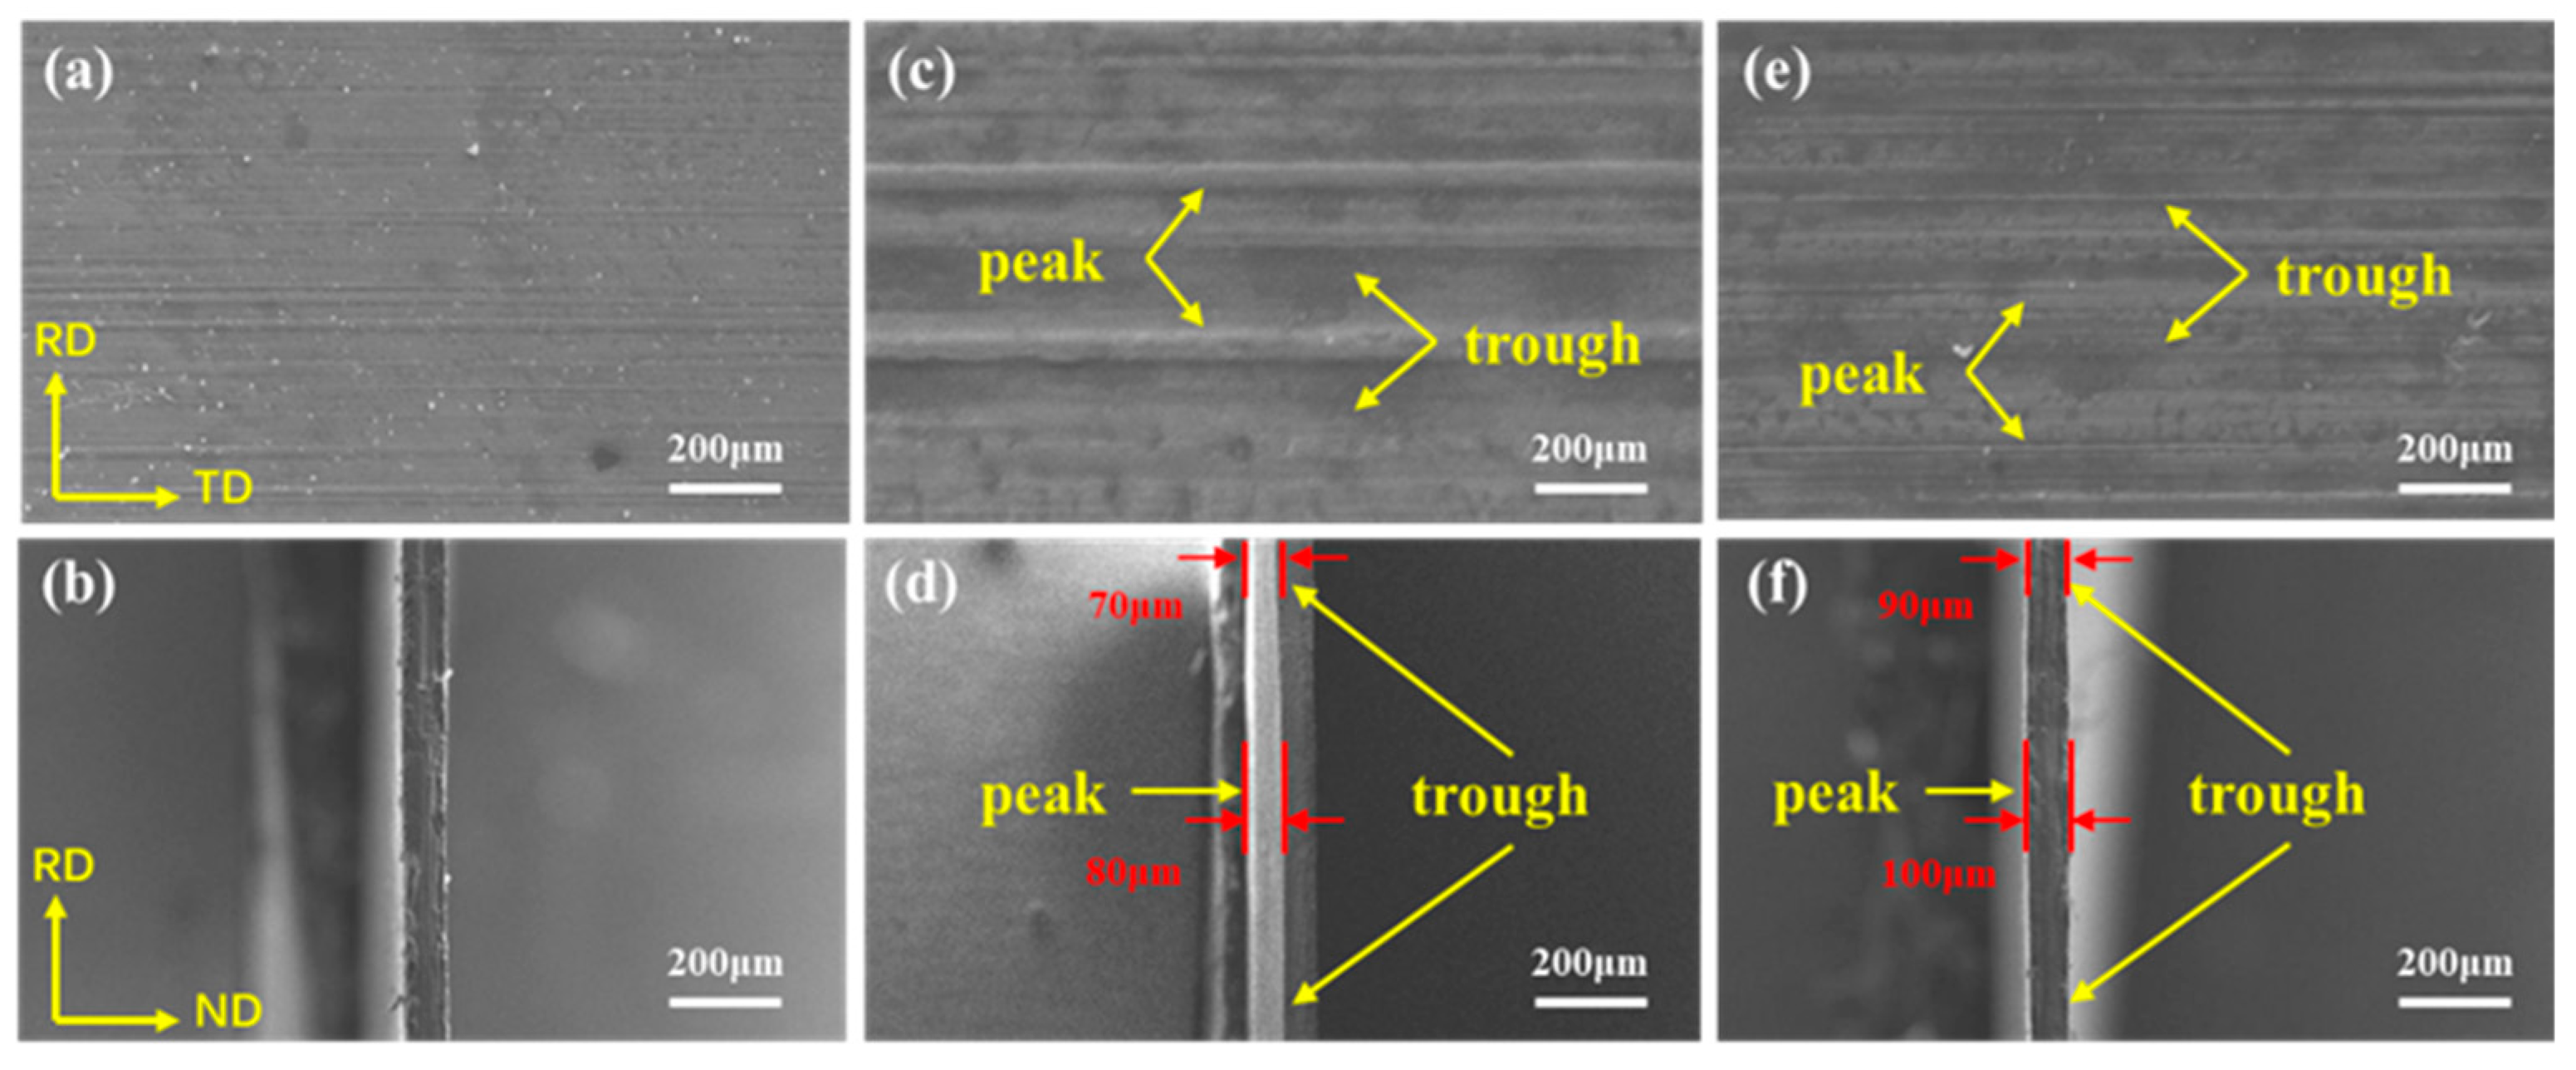
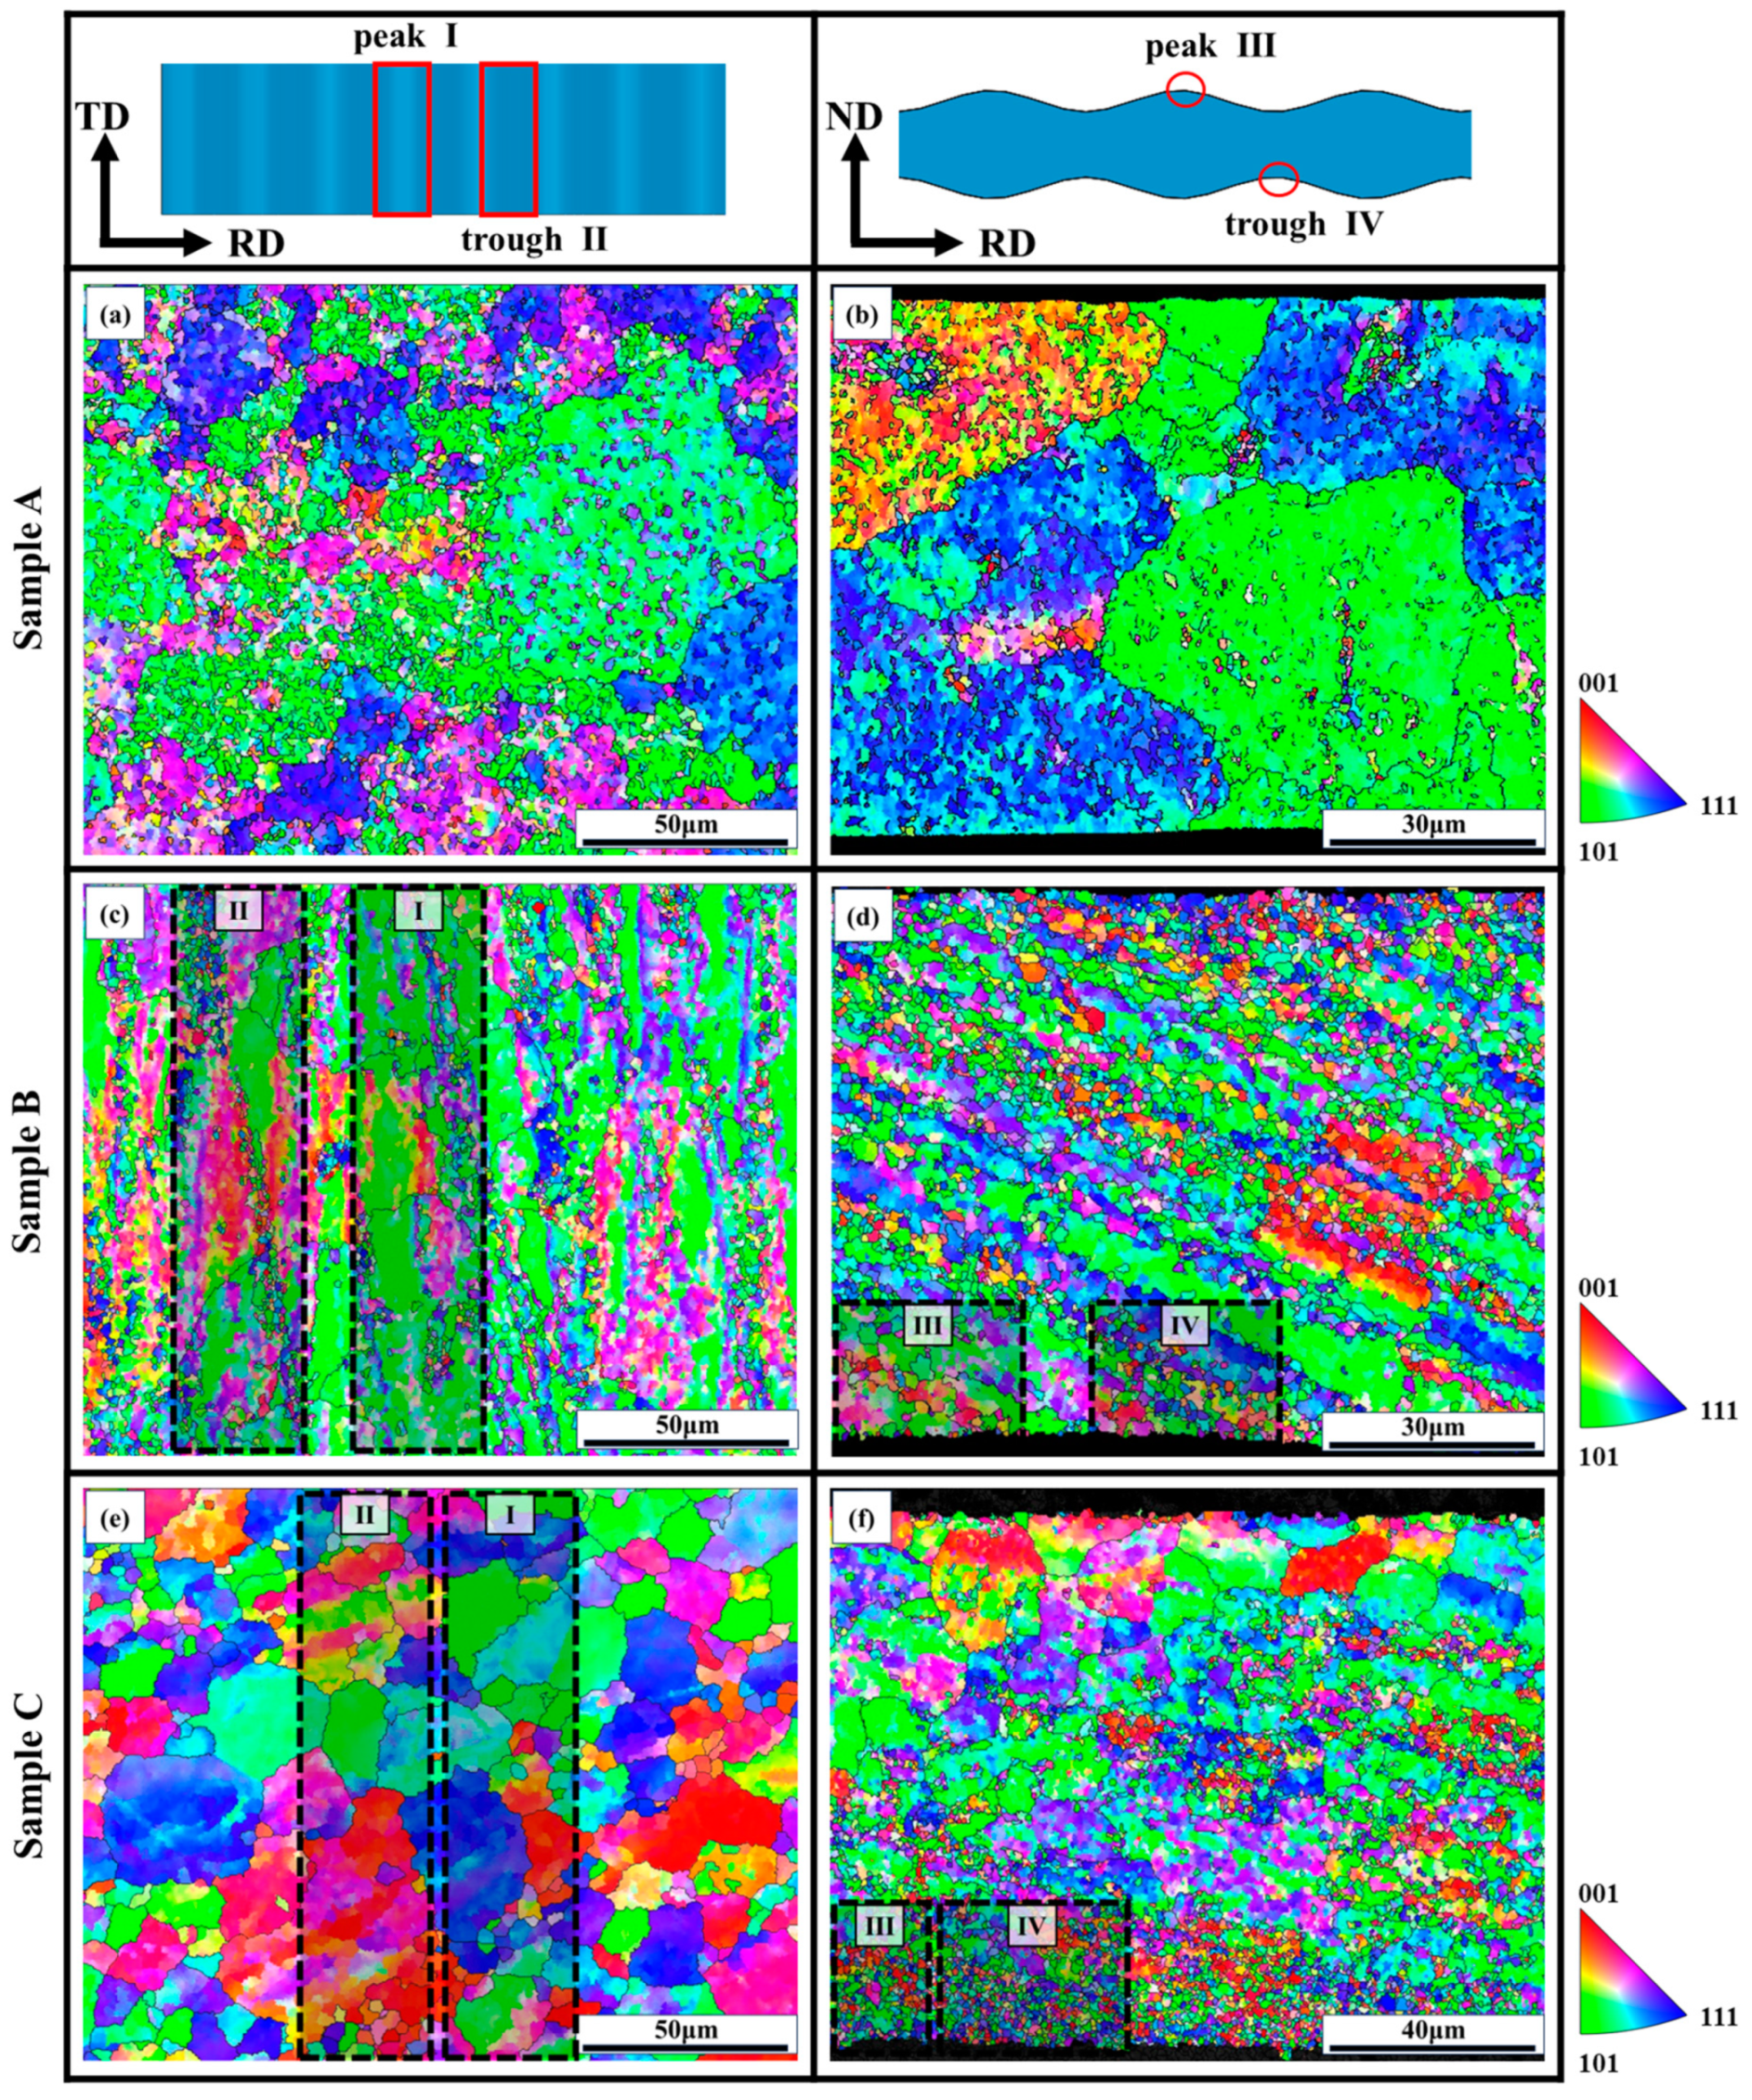
3.1. Microstructure
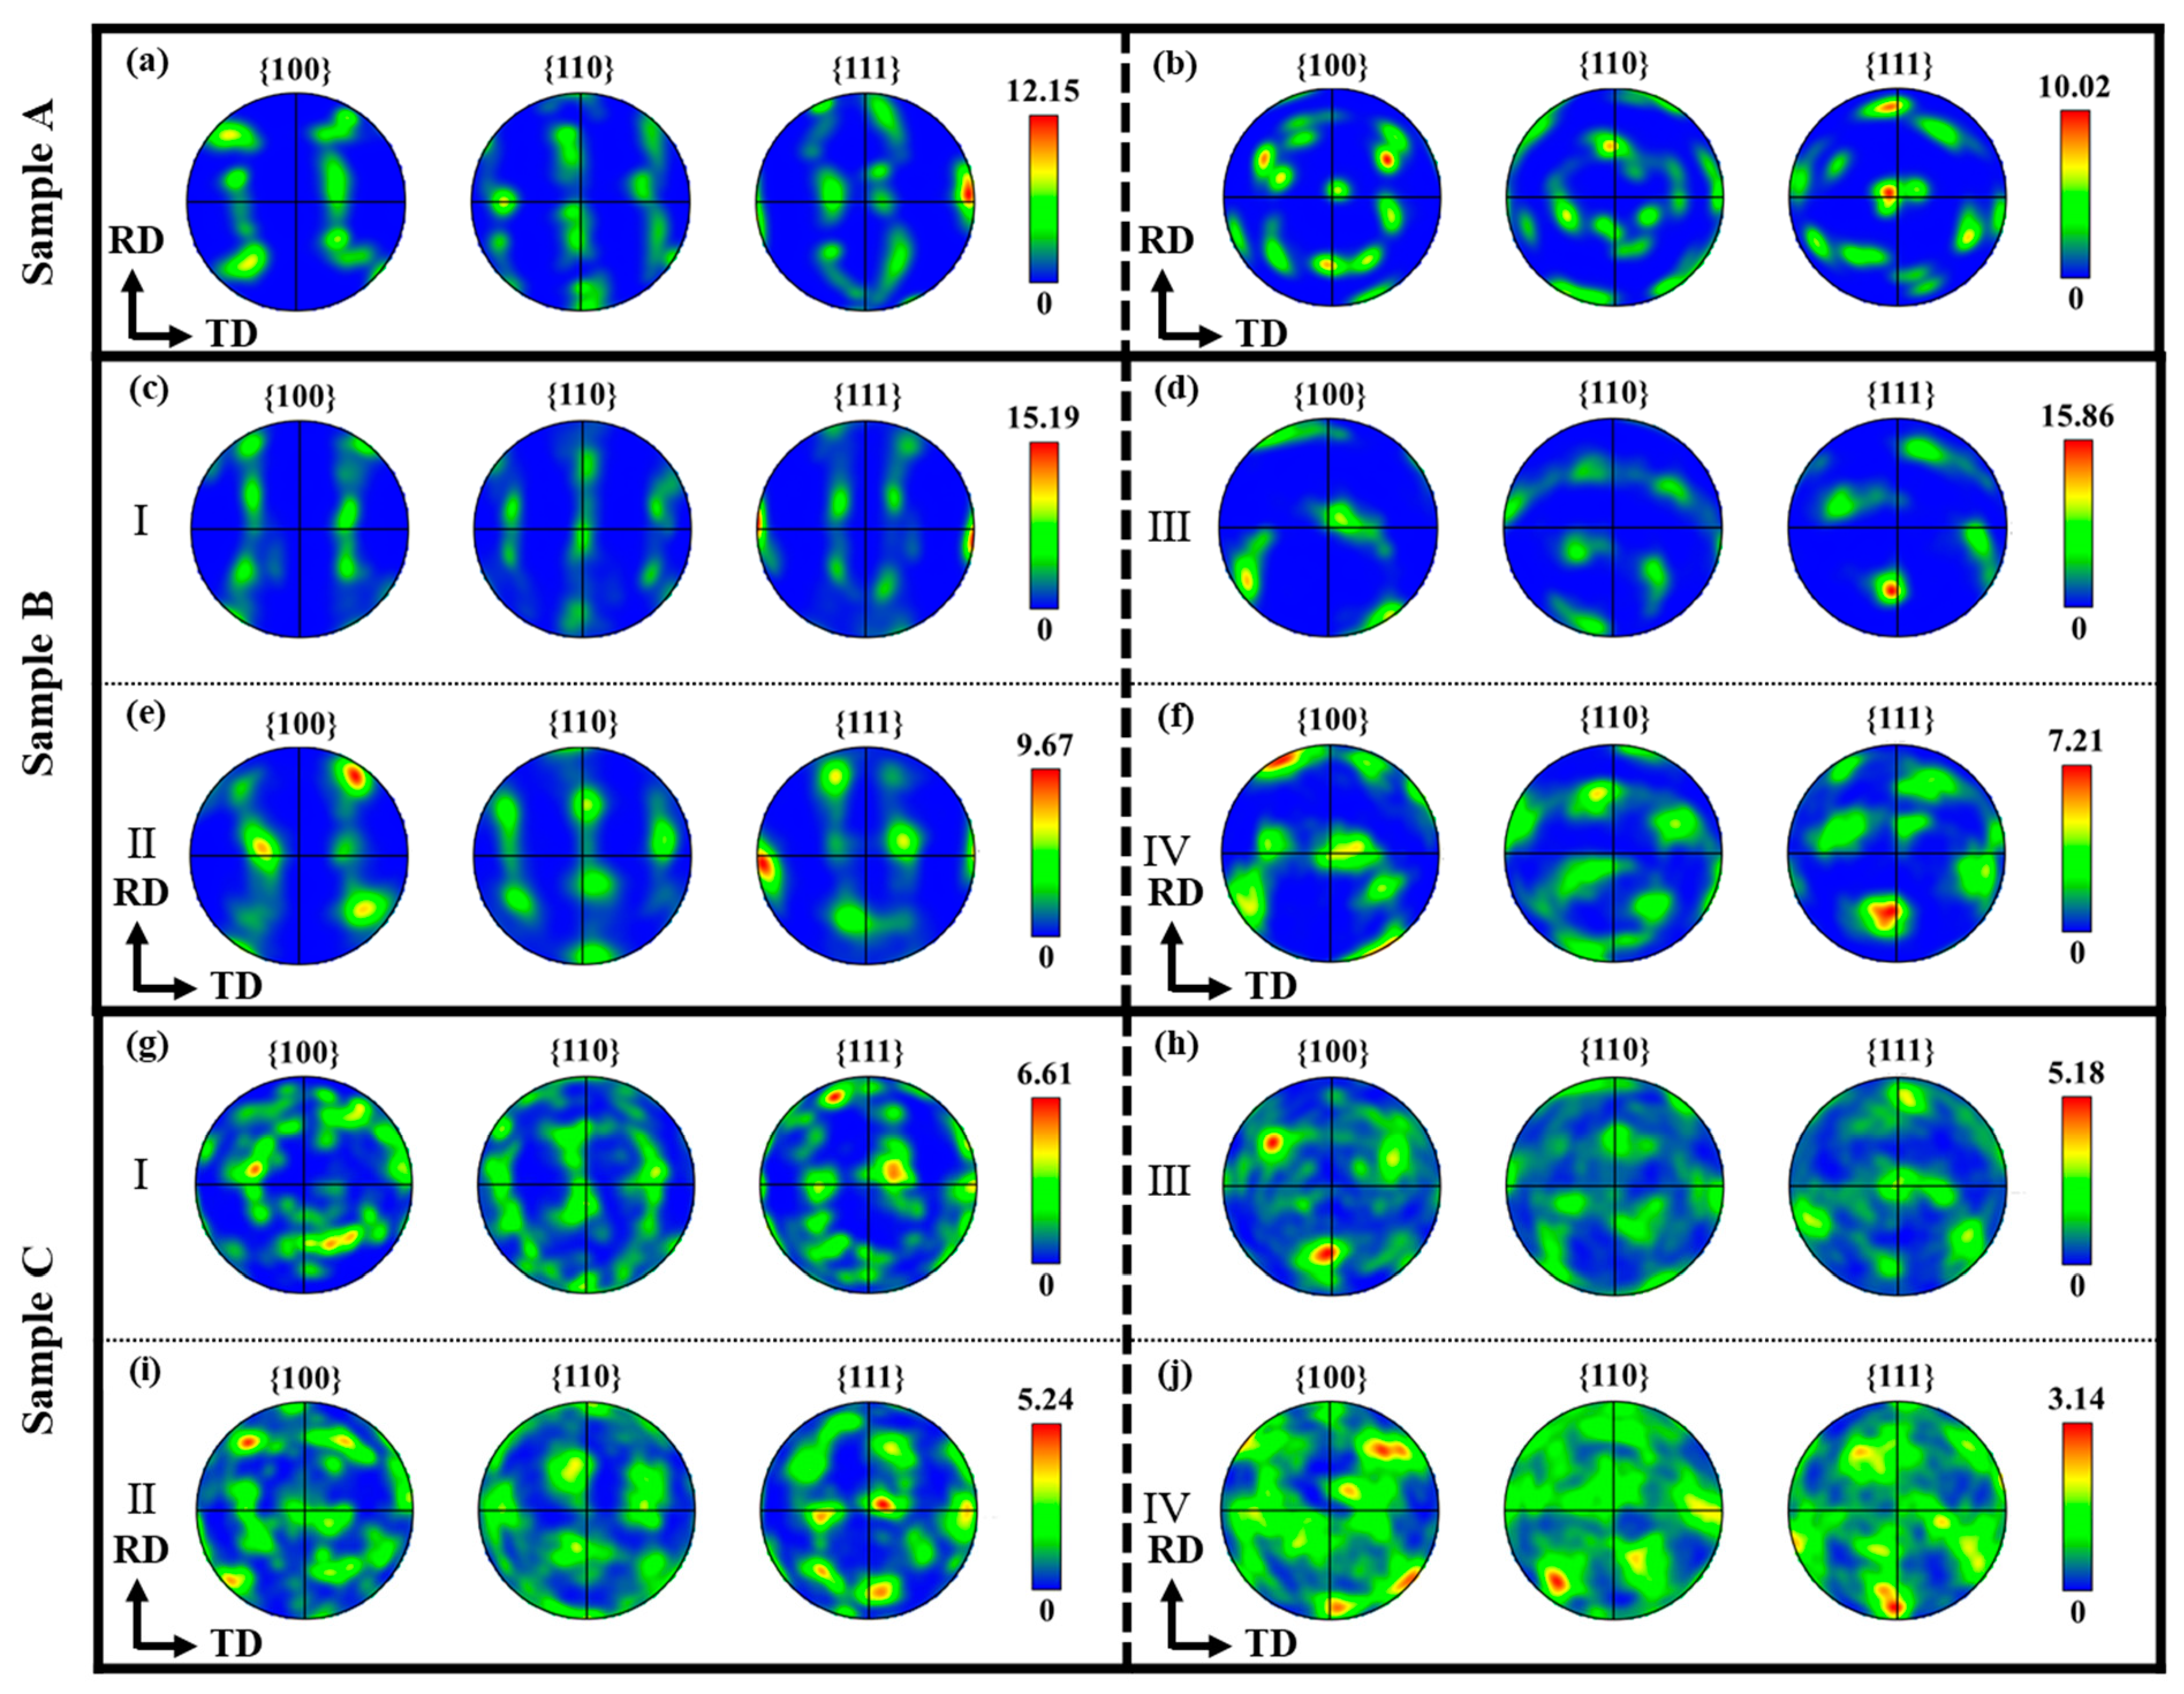
3.2. Texture
3.3. Misorientation Angle
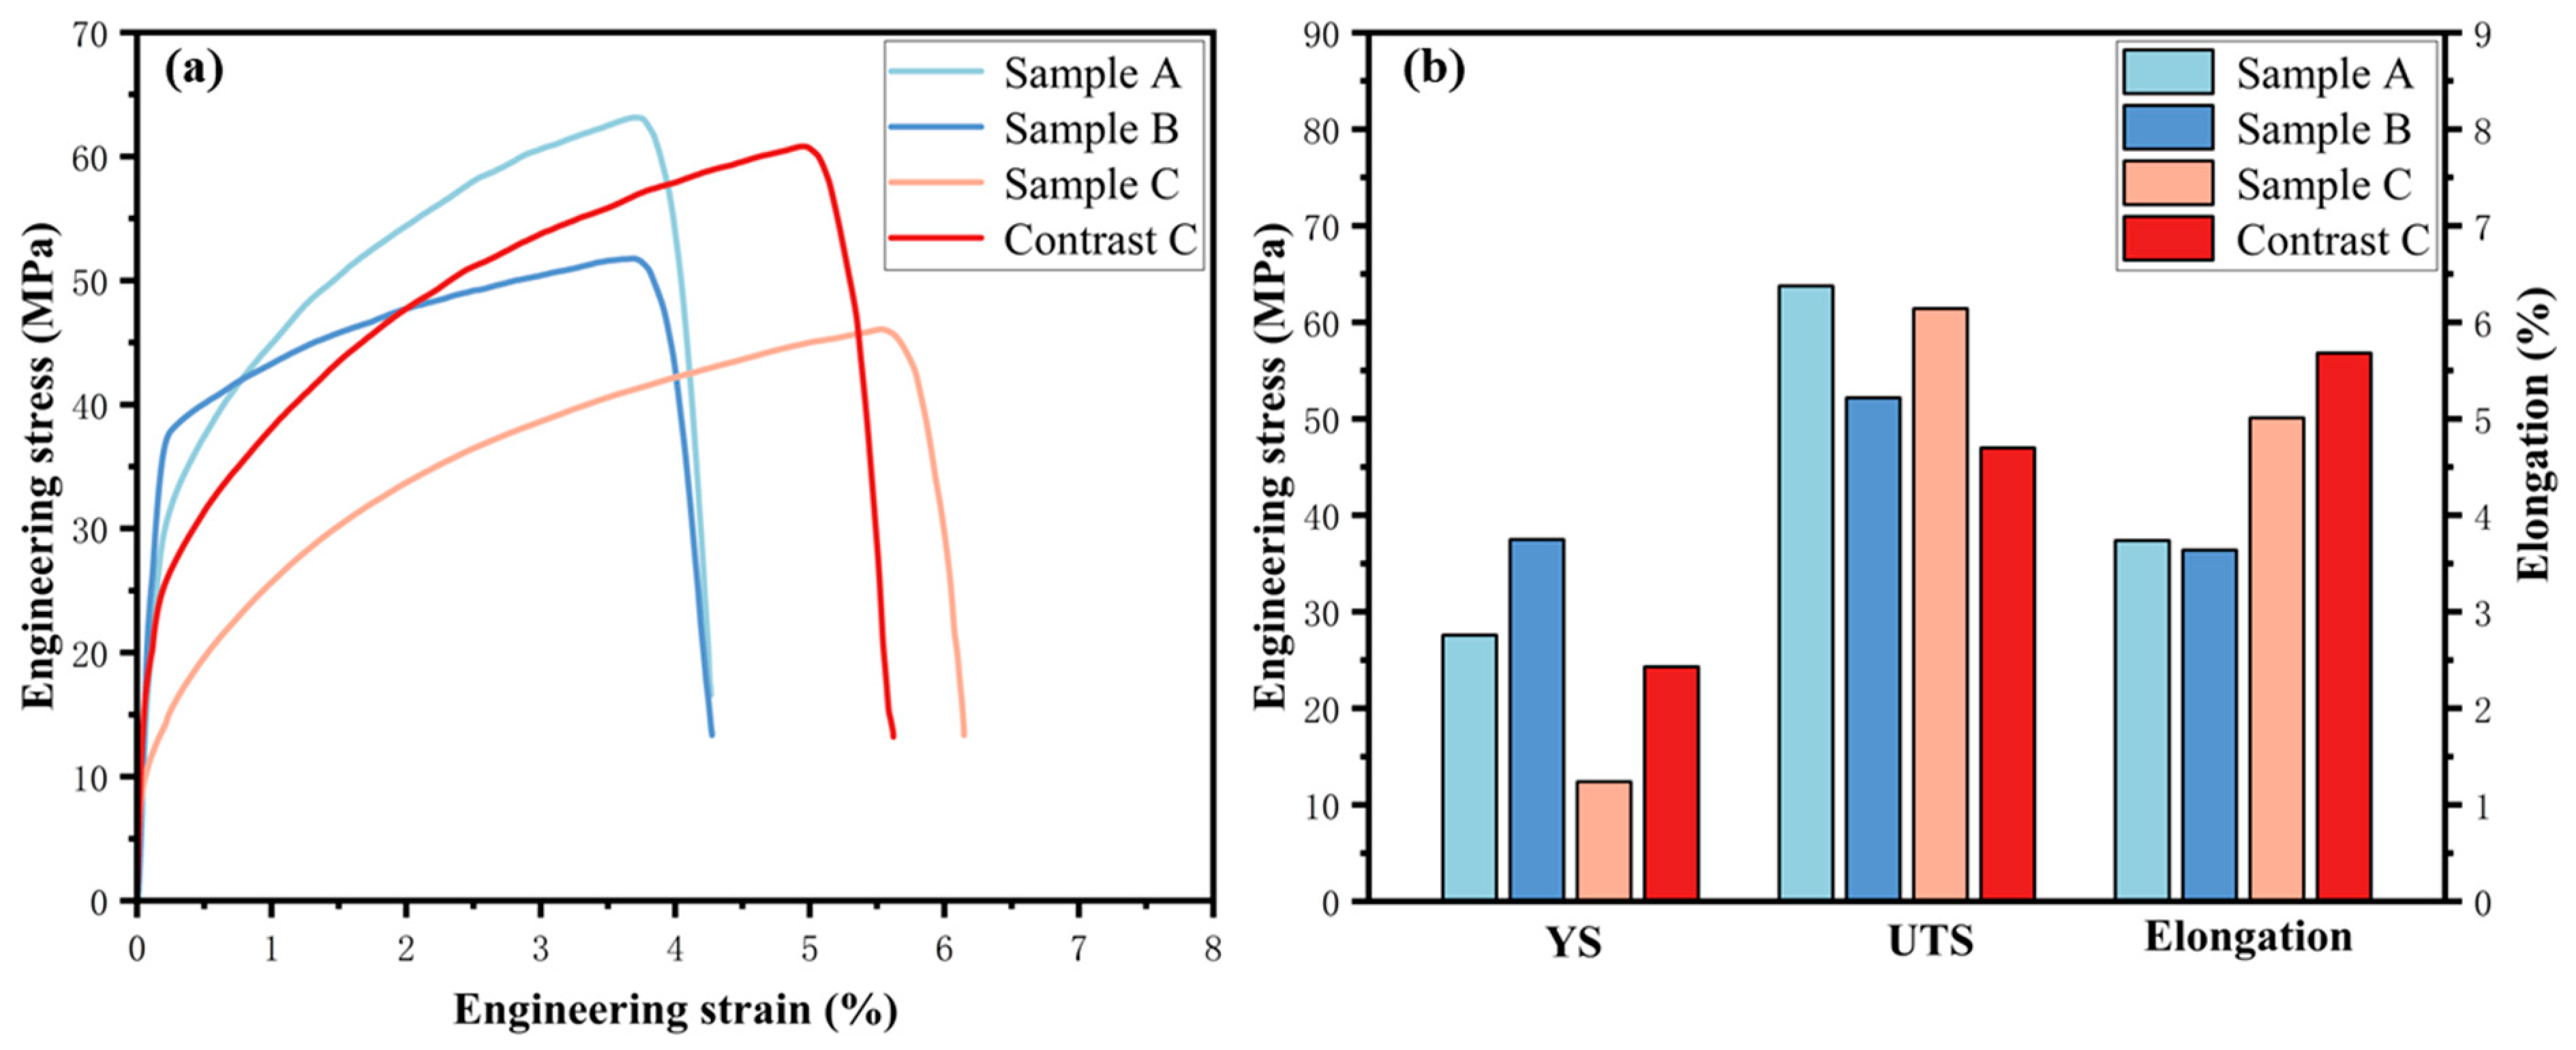
3.4. Mechanical Properties
4. Conclusions
- (1)
- Roller vibration leads to local grain refinement in pure aluminum ultra-thin strips, with uneven grain sizes at the peaks and troughs. The average grain size of Sample B at position IV is 4 μm, while, at position III, it is 10.1 μm, indicating significant grain refinement at the trough position. From the peak position to the trough position, LAGBs transition to HAGBs, and the average misorientation angle at the trough position is higher compared to the peak position. The average misorientation angle of Sample B at position III is 10.82°, increasing to 15.40° at position IV, as the impact generated by roller vibration leads to a greater plastic deformation at the trough position, resulting in an increase in the grain boundary misorientation angle.
- (2)
- At the troughs of pure aluminum ultra-thin strips, a texture different from conventional rolling is induced. In Sample B, at position I, a {110}<112> texture appears, while, at position II, a {111}<110> texture emerges. In Sample C, the {111}<112> texture at position III transitions to a {100}<110> texture at position IV, exhibiting alternating textures at the peaks and troughs. This is primarily due to the uneven impact on the surface of the strip caused by roller vibration, leading to uneven plastic deformation and changes in grain orientation, resulting in the texture differences between peaks and troughs. This alternating texture phenomenon will affect the ductility and mechanical properties of pure aluminum ultra-thin strips.
- (3)
- The mechanical properties of pure aluminum ultra-thin strips are affected by roller vibration, resulting in increased elongation but decreased tensile strength. This is because roller vibration causes grain refinement at the trough positions of the aluminum strip, which increases its elongation. However, due to the uneven grain refinement, the tensile strength of the aluminum strip is reduced.
Author Contributions
Funding
Data Availability Statement
Conflicts of Interest
References
- Tarascon, J.M.; Armand, M. Issues and challenges facing rechargeable lithium batteries. Nature 2001, 414, 359–367. [Google Scholar] [CrossRef] [PubMed]
- Masias, A.; Marcicki, J.; Paxton, W.A. Opportunities and Challenges of Lithium Ion Batteries in Automotive Applications. ACS Energy Lett. 2021, 6, 621–630. [Google Scholar] [CrossRef]
- Nitta, N.; Wu, F.; Lee, T.J.; Yushin, G. Li-ion battery materials: Present and future. Mater. Today 2015, 18, 252–264. [Google Scholar] [CrossRef]
- Choi, D.; Shamim, N.; Crawford, A. Li-ion battery technology for grid application. J. Power Sources 2021, 511, 230419. [Google Scholar] [CrossRef]
- Zubi, G.; Dufo-Lopez, R.; Carvalho, M.; Pasaoglu, G. The lithium-ion battery: State of the art and future perspectives. Renew. Sustain. Energy Rev. 2018, 89, 292–308. [Google Scholar] [CrossRef]
- Pacala, S.; Socolow, R. Stabilization Wedges: Solving the Climate Problem for the Next 50 Years with Current Technologies. Science 2004, 305, 968–972. [Google Scholar] [CrossRef]
- Steven, T.B.; Mohammad, H.T. Are Foils the Future of Anodes? Joule 2020, 4, 1342–1346. [Google Scholar]
- Zhang, X.M.; Liu, J.C.; Tang, J.G. Element segregation on the surfaces of pure aluminum foils. Appl. Surf. Sci. 2010, 256, 7300–7304. [Google Scholar] [CrossRef]
- Zang, J.; Zheng, T.Y.; Lam, K.H.; Boles, S.T. Design considerations and cycling guidance for aluminum foil anodes in lithium-ion rechargeable cells. Electrochim. Acta 2023, 456, 142437. [Google Scholar] [CrossRef]
- Crowley, P.J.; Scanlan, K.P.; Manthiram, A. Diffusional lithium trapping as a failure mechanism of aluminum foil anodes in lithium-ion batteries. J. Power Sources 2022, 546, 231973. [Google Scholar] [CrossRef]
- Li, D.Q.; Chu, F.L.; He, Z.J. Single-material aluminum foil as anodes enabling high-performance lithium-ion batteries: The roles of prelithiation and working mechanism. Mater. Today 2022, 58, 80–90. [Google Scholar] [CrossRef]
- Jovanovi, M.T.; Ilic, N.; Cvijovi-Alagi, I. Multilayer aluminum composites prepared by rolling of pure and anodized aluminum foils. Trans. Nonferrous Met. Soc. China 2017, 27, 1907–1919. [Google Scholar] [CrossRef]
- Le, H.R.; Sutcliffe, M.P. Analysis of surface roughness of cold-rolled aluminium foil. Wear 2000, 244, 71–78. [Google Scholar] [CrossRef]
- Jeong, H.T.; Jang, J.; Lee, D.G.; Lee, D.W.; Kim, W.J. Grain size and hardness: Key parameters for enhancing the chemo-mechanical stability of lithiated aluminum foil anodes. J. Alloys Compd. 2023, 965, 171279. [Google Scholar] [CrossRef]
- Bonatti, C.; Mohr, D. Anisotropic viscoplasticity and fracture of fine grained metallic aluminum foil used in Li-ion batteries. Mater. Sci. Eng. A 2016, 654, 329–343. [Google Scholar] [CrossRef]
- Yang, L.L.; Zhao, W.Q.; Sun, S.; Xu, C.Y. Grain boundary density matters in lithiation performances of aluminum foil anode for lithiumion batteries. Mater. Today Commun. 2023, 37, 107179. [Google Scholar] [CrossRef]
- Nadja, B.; Philipp, F.; Marcus, B. On radial microstructural variations, local texture and mechanical gradients after cold extrusion of commercially pure aluminum. Mater. Sci. Eng. A 2022, 850, 143496. [Google Scholar]
- Naghdy, S.; Kestens, L.; Hertelé, S.; Verleysen, P. Evolution of microstructure and texture in commercial pure aluminum subjected to high pressure torsion processing. Mater. Charact. 2016, 120, 285–294. [Google Scholar] [CrossRef]
- Lanjewar, H.; Naghdy, S.; Vercruysse, F.; Kestens, L.; Verleysen, P. Severe plastically deformed commercially pure aluminum: Substructure, micro-texture and associated mechanical response during uniaxial tension. Mater. Sci. Eng. A 2019, 764, 138195. [Google Scholar] [CrossRef]
- Byakov, A.V.; Eremin, A.V.; Shah, R.T. Estimating mechanical state of AA specimen under tension with the use of Lamb wave based ultrasonic technique. Mol. Cryst. Liq. Cryst. 2017, 655, 94–102. [Google Scholar] [CrossRef]
- Liu, X.H.; Song, M.; Sun, X.K.; Zhao, Q.L.; Yu, Q.B. Advances in Research and Application of Foil Rolling. J. Mech. Eng. 2017, 53, 1–9. [Google Scholar] [CrossRef]
- Kenmochi, K.; Yarita, I.; Abe, H.; Fukuhara, A.; Komatu, T.; Kaito, H. Effect of micro-defects on the surface brightness of cold-rolled stainless-steel strip. J. Mater. Process. Technol. 1997, 69, 106–111. [Google Scholar] [CrossRef]
- Zhang, Z.Q.; Zhang, H.R.; Liu, H.; Wang, T.; Huang, Q.X.; Liao, X. Effect of roll surface topography on microstructure and mechanical properties of 304 stainless steel ultra-thin strip. J. Manuf. Process. 2023, 108, 764–778. [Google Scholar] [CrossRef]
- Wu, Y.X.; Duan, J.A. Frequency modulation of high-speed mill chatter. J. Mater. Process. Technol. 2002, 129, 148–151. [Google Scholar] [CrossRef]
- Xiao, H.; Ren, Z.K.; Liu, X. New mechanism describing the limiting producible thickness in ultra-thin strip rolling. Int. J. Mech. Sci. 2017, 133, 788–793. [Google Scholar] [CrossRef]
- Zhang, H.B.; Zhao, W.; Huang, D. Vertical nonlinear vibration analysis of cold rolling mill considering structural gap and dynamic rolling force. J. Manuf. Process. 2023, 108, 280–291. [Google Scholar] [CrossRef]
- Qian, C.; Hua, C.C.; Zhang, L.L.; Ahn, C.K. Modeling and adaptive vibration control for variable-length strip rolling systems with actuator faults and output constraints. Nonlinear Dyn. 2024, 112, 995–1009. [Google Scholar] [CrossRef]
- Hou, D.X.; Xu, L.; Shi, P.M. Vertical–horizontal coupling nonlinear vibration characteristics of rolling mill under mixed lubrication. J. Iron Steel Res. Int. 2021, 28, 574–585. [Google Scholar] [CrossRef]
- Cao, L.; Li, X.; Wang, Q.L.; Zang, D.H. Vibration analysis and numerical simulation of rolling interface during cold rolling with unsteady lubrication. Tribol. Int. 2021, 153, 106604. [Google Scholar] [CrossRef]
- Zhong, J.; Yan, H.Z.; Duan, J.; Xu, L.J.; Wang, W.H.; Chen, P.L. Industrial experiments and findings on temper rolling chatter. J. Mater. Process. Tech. 2002, 120, 275–280. [Google Scholar] [CrossRef]
- Kim, Y.; Kim, C.W.; Lee, S.; Park, H. Dynamic Modeling and Numerical Analysis of a Cold Rolling Mill. Int. J. Precis. Eng. Manuf. 2013, 14, 407–413. [Google Scholar] [CrossRef]
- Wu, S.L.; Wang, L.M.; Shao, Y.M.; Yuan, Y.L. Vibration characteristic analysis of twenty-high rolling mill with local defect on roll surface based on the time-varying contact stiffness. Eng. Fail. Anal. 2014, 42, 297–310. [Google Scholar] [CrossRef]
- GB/T 16865-2013. Test Pieces and Method for Tensile Test for Wrought Aluminium and Magnesium Alloys Products. Standard Press of China: Beijing, China, 2013.
- Chen, X.; Huang, G.S.; Liu, S.S. Grain refinement and mechanical properties of pure aluminum processed by accumulative extrusion bonding. Trans. Nonferrous Met. Soc. China 2019, 29, 437–447. [Google Scholar] [CrossRef]
- Tang, Y.P.; Komatsu, T.; Masuda, T. Mechanical properties and electrical conductivity of ultrafine-grained aluminum consolidated by high-pressure sliding. Mater. Lett. 2020, 14, 100916. [Google Scholar]
- Chung, Y.; Gubarevich, A.V.; Yoshida, K. Effects of solid solution, grain size and porosity on the thermal conductivity of aluminum- and boron-added porous silicon carbide ceramics with in-situ grain growth. J. Eur. Ceram. Soc. 2023, 43, 792–804. [Google Scholar] [CrossRef]
- Nie, H.H.; Liang, W.; Chen, H.S.; Zheng, L.W.; Chi, C.Z.; Li, X.R. Effect of annealing on the microstructures and mechanical properties of Al/Mg/Al laminates. Mater. Sci. Eng. A 2018, 732, 6–13. [Google Scholar] [CrossRef]
- Merriman, C.C.; Field, D.P. Orientation dependence of dislocation structure evolution during cold rolling of aluminum. Mater. Sci. Eng. 2008, 494, 28–35. [Google Scholar] [CrossRef]
- Liu, W.C.; Morris, J.G. Effect of pre-treatment on recrystallization and recrystallization textures of cold rolled CC AA 5182 aluminum alloy. Mater. Sci. Eng. A 2003, 363, 253–262. [Google Scholar] [CrossRef]
- Hollinshead, P.A. Effect of preheat treatment on ingot structure and recrystallisation of brass component of rolling texture in hot rolled AA 5182. Metal Sci. J. 1992, 8, 56–62. [Google Scholar] [CrossRef]
- Jiang, J.F.; Liu, Y.Z.; Xiao, G.F.; Wang, Y.; Ju, Y.N. Effect of pass reduction on microstructure, mechanical properties and texture of hot-rolled 7075 alloy. Mater. Charact. 2019, 147, 324–339. [Google Scholar] [CrossRef]


| Materials | Al | Si | Fe | Cu | C |
|---|---|---|---|---|---|
| 1A99 | 99.9 | 0.003 | 0.003 | 0.003 | 0.001 |
Disclaimer/Publisher’s Note: The statements, opinions and data contained in all publications are solely those of the individual author(s) and contributor(s) and not of MDPI and/or the editor(s). MDPI and/or the editor(s) disclaim responsibility for any injury to people or property resulting from any ideas, methods, instructions or products referred to in the content. |
© 2024 by the authors. Licensee MDPI, Basel, Switzerland. This article is an open access article distributed under the terms and conditions of the Creative Commons Attribution (CC BY) license (https://creativecommons.org/licenses/by/4.0/).
Share and Cite
Zhang, Y.; Li, W.; Hu, Y.; Huang, Z.; Peng, Y.; Chu, Z. Microstructural Evolution and Mechanical Behavior of Pure Aluminum Ultra-Thin Strip under Roller Vibration. Metals 2024, 14, 617. https://doi.org/10.3390/met14060617
Zhang Y, Li W, Hu Y, Huang Z, Peng Y, Chu Z. Microstructural Evolution and Mechanical Behavior of Pure Aluminum Ultra-Thin Strip under Roller Vibration. Metals. 2024; 14(6):617. https://doi.org/10.3390/met14060617
Chicago/Turabian StyleZhang, Yang, Wenguang Li, Yijian Hu, Zhiquan Huang, Yan Peng, and Zhibing Chu. 2024. "Microstructural Evolution and Mechanical Behavior of Pure Aluminum Ultra-Thin Strip under Roller Vibration" Metals 14, no. 6: 617. https://doi.org/10.3390/met14060617