Article

Study and Optimization of the Punching Process of Steel Using the Johnson–Cook Damage Model

1
Engineering Department, Universidad Pública de Navarra (UPNA), Campus Arrosadía S/N, 31006 Pamplona, Spain
2
Institute for Advanced Materials and Mathematics (INAMAT2), Universidad Pública de Navarra (UPNA), Campus Arrosadía S/N, 31006 Pamplona, Spain
3
NUADI, Polígono Ind. Arazuri-Orcoyen, Calle D, 2, 31170 Arazuri, Spain
*
Author to whom correspondence should be addressed.
Metals 2024, 14(6), 616; https://doi.org/10.3390/met14060616
Submission received: 1 March 2024 / Revised: 17 May 2024 / Accepted: 17 May 2024 / Published: 23 May 2024
(This article belongs to the Special Issue Advances in Modeling and Simulation in Metal Forming)

Abstract

:
Sheet metal forming processes are widely used in applications such as those in the automotive or aerospace industries. Among them, punching is of great interest due to its high productivity and low operating cost. However, it is necessary to optimize these processes and adjust their parameters, such as clearance, shear force or tool geometry, to obtain the best finishes and minimize crack generation. Thus, the main objective of this research work is to optimize the punching process to achieve parts that do not require subsequent processes, such as deburring, by controlling the properties of the starting materials and with the help of tools such as design of experiments and simulations. In the present study, tensile tests were performed on three steels with different compositions and three sample geometries. The information obtained from these tests has allowed us to determine the parameters of the Johnson–Cook damage criteria. Moreover, punching was performed on real parts and compared with simulations to analyze the percentage of burnish surface. The results obtained show that the methodology used was correct and that it can be extrapolated to other types of die-cutting processes by reducing the percentage of surface fractures and predicting the appearance of cracks. Furthermore, it was observed that clearance has a greater influence than processing speed, while the minimum percentage of the burnish area was observed for the minimum values of clearance.

1. Introduction

Sheet metal forming processes have been widely used throughout history to manufacture components with thicknesses ranging from microns to centimeters. Applications where these methods are used include the manufacture of automotive parts, aerospace components or commonly used products such as cans, sinks and boxes, among others [1,2,3].
In industries like the automotive industry, requirements for lightweight construction and crash safety have led to the use of modern steels, including advanced high strength steels [4]. This type of material is more sensitive to edge cracking in the forming processes, leading to the formation of edge cracks [4].
The condition of the edge and the occurrence of cracks in the material will depend on the cutting process used. In processes such as water-jet cutting, erosion, machining or polishing there will be almost no influence, while in processes where shear cutting occurs (punching and blanking, among others) there is a higher risk of edge cracking [4]. In shear cutting, the large deformation that is generated causes strain hardening, accompanied by a reduction in forming potential, damage to the microstructure and strong residual stress fields. Therefore, the process parameters will influence the lamination, burnish, fracture, and burr zones generated as a result of shearing [4].
Die cutting is very attractive as it provides high stability and high productivity at a low operating cost. However, the continuous evolution of the industry has resulted in increasing demands on the precision of stamped parts [5,6]. Moreover, the burnish area is smaller compared with other processes such as fine blanking, which makes it less competitive. A possible solution to this problem is the use of accessory parts such as tampers. In the case of using these components, the process is slower and more expensive, losing its main advantage over other techniques.
Among the metal forming processes, in operations such as stamping and bending the aim is to plastically deform the part, while in case of die cutting the aim is complete rupture. The shear stresses generated by the penetration of the punch [7] cause the damage phenomena and crack propagation in the material before complete rupture. Several parameters such as material hardening, damage evolution or crack initiation and propagation can be used to describe the behavior of the part in the working conditions [8]. Crack formation in the components may start because of localized plastic deformation appearing near the edges of the punch and die. With punch advancement, these localized cracks at the tool edge (die and punch) propagate through the sheet thickness and lead to a complete separation of the material [3,7]. There are many factors that affect the performance of the sheet metal stamping process, among which the following can be highlighted: shear force, clearance, sheet thickness and material, tool geometry, clamping force, design of the part to be stamped, penetration rate and punch alignment [9]. The correct selection of these parameters will influence the geometry of the cut edge, the depth of material affected by the cut and the degree of work hardening.
The die-cutting process is influenced by the clearance and tool geometry and by the properties of the workpiece material (die thickness, mechanical properties, microstructure, etc.) [10]. As has been observed in different studies, the more ductile the material, the higher the percentage of clean shear [11,12]. In addition, it has also been noted that the more ductile the material, the smaller the clearance used should be [9]. On the other hand, the brittleness of the material requires that both punch and die must be sharper to avoid the generation of burrs [12].
The most influential factor on the shape and quality of the cut is the clearance. Generally, increased clearance results in rougher edges and a larger deformation zone. In addition, the sheet may bend and deform because of tensile stresses if the clearance is too large [12]. Therefore, by increasing the clearance, the subsequent deformation capacity of the material is decreased [13] and better results will be obtained with low values of clearance. However, zero values cannot be used and usually values between 5 and 10% of the sheet thickness are used. Furthermore, it has been shown that the optimum clearance decreases as the elongation of the material increases, i.e., the more brittle the material, the greater the clearance used should be [9,14].
Depending on the objective of the application, the value of the optimum clearance will be different. For cases in which it is important to minimize the punching force, the clearance should be set at 10% of the thickness; whereas, if the aim is to minimize the angle and depth of the fracture, it is better to set the clearance at 5% [15]. It should also be considered that when the backlash is set at 10%, the wear suffered by the tool is slightly reduced, which can favor cost reduction. The coefficient of friction, which will depend on the materials in contact and the process conditions, will also be linked to the wear suffered by the tool [16,17].
Summarizing, it can be said that the clearance will influence both the die and punch life, the cutting force required to carry out the process and the dimensional accuracy of the cut [9]. With respect to shear quality, an increase in the shear force applied by the punch will result in a decrease in the height of the drop zone [11,18].
In the case of friction and wear, the end of the useful life of metal forming tools is largely associated with the increase in the roughness of the manufactured product and the transfer of material to the tool surface [16]. The relative wear between the tools causes the appearance of wear and friction, in many cases with very high contact pressures. The normal forces of this process will cause creep and consequently the lateral force will deform the material in addition to helping to overcome friction. Although friction is necessary to shape the material, the values should not be excessively high to reduce the energy used during shaping. Therefore, it is necessary to have a stable friction value that allows for controlled deformation and an adequate surface finish of the final product. Wear and changes in contact between the parts that are part of the process will have a great influence on this aspect [16].
The use of simulation to optimize the die-cutting processes and adjust the parameters described in the previous lines is of great interest. Finite element simulation allows obtaining information about the behavior of the component under the working conditions, thus enabling adjustment of these parameters. In this research work, finite element simulation and the Johnson and Cook damage model have been used to optimize the punching process. This damage model defines the material fracture as a function of triaxiality, the plastic deformation rate and temperature [19]. Using this damage model, it is possible to predict damage and fracture in metallic materials subjected to dynamic loads [20].
Punching is a fast and cost-effective material forming and/or cutting process, which makes it an attractive option compared to other processes such as fine blanking. However, its main disadvantage is the poor finish of the parts due to the cracks that are observed after the operations. Because of this, optimizing the process by adjusting factors such as the clearance or punch velocity to increase the percentage of burnish area is of great importance to achieve a process that can compete with other more expensive ones.
The main objective of this present study is to optimize the punching process to achieve better cuts through control of the starting material and using tools such as design of experiments and simulations. For this purpose, tensile tests were carried out on samples with three different shapes in order to obtain the necessary parameters to carry out the simulations. These results, combined with those obtained from the in-service material tests, have allowed us to carry out the design of experiments that will result in the optimization of the process.

2. Materials and Methods

2.1. Materials

In the present research work, three different unalloyed structural steels, obtained directly from suppliers, were used. The suppliers provided coils of laminated material 170 mm wide, 5.5 mm in thickness and 2000 kg in weight. From these coils, specimens were machined by wire cutting. The designation used during this study for each structural steel and their chemical compositions are shown in Table 1, while Table 2 outlines the mechanical properties measured by the supplier. In Table 2, σy refers to the elastic limit, while Rm refers to the fracture resistance of the materials.
It should be noted that the carbon content of the steels varies, ranging from 0.05 %C to 0.15 %C. Given the importance of the percentage of carbon for the hardness and mechanical properties, it should be considered when evaluating the results.
Regarding their mechanical properties, significant changes were observed in the fracture resistance and elongation of the different materials. Elongation is related to ductility, so the material with the highest elongation value is the most ductile. In this case, it can be clearly observed that as the carbon percentage increases, ductility decreases and therefore elongation decreases. Therefore, the material with the lowest elongation is steel 3 (26% approximately) and the one with the highest elongation is steel 2 (39%). The fracture resistance of the steel that has an intermediate carbon percentage, steel 1, showed a fracture resistance of almost 420 MPa, while the two with percentages around 0.05 showed a considerably lower toughness (≈390 MPa) and the two with percentages higher than 0.15% presented values of approximately 460 MPa.
In order to observe the microstructure of each steel, optical microscopy was used after attacking the surface of the samples. The specimens were prepared by first hot grating in Lumigraf resin (Lumigraf, Montreal, QC, Canada), then attacking with 3% nital for 3 min and finally cleaning with a mixture of distilled water and ethanol and air-drying. Figure 1 shows the microstructure of each steel obtained by optical microscopy Olympus BX60M (Olympus, Tokyo, Japan). In these figures, it is possible to observe the structure of carbon steels, pearlitic matrix in lighter tones and martensite grains in darker tones of gray color. It is known that the ferritic matrix is a ductile matrix and that the martensite grains provide hardness and strength, although they also increase brittleness. Steel 3 presents the highest amount of martensite, which is associated with the higher values of Rm observed in Table 2.
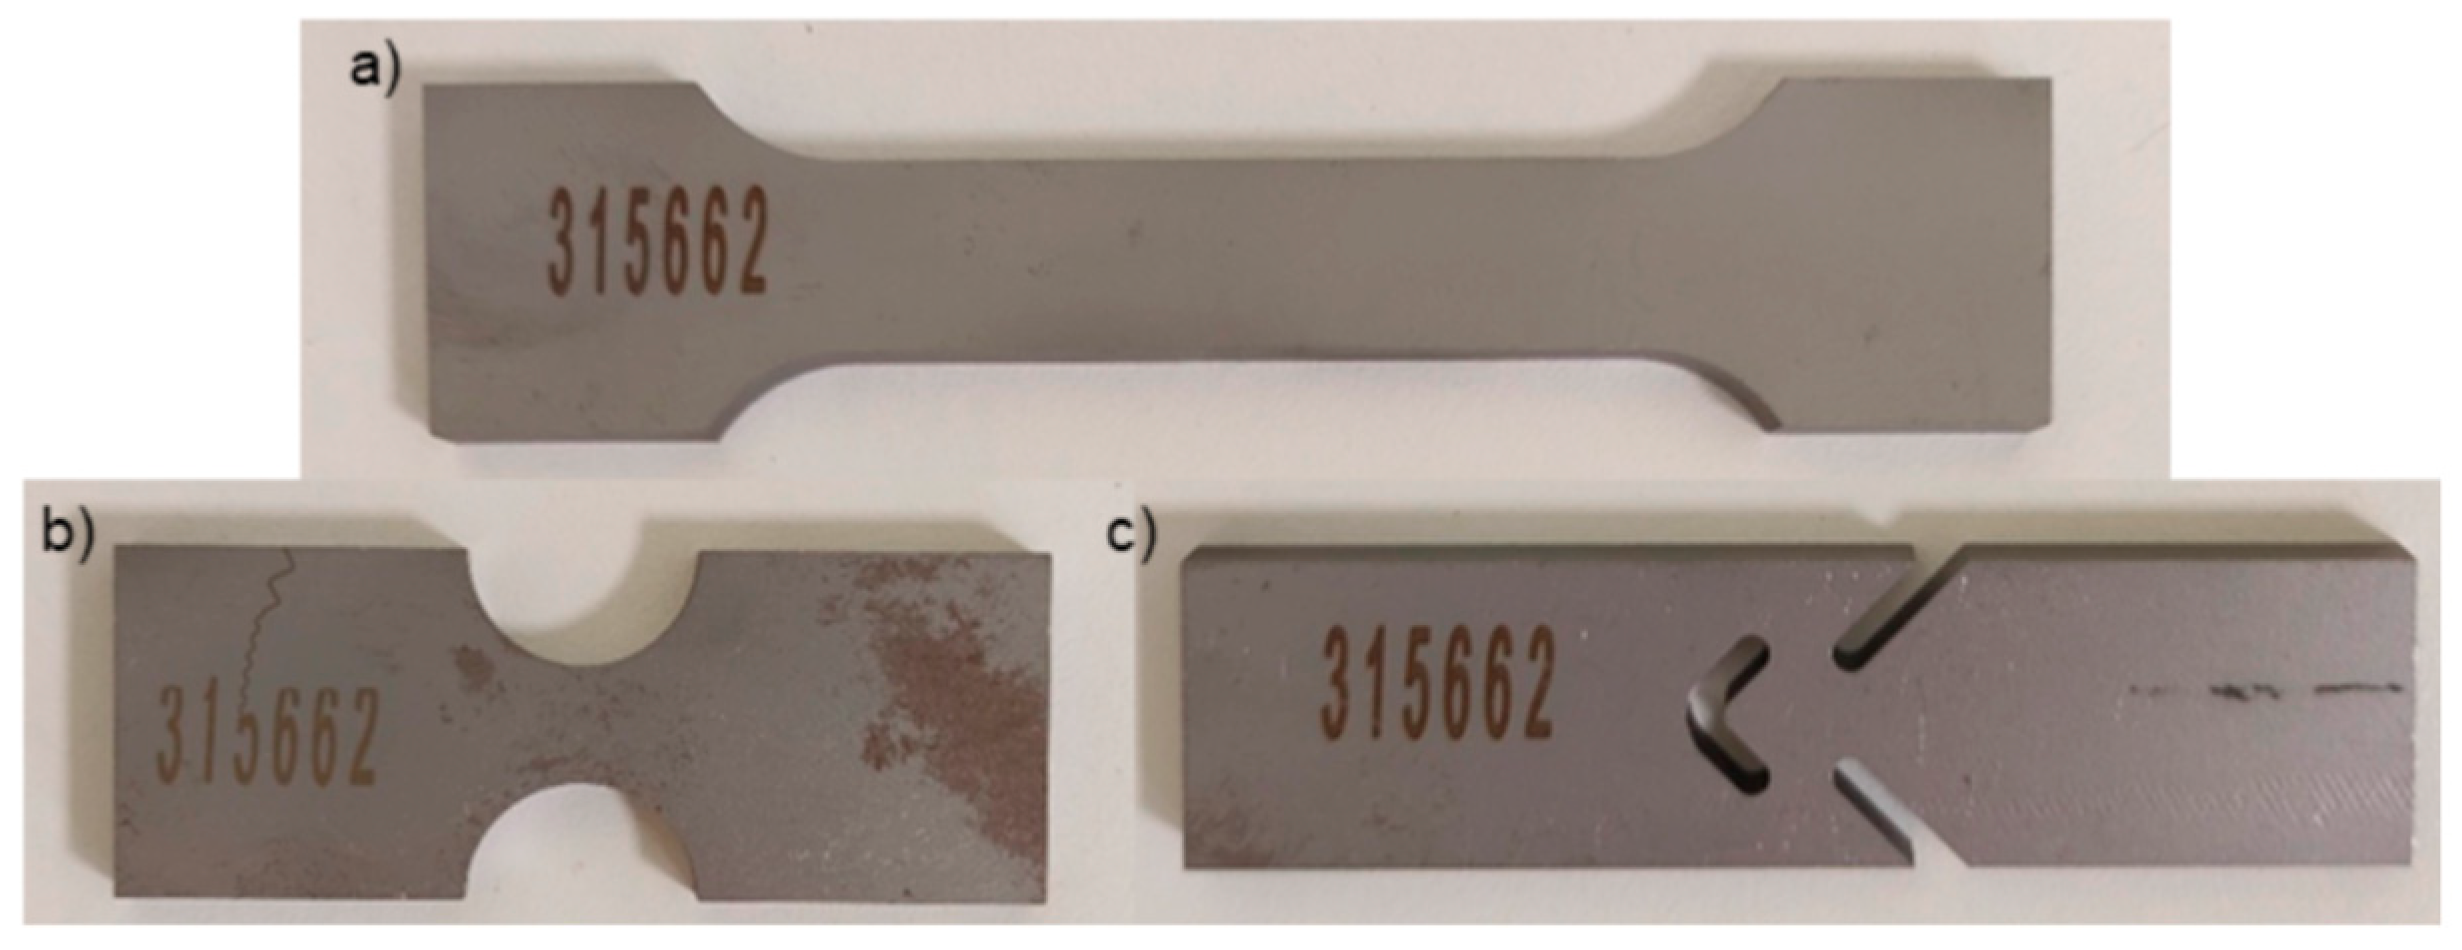
Three different tensile specimen geometries were obtained from each of the materials, all of them in the rolling direction, as can be observed in Figure 2. The specimens used were as follows:
  • Conventional tensile samples: UNE-EN ISO 6892-1:2020 [21].
  • Notched test sample: from the Simufact software (versión 2022.1) manual.
  • Shear test sample: ASTM B831 [22].
The objective of designing tensile specimens with different geometries was to obtain triaxiality (η) data for each of them considering that they would break in a different way. Thus, it would be possible to characterize the damage model of the material [23]. Positive triaxiality values are related to tensile stresses, and within this range the following values were sought for each of the specimens:
  • Shear test sample → Pure shear stress: η = 0
  • Conventional tensile test → Pure traction: η = 1/3
  • Notched test sample → Tensile test with notch: η = 2/3
It is known that the smaller the notch radius, the higher the triaxiality value [24], so a notched specimen was used instead of a conventional tensile specimen to obtain the maximum triaxiality values.

2.2. Tensile Tests

Tensile tests were performed with an EM2/200/FR (Microtest, Madrid, Spain), which is composed of a force transducer PBF/20 with a maximum capacity of 200 kN. The objective of these tensile tests was to obtain the basic mechanical properties and identify the material parameters necessary to subsequently simulate the process. Tensile tests were performed in triplicate for each material and sample type to ensure repeatability.
Constants K and n, the strength coefficient and the strain hardening exponent, respectively, are used to evaluate the behavior of the materials in uniaxial tension tests at room temperature. For these reasons, and since structural steels behave according to Hollomon’s Law [25], they have been used to characterize the behavior of the studied materials in both tensile tests and in die-cutting operations. This law allows obtaining the pairs of real plastic stress–strain values necessary to define the behavior of the material, as defined in Equation (1):
σ = K ε n
Therefore, from the tests performed on the conventional tensile samples, the Hollomon’s Law constants were obtained for each of the materials. From the tensile test, the stress vs. strain data, both real and engineering, were obtained and, from these data, the hardening coefficient and resistance coefficient parameters were obtained [26]. Tensile tests were also performed for the other two geometries (notched and shear) to define the Johnson–Cook damage model.

2.3. Simulations

All simulations conducted in the present study were performed using the Simufact Forming 2022.3 software from MSC. This software specializes in plastic deformation processes, which allows the use of different flow stress laws and complex damage models such as the Johnson–Cook model. It is also worth highlighting the possibility of modeling the appearance of cracks using the element elimination method or the mesh separation method. Consequently, the latter approach was selected for this study due to its higher accuracy and greater consistency in simulation convergence. However, it is limited to 2D simulations, as it cannot be used in 3D. Fortunately, this limitation does not affect the current study, as all simulations are set up in 2D (plane strain or axisymmetric).

2.4. Experimental Punching Tests

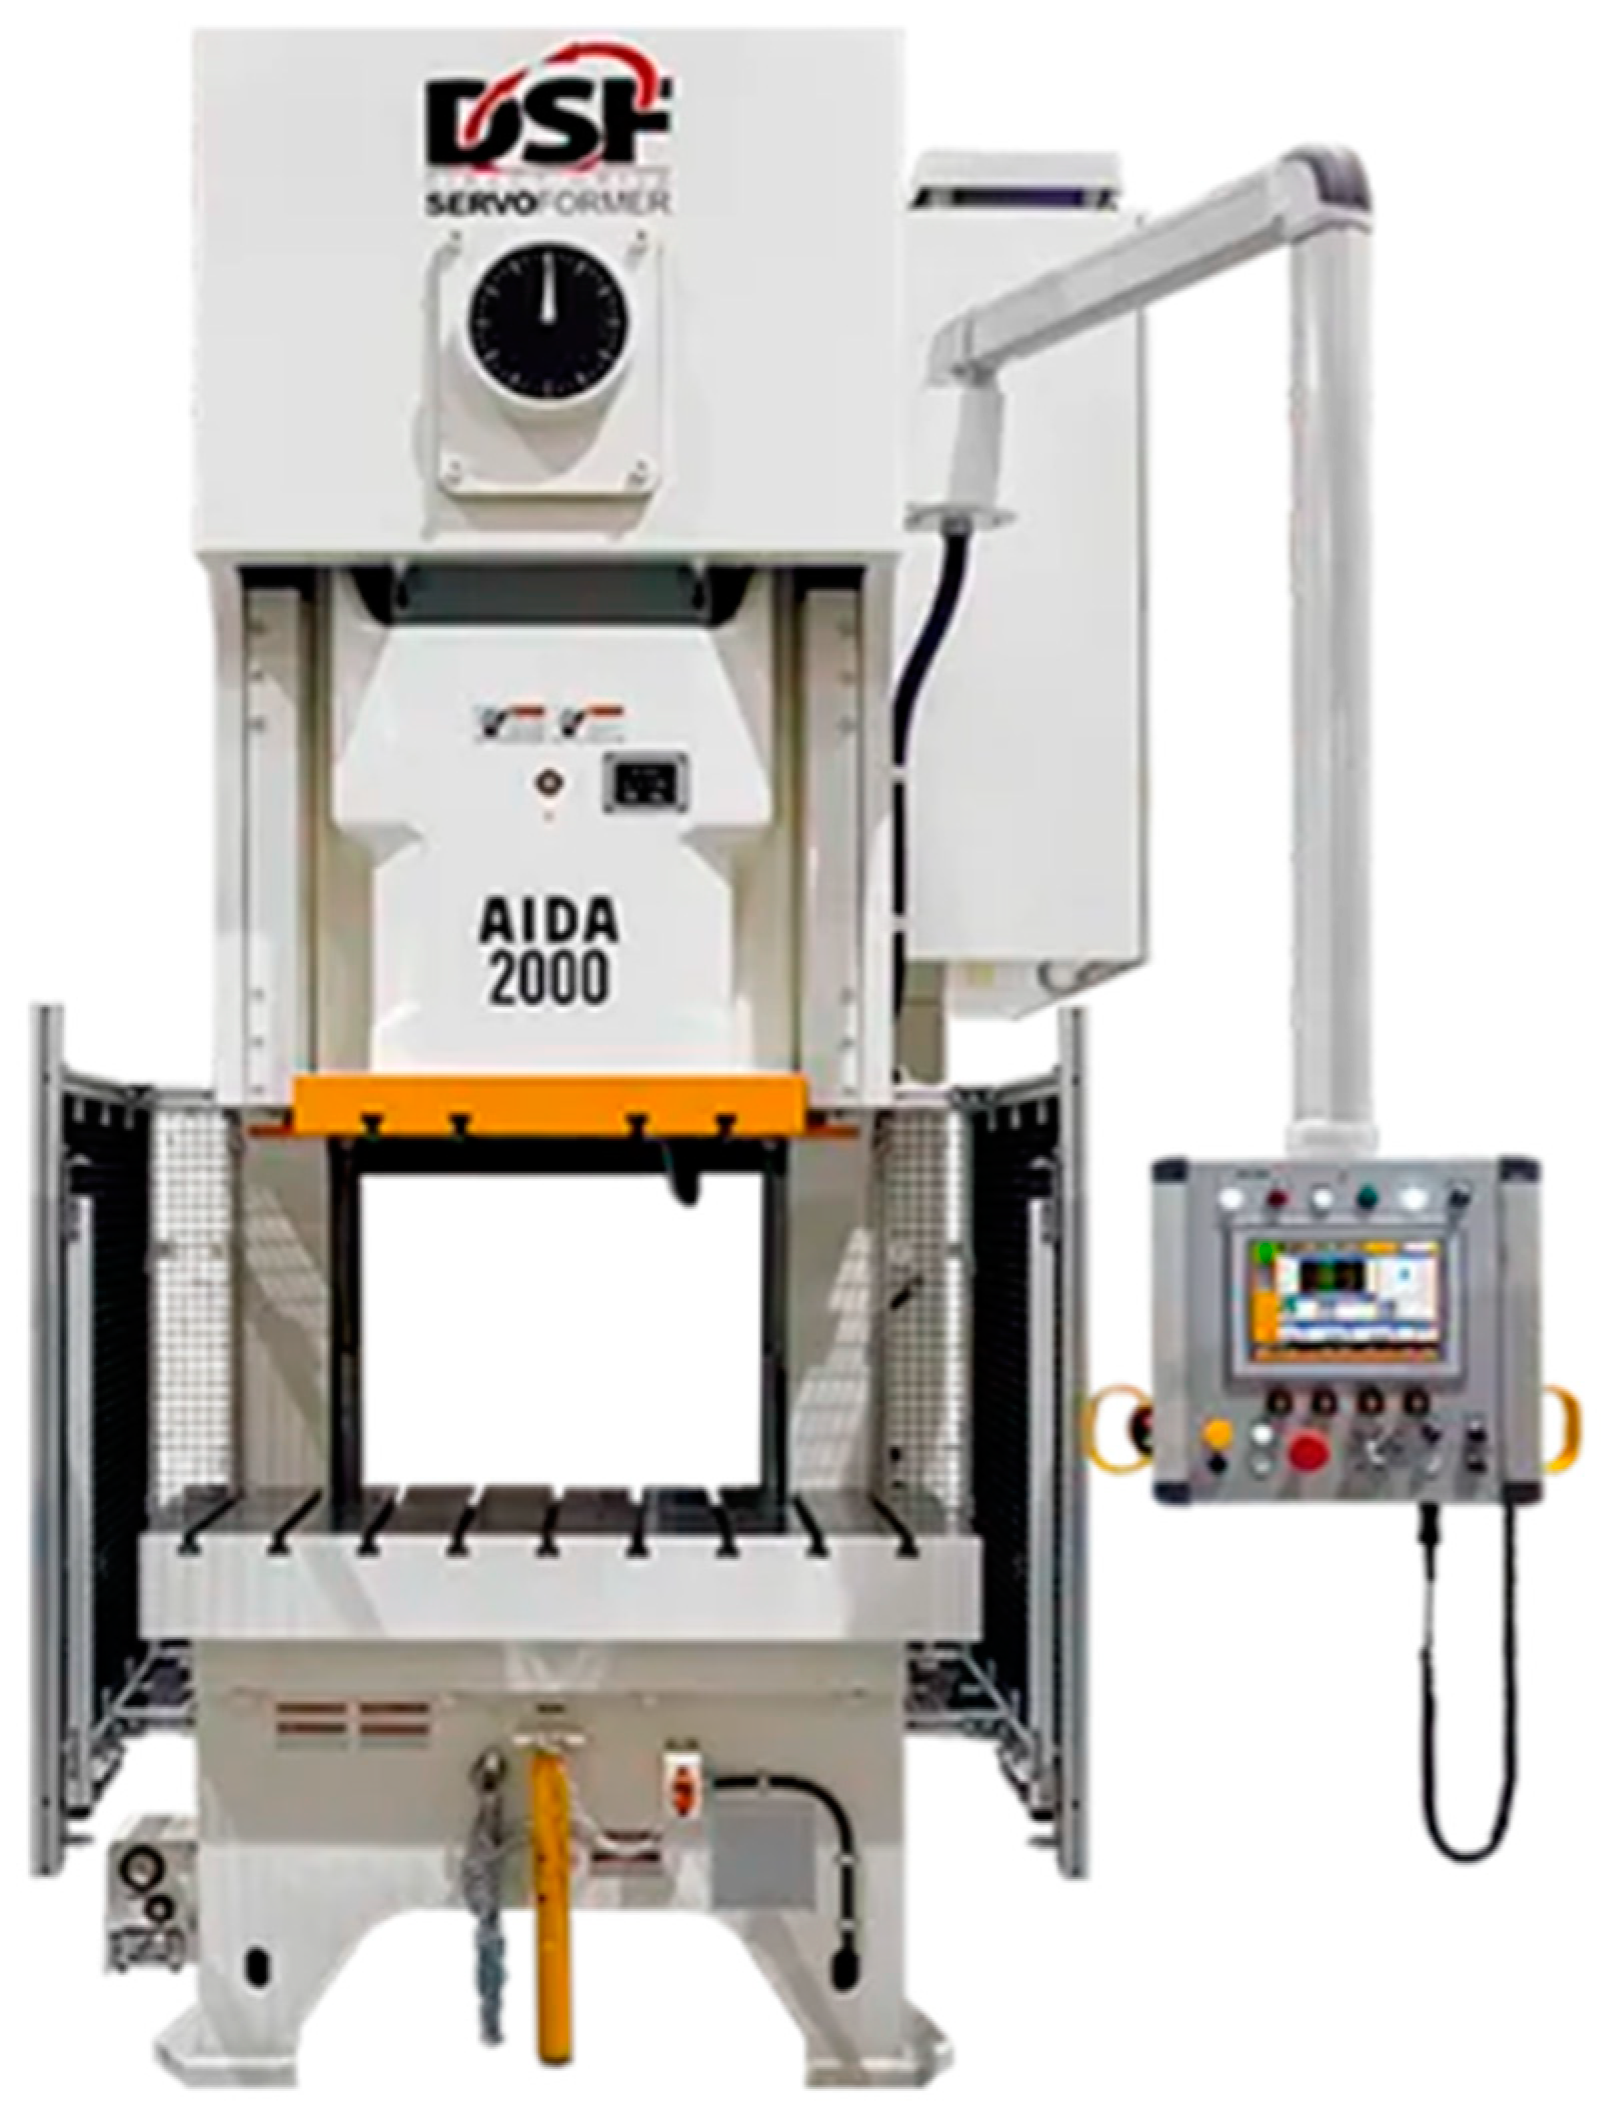
The 10 mm diameter holes were made using an DSF-C1-2000 machine (Aida Engineering Ltd., Sagamihara City, Japan), with a capacity of 2000 kN and a maximum stroke of 250 mm (see Figure 3). In addition, a Tecapres cylindrical punch, model TPF 11800C, was also used. A total of 5 repetitions were performed in each material.
As mentioned above, the aim of this study is to investigate the influence of punch velocity and die clearance parameters on the punching process to determine the optimal combination for different types of materials. To do that, design of experiments (DOE) techniques were used in order to reduce the number of the experiments. Consequently, three values were defined for each parameter based on the equipment capacity and the existing literature. A 22 factorial model with three central points and four additional star points was selected, giving a total of 11 runs. All the experiments were made for each material. Table 3 shows the selected design factors and their corresponding values. In addition, to ensure the reliability of the results, measurements of five die cuts were taken for each parameter combination. Similar parameters have been used in other studies, obtaining optimal results [7,27,28,29].

3. Characterization (K, n and Damage Parameters)

3.1. Tensile Tests

The parameters that are necessary to define the Johnson–Cook model, n and K, obtained from the tensile tests, are shown in Table 4.
The Johnson–Cook damage model is known to be related to the stress triaxiality, strain rate and temperature influence on the state of the material during a plastic deformation process through Equation (2):
ε f = [ D 1 + D 2 exp ( D 3 σ * ) ] ( 1 + D 4 ln ε ˙ * ) ( 1 + D 5 T * )
Since εf is the plastic strain equivalent to fracture, D1, D2, D3, D4 and D5 material constants and σ*, the stress triaxiality [20], it is possible to define a damage model sufficiently faithful to reality, obviating the influence of the strain rate (D4 = 0) and temperature (D5 = 0). ε ˙ * is the homologous strain rate and T* is the homologous temperature. This is the reason for using three different specimen geometries in the tensile tests.
To obtain the values of these three constants, Simufact Forming software was employed. It requires two or three different values of equivalent stress to fracture and triaxiality, each one of a sample geometry. The software then provides the parameters that define the accumulated damage in the parts D1, D2 and D3. The values of triaxiality and effective plastic deformation must be recorded in the crack zone [30]. For this purpose, the stroke traveled by each of the samples until cracking is recorded and this stroke value is the one used to obtain the values of plastic deformation and triaxiality in the simulations.

3.2. Damage Model

The information obtained from the material characterizations was used to simulate the tensile tests on the sample specimens to characterize the damage and fracture.

3.2.1. Geometry and Meshing

The bodies that will interact during the simulations, the grips that hold the samples and the samples with the three different geometries must be defined. The connection between the grips and the samples was defined as a glued contact.
The force required for the tension tests is produced by a hydraulic press and two infinitely rigid grips, 5 mm in height, 5.5 mm in width and 30 mm in length, that were defined to hold the samples. The movement speed was set at 1667 mm/s, which is the maximum working speed of the press and therefore the closest to the real working one. Furthermore, the movement is limited by a maximum stroke, which must be defined. The stroke was defined with different values for each sample geometry, since in the tensile tests the strokes were quite different. In the case of conventional tensile samples, the stroke was set at 35 mm, in the case of notched samples, at 10 mm and in the case of shear samples, at 12 mm.
The meshing was performed with an Advancing Front Quad-type mesher, which produces a 2D mesh based on Plain Strain-type elements Quad 4, which uses quadrilateral elements to simulate plane strain. The meshes of the different specimens are shown in Figure 4.
The element size, which is a critical parameter for the simulations, was defined as 1 mm. In this way, 3311 elements were obtained for the conventional tensile test samples, 2190 elements for the notched samples and 7315 elements in the shear samples.
The complex geometry of the shear samples requires defining a higher number of elements for the simulation to converge. The minimum element size was defined as one fifth of the element size defined above, i.e., 0.2 mm.

3.2.2. Definition of the Damage Model

With the values of n and K obtained from the tensile tests, the necessary simulations were carried out to obtain the equivalent stress and triaxiality values at the moment of fracture. In the simulations, the strokes were defined with values greater than those of the real tests, and therefore, the real stroke had to be calculated in each of the cases.
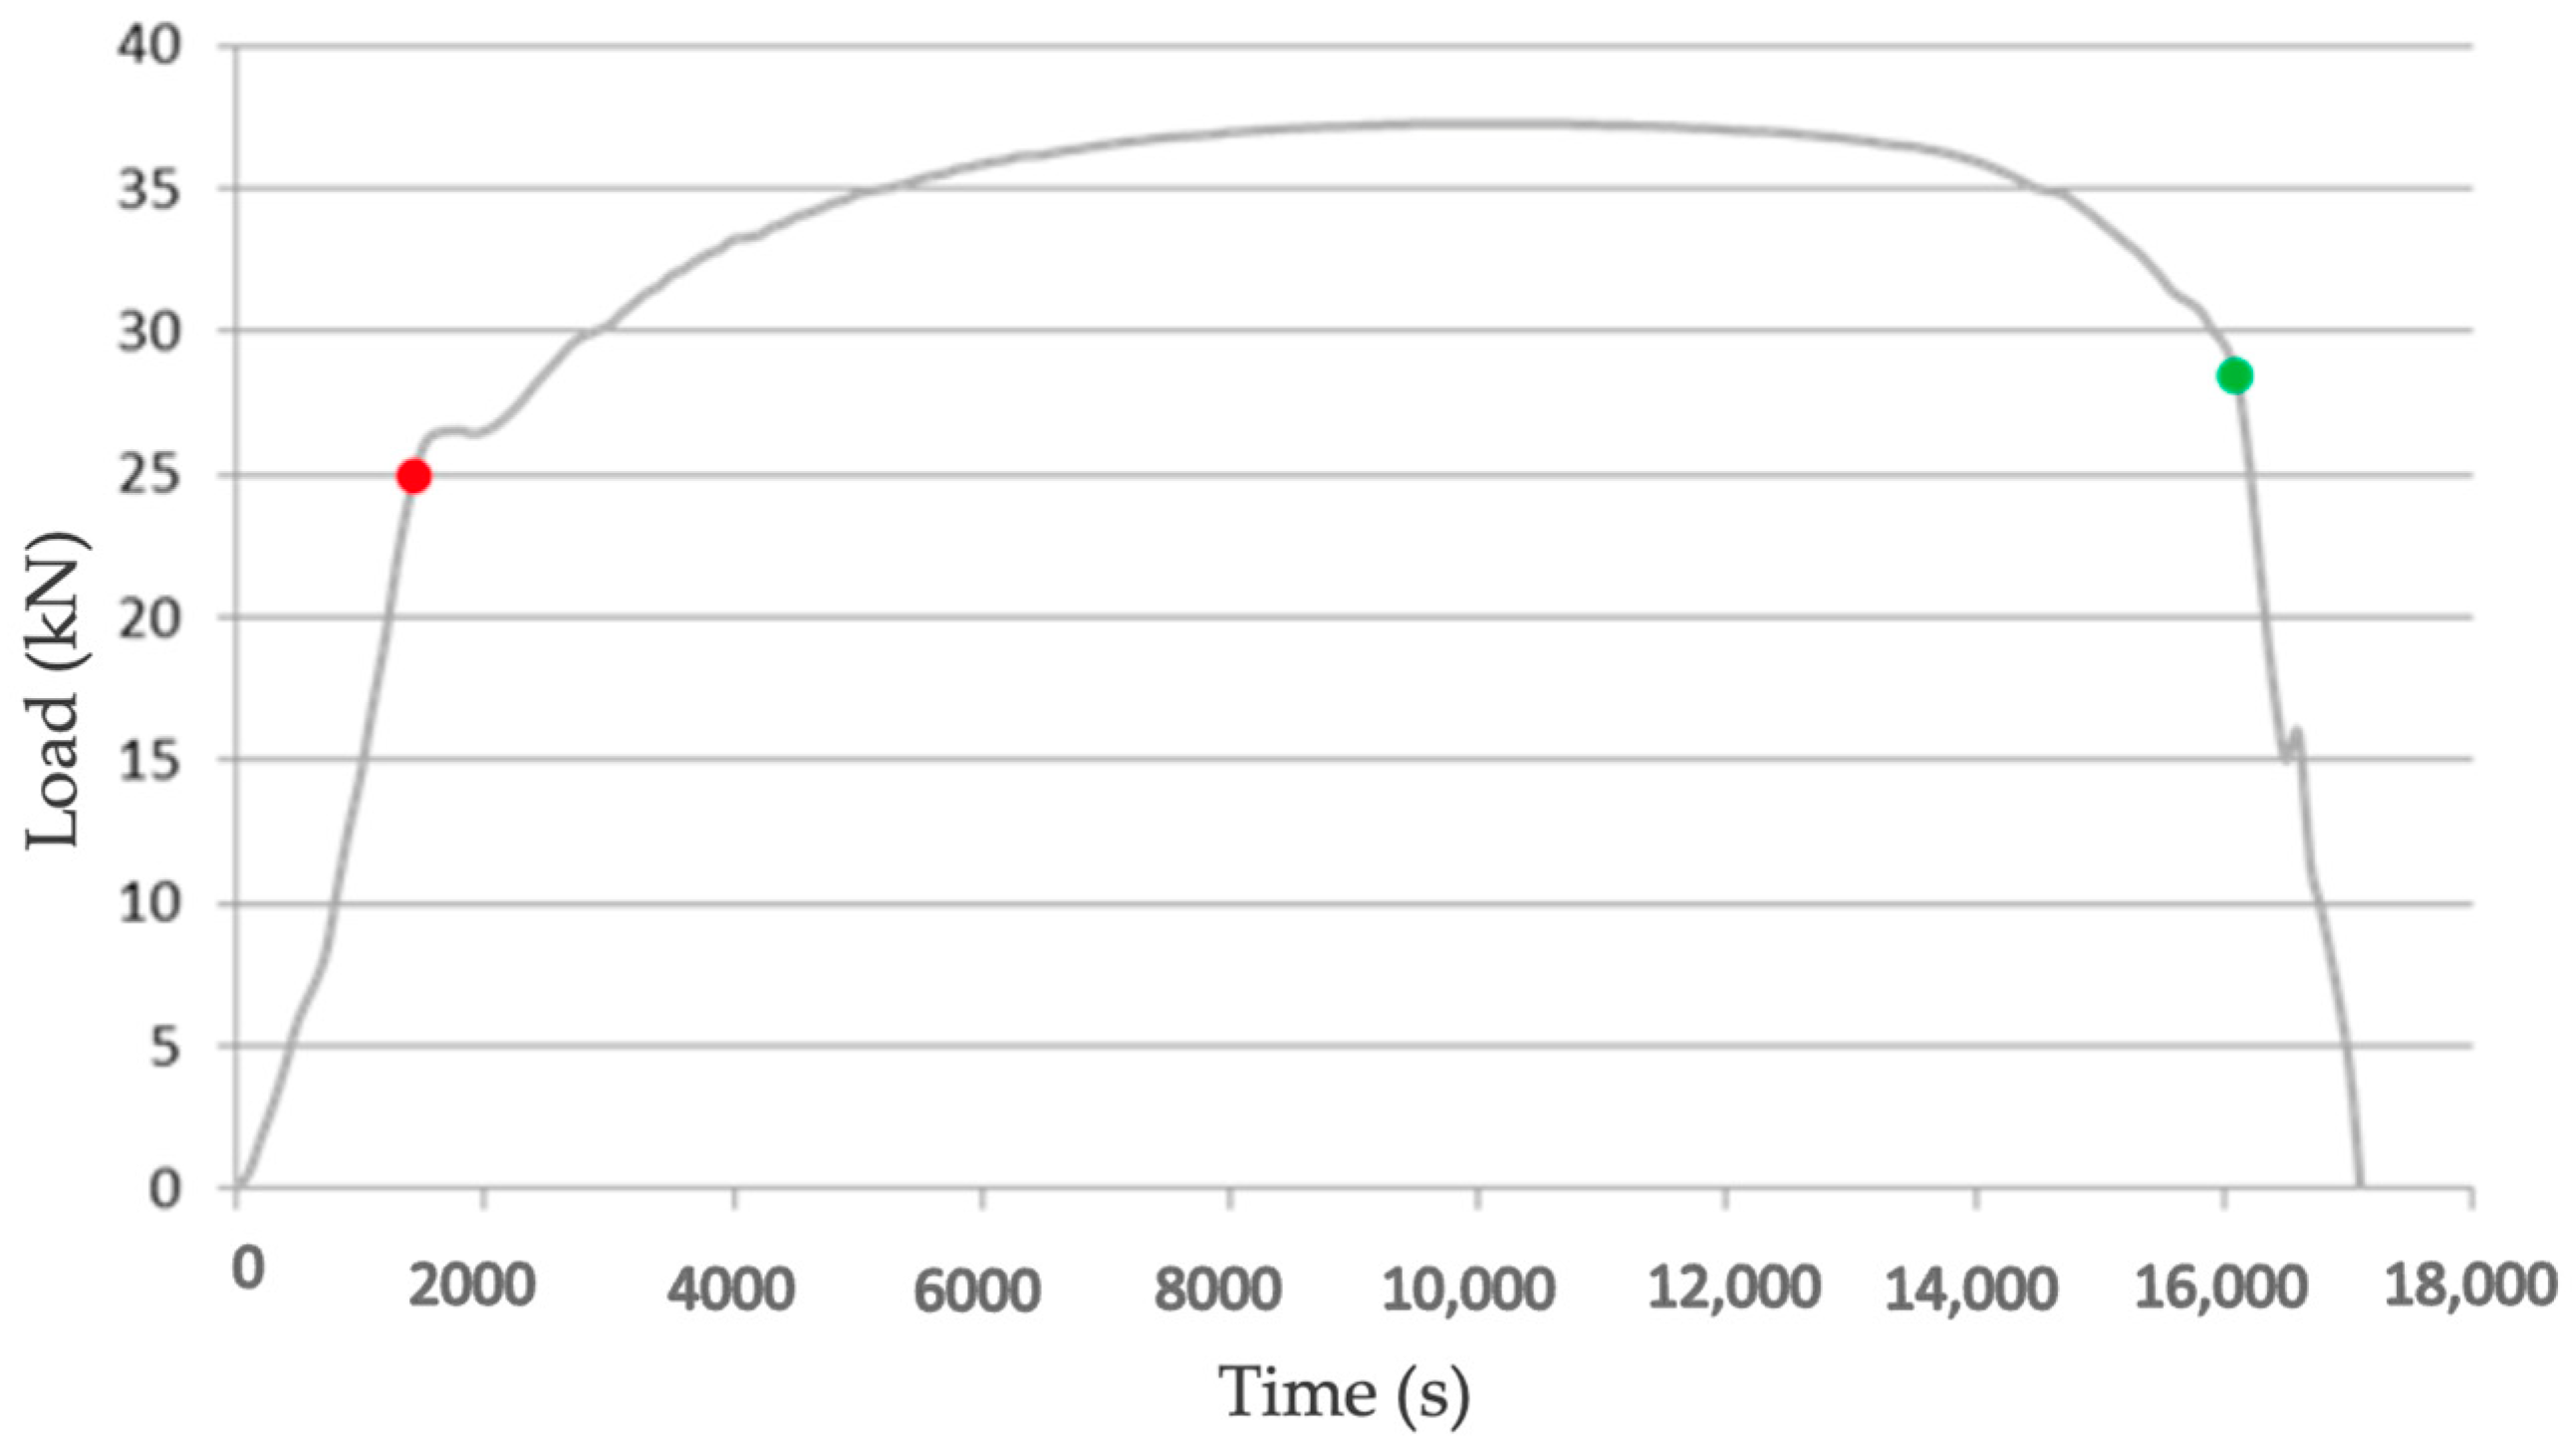
To obtain the stroke values for each of the tensile tests, the elastic zone of the curve was omitted and the section defined between the green and red planes of the graph in Figure 5 was taken.
The red point shows the point from which plastic deformation begins and, therefore, the stroke begins to be measured. On the other hand, the green point indicates the point where the fracture of the sample is estimated, that is the end of the useful stroke. The stroke values required to obtain the equivalent fracture resistance and triaxiality values from the simulations are shown in Table 5:
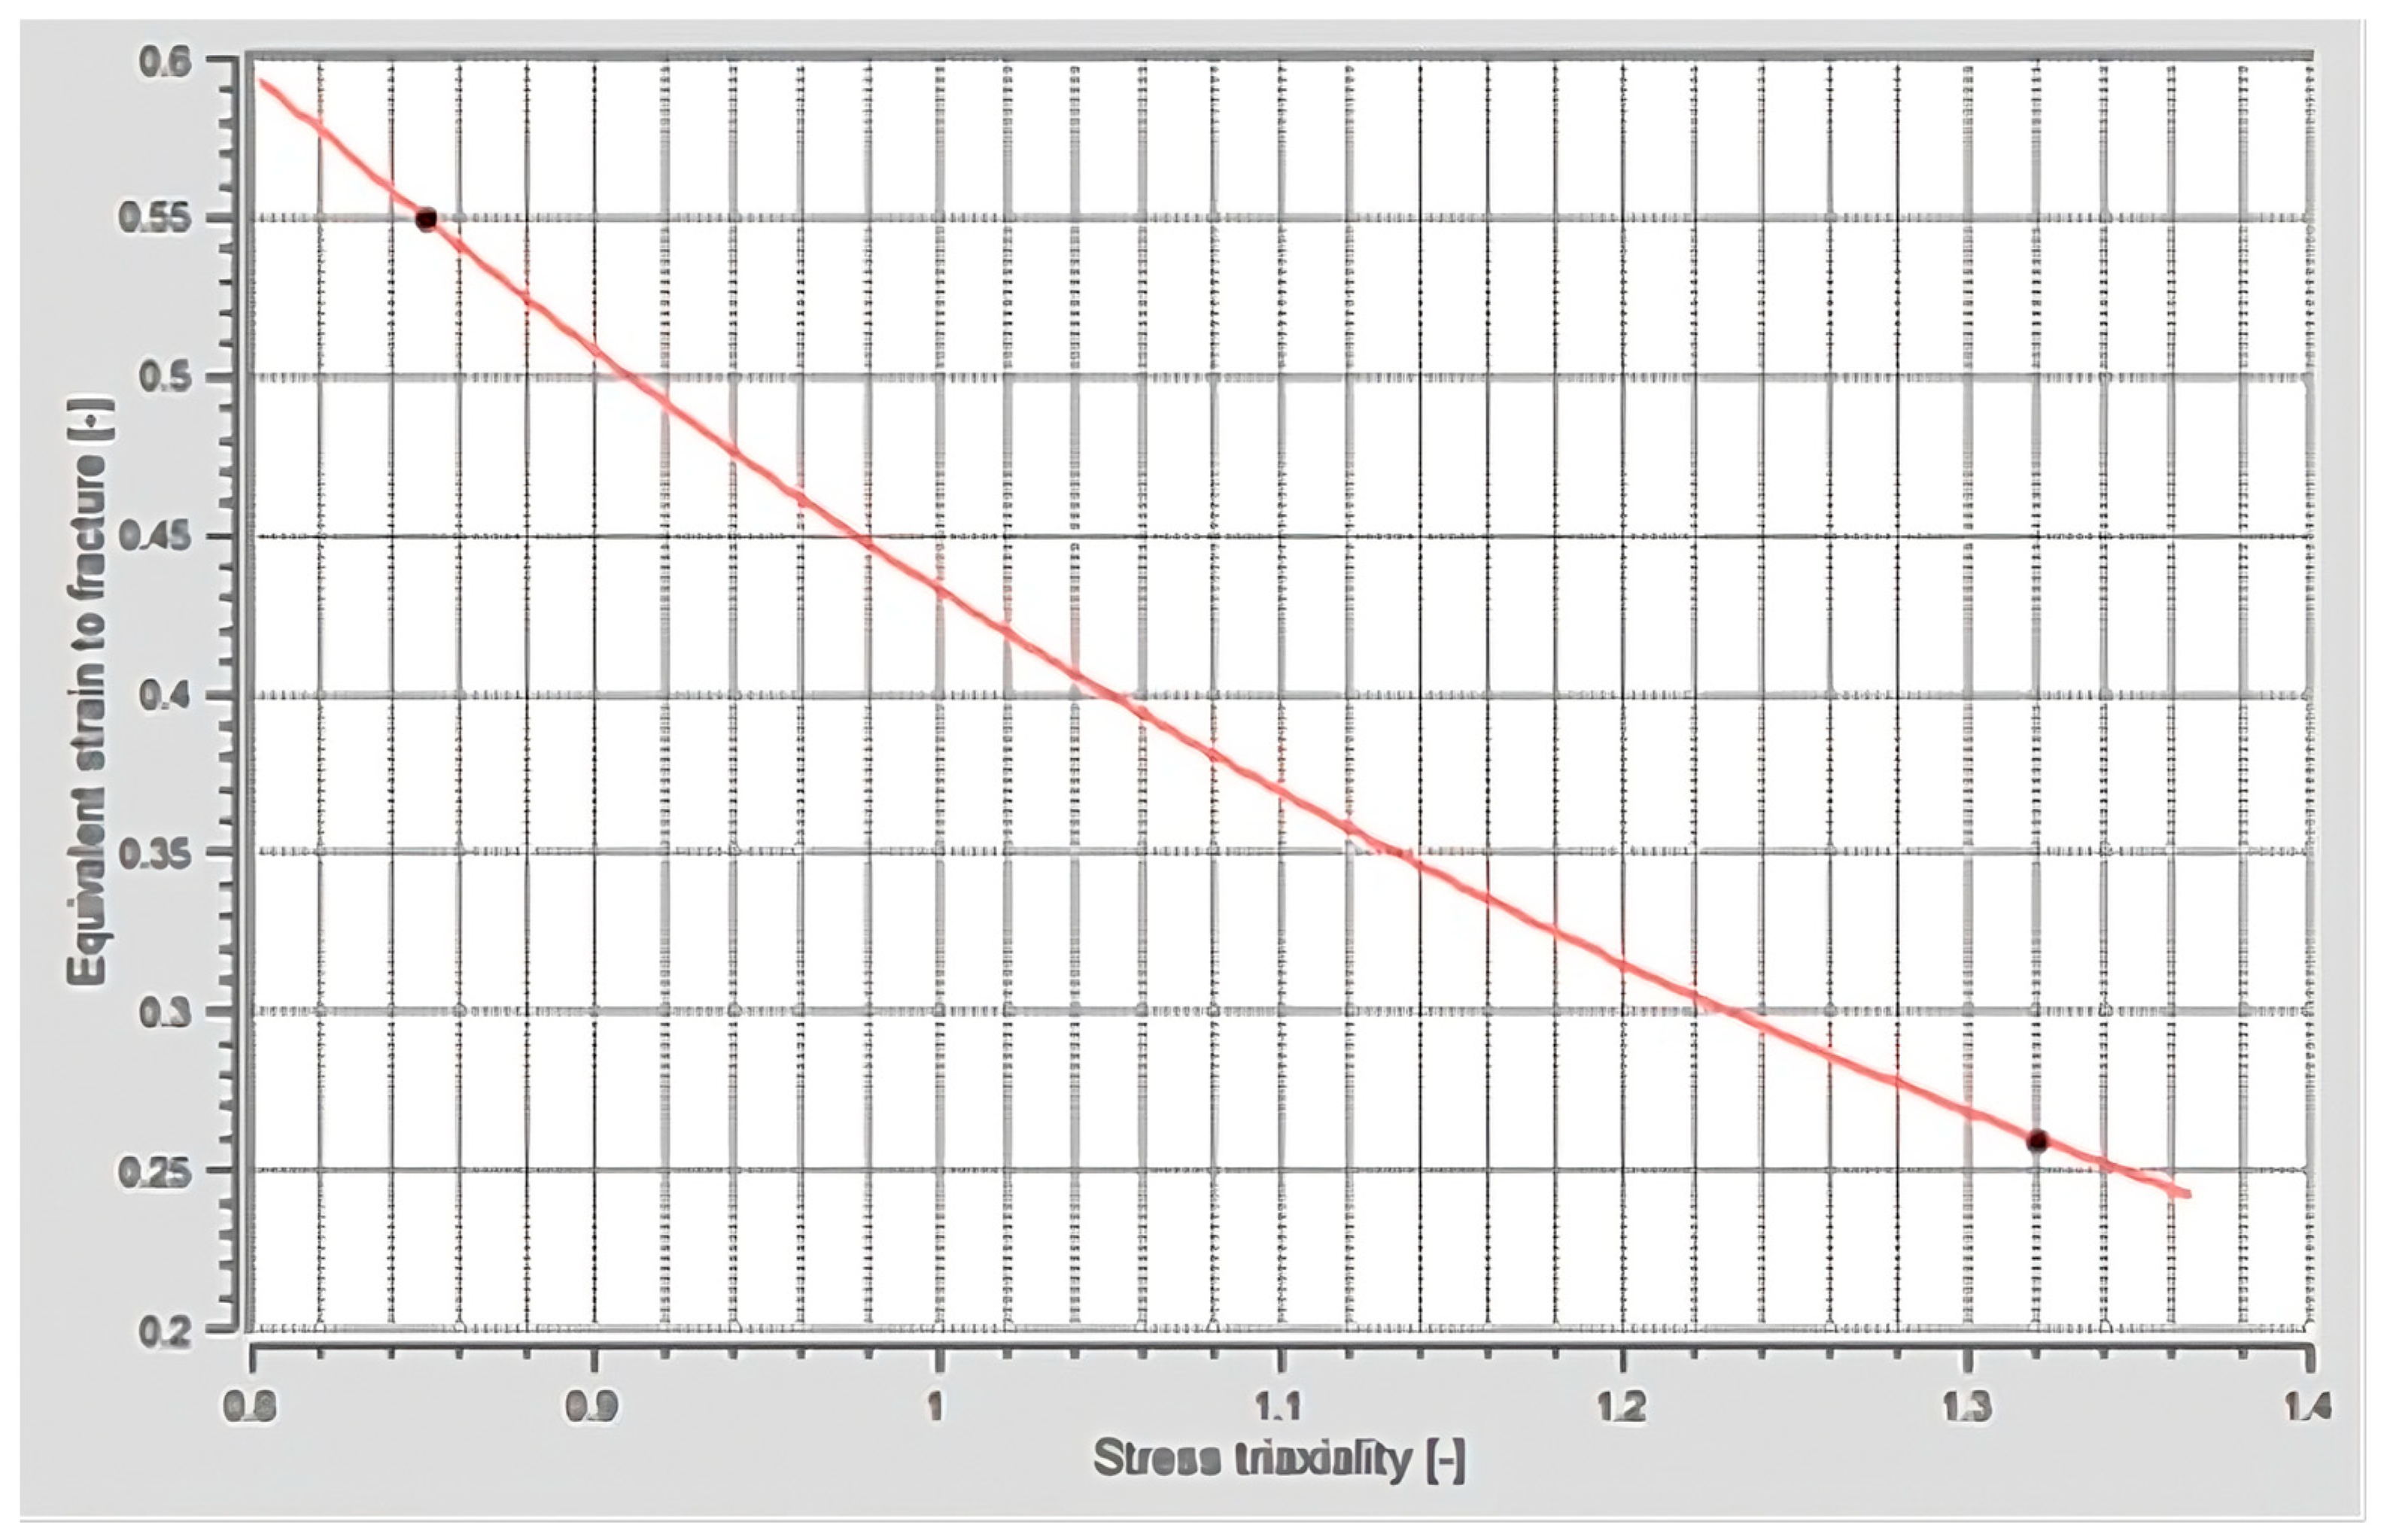
With the stroke values obtained, it was possible to determine the triaxiality and equivalent strain values for each of the materials, as shown in Table 6. With these points, the curve was defined as shown in Figure 6.
The Johnson–Cook model constants obtained are observed in Table 7:

3.2.3. Damage

With the previously defined stroke time, it was possible to know the damage accumulated by the specimen at the moment of rupture and to be able to define a rupture criterion in the simulation. For this purpose, the Johnson–Cook model was defined with the values of triaxiality and strain equivalent to fracture determined from the notched and shear samples. In addition, it is possible to determine a parameter called the damage exponent (n) to relate the accumulated damage to the plastic deformation. This parameter defines how damage accumulation occurs in the material [30]. If n = 1, the relationship is linear and therefore the growth at the beginning of the forming process is too large, which can lead to a misinterpretation of the location of the onset of damage [30]. Therefore, a value of n = 2 was used in this case. The damage is accumulated incrementally using the following equation:
D = ΣΔD = Σ (nD (1−1/n) (Δεp/n εf))
Since εf is the plastic strain equivalent to fracture, Δεp is an increment of the equivalent plastic strain, D is the accumulated damage and n is the damage exponent.
In this study, the value at which a macro-crack occurs (Dc) is less than one. Therefore, the failure criterion is now [31]:
D = Dc ≤ 1
To obtain the value of the maximum damage accumulated by the material or the critical damage (Dc), the rupture stroke obtained previously must be used. In this way, it will be possible to estimate the maximum damage values supported by the samples, that is to say, when a crack will occur causing its rupture. These values are reported in Table 8.
The maximum damage obtained varied depending on the type of sample used. Notched and shear samples showed damage values ranging from 0.8 to 1, while tensile specimens showed damage values between 0.1 and 0.35. Since this value defines the maximum damage value that the material can withstand before starting to break, it was decided to work with the maximum damage value obtained for the tensile specimens. In this way, the most restrictive case was studied.

3.2.4. Simulation: Mesh Spacing Criteria

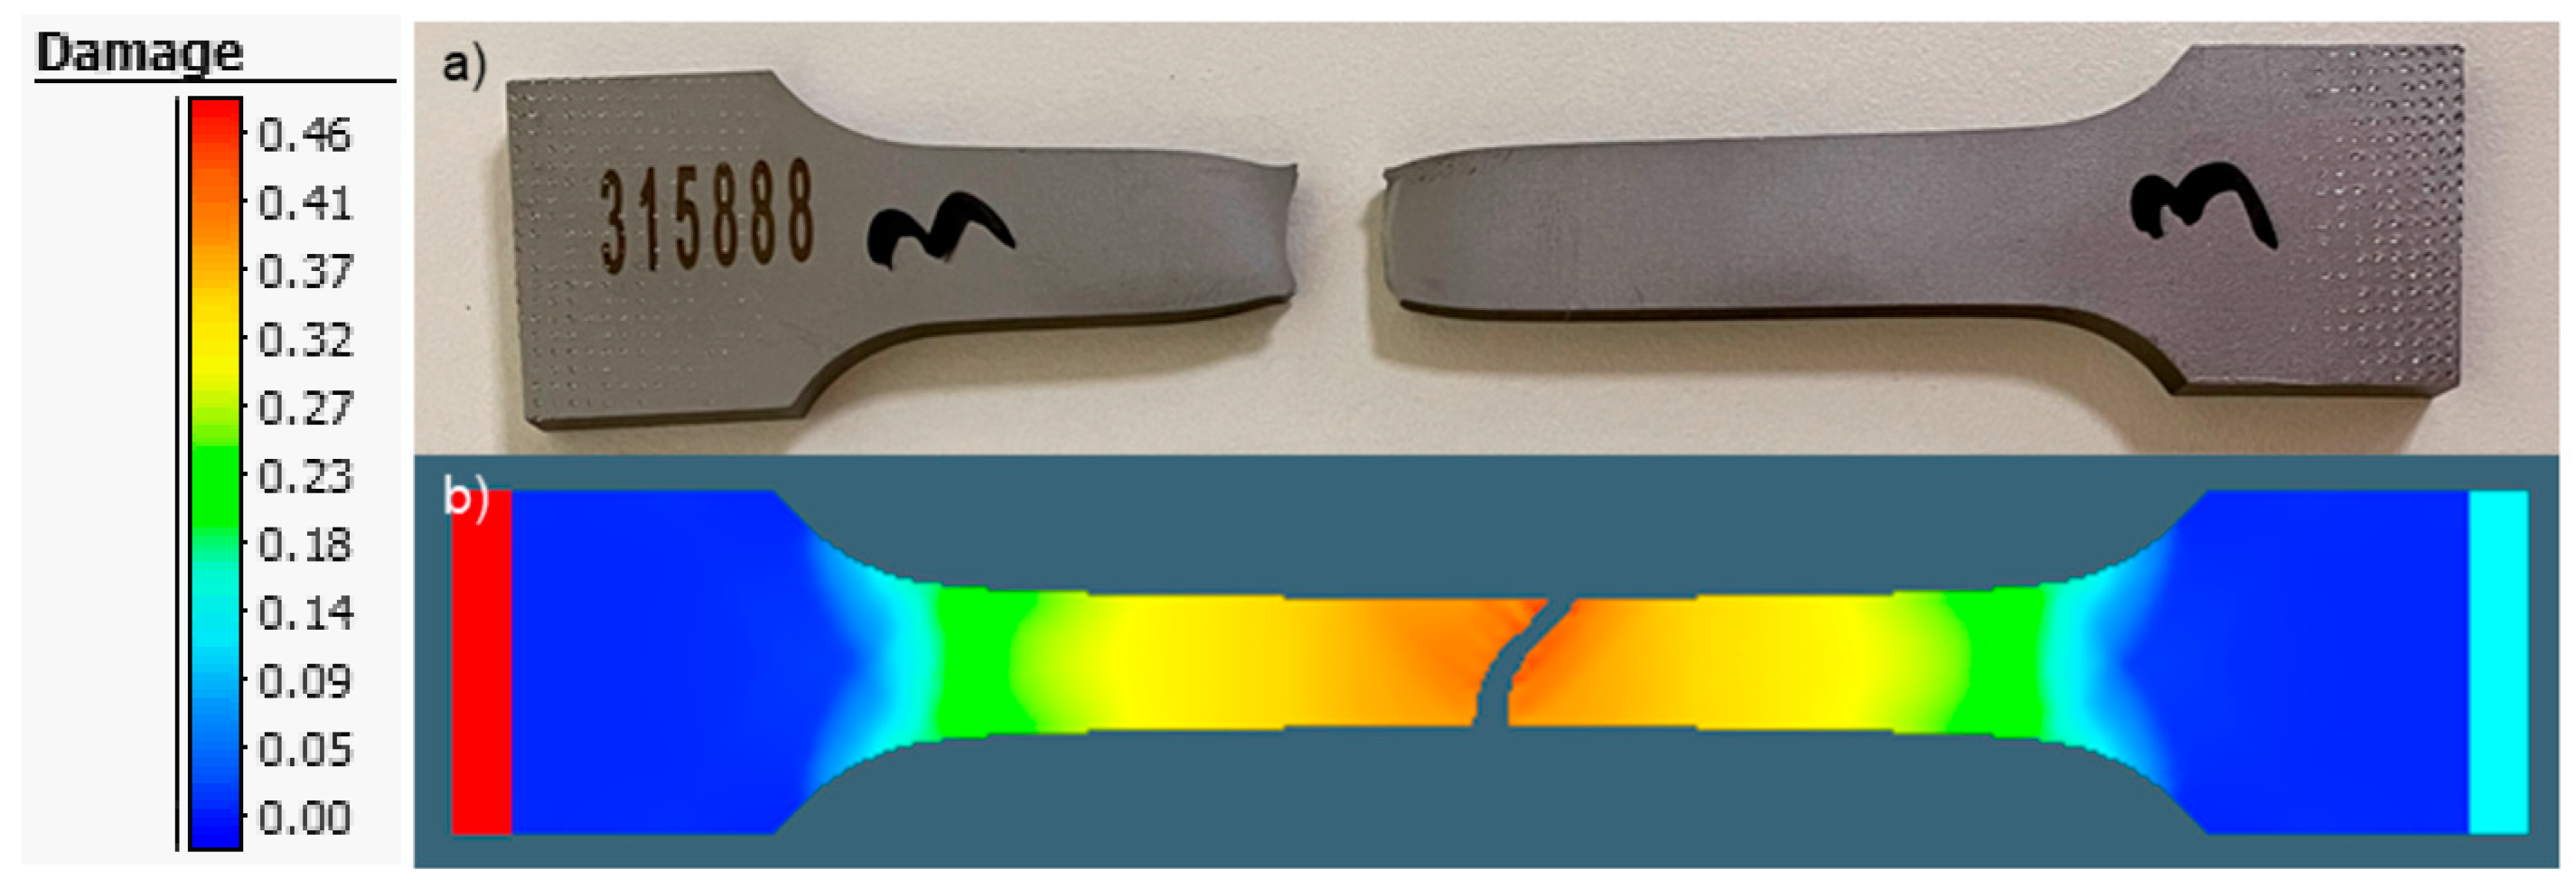
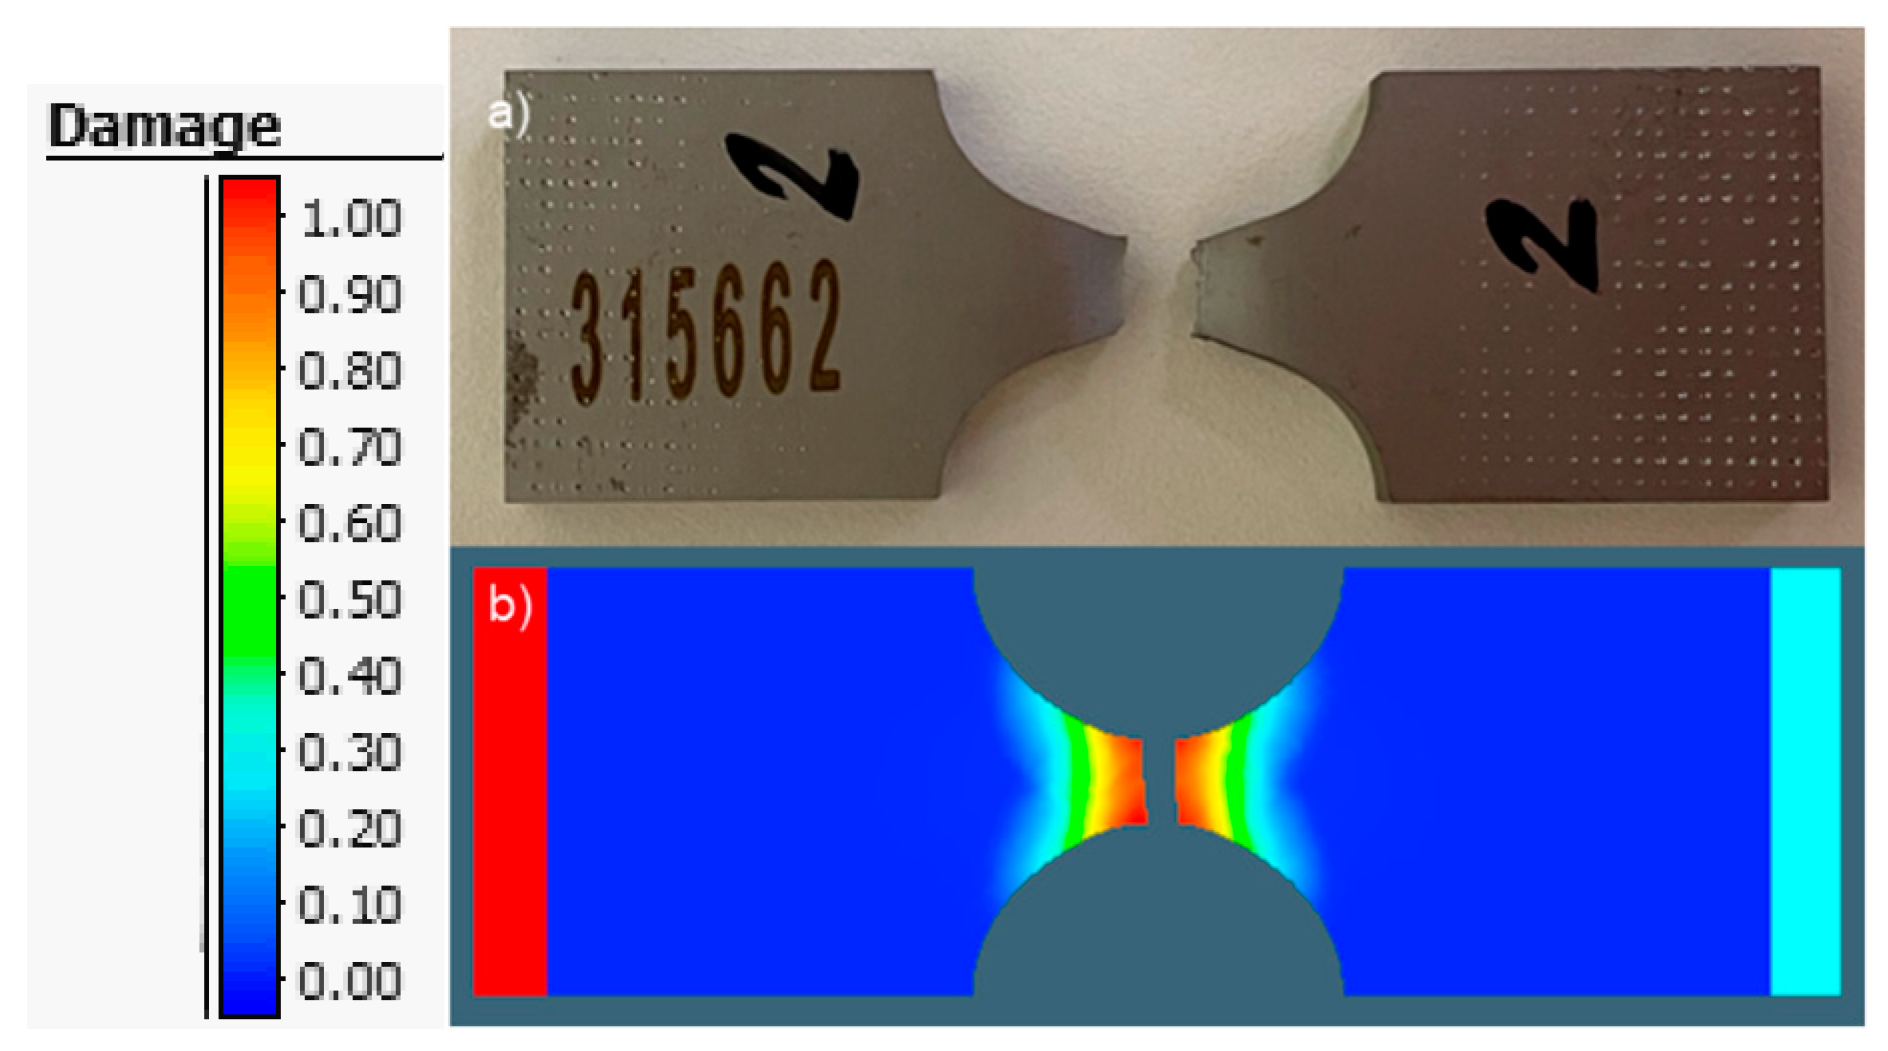
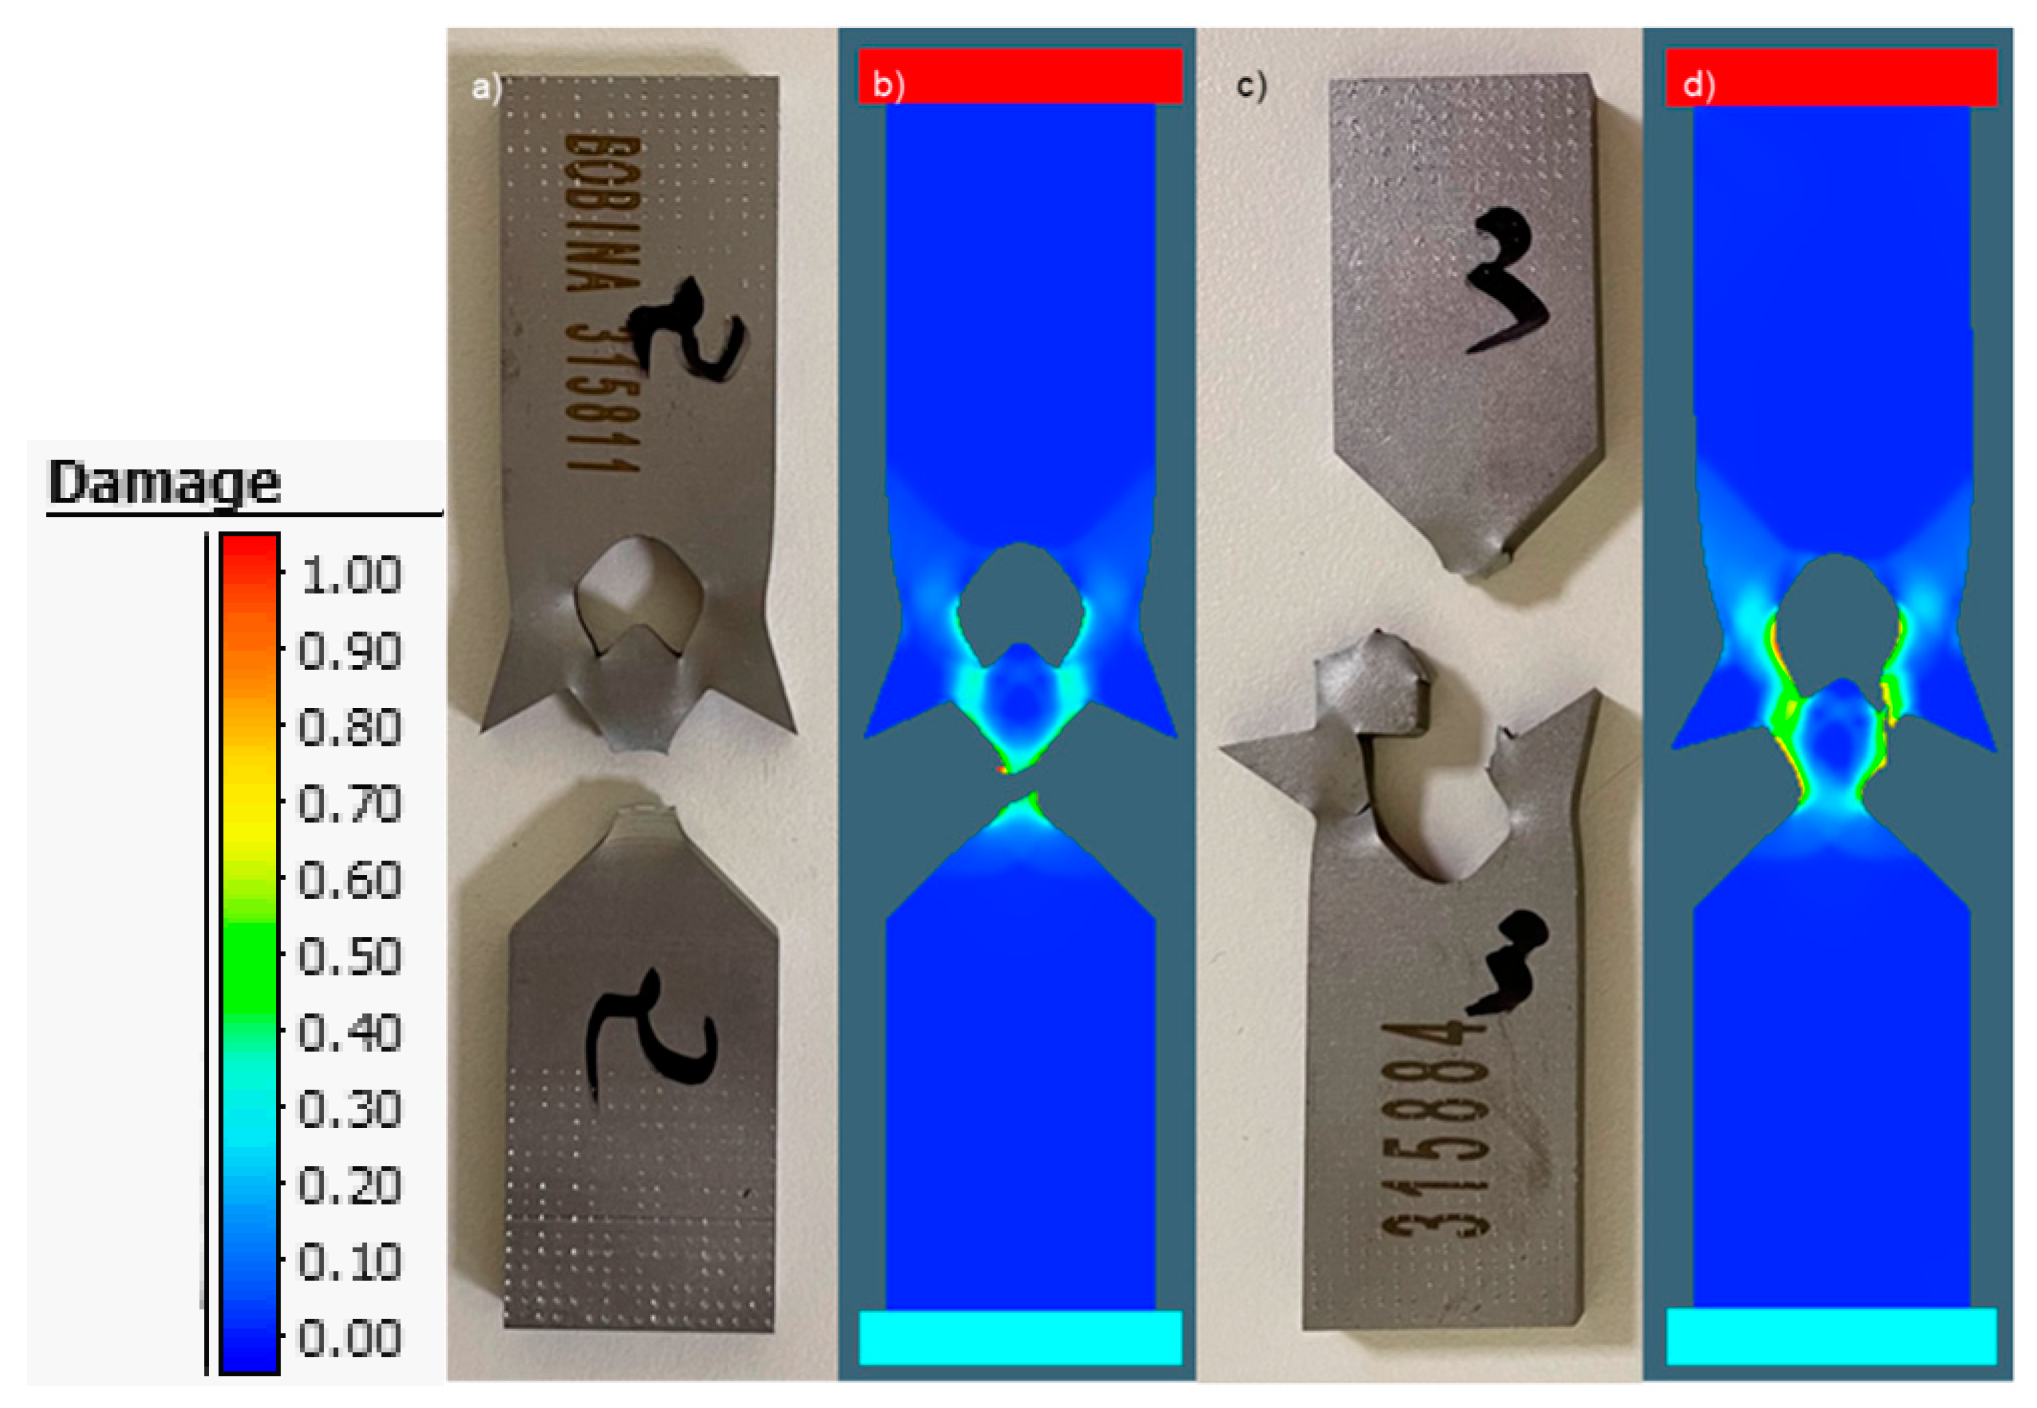
To simulate the rupture of the samples, the mesh spacing criterion was established with a possible number of cracks set at three—in the tensile and notched specimens this is not significant, but it is in the shear specimens—and the crack propagation angle set at 25°. When an integration point reaches the critical damage value (Dc), the neighboring nodes separate producing the crack modeling. The results obtained with this criterion are shown in Figure 7, Figure 8 and Figure 9 for the conventional tensile samples, notched samples and shear samples. Damage distribution (D) is shown in the simulation image (Figure 7, Figure 8 and Figure 9b) of each figure.
As can be seen, the results were very similar to those obtained in the real tests. Moreover, the strokes in this simulation case were analyzed and the results were compared with those determined in the real tests, as shown Table 9.
After analyzing the results obtained in this section, it was decided to use this breakage criterion, with the indicated limits, to carry out the simulations of the die-cutting process.

4. Results

In this section, the results obtained from experimental and simulation punching are presented. Additionally, a final comparison has been conducted to verify that the methodology employed is correct and can be extrapolated to other types of die-cutting processes.

4.1. Experimental Results

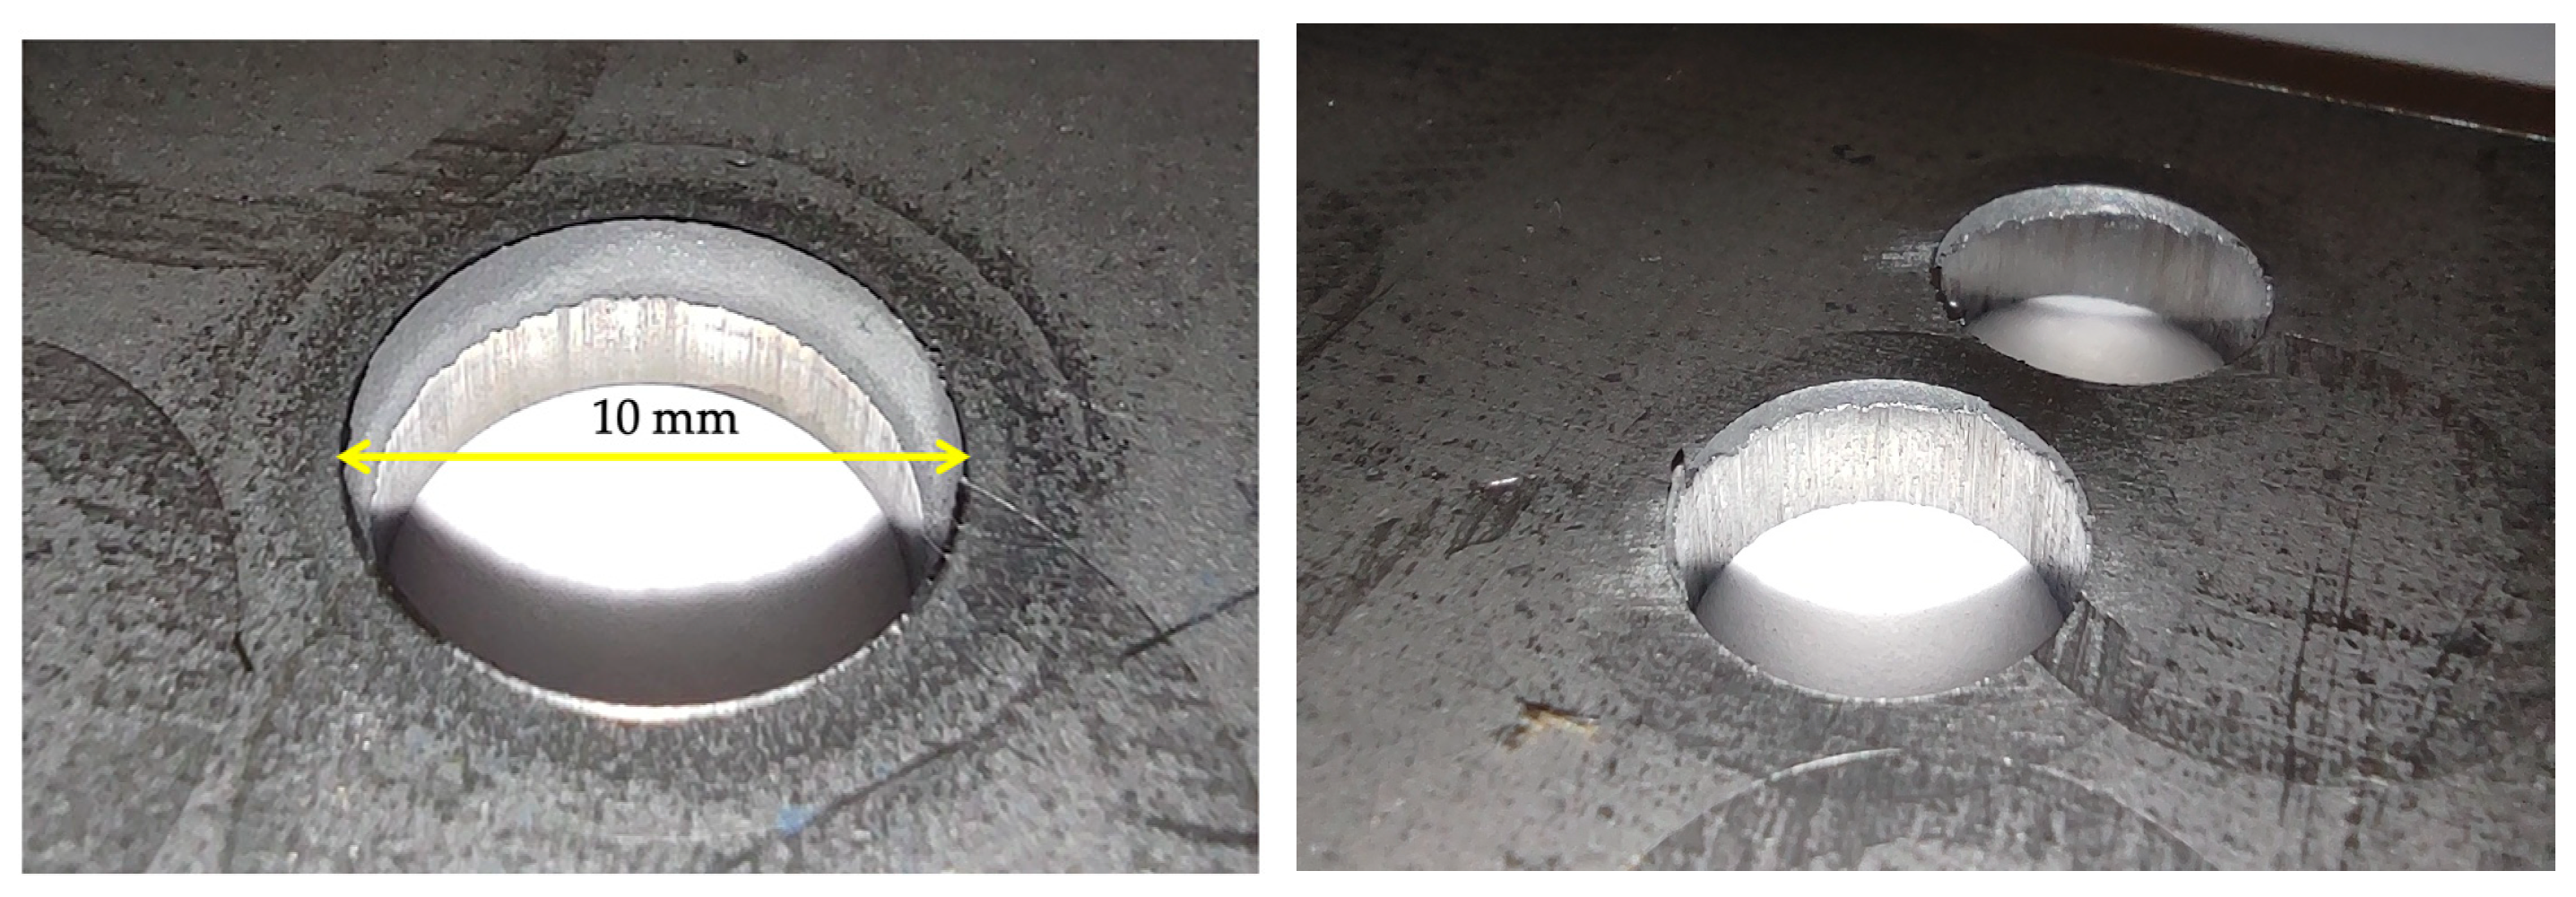
The percentage of burnish area has been analyzed based on measurements from individual photographs according to the methodology described earlier. Thus, Figure 10 shows some holes obtained through the experimental punching tests.
The experimental results obtained can be observed in Table 10.
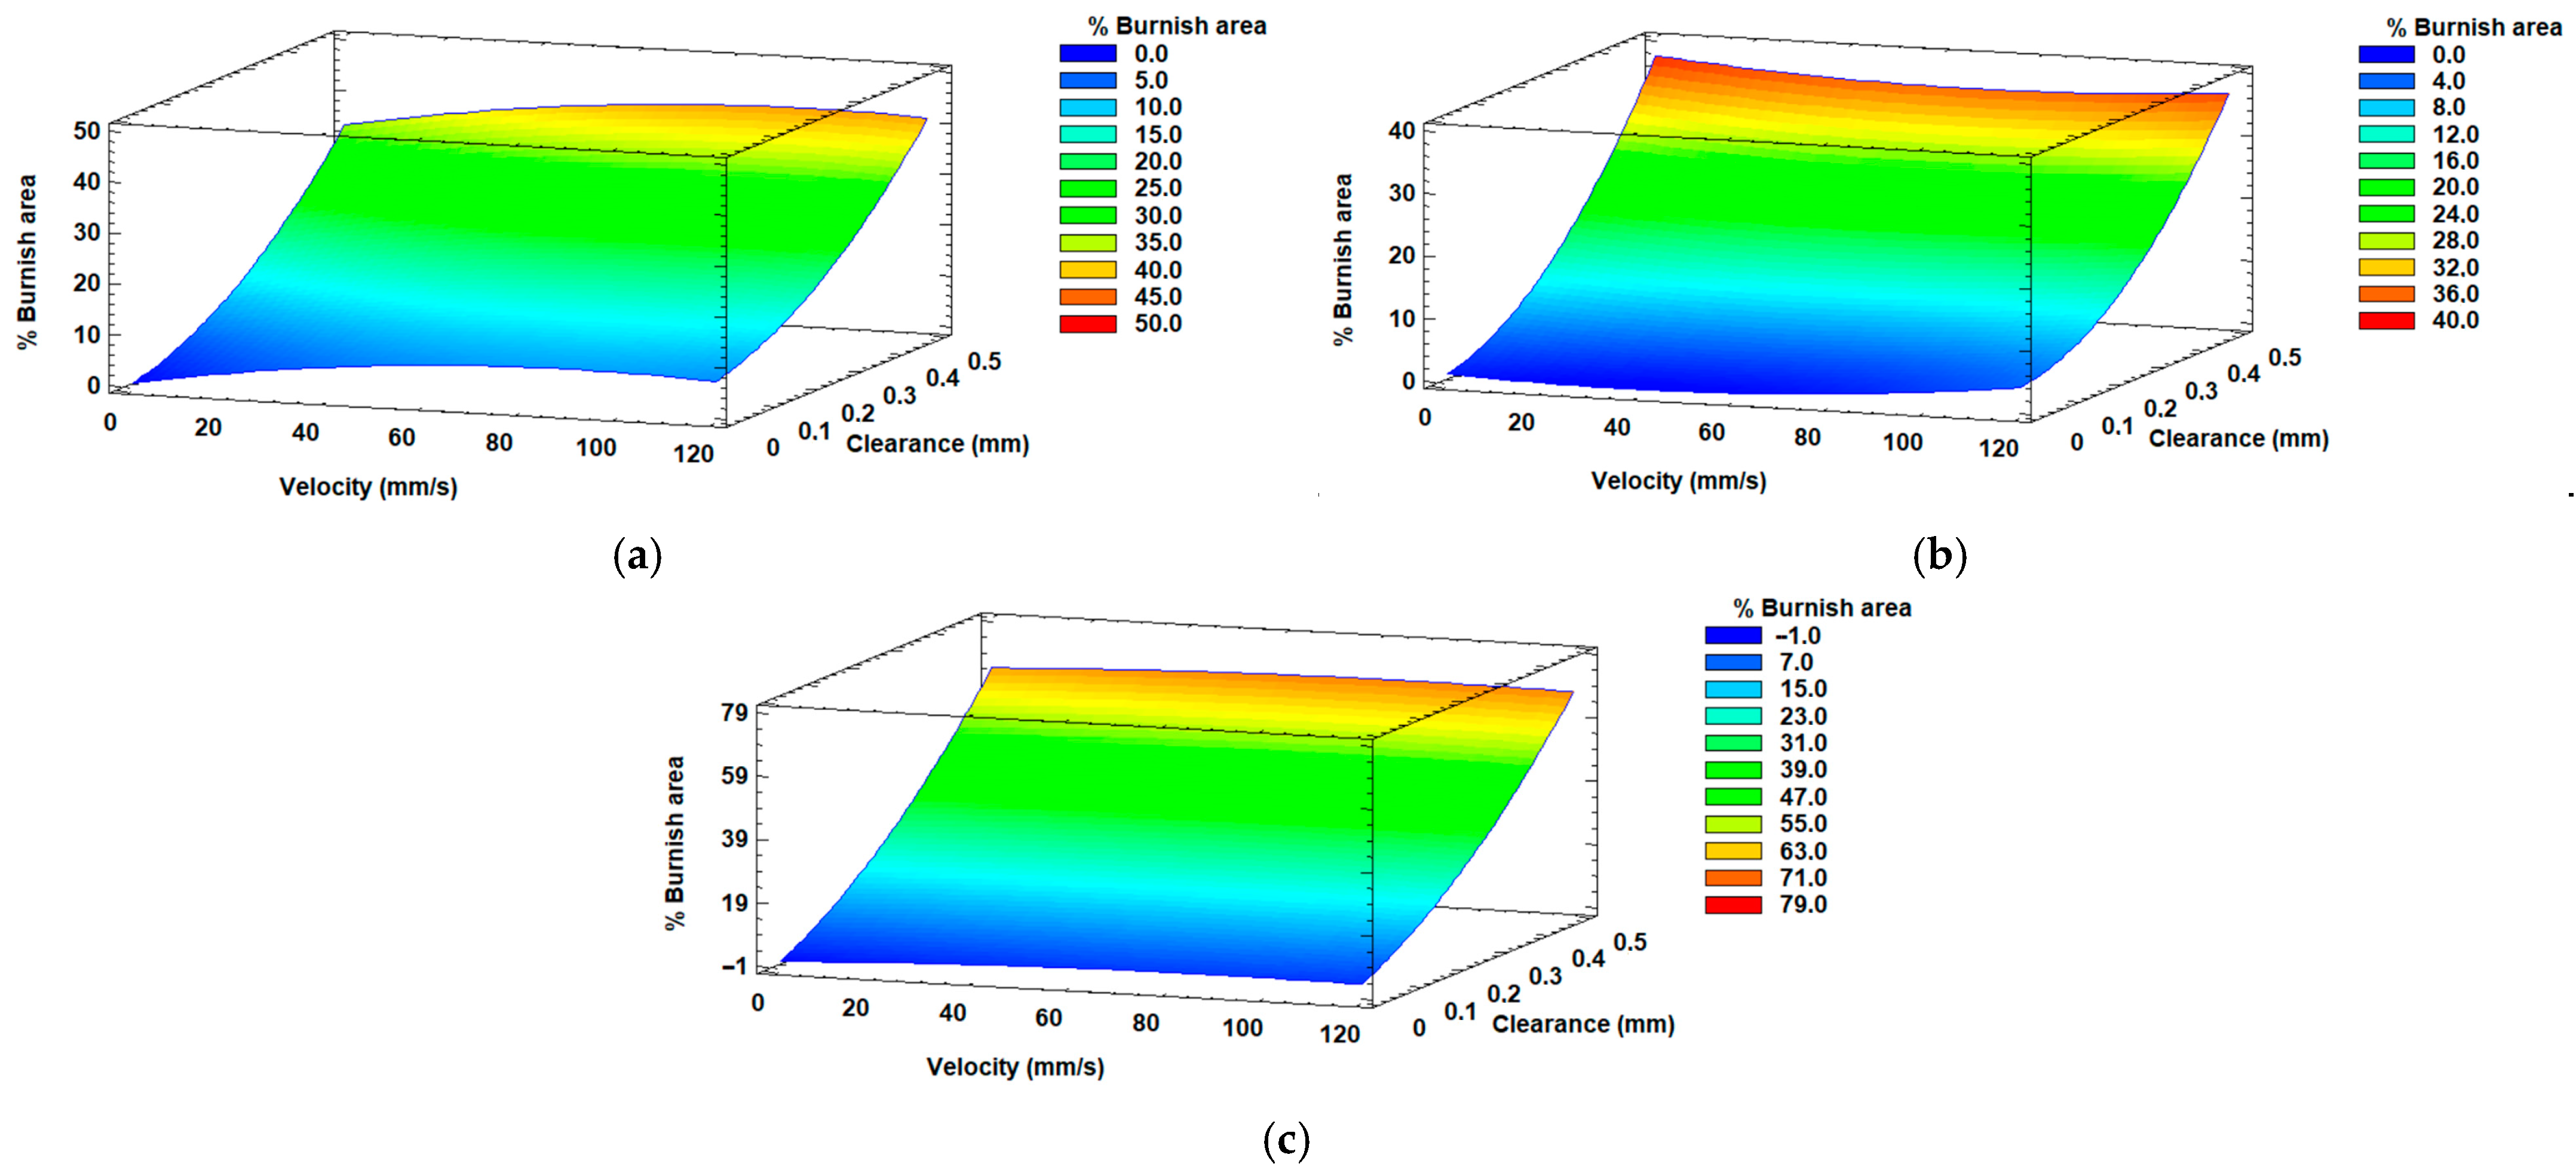
Figure 11 shows the estimated response surface of burnish area vs. velocity and clearance for (a) steel 1, (b) steel 2 and (c) steel 3. In general terms, for the three types of steel, there is a tendency for the burnish area to increase for any value of the velocity as a function of the clearance.
In addition, in the case of steel 1, the R2 statistic has a value of 98.3684, whereas the R2adj value is 96.7367. For steel 2, the R2 and R2adj values are 99.6555 and 99.3109, respectively. Finally, for steel 3, the values for R2 and R2adj are 99.7624 and 99.5249, respectively. Based on these results, it can be seen that, for the three steel cases, the models obtained are good enough to characterize the relationship between velocity and clearance parameters and the burnish area.

4.2. FEM

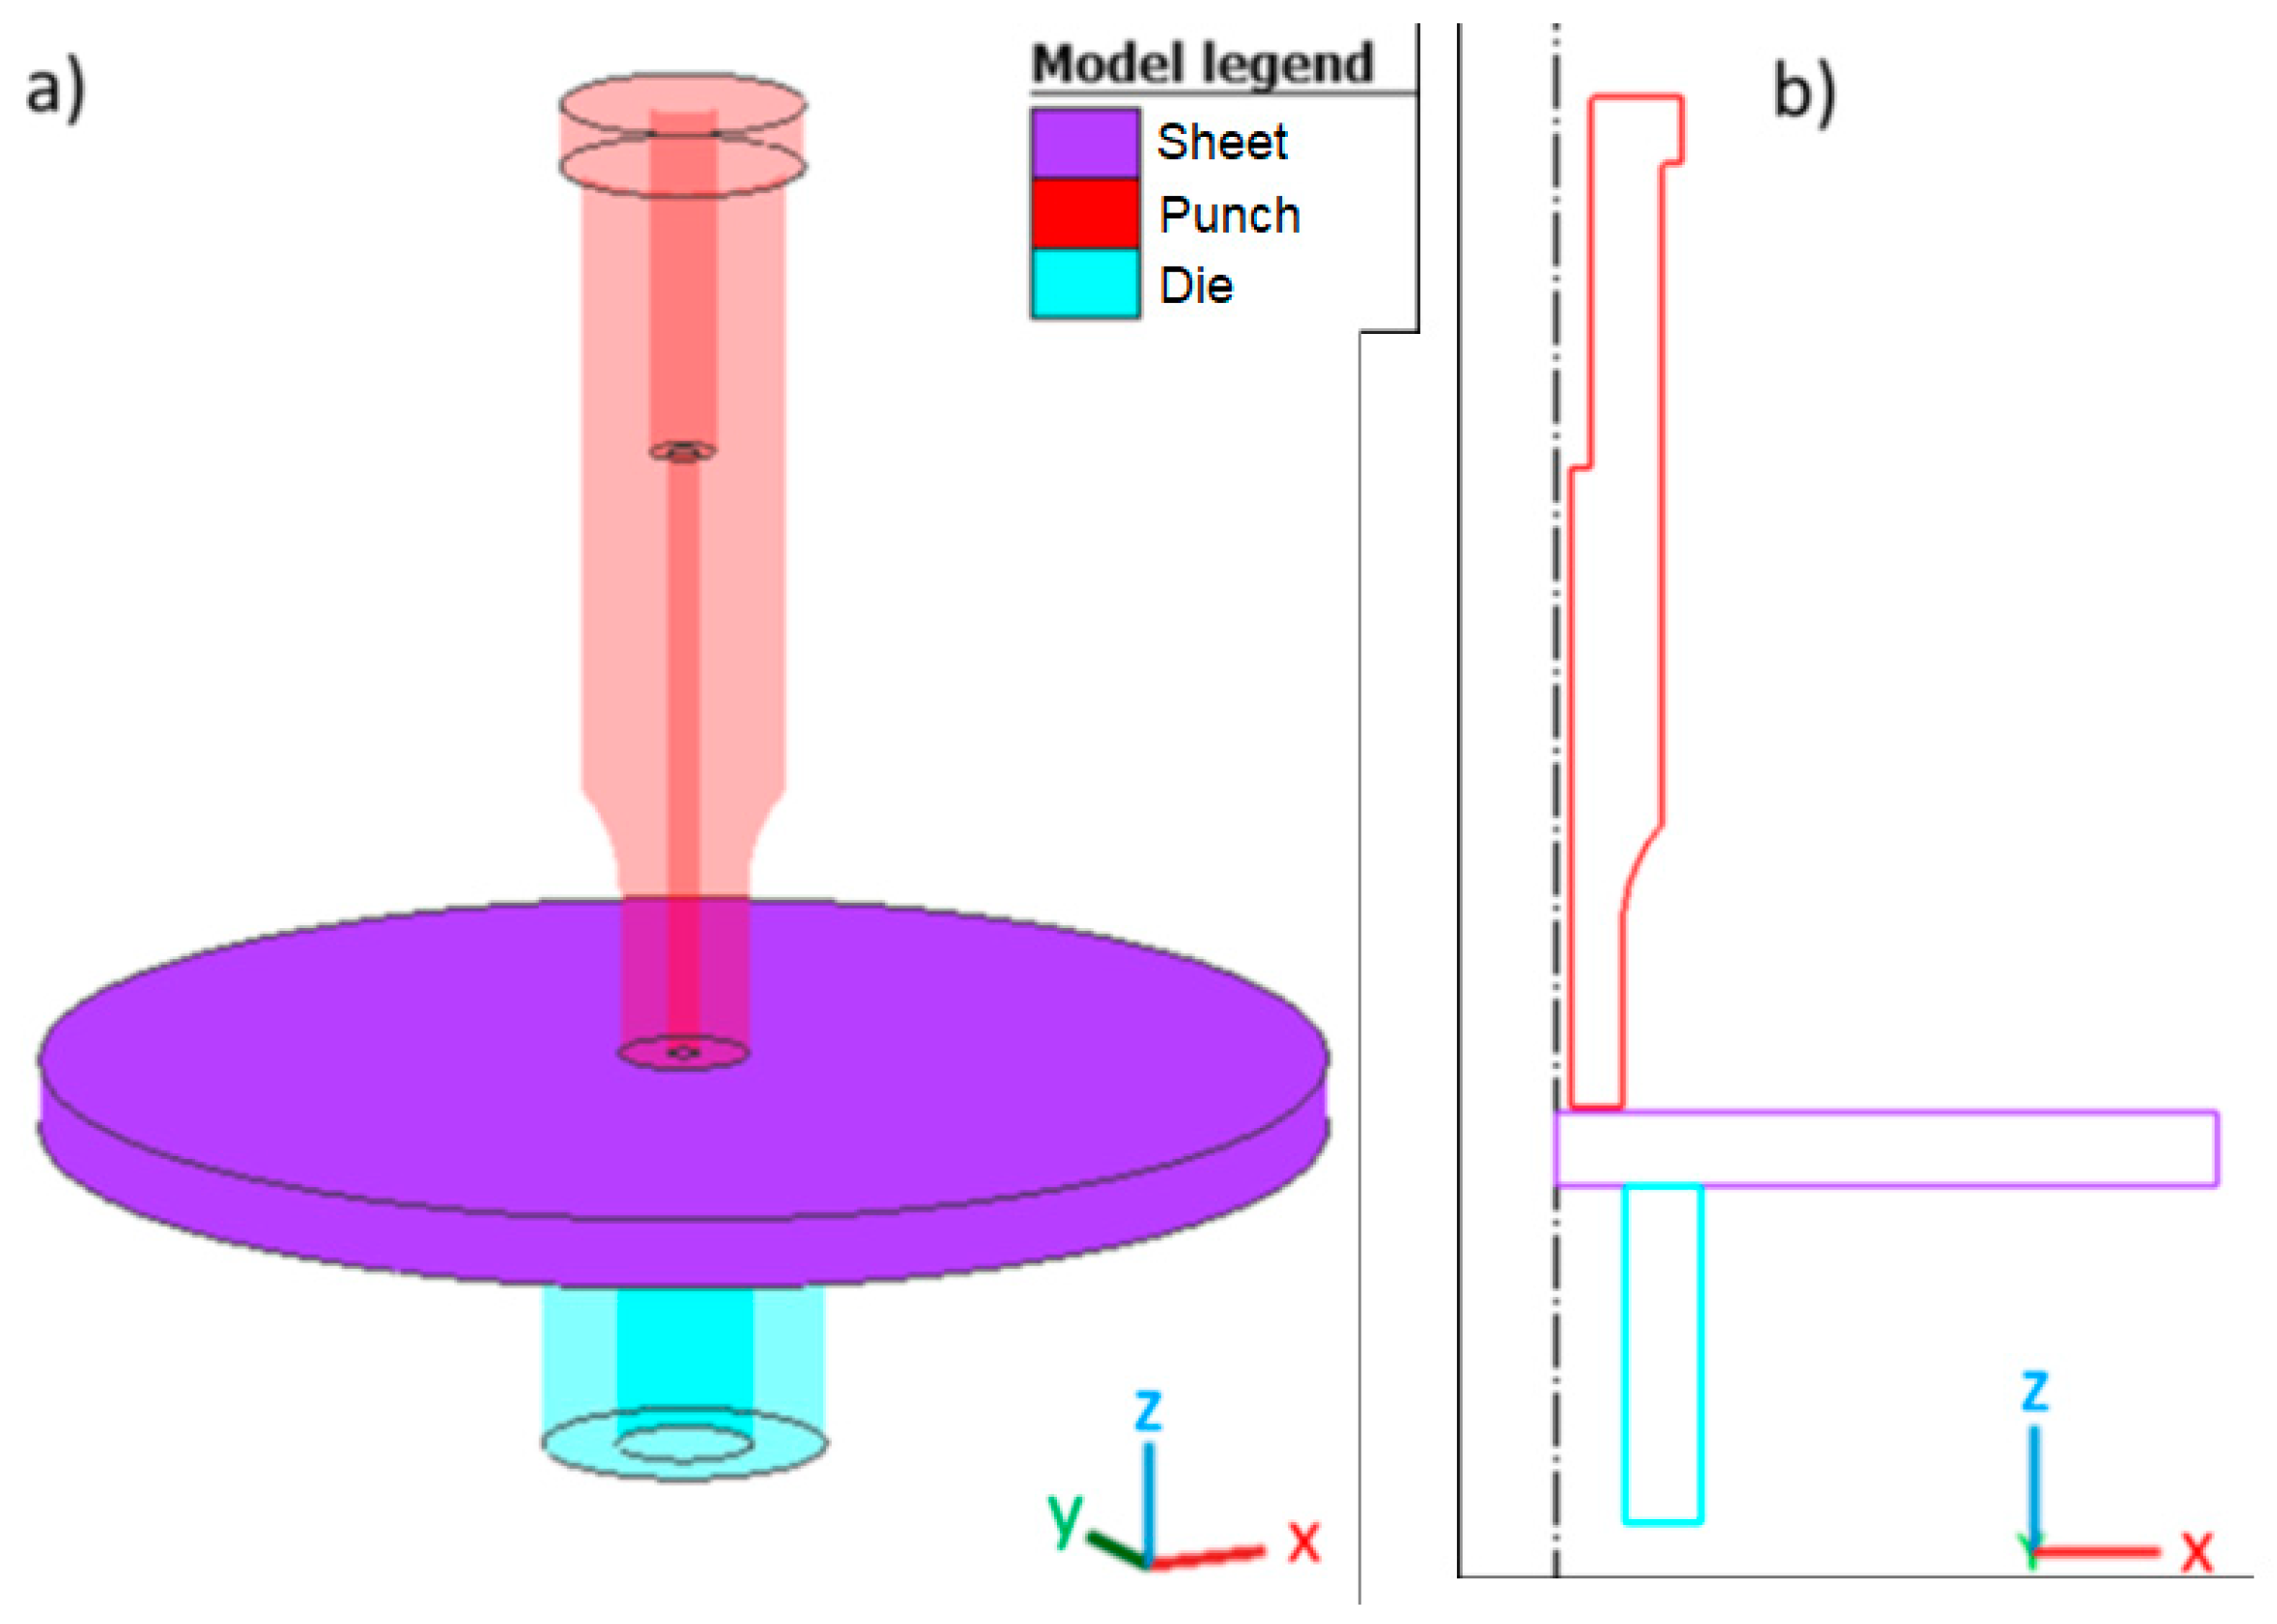
The die-cutting simulations are intended to be as close as possible to the experimental case. Hollomon’s laws and the Johnson–Cook damage criterion were used, along with the previously obtained parameters. Regarding the geometry, the sheet has a thickness of 5.5 mm. Additionally, the outer radius of the punch is positioned 5 mm from the axis of rotation to achieve a hole of 10 mm diameter, while the inner radius of the die is set at a distance from the axis of rotation equal to the radius plus the clearance. This configuration is illustrated in Figure 12.
A touching-type contact was used between the sheet and the geometric bodies, with a friction coefficient between them that, according to the literature, has been defined as 0.3 [26]. The stroke length of the modeled hydraulic press was 6 mm. This amount was considered adequate to ensure the separation of the scrap. In this case, an Advancing Front Quad mesh generator was used to produce a 2D mesh based on quadrilaterals. However, the element-type used is Quad (10) with axisymmetric conditions. Element sizes of 0.4 mm were selected, with a minimum size of 0.05 mm, resulting in 11,710 elements across the sheet. The minimum element size was applied to the area in the clearance between the punch and the die throughout the thicknesses of the sheet. For this purpose, a level 3 refinement box was used directly in the cutting area, as shown in Figure 13.
In the case of remeshing, it has been established as a criterion that remeshing is carried out if penetration occurs between the elements and the other contact geometric bodies (die and punch) and if the change of deformation in the elements exceeds 40%. The mesh parameters are identical to those of the initial mesh.
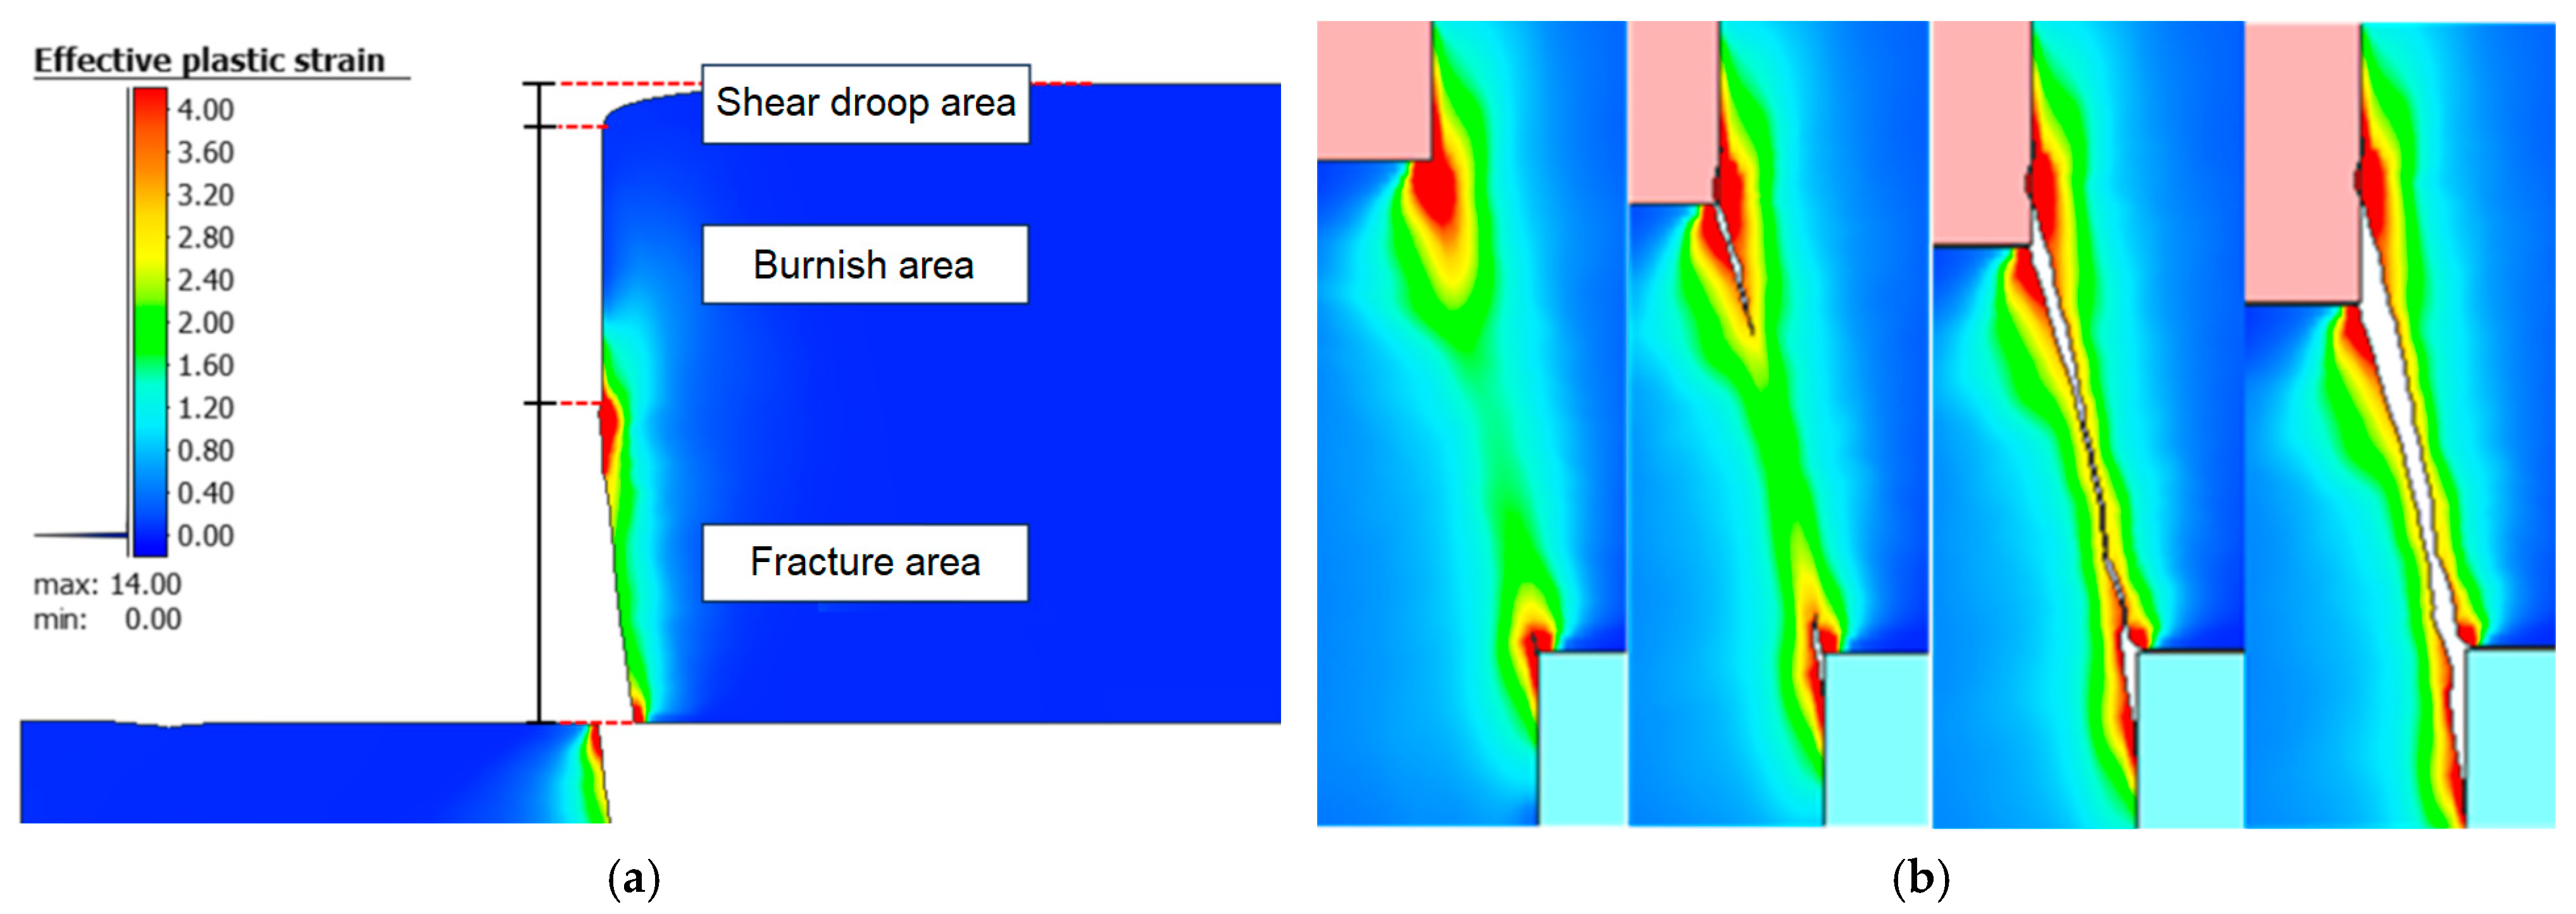
Figure 14a shows the cuts obtained with the characteristic areas of this type of process, whereas Figure 14b illustrates an example of the evolution of material shear generation during simulation. It can be seen that, in this case, after the punch has penetrated a quarter of the thickness of the sheet, the damage causes the appearance of a first crack in the lower part of the sheet. Subsequently, another crack is generated in the area of maximum tension at the contact point between the punch and the material. Finally, these cracks join together, causing a cut with the different characteristic areas of this process.
The percentage of burnish area results obtained from the simulations can be seen in Table 11.
Additionally, Figure 15 represents the estimated response surface of burnish area in relation to velocity and clearance for three different types of steel: (a) steel 1, (b) steel 2 and (c) steel 3. As may be observed, for steel 2 and steel 3, there is a tendency for the burnish area to increase for any value of the velocity as a function of the clearance.
For the case of steel 1, R2 is 99.9512, whereas R2adj is 99.9023. For steel 2, the corresponding values are 97.4480 and 94.8960, respectively. Finally, for steel 3, the R2 and R2adj values are 98.3895 and 96.7790, respectively. It should also be noted that the models obtained by simulation for the three steel cases are also good enough to characterize the relationship between the velocity and clearance parameters and the burnish area.

4.3. Comparison of Results

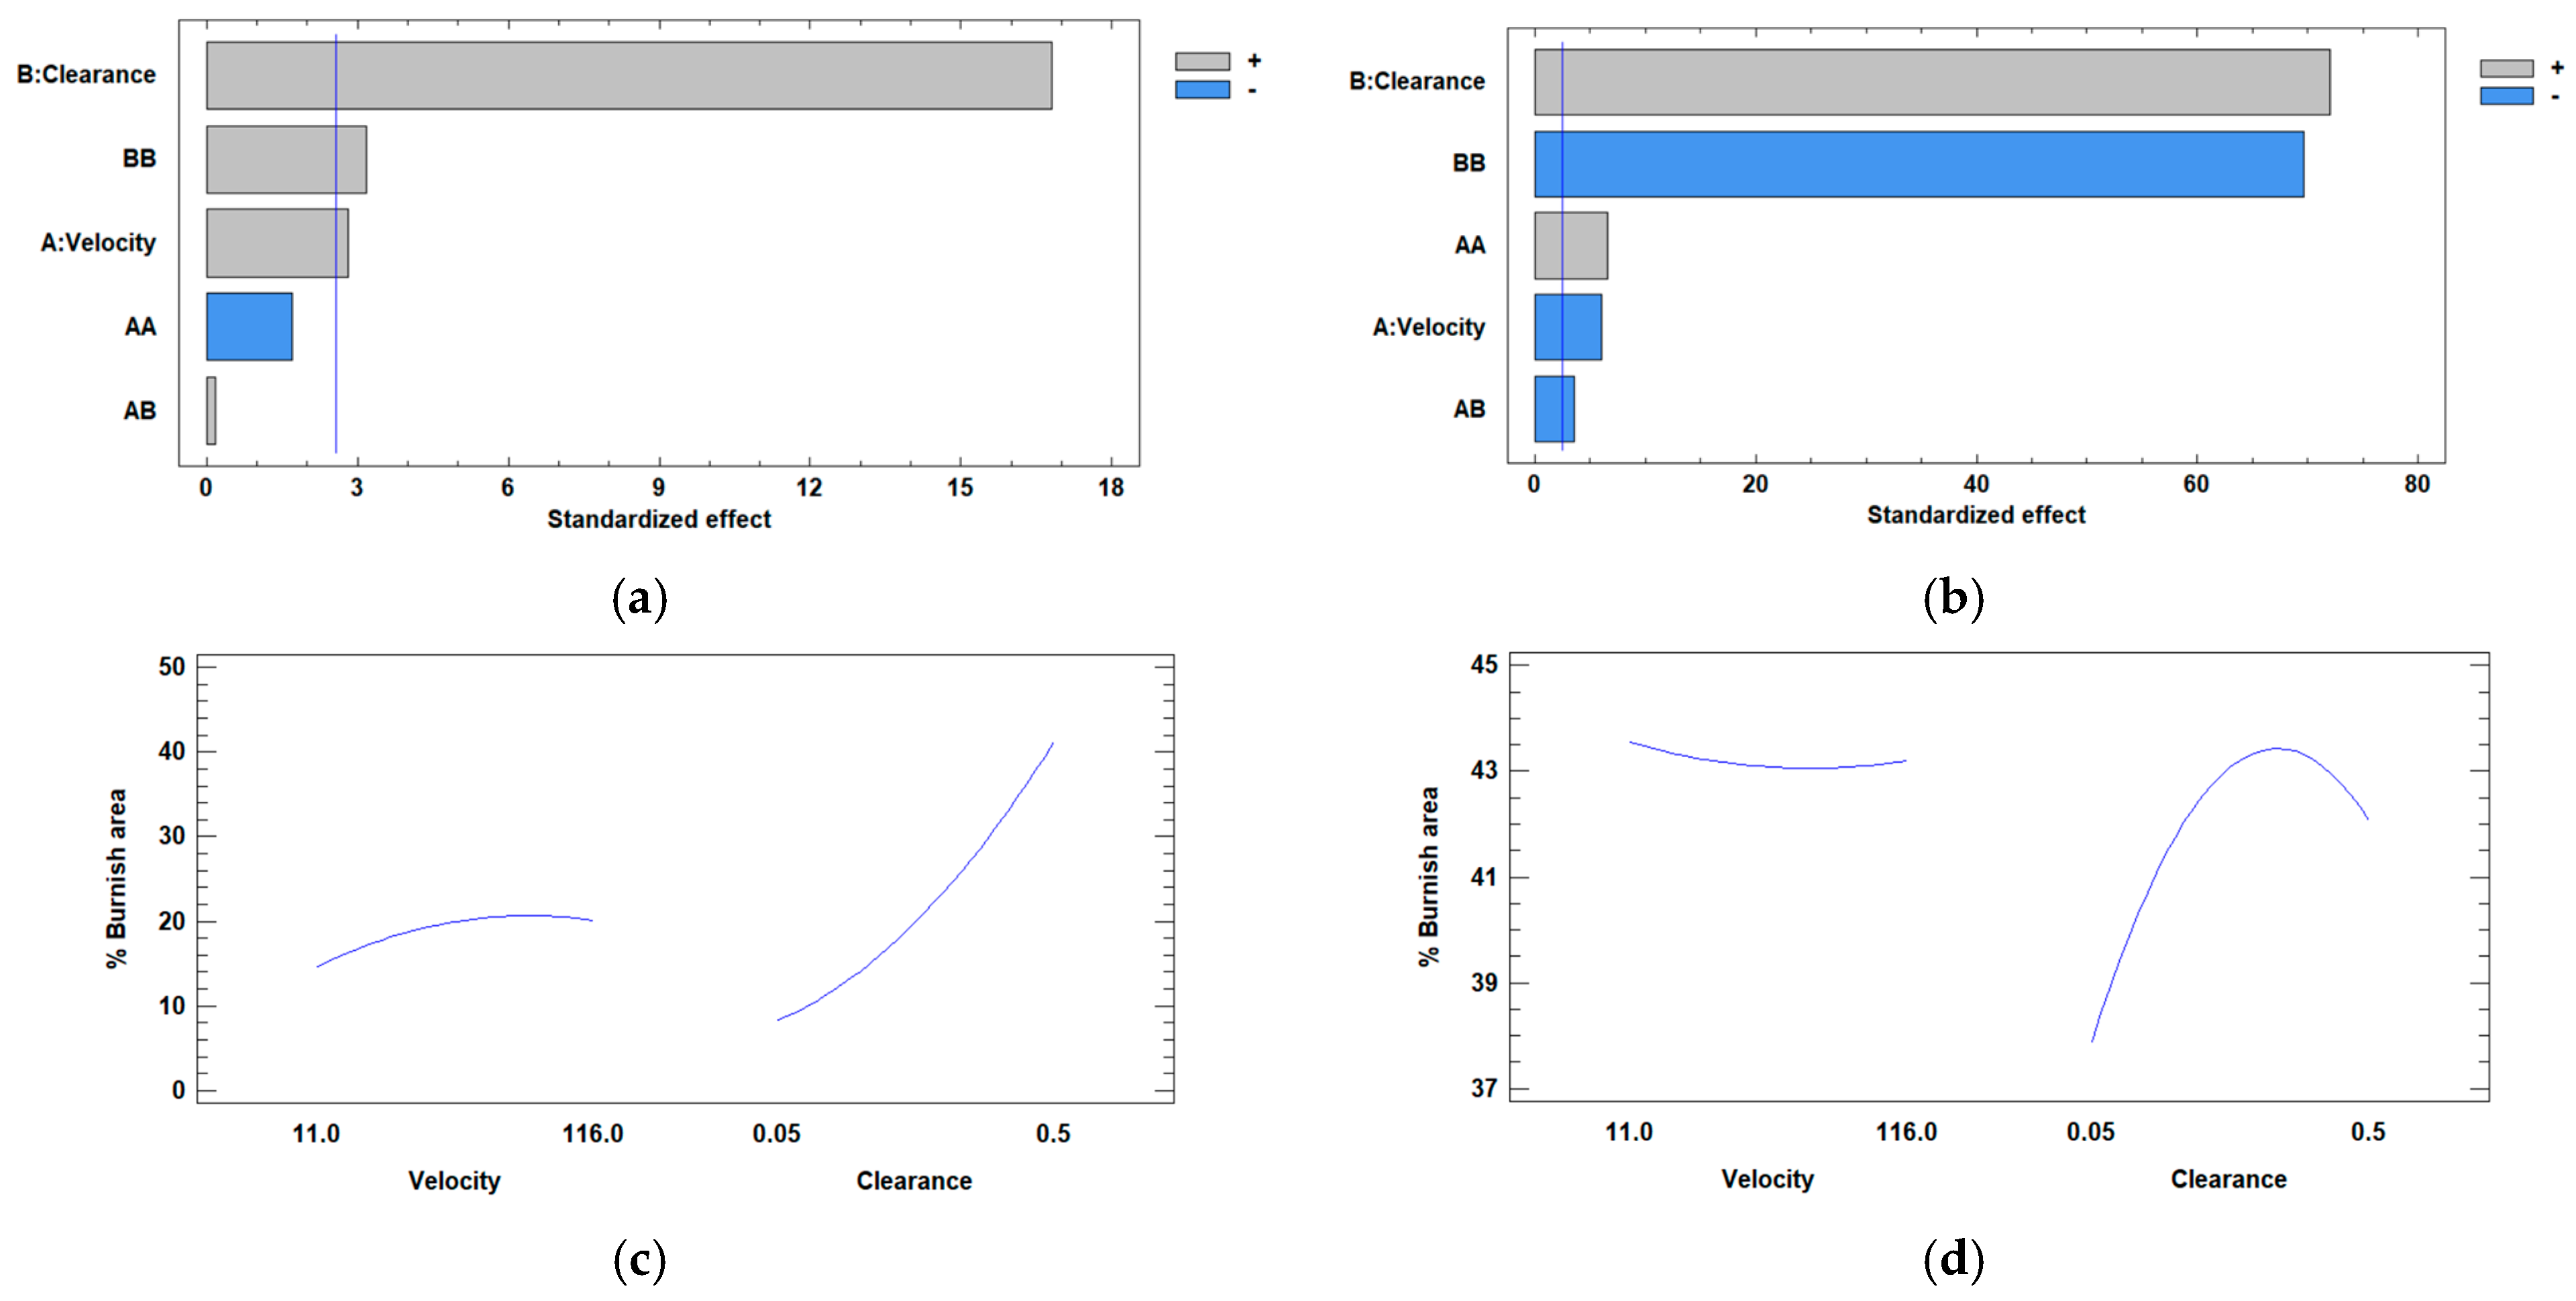
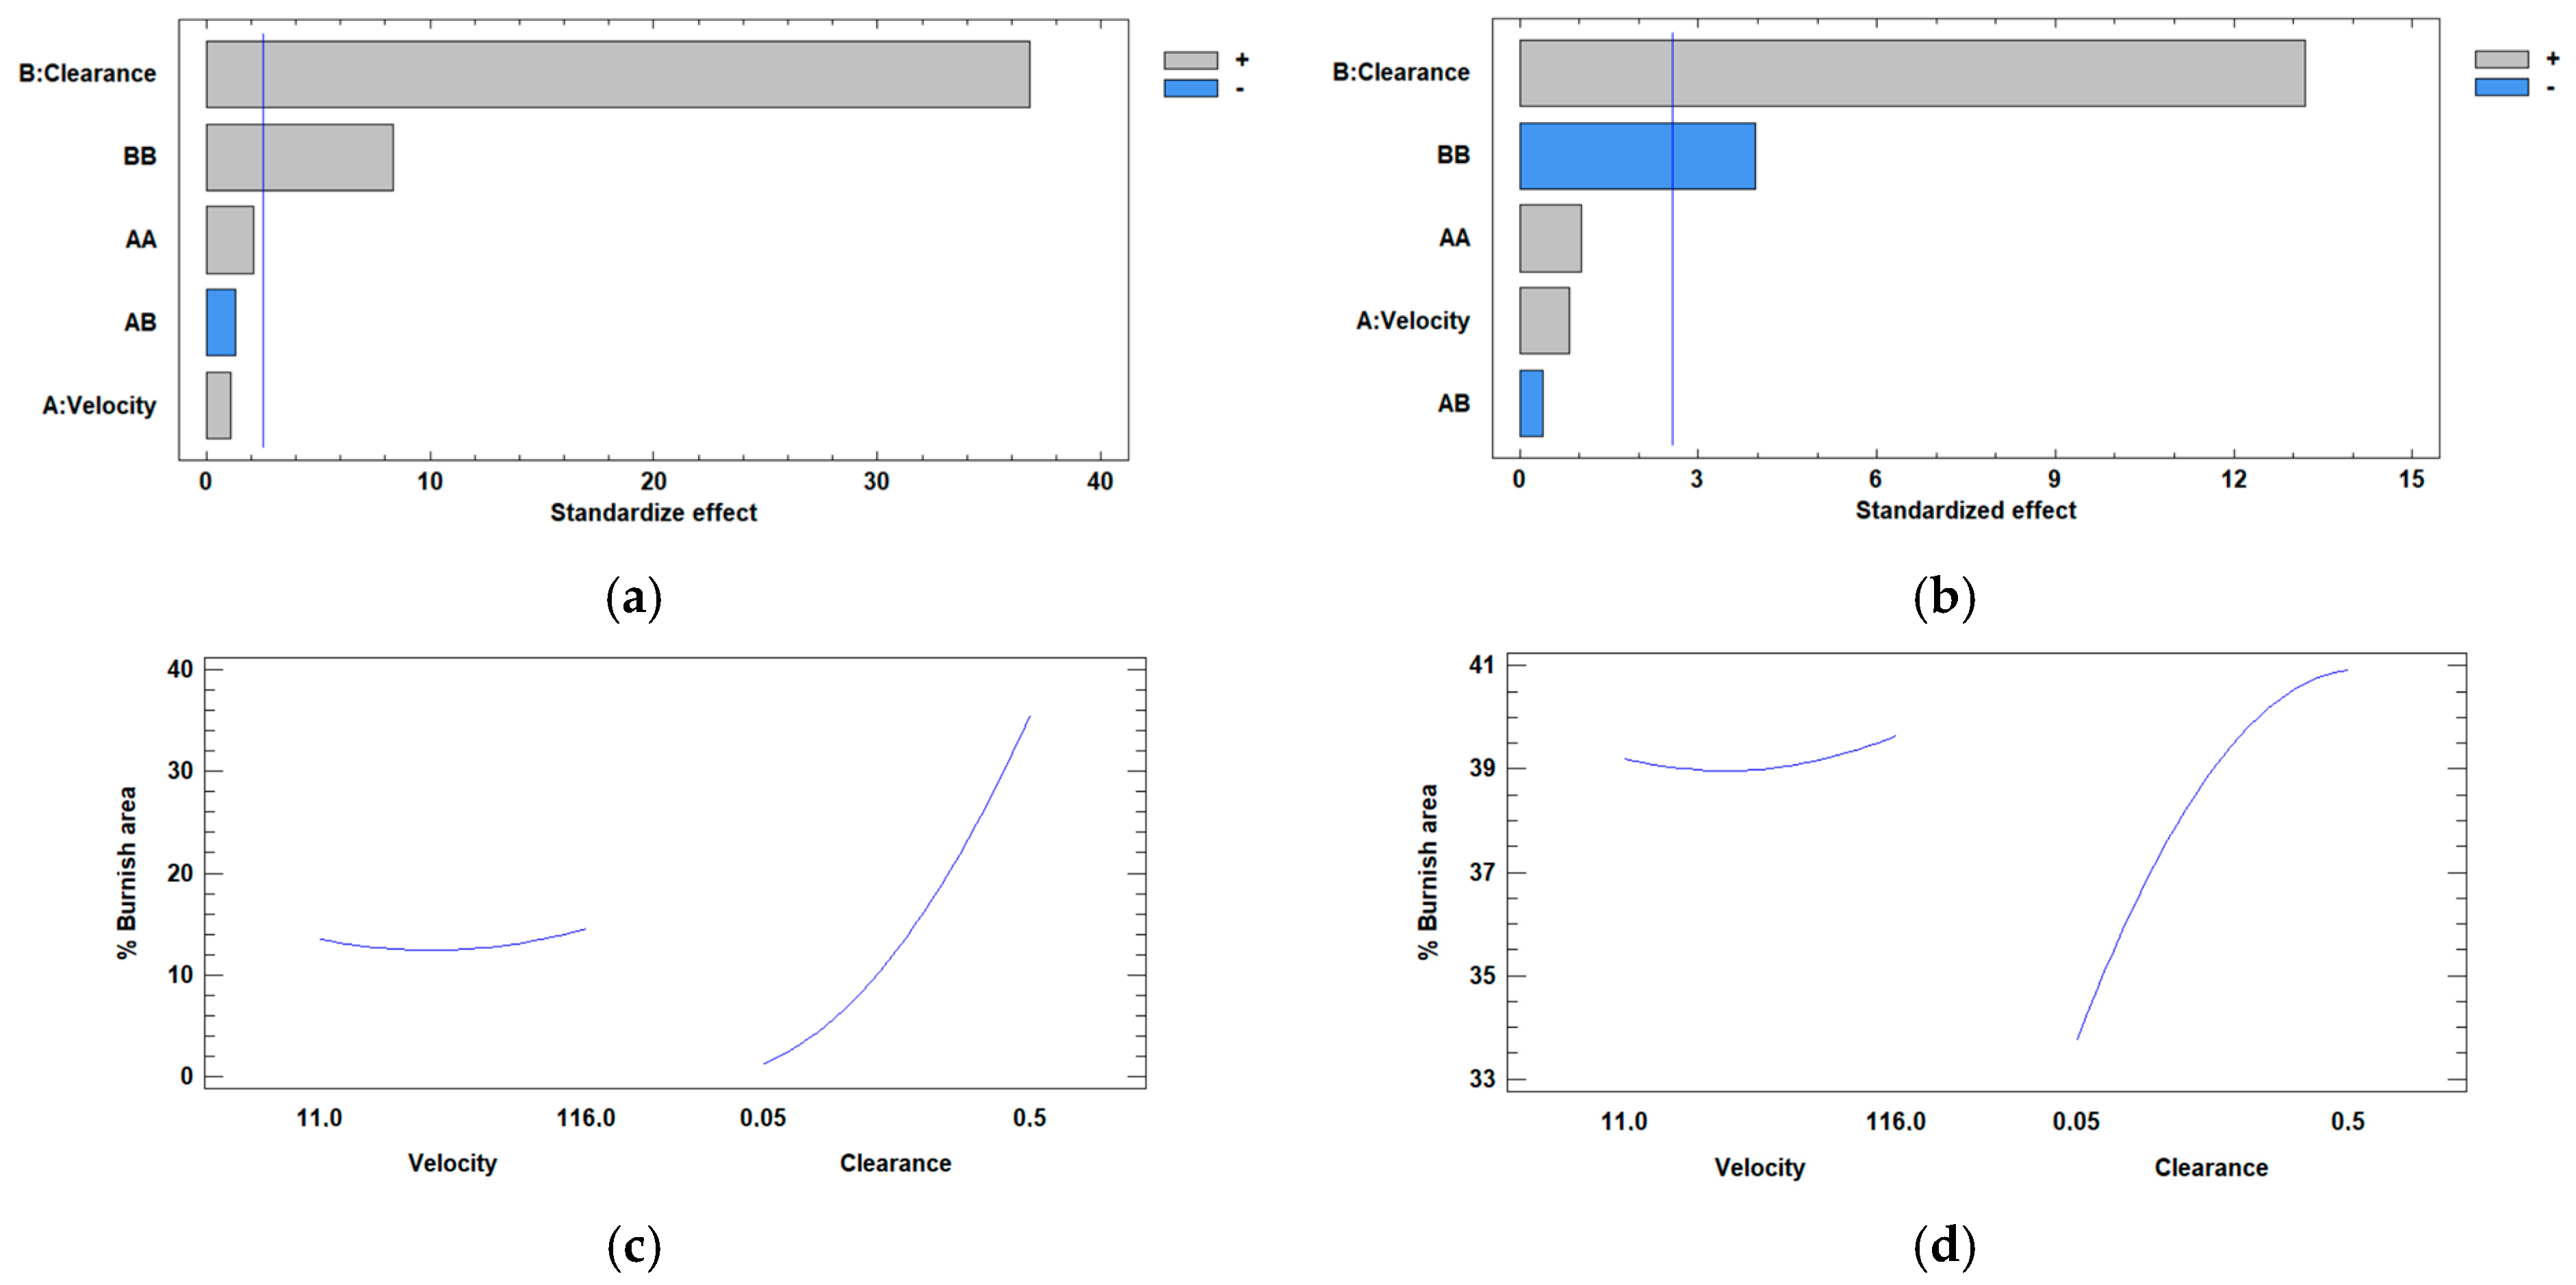
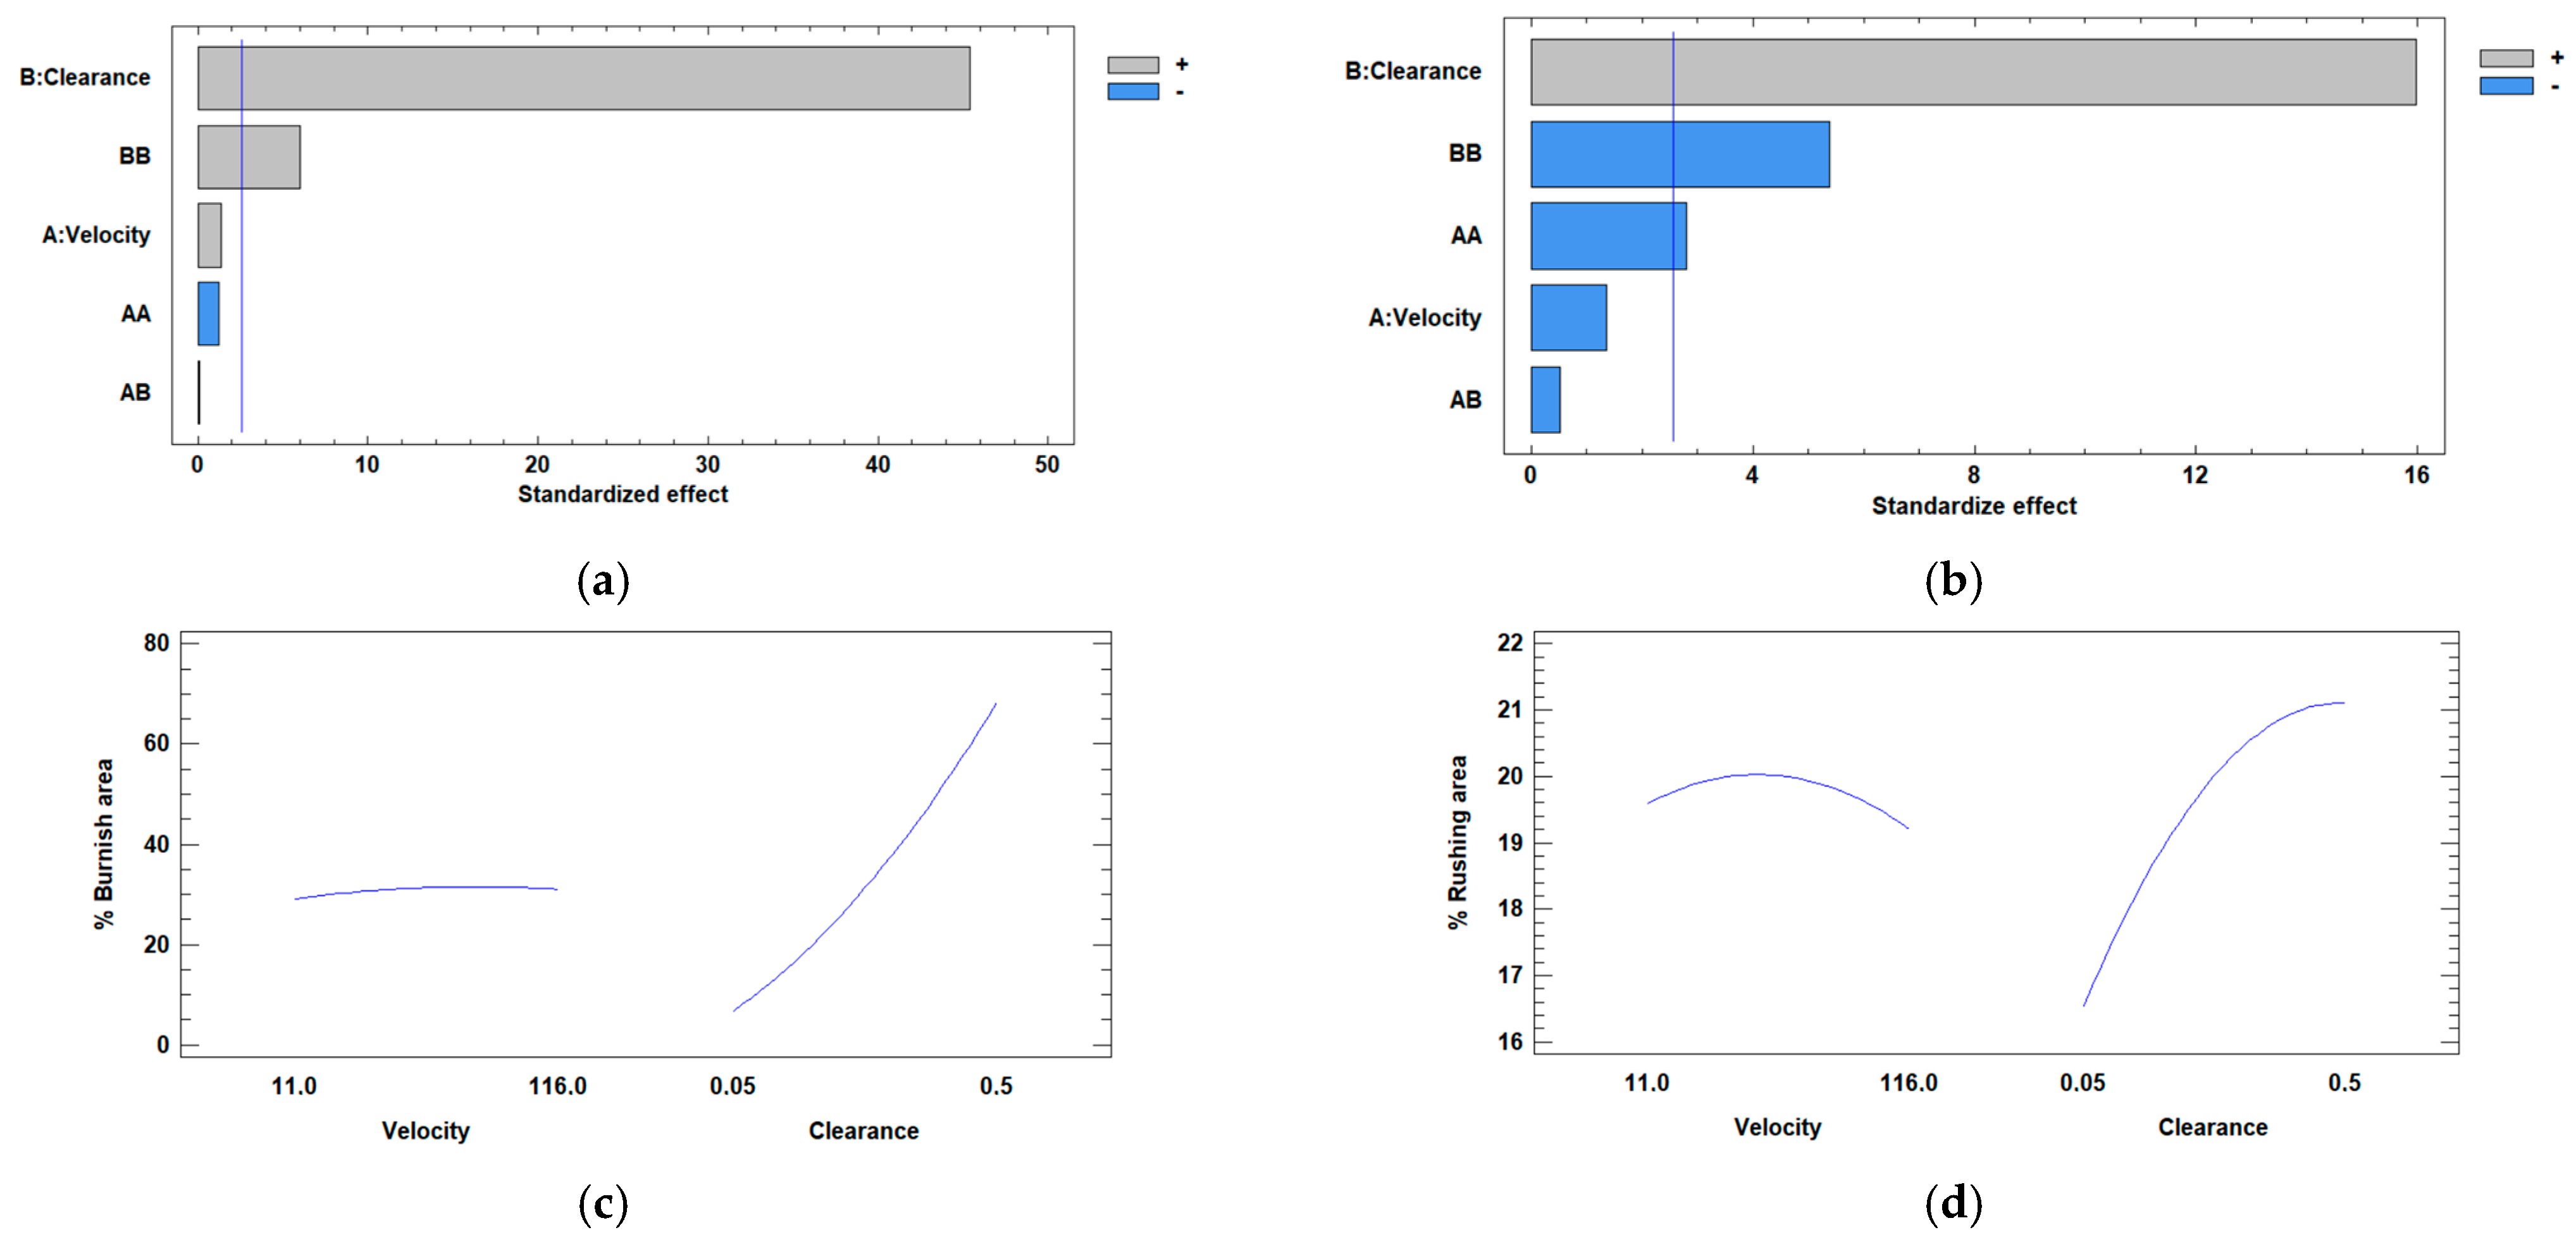
In this section, the results obtained experimentally have been compared with those obtained from the simulations for the three types of steel. To do that, the Pareto chart and the main effects plot have been used, as shown in Figure 16, Figure 17 and Figure 18.
As is clearly shown, in both the experimental and FEM cases, and for the three types of steel, clearance is the most influential factor on the burnish area. In general terms, an increase in burnish area is observed when the clearance factor is increased. However, in the case of simulations, this increase tends to decrease for higher clearance values. In addition, the variation in the burnish area as a function of clearance is much higher in the experimental cases compared to the simulated ones.
On the other hand, the second most influential factor is the quadratic term of the clearance parameter. However, the behavior observed in the experimentation is contrary to that obtained in FEM. In the first case, as the value of this factor increases, the burnish area increases, while for simulation its value decreases.

5. Discussion

In this research work, the study and optimization of steel punching using the Johnson–Cook damage model has been carried out.
In general, in such processes, increasing the clearance results in rougher edges and a larger deformation zone, thereby reducing the material’s deformation capacity [13]. In the contrast, as mentioned above, if the clearance decreases better results will be obtained, but the clearance cannot be null. The optimum clearance decreases as the elongation of the material increases, i.e., the more brittle the material, the larger the clearance used should be [9,14]. By defining an adequate clearance between the cutting edges, fractures ideally start at the cutting edge of the punch and die, maintaining a burnish area appearance [12]. According to the literature, the percentage of burnish area increases as the clearance between the die and the punch decreases, until reaching an inflection point at 5% of the thickness [9]. This percentage is considered to be the optimum for punching processes. If the simulations performed in this study are observed, some of them showed this trend, while others showed a trend completely opposite to what was expected. In these cases, the percentage of burnish area increases as the clearance value increases. However, it is worth noting that the lowest percentage of fracture area was observed with the minimum clearance value. It seems evident that the influence of the clearance will be decisive in minimizing the defective zones in the forming process. Trying to minimize this parameter without affecting the process will be important in achieving the desired result.
Regarding the behavior of each material, it was observed that steel 2 was the most ductile of all, followed by steel 1; steel 3 was the most brittle. The hardness of the material will directly influence the quality of the cut obtained, since the width of the honing zone will depend on it. If the die clearance and the thickness of the material are constant, the width of the honing zone will increase with the ductility of the material, while the drop, fracture and burr zones will be smaller. That is, the more ductile the material, the higher the percentage of burnish area [11,12]. Furthermore, it was shown that the more ductile the material, the smaller the clearance used should be [9]. On the other hand, the more brittle the material, the sharper the punch and die should be, since if the tools are blunt, they will create the effect of too little clearance and burrs will be generated [12]. This was corroborated by the burnish area percentage results, where values of around 20% were obtained for steel 3 and values of about 40% were obtained for steels 1 and 2. Therefore, it is necessary to keep the clearance parameter as small as possible to minimize the burnish area, but this value must be adjusted for each material, since, as it has been observed, there are differences depending on it. Thus, no exact value for this parameter has been defined.
The following points can be highlighted from the damage model and the simulation of the tensile tests:
The Johnson–Cook model was defined using the equivalent strain and triaxiality values obtained from the tensile tests performed for the three different sample geometries.
The results for the damage and fracture obtained from the mesh spacing criteria simulation in the tension tests were very similar to those obtained in the real tests.
Particularly relevant was to check the differences between the rupture zones in the shear samples for the different materials. It was observed how, with different materials, these zones varied both in the experimental tests and in the simulations. Furthermore, the critical rupture zone and the geometric deformation of the specimens could be predicted.
In the comparison between real die cutting and simulation, the following conclusions can be drawn:
The influence of processing speed is much less significant than that of clearance within the studied intervals.
The differences observed in the comparisons show that it is necessary to adjust the simulations as much as possible to the real process. In real processes, many factors are in play, resulting in discrepancies with the theoretical models. Therefore, it is crucial to try to take into account all the variables and possible factors involved in the processes.
The minimum percentage of burnish area was observed for the minimum values of clearance in all the cases.
The variation in the burnish area as a function of clearance is much higher in the experimental cases than in the simulations.
Summarizing, the methodology defined in this research work can be useful for optimizing the forming processes and extrapolating it to different types of die cutting. This could help reduce the percentage of fracture area in such processes and predict the appearance of cracks.

6. Conclusions

After considering all the results obtained from the study and optimization of steel punching using the Johnson–Cook damage model, this section summarizes the main conclusions of the study:
  • Some simulations performed in this study showed that the percentage of burnish area increases as the clearance between the die and the punch decreases, while others showed a trend completely opposite to what was expected.
  • The lowest percentage of fracture area was observed with the minimum clearance value.
  • According to the literature, the more ductile the material, the higher the percentage of burnish area. In this case, steel 2 was the most ductile of all, followed by steel 1, while steel 3 was the most brittle. Observing the burnish area percentage results, values of around 20% were obtained for steel 3 and values of about 40% were obtained for steels 1 and 2.
  • The results for the damage and fracture obtained from the simulations in the tension tests were very similar to those obtained in the real tests.
  • With different materials, the rupture zones in the shear samples varied both in the experimental tests and in the simulations. Furthermore, the critical rupture zone and the geometric deformation of the specimens could be predicted.
  • The clearance has more influence than the processing speed, and the minimum burnish area percentage was observed for the minimum values of clearance for all the cases.
  • In the experimental case, a greater variation in the burnish area as a function of clearance was observed than in the simulation.

Author Contributions

Conceptualization, A.C., D.S. and J.A.G.; methodology, A.C., A.H.A., D.S., E.B. and J.P.F.; software, D.S., R.L. and A.H.A.; formal analysis, A.C., D.S., J.P.F. and A.T.; investigation, A.C., A.H.A., E.B., J.P.F., R.L. and D.S.; resources, E.B., A.C. and D.S.; data curation, A.C., J.P.F. and D.S.; writing—original draft preparation, A.C. and D.S.; writing—review and editing, A.C., J.P.F., A.T. and D.S.; supervision, D.S.; project administration, A.C. and D.S.; funding acquisition, D.S. and J.A.G. All authors have read and agreed to the published version of the manuscript.

Funding

This research was funded by Gobierno de Navarra-Departamento de Desarrollo Económico y Empresarial and Fondo Europeo de Desarrollo Regional (FEDER) through the project “Soportes de freno de máxima calidad mediante una nueva tecnología con desarrollo de componentes específicos y simulación de comportamiento del material (SOPSIMAT)”, grant number 0011-1365-2022-000108”.

Data Availability Statement

The original contributions presented in the study are included in the article, further inquiries can be directed to the corresponding author.

Conflicts of Interest

Author Eneko Barba was employed by the company NUADI. The remaining authors declare that the research was conducted in the absence of any commercial or financial relationships that could be construed as a potential conflict of interest.

References

  1. Badgujar, T.Y.; Wani, V.P. Stamping Process Parameter Optimization with Multiple Regression Analysis Approach. Mater. Today Proc. 2018, 5, 4498–4507. [Google Scholar] [CrossRef]
  2. Paetzold, I.; Feistle, M.; Golle, R.; Volk, W.; Frehn, A.; Ilskens, R. Determination of the Minimum Possible Damage Due to Shear Cutting Using a Multi-Stage Shear Cutting Process. IOP Conf. Ser. Mater. Sci. Eng. 2018, 418, 012070. [Google Scholar] [CrossRef]
  3. Maiti, S.K.; Ambekar, A.A.; Singh, U.P.; Date, P.P.; Narasimhan, K. Assessment of Influence of Some Process Parameters on Sheet Metal Blanking. J. Mater. Process. Technol. 2000, 102, 249–256. [Google Scholar] [CrossRef]
  4. Pätzold, I.; Stahl, J.; Golle, R.; Volk, W. Reducing the Shear Affected Zone to Improve the Edge Formability Using a Two-Stage Shear Cutting Simulation. J. Mater. Process. Technol. 2023, 313, 117872. [Google Scholar] [CrossRef]
  5. Xie, Y.; Feng, K.; Du, M.; Wang, Y.; Li, L. Robust Optimization of Stamping Process Based on Bayesian Estimation. J. Manuf. Process. 2023, 101, 245–258. [Google Scholar] [CrossRef]
  6. Mitsomwang, P.; Nagasawa, S. Effects of Shearing Parameters on Cutting Characteristics of Polycarbonate Sheet Subjected to Straight Punch/Die Shearing. J. Mater. Process. Technol. 2015, 220, 46–57. [Google Scholar] [CrossRef]
  7. Cabrera, V.H.; Quillupangui, W.; Juiña, L.; Valdez, M. Cutting Parameters in Dies for Sheet Metal through Inclined, Concave, and Convex Shapes in Round Punches. Mater. Today Proc. 2022, 49, 28–34. [Google Scholar] [CrossRef]
  8. Hambli, R.; Reszka, M. Fracture Criteria Identification Using an Inverse Technique Method and Blanking Experiment. Int. J. Mech. Sci. 2002, 44, 1349–1361. [Google Scholar] [CrossRef]
  9. Nishad, R.; Totre, A.; Bodke, S.; Chauhan, A. An Overview of the Methodologies Used in the Optimization Processes in Sheet Metal Blanking. Int. J. Mech. Eng. Robotic Res. 2013, 2, 307–314. Available online: https://www.ijmerr.com/show-117-93-1.html (accessed on 1 March 2024).
  10. Hambli, R.; Richir, S.; Crubleau, P.; Taravel, B. Prediction of Optimum Clearance in Sheet Metal Blanking Processes. Int. J. Adv. Manuf. Technol. 2003, 22, 20–25. [Google Scholar] [CrossRef]
  11. Gustafsson, E.; Oldenburg, M.; Jansson, A. Experimental Study on the Effects of Clearance and Clamping in Steel Sheet Metal Shearing. J. Mater. Process. Technol. 2016, 229, 172–180. [Google Scholar] [CrossRef]
  12. Boljanovic, V. Sheet Metal Forming Processes and Die Design, Angewandte Chemie International ed.; Industrial Press: New York, NY, USA, 2004; Volume 6, pp. 951–952. [Google Scholar]
  13. Nasheralahkami, S.; Golovashchenko, S.; Pan, K.; Brown, L.; Gugnani, B. Characterization of Trimmed Edge of Advanced High Strength Steel. In SAE Technical Papers; SAE International: Warrendale, PA, USA, 2016. [Google Scholar] [CrossRef]
  14. Optimization of Blanking Processes Using Neural Network Simulation. Available online: https://www.researchgate.net/publication/270749492_Optimization_of_blanking_processes_using_neural_network_simulation (accessed on 1 March 2024).
  15. Hambli, R. Design of Experiment Based Analysis for Sheet Metal Blanking Processes Optimisation. Int. J. Adv. Manuf. Technol. 2002, 19, 403–410. [Google Scholar] [CrossRef]
  16. Tavares, A.F.; Lopes, A.P.O.; Mesquita, E.A.; Almeida, D.T.; Souza, J.H.C.; Costa, H.L. Effect of Transfer Layers on Friction and Wear Mechanisms in Strip Drawing Tests of Commercially Coated Forming Tools. Wear 2021, 476, 203733. [Google Scholar] [CrossRef]
  17. Liang, H.; Yang, X.; Yue, C.; Zhao, G.; Zhang, J.; Wang, Y. A Comparative Friction and Wear Study of Diamond and Diamond-like Carbon Films against Cu. Tribol. Int. 2024, 193, 109344. [Google Scholar] [CrossRef]
  18. Klocke, F.; Sweeney, K.; Raedt, H.W. Improved Tool Design for Fine Blanking through the Application of Numerical Modeling Techniques. J. Mater. Process. Technol. 2001, 115, 70–75. [Google Scholar] [CrossRef]
  19. Amaral, R.; Teixeira, P.; Azinpour, E.; Santos, A.D.; Cesar De Sa, J. Evaluation of Ductile Failure Models in Sheet Metal Forming. MATEC Web Conf. 2016, 80, 03004. [Google Scholar] [CrossRef]
  20. Li, X.Y.; Zhang, Z.H.; Cheng, X.W.; Liu, X.P.; Zhang, S.Z.; He, J.Y.; Wang, Q.; Liu, L.J. The Investigation on Johnson-Cook Model and Dynamic Mechanical Behaviors of Ultra-High Strength Steel M54. Mater. Sci. Eng. A 2022, 835, 142693. [Google Scholar] [CrossRef]
  21. UNE-EN ISO 6892-1:2020; Metallic Materials—Tensile Testing—Part 1: Method of Test at Room Temperature (ISO 6892-1:2019). UNE Normalización Española: Madrid, Spain, 2020.
  22. ASTM B831; Standard Test Method for Shear Testing of Thin Aluminum Alloy Products. ASTM International: West Conshohocken, PA, USA, 2023.
  23. Jansen, J. Ein Werkstoffmodell Für Eine Aluminium-Druckgusslegierung Unter Statischen Und Dynamischen Beanspruchungen. University Thesis, Fraunhofer-IRB-Verl, Stuttgart, Germany, 2007. Available online: https://d-nb.info/98552524X (accessed on 16 May 2024).
  24. Khare, S.; Kumar, K.; Choudhary, S.; Singh, P.K.; Verma, R.K.; Mahajan, P. Determination of Johnson–Cook Material Parameters for Armour Plate Using DIC and FEM. Met. Mater. Int. 2021, 27, 4984–4995. [Google Scholar] [CrossRef]
  25. Tekkaya, A.E.; Bouchard, P.O.; Bruschi, S.; Tasan, C.C. Damage in Metal Forming. CIRP Ann. 2020, 69, 600–623. [Google Scholar] [CrossRef]
  26. Barba, E.; Salcedo, D.; Claver, A.; Luri, R.; Garcia, J.A.; Barba, E.; Salcedo, D.; Claver, A.; Luri, R.; Garcia, J.A. Influence of Friction Coefficient on the Performance of Cold Forming Tools. Metals 2023, 13, 960. [Google Scholar] [CrossRef]
  27. Soares, J.A.; Gipiela, M.L.; Lajarin, S.F.; Marcondes, P.V.P. Study of the Punch-Die Clearance Influence on the Sheared Edge Quality of Thick Sheets. Int. J. Adv. Manuf. Technol. 2013, 65, 451–457. [Google Scholar] [CrossRef]
  28. Mahmudah, A.; Kiswanto, G.; Priadi, D. Analysis of Shear Edge Quality for Different Punch Velocities in Micro-Blanking Process. Int. J. Mech. Eng. Robot. Res. 2017, 6, 279–284. [Google Scholar] [CrossRef]
  29. Mitsomwang, P.; Nagasawa, S. Effect of Mechanical Conditions on Cutting Characteristics of Polycarbonate Sheet Subjected to Straight Punch/Die Shearing. Procedia Eng. 2014, 81, 1145–1150. [Google Scholar]
  30. Hexagon, A.B. Simufact Forming 2022.1 Application. Examples of All Applications. Available online: https://hexagon.com/products/simufact-forming (accessed on 16 May 2024).
  31. Banerjee, A.; Dhar, S.; Acharyya, S.; Datta, D.; Nayak, N. Determination of Johnson cook material and failure model constants and numerical modelling of Charpy impact test of armour steel. Mater. Sci. Eng. A 2015, 640, 200–209. [Google Scholar] [CrossRef]
Figure 1. Image of the microstructure of each material obtained by optical microcopy: (a) steel 1, (b) steel 2 and (c) steel 3.
Metals 14 00616 g001
Figure 2. Image of the samples that were employed in the tensile tests. (a) Conventional tensile test, (b) notched sample, (c) shear sample.
Metals 14 00616 g002
Figure 3. The DSF-C1-2000 punching equipment.
Metals 14 00616 g003
Figure 4. Image of the sample meshing of each sample. (a) Conventional tensile sample, (b) shear sample, (c) notched sample.
Metals 14 00616 g004
Figure 5. Stroke zone determination from the tensile test; yield limit point (red circle) and fracture point (green circle).
Metals 14 00616 g005
Figure 6. Fracture curve of the Johnson–Cook model defined by two points.
Metals 14 00616 g006
Figure 7. Comparison of fracture in conventional tensile samples: (a) real and (b) simulation.
Metals 14 00616 g007
Figure 8. Comparison of fracture in (a) real and (b) simulation.
Metals 14 00616 g008
Figure 9. Comparison of fracture in shear samples: (a,c) real and (b,d) simulation.
Metals 14 00616 g009
Figure 10. Holes obtained through experimental punching tests.
Metals 14 00616 g010
Figure 11. Experimental results: estimated response surface of % burnish area vs. velocity and clearance for (a) steel 1, (b) steel 2 and (c) steel 3.
Metals 14 00616 g011
Figure 12. Geometries in the die-cutting simulations. (a) 3D view, (b) profile view.
Metals 14 00616 g012
Figure 13. Level 3 refinement box in the sheet and the resulting mesh.
Metals 14 00616 g013
Figure 14. Example of cut zones obtained from Simufact Forming software (a) general view, and (b) detailed figures.
Metals 14 00616 g014
Figure 15. FEM results: estimated response surface of % burnish area vs. velocity and clearance for: (a) steel 1, (b) steel 2 and (c) steel 3.
Metals 14 00616 g015
Figure 16. Results analysis from DOE. (a) Pareto chart (experimental, steel 1), (b) Pareto chart (FEM, steel 1), (c) main effects plot (experimental, steel 1), (d) main effects plot (FEM, steel 1).
Metals 14 00616 g016
Figure 17. Results analysis from DOE. (a) Pareto chart (experimental, steel 2), (b) Pareto chart (FEM, steel 2), (c) main effects plot (experimental, steel 2), (d) main effects plot (FEM, steel 2).
Metals 14 00616 g017
Figure 18. Results analysis from DOE. (a) Pareto chart (experimental, steel 3), (b) Pareto chart (FEM, steel 3), (c) main effects plot (experimental, steel 3), (d) main effects plot (FEM, steel 3).
Metals 14 00616 g018
Table 1. Chemical composition of each structural steel.
Structural Steel%C%Mn%Si%P%S%Al%Ni%Cr
Steel 10.1060.500-0.0110.014- -
Steel 20.0660.3190.0090.0160.0140.0520.0110.029
Steel 30.1580.5820.0300.0110.0130.0490.016-
Table 2. Mechanical properties of each structural steel: (σy), (Rm) and elongation (e).
Structural Steelσy (MPa)Rm (MPa)e (%)
Steel 135141833.5
Steel 230239239.0
Steel 331146326.8
Table 3. Design factors and their values.
TestPunch Velocity (mm/s)Clearance (mm)
163.50.275
263.50.275
363.50.275
411.00.275
5116.00.050
6116.00.500
7116.00.275
811.00.050
963.50.500
1011.00.500
1163.50.050
Table 4. Values of n and K that define the behavior of each material.
Structural Steeln±ΔnK±ΔK
Steel 10.3500.009851.0587.053
Steel 20.3630.007846.8829.308
Steel 30.3530.009972.65220.811
Table 5. Stroke values obtained for each material and test.
Stroke (mm)Steel 1Steel 2Steel 3
Conventional tensile test24.4 ± 0.225.3 ± 0.721.3 ± 1.0
Notched samples3.4 ± 1.24.4 ± 0.033.6 ± 0.3
Shear samples8.3 ± 0.18.6 ± 0.34.8 ± 0.3
Table 6. Equivalent strain and triaxiality values obtained for each material and test.
Equivalent StrainTriaxiality
SampleTensileNotchedShearTensileNotchedShear
Steel 10.330.550.260.580.851.32
Steel 20.330.570.330.580.851.30
Steel 30.280.440.550.580.850.20
Table 7. Johnson–Cook model constants for each material.
SampleD1D2D3
Steel 10.0052.154−1.618
Steel 20.0001.600−1.215
Steel 30.0000.598−0.343
Table 8. Maximum damage values for each material.
Steel 1Steel 2Steel 3
Damage0.1430.1700.335
Table 9. Comparison between stroke value obtained in real tensile tests and simulations for each sample type and material.
Steel 1Steel 2Steel 3
Stroke conventional tensile testReal test (mm)24.4225.3421.34
Simulation (mm)32.8034.6129.50
Difference (%)34.3436.5938.25
Stroke notched samplesReal test (mm)4.264.433.57
Simulation (mm)4.124.324.11
Difference (%)−3.25−2.5315.02
Stroke shear samplesReal test (mm)8.308.594.78
Simulation (mm)10.409.424.91
Difference (%)25.339.002.88
Table 10. Results to be analyzed from the experimental punching tests on the 3 steels.
TestSteel 1Steel 2Steel 3
% Burnish Area% Burnish Area% Burnish Area
120.48 ± 11.9612.14 ± 7.7531.13 ± 6.04
220.48 ± 11.9612.14 ± 7.7531.13 ± 6.04
320.48 ± 11.9612.14 ± 7.7531.13 ± 6.04
415.06 ± 13.5712.92 ± 11.6727.50 ± 3.26
510.54 ± 4.652.92 ± 0.105.89 ± 2.19
641.31 ± 20.4736.55 ± 13.8966.37 ± 3.93
718.10 ± 11.3316.01 ± 4.7633.21 ± 8.14
84.23 ± 4.881.43 ± 0.545.77 ± 2.25
942.98 ± 6.0835.30 ± 9.8769.46 ± 8.17
1034.11 ± 20.8238.04 ± 1.8866.55 ± 2.89
114.88 ± 4.692.56 ± 0.906.25 ± 6.39
Table 11. Results to be analyzed from the simulation stampings on the 3 steels.
TestSteel 1Steel 2Steel 3
% Burnish Area% Burnish Area% Burnish Area
143.07538.68719.978
243.07538.68719.978
343.07538.68719.978
443.49340.17519.742
538.06834.51516.073
642.05441.53020.015
743.26039.59319.138
838.21933.29116.167
941.99541.23921.584
1042.72240.83020.481
1137.96034.36916.157
Disclaimer/Publisher’s Note: The statements, opinions and data contained in all publications are solely those of the individual author(s) and contributor(s) and not of MDPI and/or the editor(s). MDPI and/or the editor(s) disclaim responsibility for any injury to people or property resulting from any ideas, methods, instructions or products referred to in the content.