
Compositional Design and Thermal Processing of a Novel Lead-Free Cu–Zn–Al–Sn Medium Entropy Brass Alloy

 ,
,  , , and
Abstract
:1. Introduction
2. Materials and Methods
2.1. Computational Methods
2.2. Experimental Methods
3. Results and Discussion
3.1. Thermo-Physical Parameters for Phase Formation in HEAs
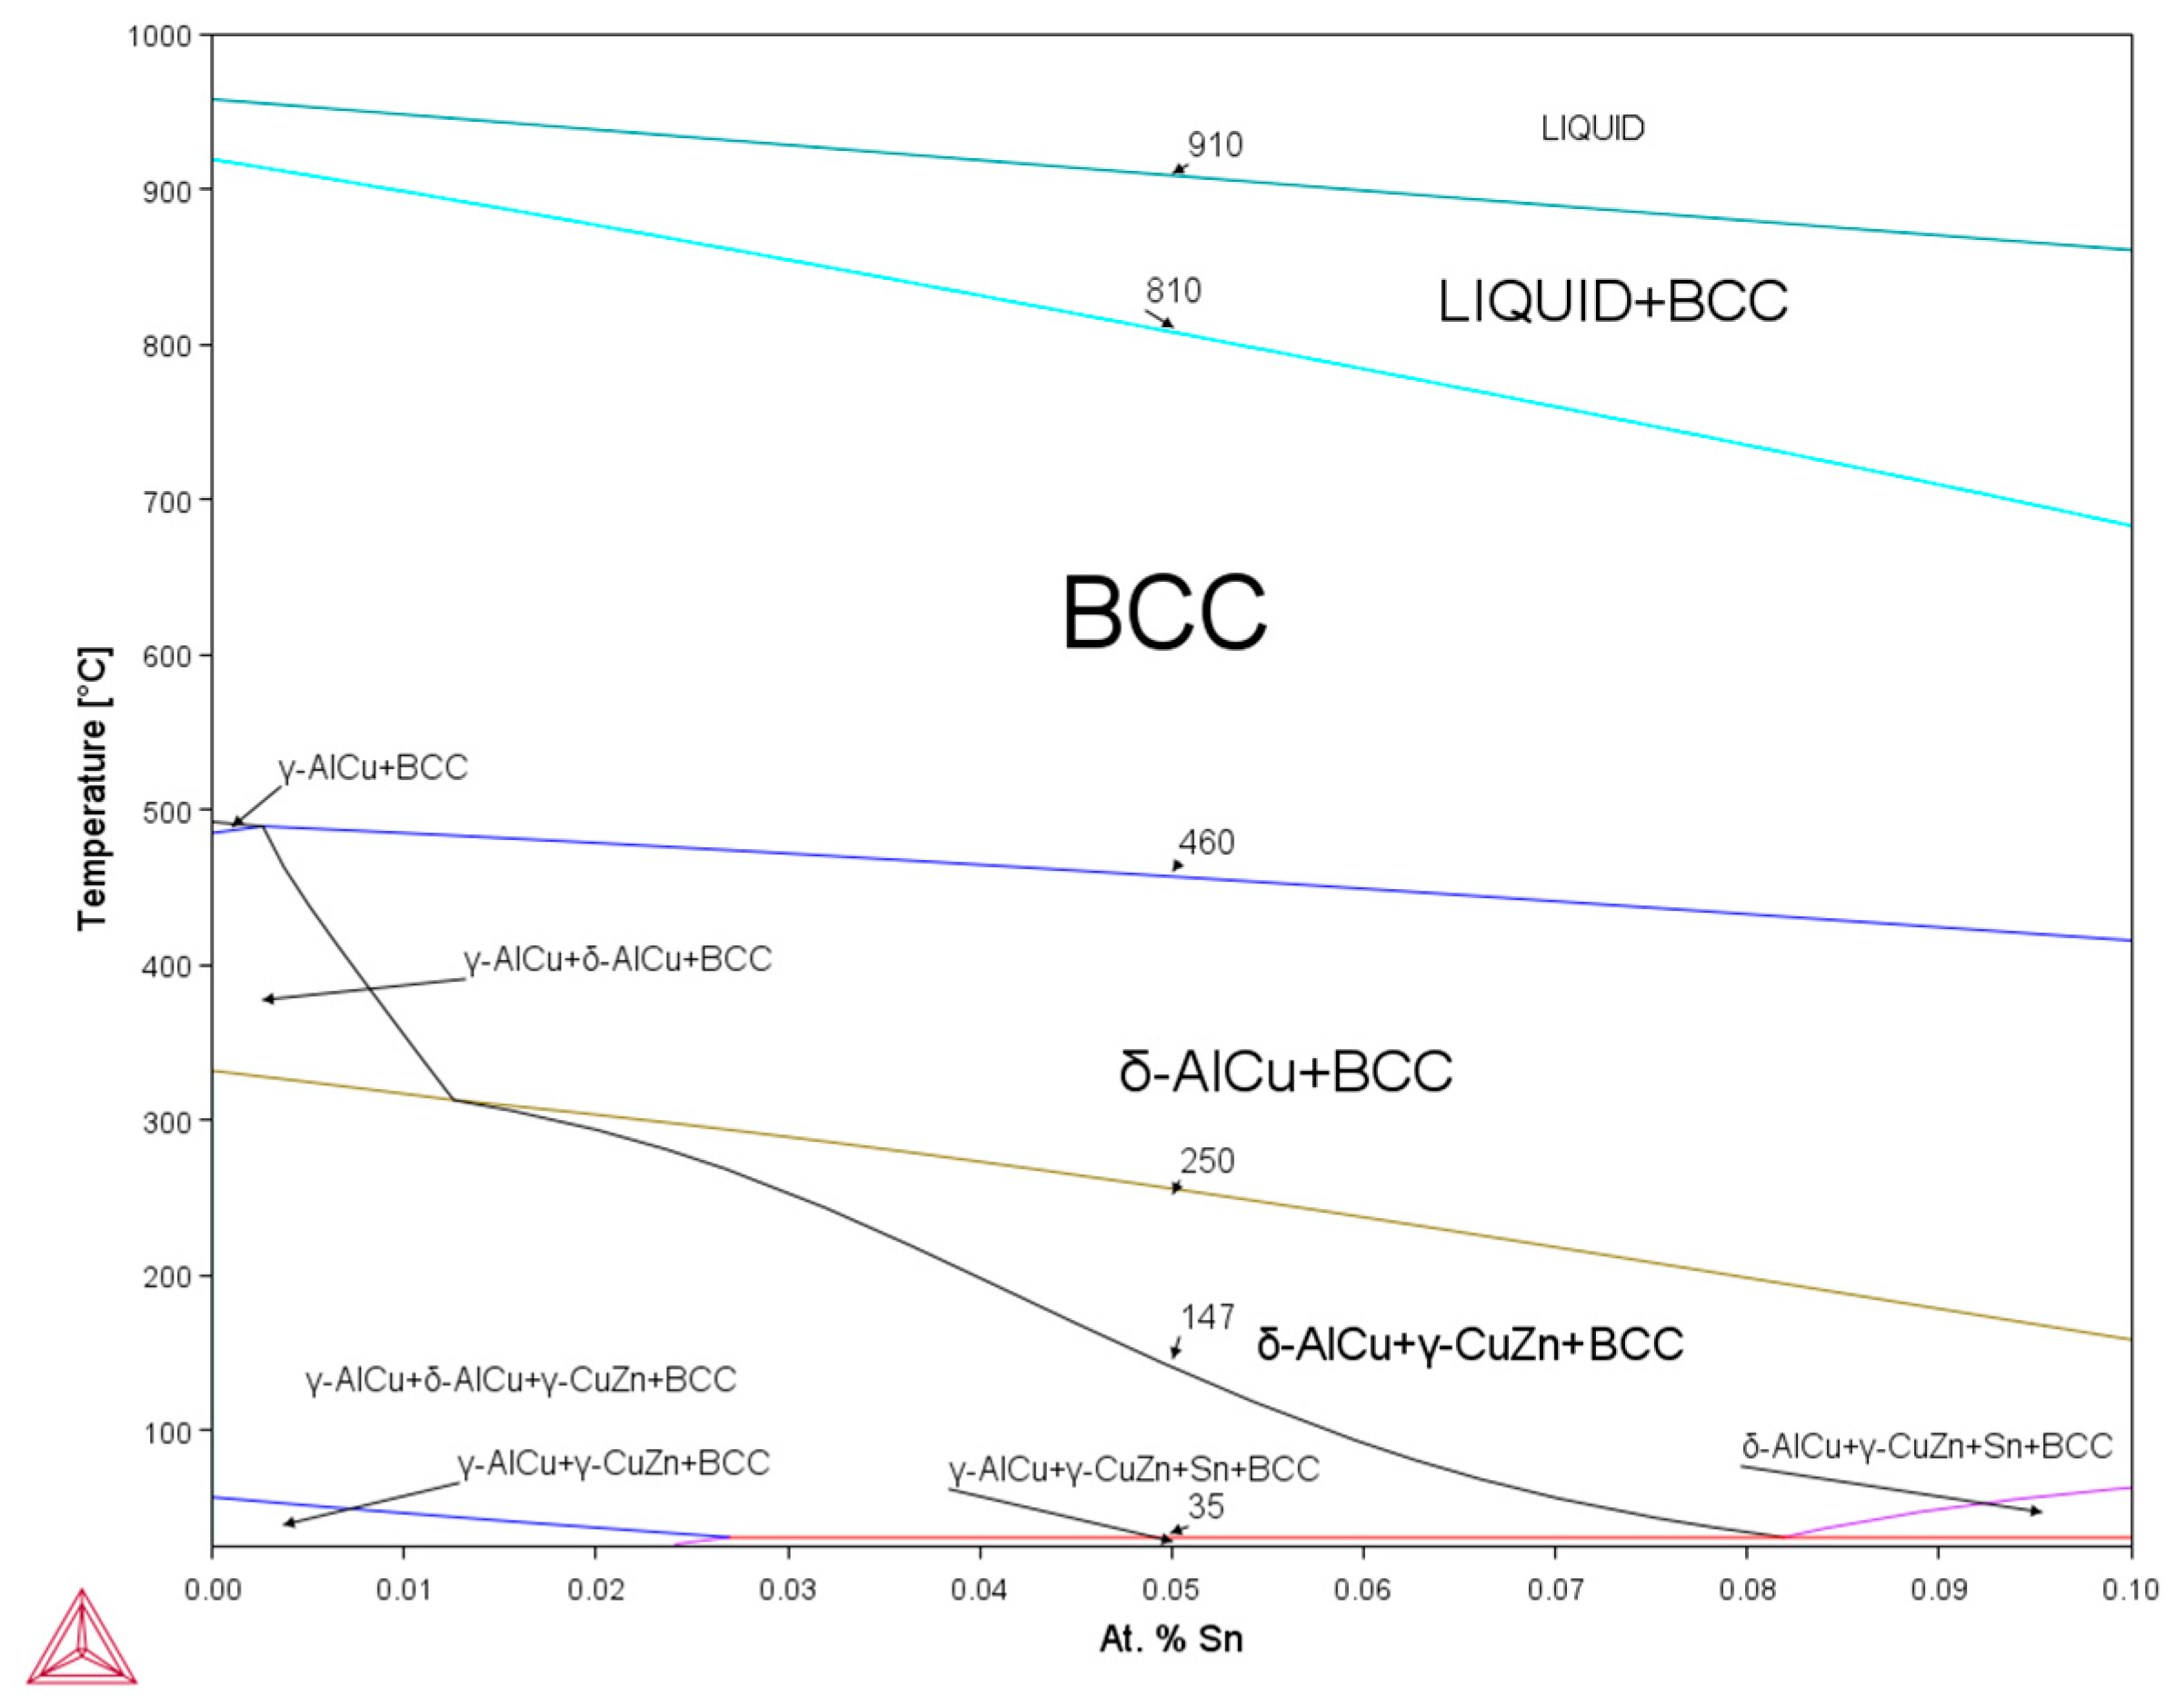
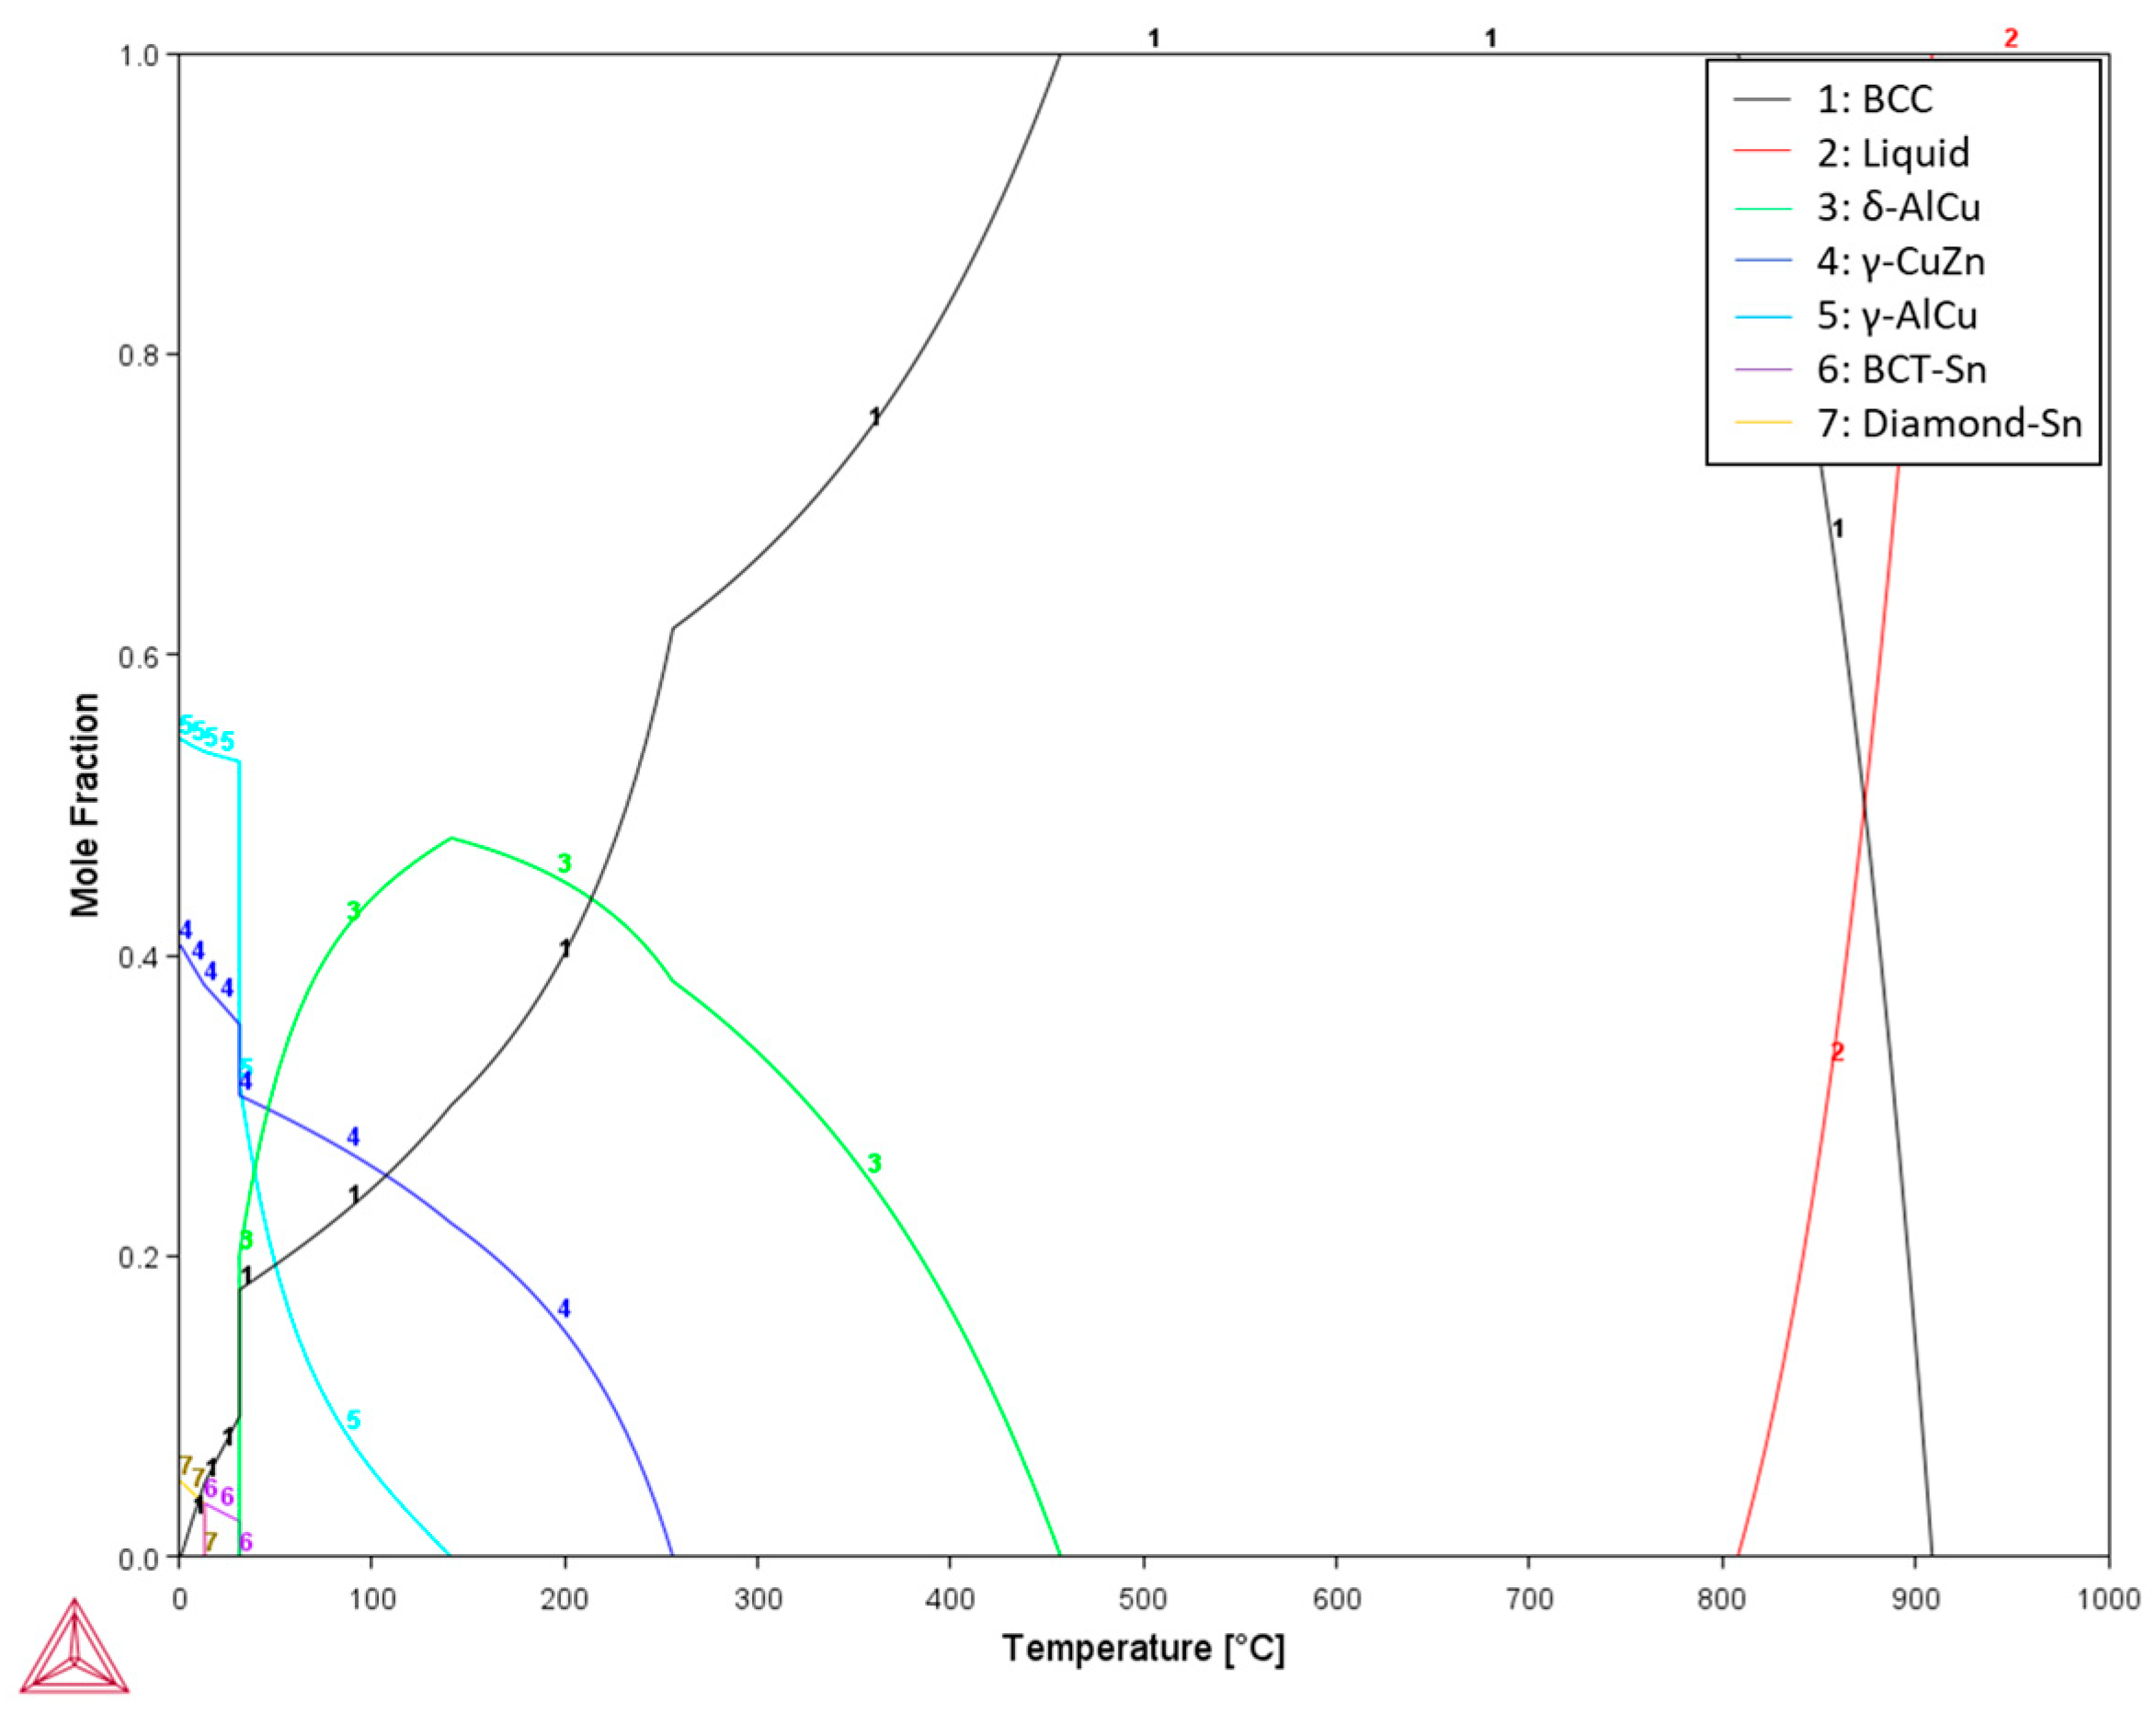
3.2. CALPHAD Methodology and Equilibrium Phase Diagram
3.3. Solidification Zones
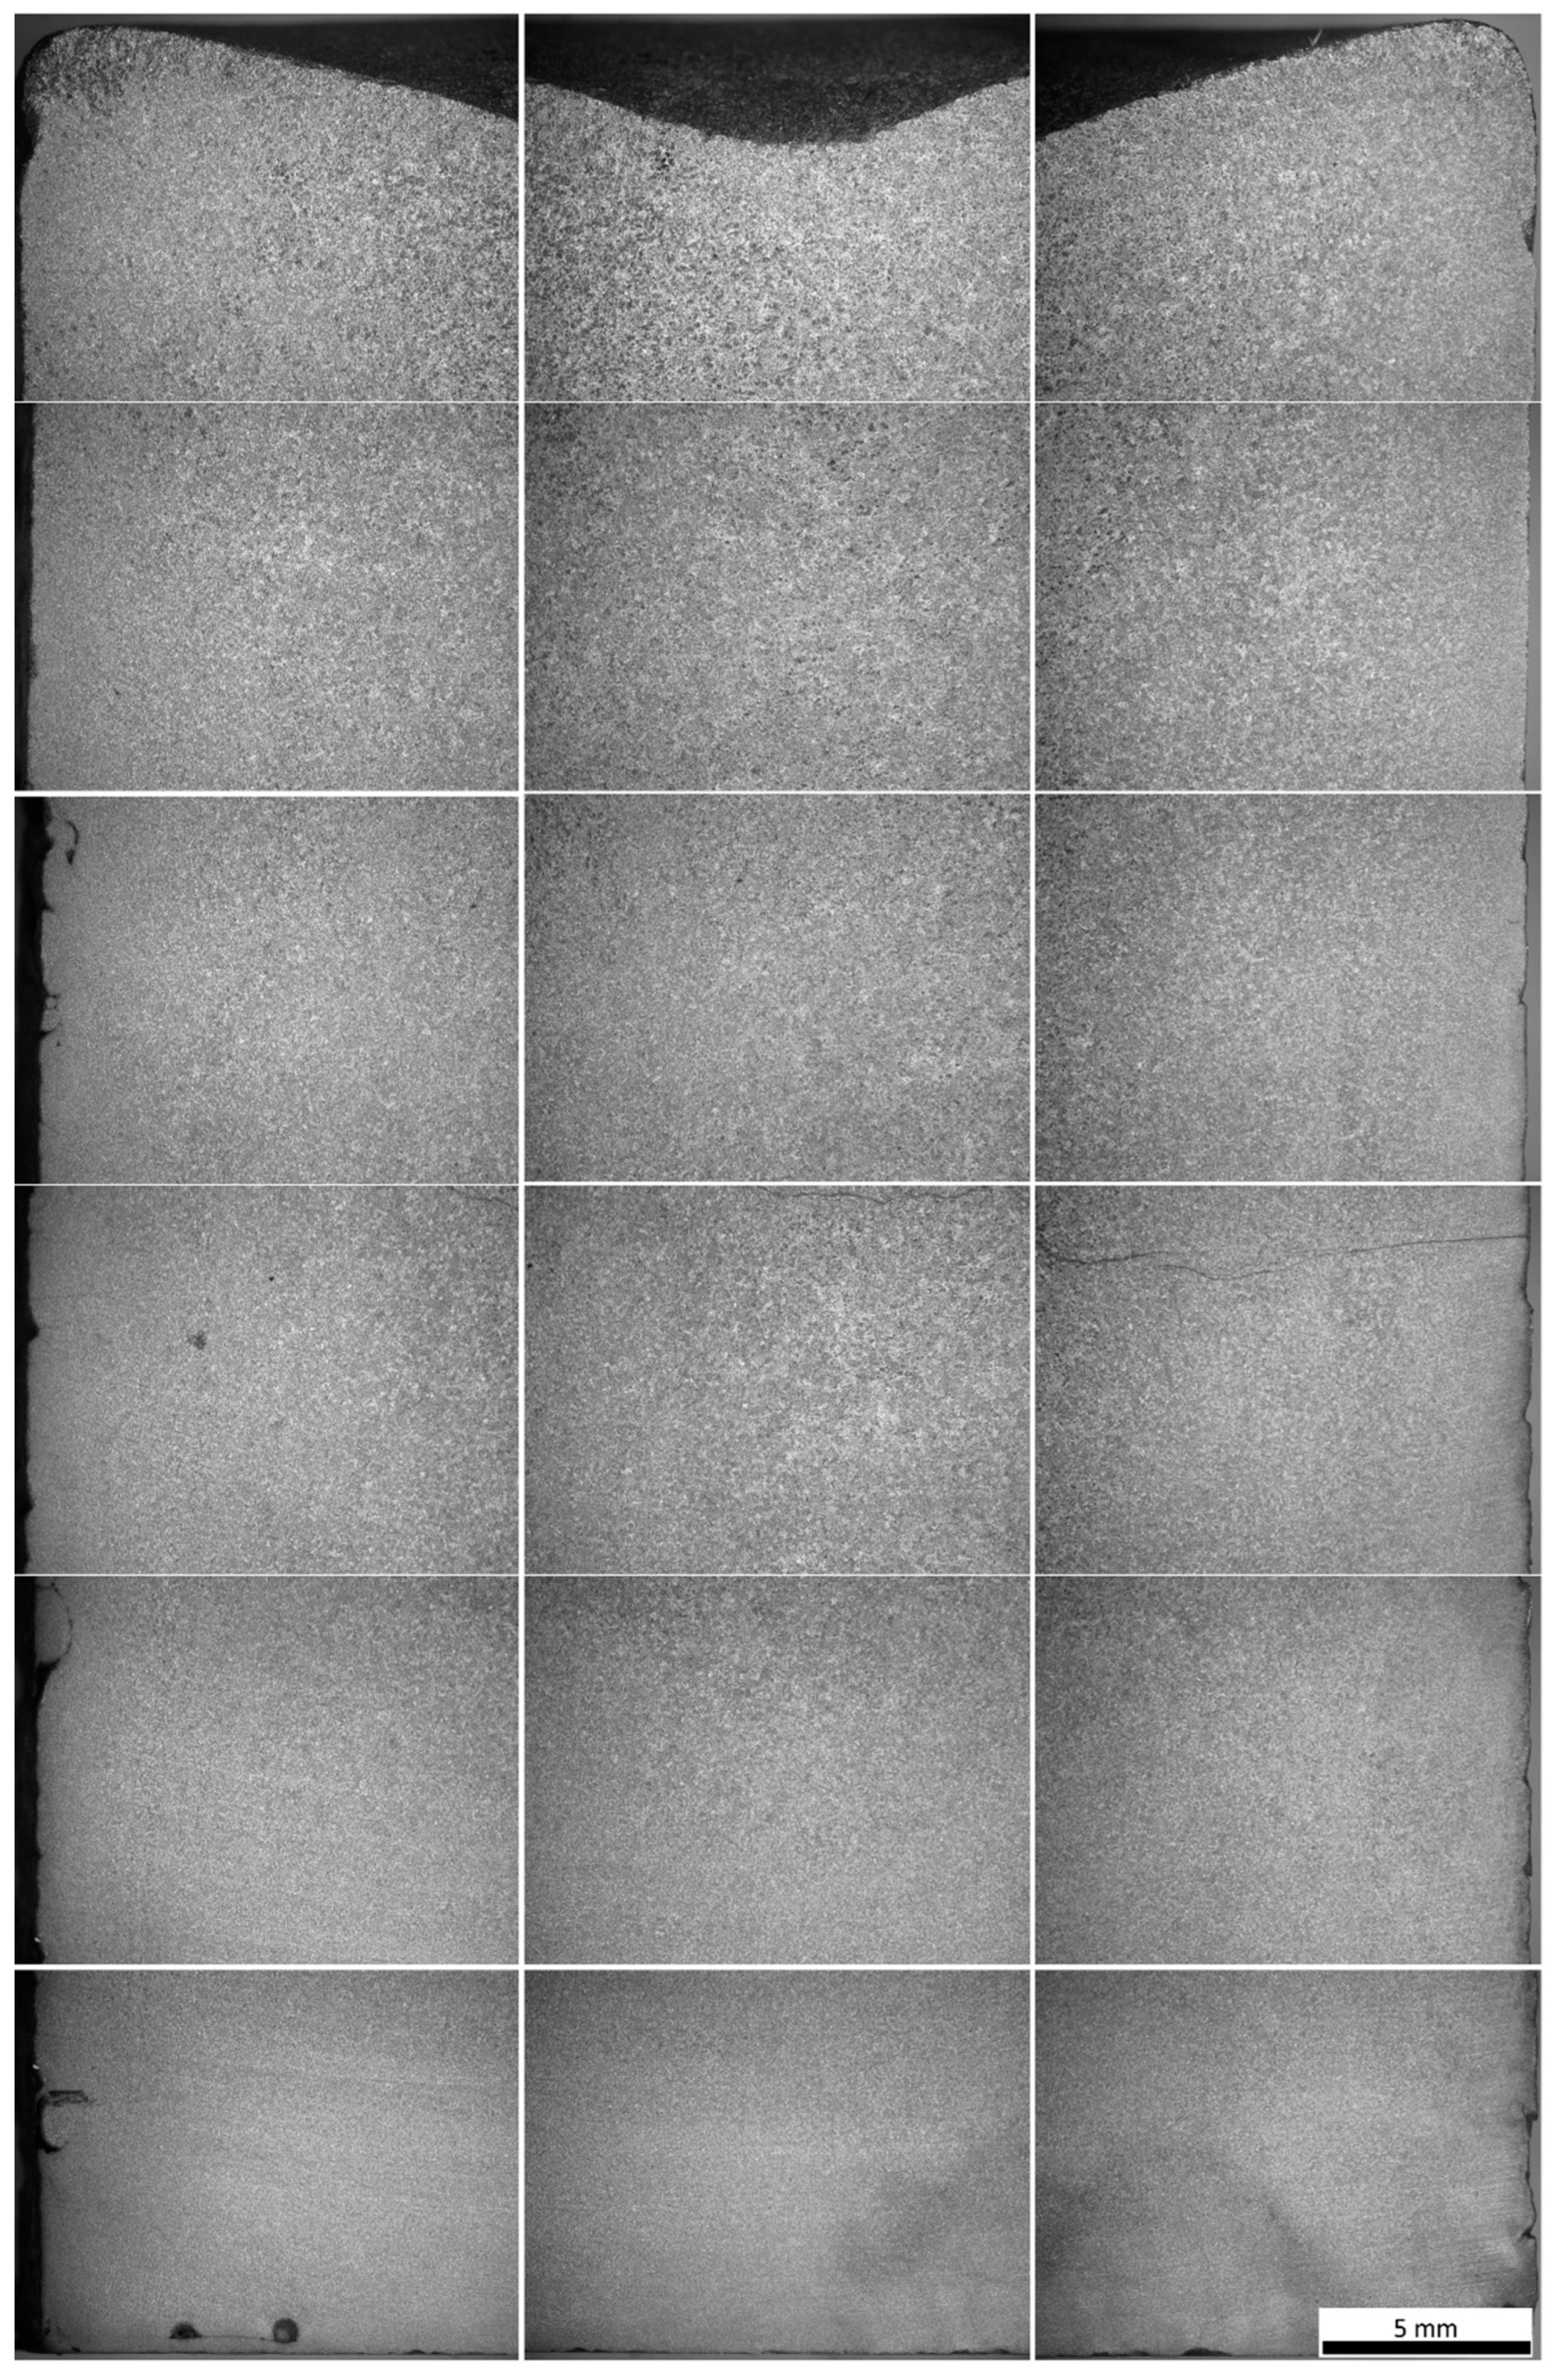
3.4. Microstructural Characterization
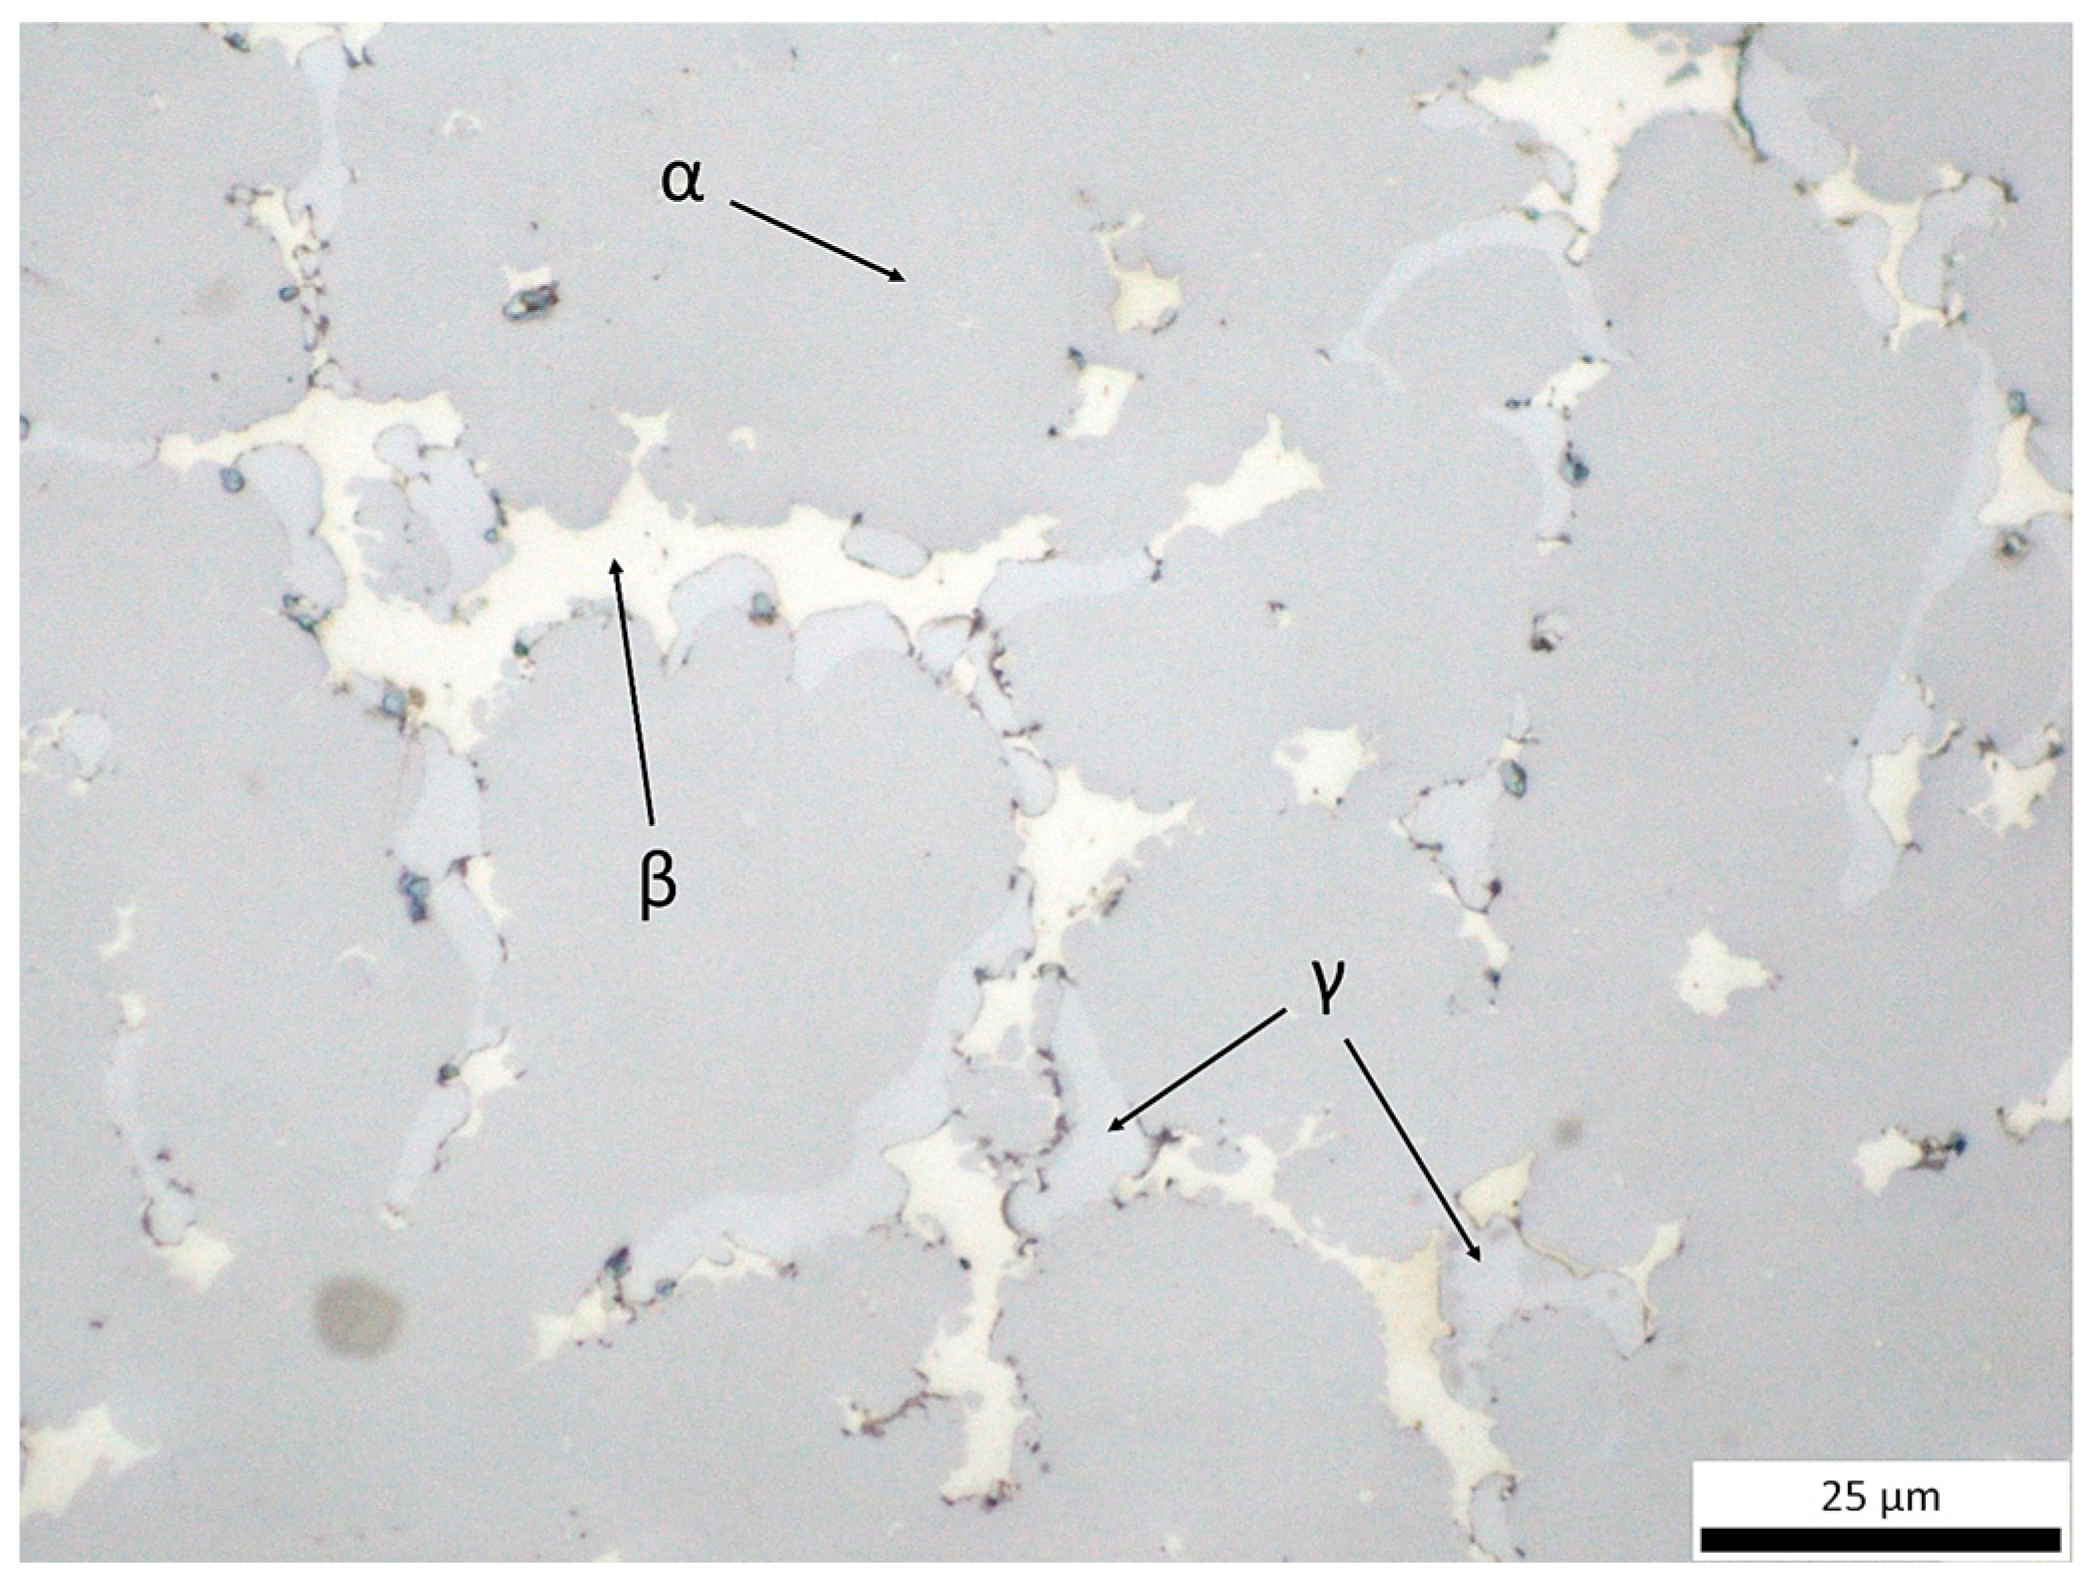
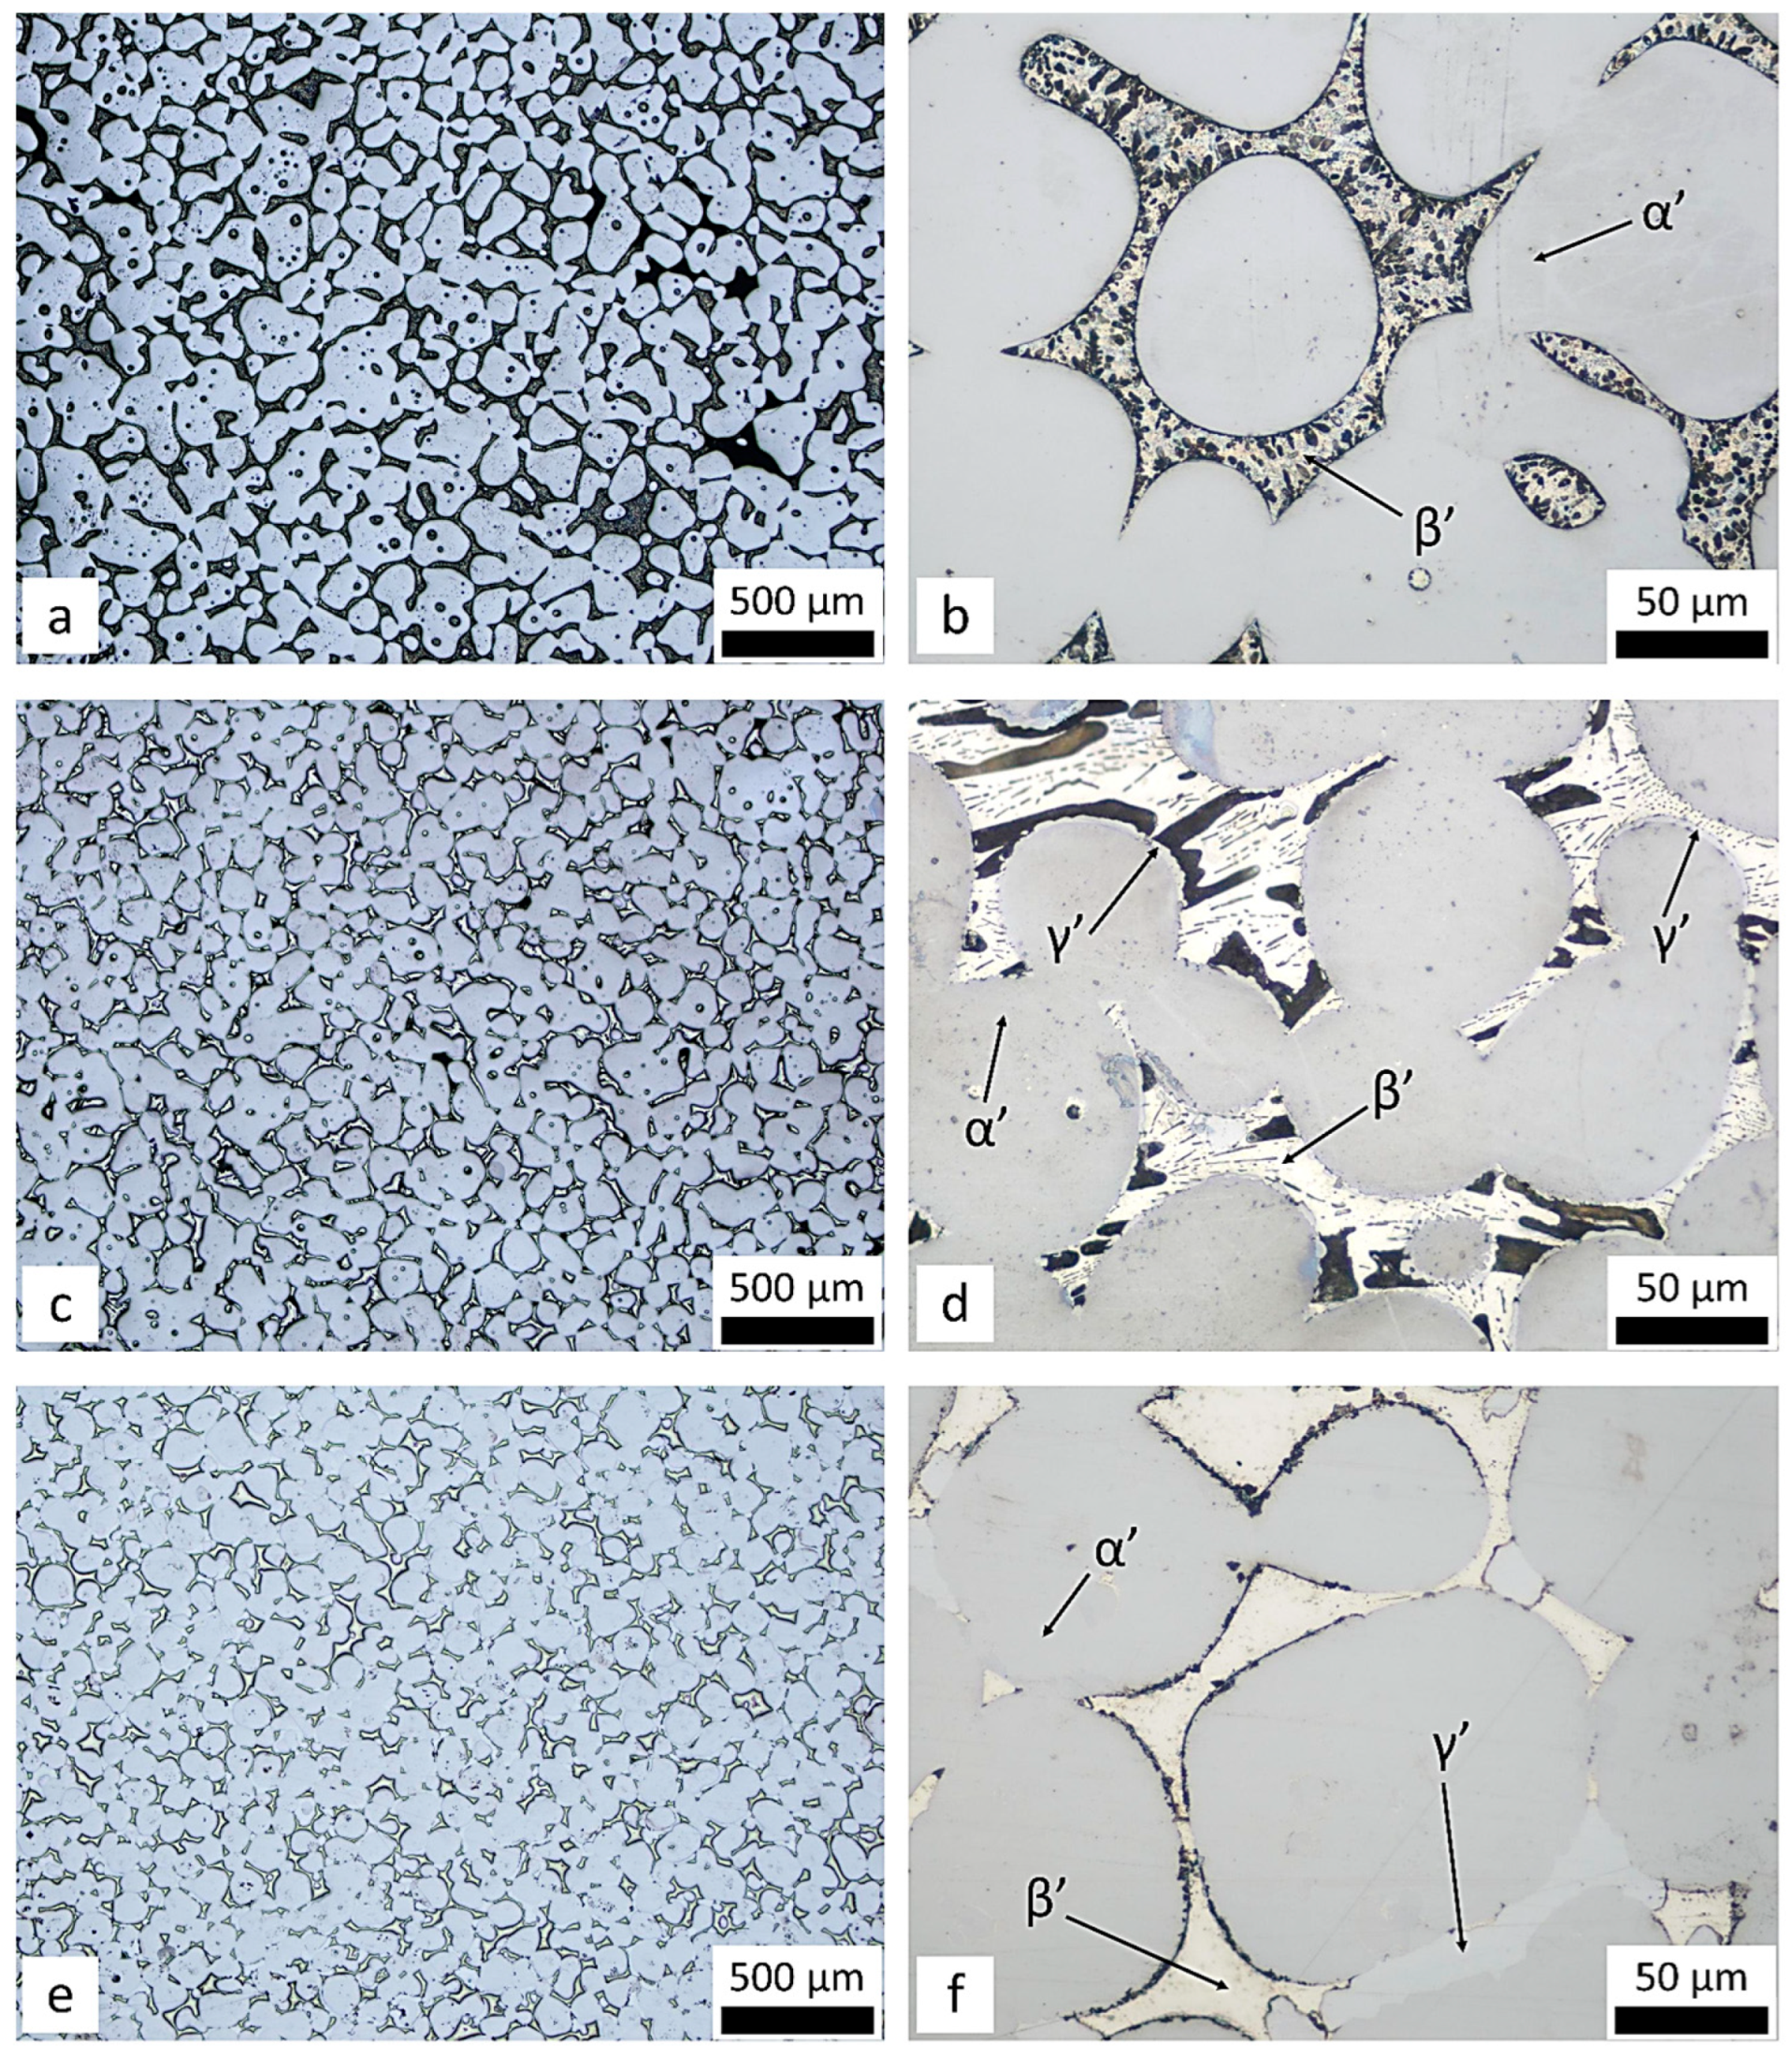
3.4.1. Optical Microscopy
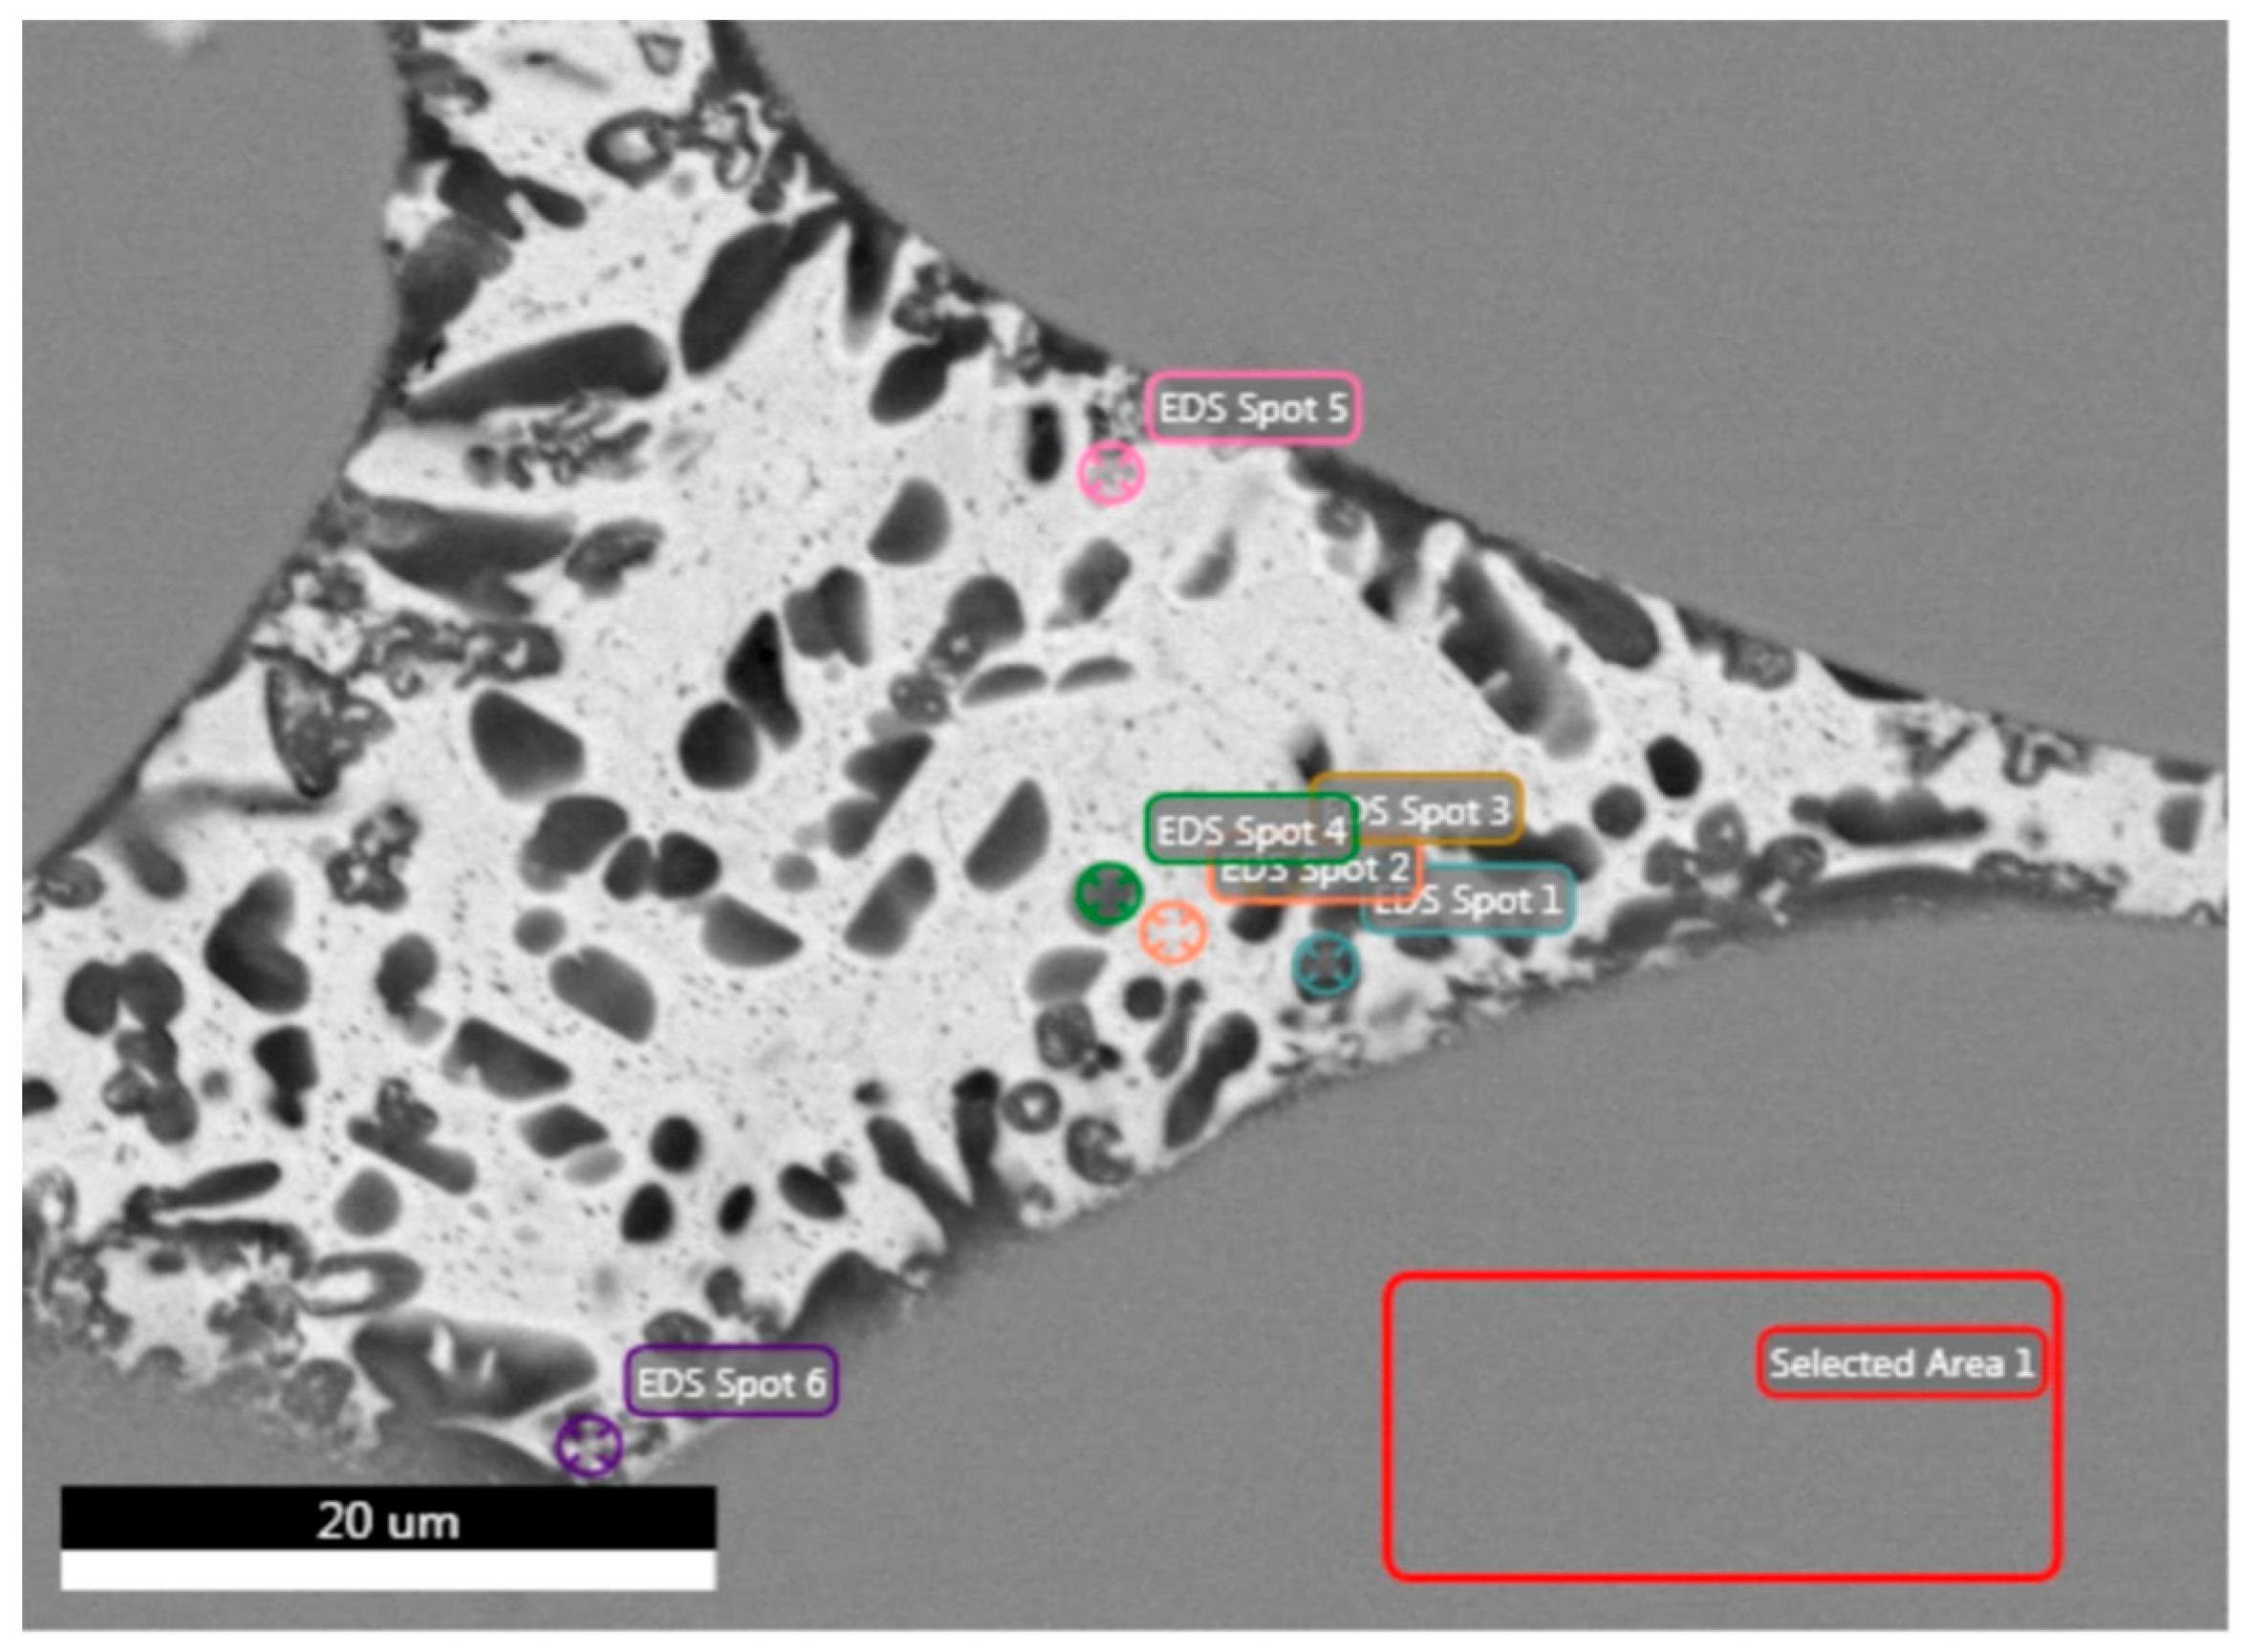
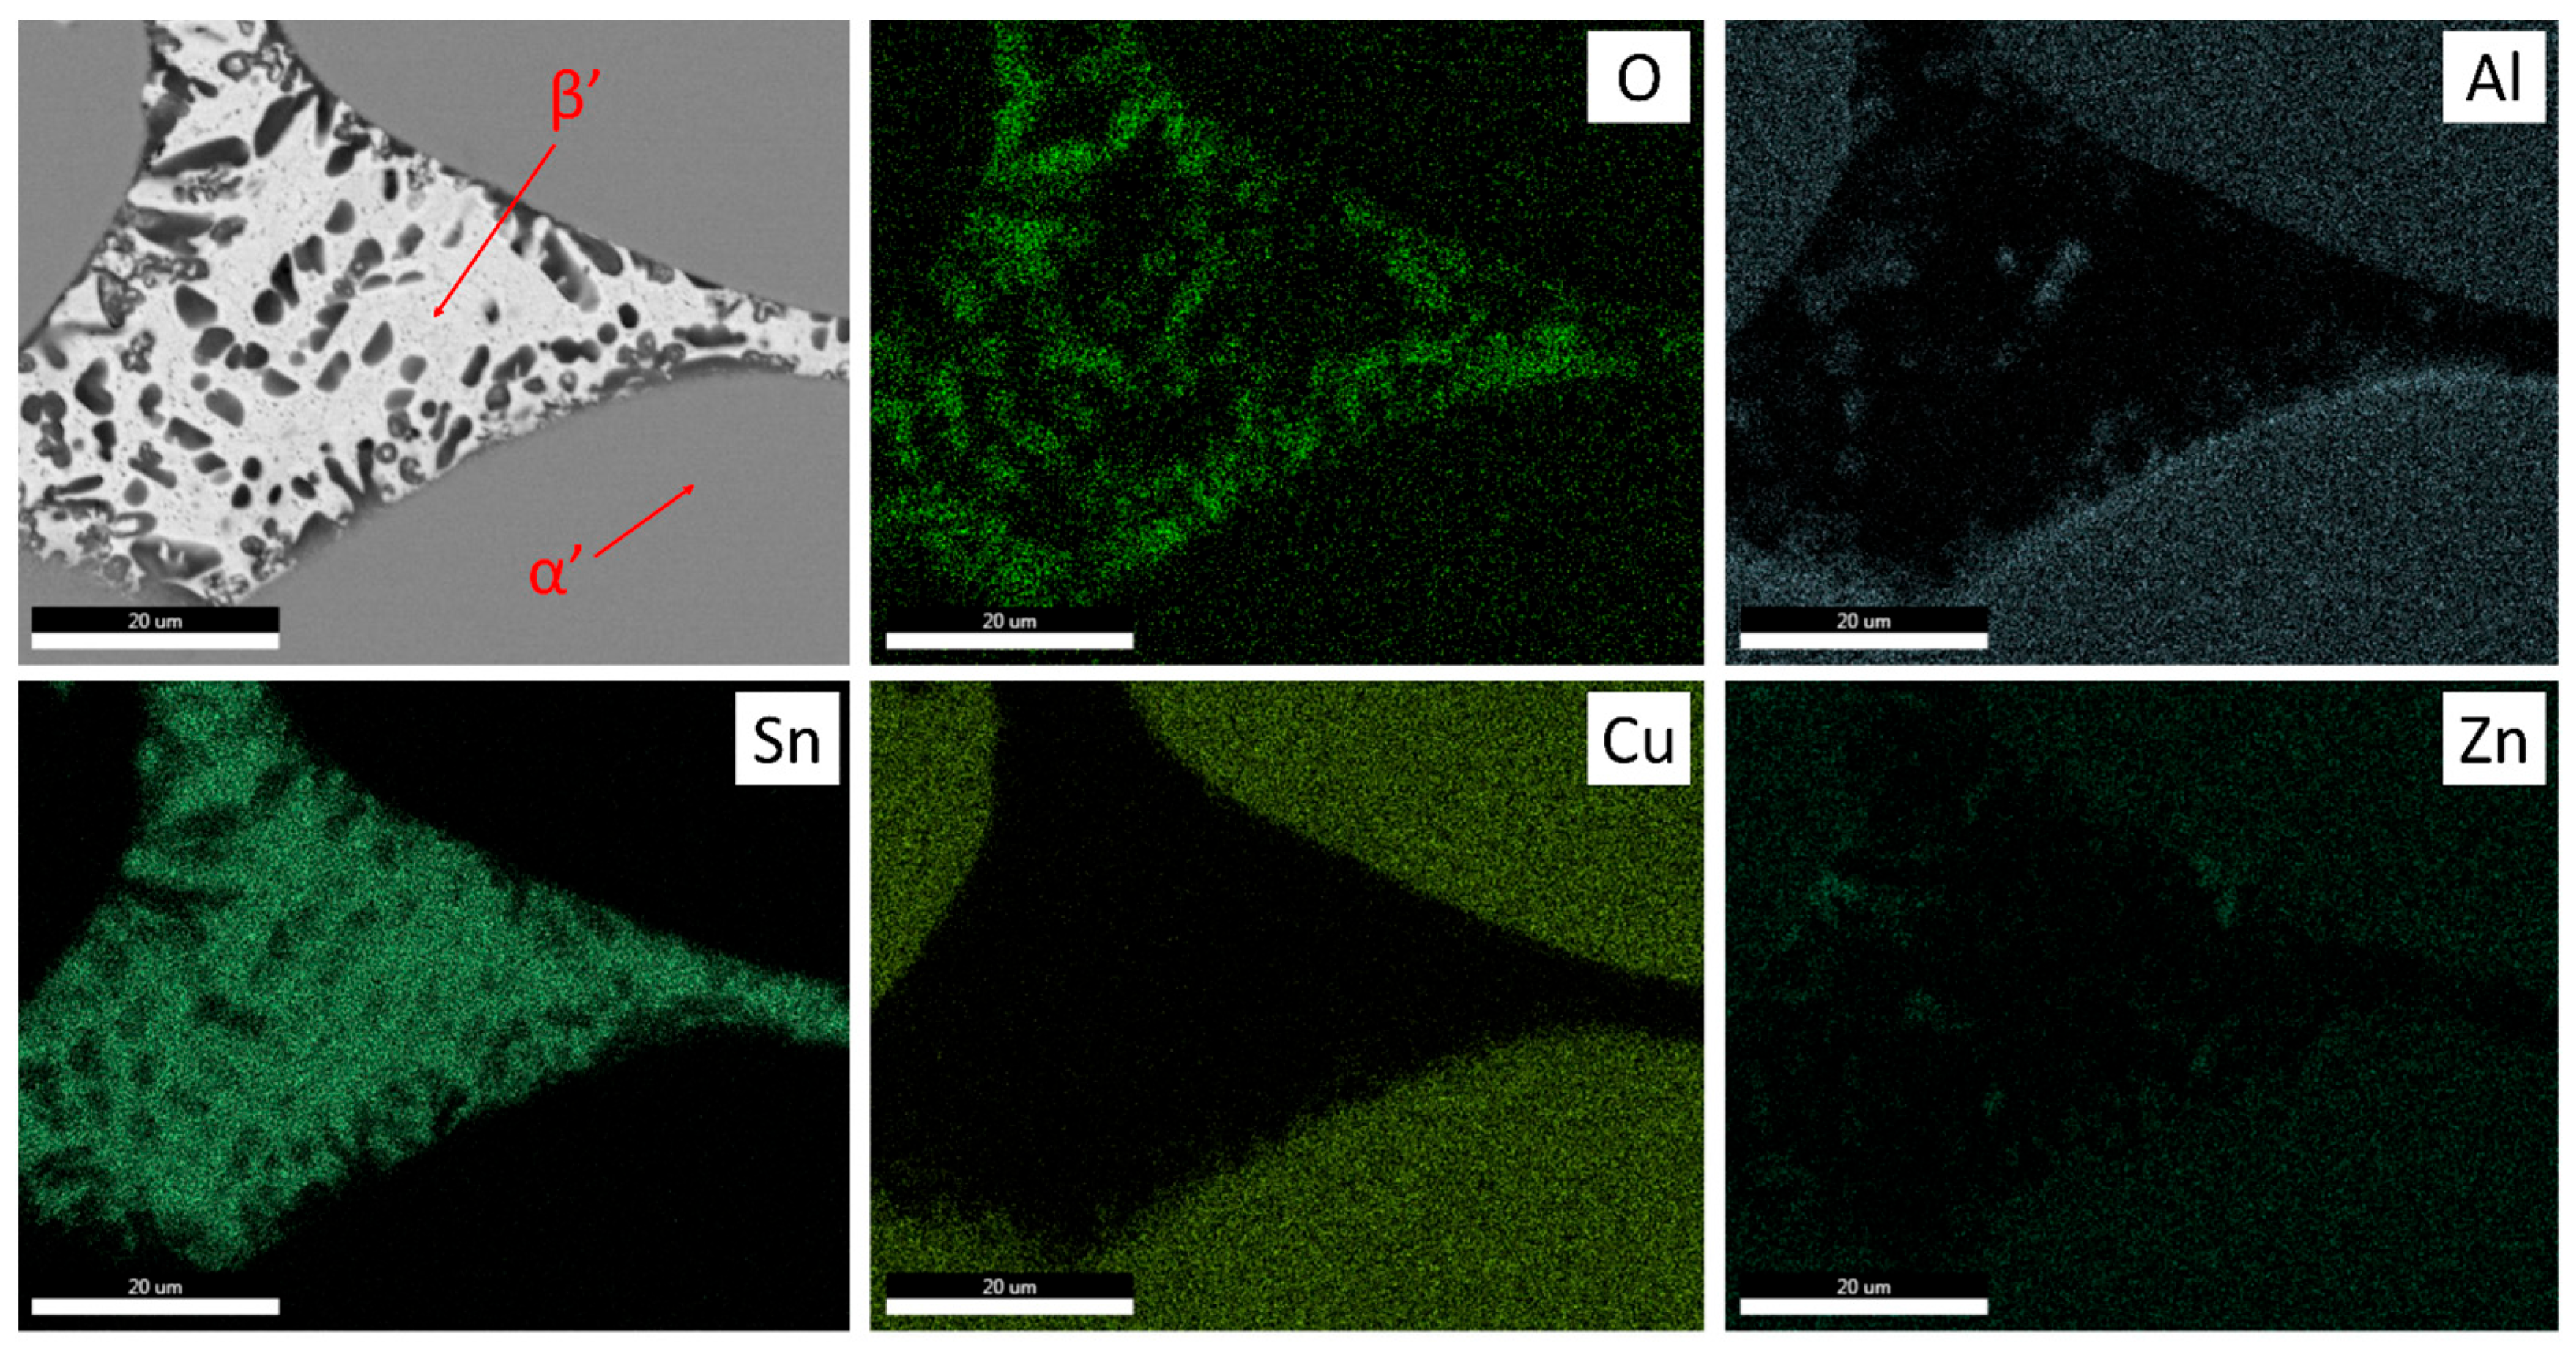
3.4.2. SEM and EDS Analysis
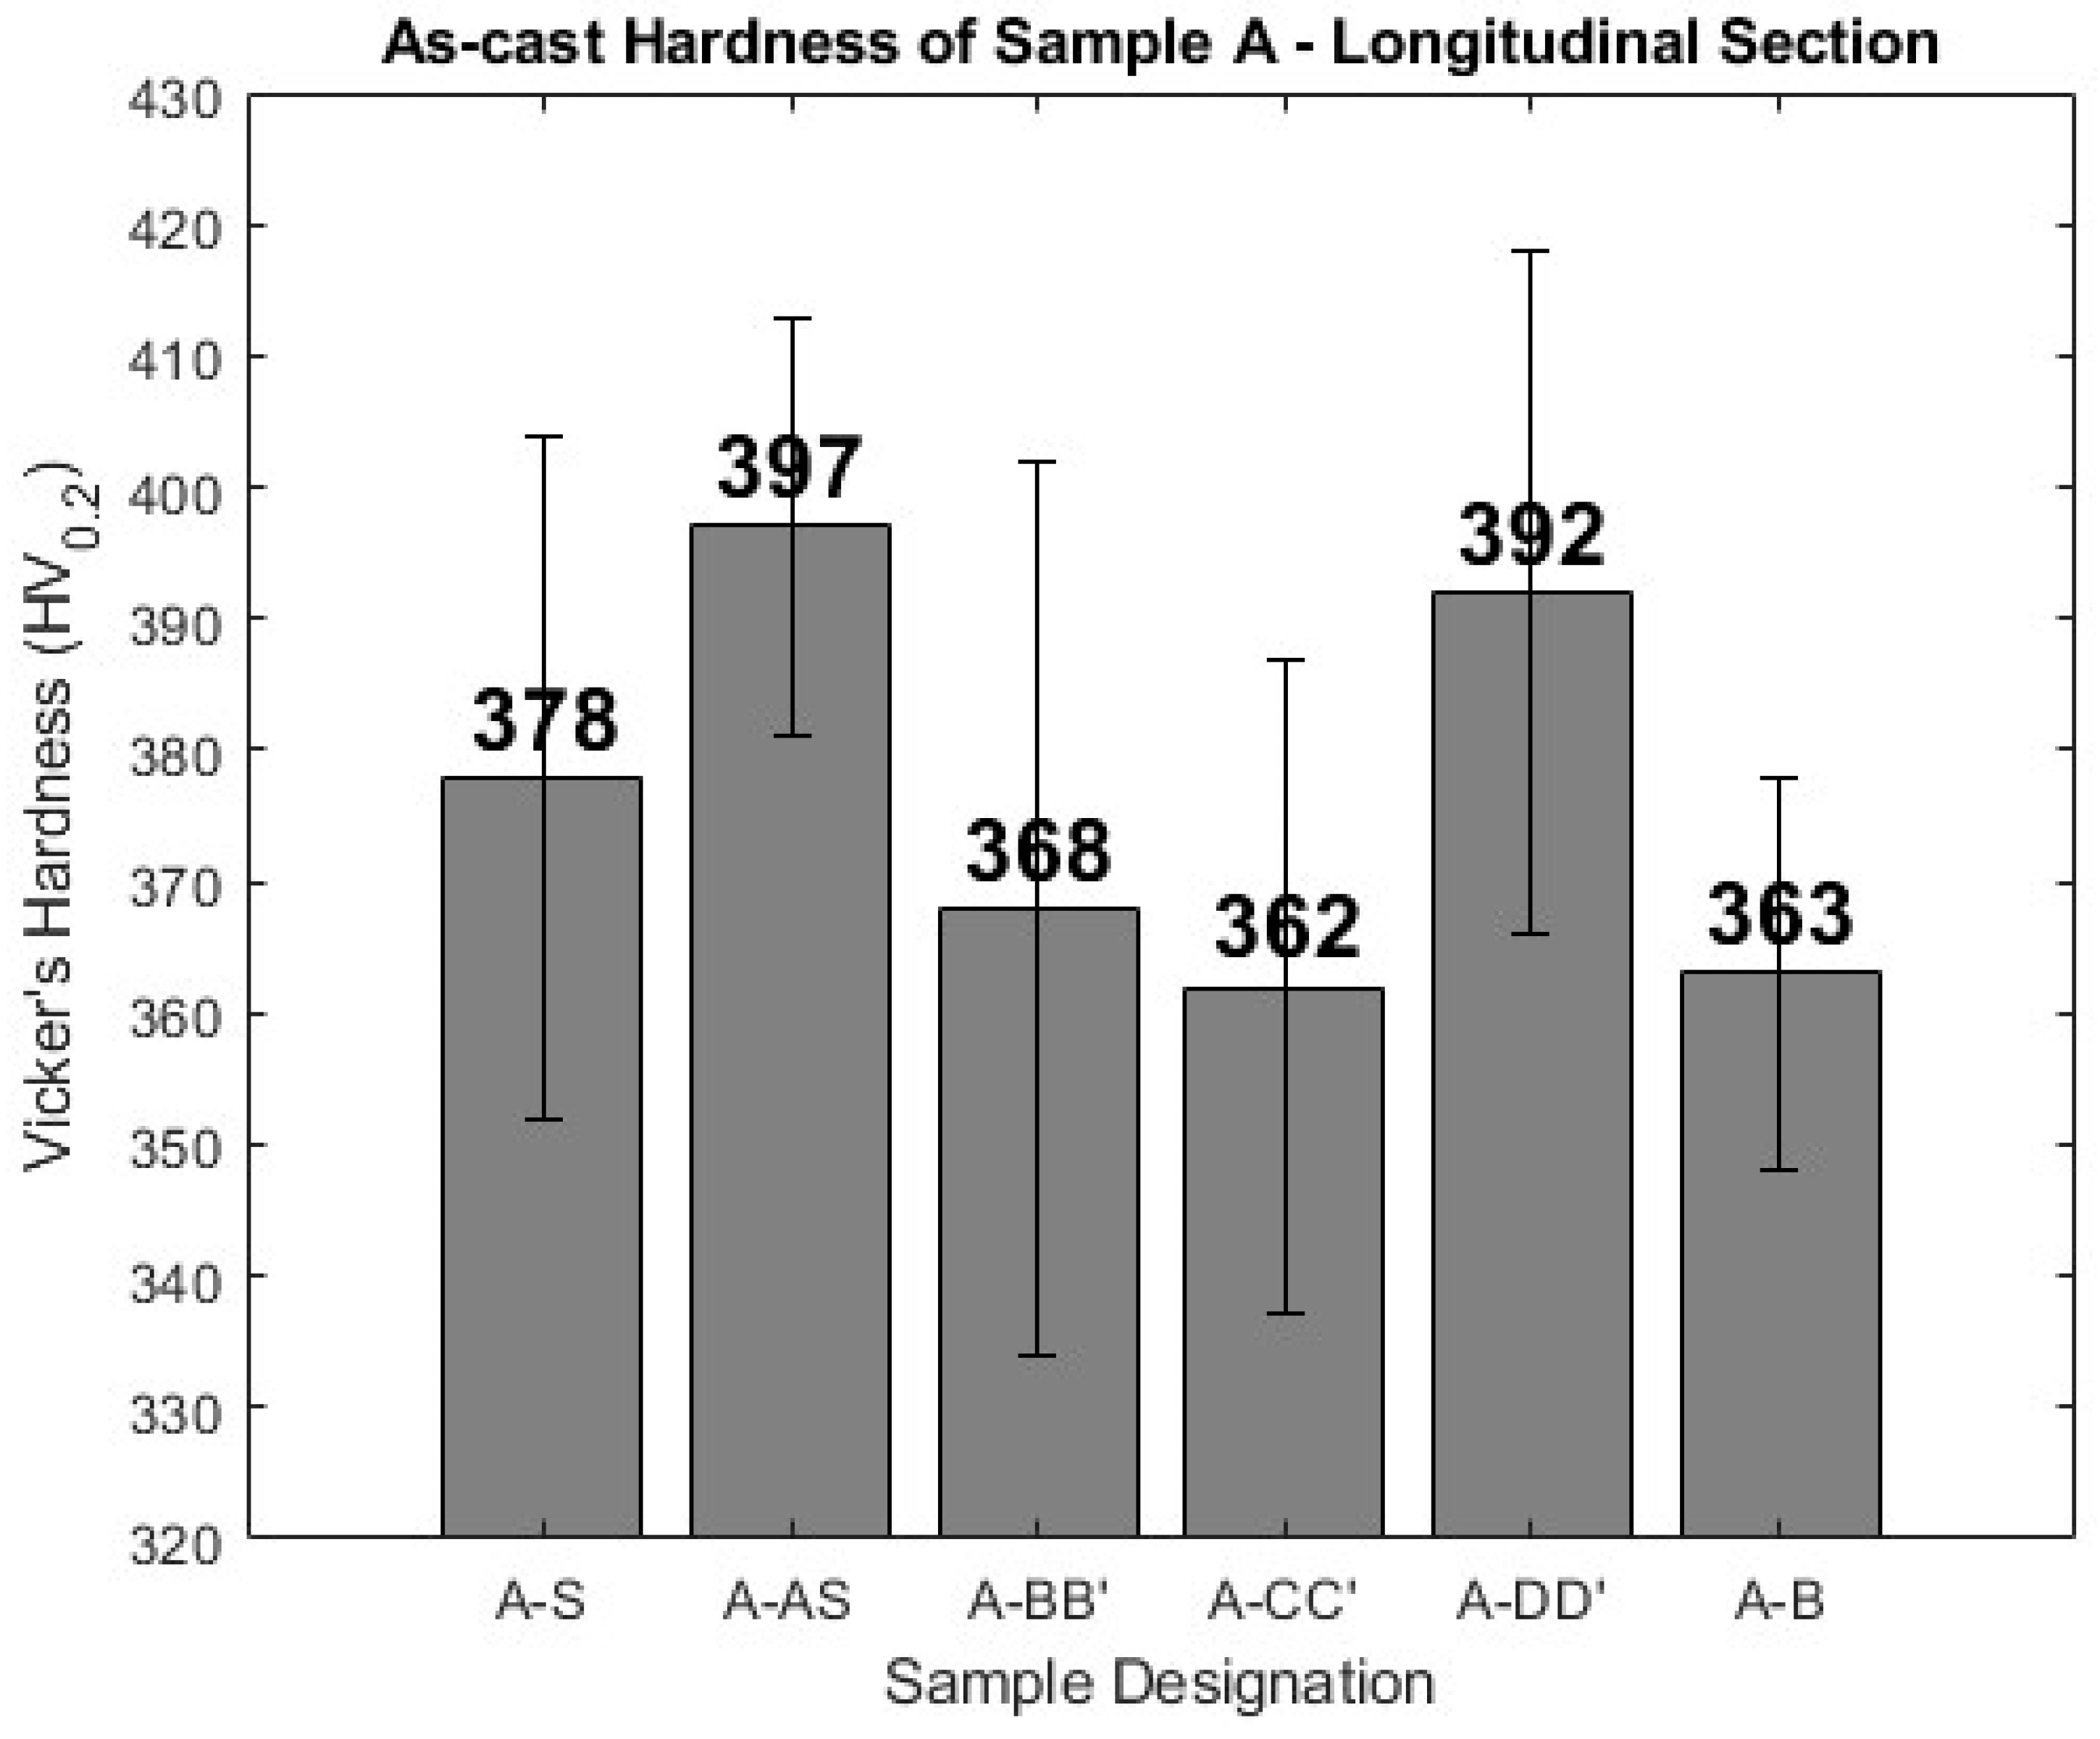
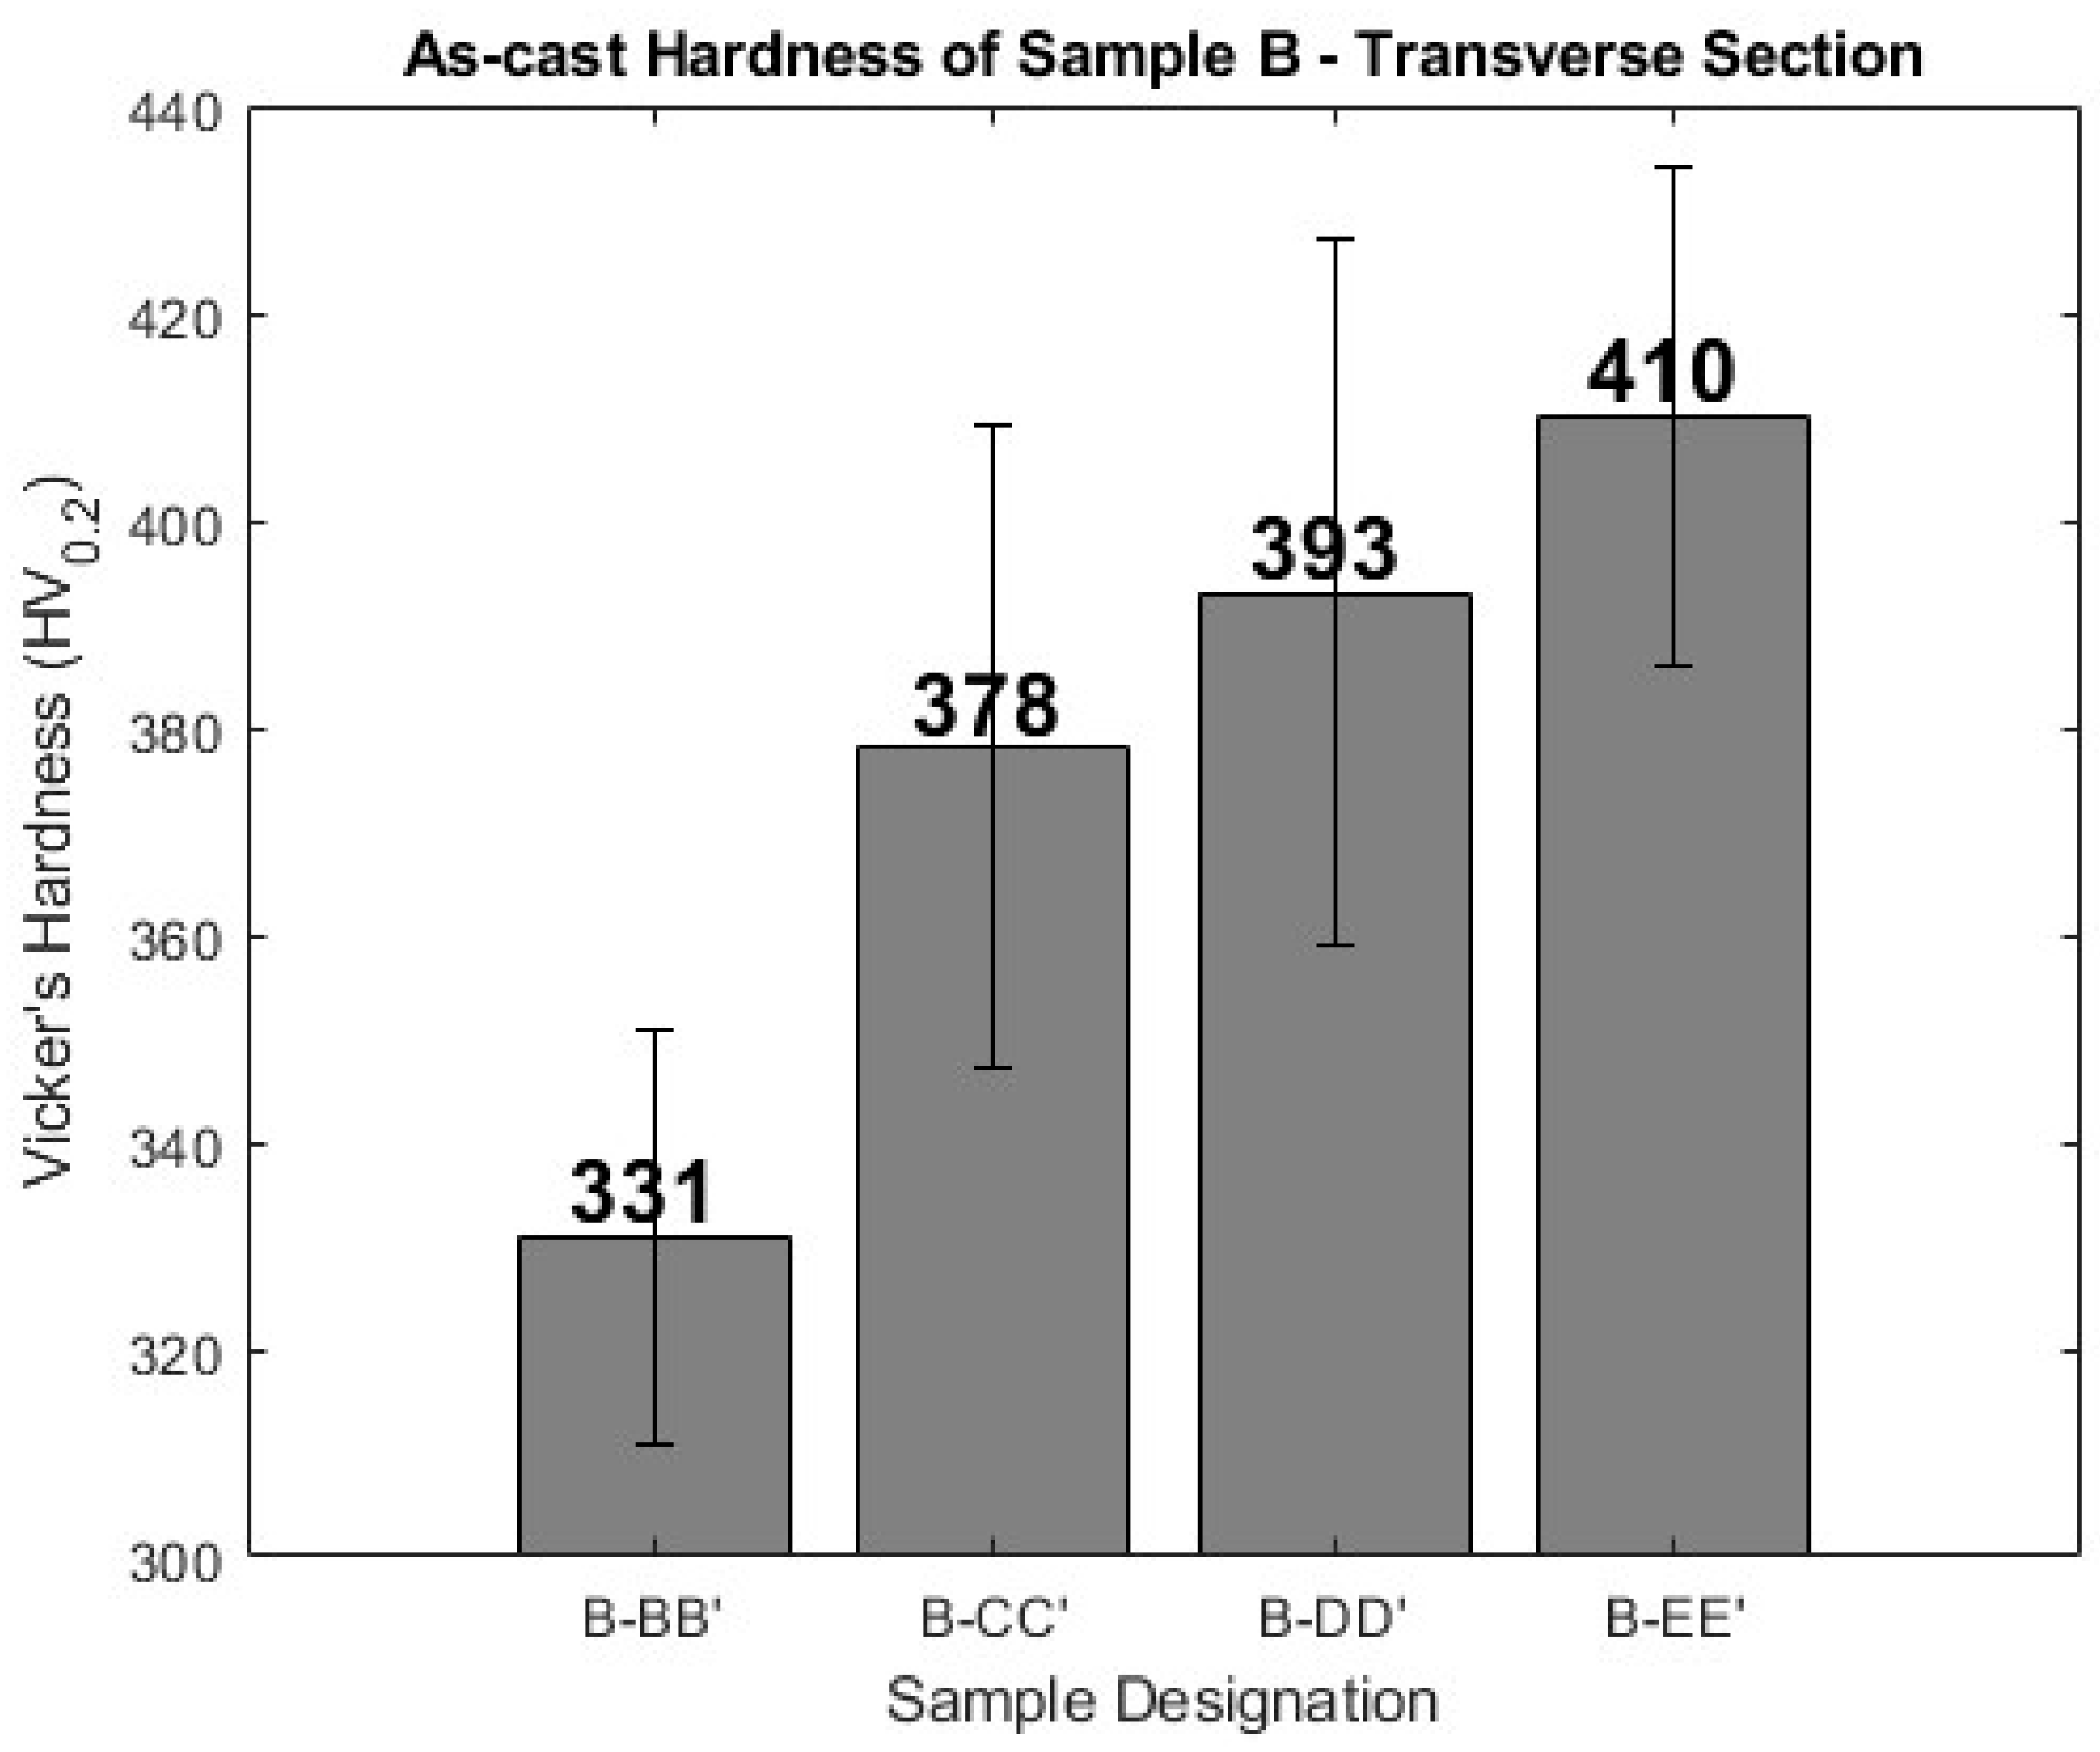
3.5. Mechanical and Physical Properties
4. Conclusions
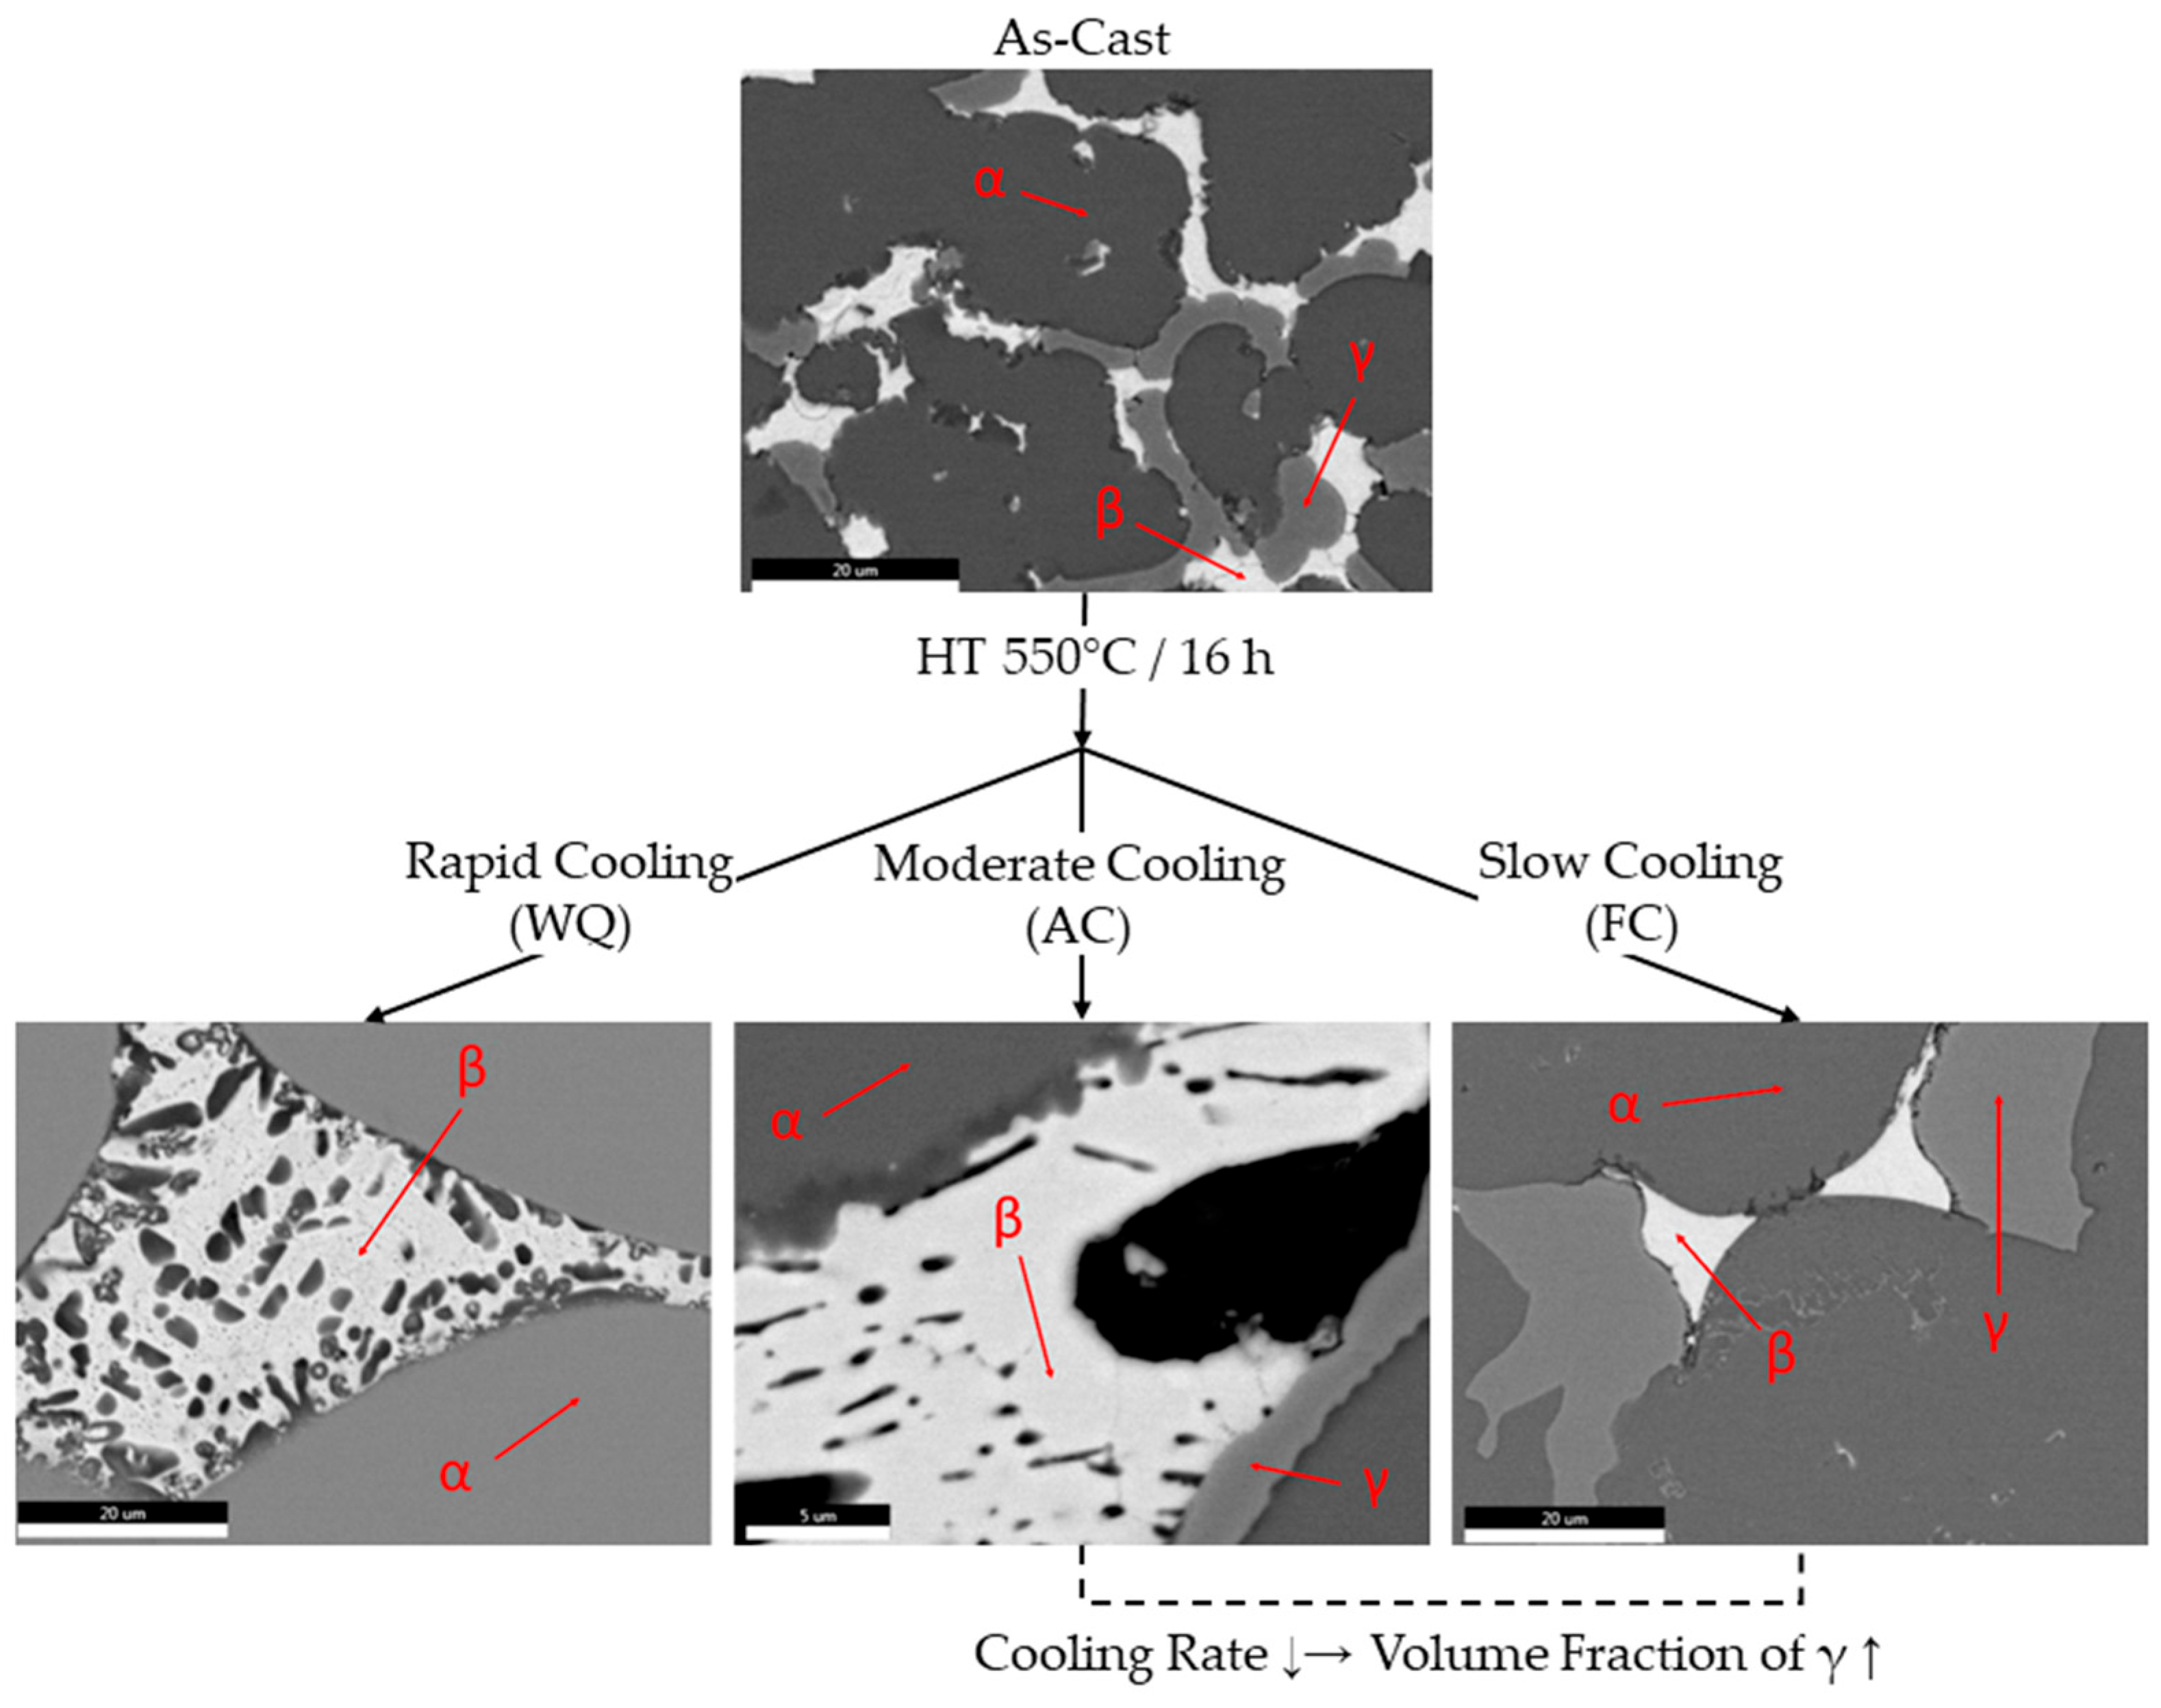
- The high cooling rate of the casting process led to the absence of a columnar solidification zone in the cast material.
- The ingot was characterized by notable macrosegregation phenomena, with the Al and Sn content complementing each other, moving from the top to the bottom of the ingot.
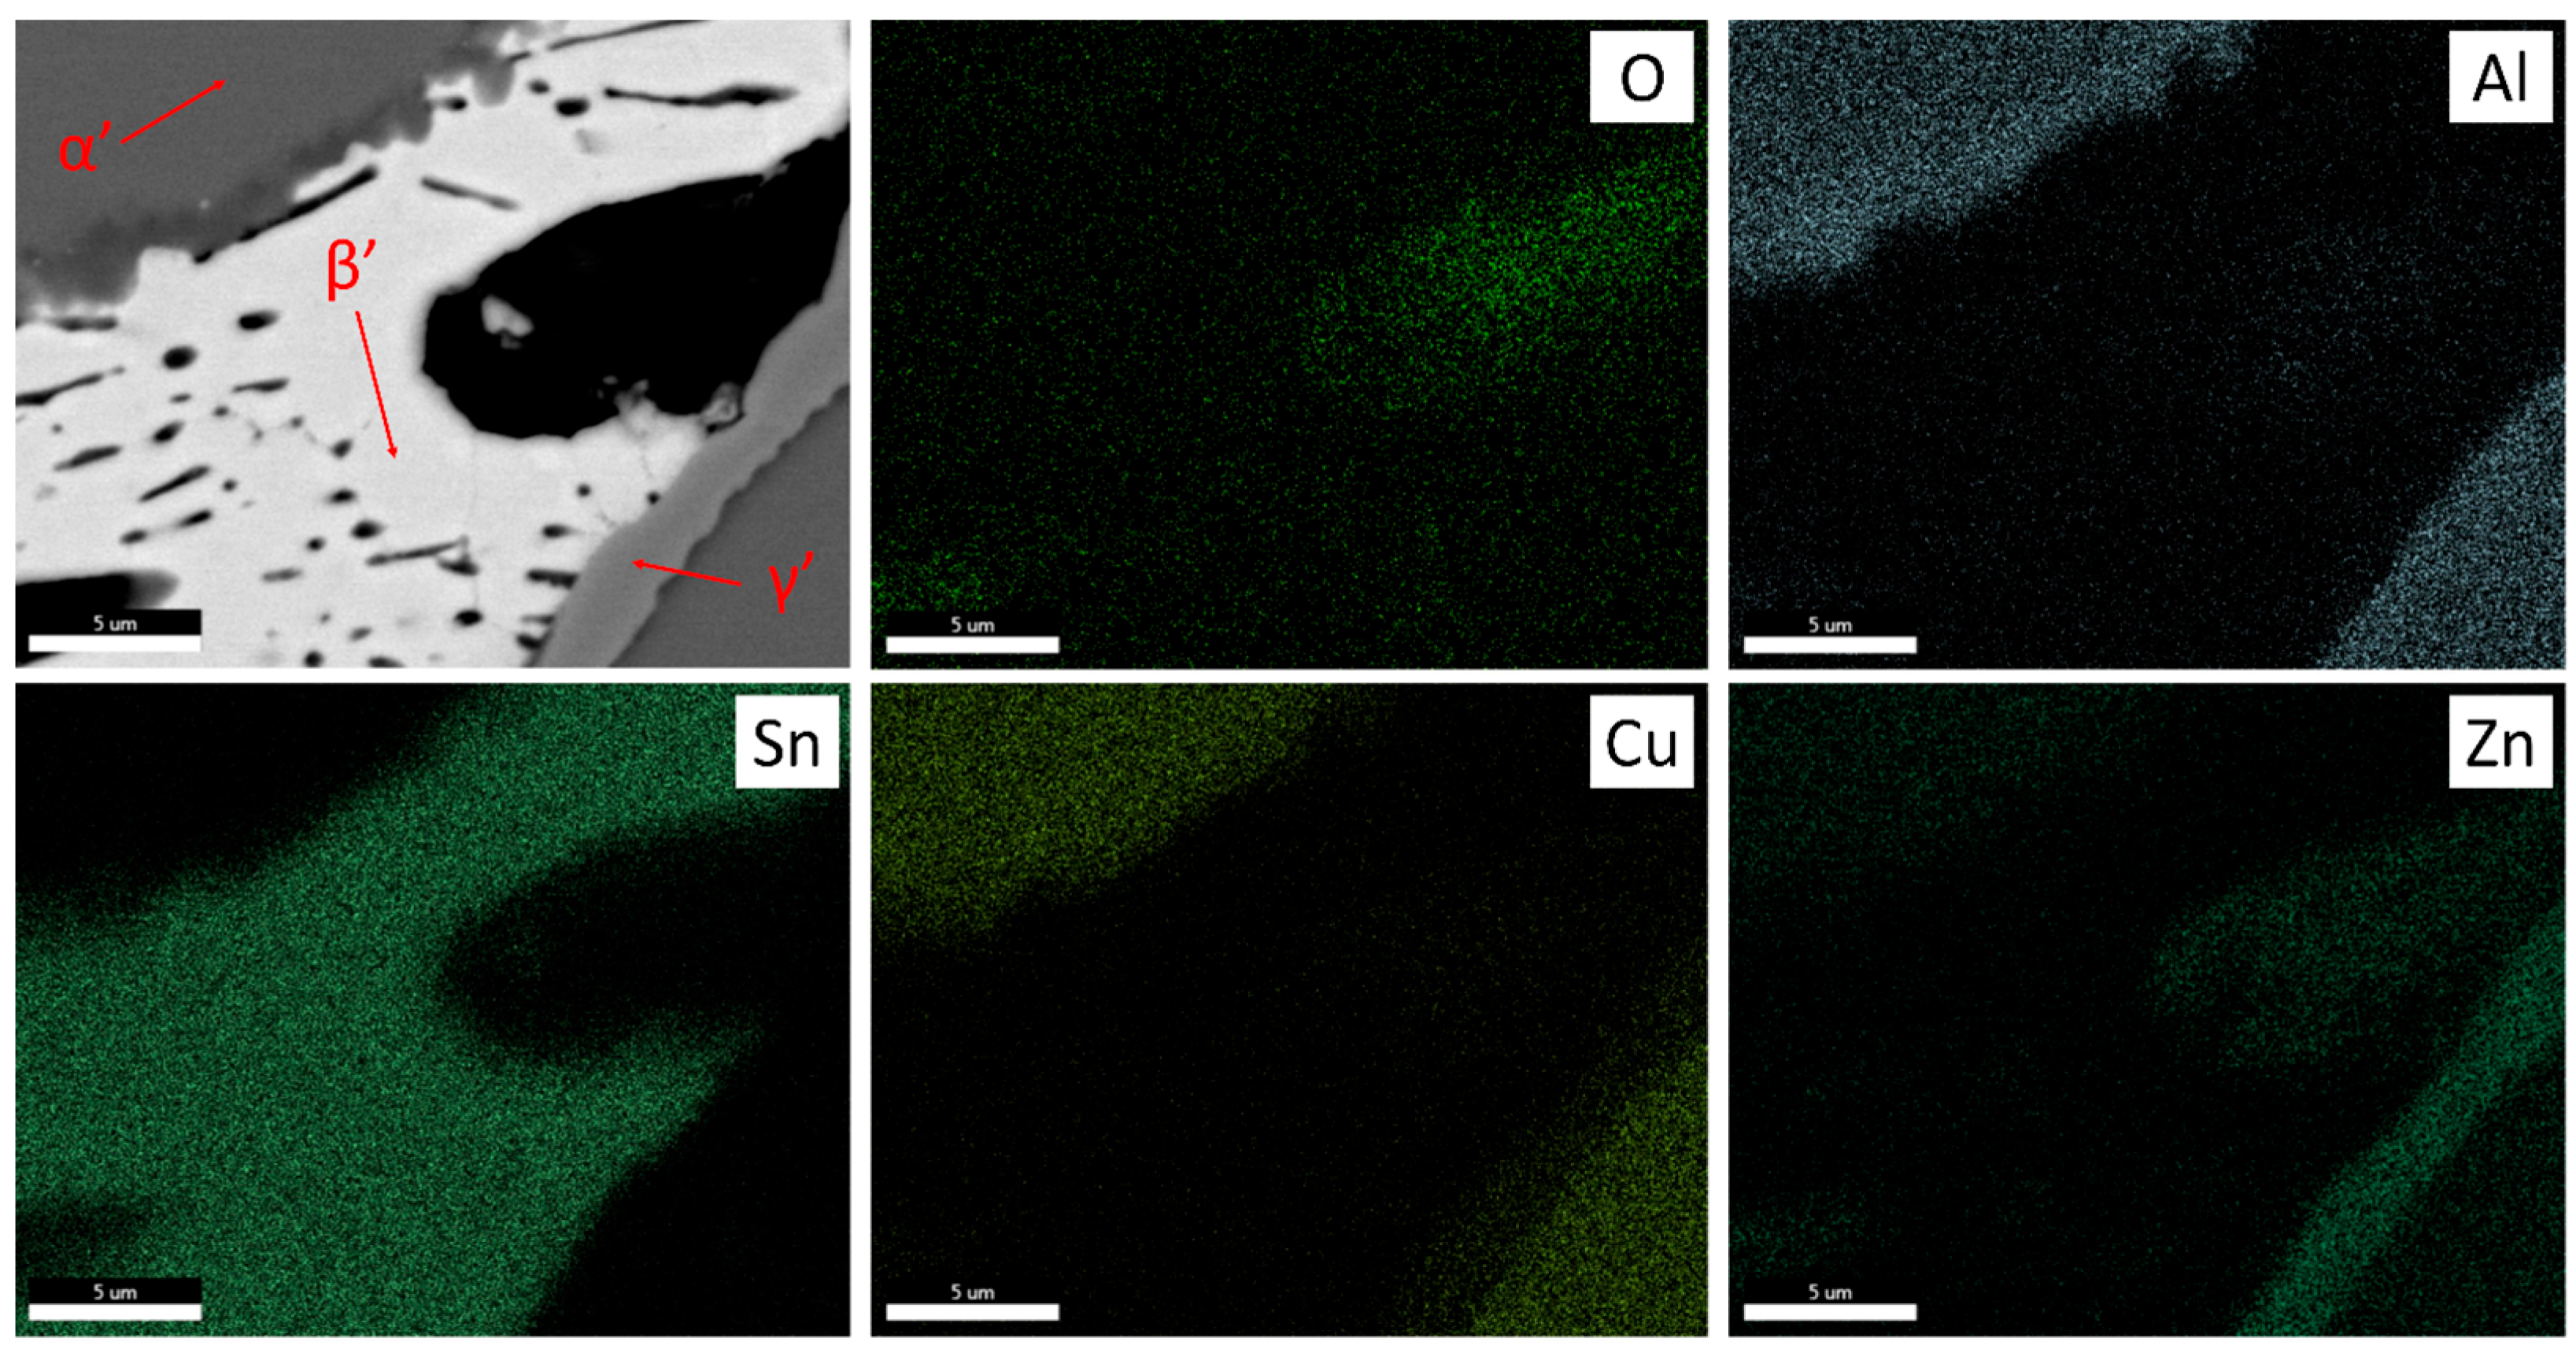
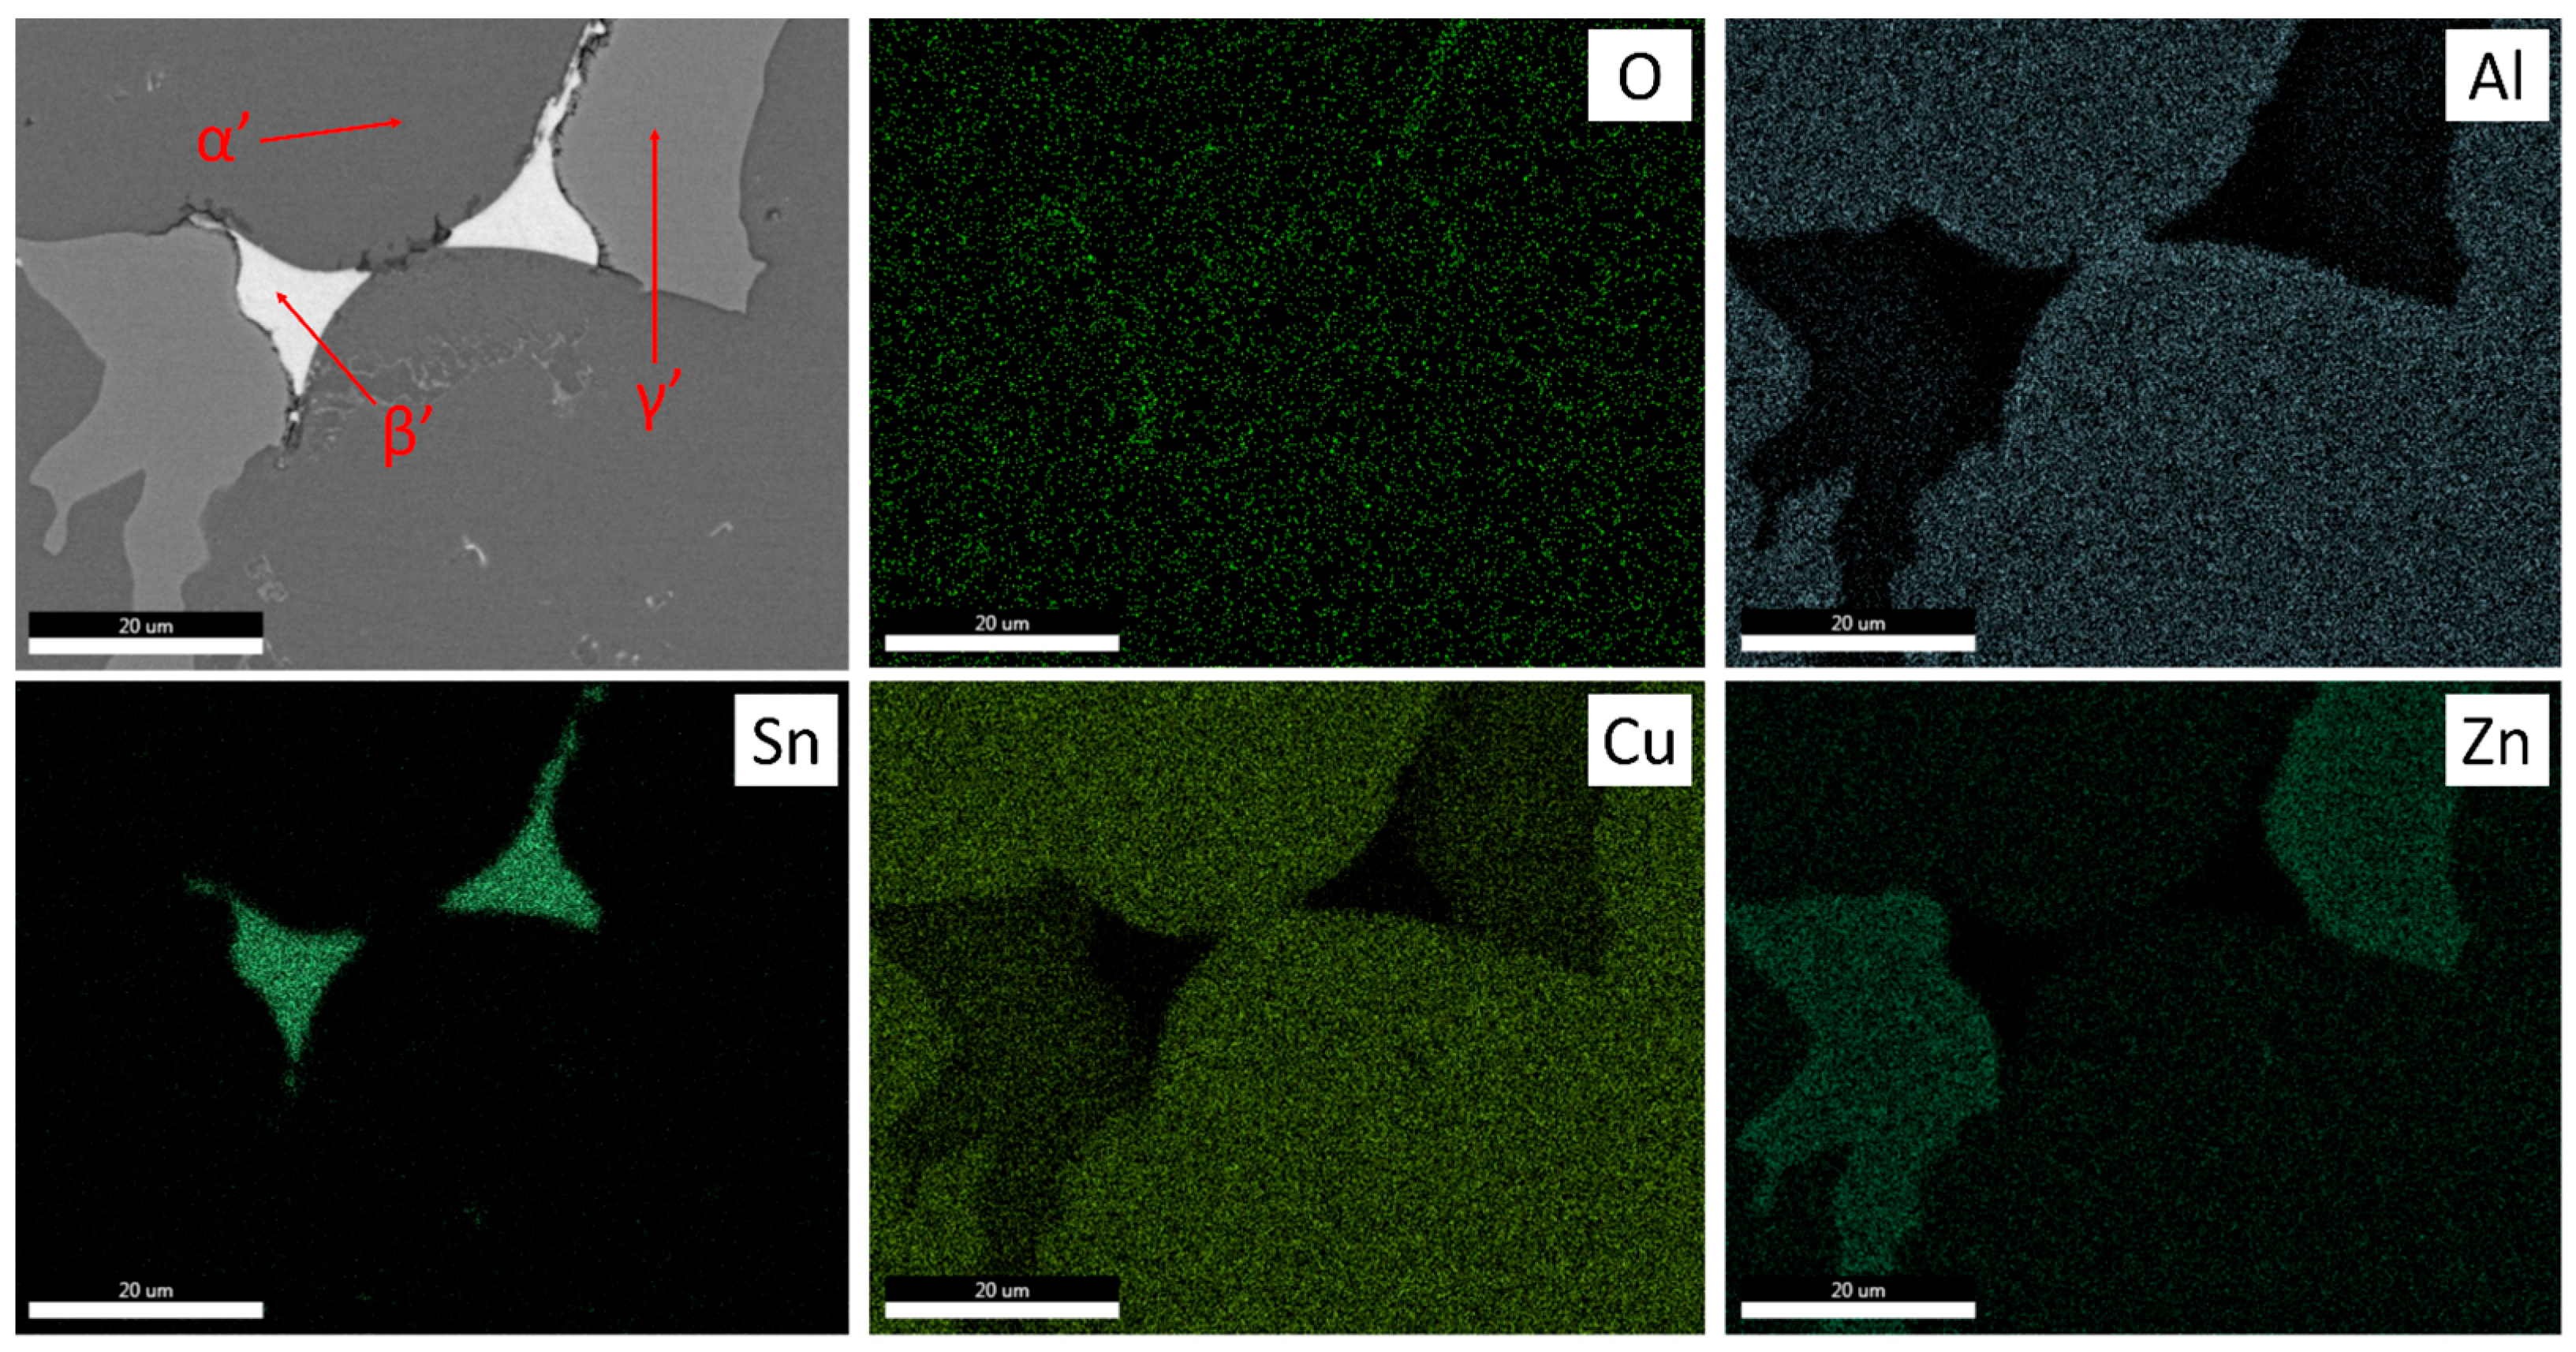
- Three phases were observed in the as-cast and heat-treated samples: the primary phase Cu55Zn25Al20, pure Sn particles and the IM phase ZnxCuy (x = 65–70 at. %, y = 30–35 at. %). Phase γ is likely to form during exposure at lower temperatures as it was not observed after rapid cooling, while its volume fraction was reduced in the air-cooled sample compared with the furnace-cooled one.
- The primary phase showed notable thermodynamic stability, remaining unaffected throughout all heat-treatment schemes and can be used as a basis for future alloy design.
- The IM phase and Sn particles were significantly affected by the cooling rate, where, in water-quenched and air-cooled samples, dark small-size particles appeared within the volume of the elemental Sn islands. The shape of these particles was also affected by the cooling rate. The average specific hardness of the material was higher than that of most conventional brass and bronze alloys. The hardness was strongly dependent on the heat treatments, attaining its maximum value in the FC condition.
Author Contributions
Funding
Data Availability Statement
Acknowledgments
Conflicts of Interest
References
- Panagopoulos, C.N.; Georgiou, E.P.; Simeonidis, K. Lubricated Wear Behavior of Leaded A+β Brass. Tribol. Int. 2012, 50, 1–5. [Google Scholar] [CrossRef]
- Achiţei, D.C.; Minciună, M.G.; Vizureanu, P.; Sandu, A.V.; Cimpoeşu, R.; Istrate, B. Study on Structure and Properties of CuZn40Pb Alloy. IOP Conf. Ser. Mater. Sci. Eng. 2016, 133, 012015. [Google Scholar] [CrossRef]
- Kuyucak, S.; Sahoo, M. A Review of the Machinability of Copper-Base Alloys. Can. Metall. Q. 1996, 35, 1–15. [Google Scholar] [CrossRef]
- Johansson, J.; Persson, H.; Ståhl, J.-E.; Zhou, J.-M.; Bushlya, V.; Schultheiss, F. Machinability Evaluation of Low-Lead Brass Alloys. Procedia Manuf. 2019, 38, 1723–1730. [Google Scholar] [CrossRef]
- Hrechuk, A.; Bushlya, V.; M’Saoubi, R.; Ståhl, J.-E. Quantitative Analysis of Chip Segmentation in Machining Using an Automated Image Processing Method. Procedia CIRP 2019, 82, 314–319. [Google Scholar] [CrossRef]
- Stavroulakis, P.; Toulfatzis, A.I.; Pantazopoulos, G.A.; Paipetis, A.S. Machinable Leaded and Eco-Friendly Brass Alloys for High Performance Manufacturing Processes: A Critical Review. Metals 2022, 12, 246. [Google Scholar] [CrossRef]
- Momeni, A.; Ebrahimi, G.R.; Faridi, H.R. Effect of Chemical Composition and Processing Variables on the Hot Flow Behavior of Leaded Brass Alloys. Mater. Sci. Eng. A 2015, 626, 1–8. [Google Scholar] [CrossRef]
- Kozana, J.; Garbacz-Klempka, A.; Piękoś, M. Lead-Free Casting Brasses. Investigations of the Corrosion Resistance and Shaping of Microstructure and Properties. Arch. Foundry Eng. 2019, 2, 113–118. [Google Scholar] [CrossRef]
- Nobel, C.; Hofmann, U.; Klocke, F.; Veselovac, D.; Puls, H. Application of a New, Severe-Condition Friction Test Method to Understand the Machining Characteristics of Cu–Zn Alloys Using Coated Cutting Tools. Wear 2015, 344–345, 58–68. [Google Scholar] [CrossRef]
- Adineh, M.; Doostmohammadi, H.; Raiszadeh, R. Effect of Si and Al on the Microstructure, Mechanical Properties and Machinability of 65Cu-35Zn Brass. Iran. J. Mater. Sci. Eng. 2019, 16, 21–32. [Google Scholar]
- Rajabi, Z.; Doostmohammadi, H. Effect of Addition of Tin on the Microstructure and Machinability of α—Brass. Mater. Sci. Technol. 2018, 34, 1218–1227. [Google Scholar] [CrossRef]
- Yang, C.; Ding, Z.; Tao, Q.C.; Liang, L.; Ding, Y.F.; Zhang, W.W.; Zhu, Q.L. High-Strength and Free-Cutting Silicon Brasses Designed via the Zinc Equivalent Rule. Mater. Sci. Eng. A 2018, 723, 296–305. [Google Scholar] [CrossRef]
- Taha, M.A.; El-Mahallawy, N.A.; Hammouda, R.M.; Moussa, T.M.; Gheith, M.H. Machinability Characteristics of Lead Free-Silicon Brass Alloys as Correlated with Microstructure and Mechanical Properties. Ain Shams Eng. J. 2012, 3, 383–392. [Google Scholar] [CrossRef]
- Han, H.B.; Huang, X.M.; Wu, Y.C.; Qin, Y.Q.; Cao, J.L. Microstructure and Properties of a Bismuth-Brass. Adv. Mater. Res. 2012, 486, 270–273. [Google Scholar] [CrossRef]
- Zhuo, H.; Tang, J.; Xue, Y.; Ye, N. Preparation of Lead-Free Free-Cutting Graphite Brasses by Graphitization of Cementite. Trans. Nonferrous Met. Soc. China 2015, 25, 3252–3257. [Google Scholar] [CrossRef]
- Zhang, X.; Ma, C.; Li, S.; Pan, D.; Zheng, F. Interface Design of Lead-Free Free-Cutting Titanium Reinforced Graphite Brass Composites and Its Effect on Mechanical Properties and Cutting Performance. Mater. Sci. Eng. A 2020, 774, 138909. [Google Scholar] [CrossRef]
- Lee, B.J.; Kim, W.H.; Park, C.M.; Cho, Y.R.; Jeong, M.J. Leadless Free-Cutting Copper Alloy and Method for Producing the Same. U.S. Patent No. 9840758B2, 12 December 2017. [Google Scholar]
- Zheng, E.; Ye, D.; Chao, G.; Zhang, B.; Fu, J.; Zhang, C. Free-Cutting Copper Alloy with Excellent Hot Forging Performance and Preparation Method Thereof. CN113106289B, 25 March 2023. [Google Scholar]
- Recep, A.; Semih, Ö. Production of a Lead-Free Brass Alloy with the Improved Machinability. TR202018149A2, 23 May 2022. [Google Scholar]
- Reetz, B.; Münch, T.; Plett, T. Lead-Free Cu-Zn Alloy. U.S. Patent No. 20220136085A1, 5 May 2022. [Google Scholar]
- Toulfatzis, A.; Pantazopoulos, G.; David, C.; Sagris, D.; Paipetis, A. Final Heat Treatment as a Possible Solution for the Improvement of Machinability of Pb-Free Brass Alloys. Metals 2018, 8, 575. [Google Scholar] [CrossRef]
- Amaral, L.; Quinta, R.; Silva, T.E.; Soares, R.M.; Castellanos, S.D.; De Jesus, A.M. Effect of Lead on the Machinability of Brass Alloys Using Polycrystalline Diamond Cutting Tools. J. Strain Anal. Eng. Des. 2018, 53, 602–615. [Google Scholar] [CrossRef]
- Cantor, B.; Chang, I.T.H.; Knight, P.; Vincent, A.J.B. Microstructural Development in Equiatomic Multicomponent Alloys. Mater. Sci. Eng. A 2004, 375–377, 213–218. [Google Scholar] [CrossRef]
- Miracle, D.B.; Senkov, O.N. A Critical Review of High Entropy Alloys and Related Concepts. Acta Mater. 2017, 122, 448–511. [Google Scholar] [CrossRef]
- Bhadeshia, H.K.D.H. High Entropy Alloys. Mater. Sci. Technol. 2015, 31, 1139–1141. [Google Scholar] [CrossRef]
- Chaskis, S.; Stachouli, E.; Gavalas, E.; Bouzouni, M.; Papaefthymiou, S. Microstructure, Phase Formation and Heat-Treating of Novel Cast Al-Mg-Zn-Cu-Si Lightweight Complex Concentrated Aluminum Based Alloy. Materials 2022, 15, 3169. [Google Scholar] [CrossRef] [PubMed]
- Chaskis, S.; Bouzouni, M.; Gavalas, E.; Loukadakis, V.; Papaefthymiou, S. Development of Complex Concentrated Alloys (CCAs) Utilizing Scrap to Preserve Critical Raw Materials. In Proceedings of the International Conference on Raw Materials and Circular Economy. Mater. Proc. 2021, 5, 109. [Google Scholar]
- Laws, K.J.; Crosby, C.; Sridhar, A.; Conway, P.; Koloadin, L.S.; Zhao, M.; Aron-Dine, S.; Bassman, L.C. High Entropy Brasses and Bronzes—Microstructure, Phase Evolution and Properties. J. Alloys Compd. 2015, 650, 949–961. [Google Scholar] [CrossRef]
- Nagase, T.; Shibata, A.; Matsumuro, M.; Takemura, M.; Semboshi, S. Alloy Design and Fabrication of Ingots in Cu-Zn-Mn-Ni-Sn High-Entropy and Cu-Zn-Mn-Ni Medium-Entropy Brasses. Mater. Des. 2019, 181, 107900. [Google Scholar] [CrossRef]
- Copper Casting Alloys; Copper Development Association: New York, NY, USA, 1994.
- Subedi, U.; Kunwar, A.; Coutinho, Y.A.; Gyanwali, K. pyMPEALab Toolkit for Accelerating Phase Design in Multi-Principal Element Alloys. Met. Mater. Int. 2022, 28, 269–281. [Google Scholar] [CrossRef]
- Smallman, R.E.; Ngan, A.H.W. Modern Physical Metallurgy, 8th ed.; Elsevier: Amsterdam, The Netherlands, 2014; ISBN 9780080982045. [Google Scholar]
- Zhang, Y.; Zhou, Y.J.; Lin, J.P.; Chen, G.L.; Liaw, P.K. Solid-Solution Phase Formation Rules for Multi-component Alloys. Adv. Eng. Mater. 2008, 10, 534–538. [Google Scholar] [CrossRef]
- Yang, X.; Zhang, Y. Prediction of High-Entropy Stabilized Solid-Solution in Multi-Component Alloys. Mater. Chem. Phys. 2012, 132, 233–238. [Google Scholar] [CrossRef]
- Pickering, E.J.; Jones, N.G. High-Entropy Alloys: A Critical Assessment of Their Founding Principles and Future Prospects. Int. Mater. Rev. 2016, 61, 183–202. [Google Scholar] [CrossRef]
- Andersson, J.-O.; Helander, T.; Höglund, L.; Shi, P.; Sundman, B. Thermo-Calc & DICTRA, Computational Tools for Materials Science. Calphad 2002, 26, 273–312. [Google Scholar] [CrossRef]
- Ahlers, M. Martensite and Equilibrium Phases in Cu-Zn and Cu-Zn-Al Alloys. Prog. Mater. Sci. 1986, 30, 135–186. [Google Scholar] [CrossRef]
- Kim, S.-J.; Kim, K.-S.; Kim, S.-S.; Kang, C.-Y.; Suganuma, K. Characteristics of Zn-Al-Cu Alloys for High Temperature Solder Application. Mater. Trans. 2008, 49, 1531–1536. [Google Scholar] [CrossRef]
- Alkan, S.; Wu, Y.; Ojha, A.; Sehitoglu, H. Transformation Stress of Shape Memory Alloy CuZnAl: Non-Schmid Behavior. Acta Mater. 2018, 149, 220–234. [Google Scholar] [CrossRef]
- Paul, C.; Sellamuthu, R. The Effect of Sn Content on the Properties of Surface Refined Cu-Sn Bronze Alloys. Procedia Eng. 2014, 97, 1341–1347. [Google Scholar] [CrossRef]
- Sanchez, J.M.; Pascual, A.; Vicario, I.; Albizuri, J.; Guraya, T.; Galarraga, H. Microstructure and Phase Formation of Novel Al80Mg5Sn5Zn5X5 Light-Weight Complex Concentrated Aluminum Alloys. Metals 2021, 11, 1944. [Google Scholar] [CrossRef]
- Balazinski, M.; Songmene, V.; Kishawy, H.A. Analyzing the Machinability of Metal Matrix Composites. In Machining Technology for Composite Materials; Elsevier: Amsterdam, The Netherlands, 2012; pp. 394–411. ISBN 9780857090300. [Google Scholar]
- Vilarinho, C.; Davim, J.P.; Soares, D.; Castro, F.; Barbosa, J. Influence of the Chemical Composition on the Machinability of Brasses. J. Mater. Process. Technol. 2005, 170, 441–447. [Google Scholar] [CrossRef]
- Stavroulakis, P.; Freeman, C.L.; Patel, D.; Utton, C.; Goodall, R. Successful Prediction of the Elastic Properties of Multiphase High Entropy Alloys in the AlTiVCr-Si System through a Novel Computational Approach. Materialia 2022, 21, 101365. [Google Scholar] [CrossRef]


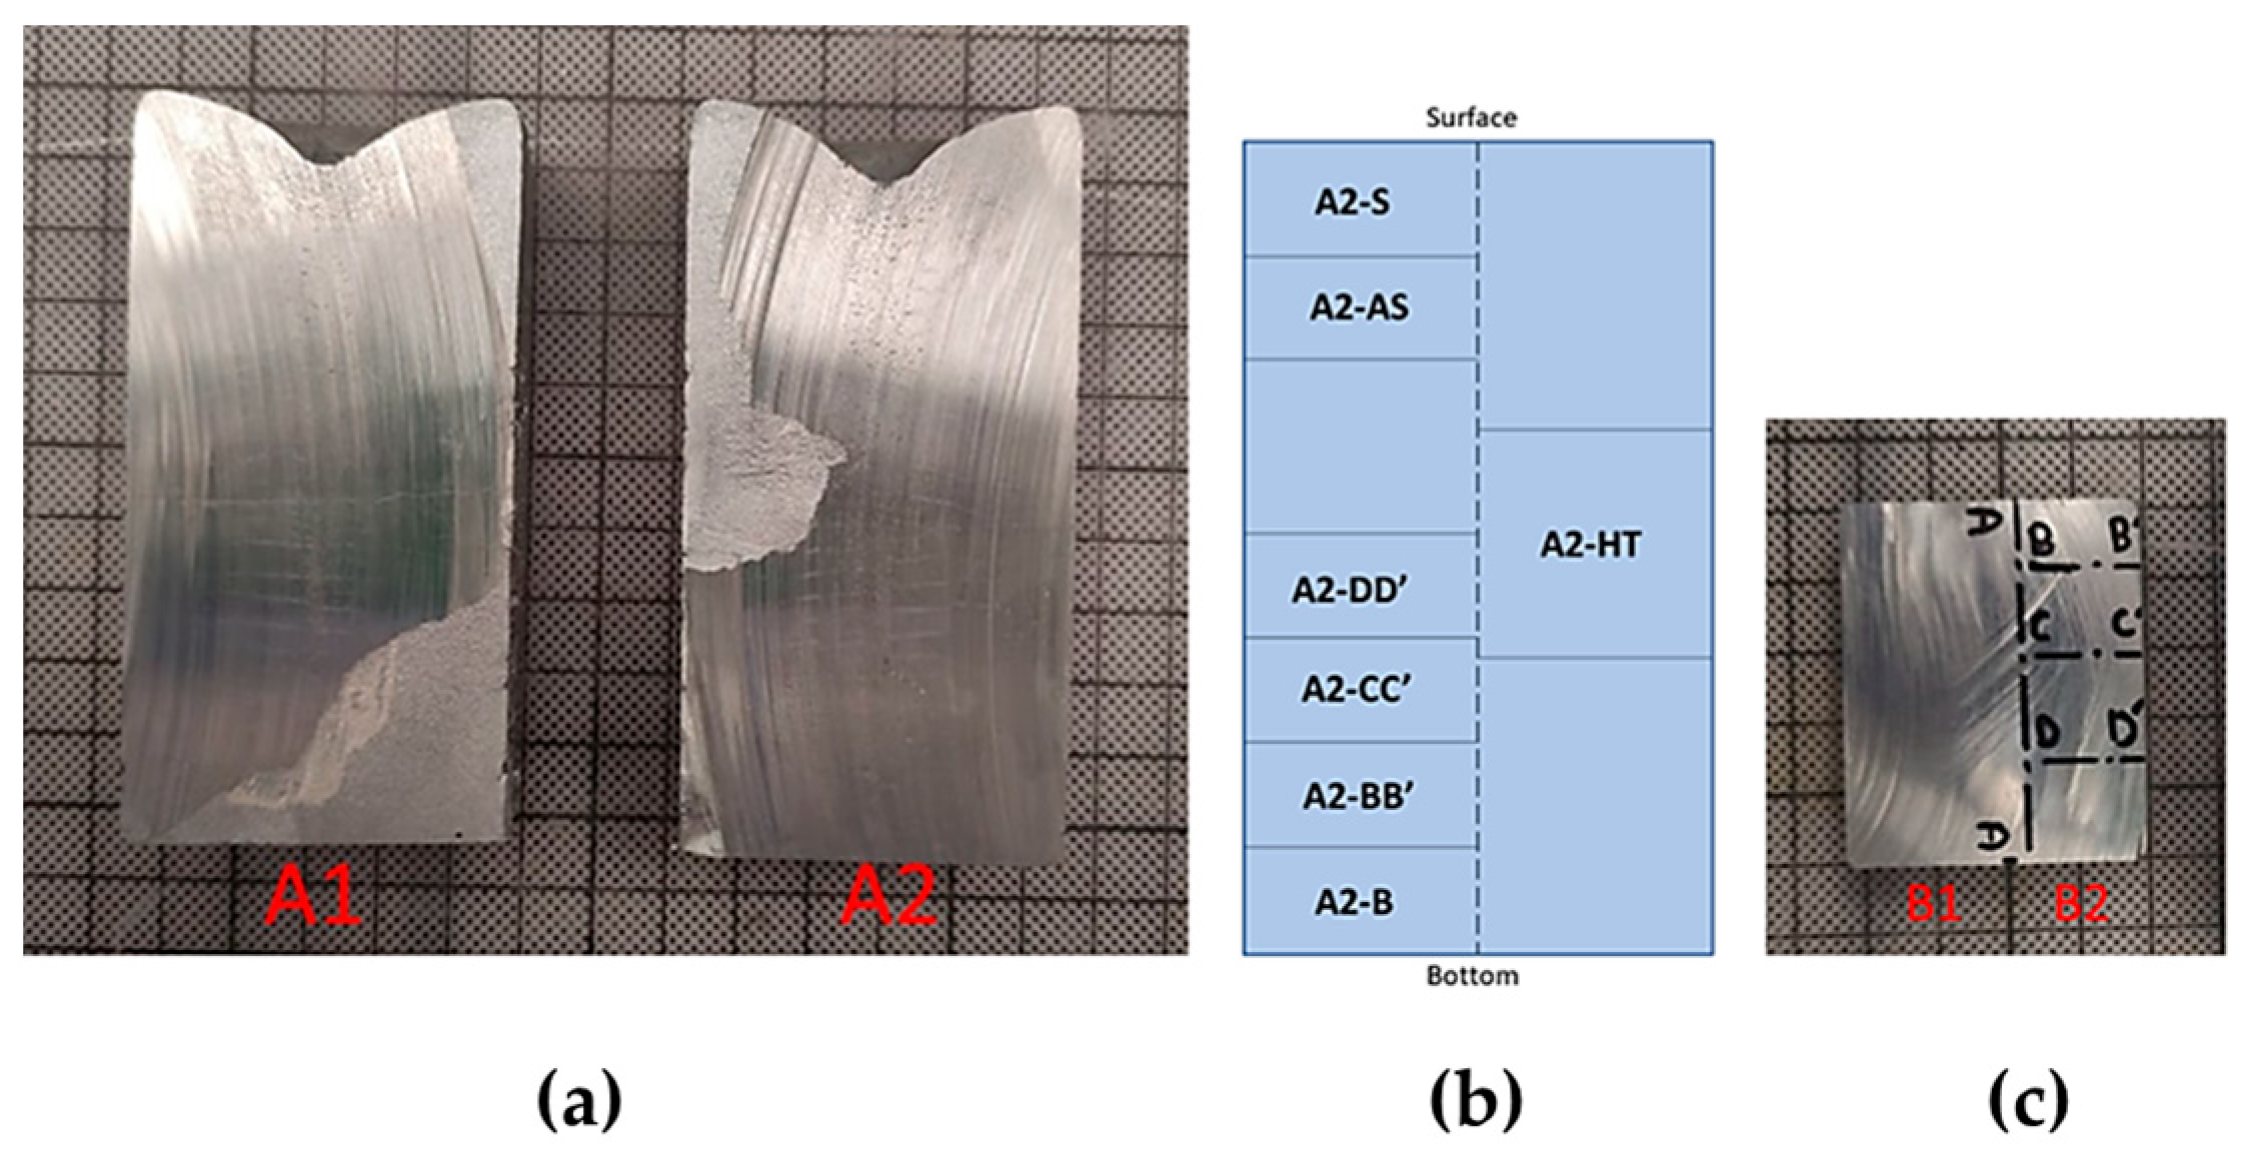
| Samples | Description |
|---|---|
| A2-S, A2-AS, A2-BB’, A2-CC’, A2-DD’, A2-B | As-cast samples, sections from sample A2. |
| B2-BB’, B2-CC’, B2-DD’, B2-EE’ | As-cast samples, sections from sample B2. |
| A1, Β1 | Samples for the study of solidification zones. |
| Τ16AC, Τ16WQ, Τ16FC | Samples for heat treatment. |
| Sample | Time (Hours) | Cooling Method |
|---|---|---|
| Τ16AC | 16 | AC |
| Τ16WQ | 16 | WQ |
| Τ16FC | 16 | FC |
| Etchant | RI (Tucker’s Etch) | RII (Diluted HNO3) | RIII (HNO3) | RIV (FeCl3) |
|---|---|---|---|---|
| Composition | 25 mL H2O 15 mL HNO3 45 mL HCl 15 mL HF | 10 mL HNO3 90 mL H2O | 50 mL HNO3 50 mL H2O | 30 mL HCl 10 g FeCl3 120 mL H2O |
| Etching Duration (s) | 300 | 300 | 30 | 60 |
| ΔHmix (kJ/mol) | δ (%) | ΔSmix (J/K/mol) | Ω | Δχ | VEC | Τm (K) |
|---|---|---|---|---|---|---|
| 0.1 | 6.62 | 9.68 | 105.93 | 0.14 | 9.3 | 1063.89 |
| Phases | Chemical Composition (Mole Percent) | Pearson Notation | Temp. Range | Symmetry/Space Group |
|---|---|---|---|---|
| BCC | Varied | cI2 | RT-910 °C | m |
| γ-AlCu | Al0.37Cu0.63 | cI52/cP52 | RT-147 °C | 3 m |
| δ-AlCu | Al0.4Cu0.6 | hR52 | 35-460 °C | R3 m |
| γ-CuZn | Cu0.35Zn0.65 | cI52 | RT-250 °C | 3 m |
| Sn | Pure Sn | tI4/cF8 | RT-35 °C | mm/Fd3 m |
| Alloying Elements (at. %) | Cu | Al | Zn | Sn |
|---|---|---|---|---|
| Nominal | 50 | 20 | 25 | 5 |
| Surface | 51.97 | 18.64 | 27.66 | 1.73 |
| Center | 48.43 | 20.13 | 26.35 | 5.08 |
| Bottom | 54.67 | 9.16 | 30.85 | 5.32 |
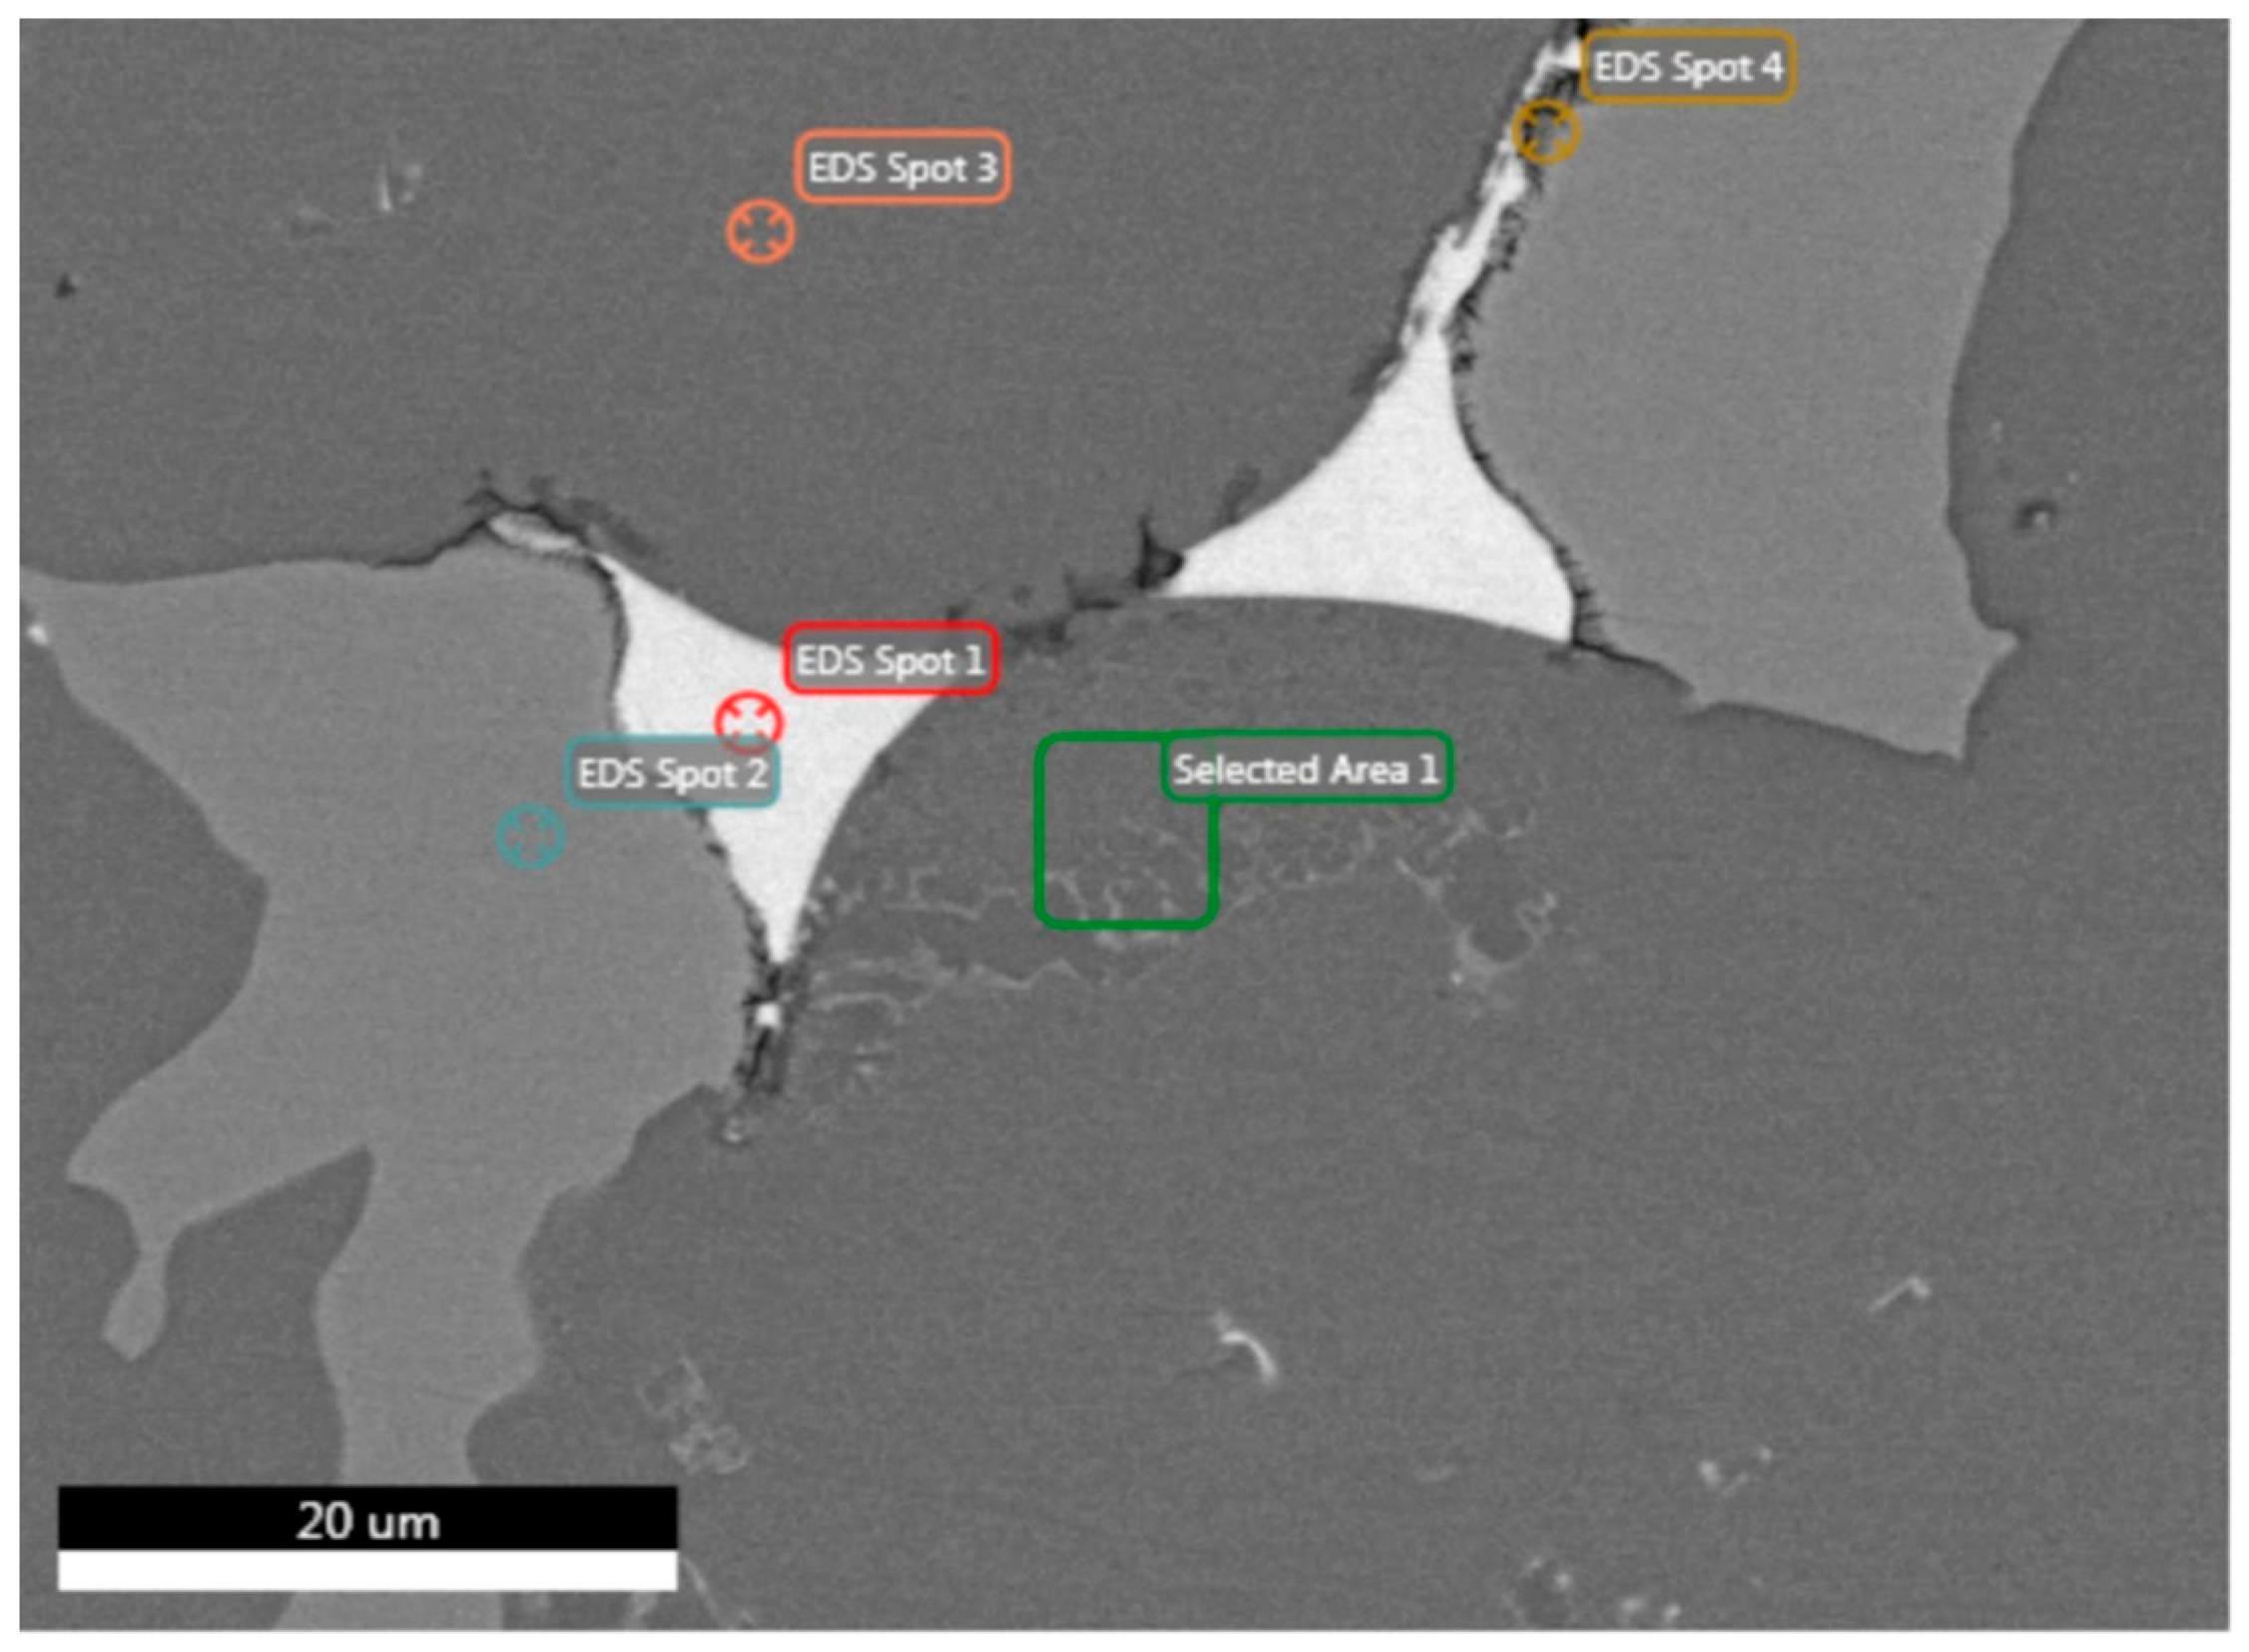
| Analysis/ Elements | Spot 1 (at. %) | Spot 2 (at. %) | Spot 3 (at. %) | Area 1 (at. %) |
|---|---|---|---|---|
| O | 0.27 | 1.15 | 0.57 | 0.79 |
| Cu | 24.63 | 9.17 | 49.80 | 53.97 |
| Al | 2.52 | 1.34 | 29.85 | 20.84 |
| Zn | 72.24 | 7.17 | 17.39 | 24.17 |
| Sn | 0.33 | 81.17 | 2.38 | 0.24 |
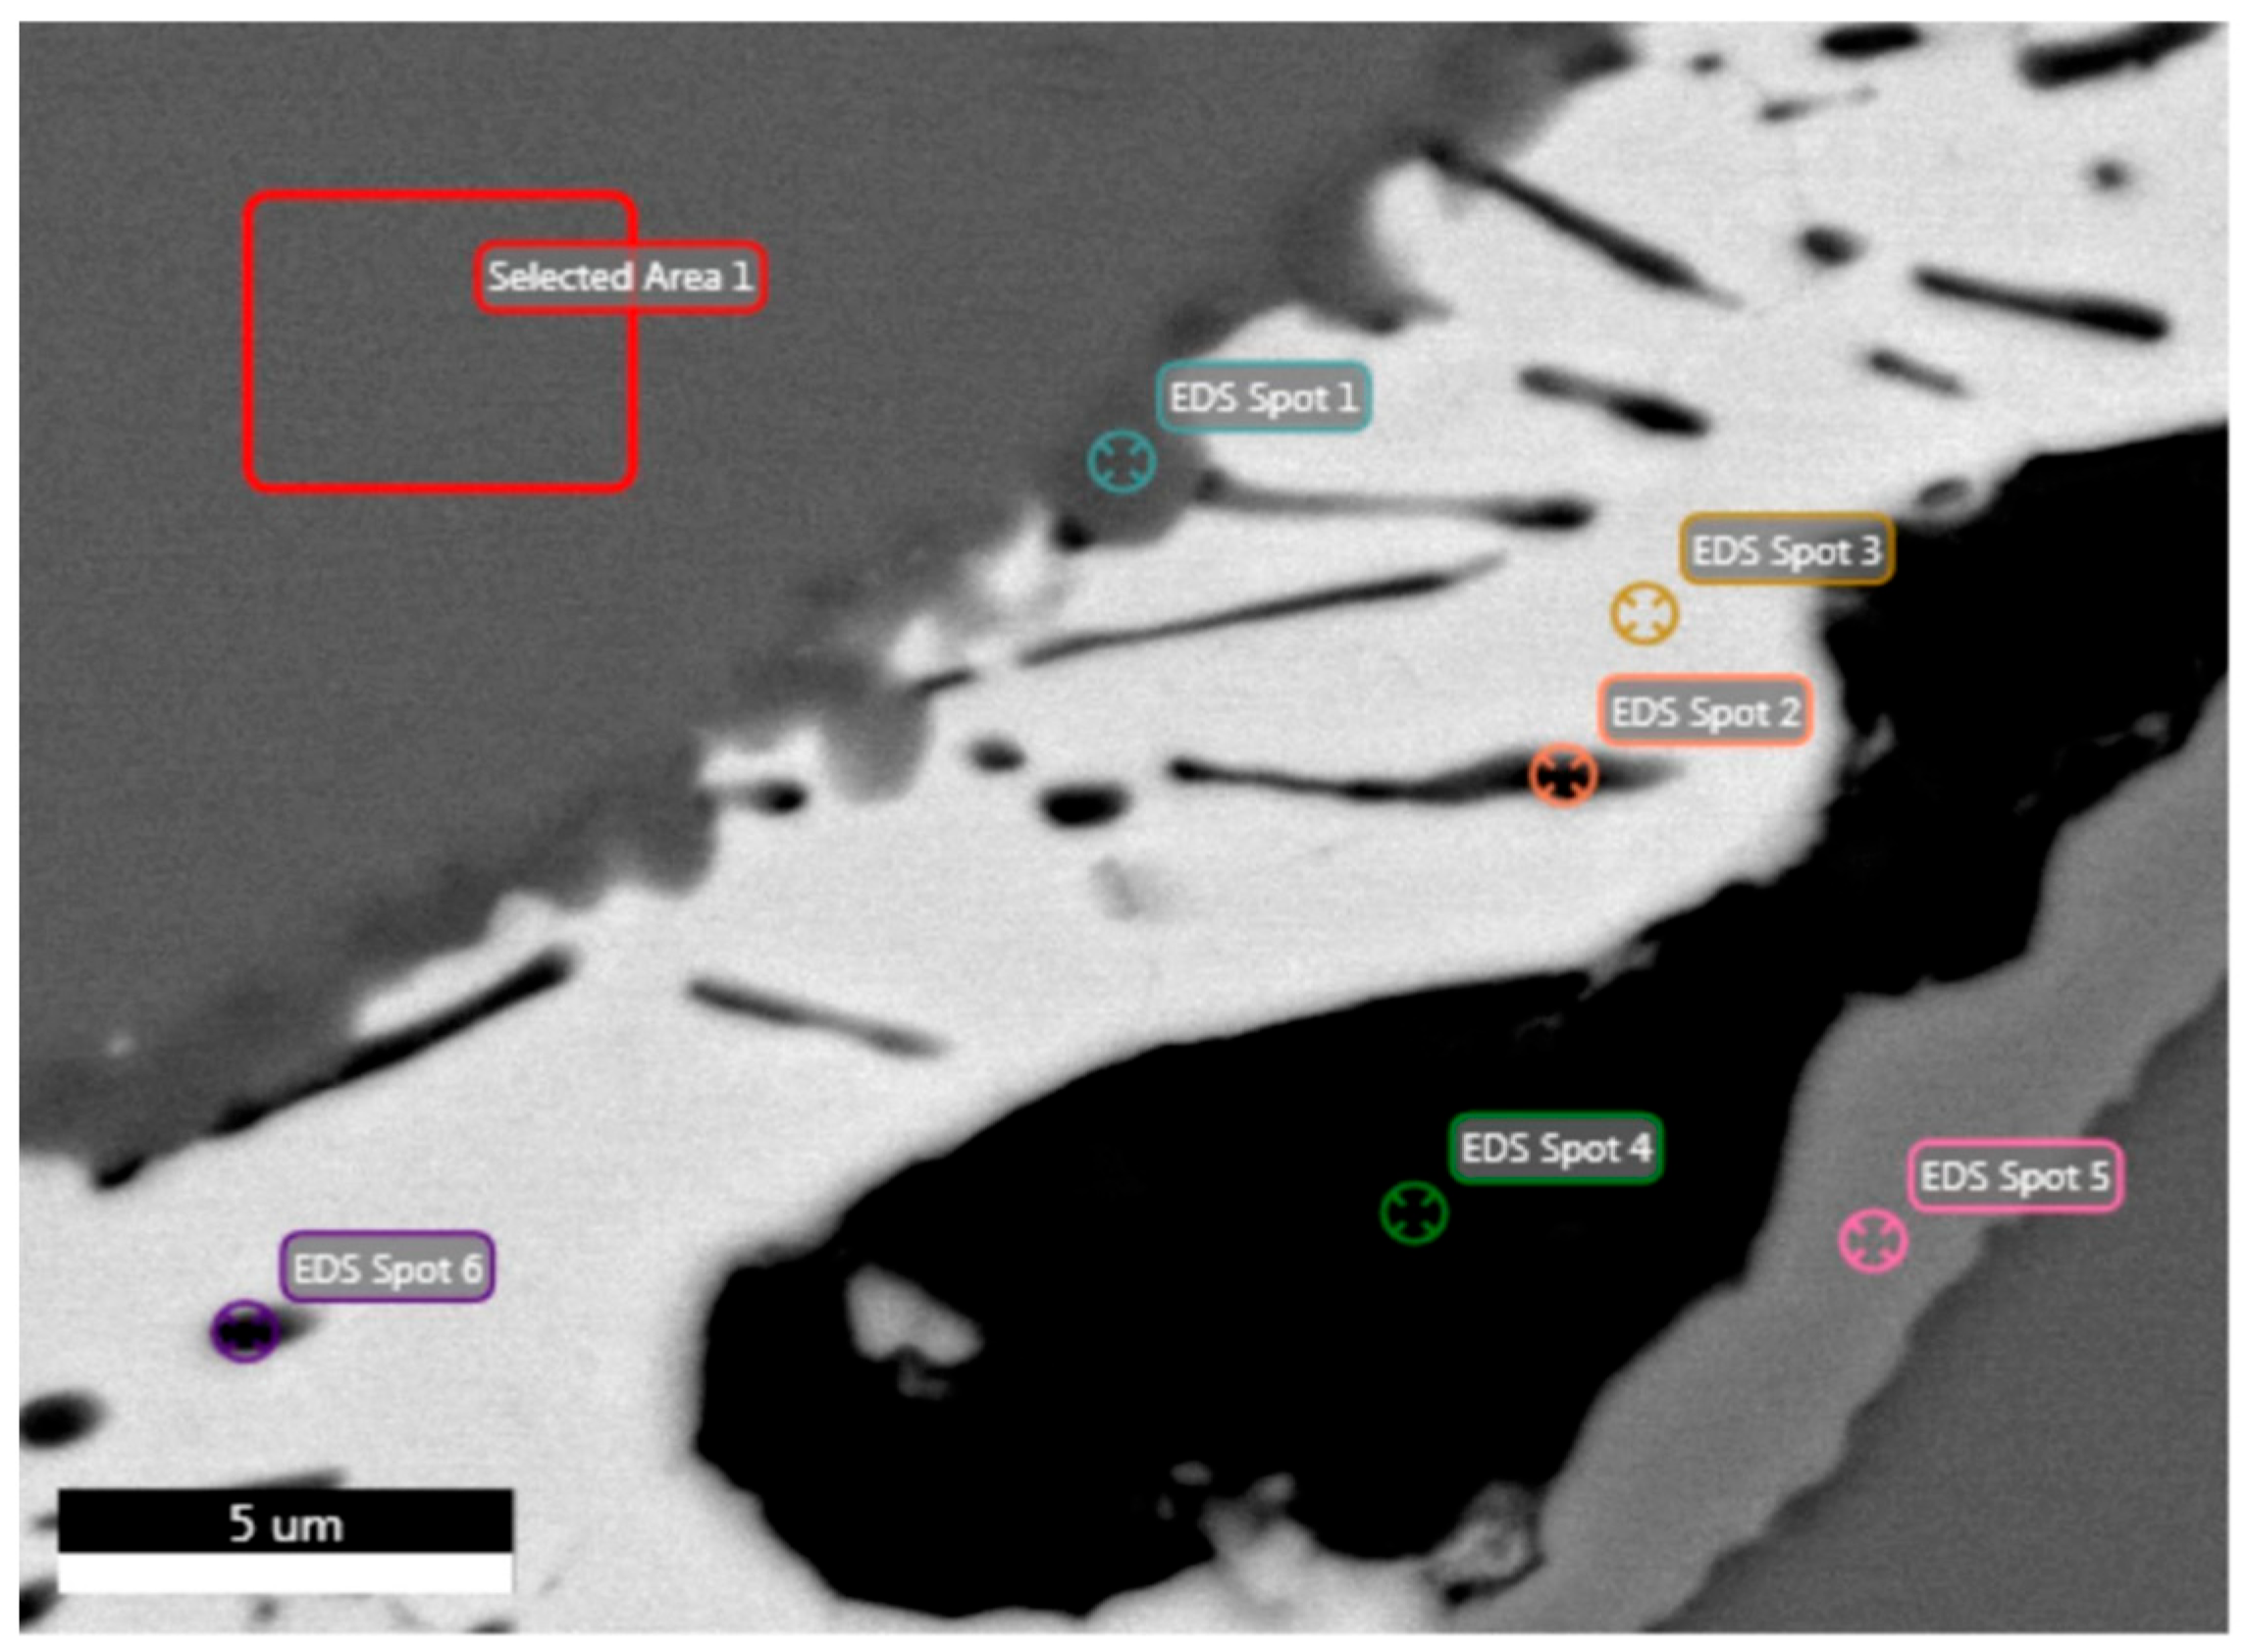
| Analysis/ Elements | Spot 1 (at. %) | Spot 2 (at. %) | Spot 3 (at. %) | Spot 4 (at. %) | Spot 5 (at. %) | Spot 6 (at. %) | Area 1 (at. %) |
|---|---|---|---|---|---|---|---|
| O | 15.13 | 0.00 | 14.71 | 19.35 | 11.40 | 7.76 | 2.31 |
| Cu | 14.18 | 4.20 | 5.99 | 5.59 | 3.49 | 24.32 | 54.66 |
| Al | 9.75 | 1.80 | 5.46 | 3.94 | 10.11 | 20.56 | 20.08 |
| Zn | 39.62 | 10.69 | 25.58 | 9.33 | 11.69 | 13.80 | 22.79 |
| Sn | 21.32 | 83.32 | 48.27 | 61.79 | 63.30 | 33.55 | 0.16 |
| Analysis/ Elements | Spot 1 (at. %) | Spot 2 (at. %) | Spot 3 (at. %) | Spot 4 (at. %) | Spot 5 (at. %) | Spot 6 (at. %) | Area 1 (at. %) |
|---|---|---|---|---|---|---|---|
| O | 3.40 | 7.22 | 3.29 | 11.70 | 1.08 | 3.54 | 1.59 |
| Cu | 10.71 | 10.27 | 3.08 | 10.88 | 23.24 | 1.88 | 53.75 |
| Al | 10.65 | 1.39 | 0.31 | 4.96 | 3.49 | 0.56 | 19.54 |
| Zn | 8.95 | 53.20 | 5.02 | 52.97 | 71.78 | 4.85 | 24.75 |
| Sn | 66.29 | 27.92 | 88.31 | 19.49 | 0.40 | 89.16 | 0.36 |
| Analysis/ Elements | Spot 1 (at. %) | Spot 2 (at. %) | Spot 3 (at. %) | Spot 4 (at. %) | Area 1 (at. %) |
|---|---|---|---|---|---|
| O | 0.00 | 0.00 | 0.00 | 2.64 | 0.24 |
| Cu | 5.98 | 35.76 | 61.28 | 26.46 | 54.92 |
| Al | 0.22 | 0.90 | 11.75 | 0.76 | 21.59 |
| Zn | 4.94 | 63.17 | 26.46 | 69.42 | 22.98 |
| Sn | 88.85 | 0.17 | 0.52 | 0.73 | 0.26 |
| Elements/ Phases | α (at. %) | β (at. %) | γ (at. %) |
|---|---|---|---|
| Cu | 54.3 ± 0.6 | 5.6 ± 2.7 | 27.9 ± 6.9 |
| Al | 20.5 ± 0.9 | 0.9 ± 0.8 | 2.3 ± 1.3 |
| Zn | 23.7 ± 0.9 | 7.0 ± 2.7 | 69.1 ± 5.1 |
| Sn | 0.3 ± 0.1 | 85.4 ± 3.8 | 0.3 ± 0.1 |
Disclaimer/Publisher’s Note: The statements, opinions and data contained in all publications are solely those of the individual author(s) and contributor(s) and not of MDPI and/or the editor(s). MDPI and/or the editor(s) disclaim responsibility for any injury to people or property resulting from any ideas, methods, instructions or products referred to in the content. |
© 2024 by the authors. Licensee MDPI, Basel, Switzerland. This article is an open access article distributed under the terms and conditions of the Creative Commons Attribution (CC BY) license (https://creativecommons.org/licenses/by/4.0/).
Share and Cite
Chaskis, S.; Maritsa, S.; Stavroulakis, P.; Papadopoulou, S.; Goodall, R.; Papaefthymiou, S. Compositional Design and Thermal Processing of a Novel Lead-Free Cu–Zn–Al–Sn Medium Entropy Brass Alloy. Metals 2024, 14, 620. https://doi.org/10.3390/met14060620
Chaskis S, Maritsa S, Stavroulakis P, Papadopoulou S, Goodall R, Papaefthymiou S. Compositional Design and Thermal Processing of a Novel Lead-Free Cu–Zn–Al–Sn Medium Entropy Brass Alloy. Metals. 2024; 14(6):620. https://doi.org/10.3390/met14060620
Chicago/Turabian StyleChaskis, Spyridon, Stavroula Maritsa, Paul Stavroulakis, Sofia Papadopoulou, Russell Goodall, and Spyros Papaefthymiou. 2024. "Compositional Design and Thermal Processing of a Novel Lead-Free Cu–Zn–Al–Sn Medium Entropy Brass Alloy" Metals 14, no. 6: 620. https://doi.org/10.3390/met14060620