Article

Neutron Diffraction Measurements of Residual Stresses for Ferritic Steel Specimens over 80 mm Thick

1
National Research Center, Kurchatov Institute, 1 Akademika Kurchatova pl., Moscow 123182, Russia
2
Neutron Science Division, Korea Atomic Energy Research Institute, Daedok-daero 989-111, Daejeon 34057, Republic of Korea
3
Nuclear Physics Institute ASCR, 250 68 Rez, Czech Republic
*
Authors to whom correspondence should be addressed.
Metals 2024, 14(6), 638; https://doi.org/10.3390/met14060638
Submission received: 15 April 2024 / Revised: 21 May 2024 / Accepted: 24 May 2024 / Published: 28 May 2024
(This article belongs to the Special Issue Characterization and Modeling on Complex Metallic Materials)

Abstract

:
The maximum thickness for ferritic steel specimens’ residual stress measurements using neutron diffraction is known to be about 80 mm. This paper proposes a new neutron diffraction configuration of residual stress measurements for cases that are over 80 mm thick. The configuration utilizes a neutron beam with a wavelength of 1.55 Å diffracted from the (220) plane with a diffraction angle (2θ) of 99.4°. The reason for the deep penetration capability is attributed to the chosen wavelength having enough intensities due to the low cross-section near the Bragg edge and the reduced beam path length (~16 mm) reflected by the large diffraction angle. Neutron diffraction experiments with this configuration can decrease strain errors up to ±150 με, corresponding to a stress of about ±30 MPa.

1. Introduction

Thanks to the deep penetration capability of thermal neutrons through the most industrial metals and alloys, the neutron diffraction method has been widely used for residual stress measurements in various specimens and engineering products [1,2]. However, the capability of the neutron diffraction method has a limitation in terms of the weak brightness of neutron sources [3]. It has been known that the maximum neutron path length for residual stress measurements in steels is about 60 mm, which corresponds to about a 40-mm thickness of the steel plate when using most modern stress diffractometers [4,5,6]. Extensive studies have been performed to enhance the neutron path length and thickness with the aid of the neutron wavelength located at the local minima of the total neutron cross-section near the Bragg edges [7,8,9,10,11,12,13]. Withers described the depth capabilities of neutron strain measurements based on the neutron wavelength selection and showed that the maximum penetration path length can reach a thickness of about 40 mm in steel specimens, with 104 accuracy in 1 h by 40 mm3 sampling volume when using conventional neutron diffractometers [7,8]. Em and Woo further developed methods for thick specimens and welds having up to a 80 mm thickness by using a focused neutron beam [9], and the results of residual stresses were compared to destructive methods, such as contour method and deep hole drilling [11,12]. Recently, Jiang’s group applied the wavelength-dependent neutron diffraction method for the residual stress measurements of thick stainless steel pipes for heavy industrial application purposes [13].
The total cross-section determines the neutron attenuation when the neutron beam penetrates through the specimen [1,7]. Then, it results in the available neutron path length and the strain uncertainties for the residual stress measurements [9]. Figure 1 shows the total cross-section as a function of the neutron wavelength (λ) in a ferritic steel. It significantly decreases when the wavelength is higher than the individual Bragg edges (λ > 2 dhkl), which means that the neutrons are mostly transmitted because it cannot participate in the Bragg diffraction process. It has been reported that with the use of neutron wavelength λ = 2.39 Å near the Bragg edge (112) by Si(111) monochromator, the (110) diffraction plane of the ferritic steel can enhance the path length up to 83 mm with a gauge volume of 80 mm3 in ferritic steels [9]. Furthermore, it should be mentioned that a bent perfect crystal is necessary for the silicon monochromator in order to increase the neutron beam intensity by focusing it, and it is accepted as an effective device for the stress diffractometer [14,15,16,17].
For the residual stress analysis, the stress tensor components are usually calculated based on the generalized Hooke’s law [1]. To do that, three components of the strain tensors are necessary along the three principal directions, i.e., longitudinal (L), transverse (T), and normal (N), of the specimens. The L and T strain components are measured in the transmission geometry (Figure 2a) when the neutron beam passes through the entire thickness of the specimen.
When the neutron beam penetrates through the specimen, the maximum feasible depth (Dtr) is related to the total path length (lm) and the diffraction angle (θhkl), as shown below:
Dtr = lm cosθhkl
It is equivalent to the maximum feasible thickness that can be probed in the transmission geometry. The smaller the angle (θhkl), the thicker the plate that can be measured at a given lm (= ll + ld). On the other hand, the N strain component is usually measured in the reflection geometry when the incident and reflected neutron beams are on the same side of the plate (Figure 2b). In the reflection geometry, the maximum feasible depth (Dref) is related to the lm, as shown below:
Dref = 0.5lm sin θhkl
Thus, the depth measurements can be performed on both sides of the plate specimen, and the maximum feasible thickness (2Dref) of the plate is determined by lm sin θhkl. It should be mentioned that the large diffraction angle (θhkl) is an advantage for the reflection geometry in a thick plate because the given lm can be decreased. If the θhkl is 45°, the total feasible thickness is the same between transmission and reflection geometries: Dtr = 2Dref.
Table 1 summarizes the instrumental configurations for the residual stress measurements in thick ferritic steel specimens. For all configurations, the wavelengths (λ) are located at a low total neutron cross-section (σt) of the ferritic steel near the Bragg edges, as shown in Figure 1.
Firstly, when using configuration 1 for the three components, it was possible to measure the Dtr up to 67 mm for the L and T components with the transmission geometry in very thick plates [9,10]. However, the available thickness of the N component is much smaller (2Dref = 46 mm) because the relatively small diffraction angle (2θ110 = 72.1°) of configuration 1 significantly increases the beam path in the reflection geometry, as shown in Figure 2b.
To overcome the long beam path in the reflection geometry for the N component measurements of the thick plates, the “two wavelengths and diffractions” method was proposed [10]. It utilized the neutron λ of 1.55 Å made by the Si220 monochromator and was measured by the (112) diffraction plane for the N component (noted as configuration 2 in Table 1). Since the λ is located near the Bragg edge (321) in Figure 1, this configuration can increase the 2Dref up to 56 mm (10 mm higher than configuration 1) for the N component with the benefit of a large diffraction angle (2θ112 = 82.9°). As a result, with the combined methods (configuration 1 for L and T and configuration 2 for N in Table 1), it was possible to measure the residual stresses in steel welds with a thickness of 70 mm [11] and up to 80 mm [12]. Note that the elastic constants between the (110) and (112) planes are identical, i.e., E110 = E112 = 225.5 GPa, ν110 = ν112 = 0.28, as suggested by the Kroner model for ferritic steels [2]. The weakness of this method is the relatively large errors (over ±300 με) near the middle locations of the plate thickness [9] and the large gauge volume with for example, 320 and 500 mm3 for 70 and 80 mm thick specimens, respectively [11,12]. Due to the long beam path through the sample in the reflection geometry, the large strain uncertainties induce error ranges of about ±100 MPa for the residual stresses at a mid-thickness of 35 mm depth in the 70 mm thick weld [11]. Furthermore, the stress measurements were unclear at a 40 mm depth in the 80 mm thick weld [12]. Furthermore, the measurement time (12–24 h/point) of the N components was significantly longer than that (1–2 h/point) of the L or T components. Thus, it is necessary to examine a new configuration for the reflection geometry by using larger diffraction angles at a low neutron cross-section near the Bragg edge.
The purpose of this paper is to elucidate the deep penetration capability from the (220) diffraction plane (configuration 3) instead of the (112) diffraction plane (configuration 2) for the measurements of normal components in very thick (≥80 mm) steel plates. This should be examined in experiments because configuration 3 can decrease the beam path by using a large diffraction angle (99.4°), though the peak intensity is normally lower in the (220) diffractions than in the (112) diffractions. Thus, we propose “a modified two wavelengths and diffractions method”, which combines configuration 1 for the transmission geometry and configuration 3 for the reflection geometry. This can overcome the limitation of the neutron beam path and enable us to measure the residual stresses in over-80-mm thick specimens.

2. Experimental Procedure

The neutron experiments were performed by the STRESS diffractometer with a reactor power of 5 MW. The instrument was installed on the horizontal channel of the IR-8 reactor (maximum power 8 MW) of the National Research Center at the Kurchatov Institute. The diffractometer uses a double monochromator coupled with PG002 and Si220 consisting of a pyrolytic graphite (PG) with a reflecting plane (002) at a monochromator angle (2θM1) of 27° and a bent perfect crystal silicon (Si) monochromator with a reflecting plane (220) at a monochromator angle (2θM2) of 48°. It provides a monochromatic neutron beam with a fixed wavelength λ = 1.55 Å near the minimum total cross section, corresponding to the Bragg edge (321), as shown in Figure 1. For the Si220 monochromator in the diffractometer STRESS, a sandwich-type single crystal structure was used. A total of three single crystals (each 1.3 mm thick) were stacked, with total dimensions of 200 × 40 × 3.9 mm3. Note that the sandwich structure can be bent more without destroying the crystal. It has a specific design compared to recent neutron diffractometers [18,19,20].
Two kinds of neutron diffraction experiments were performed. First of all, the neutron diffraction experiments were performed by varying the curvature of the Si220 monochromator. These are often called “optimization” experiments, which select the proper beam properties. A ferritic steel rod with a diameter of 2 mm and a height of 40 mm was installed, and the diffraction peaks of (112) and (220) were measured from the center of the rod with a gauge volume of 120 mm3. Secondly, the depth measurements by neutron diffraction were performed with a ferritic steel disk having with a diameter of 130 mm and a thickness of 40 mm, as shown in Figure 3a. The disk-type specimen was pre-annealed at a temperature of 900 °C to reduce the texture. The (112) and (220) neutron diffraction peaks were measured in the reflection geometry, as shown in Figure 2b, as a function of the depth (e.g., 32–34 mm from the surface) at the center of the disk specimen. The gauge volumes of 320 mm3 (4 × 4 × 20 mm3) and 640 mm3 (4 × 4 × 40 mm3) were determined by the incident and reflected beams using the 4 mm wide cadmium slits. Figure 3b presents the diffraction peaks measured at different depths. It is obvious that the peak height (H) to background (B) ratio (H/B) for the (220) diffraction peak is higher than for the (112) peak. This is comparable to the previous results (~1.63) at a depth of 33 mm [12].

3. Results and Discussion

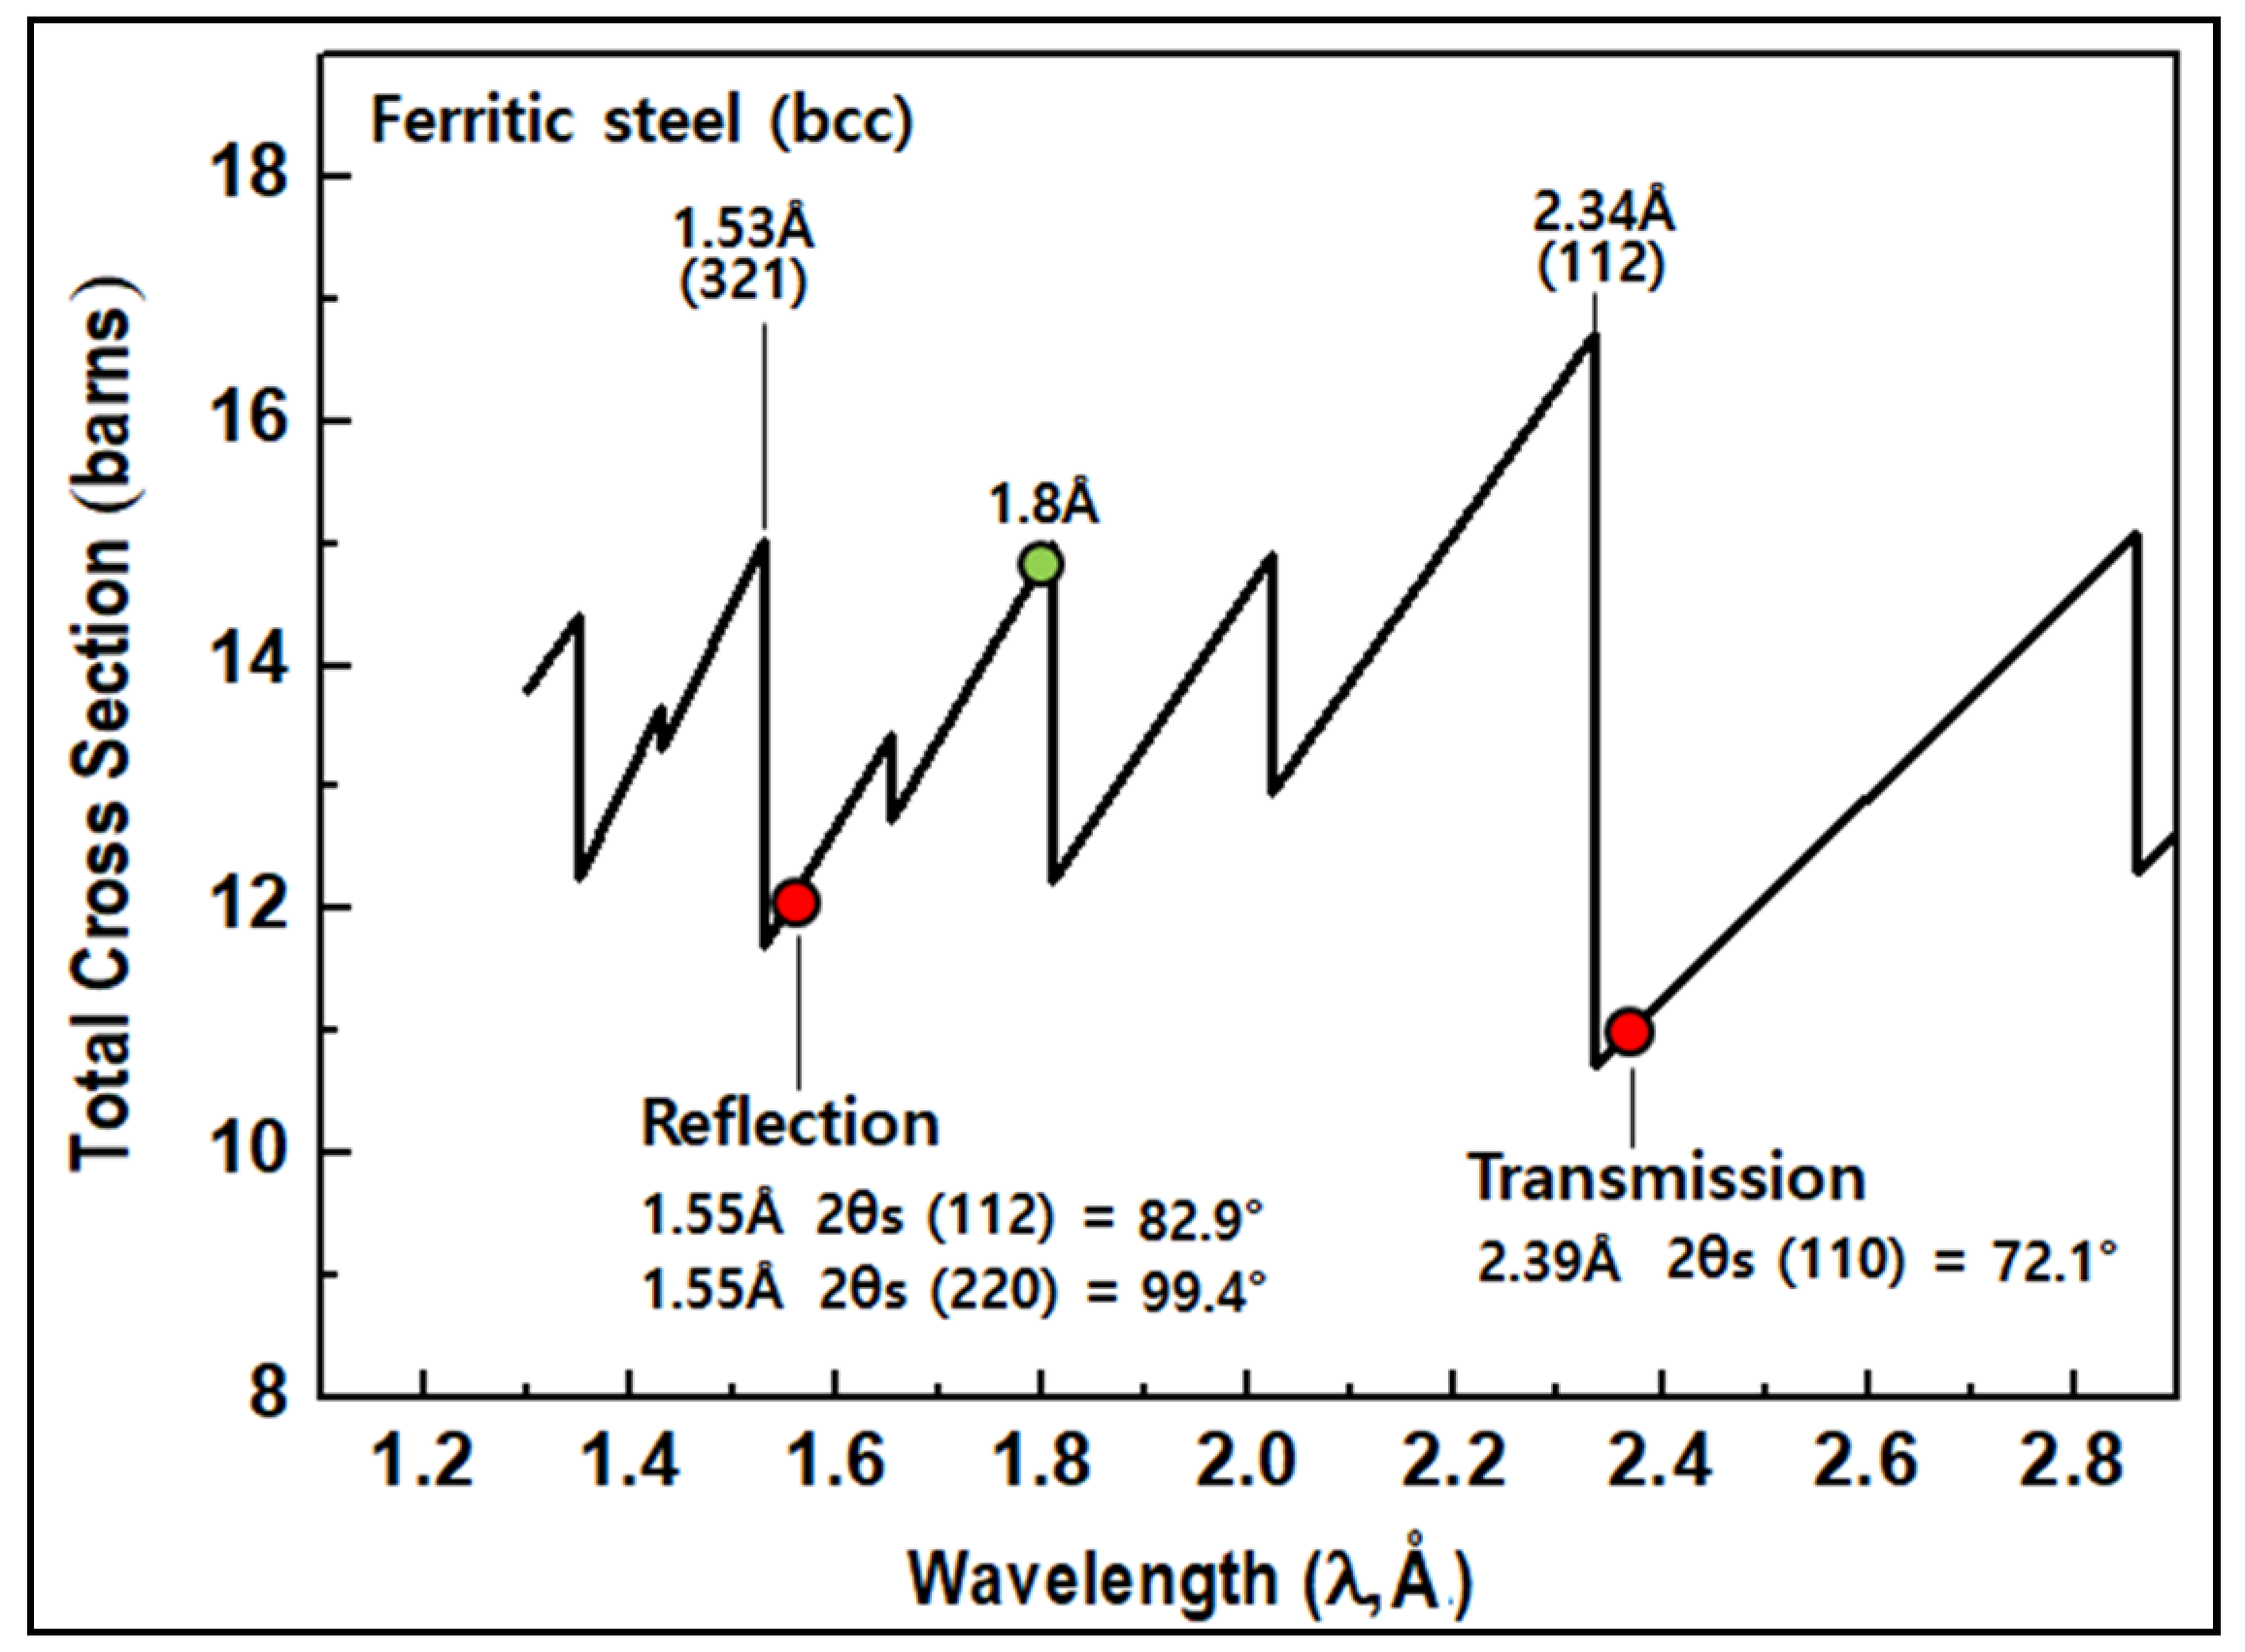
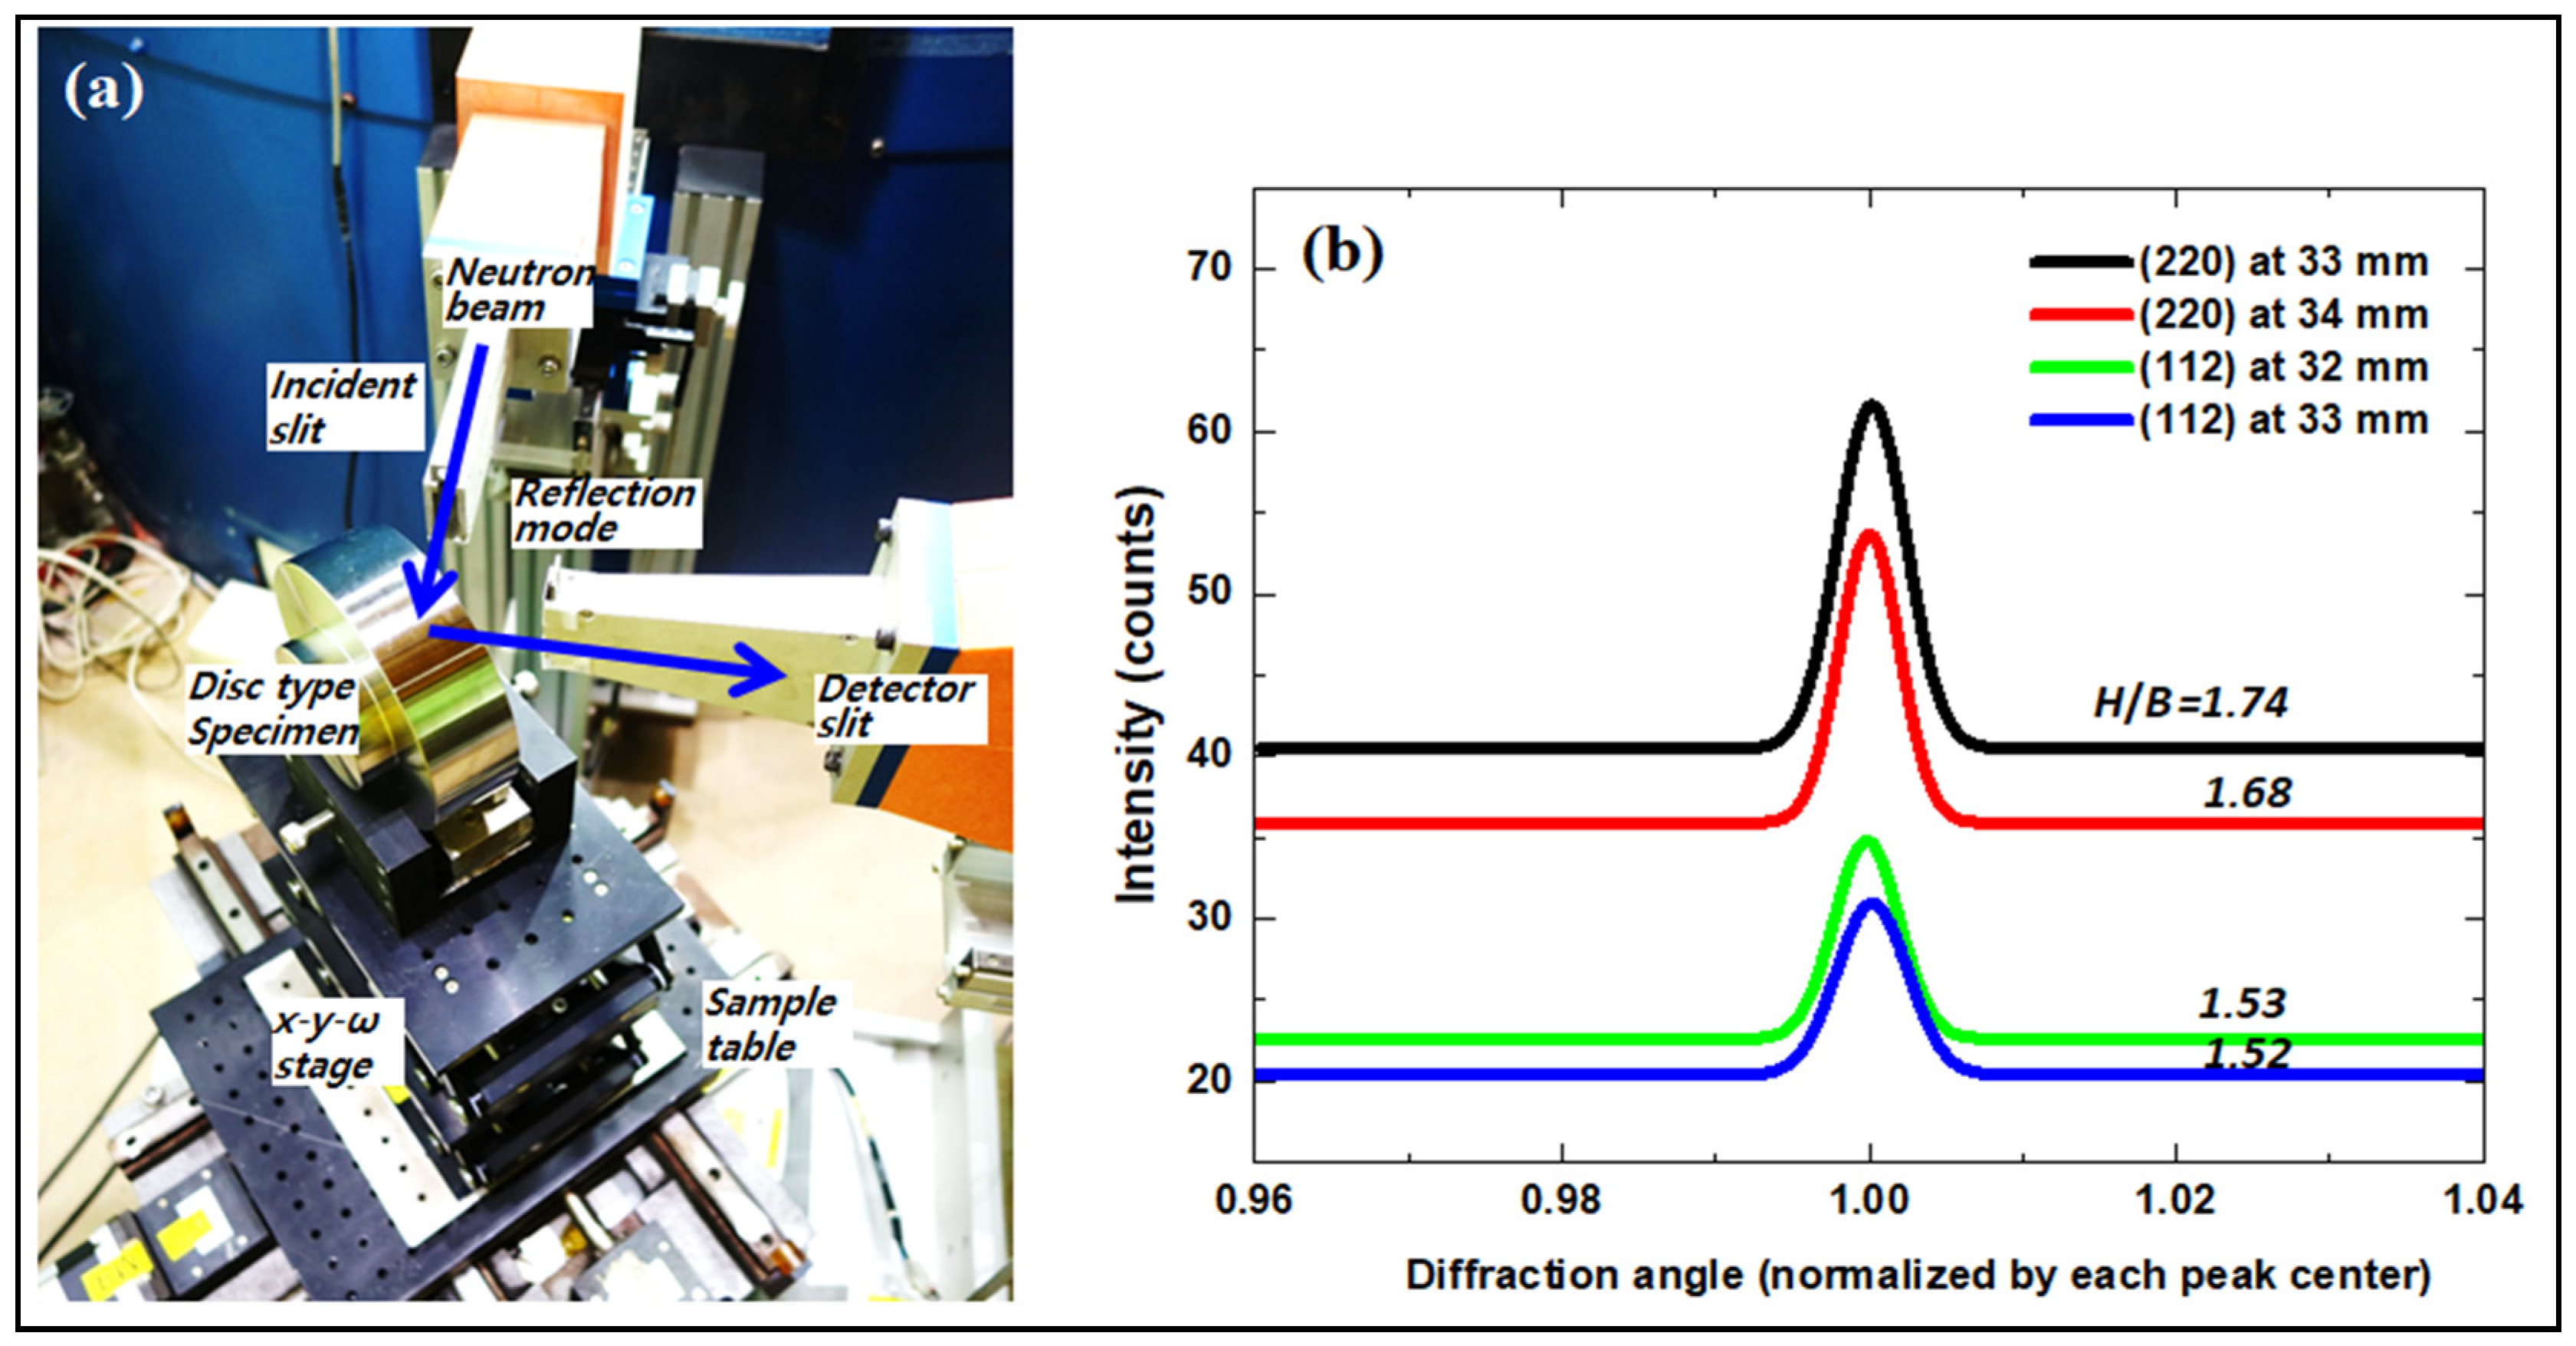
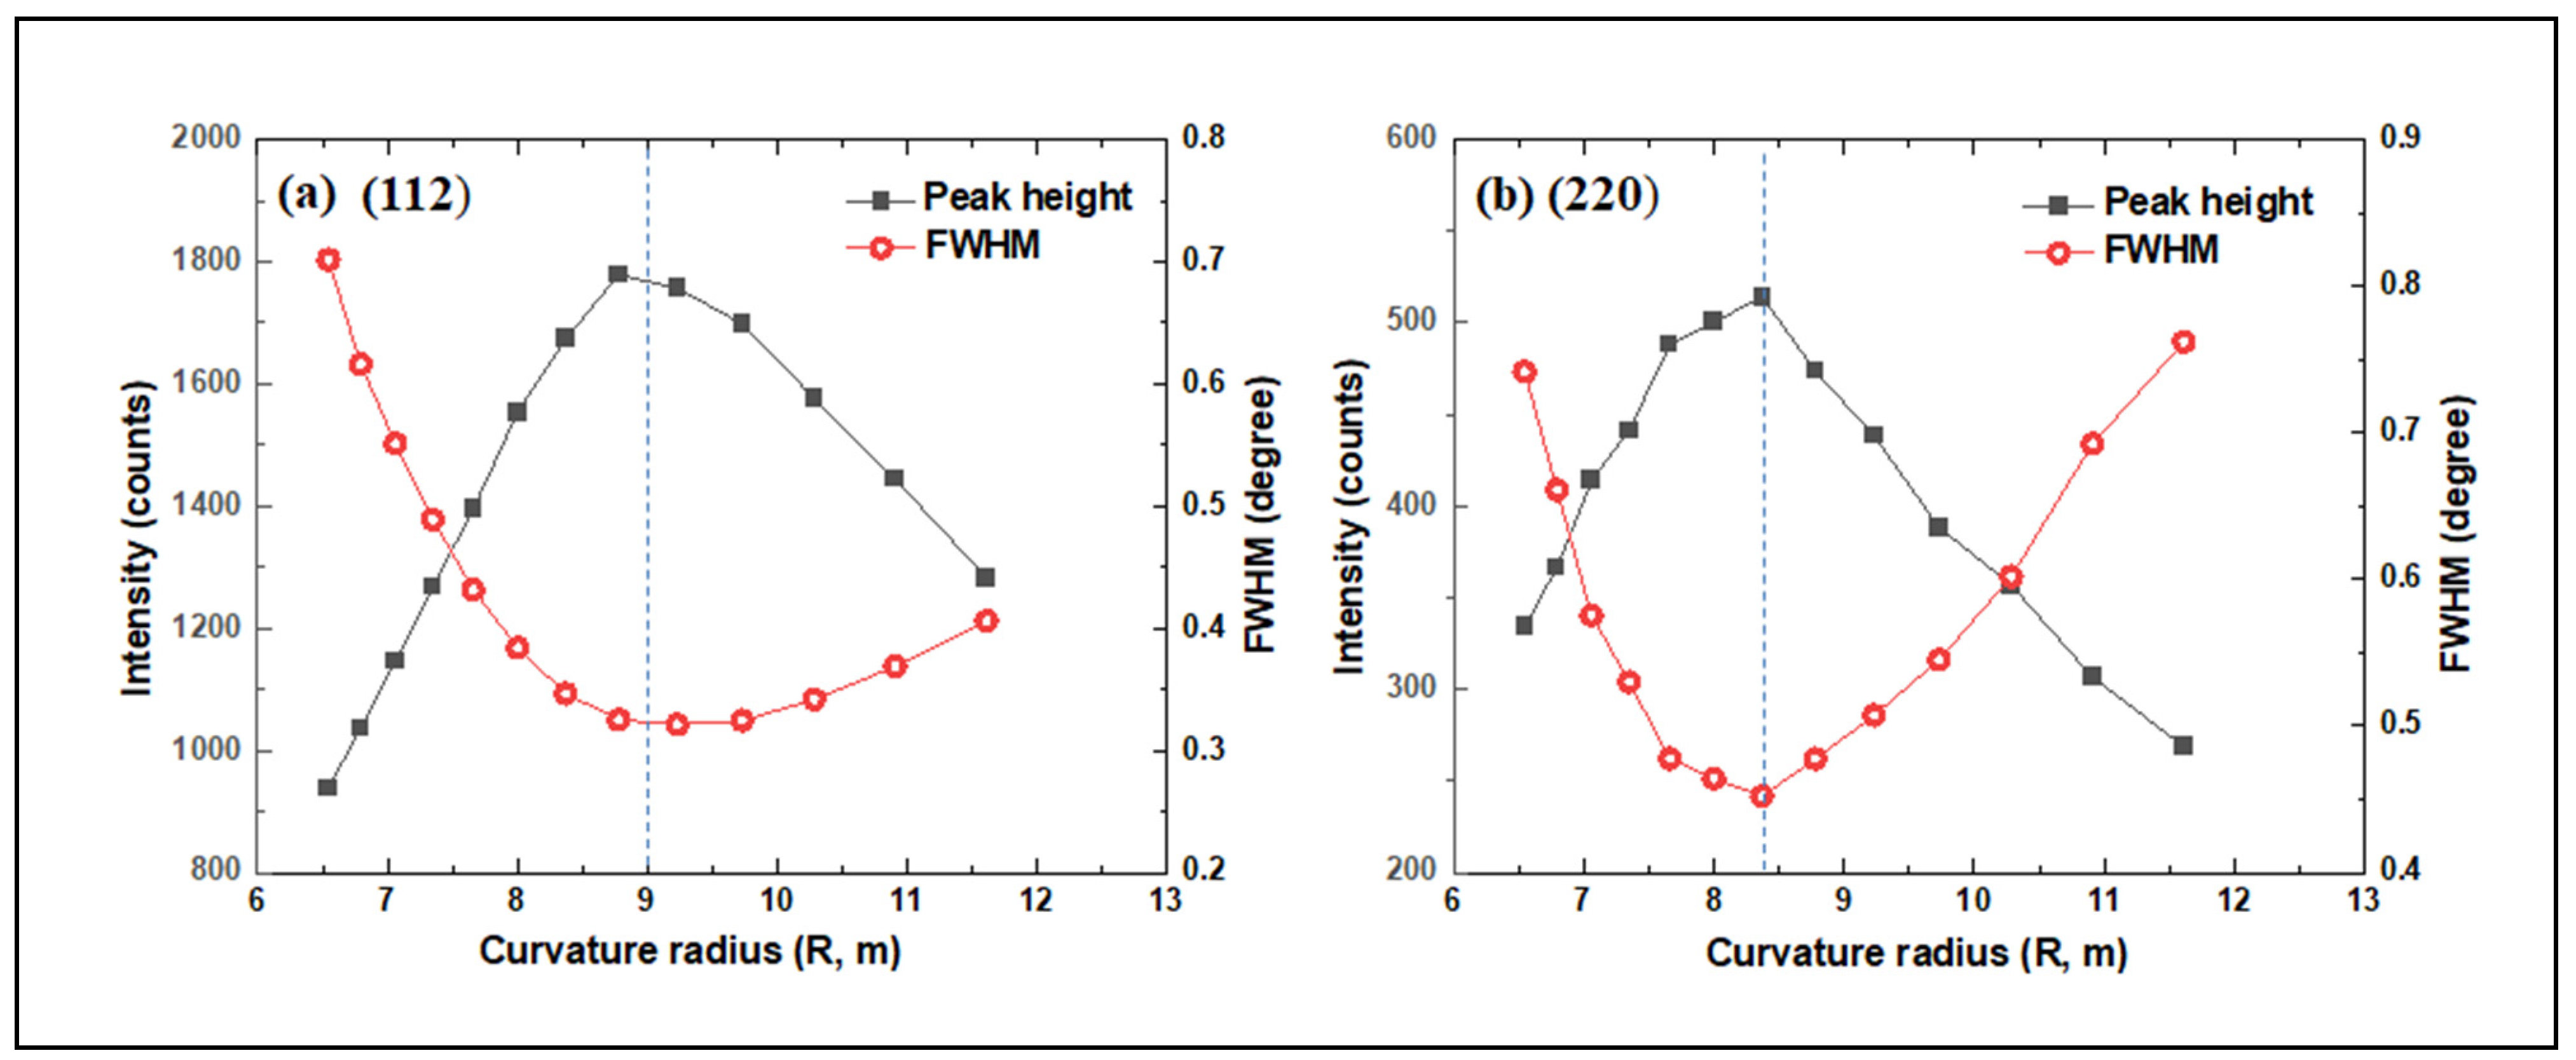
3.1. Optimum Beam Properties for (112) and (220) Diffractions in Ferritic Steels

It has been known that the error of the diffraction peak position is proportional to the peak width (full width at half maximum, FWHM) and the square root of the peak height (H) [1,9]. Since the peak width and height vary as a function of the curvature of the monochromator, it is necessary to perform the diffraction experiments to determine the optimized curvature [9,18]. Figure 4 shows the dependence of the H and FWHM of the (112) and (220) diffraction peaks from a ferritic steel as a function of the curvature radius (R, m) by bending the Si220 monochromator. The diffraction peaks were obtained from an identical ferritic steel pin (diameter of 2 mm, height of 40 mm) when R varied with the same λ of 1.55 Å. This shows that the optimal ratio of the height and width for the (112) and (220) peaks can be achieved at R112 ≈ 9.0 m and R220 ≈ 8.4 m, respectively. With the proper R, the peak width is the minimum with, for example, 0.33 degree for the FWHM112 and 0.45 degree for the FWHM 220 with mostly the highest intensities, respectively.

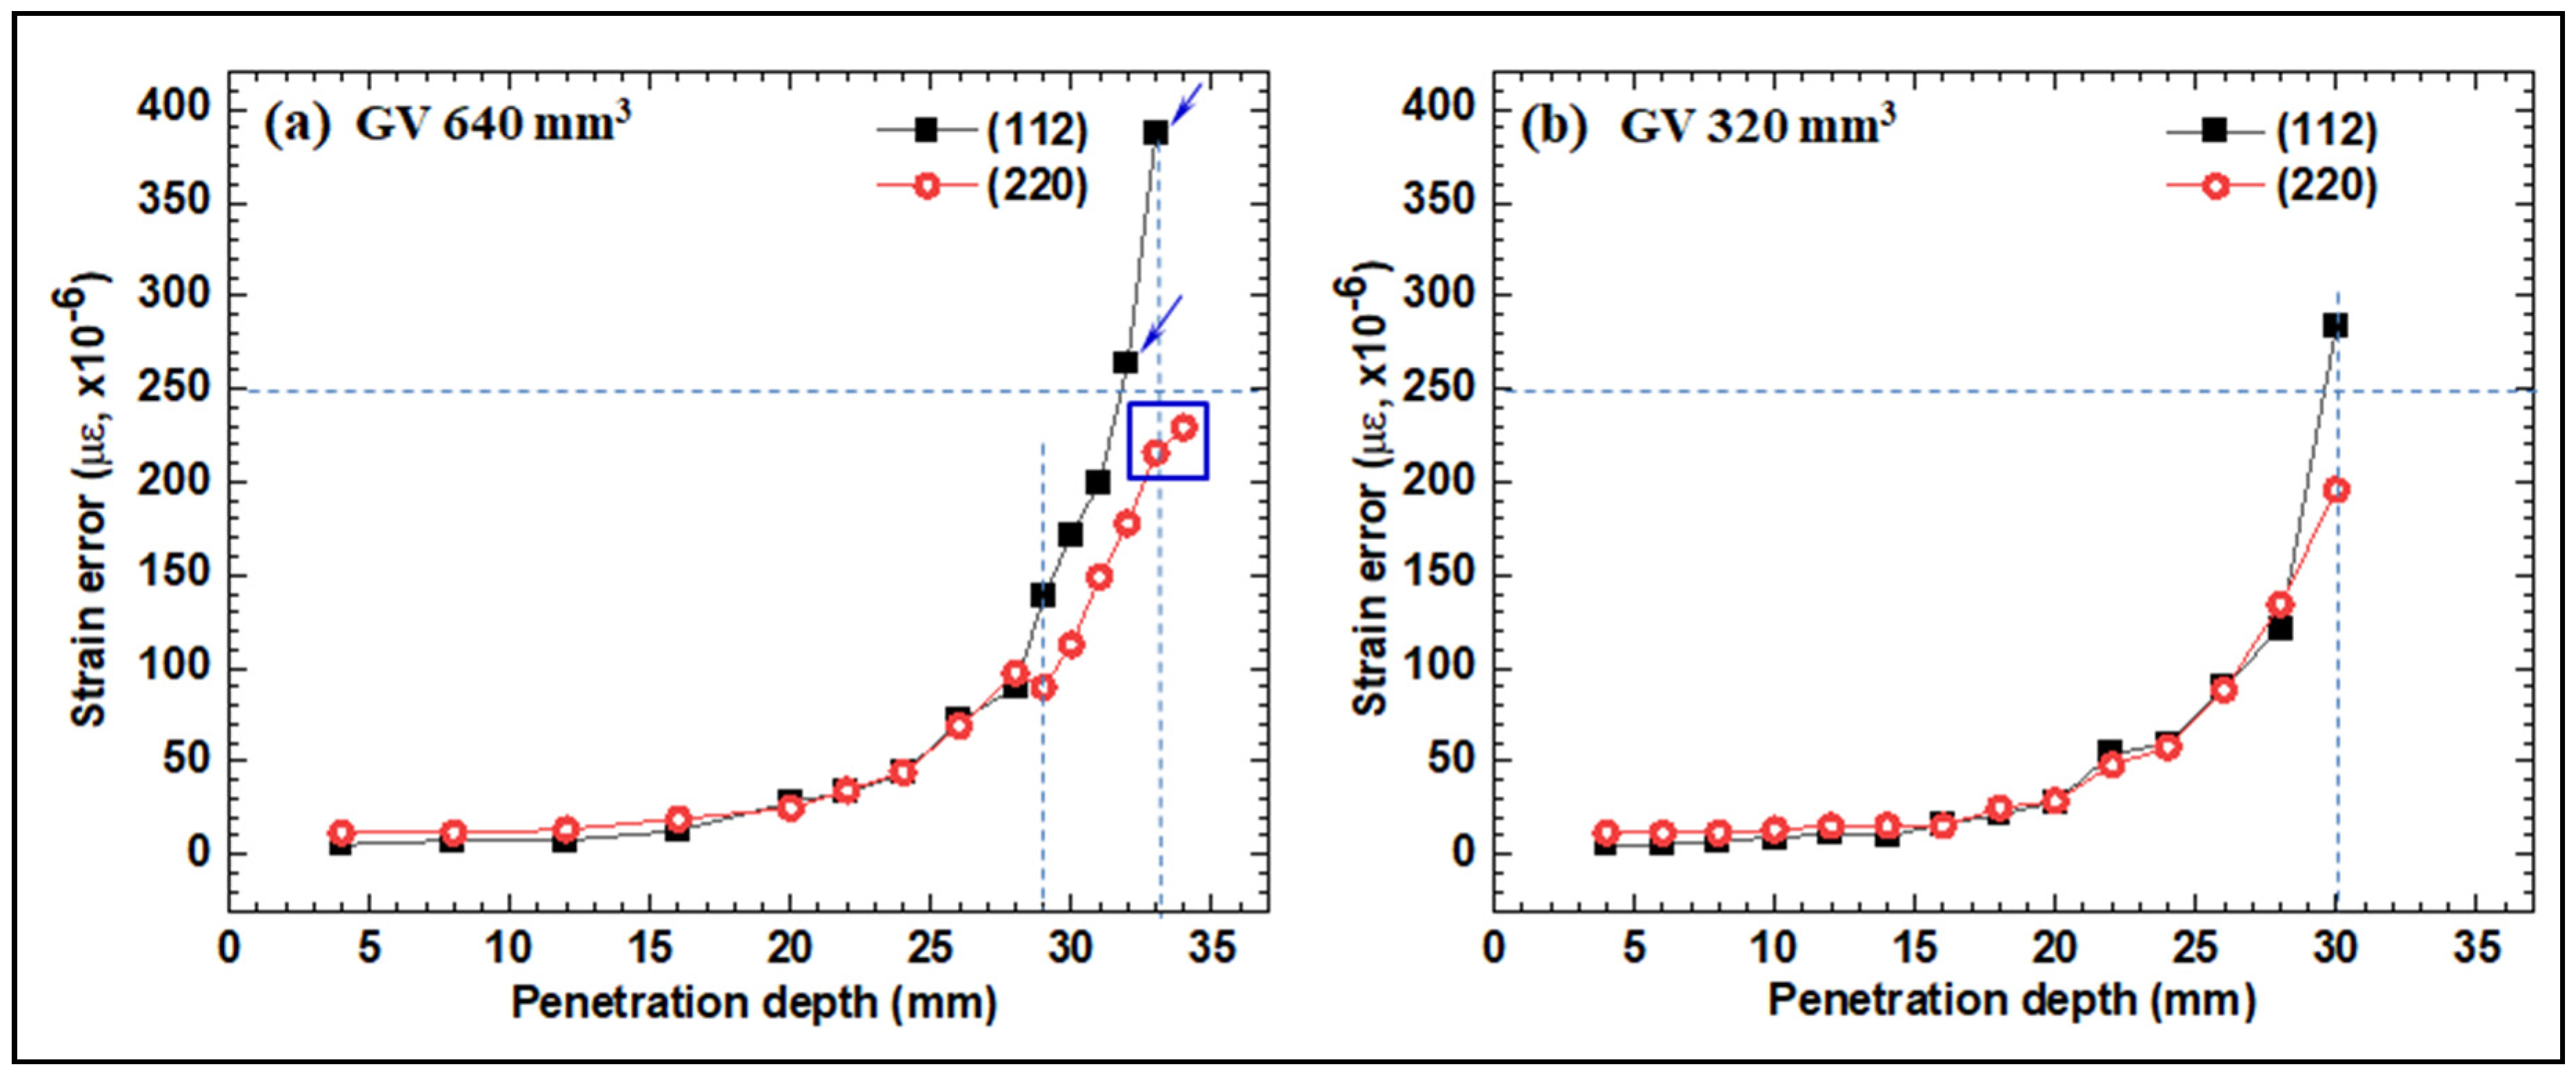
3.2. Strain Error Measurements as a Function of the Penetration Depth

Figure 5a show the experimental strain error, Err (ε), as a function of the penetration depth for the (112) and (220) diffractions with a gauge volume (GV) of 640 mm3. Once the peak position was determined by Gaussian fitting, as shown in Figure 3b, the strain error could be calculated by Err (ε) = u cot θ/I½, where u is the standard deviation of the peak profile in the diffraction angle (θ), and I is the integrated peak intensity [7,9]. The result shows slightly lower errors for the (112) diffraction near the surface (~15 mm depth). This is likely due to the approximately 2.3 times larger integrated intensity of the (112) peak compared to that of the (220) peak near the surface. Then, most errors from the (112) diffractions are similar to those from the (220) diffractions up to a ~25 mm depth. However, from a depth of 29 mm, it is clear that the errors for (220) diffractions become smaller than those from the (112) diffractions. The trend is similar when the gauge volume is half (320 mm3), as shown in Figure 5b. The relatively larger strain errors in Figure 5b than in Figure 5a are due to the fewer number of diffraction grains reflected from the half-beam gauge volume.

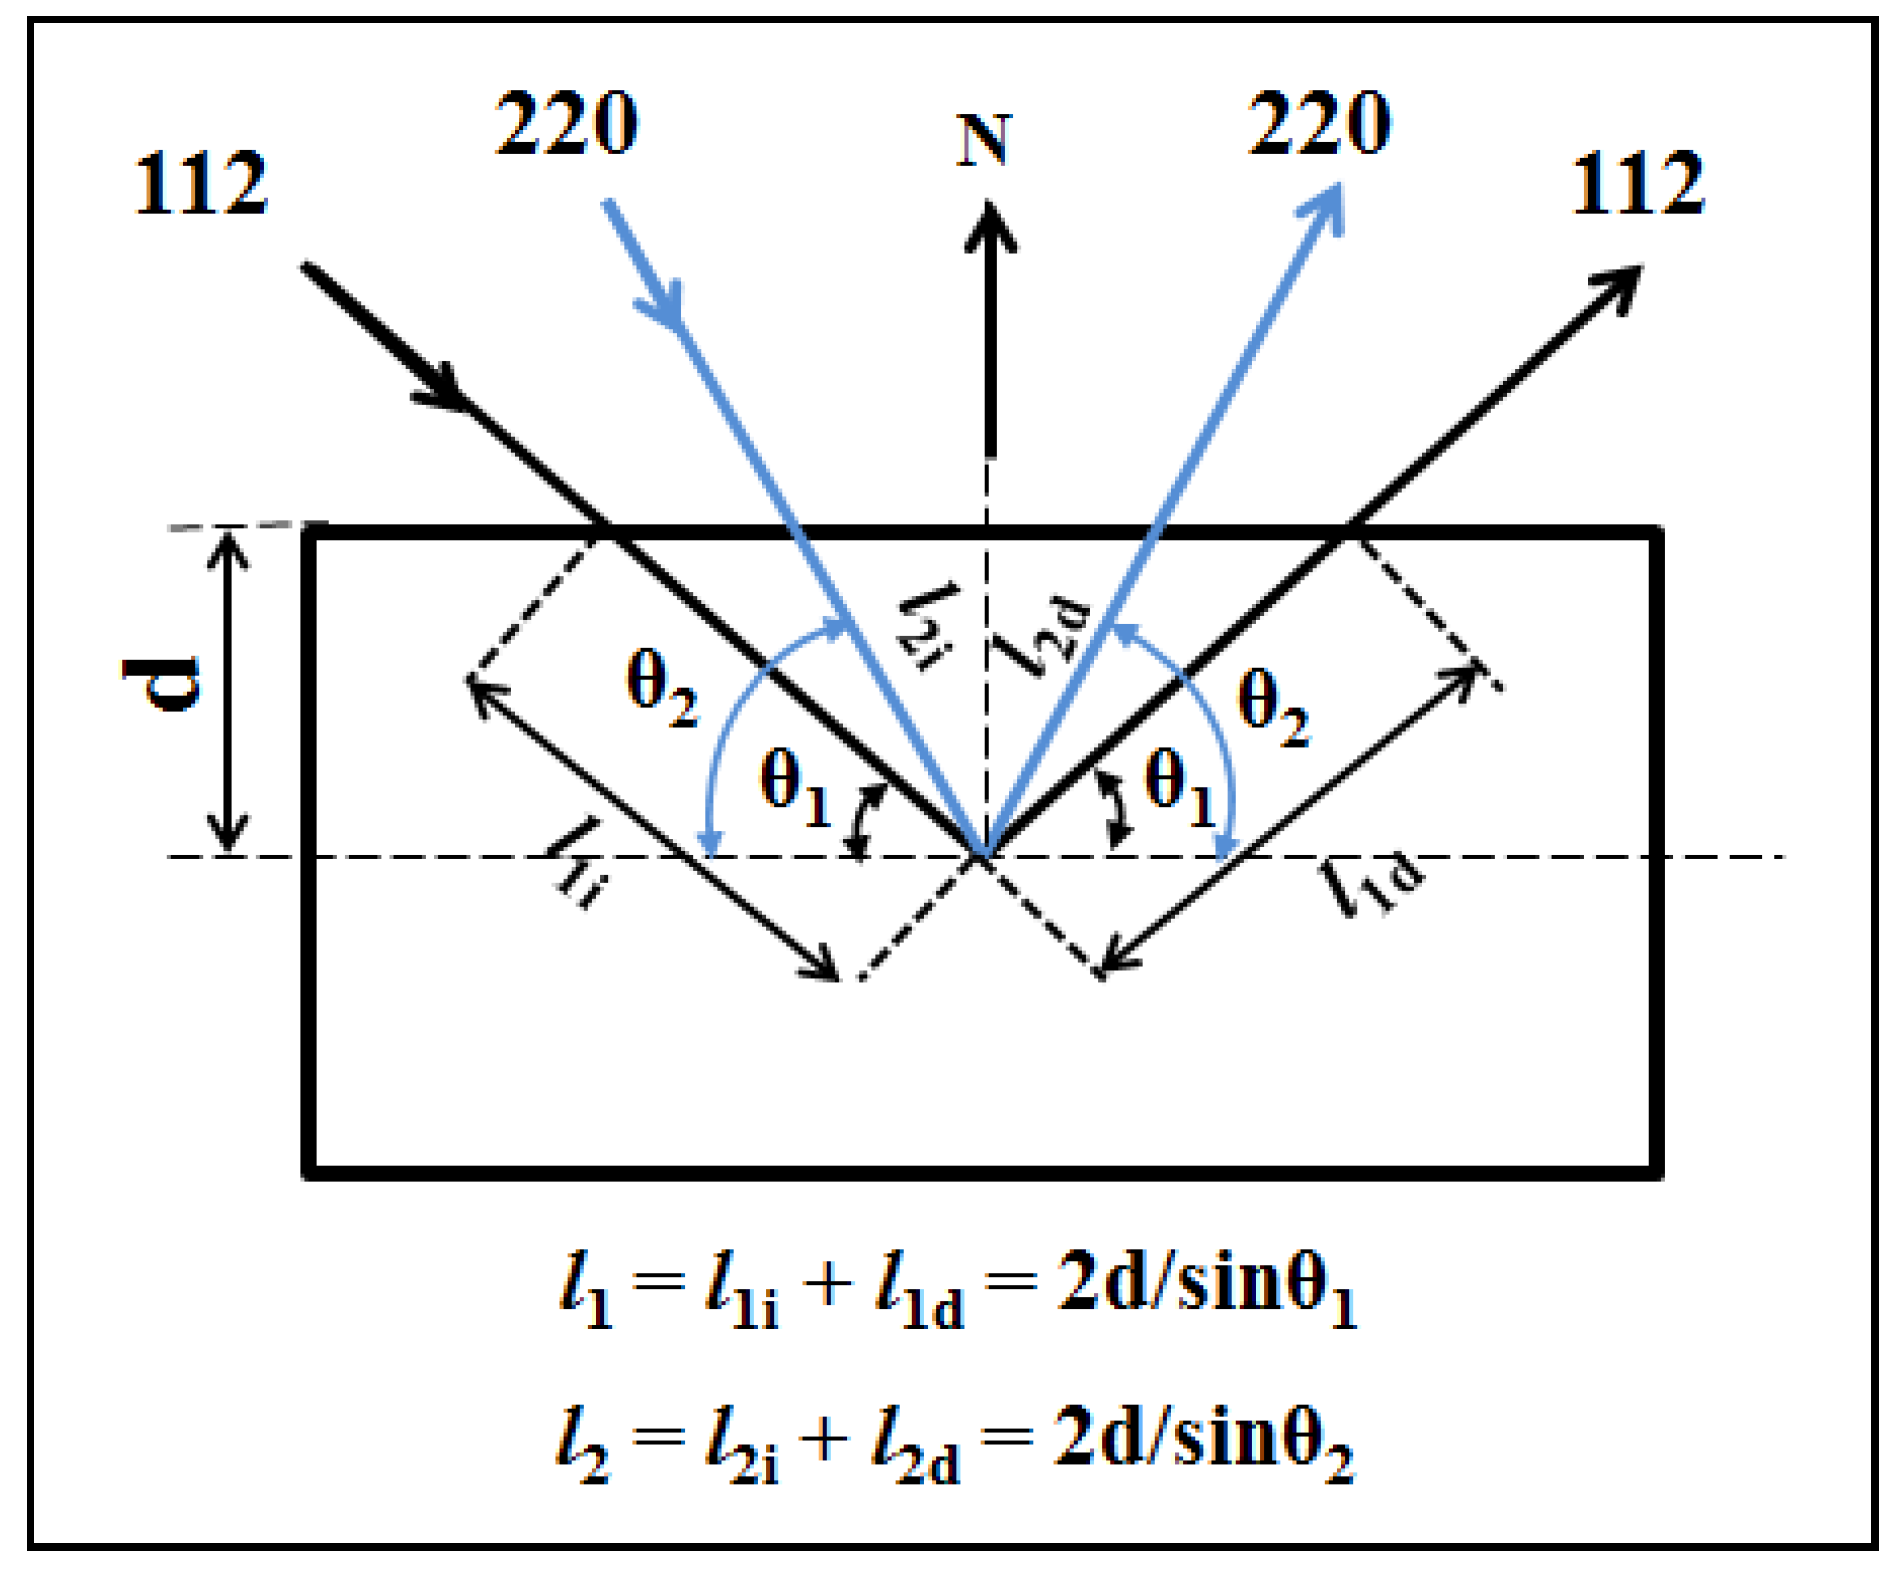
3.3. Reasons for the Lower Strain Errors with the (220) Diffraction

First of all, it is necessary to confirm whether the attenuation coefficient (μ) is identical between the two separate experiments, i.e., when using (112) and (220) diffractions. If μ is different, this is misleading for the selection of the wavelength (λ = 1.55 Å) and/or diffraction angles in experiments. The integral intensity of a beam decreases as the path length (l) increases [9,21].
Il = I0e−μl
where Il is the integral intensity at a path length (l), I0 is the intensity on the surface, and μ is the linear attenuation coefficient of the neutron beam in the material. Equation (3) is driven by ln(I0/Il) = μl, and μ can be defined as the angular coefficient of the linear dependence (slope) of ln(I0/Il) on the path length (l). Figure 6 shows ln(I0/Il) versus l plotted from the experimental intensities of the (112) and (220) peaks. Note that I0 was used as the intensity of the diffraction peak at a depth of 4 mm and that l measured the intensity at each point. Note that it is necessary to immerse the entire beam (gauge volume) within the specimen. This shows that μ, experimentally obtained for the reflections 112 and 220, coincide well with each other within the experimental error: μ112 = (0.1028 ± 0.0003) mm−1 and μ220 = (0.1029 ± 0.0003) mm−1. This shows that the μ values are comparable due to the properly selected same λ of 1.55 Å in both diffractions. As a comparison, the μ at 1.55 Å is much lower than the λ of 1.8 Å (0.1240 mm−1 [1]) because 1.55 Å is located near the Bragg edge, which has a lower neutron cross-section than for 1.8 Å, as marked in Figure 1.
It is necessary to discuss the correlation between the strain error and beam path length. If the diffraction peak has the shape of a Gaussian distribution and the background level is low, the strain error, Err (ε), is determined by the relation shown below [7]:
Err (ε) = u cot θ/I½
where u is the standard deviation of the peak profile in θ, and I is the integrated peak intensity. If the peak width does not change with the path length (l) in the material, the error at l is driven by Equation (3), as shown below:
Err (ε)l = u cot θ/(I0eμl)½
Figure 7 shows the passage of neutron beams for the measurement of the normal (N) strain component with the (112) and (220) diffractions. When measuring the N component at depth (d), the error is as follows:
Err (εi)d = ui cot θi/(Ii0 e−2μd/sin θi)½
where i = 1, 2, corresponding to the (112) and (220) diffractions, respectively. The difference in the beam path lengths between the (112) and (220) diffractions is l1l2 = 2d(1/sin θ1 − 1/sin θ2) in Figure 7. This means that the beam path difference (l1l2) increases as d increases. Thus, the 112 peak intensity should decrease much faster than the 220 peak with the depth. Equation (6) implies that the strain error, Err (ε), also exponentially increases as the depth (d) increases. As a result, the errors for the (220) diffraction should be less than for the (112) diffraction. Indeed, this was obvious to note for depths of 29–30 mm in the neutron diffraction experiments shown in Figure 5.
Finally, it is necessary to consider the background level (B) of the diffraction peak. As the beam path increases, B also increases and becomes comparable to the peak height (H) as depth in Figure 3b. Consequently, it is known that the strain error increases with the penalty factor: 1 + 2 2 B / H 1 / 2 [21]. Assuming that the peak width is independent of the depth, the peak height (H) also decreases exponentially with the path length (l): Hl = H0 exp(−μl). Thus, the strain error at depth (d), Err (εi)d, is further derived from Equation (6), as shown below:
E r r ε i d = c o t θ i u i I i 0 e 2 μ d / s i n θ i 1 / 2 1 + 2 2 B i d H i 0 e 2 μ d / s i n θ i 1 / 2
As the depth (d) increases, the second factor grows in the same way as the first. This means that the Err (εi)d for the (112) diffraction increases more than for the (220) diffraction due to the increases of the background (B) as well.
Feasibility and limitations should be mentioned for further considerations. The reduced beam path length (lm = ~16 mm) due the large diffraction angle (2θ = 99.4°) in configuration 3 corresponds to a thickness of about 12 mm (Dref = 0.5lm sin θ220). This means that the penetration thickness of 80 mm should be exceeded by the current configuration when using the proper neutron beam condition used in ref. 13. Meanwhile, the experiments were performed under non-texture conditions. In the case of textured specimens that are often observed in thick welds, it is necessary to experimentally determine whether the (112) or (220) diffractions are advantageous for measuring the normal strain component. In general, the (112) diffraction is less sensitive to texture than the (220) diffraction due to the larger multiplicity factor. Furthermore, the elastic constants of the (110) and (220) planes of the ferritic steels are inherently the same, and thus the stress calculations when using both diffractions should be correct.

4. Conclusions

For the residual stress measurements in thick ferritic steel specimens using neutron diffraction, we recommend configuration 1, shown in Table 1, as the proper configuration for longitudinal and transverse strain components when using transmission geometry at all depths. On the other hand, for the measurement of a normal component using reflection geometry, configuration 3, utilizing a neutron beam with a wavelength of 1.55 Å diffracted from the (220) plane with a diffraction angle (2θ) of 99.4°, is highly recommended for cases involving a specimen thickness of over 80 mm, instead of the (112) diffraction used in configuration 2.

Author Contributions

Conceptualization, W.W. and V.E.; methodology, K.I. and P.M.; software, K.I. and P.M.; formal analysis, K.I. and P.M.; investigation, W.W. and V.E.; writing—original draft preparation, K.I. and P.M.; writing—review and editing, W.W. and V.E.; visualization, K.I. and P.M.; project administration, W.W. and V.E.; funding acquisition, W.W. and V.E. All authors have read and agreed to the published version of the manuscript.

Funding

This study was performed using the equipment of the unique Neutron research complex based on an IR-8 reactor at the National Research Center, Kurchatov Institute. This work was supported by the Korea Institute of Energy Technology Evaluation and Planning (KETEP) and the Ministry of Trade, Industry & Energy (MOTIE) of the Republic of Korea (No. 20223030030110).

Data Availability Statement

The original contributions presented in the study are included in the article, and further inquiries can be directed to the corresponding authors.

Acknowledgments

We thank the National Research Center, Kurchatov Institute for neutron resources. We also thank the Korea Institute of Energy Technology Evaluation and Planning (KETEP) and the Ministry of Trade, Industry & Energy (MOTIE) for financial support.

Conflicts of Interest

The authors declare no conflict of interest.

References

  1. Withers, P.J.; Bhadeshia, H.K.D.H. Overview residual stress, part 2: Nature and origin. Mater. Sci. Technol. 2001, 17, 366–375. [Google Scholar] [CrossRef]
  2. Hutchings, M.T.; Withers, P.J.; Holden, T.M.; Lorentzen, T. Introduction to the Characterization of Residual Stress by Neutron Diffraction; Taylor and Francis: London, UK, 2005. [Google Scholar]
  3. Santistaban, J.R.; Daymond, M.R.; James, J.A.; Edvards, L. ENGIN-X: A third-generation neutron strain scanner. J. Appl. Cryst. 2006, 39, 812–825. [Google Scholar] [CrossRef]
  4. Smith, D.J.; Bouchard, P.J.; George, D. Measurement andprediction of residual stresses in thick-section steel welds. J. Strain Anal. 2000, 35, 287–305. [Google Scholar] [CrossRef]
  5. Rossini, N.S.; Dassisti, M.; Benyounis, K.Y.; Olabi, A.G. Review: Methods of measuring residual stress in components. Mater. Des. 2012, 35, 572–588. [Google Scholar] [CrossRef]
  6. Dive, V.; Lakade, S. Recent Research Progress on Residual Stress Measurement Using Non-Destructive Testing. Mater. Today Proc. 2021, 47, 3282–3287. [Google Scholar] [CrossRef]
  7. Withers, P.J. Depth capabilities of neutron and synchrotron diffraction strain measurement instruments, I. The maximum feasible path length. J. Appl. Cryst. 2004, 37, 596–606. [Google Scholar] [CrossRef]
  8. Withers, P.J. Depth capabilities of neutron and synchrotron diffraction strain measurement instruments, II. Practical implications. J. Appl. Cryst. 2004, 37, 607–612. [Google Scholar] [CrossRef]
  9. Woo, W.; Em, V.; Seong, B.S.; Shin, E.; Mikula, P.; Joo, J.; Kang, M. Effect of wavelentgh-dependent attenuation on neutron diffraction stress measurerments at depth in steel. J. Appl. Cryst. 2011, 44, 747–754. [Google Scholar] [CrossRef]
  10. Lodh, A.; Thool, K.; Samajdar, I. X-ray Diffraction for the Determination of Residual Stress of Crystalline Material: An Overview. Trans. Indian Inst. Met. 2022, 75, 983–995. [Google Scholar] [CrossRef]
  11. Woo, W.; An, G.B.; Kingston, E.J.; DeWald, A.T.; Smith, D.J.; Hill, M.R. Through-thickness distributions of residual stresses in two extreme heat-input thick welds: A neutron diffraction, contour method and deep hole drilling study. Acta Mater. 2013, 61, 3564–3574. [Google Scholar] [CrossRef]
  12. Woo, W.; An, G.B.; Em, V.T.; DeWald, A.T.; Hill, M.R. Through-thickness distributions of residual stresses in an 80 mm thick weld using neutron diffraction and contour method. J. Mater. Sci. 2015, 50, 784–793. [Google Scholar] [CrossRef]
  13. Jiang, W.; Li, J.; Wan, Y.; Sun, G.; Tu, S.-Y.; Woo, W. Determination of the through-thickness residual stress in thick duplex stainless steel welded plate by wavelength-dependent neutron diffraction method. Int. J. Press. Vessel. Pip. 2022, 196, 104603. [Google Scholar] [CrossRef]
  14. Popovici, M.; Yelon, W.B.; Berliner, R.; Stoica, A.D.; Ionita, I.; Law, R. Curved crystal optics and the resolution formalism: Programs and optimization procedures. Nucl. Instrum. Methods Phys. Res. Sect. A 1994, 338, 99–110. [Google Scholar] [CrossRef]
  15. Schröder, J.; Evans, A.; Mishurova, T.; Ulbricht, A.; Sprengel, M.; Serrano-Munoz, I.; Fritsch, T.; Kromm, A.; Kannengießer, T.; Bruno, G. Diffraction-Based Residual Stress Characterization in Laser Additive Manufacturing of Metal. Metals 2021, 11, 1830. [Google Scholar] [CrossRef]
  16. Popovici, M.; Stoica, A.D. Neutron imaging with multi-wafer monochromators. Appl. Phys. A 2002, 74, S273–S276. [Google Scholar] [CrossRef]
  17. Moon, M.-K.; Em, V.T.; Lee, C.-H.; Mikula, P.; Hong, K.-P.; Choi, Y.-H.; Cheon, J.-K.; Nam, U.-W.; Kong, K.-N.; Jin, K.-C. Optimization of bent perfect Si(2 2 0) crystal monochromator for residual strain/stress instrument. Part II. Phys. B Condens. Matter 2005, 368, 70–75. [Google Scholar] [CrossRef]
  18. Mohamed, O.; Zhu, B.; Leung, N.; Kockelmann, W.; Barrett, T.R.; Whiting, M.J.; Wang, Y.; Sui, T. The use of time-of-flight neutron Bragg edge imaging to measure the residual strains in W/Cu dissimilar joints for fusion reactors. Nucl. Mater. Energy 2024, 38, 101593. [Google Scholar] [CrossRef]
  19. Bunn, J.R.; Fancher, C.M.; Payzant, E.A.; Cornwell, P.A.; Bailey, W.B.; Gregory, R. The high intensity diffractometer for residual stress analysis (HIDRA), a third generation residual stress mapping neutron diffractometer at the high flux isotope reactor. Rev. Sci. Instrum. 2023, 94, 035101. [Google Scholar] [CrossRef] [PubMed]
  20. Hao, J.; Tan, Z.; Lu, H.; Deng, S.; Shen, F.; Zhao, D.; Zheng, H.; Ma, Q.; Chen, J.; He, L. Residual stress measurement system of the general purpose powder diffractometer at CSNS. Nucl. Inst. Methods Phys. Res. A 2023, 1055, 168532. [Google Scholar] [CrossRef]
  21. Withers, P.J.; Daymond, M.R.; Johnson, M.W. The precision of diffraction peak location. J. Appl. Cryst. 2001, 34, 737–743. [Google Scholar] [CrossRef]
Figure 1. Selection of the wavelength (λ) located at the low total neutron cross-section (σt) of the ferritic steel.
Metals 14 00638 g001
Figure 2. Schematic of the sample orientations for the neutron beam penetration. (a) Transmission geometry for the longitudinal (L) and transverse (T) stress components and (b) reflection geometry for the normal (N) component. The gauge volume (GV) is defined by the slits of the incident and diffracted beams. The path length (lm) of the neutron beam in the specimen is the sum of the path lengths of the incident (li) and diffracted (ld) beams.
Metals 14 00638 g002
Figure 3. (a) Experimental set up for the neutron diffraction measurements in the reflection geometry and (b) neutron diffraction peaks (Guassian fitted) from (220) and (112) planes measured at each location. The peak height to background ratio (H/B) is marked.
Metals 14 00638 g003
Figure 4. Variation of the peak height (H) and width (FWHM) in (a) Fe (112) and (b) Fe (220) diffraction peaks.
Metals 14 00638 g004
Figure 5. Strain errors as a function of the penetration depth in ferritic steels (bcc). The depth scan was performed in the reflection geometry with a gauge volume (GV) of (a) 640 mm3 (4 × 4 × 40 mm3) and (b) 320 mm3 (4 × 4 × 20 mm3) for 1 h. The peak profiles of the marked data in (a) are shown in Figure 3b.
Metals 14 00638 g005
Figure 6. Dependences of ln(I0/Il) on path length (l), plotted from the experimental intensities of (112) and (220) diffraction peaks. The μ is noted as the attenuation coefficient.
Metals 14 00638 g006
Figure 7. Comparison of the neutron beam paths between the (112) and (220) diffractions for the normal (N) strain component in the reflection geometry. For the same depth (d), the path length of the reflection 112 (l1 = 2d/sin θ1) is longer than for the reflection 220 (l2 = 2d/sin θ2).
Metals 14 00638 g007
Table 1. Three categories of instrumental configurations for the residual stress measurements in thick ferritic steel specimens.
ConfigurationMonochromator2θM (deg)λ (Å)Diffraction PlaneDiffraction Angle (2θ, deg)
1Si (111)452.39(110)72.1
2Si (220)481.55(112)82.9
3Si (220)481.55(220)99.4
Disclaimer/Publisher’s Note: The statements, opinions and data contained in all publications are solely those of the individual author(s) and contributor(s) and not of MDPI and/or the editor(s). MDPI and/or the editor(s) disclaim responsibility for any injury to people or property resulting from any ideas, methods, instructions or products referred to in the content.

