Abstract
The alloy element Nb plays an important role in improving the performance of zirconium alloys in nuclear reactors. The effect mechanism of Nb doping on mechanical and thermodynamic properties was investigated using experimental and theoretical methods. The results of this study showed us that Nb doping refines grains and enhances hardness. The hardness increases from 2.67 GPa of pure Zr to 2.99 GPa of Zr1.5Nb. Depending on the first-principles calculations, the hardness decreases with the increase in the Nb concentration in the Zr matrix, namely from 2.45 Gpa of pure Zr to 1.78 GPa of Zr1.5Nb. If the first-principles calculations indicate that the hardness decreases with the increase in the Nb concentration in the Zr matrix, grain refinement or defects could play a major role in the increase in hardness. Furthermore, regarding the effect of Nb doping on thermal expansion coefficients, the increase in Nb content causes the thermal expansion coefficients to decrease, which might stem from the strong binding energy between Nb and Zr atoms. The thermal conductivities of three samples show similar changing trends, indicating that thermal conductivity begins to decrease at room temperature and reaches a minimum value of around 400 °C. The thermal conductivity of pure zirconium samples is consistently higher, is more obvious than that of Nb-doped samples in the test range, and decreases with an increase in the doping concentration. The possible reasons for this might stem from the distortion of the Zr matrix due to Nb substitution doping and grain refinement, both of which cause phonon propagation scattering and thus hinder the propagation of phonons. The results obtained herein may be useful for the development of advanced nuclear fuels and waste forms that utilize zirconium in applications beyond their current usage.
1. Introduction
Zirconium alloys have attracted great attention and are used as fuel cladding tubes in nuclear reactors due to their low thermal neutron cross-section, excellent corrosion resistance, remarkable irradiation-induced creep, swelling resistance, and good compatibility with uranium [1,2,3,4,5]. During use in a reactor, the microstructure and properties of zirconium alloys deteriorate because of the high temperature, high pressure, stress, corrosive medium, and especially strong neutron irradiation, which directly affect the service lifetime and, therefore, the safe operation of nuclear power plants. Thus, research on the microstructure evolution laws and performance changes in the characteristics of zirconium alloys under irradiation, aiming to understand their irradiation damage mechanisms, have attracted the most attention [6,7,8,9,10,11,12,13,14,15], providing a basis for the design and development of new zirconium alloys and meeting the growing requirements of nuclear industry development.
Mark R. Daymond et al. conducted an investigation of irradiation damage and hardening in pure Zr and Zr-Nb alloys at 573 K from self-ion irradiation, in which irradiation-induced defects, alloying element redistribution, precipitation, and hardening were analyzed [12]. J. Drouet et al. studied the interaction between dislocation loops and irradiation-induced loops in situ in a Zircaloy-4 alloy irradiated with Zr ions [16], and found that the interaction with the dislocation loops leads to the formation of a helicoidal turn, which expands along the dislocation before being blocked below the sample surface. For the purpose of determining in which way proton irradiation can be representative of neutron irradiation, S. Doriot et al. carried out a transmission electron microscopy study of second-phase particles irradiated by 2 MeV protons at 350 °C in Zr alloys, and compared the influence of the second-phase particle changes on the microstructural evolution with the neutron irradiation that happened in Zy-4 in pressurized water reactor (PWR) conditions [17].
However, tailoring the chemical composition is another research field that aims to improve the in-reactor performance of Zr-based alloys with the aim of fulfilling the requirements of enhancing the burnup and extending the fuel cycle of future nuclear power reactors. In order to reduce the impact of harmful impurities, such as nitrogen, 2.5% Sn content was initially added to Zr and was then reduced to 2% in order to improve the corrosion performance. Later, it was found that the addition of a small amount of Fe, Cr, and Ni was beneficial for improving the corrosion performance of Zr and reducing the Sn content; therefore, a Zircaloy-2 (Zr-2) alloy was developed [18]. Since Ni accelerates hydrogen absorption corrosion, Ni was later removed, the Fe content was increased to strengthen corrosion resistance, and a Zircaloy-4 (Zr-4) alloy was developed [19], which is basically equivalent to the Zr-2 alloy’s mechanical properties and corrosion resistance under the same heat treatment conditions. Due to the small thermal neutron absorption section and the effect of strengthening the alloy of the Nb element, Zr-Nb series alloys, such as E110 [20], M5 [21], and Zr-2.5 Nb [22], were developed. As mentioned previously, the properties of the irradiation defect formation, corrosion behaviors, and irradiation-induced embrittlement and hardening in normal operational conditions are of paramount concern. Thermal expansion and thermal conductivity are two other important parameters in defining nuclear material. In 1970, Wheeler et al. found that the thermal diffusivity of Zircaloy-2 was constant in the temperature range from 550 to 925 K using a modulated electron beam technique [23]. However, perhaps due to the difference in measurement methods, a minimum thermal conductivity could be found at about 400~600 K for pure Zr in subsequent measurements [24,25,26,27]. Hao Wang et al. discovered the microstructural dependence of the thermal conductivity of a zircaloy-4 alloy on the extended Raman thermometry method [28]. Regarding the temperature dependence of the thermal expansion of the Zr alloy, some researchers also carried out other investigations [23,29,30]. The thermal linear expansion coefficients of cladding tubes and rods made of the E110opt zirconium alloy were investigated using the Netzsch 402 C dilatometer by M. G. Isaenkova et al. [30], and the measured values of the α phase were equal to (5–7) × 10–6 K–1 in the temperature range of 293–1473 K.
Fundamental studies about the effect of Nb on microstructure and corrosion behavior, as well as its mechanical properties, have been carried out [31,32]. An investigation about the influence of the Nb content on the isothermal corrosion behavior of Zr-Nb was carried out by K.N. Choo et al., and they found that the corrosion resistance of the quenched alloy decreases linearly with increasing Nb content of up to 5 wt% Nb [31]. H. L. Yang et al. reported that the doping of Nb into Zr gave rise to a refined grain size in higher Nb-containing alloys, and the hardness increased with an increase in the Nb content [32].
However, the role of Nb in the thermodynamic properties has not been systematically investigated without interference from other chemical elements. Based on Calphad assessments, Guillermet reported that the Nb solubility in the Zr-rich phase is low, at 0.8 at% [33]. In this study, combining the experimental data and the theoretical first principles analysis, the Nb contents in the Zr alloy under the solubility limits and over the solubility limits were chosen to be 0.3 wt% and 1.5 wt% [34,35], respectively. The phase structure, mechanics, and thermodynamics properties were systematically investigated using both experimental and theoretical methods. The results obtained herein may be valuable for the development of advanced nuclear fuels and waste forms that may utilize zirconium in applications beyond its current experience. In other words, these findings may provide insights into achieving optimal Nb concentrations and further enhancing the performance of the next generation of zirconium alloys with excellent thermodynamic properties and anti-irradiation capabilities.
2. Experimental and Theoretical Calculation Methods
2.1. Experimental Methods
In this study, the sample ingots were fabricated using the arc-melted method in an argon atmosphere. Nuclear-grade Zr sponge (>99.5 wt%) and high-purity Nb granular particles (99.9 wt%) were chosen as the raw materials. To ensure the homogeneity of the alloying elements’ distribution, the arc-melted process was repeated three times. The sample preparation process followed the method of H.L. Yang [32], but did not undergo rolling processing. The dimensions of the conical ingot are about 40 mm for the bottom diameter and 25 mm in height. Three samples with different compositions were cut from the same part.
The prepared zirconium alloy ingots were cut into discs with a diameter of 5 mm and a thickness of 2 mm for all kinds of experimental measurements, except the thermal linear expansion coefficients, using the wire-cut electrical discharge machine. The samples for the thermal linear expansion coefficients measurement were cut into cylinders with a diameter of 5 mm and a length of 12 mm. In order to reduce the roughness and meet the testing requirements, all the samples undergo are polished using a mechanical polisher with 600-, 1000-, 1200-, and 2000-grade SiC paper in sequence, followed by 3 mm and 1 mm SiO2 suspension, respectively.
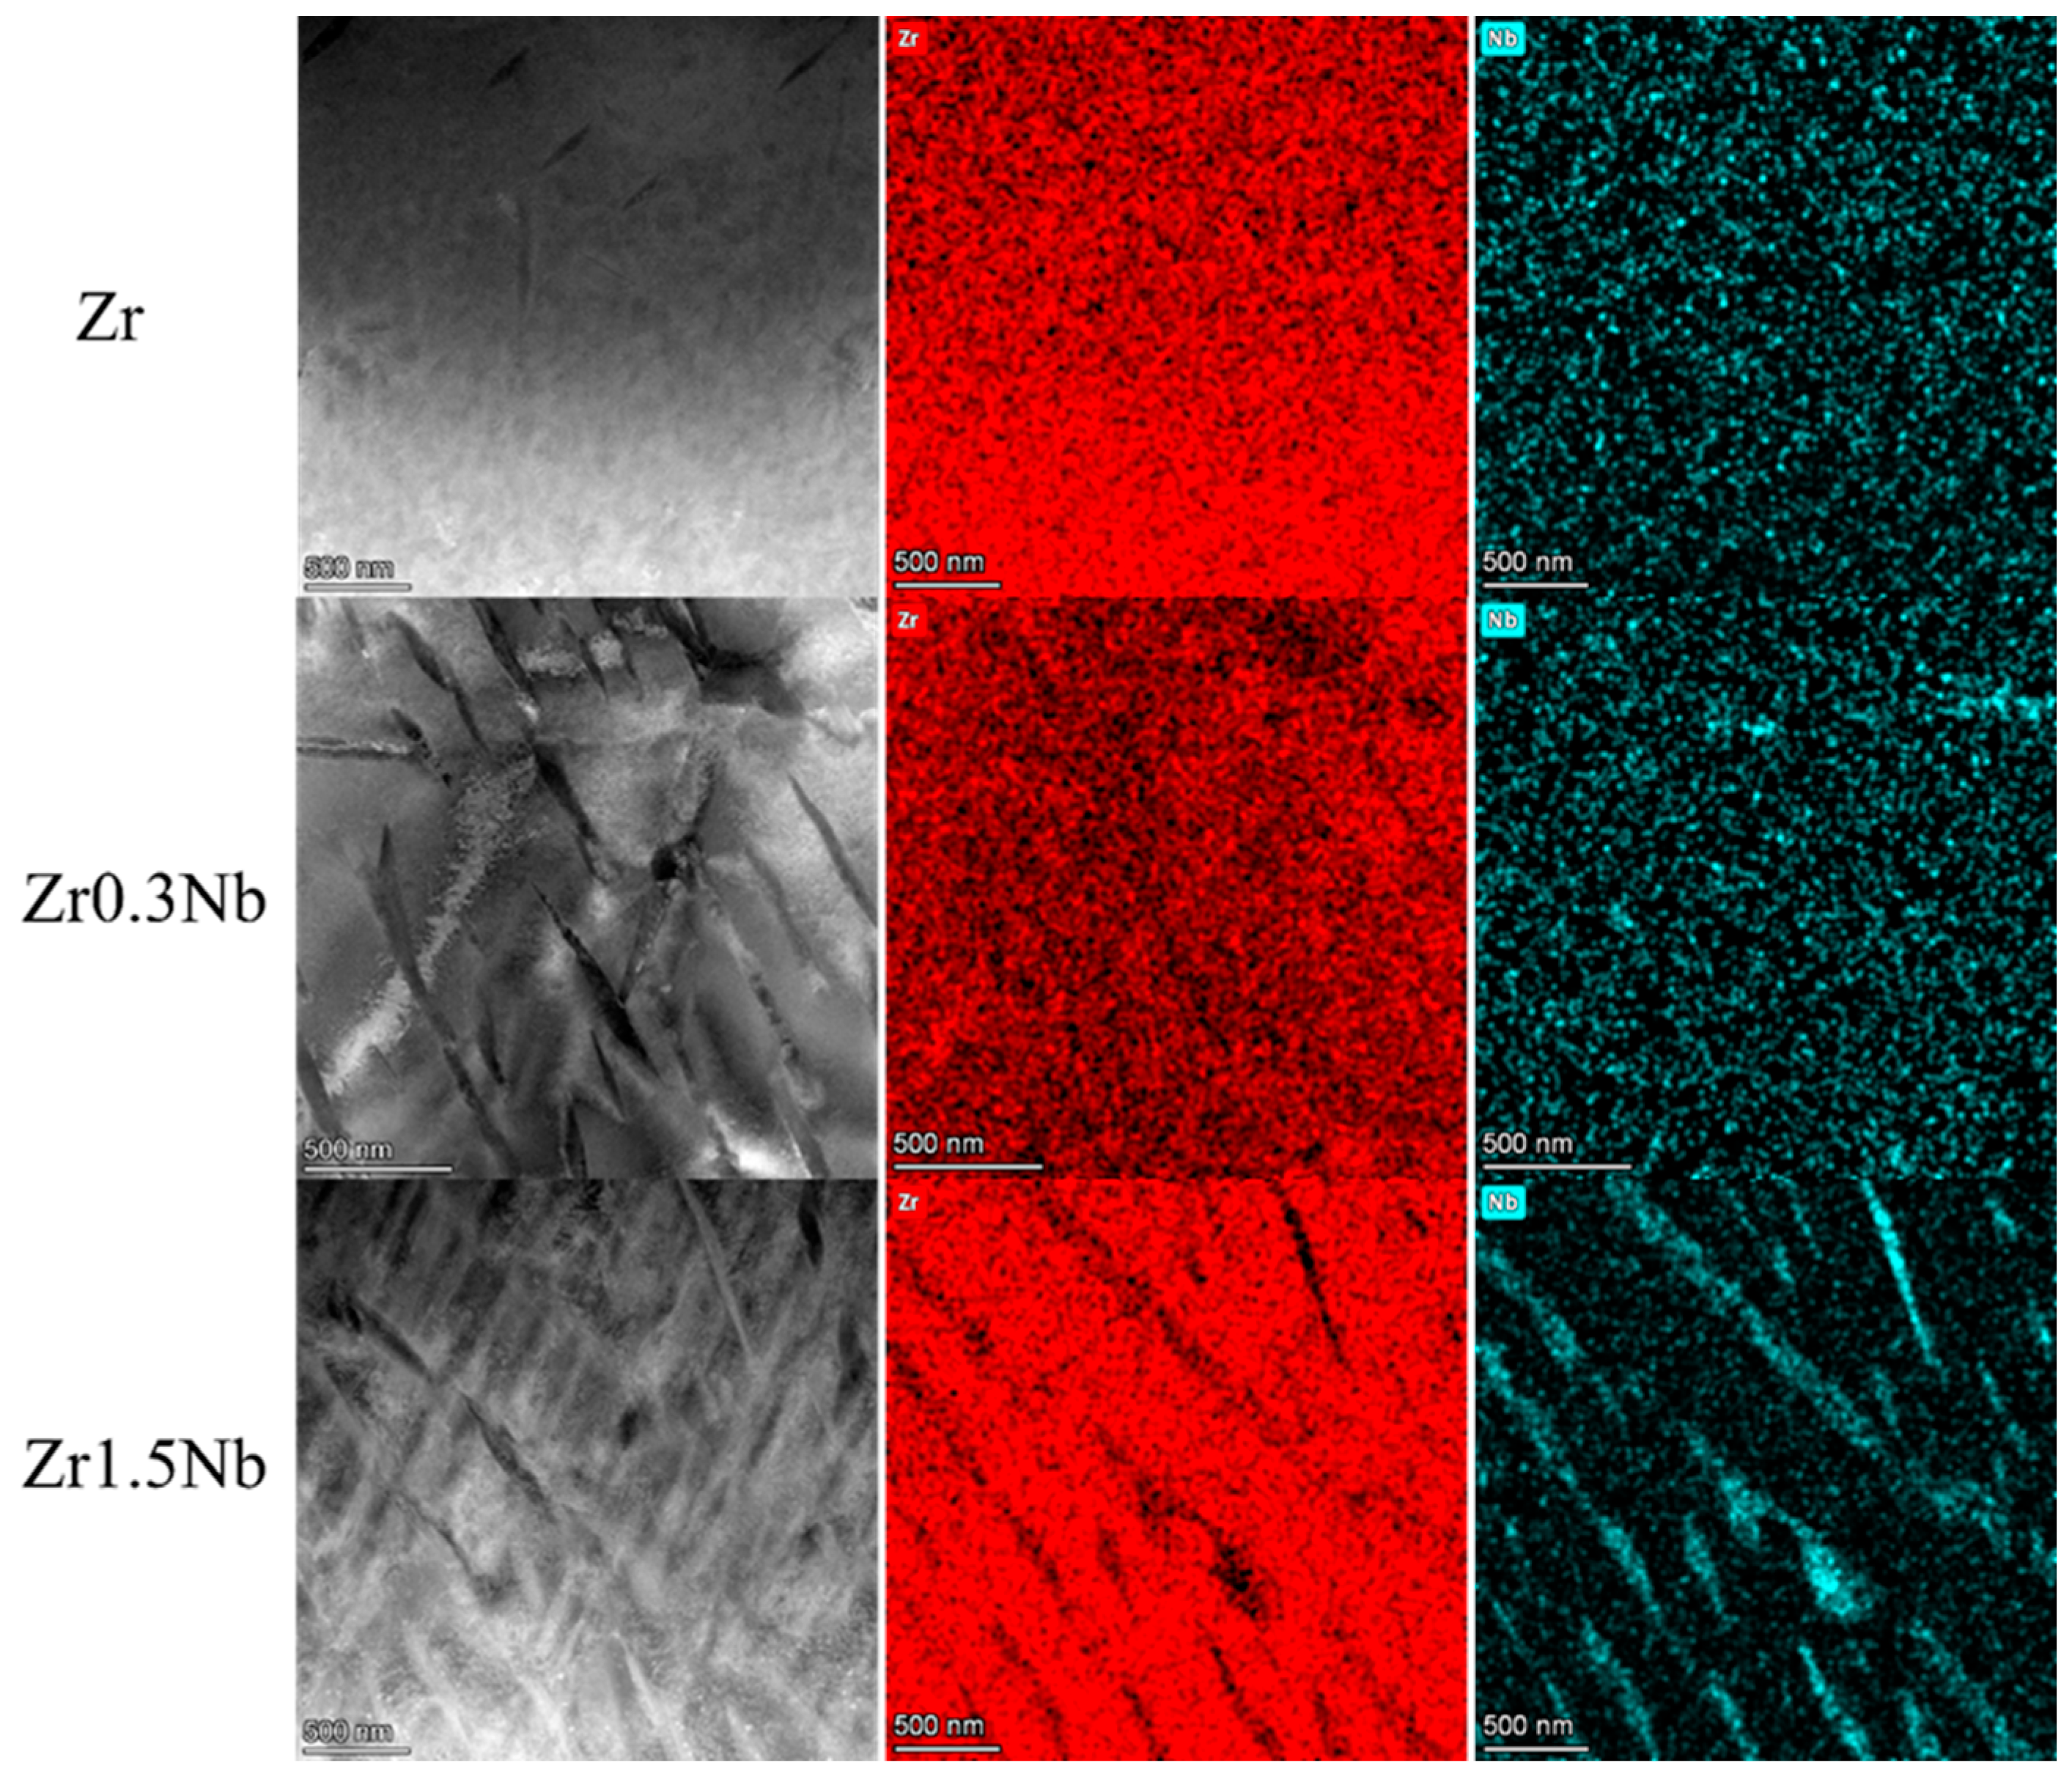
The chemical composition of these three samples was analyzed using energy-dispersive X-ray spectrometry assembled in the Talos F200X field emission transmission electron microscope system(Thermo Fisher Scientific, Brno, Czech Republic). The elemental distribution of the three samples with different Nb contents is shown in Figure 1. They were named Zr, Zr0.3Nb, and Zr1.5Nb depending on their nominal composition. The measurement results are listed in Table 1, and the tiny impurity element Fe was detected. In the case of Zr0.3Nb, the composition of the Nb element is 0.39 wt%, while the concentration of Nb in the Zr1.5Nb is 1.36 wt%, which are close to the nominal concentration. It can be seen in Figure 1 that the second phase, β-Nb, appears to have a needle-like distribution when the concentration of Nb increases to 1.36 wt%, indicating that the concentration exceeded its solid solubility in the Zr matrix.
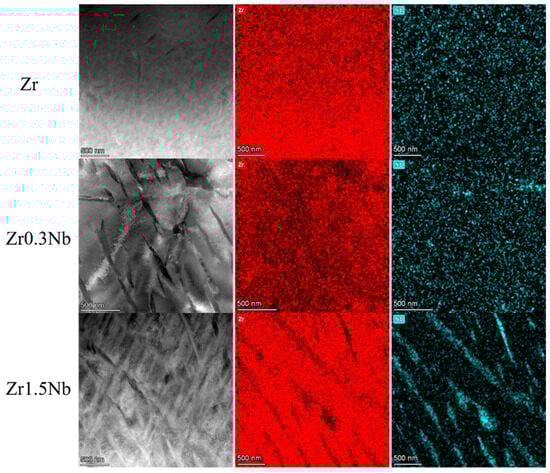
Figure 1.
Elemental distribution of three samples with different Nb contents.

Table 1.
Chemical compositions of the Zr alloy specimens.
The phase structure of the samples was characterized via homemade X-ray diffractometer (DX-2700BH Dandong Haoyuan, Dandong, China) with 2θ scanning modes (Cu Kα radiation) at the step size of 0.02°. The microstructures of these three specimens were characterized via the technique of electron backscattered diffraction (EBSD) to observe the grain size. The specimens used for EBSD observation were fabricated using the electro-polishing method at −20 °C and 18 V. The mixture for electro-polishing consists of 10 vol% perchloric acid and balanced ethanol.
The hardness and elastic modulus measurements were conducted using an in situ nanoindentation instrument, the Hysitron PI 88 (BRUKER, Berlin, Germany), loaded onto a scanning electron microscope. The nanoindentation tests were performed in single indent mode, at a load force maximum set to be 10 mN. In order to ensure the experimental reliability, nine indentation points were measured for each sample, and the distance between each two indentation points was greater than 100 μm. The variation relationship between the thermal conductivity of the zirconium alloy and the temperature was obtained from the Netzsch LFA 1000 laser flash apparatus (NETZSCH, Serb, Germany). Before measurements, the surface of the sample needs to be coated with graphite to increase the absorption of light energy and the infrared emissivity of the surface. The thickness of the graphite coating should be moderate, which can ensure that the surface is evenly and effectively covered but not too thick; otherwise, the thermal diffusion coefficient will be reduced for high-thermal-conductivity materials, so the measurement results will have a large deviation. The thermal linear expansion coefficients of cylindrical specimens were measured from room temperature up to 1000 °C using the Netzsch DIL402C (NETZSCH, Serb, Germany) dilatometer under high-purity helium flow (99.9999%).
2.2. Theoretical Calculation Methods
The elastic constants of pure Zr, Zr0.3Nb, and Zr1.5Nb were calculated with the first principles method based on density functional theory using the Vienna Ab initio Simulation Package (VASP 5.3.5) [36,37]. The pseudopotentials from the VASP library were generated using the projector augmented wave (PAW) approach [38]. The exchange-correlation functional is described by the generalized gradient approximation (GGA) parameterized by Perdew, Burke, and Ernzerhof (PBE) [39]. The plane waves were cut off at the cutoff energies of 500 eV. The Gamma-centered k-point mesh of 3 × 3 × 3 was used for the integration in the Brillouin zone within the supercell used in our work, which contained 144 Zr atoms. All the atom positions and the shape and volume of the supercell were relaxed until the force on each atom was less than 0.01 eV/Å. The substitution doping of one (Zr143Nb1) and two Zr atoms (Zr142Nb2) with a Nb atom meant that the concentration of doping Nb was 0.69% and 1.38%, respectively, which was approximately consistent with our experimental samples.
Referring to the work of S. Q. Wang and H. Q. Ye [40], the elastic constants of pure Zr and the Zr alloy can be obtained according the second derivative of total energy under the external strain around the equilibrium volume, as given in Equation (1).
The elastic constant describes the stiffness of a crystal in response to applied strain . In the case of small strain, a quadratic linear relationship known as Hooke’s law exists between the total energy of the system and the magnitude of the strain. The elastic constant serves as a coefficient that characterizes this quadratic relationship. Therefore, a specific strain is selected, the change in the total energy of the system before and after the strain at a set of different amplitudes is calculated, and then the quadratic term coefficient is obtained by fitting the quadratic function according to the change in the total energy and a set of data corresponding to the strain amplitude. This process allows us to obtain an individual elastic constant or a combination of elastic constants for the crystal under investigation. For crystals with different crystal systems, the independent elastic constants are determined due to their inherent symmetry properties. It is known that there are five independent elastic constants, namely, C11, C12, C13, C33, and C44. Though the doping of Nb atom breaks the symmetry of pure Zr crystal lattice, external strain imposed on the Zr0.3Nb and Zr1.5Nb follows the mode of hexagonal structure. The imposed strains and corresponding changes in energy are shown in Table 2.
Table 2.
The imposed strains and corresponding energy changes of pure Zr and Zr alloys.
Based on the elastic constant obtained by fitting, we can further calculate the bulk modulus (), shear modulus (), Young’s modulus (), and Poisson’s ratio () of the zirconium alloy. It should be pointed out that the aforementioned elastic constants are determined by applying different degrees of strain to the single-crystal material and by fitting the energy–strain curve, while the experimental values stem from the polycrystalline system. In order to compare the experimental results, two approximations are commonly used in theoretical evaluation: Voigt approximation and Reuss approximation. Voigt theory assumes that the distribution of strain in the structure is uniform, i.e., the strain of each grain is equal to the macroscopic strain. The Reuss theory, on the other hand, assumes that the distribution of stresses in the structure is uniform, i.e., the stress to each grain is equal to the macroscopic stress. However, since both approximations differ greatly from the actual situation, Hill improved on the two: the estimates obtained by the Voigt model and the Reuss model can be regarded as the upper and lower bounds of the true value and the arithmetic mean of the two approximates the true value, as shown in Equation (2).
where and are the bulk modulus and shear modulus of Voigt approximation; and are the bulk modulus and shear modulus of Reuss approximation; and are the bulk modulus and shear modulus of Hill approximation.
The detailed forms of and are expressed with elastic constants:
and the detail forms of and are expressed with elastic constants:
In addition, the Young’s modulus () and Poisson’s ratio () can be calculated with Equation (5):
The Vickers hardness of pure Zr and doping Nb alloys were considered based on the empirical model of polycrystalline proposed by Chen et al. [41], and the formula is as follows:
Due to the expensive calculation costs, the thermal conductivity and thermal linear expansion coefficients were calculated with the LAMMPS simulation package (lammps-29Oct20 version) [42]. The supercells used in the simulation calculations were constructed by repeating the initial supercell used in the first principles calculations in the required direction. The interaction between Zr and Nb is described using the angular-dependent potential (ADF) potential. For the thermal conductivity of Zr alloy, the Green–Kubo method of equilibrium molecular dynamics (EMD) was employed. The EMD method allows for an equilibrium simulation to be used to calculate the complete thermal conductivity tensor, thereby obtaining the thermal conductivity of the material in all directions. Moreover, the periodic boundary conditions in the EMD method allow for phonons to traverse at the boundary without scattering; therefore, the calculation of thermal conductivity is much less affected by the boundary conditions and size of the system. In the simulations, the Velocity Verlet algorithm was chosen with 0.5 fs timesteps to integrate the equation of motion. For thermal conductivity calculations, the system temperature starts at 300 K, and the thermal conductivity was calculated at intervals of 100 K to a final temperature of 1200 K. To ensure that the system is in complete equilibrium, the NPT ensemble (constant number of atoms, pressure, temperature) was first equilibrated at 0 bar pressure for 1 ns. Then, the system was run for 6 ns using the NVE ensemble for data collection. The atomic position trajectories were recorded every 10 steps. The Green–Kubo method was used to calculate thermal conductivity, where the upper time limit for integrating the autocorrelation function of heat flux density was set at 400 ps.
The thermal linear expansion coefficient can be calculated using equation at different temperatures. Before the molecular dynamic simulations, the energy of the model structure was minimized by the conjugate gradient algorithm. Then, the structure was thermally balanced with the constant atomic number, pressure, and temperature (NPT) ensemble at the temperature of 300 K. For the calculation of the linear thermal expansion coefficient, the structure was heated at a temperature interval of 100 °K, and the temperature gradually increased from 300 °K to 800 °K. Newton’s equations of motion were iterated using the Velocity Verlet algorithm with a time step of l fs. The thermal equilibrium optimization time for each temperature point was 3 ns to ensure that the structure and simulated box size were fully optimized. The time from the current temperature to the next temperature point was 50 ps. The simulated temperature and pressure were controlled by a Nose–Hoover thermostat and barostat, respectively. The pressure was maintained at 0 Pa in all directions. The last 2 ns of the 3 ns optimization for the thermal equilibrium at each temperature point were taken every 1 ps, and then the average values of the model size were obtained at that temperature point. Through linear fitting, the values of can be obtained.
3. Experimental Results and Discussion
3.1. XRD Phase Structure Analysis
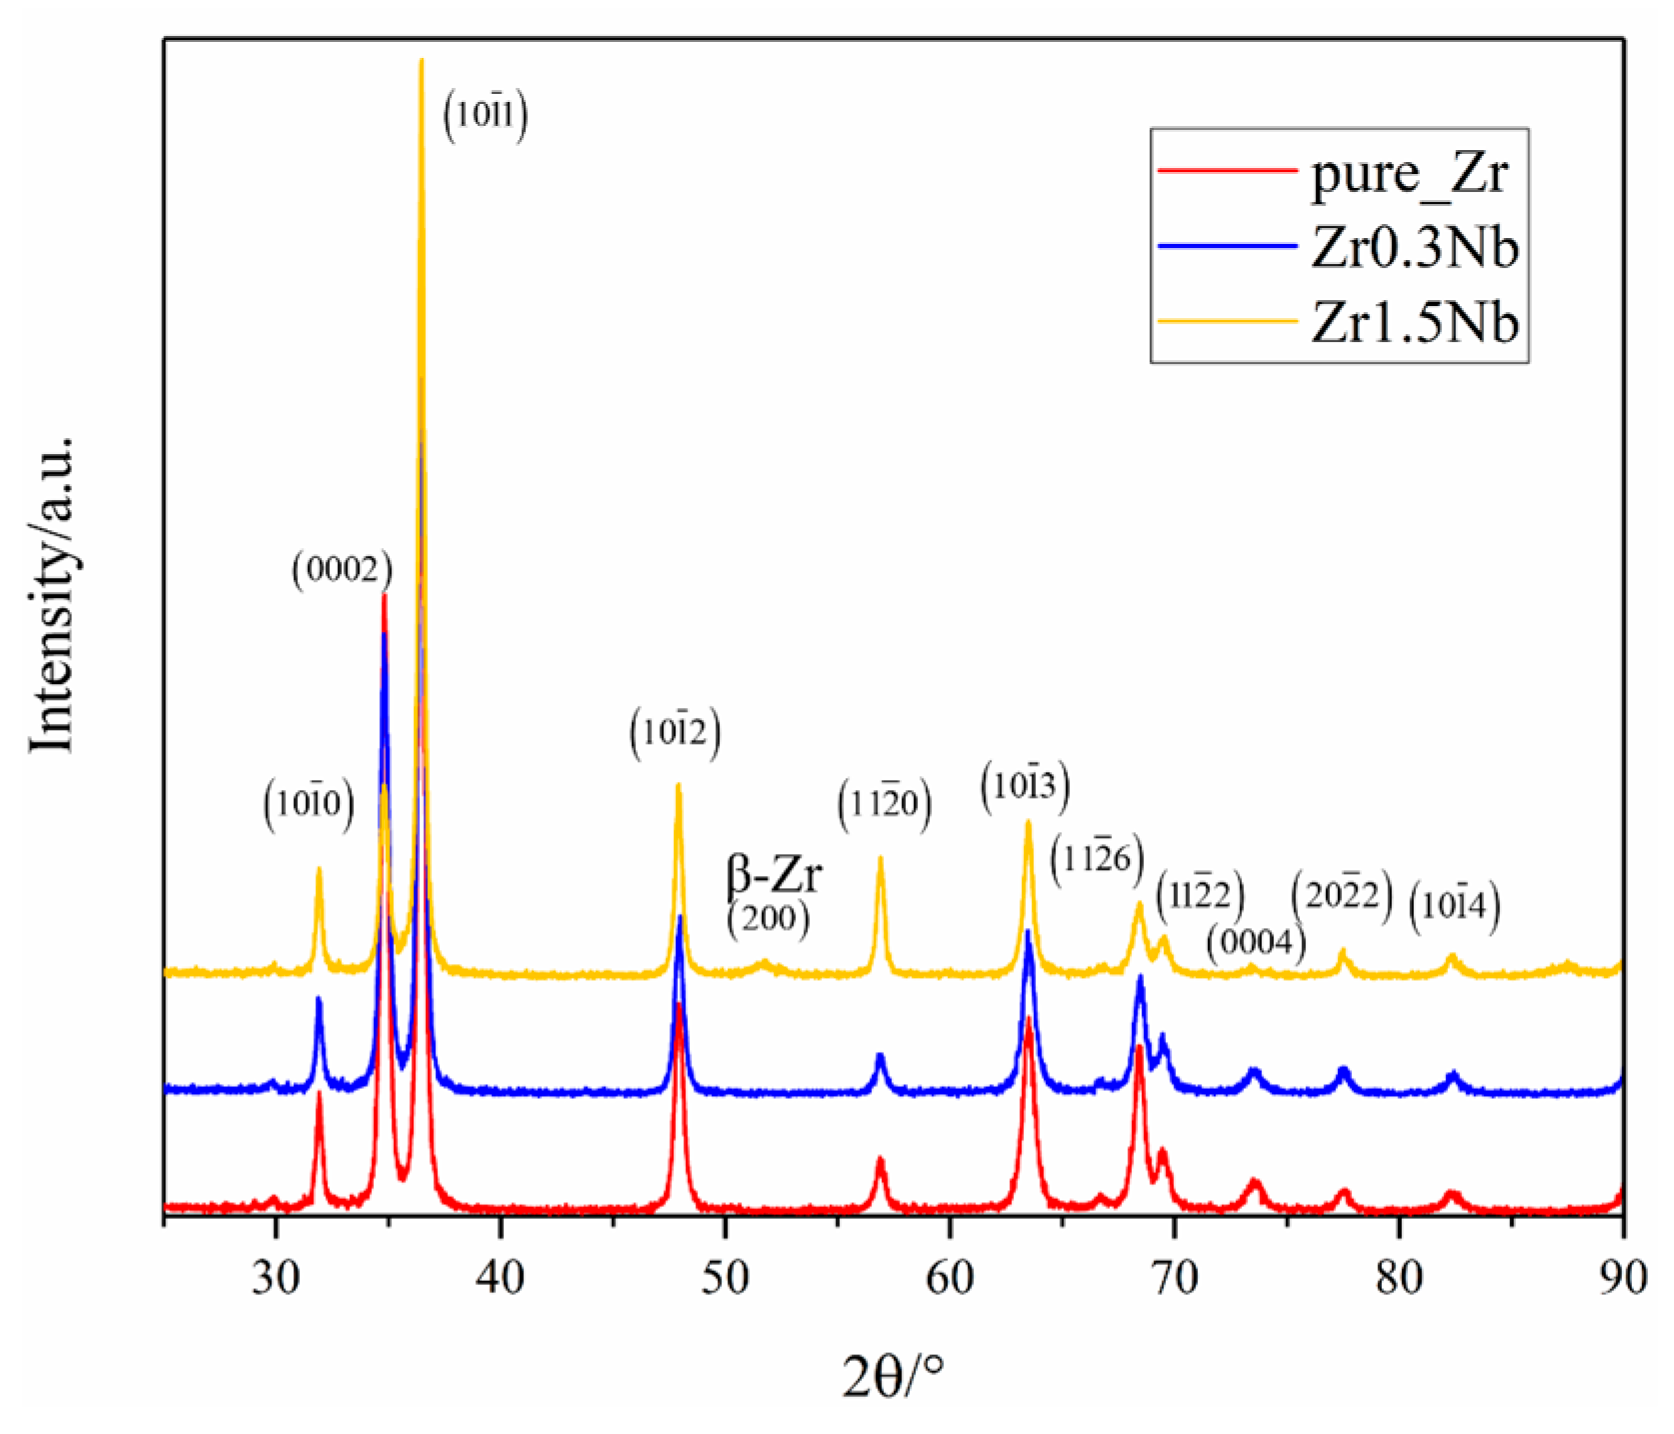
As the most basic structural properties of pure Zr and Nb doping alloys, phase structure variations due to Nb doping were first investigated using X-ray Diffraction (XRD); Cu Kα radiation and a step scan of 0.02° were employed and the range of 2θ was from 25° to 90°. Figure 2 shows the typical XRD profiles of pure Zr as a red solid line exhibiting no additional peaks. All the samples were identified through comparison with the standard pattern (P63/mmc) (PDF#:05-0665) and Im3m (229) (PDF#:34-0657). A similar observation can be found in the work of M. Sivabharathy et al. on the Zircaloy-2 alloy [23]. Comparing the profiles of pure and Zr0.3Nb, the effect of 0.3 wt% concentration Nb on the XRD profiles can be negligible. However, when the concentration of Nb increases to 1.5 wt%, a peak at 2θ, equal to 51°, appears, which can be assigned to bcc β-Zr (200). X.K. Xin et al. investigated the point defect in hcp and bcc Zr with trace solute Nb using the ab initio calculations method, and they found that Nb atoms are more likely to agglomerate in the β-Zr. The formation energy of the substitutional Nb atom in the β-Zr is only 0.07 eV [43]. Combining the experimental results with theoretical calculations, the conclusion might be drawn that the addition of Nb into the Zr matrix promoted the occurrence of a phase transition. Another obvious change is that the intensity of (0002) decreases with the increase in the concentration of Nb while the intensity of (101) increases with the increase in the concentration of Nb, which reflects changes in grain size.
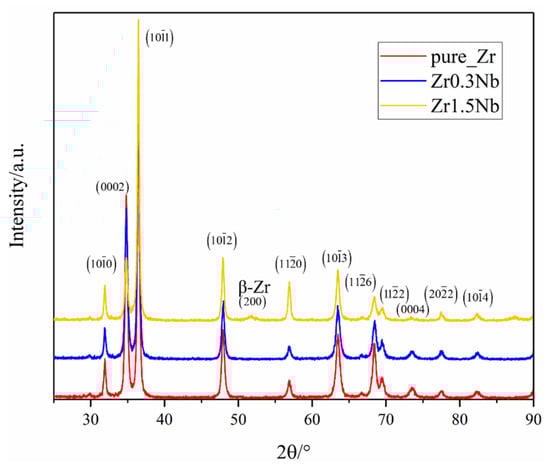
Figure 2.
XRD pattern of three samples with different Nb contents.
3.2. Electron Backscatter Diffraction (EBSD) Characterization
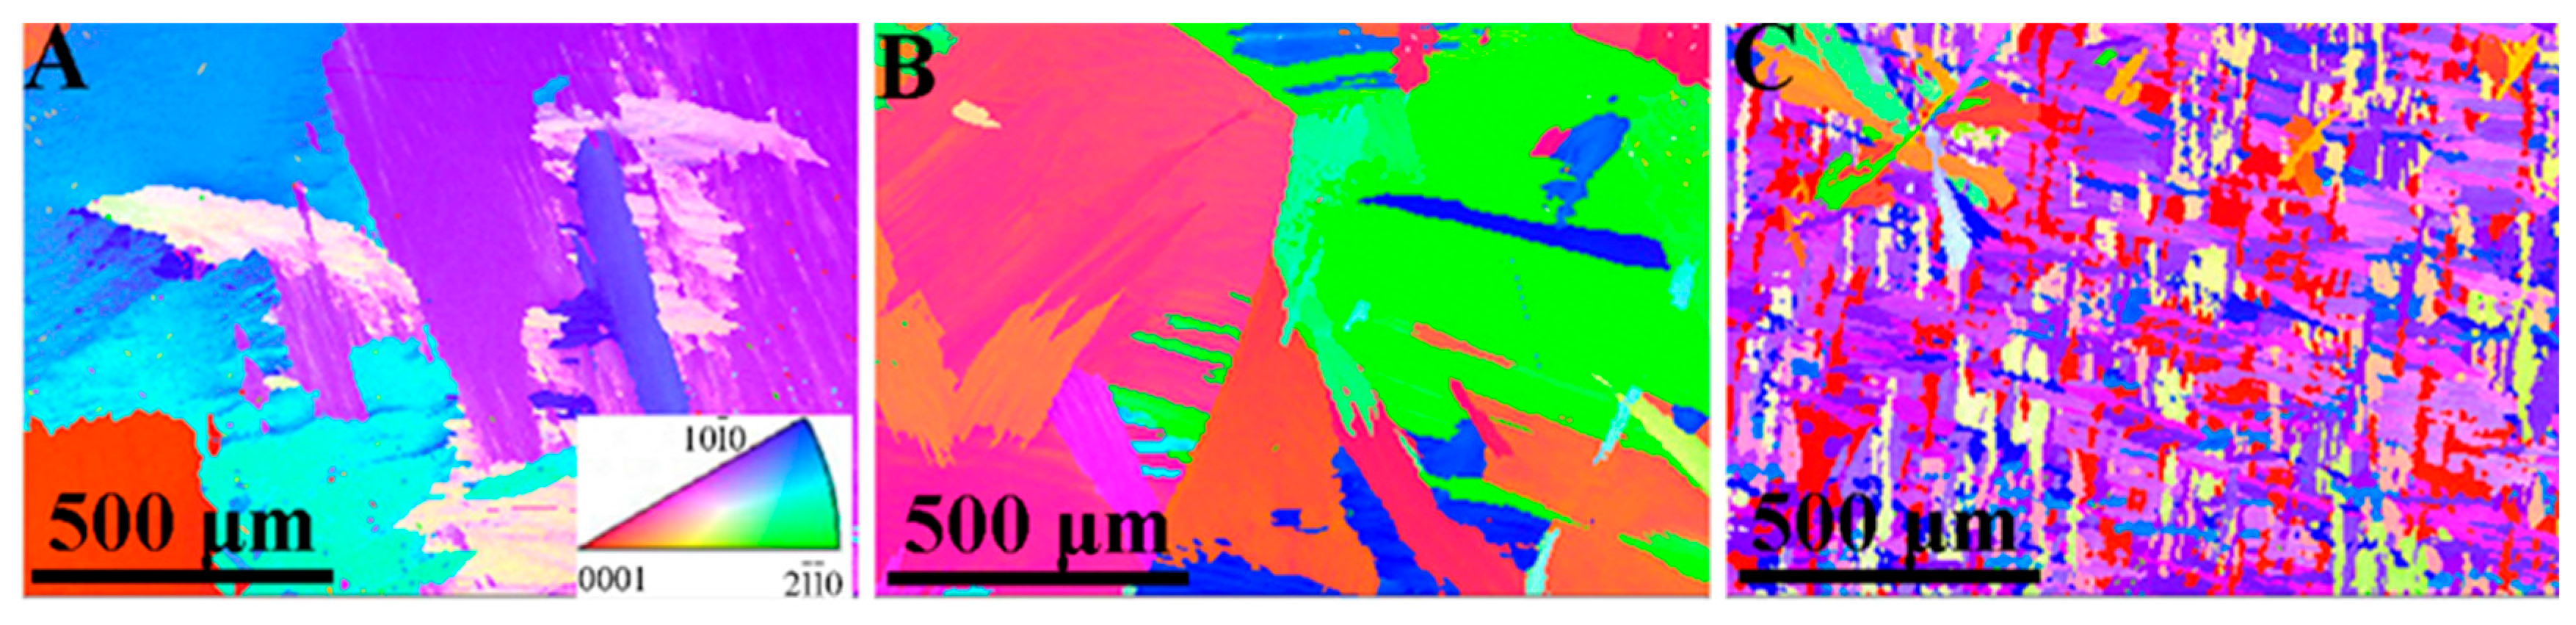
In order to investigate the effect of Nb doping on grain size and shape, an EBSD analysis was employed, and the measurement results are presented in Figure 3. It can be seen that the addition of Nb leads to a decrease in grain size for the Zr-Nb alloy. Sample Zr1.5Nb exhibits a significant reduction in grain size, which aligns with findings reported by H.L. Yang et al. [32]. In our work, not all the samples experienced the cold working, and the grain dimensions reached the millimeter level, which more effectively demonstrates the grain refinement of Nb doping, excluding interference from cold working.

Figure 3.
EBSD inverse pole figure maps of three samples with different Nb contents: (A) pure Zr, (B) Zr0.3Nb, and (C) Zr1.5Nb.
3.3. The Mechanical Properties
The mechanical properties of zirconium alloys, particularly their hardness and elastic modulus, make them of great importance as structural materials. In this work, the hardness and elastic modulus received special attention. As shown in Figure 4A, the hardness of pure Zr increased from 2.67 GPa to 2.82 GPa after Nb doping at a concentration of 0.3 wt%, and it further reaches 2.99 GPa when the Nb concentration increases to 1.5 wt%. The variation trend is consistent with the results of H.L. Yang [32], but the values are greater than their results. This may be due to the different processing process used for the samples or the different measurement methodologies. Regarding the elastic modulus, the nanoindentation instrument led to different changing trends from the hardness with the variation in Nb concentration. The elastic modulus of the doping system is larger than the pure Zr system, which reflects the hardening mechanism of the Nb element. As the Nb concentration increased from 0.3 wt% to 1.50 wt%, the excess substitutional atoms led to significant lattice distortion, which increases the stability of the crystal structure and reduces the elastic modulus. Therefore, a smaller elastic modulus of Zr1.5Nb was obtained compared to Zr0.3Nb.
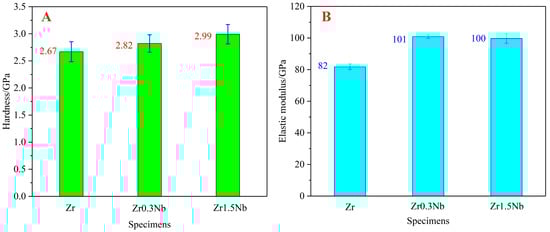
Figure 4.
Hardness (A) and elastic modulus (B) of pure Zr, Zr0.3Nb, and Zr1.5Nb. Error bars show standard deviations.
As interpreted in the work of H.L. Yang [32], the hardening contributions from solute Nb were divided into three sources: solid solution hardening, grain boundary hardening, and precipitation hardening. Due to the complexity of the grain boundary hardening and precipitation hardening, only the research about solid solution hardening was carried out using the first principles method in this work.
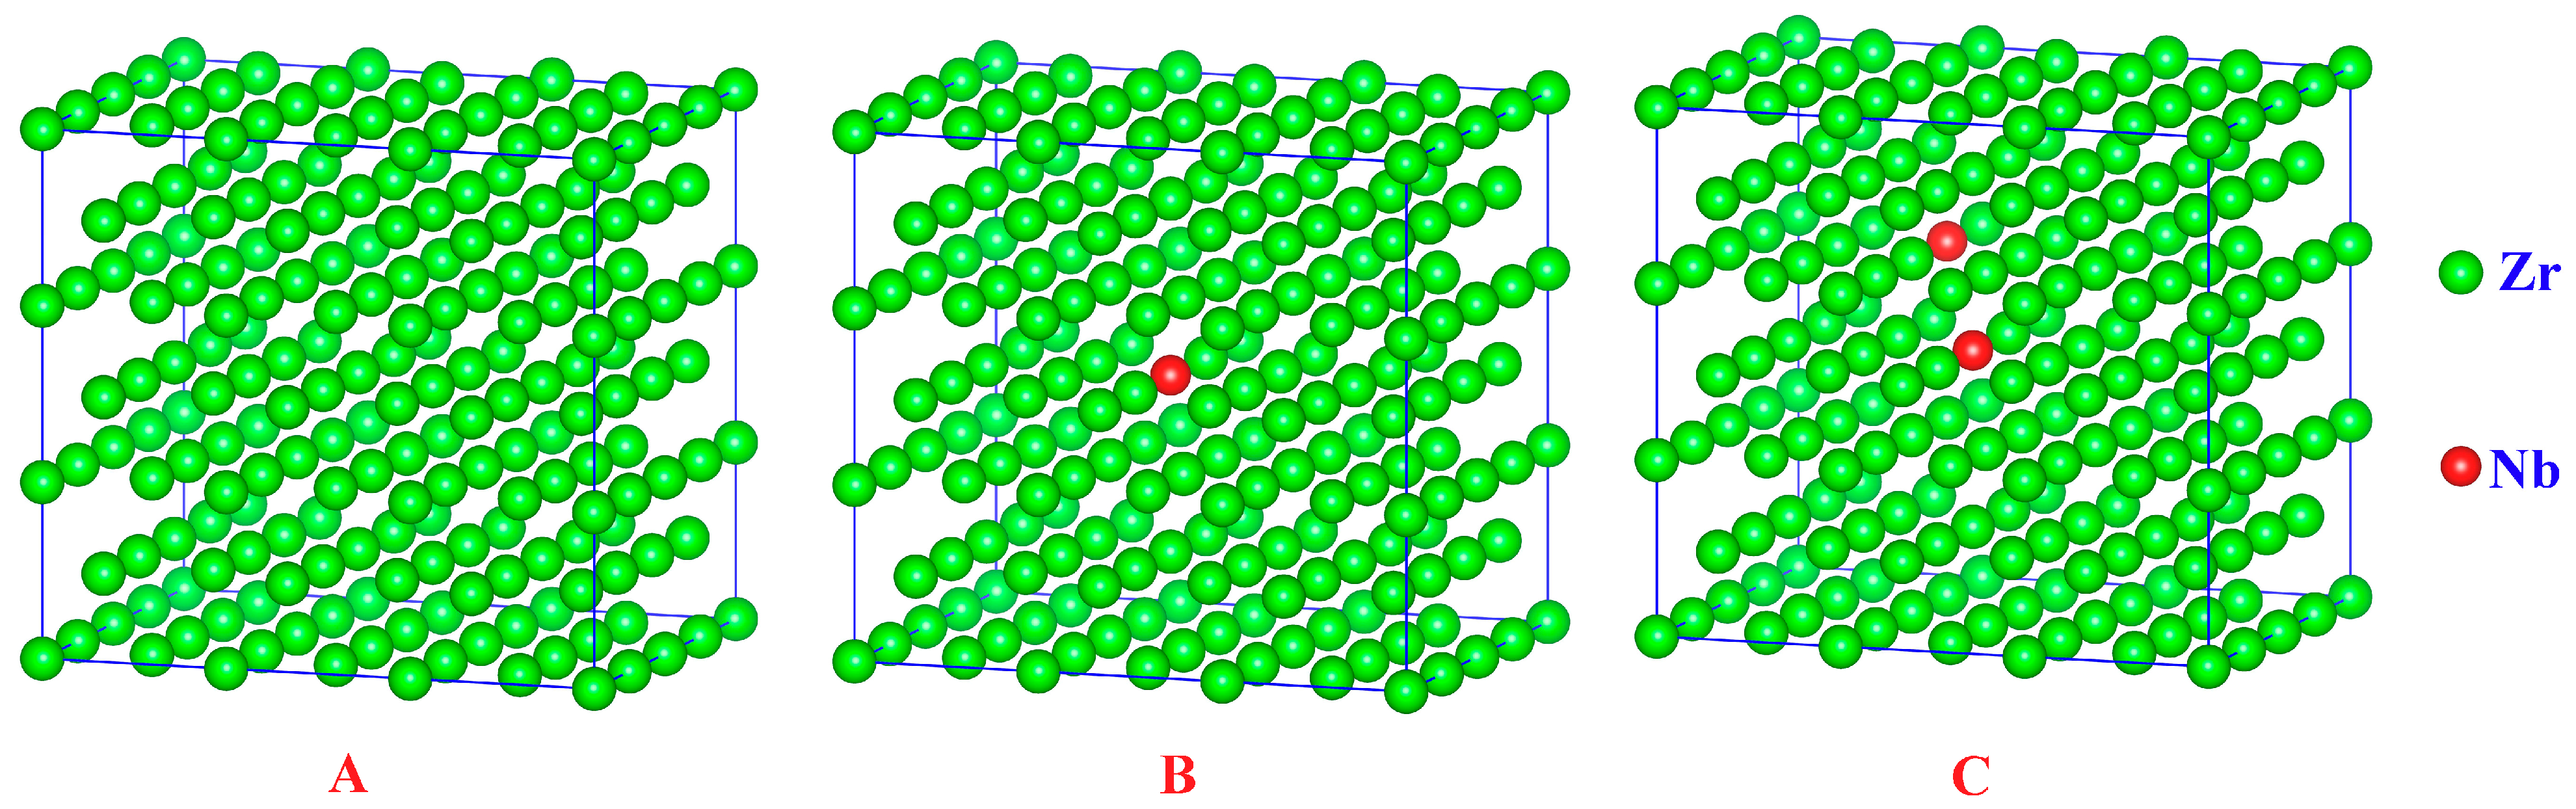
In the work of X.Y. Chen et al., the substitutional doping was reported to be the most stable configuration based on the formation energy calculations [44]. For the purpose of mimicking the doping system, one or two Zr atoms were substituted with Nb atoms in a supercell containing 144 Zr atoms to represent the Zr0.3Nb and Zr1.5Nb, as shown in Figure 5. After constructing the supercells for subsequent calculations, the energy minimization was performed first.
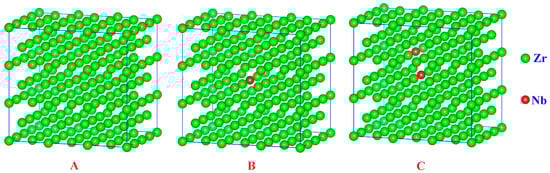
Figure 5.
The crystal lattice of pure Zr (A); one Nb atom substitution doping (B); two Nb atoms’ substitution doping (C). The green balls are Zr atoms and the red balls are Nb atoms.
The elastic constants, bulk modulus B, shear modulus G, Young’s modulus Y, and Poisson’s ratio σ of pure Zr- and Nb-doping Zr alloys were calculated using Equations (2)–(6). The calculation results are listed in Table 3 and compared with the previously calculated results and experimental data. Regarding the pure Zr system, it can be seen that the calculated values of elastic constants and hardness agree well with the experimental values, except C44, as was found in other first principle works [44]. In contrast to the works of Chen et al. [44], the larger supercells were used in our calculations. The nice consistency with previous works demonstrates the reliability of our results. After doping the Nb atom, the Young’s modulus and hardness begin to decrease and become inversely proportional to the concentration of Nb, where the hardness decreases from 2.45 GPa of pure Zr to 1.78 GPa of Zr142Nb2. However, the experimental results show that the hardness values increase from 2.67 GPa of pure Zr to 2.99 GPa of Zr1.5Nb. The different changing trends maybe suggest that the increase in hardness mainly comes from the grain refinement, not the solid solution. The influence of grain refinement on the increase in hardness will be investigated in our future studies.
Table 3.
Experimental and theoretical elastic constants, bulk modulus B, shear modulus G, Young’s modulus Y, and Poisson’s ratio σ of pure Zr- and Nb-doping Zr alloy (in GPa).
3.4. Thermal Expansion Coefficients
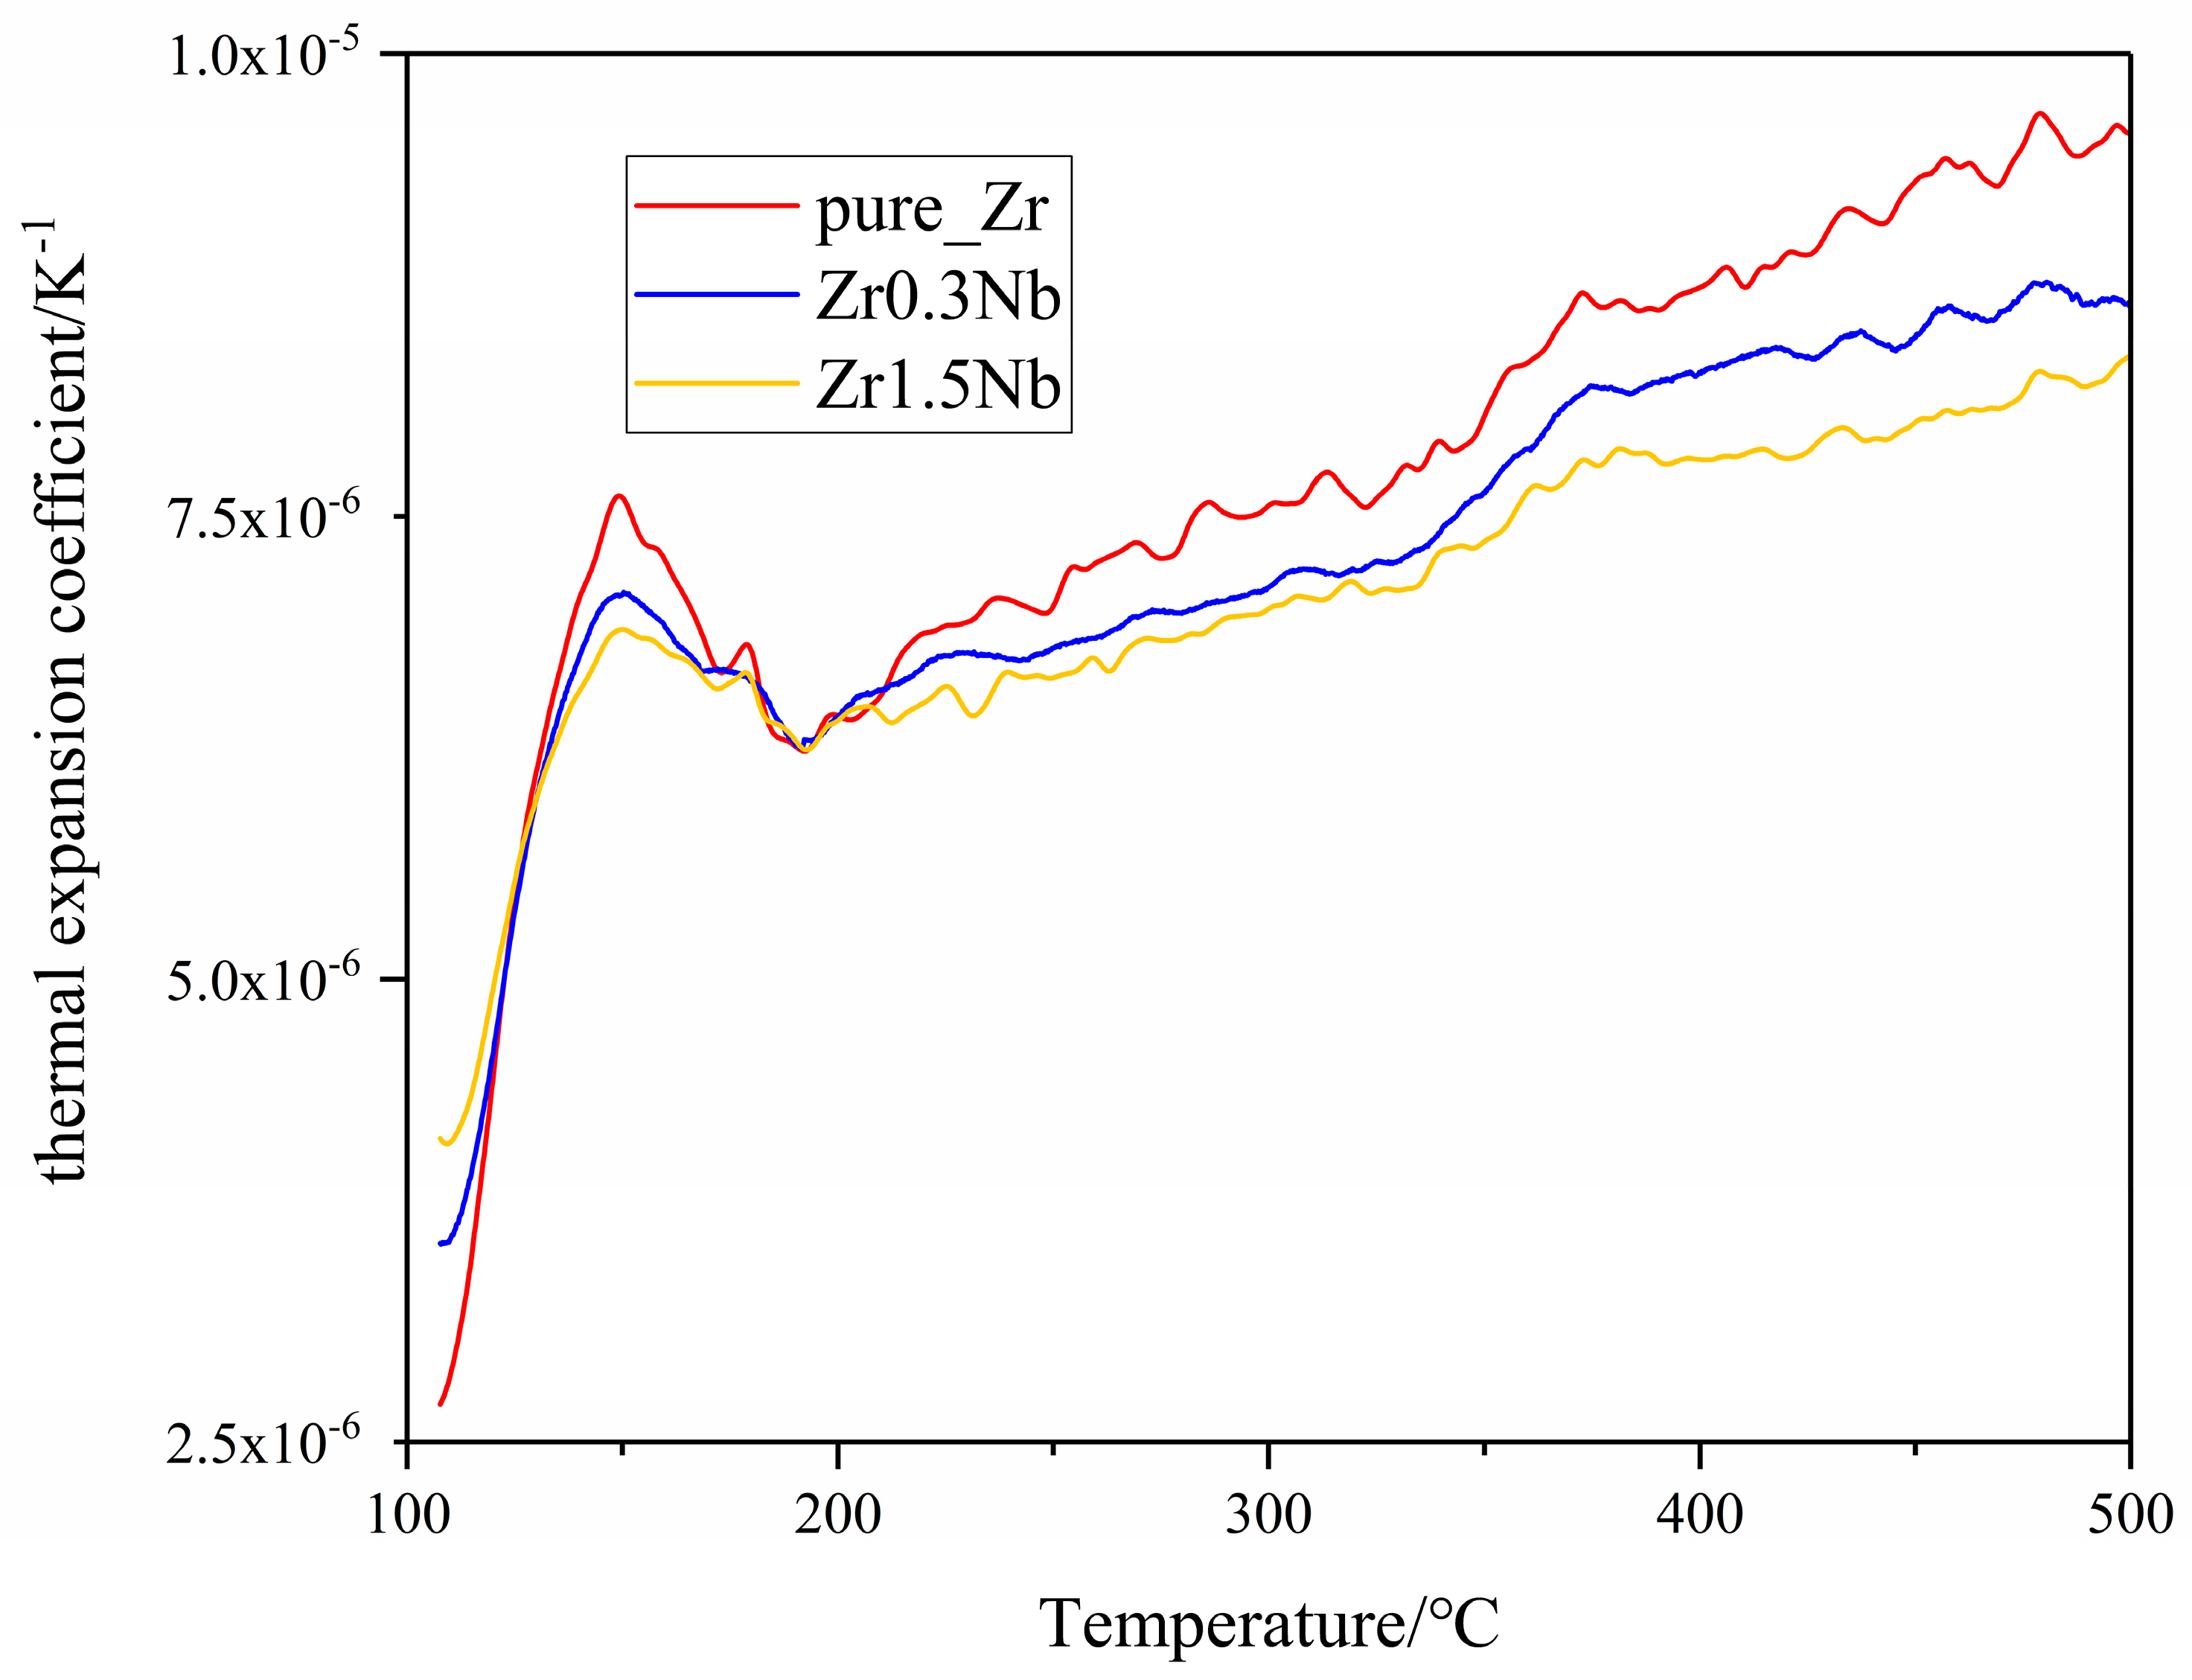
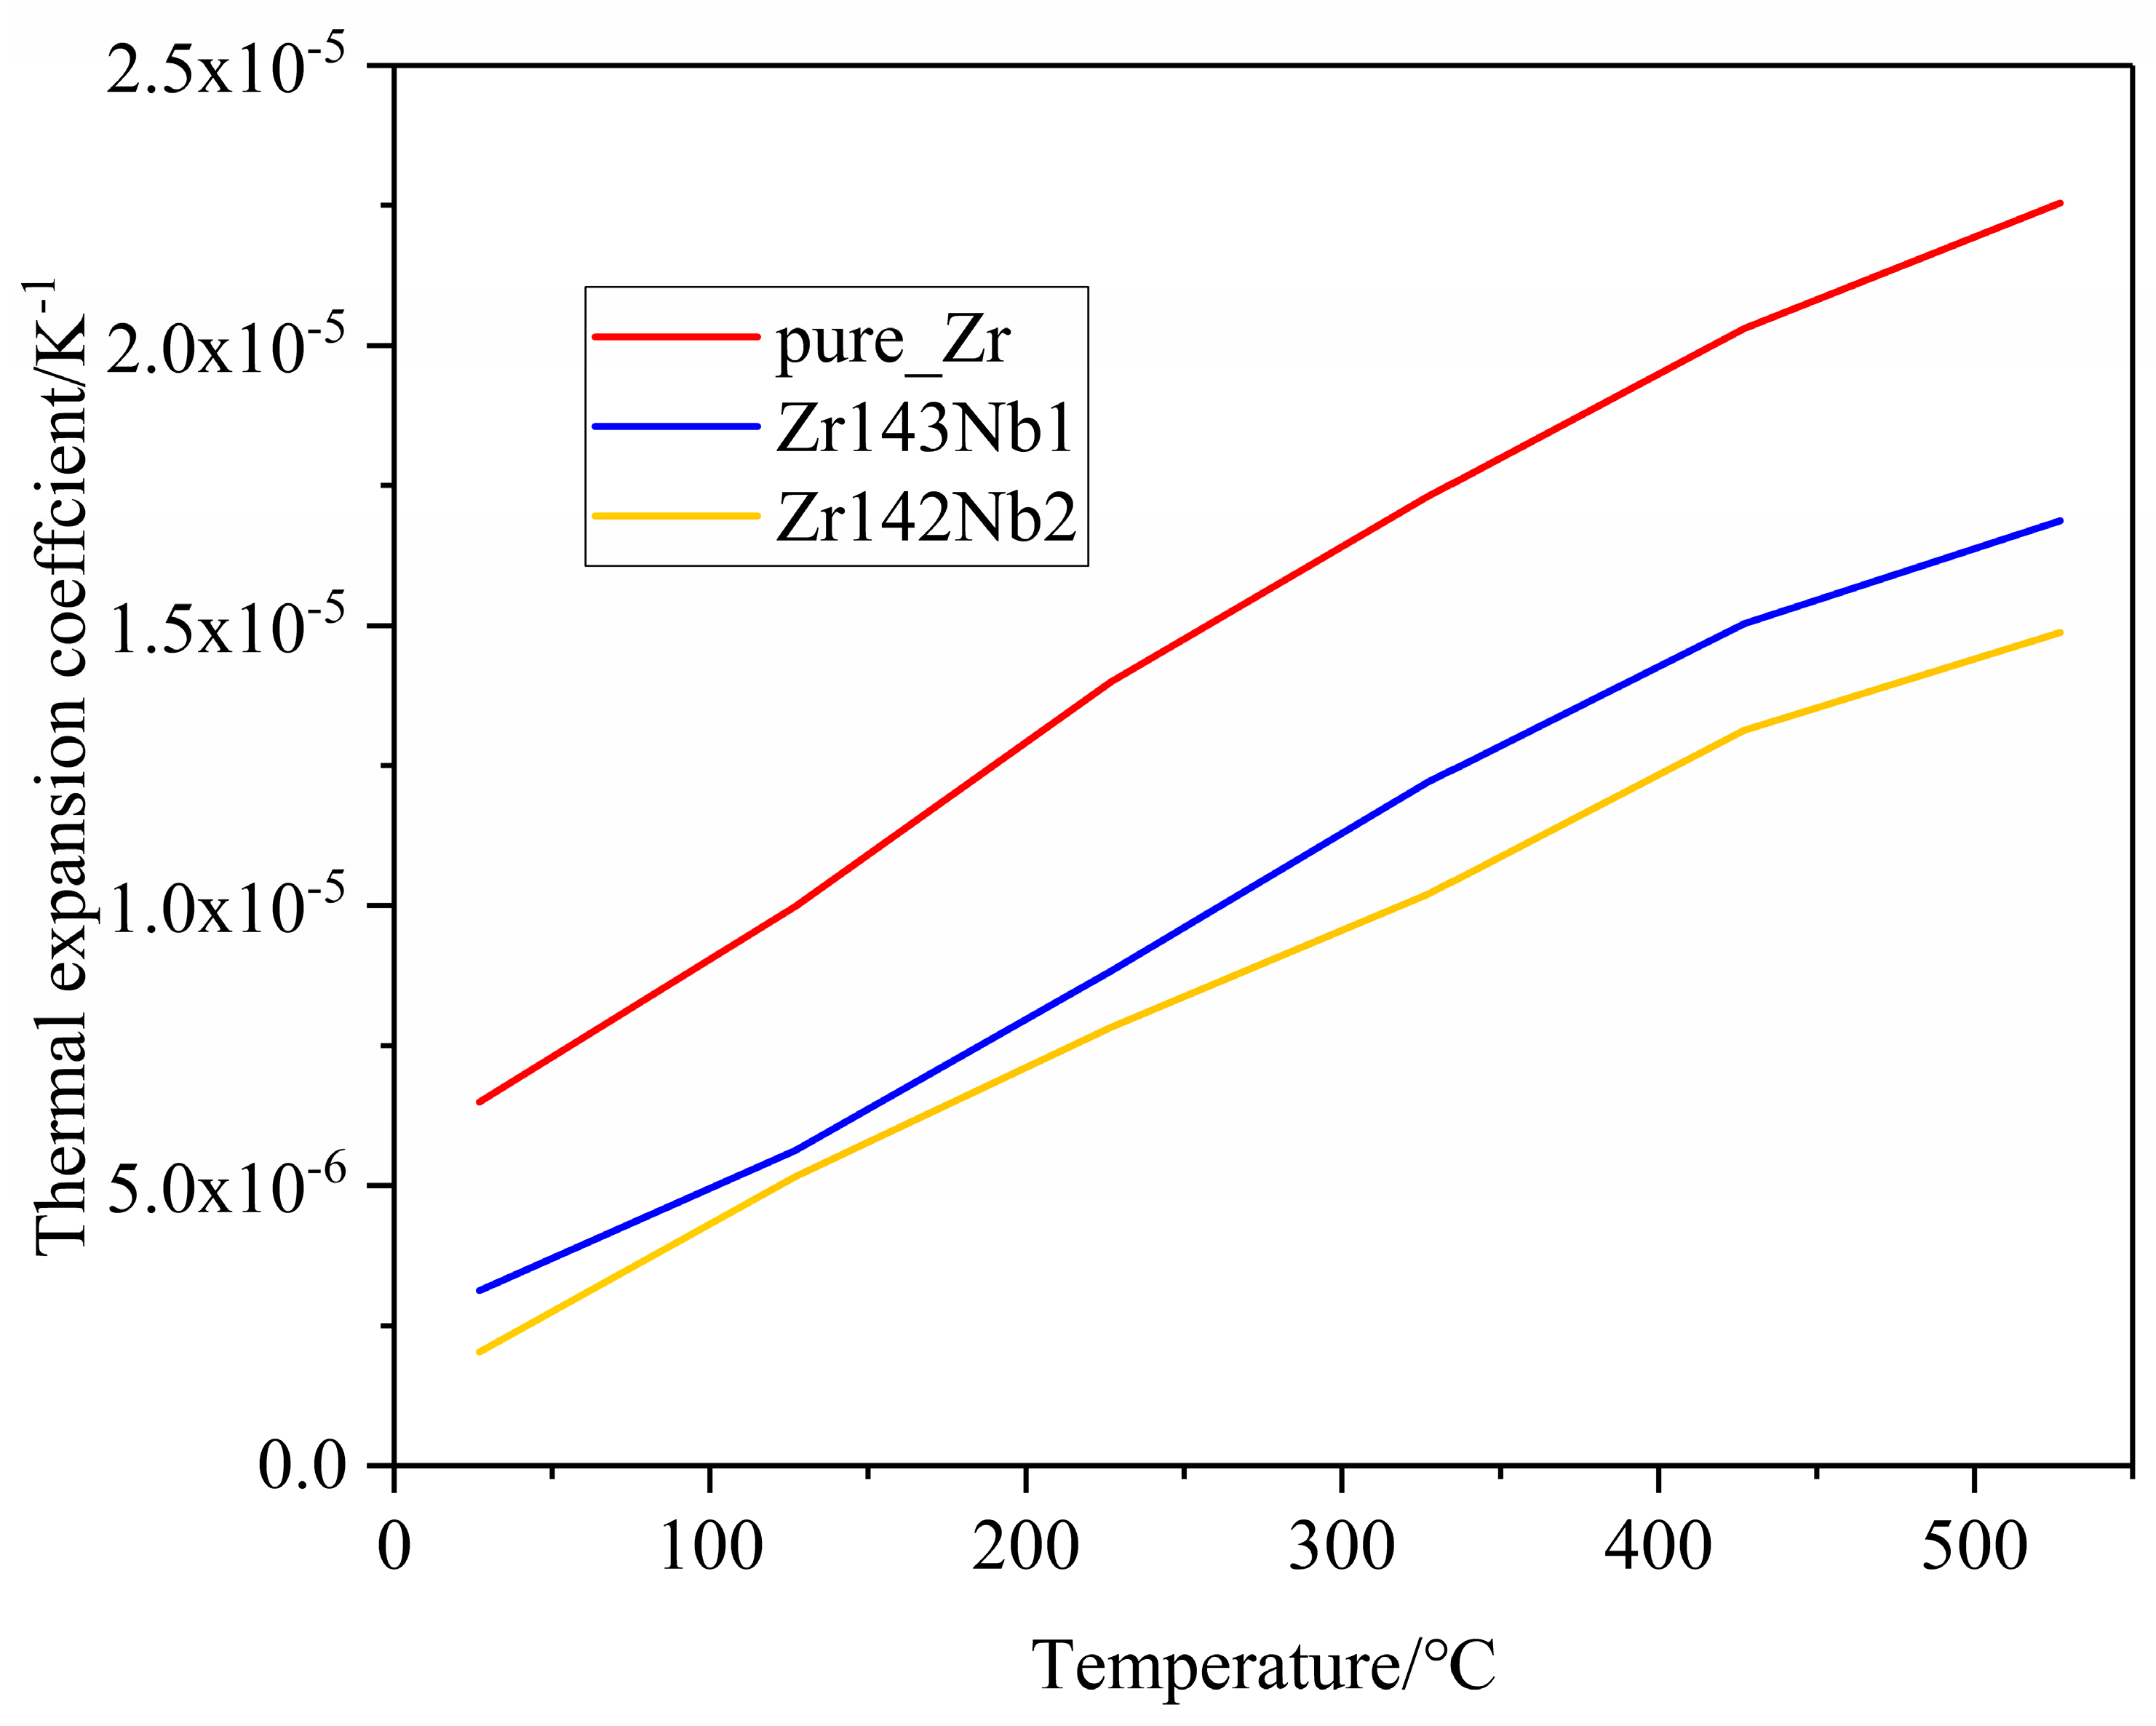
Due to the high temperatures in the nuclear material service environment, thermal expansion becomes an important property for the zirconium alloys when it functions as a cladding tube because of the existence of irradiation growth at high irradiation doses. Generally, thermal expansion is classified as a linear expansion coefficient α, area expansion coefficient β, and volume expansion coefficient γ [23]. Here, the linear expansion attracted our attention. Only data collected after the dilatometer reached a stable state, at temperatures higher than 200 °C, were discussed. Throughout the entire measurement temperature range, the thermal expansion coefficient of all three samples was less than 1.0 × 10⁻⁵ K−1, and the thermal expansion coefficients increased with the temperature. Similar results for Zircaloy-2 and E110opt alloys were obtained previously [23,30]. Regarding the effect of Nb doping on thermal expansion coefficients, Figure 6 shows us that the increase in Nb content causes the thermal expansion coefficients to decrease, which may stem from the strong binding energy between Nb and Zr atoms [46,47]. For the convenience of comparison with the experimental results of polycrystal alloys, the thermal expansion coefficients of simulation calculations are the mean values of the a and c crystal orientations in Figure 7. In the simulations, combining the equilibrium molecular dynamics and Green–Kubo method, we can obtain a similar law of change with the Nb concentration, as shown in Figure 7. It can be seen that the Nb solid solution in the Zr matrix makes a difference. However, the role of grain refinement in the thermal expansion coefficient is unclear and is an interesting topic, which will be investigated in our future work.
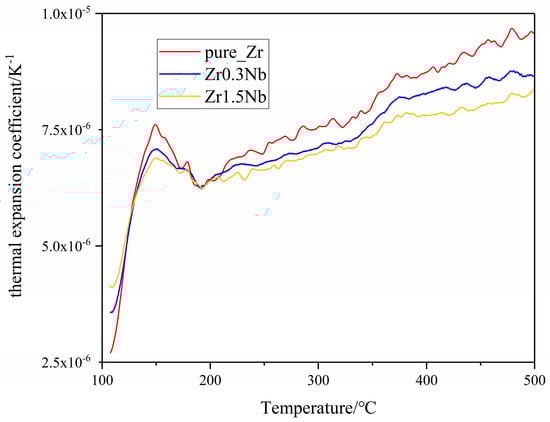
Figure 6.
Variation in the thermal expansion coefficient of zirconium alloys with temperature.
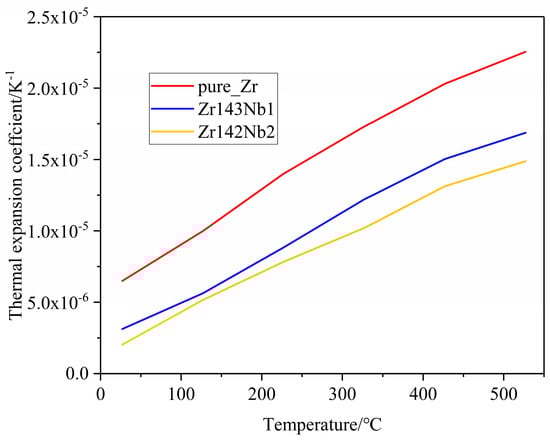
Figure 7.
Lattice thermal expansion coefficients of the pure Zr, Zr143 Nb1, and Zr142 Nb2 systems versus temperature from simulation calculations.
3.5. Thermal Conductivity of Pure Zirconium and Zirconium Alloy
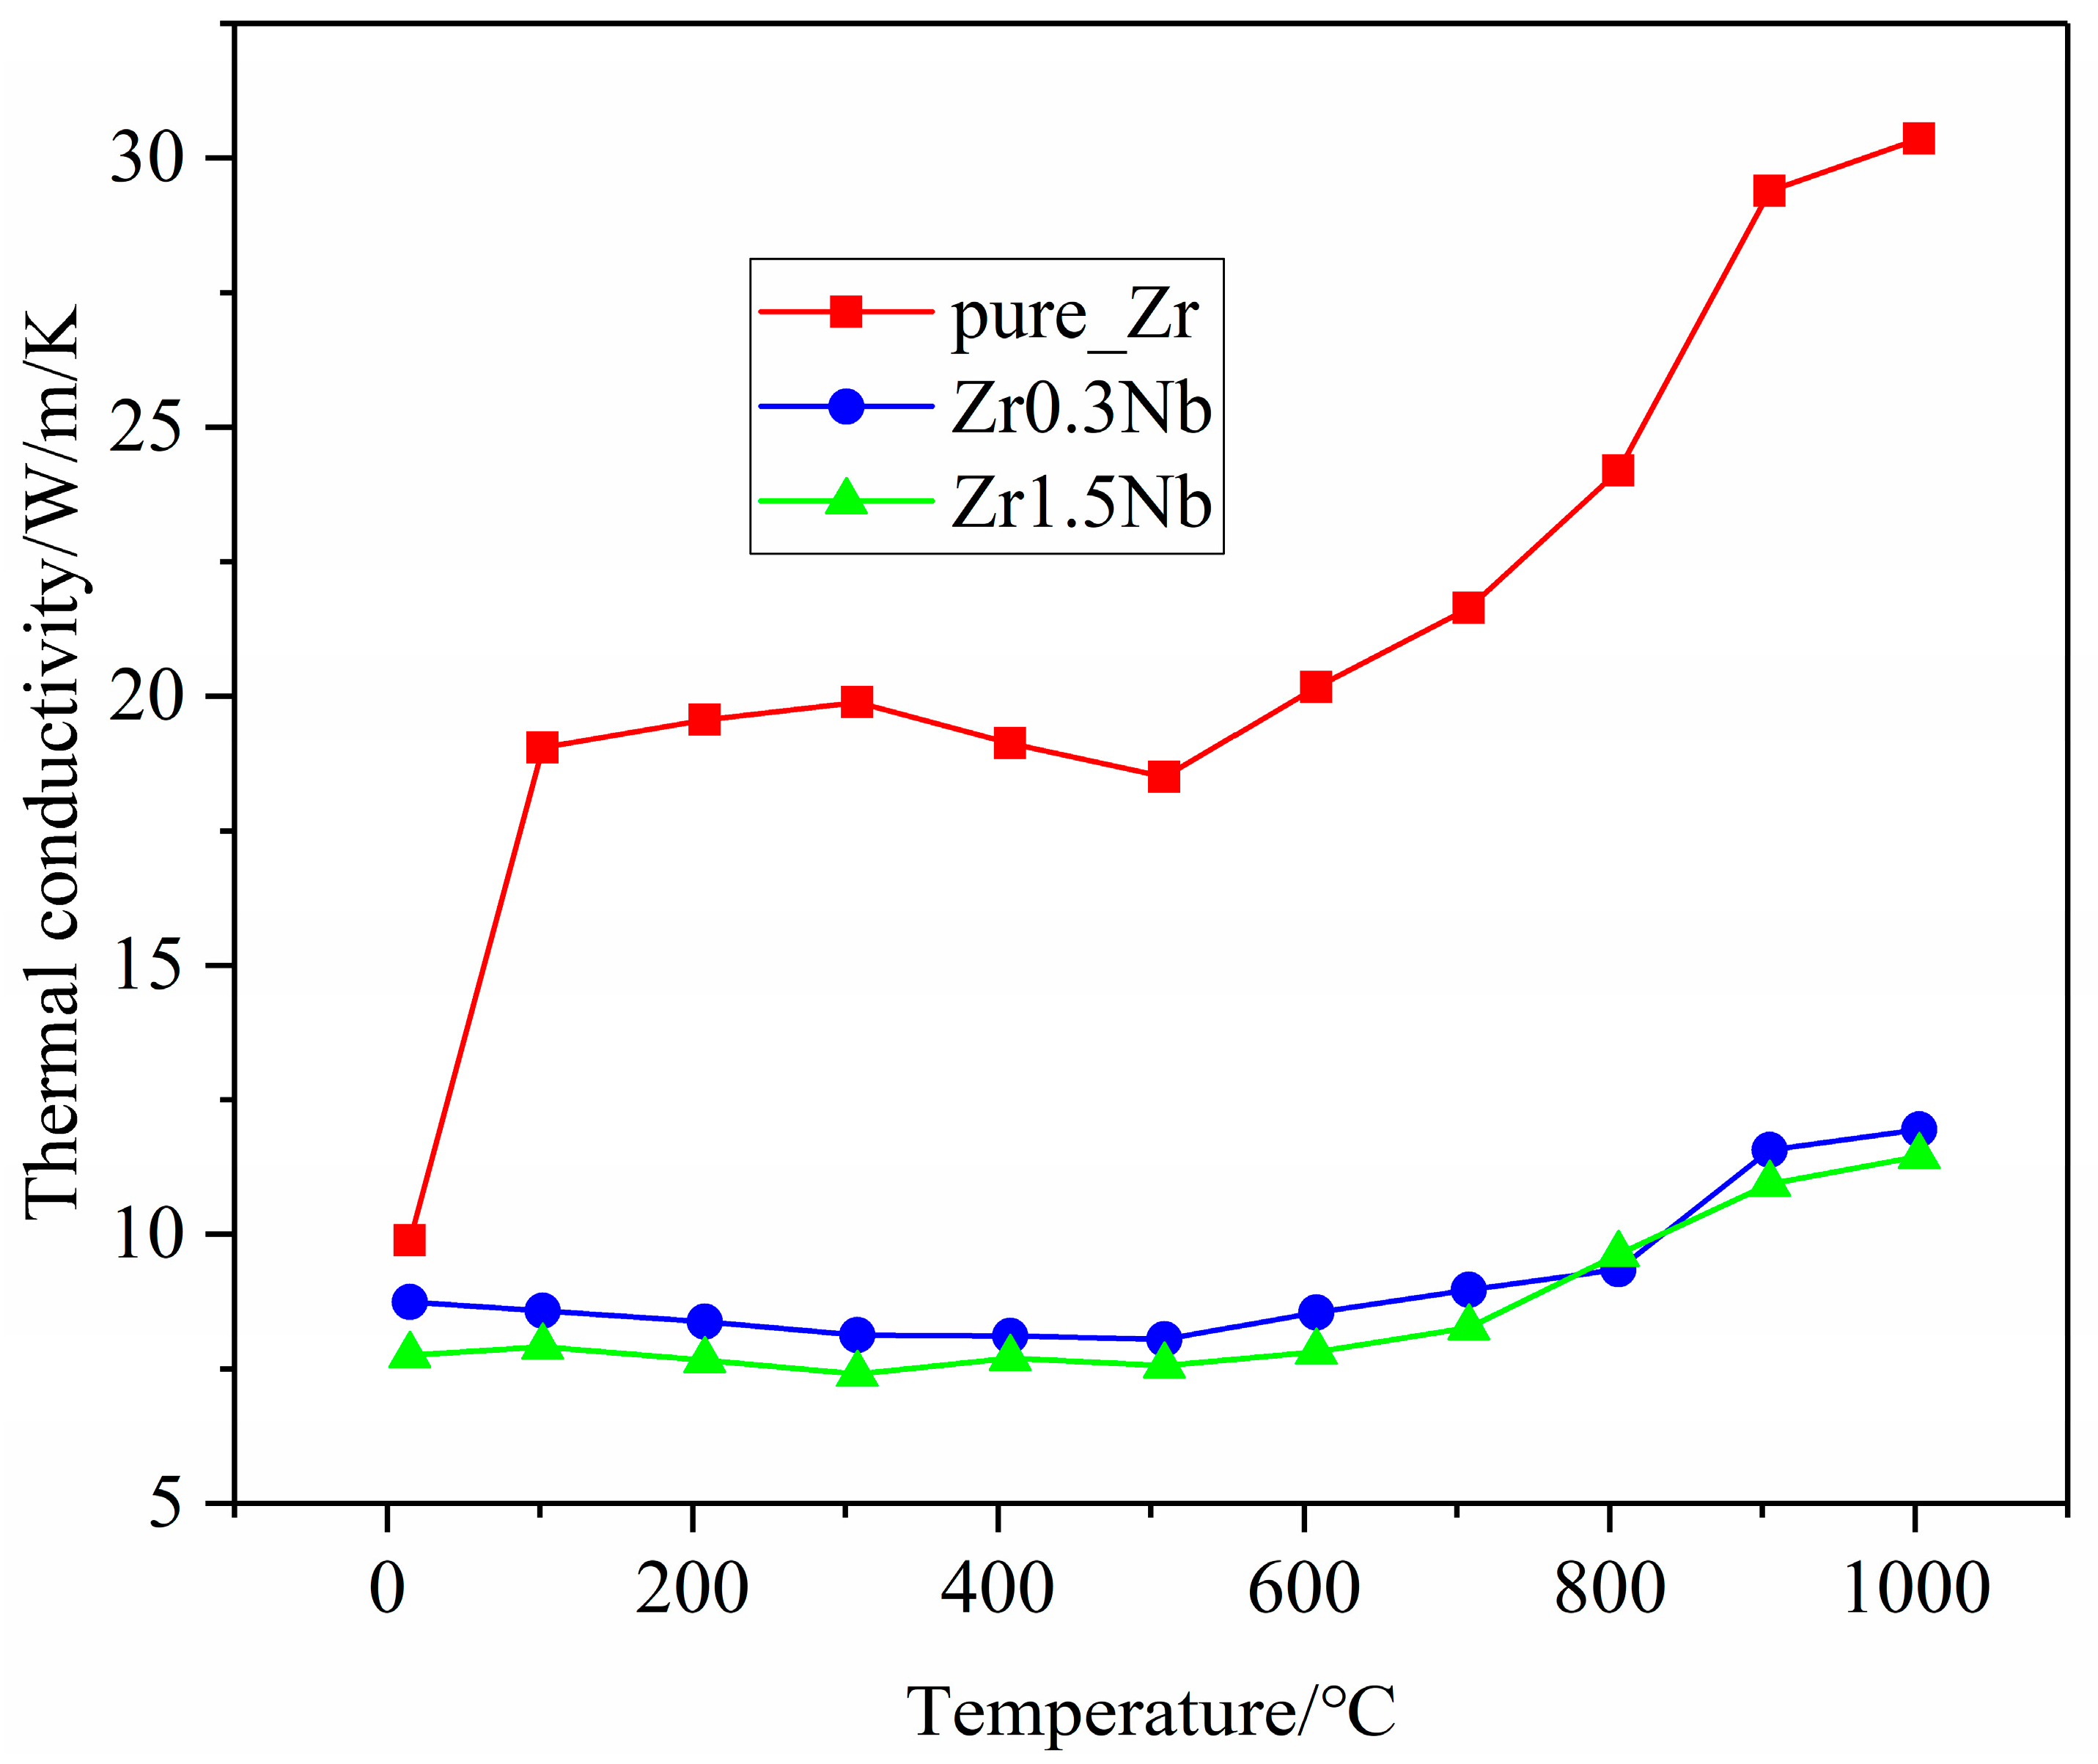
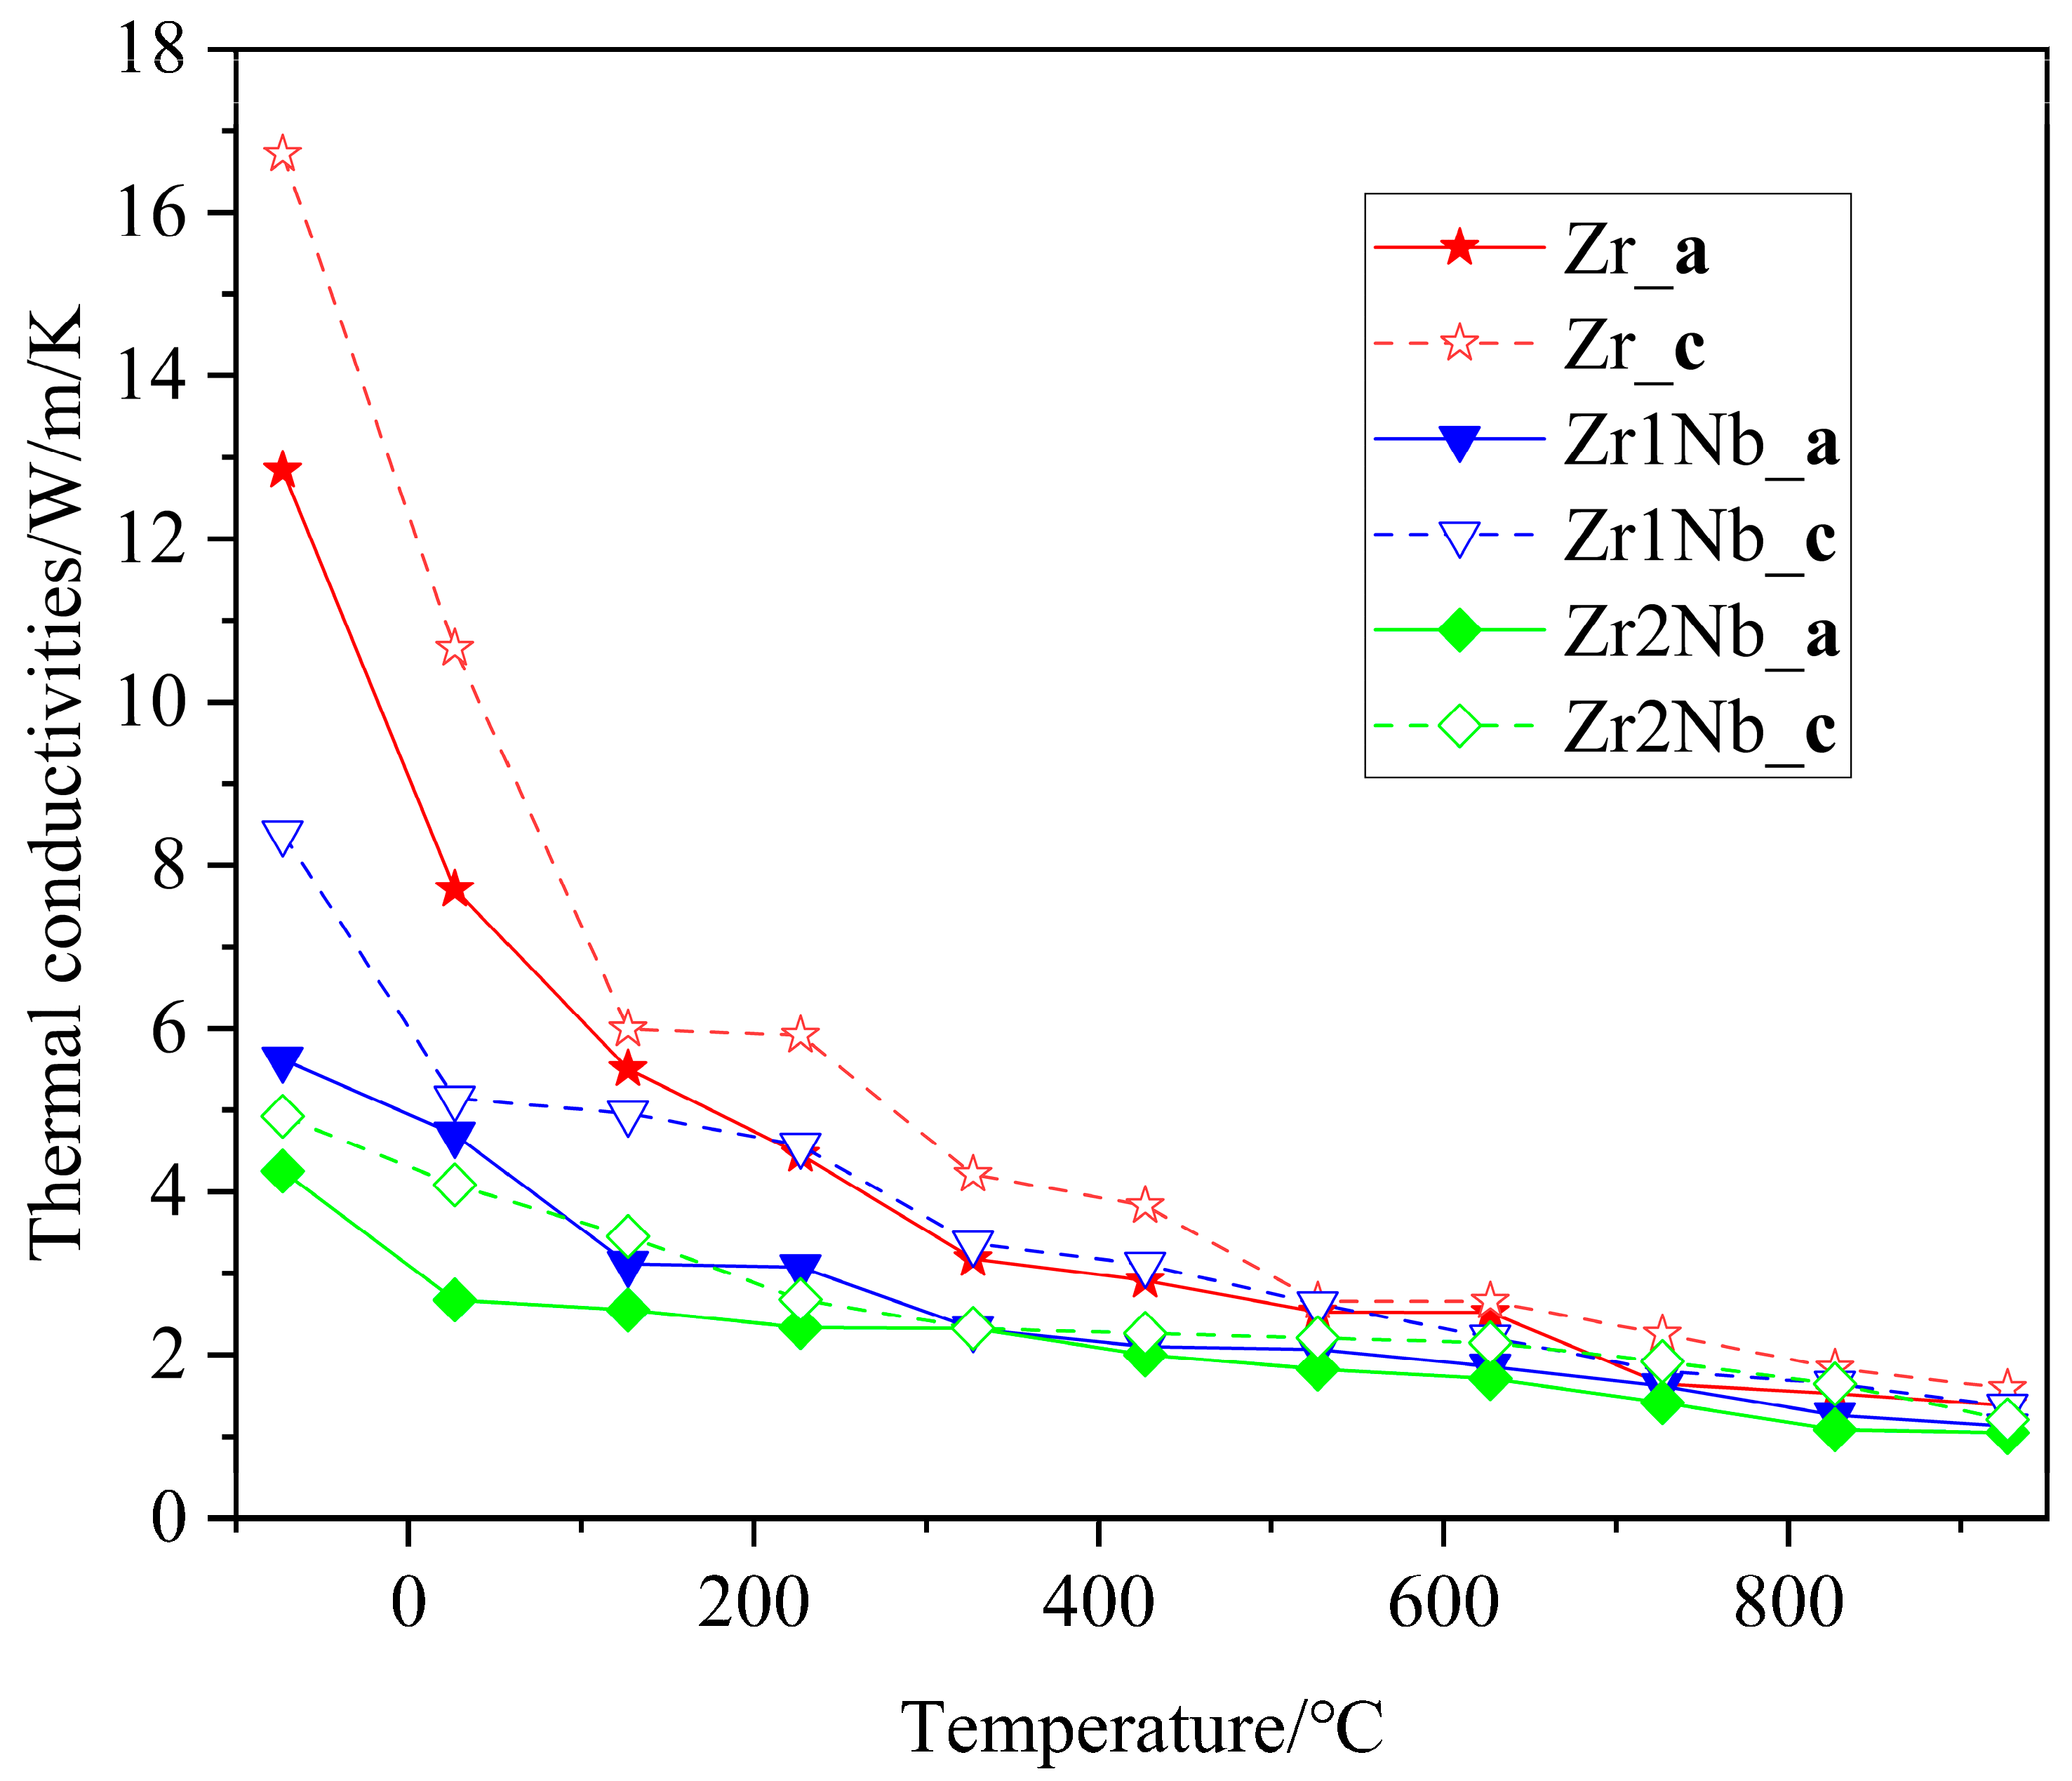
Thermal conductivity is an important thermophysical parameter for characterizing the thermal conductivity of a substance. When zirconium alloys are used as clad tubes, it is essential to have good thermal conductivity. Therefore, it is necessary to explore the impact of Nb doping on the thermal conductivity. The thermal conductivity of three samples with different Nb contents was measured on the NETZSCH LFA 100 laser flash apparatus; the measurement results are presented in Figure 8. It can be seen that the thermal conductivities of all three samples exhibited similar changing trends. The thermal conductivity begins to decrease at room temperature, reaches its minimum value around 400 °C, and then begins to increase with increasing measurement temperatures. This finding is consistent with previously reported results [25,26]. The thermal conductivity of pure zirconium samples is consistently higher than that of Nb-doped samples in the test range and decreases with increasing doping concentration. One possible reason for this discrepancy could be attributed to distortions in the Zr matrix caused by Nb substitution doping, and another reason for the drop in thermal conductivity is the grain refinement, as shown in Figure 3. Due to computational limitations, only the first reason was further investigated, using molecular dynamics simulation, from a theoretical perspective. The calculation results regarding the variation in the lattice thermal conductivity of the pure Zr, Zr143Nb1, and Zr142Nb2 with temperature using the EMD method are illustrated in Figure 9. Three simulation systems show us similar changing trends, with the experimental results showing that the thermal conductivity decreases with the Nb concentration. Perhaps the distortion induced by Nb doping causes phonon propagation scattering, and thus hinders the propagation of phonons. Molecular dynamics simulations show that the thermal conductivity of zirconium alloys decreases monotonically in the a and c crystal orientations, indicating that the large increase in the thermal conductivity of pure zirconium is mainly due to the contribution of free electrons. For the three samples, simulation results show us that thermal conductivity in the c crystal orientation is larger than that in the a crystal orientation, perhaps due to the larger disorder in the basal plane. The magnitudes of the theoretical results are smaller than the measured experimental data, which may be due to the accuracy of the potential file and the shortage of theoretical principles itself, which caused the electron–phonon interaction to be ignored.
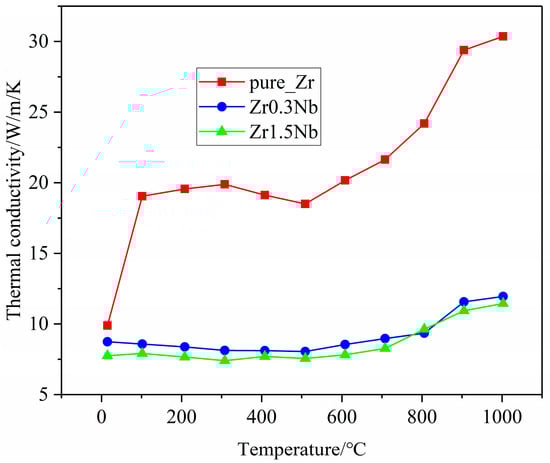
Figure 8.
Variation in the thermal conductivity of zirconium alloys with temperature in experimental measurements.
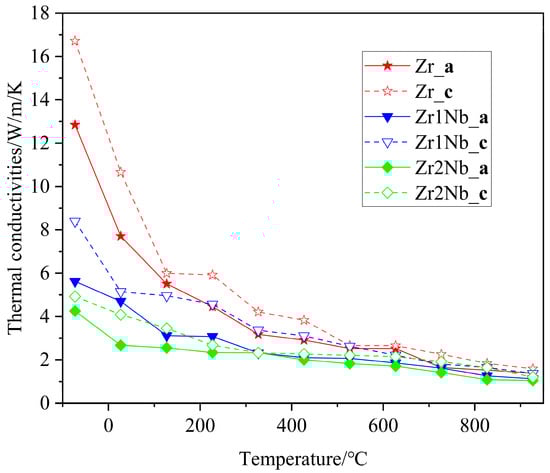
Figure 9.
Lattice thermal conductivity of the pure Zr, Zr143Nb1, and Zr142Nb2 systems in a and c crystal orientations versus temperature in the theoretical simulation.
4. Conclusions
In summary, the effects of Nb doping on the mechanical and thermodynamic properties were investigated. The results of the study show us that Nb doping refines the grains and enhances the hardness. The hardness increases from 2.67 GPa of pure Zr to 2.99 GPa of Zr1.5Nb. Based on first principles calculations, it is suggested that the hardness decreases with the increase in Nb concentration in the Zr matrix; grain refinement or defects may play a major role in this increase in hardness. Furthermore, when studying the effect of Nb doping on the thermal expansion coefficients, the increase in Nb content was shown to make the thermal expansion coefficients decrease, which may stem from the strong binding energy between Nb and Zr atoms. The thermal conductivity of the three samples manifested similar changing trends where thermal conductivity begins to decrease at room temperature and reaches a minimum value around 400 °C. The thermal conductivity of pure zirconium samples is consistently more obvious than that of Nb-doped samples in the test range and decreases with increasing doping concentration. The distortion induced by Nb doping may cause phonon propagation scattering, and thus hinder the propagation of phonons. While theoretical simulations primarily focus on the Zr matrix, the role of grain refinement remains unclear but presents an interesting topic for future research endeavors. Overall, these findings provide insights into determining optimal Nb concentrations and improving the performance characteristics of next-generation zir-conium alloys with exceptional thermodynamic and anti-irradiation properties.
Author Contributions
Methodology, X.K. and H.K.; validation, X.K., Y.Y. and J.M.; investigation, X.K., H.K., D.O.K. and L.W.; data curation, H.K., A.L., Y.Y. and J.M.; writing—original draft, X.K.; writing—review an editing, X.K., H.K., A.L., Y.Y., D.O.K., J.M. and L.W.; visualization, A.L.; supervision, D.O.K.; funding acquisition, L.W. All authors have read and agreed to the published version of the manuscript.
Funding
The present work is funded by National Key Research and Development Program of China (No. 2022YFB190122), China Postdoctoral Science Foundation Program (Grant No. 2021M693034), National Natural Science Foundation of China (No. 12004055), Natural Science Foundation of Sichuan Province (2023NSFSC0404).
Data Availability Statement
The original contributions presented in the study are included in the article, further inquiries can be directed to the corresponding author.
Conflicts of Interest
The authors declare no conflicts of interest.
References
- Kautz, E.; Gwalani, B.; Yu, Z.; Varga, T.; Geelhood, K.; Devaraj, A.; Senor, D. Investigating zirconium alloy corrosion with advanced experimental techniques: A review. J. Nucl. Mater. 2023, 585, 154586. [Google Scholar] [CrossRef]
- Adamson, R.B.; Coleman, C.E.; Griffiths, M. Irradiation creep and growth of zirconium alloys: A critical review. J. Nucl. Mater. 2019, 521, 167–244. [Google Scholar] [CrossRef]
- Griffiths, M. Microstructural Effects on Irradiation Creep of Reactor Core Materials. Materials 2023, 16, 2287. [Google Scholar] [CrossRef] [PubMed]
- King, D.J.M.; Knowles, A.J.; Bowden, D.; Wenman, M.R.; Capp, S.; Gorley, M.; Shimwell, J.; Packer, L.; Gilbert, M.R.; Harte, A. High temperature zirconium alloys for fusion energy. J. Nucl. Mater. 2022, 559, 153431. [Google Scholar] [CrossRef]
- Northwood, D.O. The development and applications of zirconium alloys. Mater. Des. 1985, 6, 58–70. [Google Scholar] [CrossRef]
- Francis, E.; Babu, R.P.; Harte, A.; Martin, T.L.; Frankel, P.; Jädernäs, D.; Romero, J.; Hallstadius, L.; Bagot, P.A.J.; Moody, M.P.; et al. Effect of Nb and Fe on damage evolution in a Zr-alloy during proton and neutron irradiation. Acta Mater. 2019, 165, 603–614. [Google Scholar] [CrossRef]
- Devi, A.; Srivastava, A.P.; Menon, R.; Mani Krishna, K.V.; Neogy, S.; Kumar, G.; Nabhiraj, P.Y.; Srivastava, D.; Dey, G.K. Study on the effect of Ar9+ ion irradiation of Zr–2.5 wt.% Nb alloy pressure tube. Philos. Mag. 2019, 99, 438–467. [Google Scholar] [CrossRef]
- Gaumé, M.; Baldo, P.; Mompiou, F.; Onimus, F. In-situ observation of an irradiation creep deformation mechanism in zirconium alloys. Scr. Mater. 2018, 154, 87–91. [Google Scholar] [CrossRef]
- Zhu, H.; Qin, M.; Wei, T.; Davis, J.; Ionescu, M. Atomic-scale study of He ion irradiation-induced clustering in α-Zirconium. Acta Mater. 2023, 244, 118584. [Google Scholar] [CrossRef]
- Tunes, M.A.; Harrison, R.W.; Greaves, G.; Hinks, J.A.; Donnelly, S.E. Effect of He implantation on the microstructure of zircaloy-4 studied using in situ TEM. J. Nucl. Mater. 2017, 493, 230–238. [Google Scholar] [CrossRef]
- Yan, C.; Wang, R.; Wang, Y.; Wang, X.; Bai, G.; Zhang, Y.; Lu, E.; Wang, B. Effect of Xe26+ ion irradiation on the microstructural evolution and mechanical properties of Zr–1Nb at room and high temperature. J. Nucl. Mater. 2015, 461, 78–84. [Google Scholar] [CrossRef]
- Dong, Q.; Qin, H.; Yao, Z.; Daymond, M.R. Irradiation damage and hardening in pure Zr and Zr-Nb alloys at 573 K from self-ion irradiation. Mater. Des. 2019, 161, 147–159. [Google Scholar] [CrossRef]
- Dong, Q.; Qin, H.; Yao, Z.; Wang, Q.; Daymond, M.R. Effect of the addition of Cu on irradiation induced defects and hardening in Zr-Nb alloys. J. Nucl. Mater. 2019, 519, 10–21. [Google Scholar] [CrossRef]
- Khan, M.I.; St Lawrence, S.; Klassen, R.J. Effect of Zr+ irradiation damage and crystal orientation on the uniaxial deformation of Zr–2.5%Nb micro-pillars: Part 1, deformation of single-phase αZr micro-pillars. Can. Metall. Q. 2021, 60, 28–40. [Google Scholar] [CrossRef]
- Griffiths, M.; Loretto, M.H.; Smallman, R.E. Electron damage in zirconium: I. defect structure and loop character. J. Nucl. Mater. 1983, 115, 313–322. [Google Scholar] [CrossRef]
- Drouet, J.; Dupuy, L.; Onimus, F.; Mompiou, F. A direct comparison between in-situ transmission electron microscopy observations and Dislocation Dynamics simulations of interaction between dislocation and irradiation induced loop in a zirconium alloy. Scr. Mater. 2016, 119, 71–75. [Google Scholar] [CrossRef]
- Doriot, S.; Onimus, F.; Gilbon, D.; Mardon, J.P.; Bourlier, F. Transmission electron microscopy study of second phase particles irradiated by 2 MeV protons at 350 °C in Zr alloys. J. Nucl. Mater. 2017, 494, 398–410. [Google Scholar] [CrossRef]
- Wei, J.; Frankel, P.; Polatidis, E.; Blat, M.; Ambard, A.; Comstock, R.J.; Hallstadius, L.; Hudson, D.; Smith, G.D.W.; Grovenor, C.R.M.; et al. The effect of Sn on autoclave corrosion performance and corrosion mechanisms in Zr–Sn–Nb alloys. Acta Mater. 2013, 61, 4200–4214. [Google Scholar] [CrossRef]
- Zee, R.H.; Rogerson, A.; Carpenter, G.J.C.; Watters, J. Effect of tin on the irradiation growth of polycrystalline zirconium. J. Nucl. Mater. 1984, 120, 223–229. [Google Scholar] [CrossRef]
- Shebaldov, P.V.; Peregud, M.M.; Nikulina, A.V. E110 Alloy Cladding Tube Properties and Their Interrelation with Alloy Structure-Phase Condition and Impurity Content. In International Symposium on Zirconium in the Nuclear Industry; ASTM International: West Conshohocken, PA, USA, 2000; pp. 545–559. [Google Scholar]
- Mardon, J.P.; Charquet, D.; Senevat, J.; Materials, A.S.F.T.A. Influence of Composition and Fabrication Process on Out-of-Pile and In-Pile Properties of M5 Alloy. In International Symposium on Zirconium in the Nuclear Industry; ASTM International: West Conshohocken, PA, USA, 2000; pp. 504–524. [Google Scholar]
- Warr, B.D.; Heide, P.A.W.V.D.; Maguire, M.A. Oxide characteristics and corrosion and hydrogen uptake in Zr-2.5 Nb CANDU pressure tubes. International Symposium on Zirconium in the Nuclear Industry; ASTM International: West Conshohocken, PA, USA, 1996; pp. 265–291. [Google Scholar]
- Sivabharathy, M.; Senthilkumar, A.; Sakthipandi, K.; Palanichamy, P.; Ramachandran, K. Thermal Expansion Studies on Zircaloy-2. Mater. Today Proc. 2016, 3 Pt B, 3064–3070. [Google Scholar] [CrossRef]
- Takahashi, Y.; Yamawaki, M.; Yamamoto, K. Thermophysical properties of uranium-zirconium alloys. J. Nucl. Mater. 1988, 154, 141–144. [Google Scholar] [CrossRef]
- Chen, W.; Bai, X.-M. Temperature and composition dependent thermal conductivity model for U-Zr alloys. J. Nucl. Mater. 2018, 507, 360–370. [Google Scholar] [CrossRef]
- Fink, J.K.; Leibowitz, L. Thermal conductivity of zirconium. J. Nucl. Mater. 1995, 226, 44–50. [Google Scholar] [CrossRef]
- Crocombette, J.-P.; Notargiacomo, P.; Marinica, M.C. Effect of the variation of the electronic density of states of zirconium and tungsten on their respective thermal conductivity evolution with temperature. J. Phys. Condens. Matter 2015, 27, 165501. [Google Scholar] [CrossRef]
- Wang, H.; Thomas, J.; Okuniewski, M.A.; Tomar, V. Microstructure dependent thermal conductivity measurement of Zircaloy-4 using an extended Raman thermometry method. J. Nucl. Mater. 2020, 539, 152338. [Google Scholar] [CrossRef]
- Isaenkova, M.G.; Tenishev, A.V.; Krymskaya, O.A.; Stolbov, S.D.; Mikhal’chik, V.V.; Fesenko, V.A.; Klyukova, K.E. Influence of the structural state and crystallographic texture of Zr-2.5% Nb alloy samples on the anisotropy of their thermal expansion. Nucl. Mater. Energy 2021, 29, 101071. [Google Scholar] [CrossRef]
- Isaenkova, M.G.; Tenishev, A.V.; Perlovich, Y.A.; Stolbov, S.D.; Mikhalchik, V.V.; Fedotov, P.V.; Novikov, V.V.; Kuznetsov, V.I. Regularities of Thermal Expansion of Cladding Tubes and Rods Made of E110opt Alloy within the Temperature Range of 273–1473 K (20–1200 °C). Inorg. Mater. Appl. Res. 2021, 12, 820–830. [Google Scholar] [CrossRef]
- Choo, K.N.; Kang, Y.H.; Pyun, S.I.; Urbanic, V.F. Effect of composition and heat treatment on the microstructure and corrosion behavior of Zr Nb alloys. J. Nucl. Mater. 1994, 209, 226–235. [Google Scholar] [CrossRef]
- Yang, H.L.; Matsukawa, Y.; Kano, S.; Duan, Z.G.; Murakami, K.; Abe, H. Investigation on microstructural evolution and hardening mechanism in dilute Zr–Nb binary alloys. J. Nucl. Mater. 2016, 481, 117–124. [Google Scholar] [CrossRef]
- Guillermet, A.F. Thermodynamic analysis of the stable phases in the Zr-Nb system and calculation of the phase diagram. Ztschrift Fur Met. 1991, 82, 478–487. [Google Scholar]
- Abriata, J.P.; Bolcich, J.C. The Nb−Zr (Niobium−Zirconium) system. J. Phase Equilibria 1982, 3, 34–44. [Google Scholar] [CrossRef]
- Cottura, M.; Clouet, E. Solubility in Zr-Nb alloys from first-principles. Acta Mater. 2018, 144, 21–30. [Google Scholar] [CrossRef]
- Kresse, G.; Hafner, J. Ab initio molecular dynamics for liquid metals. Phys. Rev. B 1993, 47, 558–561. [Google Scholar] [CrossRef] [PubMed]
- Kresse, G.; Furthmüller, J. Efficiency of ab-initio total energy calculations for metals and semiconductors using a plane-wave basis set. Comput. Mater. Sci. 1996, 6, 15–50. [Google Scholar] [CrossRef]
- Blöchl, P.E. Projector augmented-wave method. Phys. Rev. B 1994, 50, 17953–17979. [Google Scholar] [CrossRef] [PubMed]
- Perdew, J.P.; Burke, K.; Ernzerhof, M. Generalized Gradient Approximation Made Simple. Phys. Rev. Lett. 1996, 77, 3865–3868. [Google Scholar] [CrossRef] [PubMed]
- Wang, S.Q.; Ye, H.Q. Ab initio elastic constants for the lonsdaleite phases of C, Si and Ge. J. Phys. Condens. Matter. 2003, 15, 5307–5314. [Google Scholar] [CrossRef]
- Chen, X.Q.; Niu, H.Y.; Li, D.Z.; Li, Y.Y. Modeling hardness of polycrystalline mate-rials and bulk metallic glasses. Intermetallics 2011, 19, 1275–1281. [Google Scholar] [CrossRef]
- Plimpton, S. Fast Parallel Algorithms for Short-Range Molecular Dynamics. J. Comput. Phys. 1995, 117, 1–19. [Google Scholar] [CrossRef]
- Xin, X.K.; Lai, W.S.; Liu, B.X. Point defect properties in hcp and bcc Zr with trace solute Nb revealed by ab initio calculations. J. Nucl. Mater. 2009, 393, 197–202. [Google Scholar] [CrossRef]
- Chen, X.Y.; Wang, D.; Yao, B.D.; Wu, L.; Wu, X.Y.; Wang, Y.X. Mechanical and thermal properties of zirconium claddings after doping niobium: Understanding from first-principles calculations. J. Nucl. Mater. 2022, 568, 153876. [Google Scholar] [CrossRef]
- Kutty, T.R.G.; Ravi, K.; Ganguly, C. Studies on hot hardness of Zr and its alloys for nuclear reactors. J. Nucl. Mater. 1999, 265, 91–99. [Google Scholar] [CrossRef]
- Lu, H.-J.; Wu, H.; Zou, N.; Lu, X.-G.; He, Y.-L.; Morgan, D. First-principles investigation on diffusion mechanism of alloying elements in dilute Zr alloys. Acta Mater. 2018, 154, 161–171. [Google Scholar] [CrossRef]
- Kong, X.G.; Wang, Q.Q.; Yu, Y.; Shen, Y.H.; Zhang, C.Y.; Pan, R.J.; Kharchenko, D.O.; Mao, J.J.; Ning, Z.N.; Fang, Z.Q.; et al. Effect of solute Nb and Sn on self-interstitial atom defect in zirconium-based alloys by first-principles calculations. J. Nucl. Mater. 2024, 588, 154795. [Google Scholar] [CrossRef]

Disclaimer/Publisher’s Note: The statements, opinions and data contained in all publications are solely those of the individual author(s) and contributor(s) and not of MDPI and/or the editor(s). MDPI and/or the editor(s) disclaim responsibility for any injury to people or property resulting from any ideas, methods, instructions or products referred to in the content. |
© 2024 by the authors. Licensee MDPI, Basel, Switzerland. This article is an open access article distributed under the terms and conditions of the Creative Commons Attribution (CC BY) license (https://creativecommons.org/licenses/by/4.0/).