Article

The Influence of Hot Deformation on the Mechanical and Structural Properties of 42CrMo4 Steel

Faculty of Materials and Environmental Engineering, Technical University of Cluj-Napoca, 28 Memorandumului Street, 400114 Cluj-Napoca, Romania
*
Author to whom correspondence should be addressed.
Metals 2024, 14(6), 647; https://doi.org/10.3390/met14060647
Submission received: 22 April 2024 / Revised: 22 May 2024 / Accepted: 25 May 2024 / Published: 29 May 2024
(This article belongs to the Special Issue Forging of Metals and Alloys)

Abstract

:
The influence of elevated temperatures and strain rate on the mechanical and structural properties of steel 42CrMo4 were analysed experimentally in this paper. The experiments were based on uniaxial tension and compression tests at high temperatures between 700 °C and 1100 °C and strain rates in the range 0.0018–0.1 s−1. The influence of temperature and strain rate on yield stress, strain to fracture, hardness, structural changes, and fracture characteristics were analysed. The non-uniformity of deformations obtained at different values of the strain rate and temperature were also analysed. Analysis by scanning electron microscopy showed the ductile behaviour of the material. The degree of damage in the material caused by the presence of cavities increased with increasing deformation temperature. For all the presented deformation conditions, the formation of the fracture through the ductile fracture mechanism resulted from localized necking and the coalescence of microvoids. By increasing the deformation temperature and reducing the strain rate, the fracture behaviour of 42CrMo4 steel can be improved.

1. Introduction

The commercialization of steel is constantly developing, and there is a wide range of applications of steels within the fields of construction and transport (cars, trucks, aerospace industry, ship building and railways). Currently, to determine the characteristics of a material’s deformation, laboratory equipment and specialized programs can be used, which are able to simulate physically or mathematically, in a simplified way, the real operational conditions. The information provided can be used later to determine the formability of the investigated material.
Steel 42CrMo4 is widely used in the machine building industry, being used in the manufacture of high-strength parts in compressors and turbines, of the working elements in heavy surface and underground equipment, as well as of parts for agricultural equipment and other applications. In general, its application is for statically and dynamically stressed components for engines and machines [1,2,3,4,5,6,7,8,9,10]. Steel 42CrMo4 is a low alloy steel with chromium, molybdenum and manganese, is usually used in a hardened and tempered state and has wide industrial applicability due to its high strength and hardness, good fatigue behaviour and good machinability [9,10]. Despite the efforts made in studying the behaviour of 42CrMo4 steel, the effects of hot working process parameters on the stress distribution, strain, and microstructural evolution of hot worked 42CrMo4 steel needs to be further investigated to understand its workability and to optimize its parameters at varying temperatures [11,12]. Although the properties of 42CrMo4 steel have been studied, there is still a great interest in studying the mechanical properties of this material [13,14,15,16]. In the past, many investigations have been carried out on the behaviours of 42CrMo4 steel [15,16,17,18,19,20]. Lin YC et al. showed that the preference for use of 42CrMo4 high-strength steel is mainly due to its good balance of strength, toughness, and water resistance [21,22]. Research was also carried out regarding the influence of temperature and strain rate on the deformation behaviour and microstructure of the extruded 42CrMo4 alloy [23,24,25]. During hot compression, the dynamic recrystallization kinetics of 42CrMo steel were studied [26,27,28,29,30]. Constitutive models and equations were developed to explain the hot behaviour of 42CrMo4 steel [31,32,33,34,35,36,37,38,39]. Nurnberger et al. studied the microstructure behaviour of 42CrMo4 steel during continuous cooling from hot deformation temperatures [40,41,42,43]. Arun S. has studied the influence of the thermomechanical processing of the 40CrMo4 alloy on its mechanical properties [12].
In recent years, the research of Andreatta F. et al. examined localized attacks at inclusions in 42CrMo4 QT steel [44], while Díaz A. et al. studied the influence of hydrogen on the hydraulic fracture behaviour of 42CrMo4 steel welds [45], and Polášek M., et al. studied the contact fatigue resistance of gun barrel steels [46].
The fracture behaviour can be influenced by certain general factors such as the temperature of the material during deformation, the speed of stress and the degree of triaxiality of the stress states generated in the material under stress, which depends on the complexity of the stress and the presence of stress concentrators in the material. The complexity of the stresses is determined by the way the loads act and the stress concentrators (scratches, holes). The intensity of the stresses produced by a mechanical test in a material with stress concentrators is much higher than in another material without stress concentrators when the same mechanical test is applied.
The aim of this paper is to analyse the influence of elevated temperatures and strain rate on the mechanical and structural properties of steel 42CrMo4.

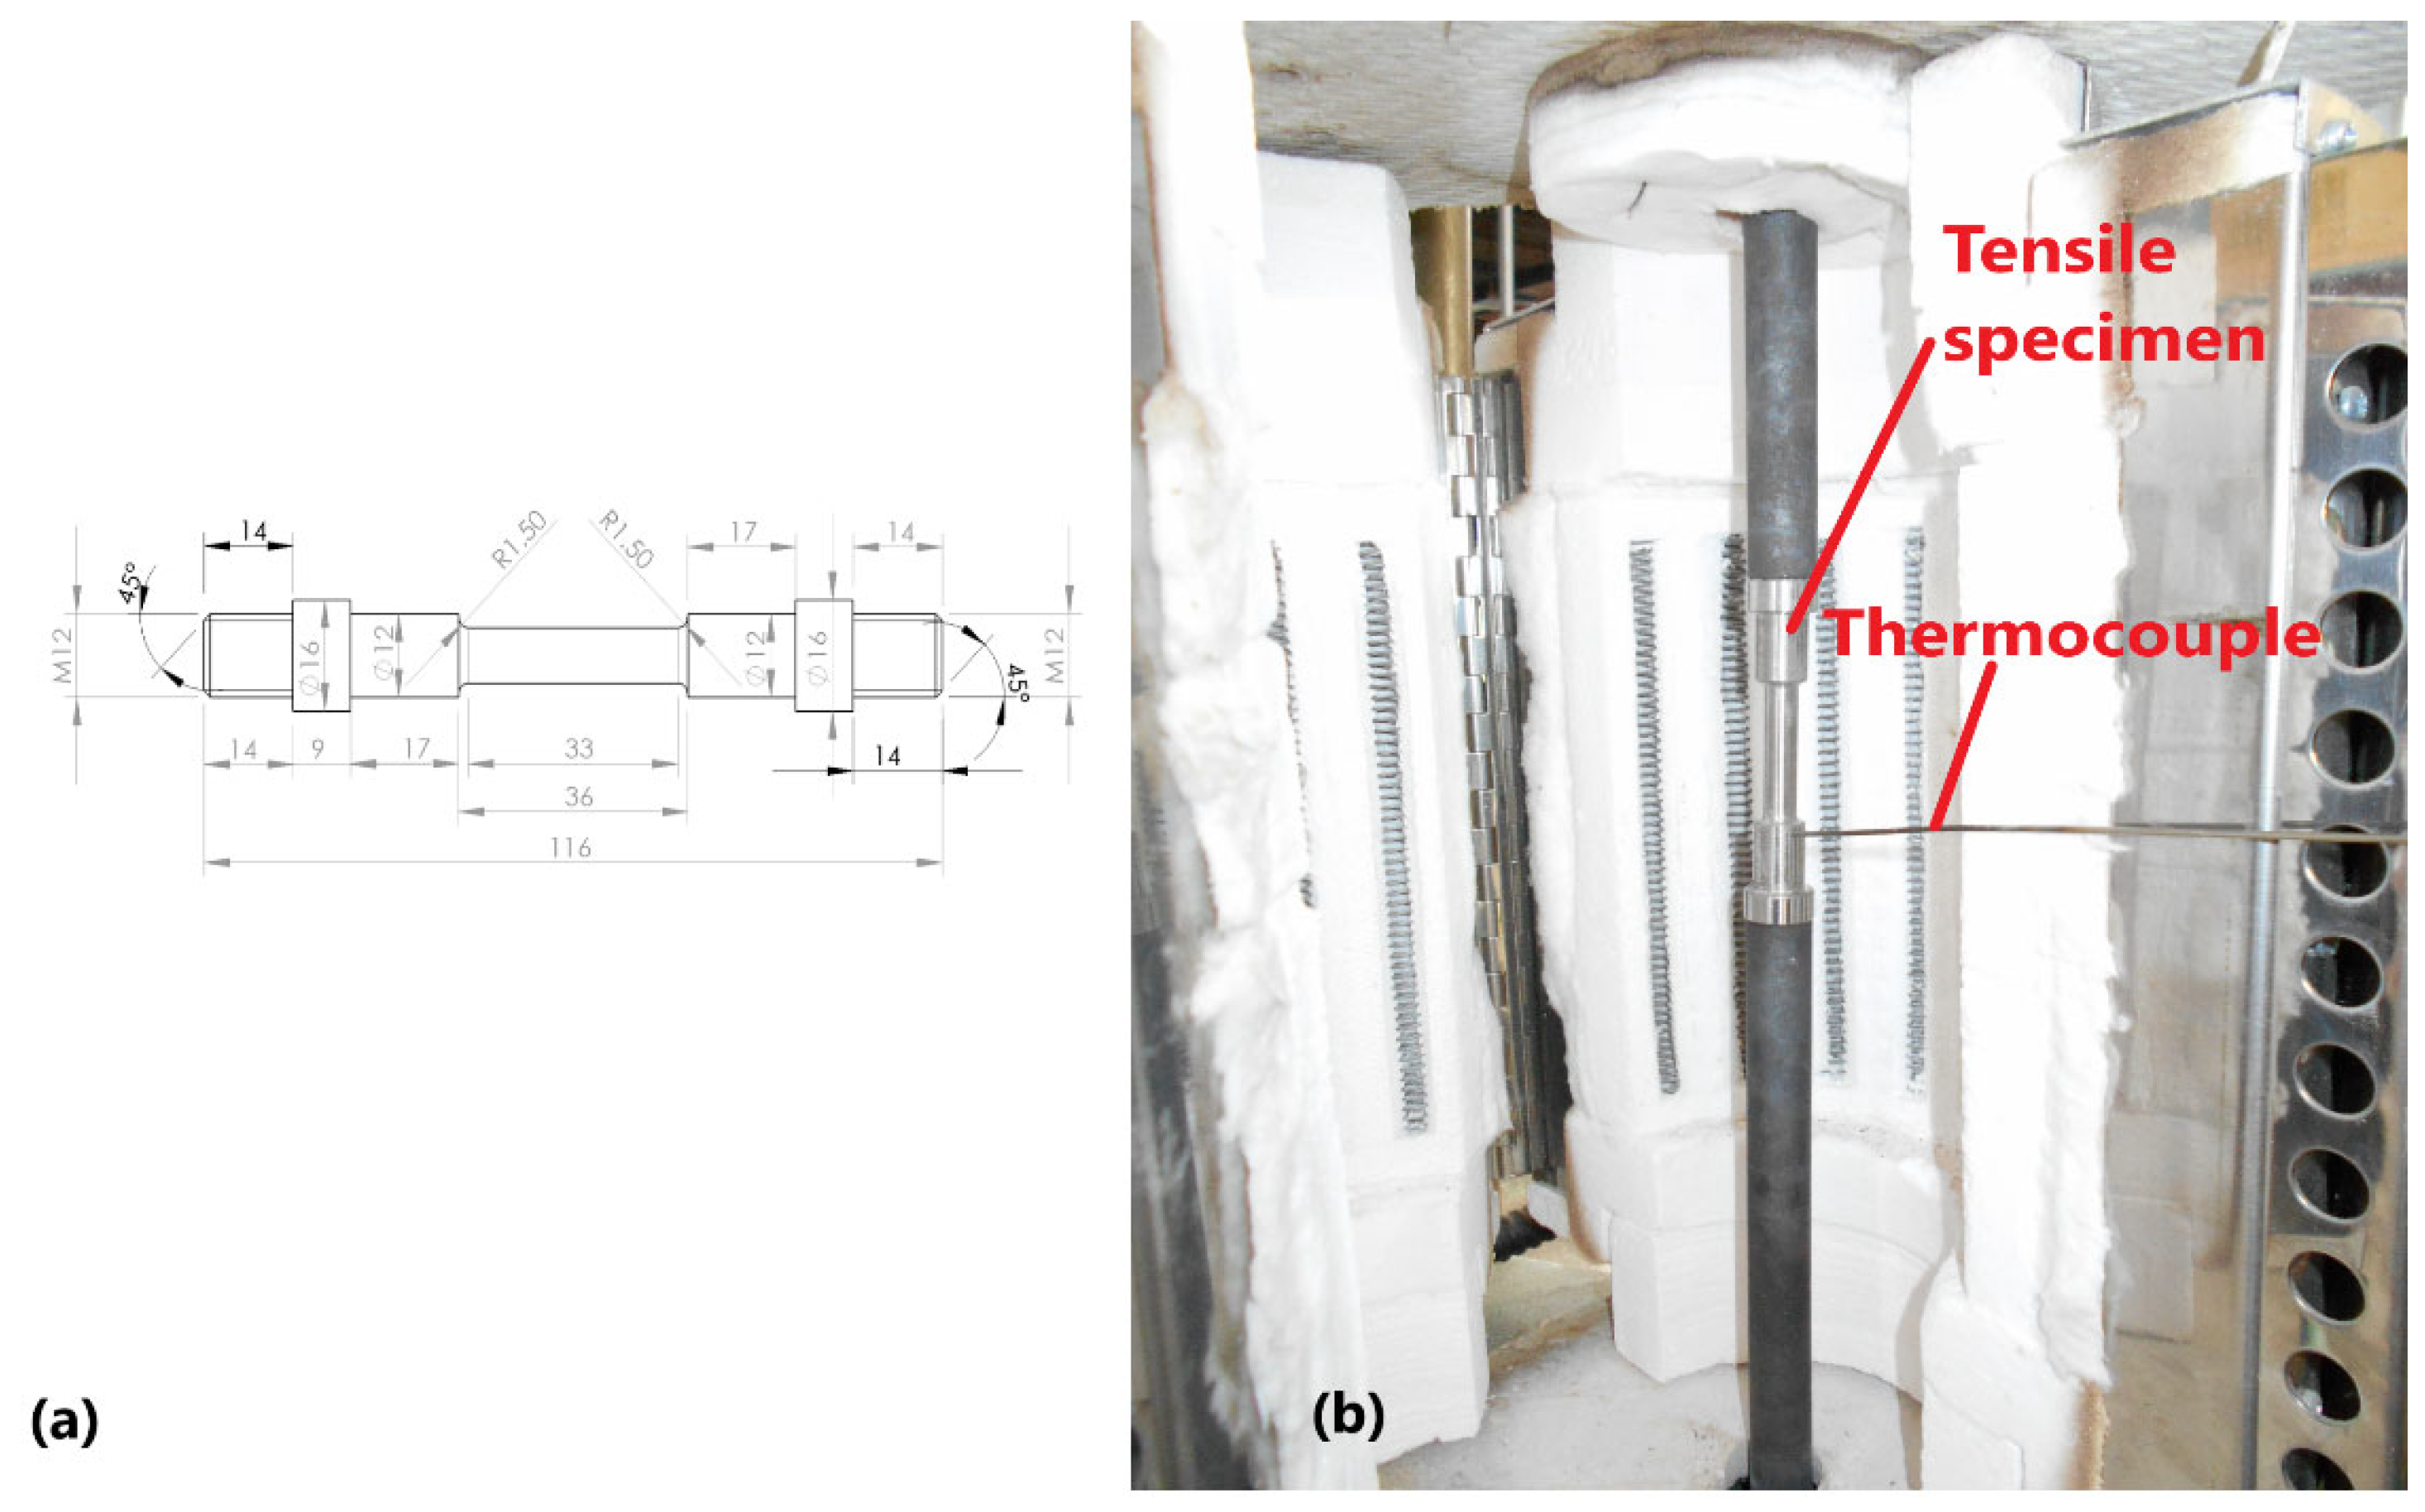
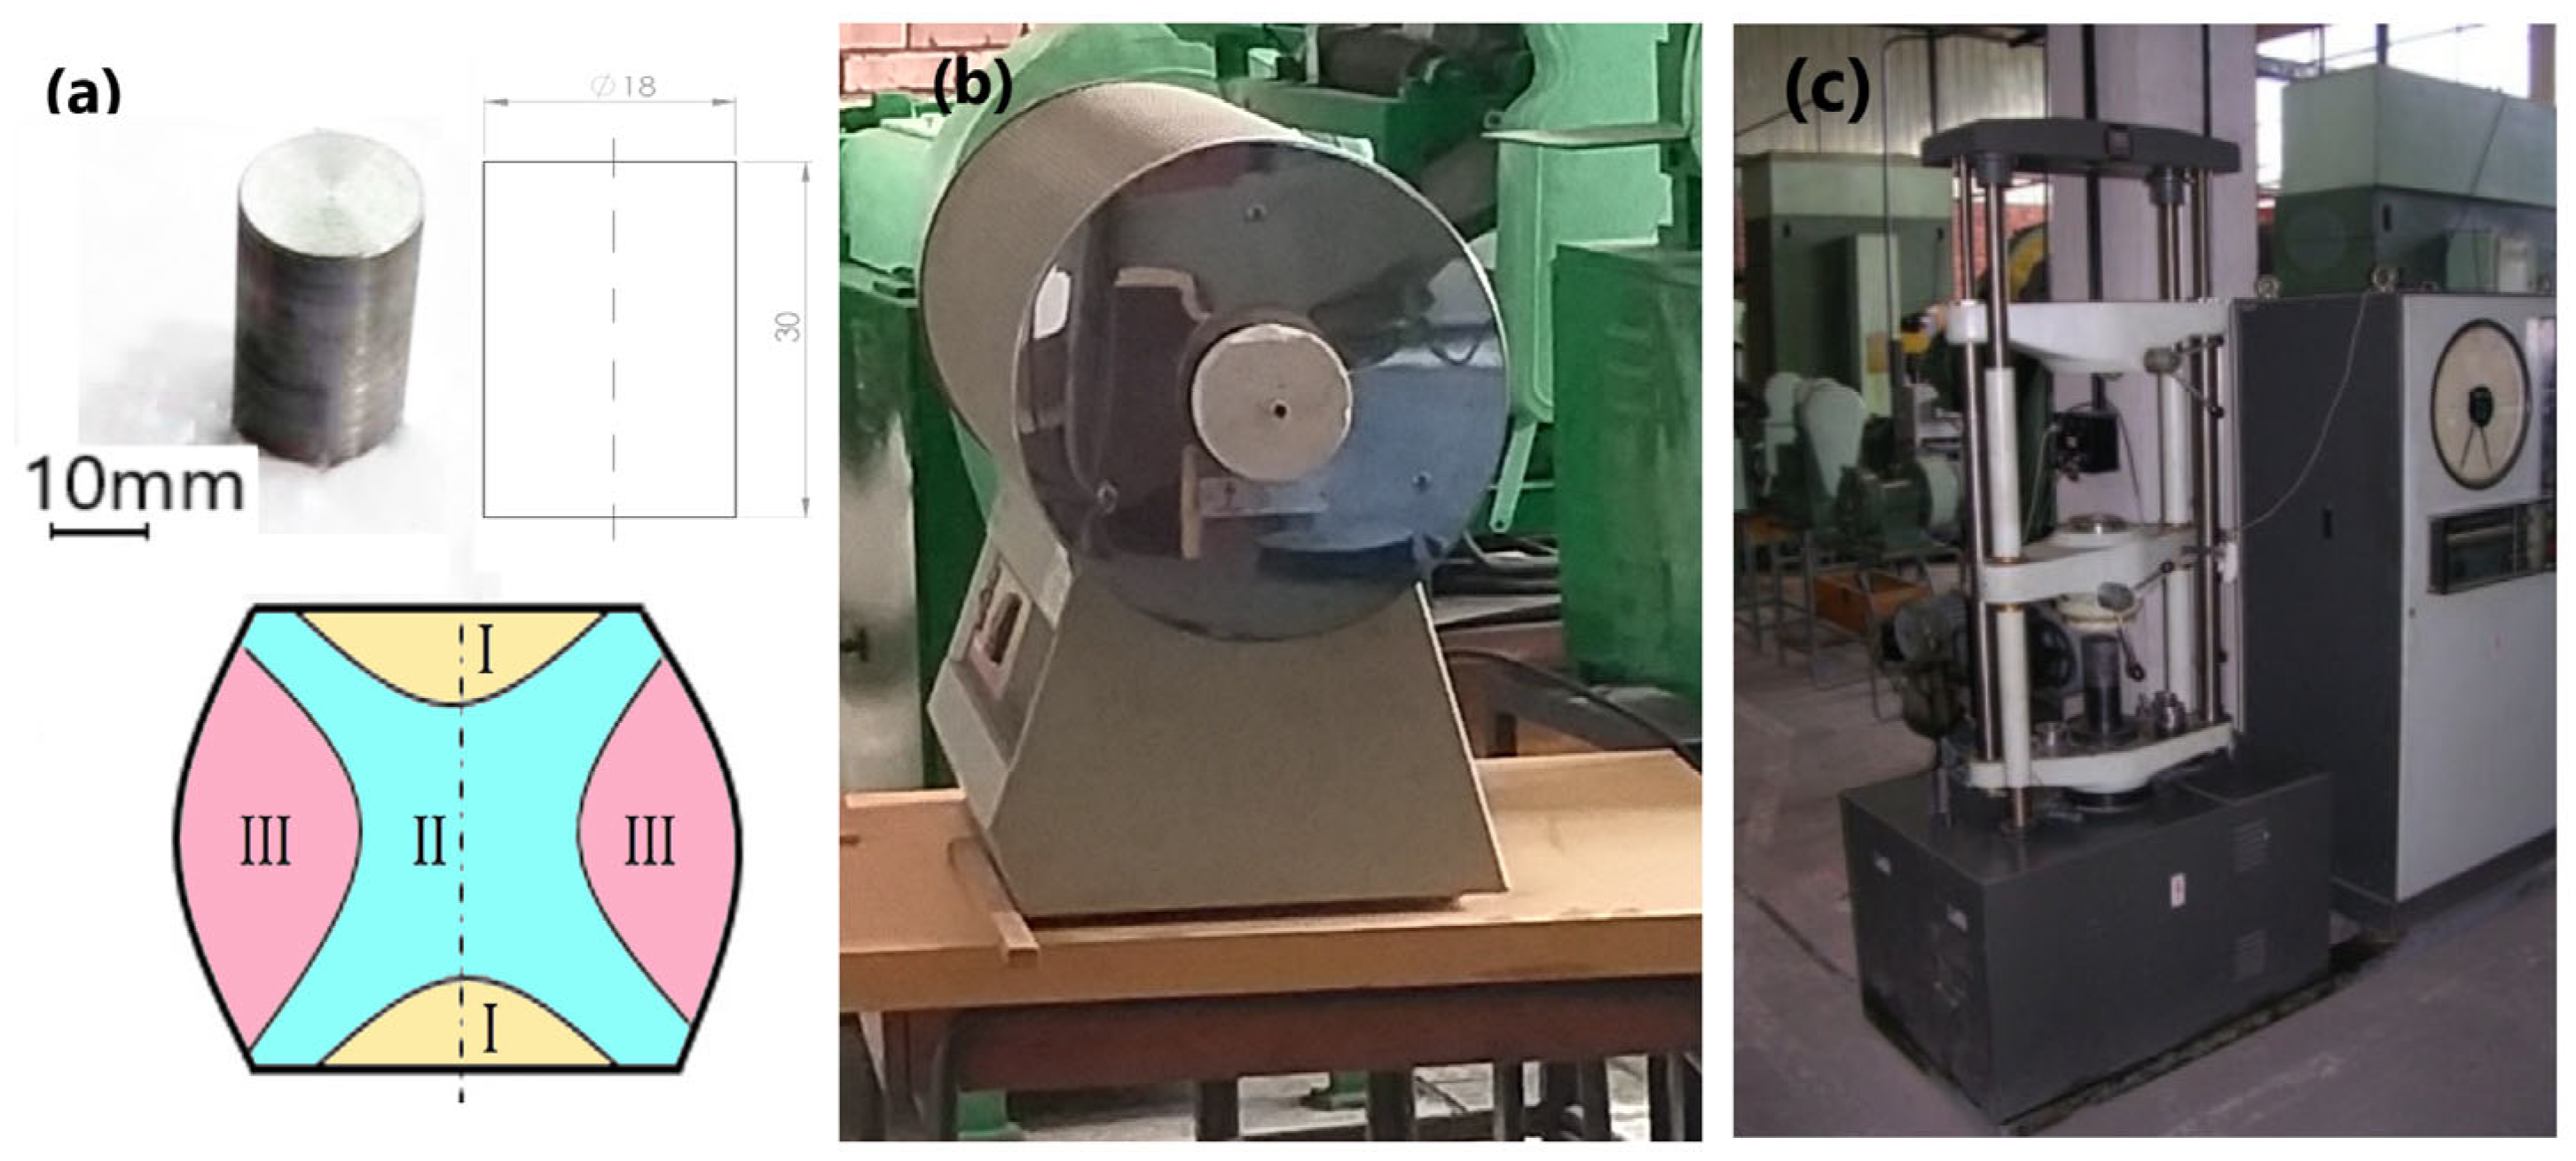
2. Experimental Details

The material used in this study was the commercial steel 42CrMo4 (1.7225:EN 10083-3-2006) [47], and its chemical composition is presented in Table 1. The yield strength of the cold material is over 930 MPa, and the tensile strength is 1080 MPa. The experimental research examined the temperature and strain rate influence on mechanical and structural properties of 42CrMo4 steel. For this purpose, several experimental tests were carried out including tensile, compression and hardness tests, as well as scanning electronic microscopy (SEM) using JEOL JSM 5600 LV (Tokyo, Japan) and AZtec software (version 4.2, Oxford Instruments, High Wycombe, UK).
The hot tensile Figure 1a and compression tests Figure 2a were performed on a Heckert type hydraulic press with a maximum force of 200 KN (200 kN hydraulic Heckert-EDZ-20S testing machine). The hot tensile tests were carried out at temperatures of T = 700 °C, T = 800 °C, T = 900 °C, T = 1000 °C and T = 1100 °C, and at strain rates of 0.0018 s−1, 0.012 s−1, 0.08 s−1 with electric heating in the vertical furnace shown in Figure 1b.
The tensile specimens were prepared from 18 mm diameter extruded round bars. The geometry and dimensions of the specimen were determined by ASTM standards [47]. The dimensions of the initial tensile specimen are shown in Figure 1.
The shape of the initial compression specimen is shown in Figure 2a. In the case of compression tests, due to the presence of friction forces on the contact surfaces between the specimen and the deformation tools, physical-chemical and structural non-homogeneity of the material subjected to deformation, and thermal inhomogeneity, the distribution of deformations inside the specimen is non-uniform. Zone I is the area with minimal deformation due to the presence of friction forces, while zone II is the area with maximum deformation, and zone III is the area with medium deformation.
The hot compression tests were carried out on specimens with dimensions of Ø18 × 30 mm heated on a Carbolite type electric furnace (CTF/12/75/700) at the temperatures T = 800 °C, T = 900 °C and T = 1000 °C, and at three strain rates of 0.033 s−1, 0.066 s−1, 0.1 s−1.
For each temperature and strain rate, 3 measurements were made, and the calculated values were the arithmetic mean of the measurements performed. The measured deformation was along the length:
ε = l 0 l 1 l 0
During hot forming, due to the deformation forces being small, the elastic deformation is negligible.

3. Experimental Results

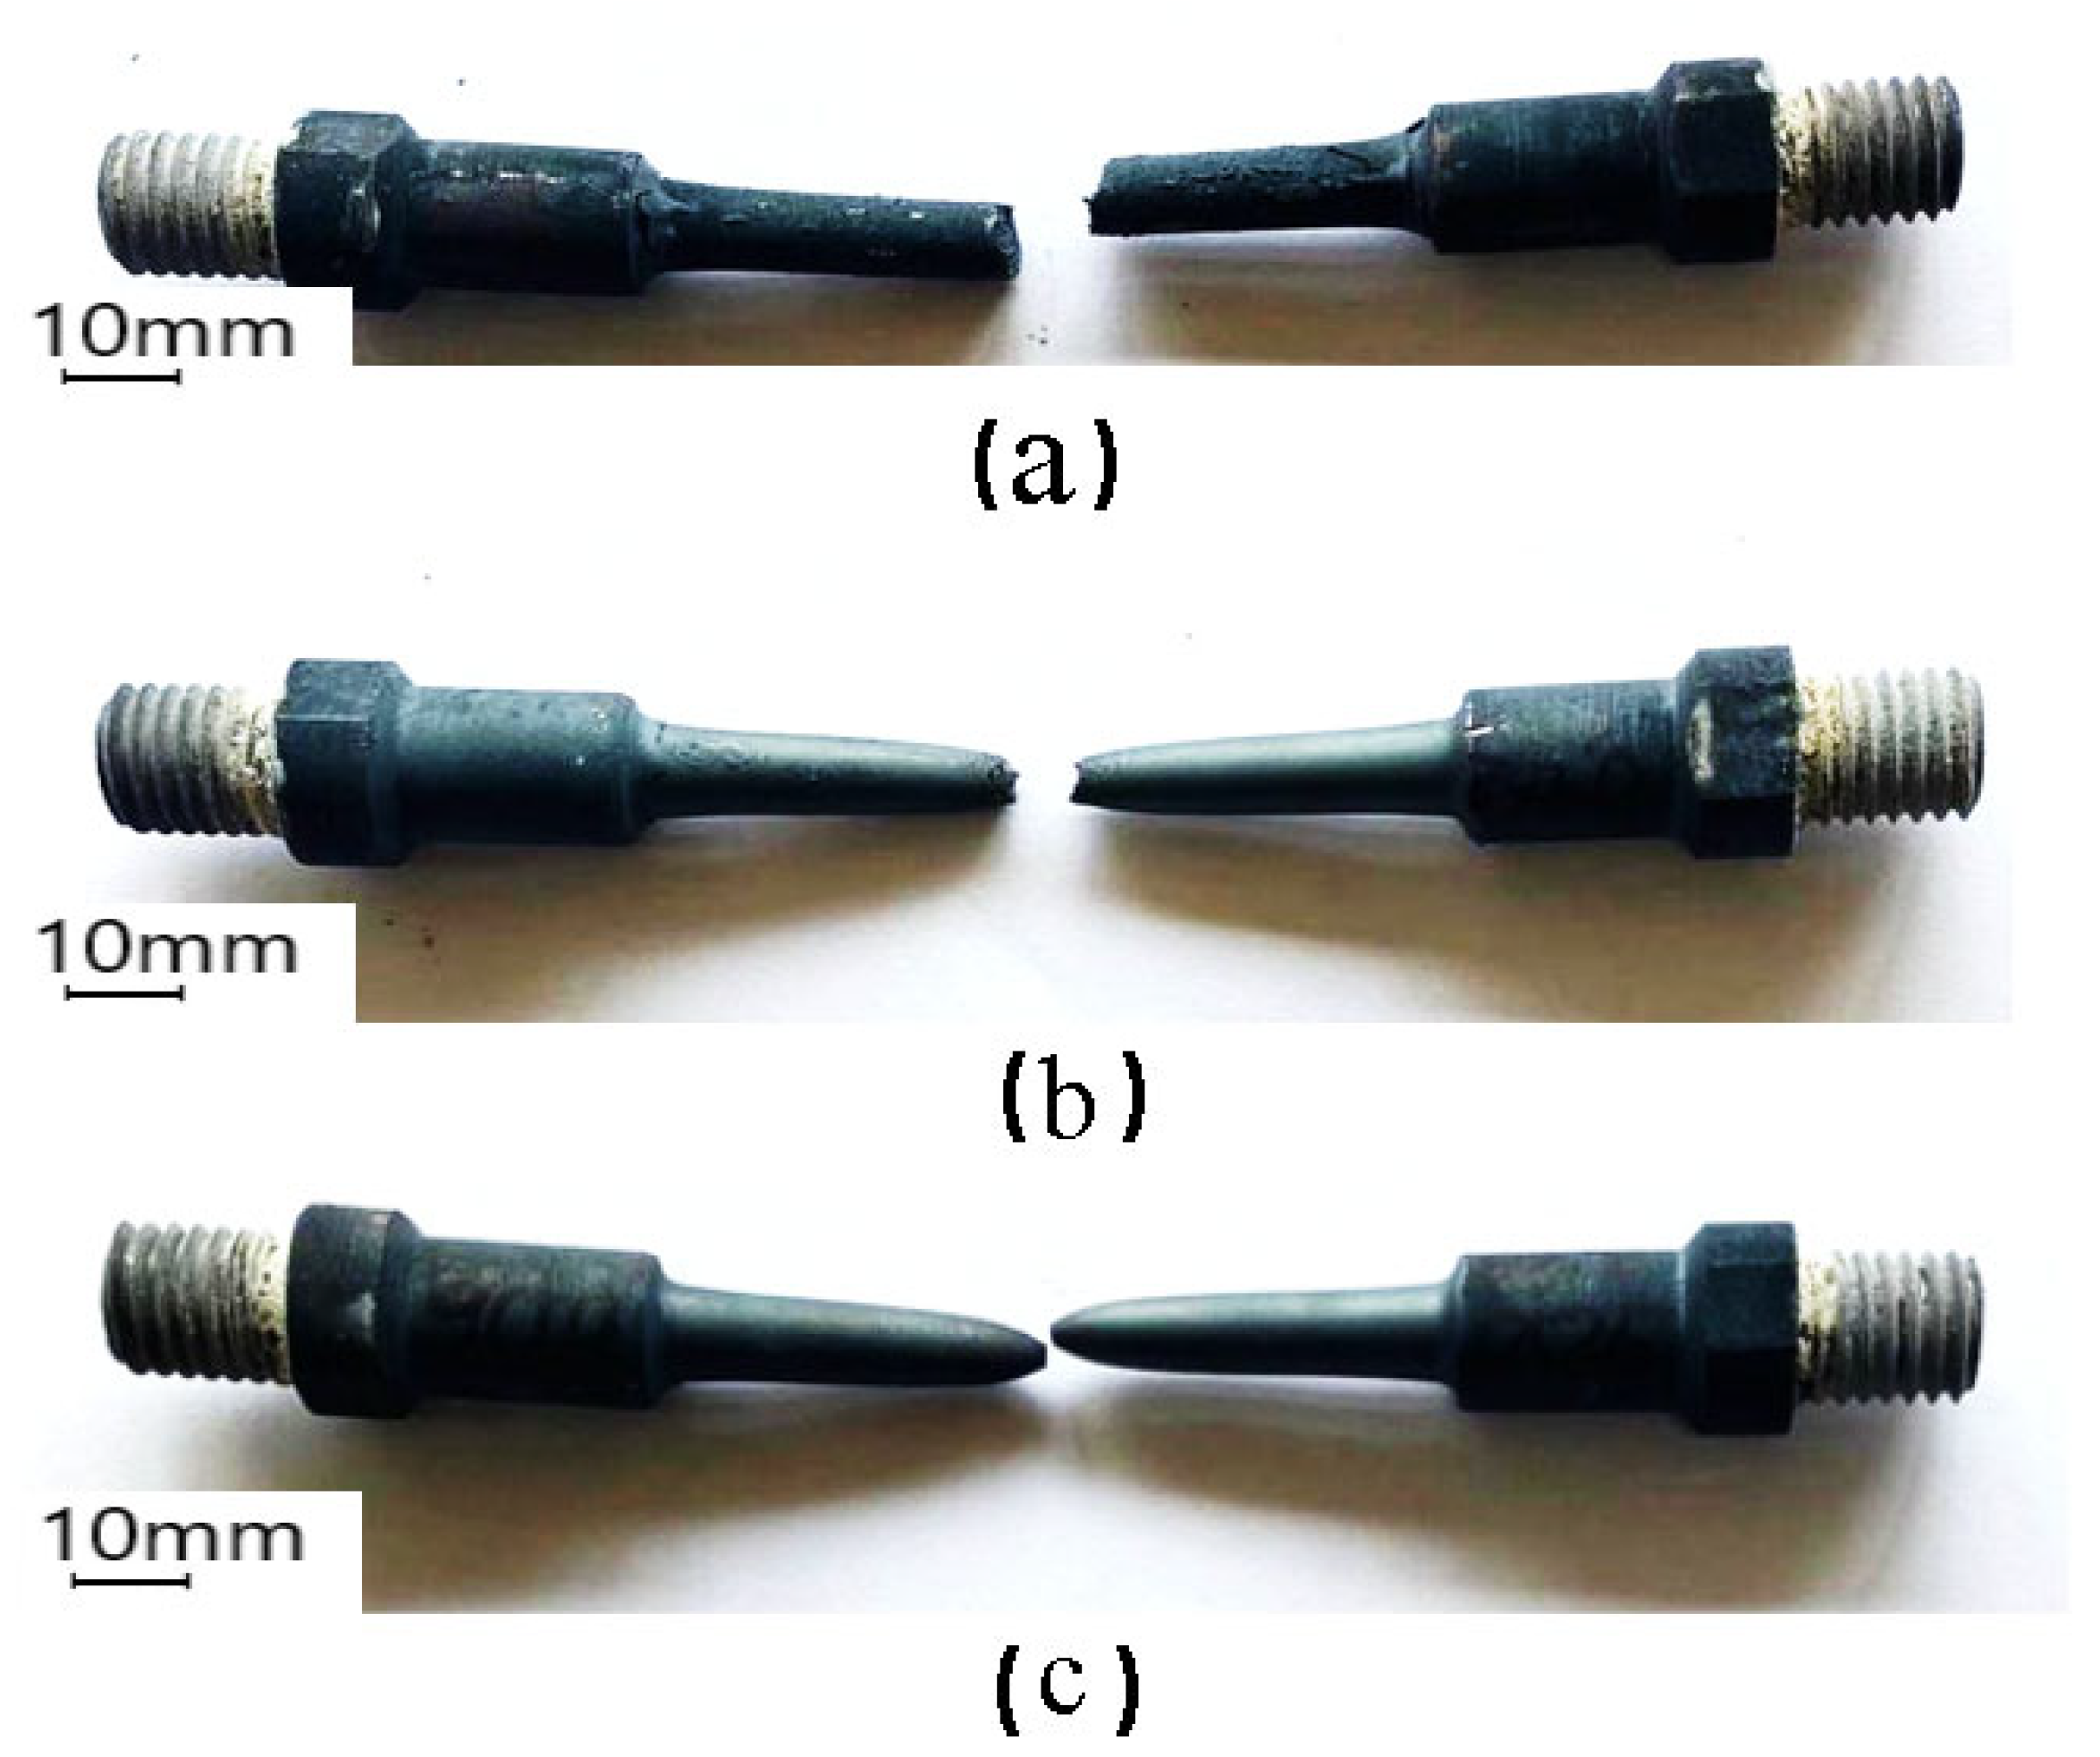
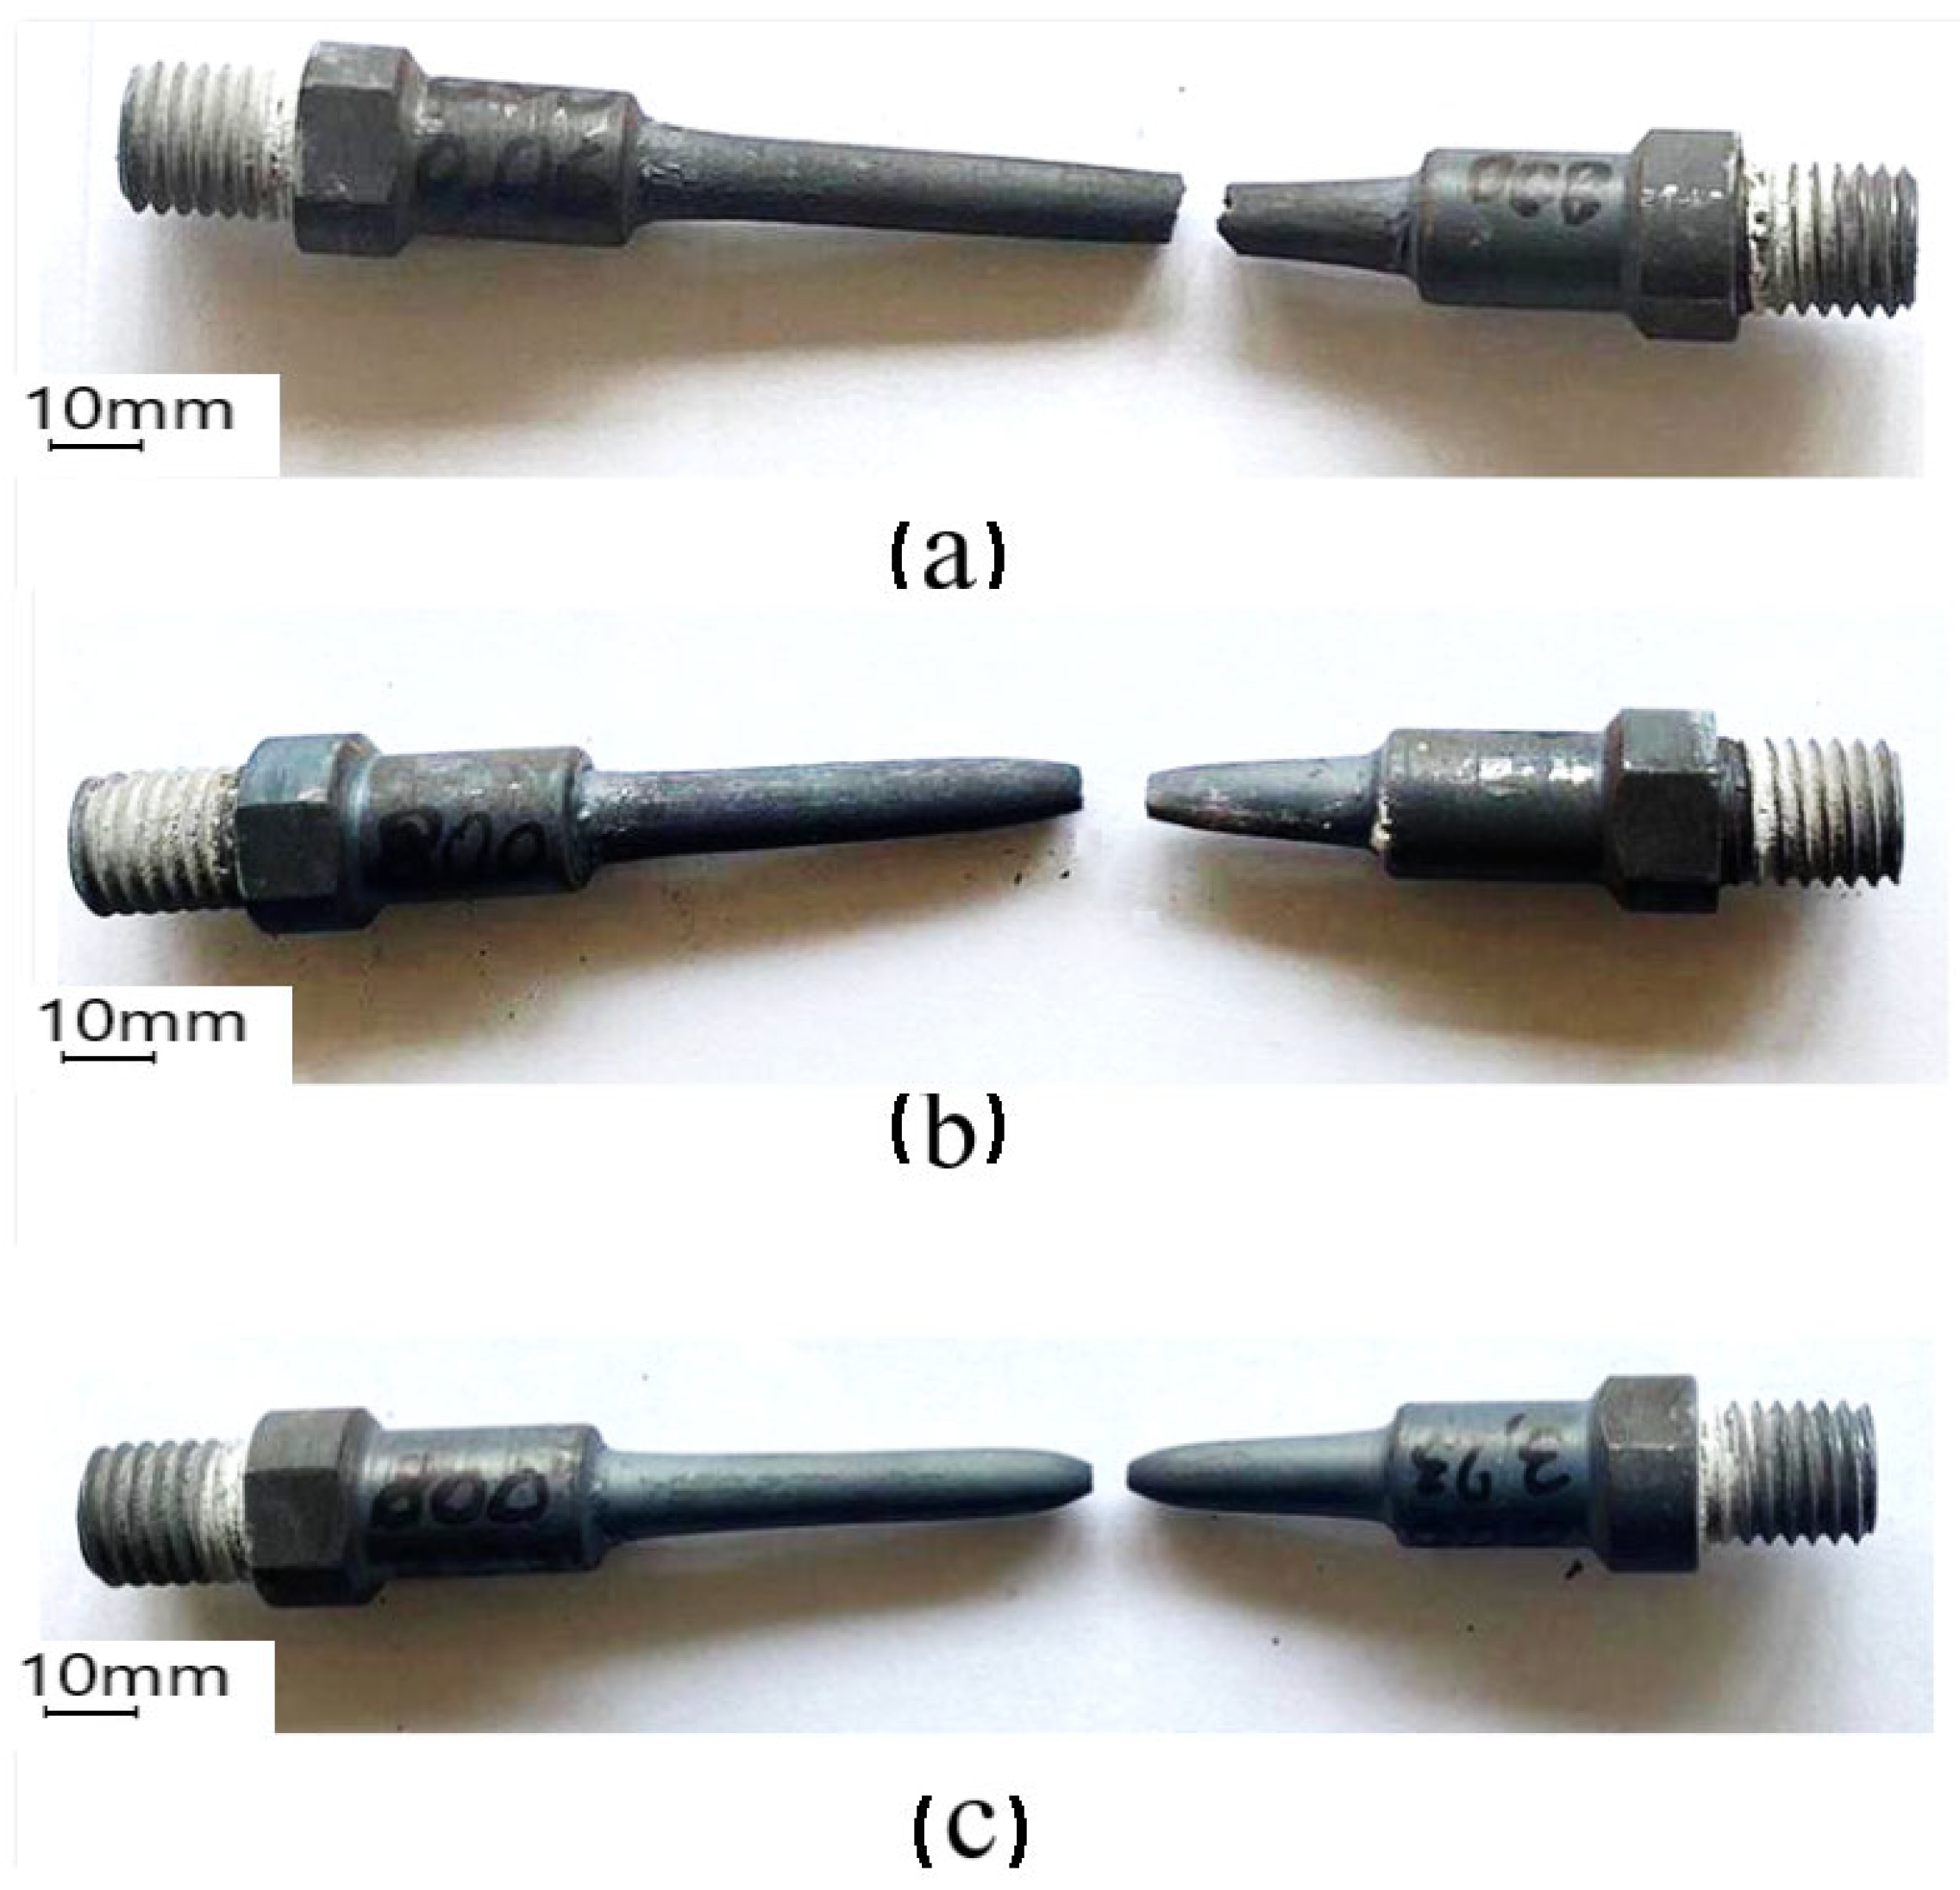
3.1. Hot Tensile Behaviour

In the case of hot compression, at the maximum degree of deformation applied (the material behaved ductile), the strength to deformation was 400 MPa, significantly higher than in the case of tension. The formability of the material was higher in the case of compression than tension. This behaviour of the material is favourable for industrial processes of plastic deformation (forging, extrusion) in which the stress on the material is compression.
Figure 3, Figure 4, Figure 5 and Figure 6 show the macro morphology of the specimens obtained after the tensile tests under different temperature and strain rate conditions.
The tensile test specimens from Figure 3 tested at 1000 °C show ductile fracture. With the increase in strain rates, the necking is more pronounced.
The tensile test specimens tested at 900 °C shown in Figure 4 and the tensile test specimens tested at 800 °C shown in Figure 5 show ductile fracture. In Figure 4a and Figure 5a, the neck is very small, and the fractures appear more fragile than those in Figure 4b,c. With the increase in strain rates, the necking is more pronounced (Figure 4c).
The tensile test specimens tested at 700 °C (Figure 6) show ductile fracture in the all strain rates conditions.
The macro fracture morphology under different temperatures and strain rates shows that the ductile fracture behaviour can be observed for all deformation conditions, due to the presence of necking localization before fracture.
The results obtained from the experimental tests are presented in Table 2.
The load vs. stroke variation diagram for ε ˙ = 0 .0897 s−1 strain rate is shown in Figure 7. Based on this diagram, the tensile stress–true strain diagrams were drawn.
It can be seen that with increases in temperature at the same strain rate, the longitudinal deformation increases, resulting in an increase in material formability.
Figure 8, Figure 9 and Figure 10 show the tensile stress evolution according to the true strain of the specimen for different experimental conditions. The flow curves obtained at different temperatures (700 °C, 800 °C, 900 °C, 1000 °C and 1100 °C) are shown for strain rate 0.0897 s−1 (Figure 8), strain rate 0.0128 s−1 (Figure 9), and strain rate 0.0018 s−1 (Figure 10). With increasing strain rate, an increase in the uniformity of the curves was observed. At the strain rate of 0.0897 s−1 (Figure 8) and temperature of 700 °C, a maximum tensile stress of 240 MPa was observed, which is more than the tensile stress of 213 MPa observed at the strain rate of 0.0128 s−1 (Figure 9), and 158 MPa observed at the 0.0018 s−1 strain rate (Figure 10) at the same temperature. At 800 °C, a maximum tensile stress of 144 MPa was obtained for the strain rate shown in Figure 8, followed by 117 MPa in Figure 9 and 91 MPa in Figure 10. At 900 °C, the maximum tensile stress was 105 MPa in Figure 8, compared with 79 MPa in Figure 9 and 60.4 MPa in Figure 10. At 1000 °C the maximum tensile stress values were 71 MPa (Figure 8), 52 MPa (Figure 9) and 37.5 MPa (Figure 10). Similarly, at 1100 °C, the maximum tensile stress values were 48 MPa (Figure 8), 35.6 MPa (Figure 9) and 24.6 MPa (Figure 10). The work hardening and dynamic softening stages can be observed here.
The influence of temperature and strain rate on the maximum ultimate tensile stress is shown in Figure 8, Figure 9 and Figure 10. In all the studied deformation conditions, with increasing temperature, the maximum stress decreases, which is observed in Figure 11.
As temperature increases, there is a major decrease in the stress curves. Additionally, it can be seen that as the strain rate increases, the stress curves also increase significantly (Figure 11).
The flow stress decreases with the decrease in strain rate and the increase in temperature, as can be seen in Figure 9. The explanation for this phenomenon is that the low strain rate leads to a longer time for the accumulation of energy. Simultaneously, the high temperature favours nucleation and the growth of dynamically recrystallized grains, and by eliminating the barriers resulting from dislocations, the flow stress decreases [41,42]. Due to the combined effects of work hardening and softening due to high temperature, the yield stress curves show different hot deformation behaviours of the material. As can be seen in the Figure, at low deformation temperatures (700 °C), the yield stress increases to a maximum value and then constantly decreases until fracture [23].
In Figure 8, Figure 9 and Figure 10, in the first stage of the deformation, work hardening is present. The yield stress then increases in the second stage to a maximum value for all the strain rates, and in the third stage of the deformation, the tension decreases until the fracture occurs.
The influence of strain rate and temperature on the maximum tensile stress is shown in Figure 11.
The increase in the strain rate leads to the increase in the tensile stress.
At low strain rates, dynamic restoration (DRV) and dynamic recrystallization (DRX) have enough time to occur so that the effect of work hardening is removed, which leads to a reduction in the stress necessary for deformation.

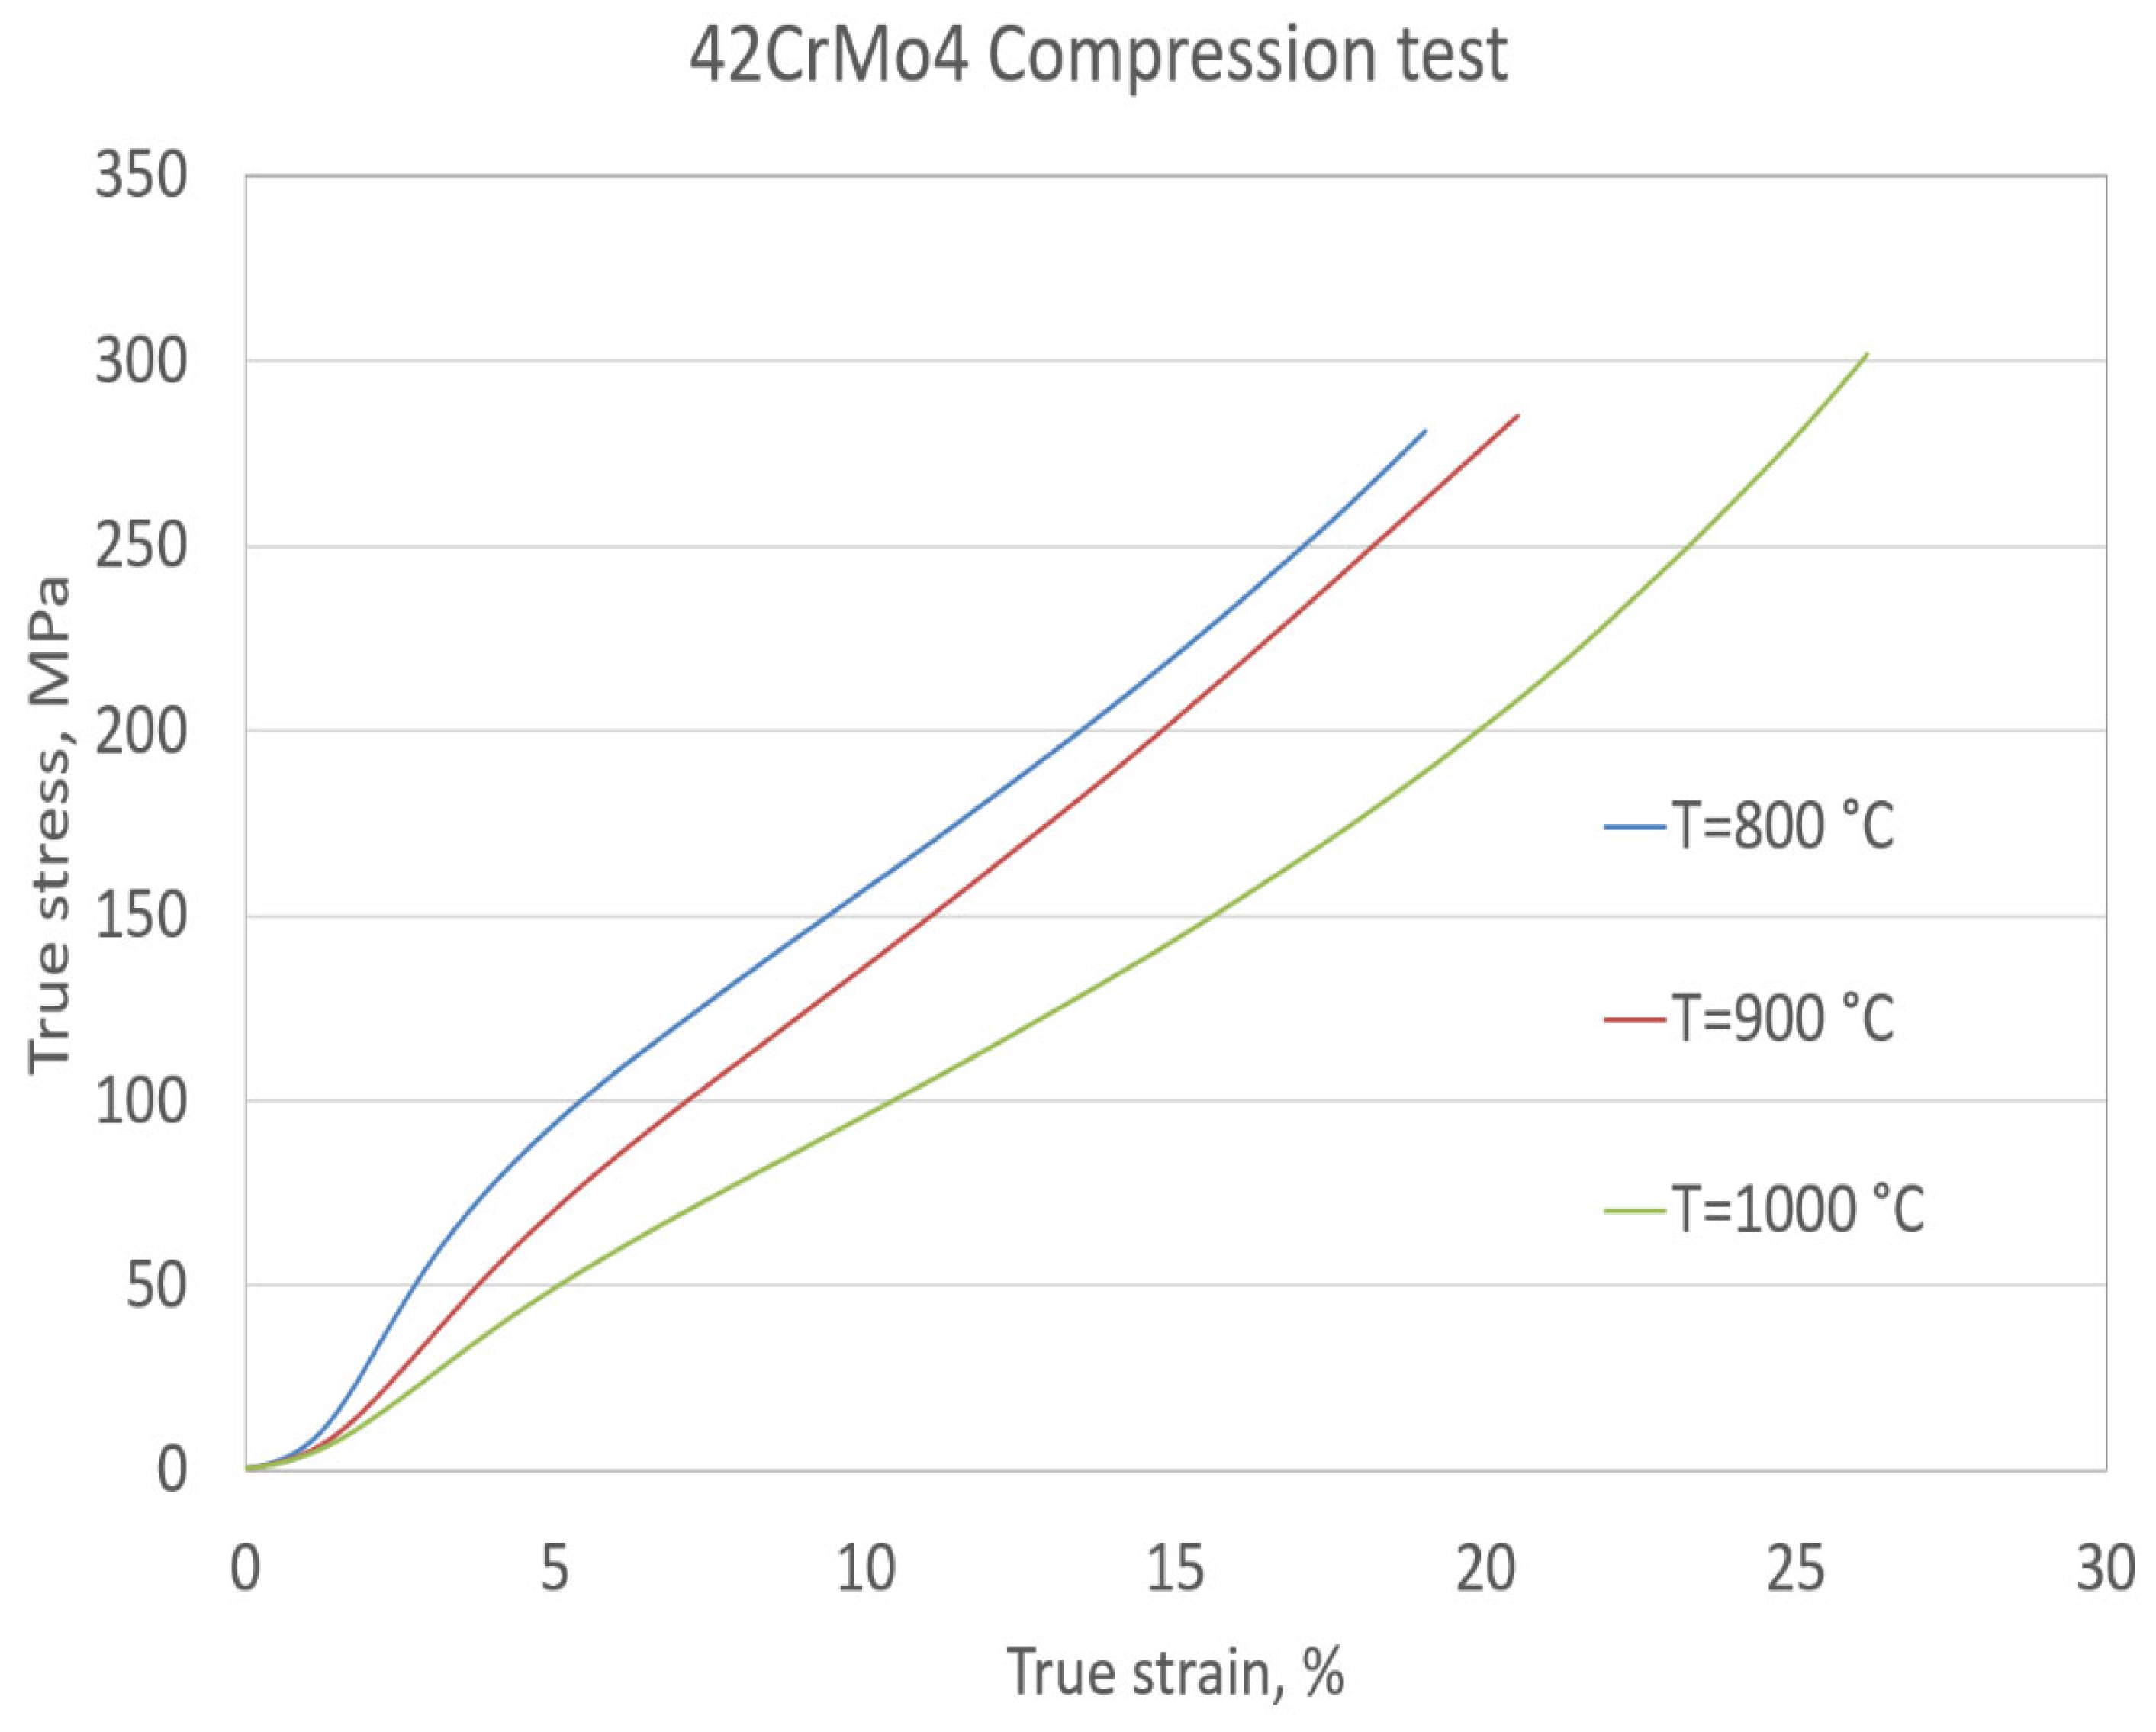
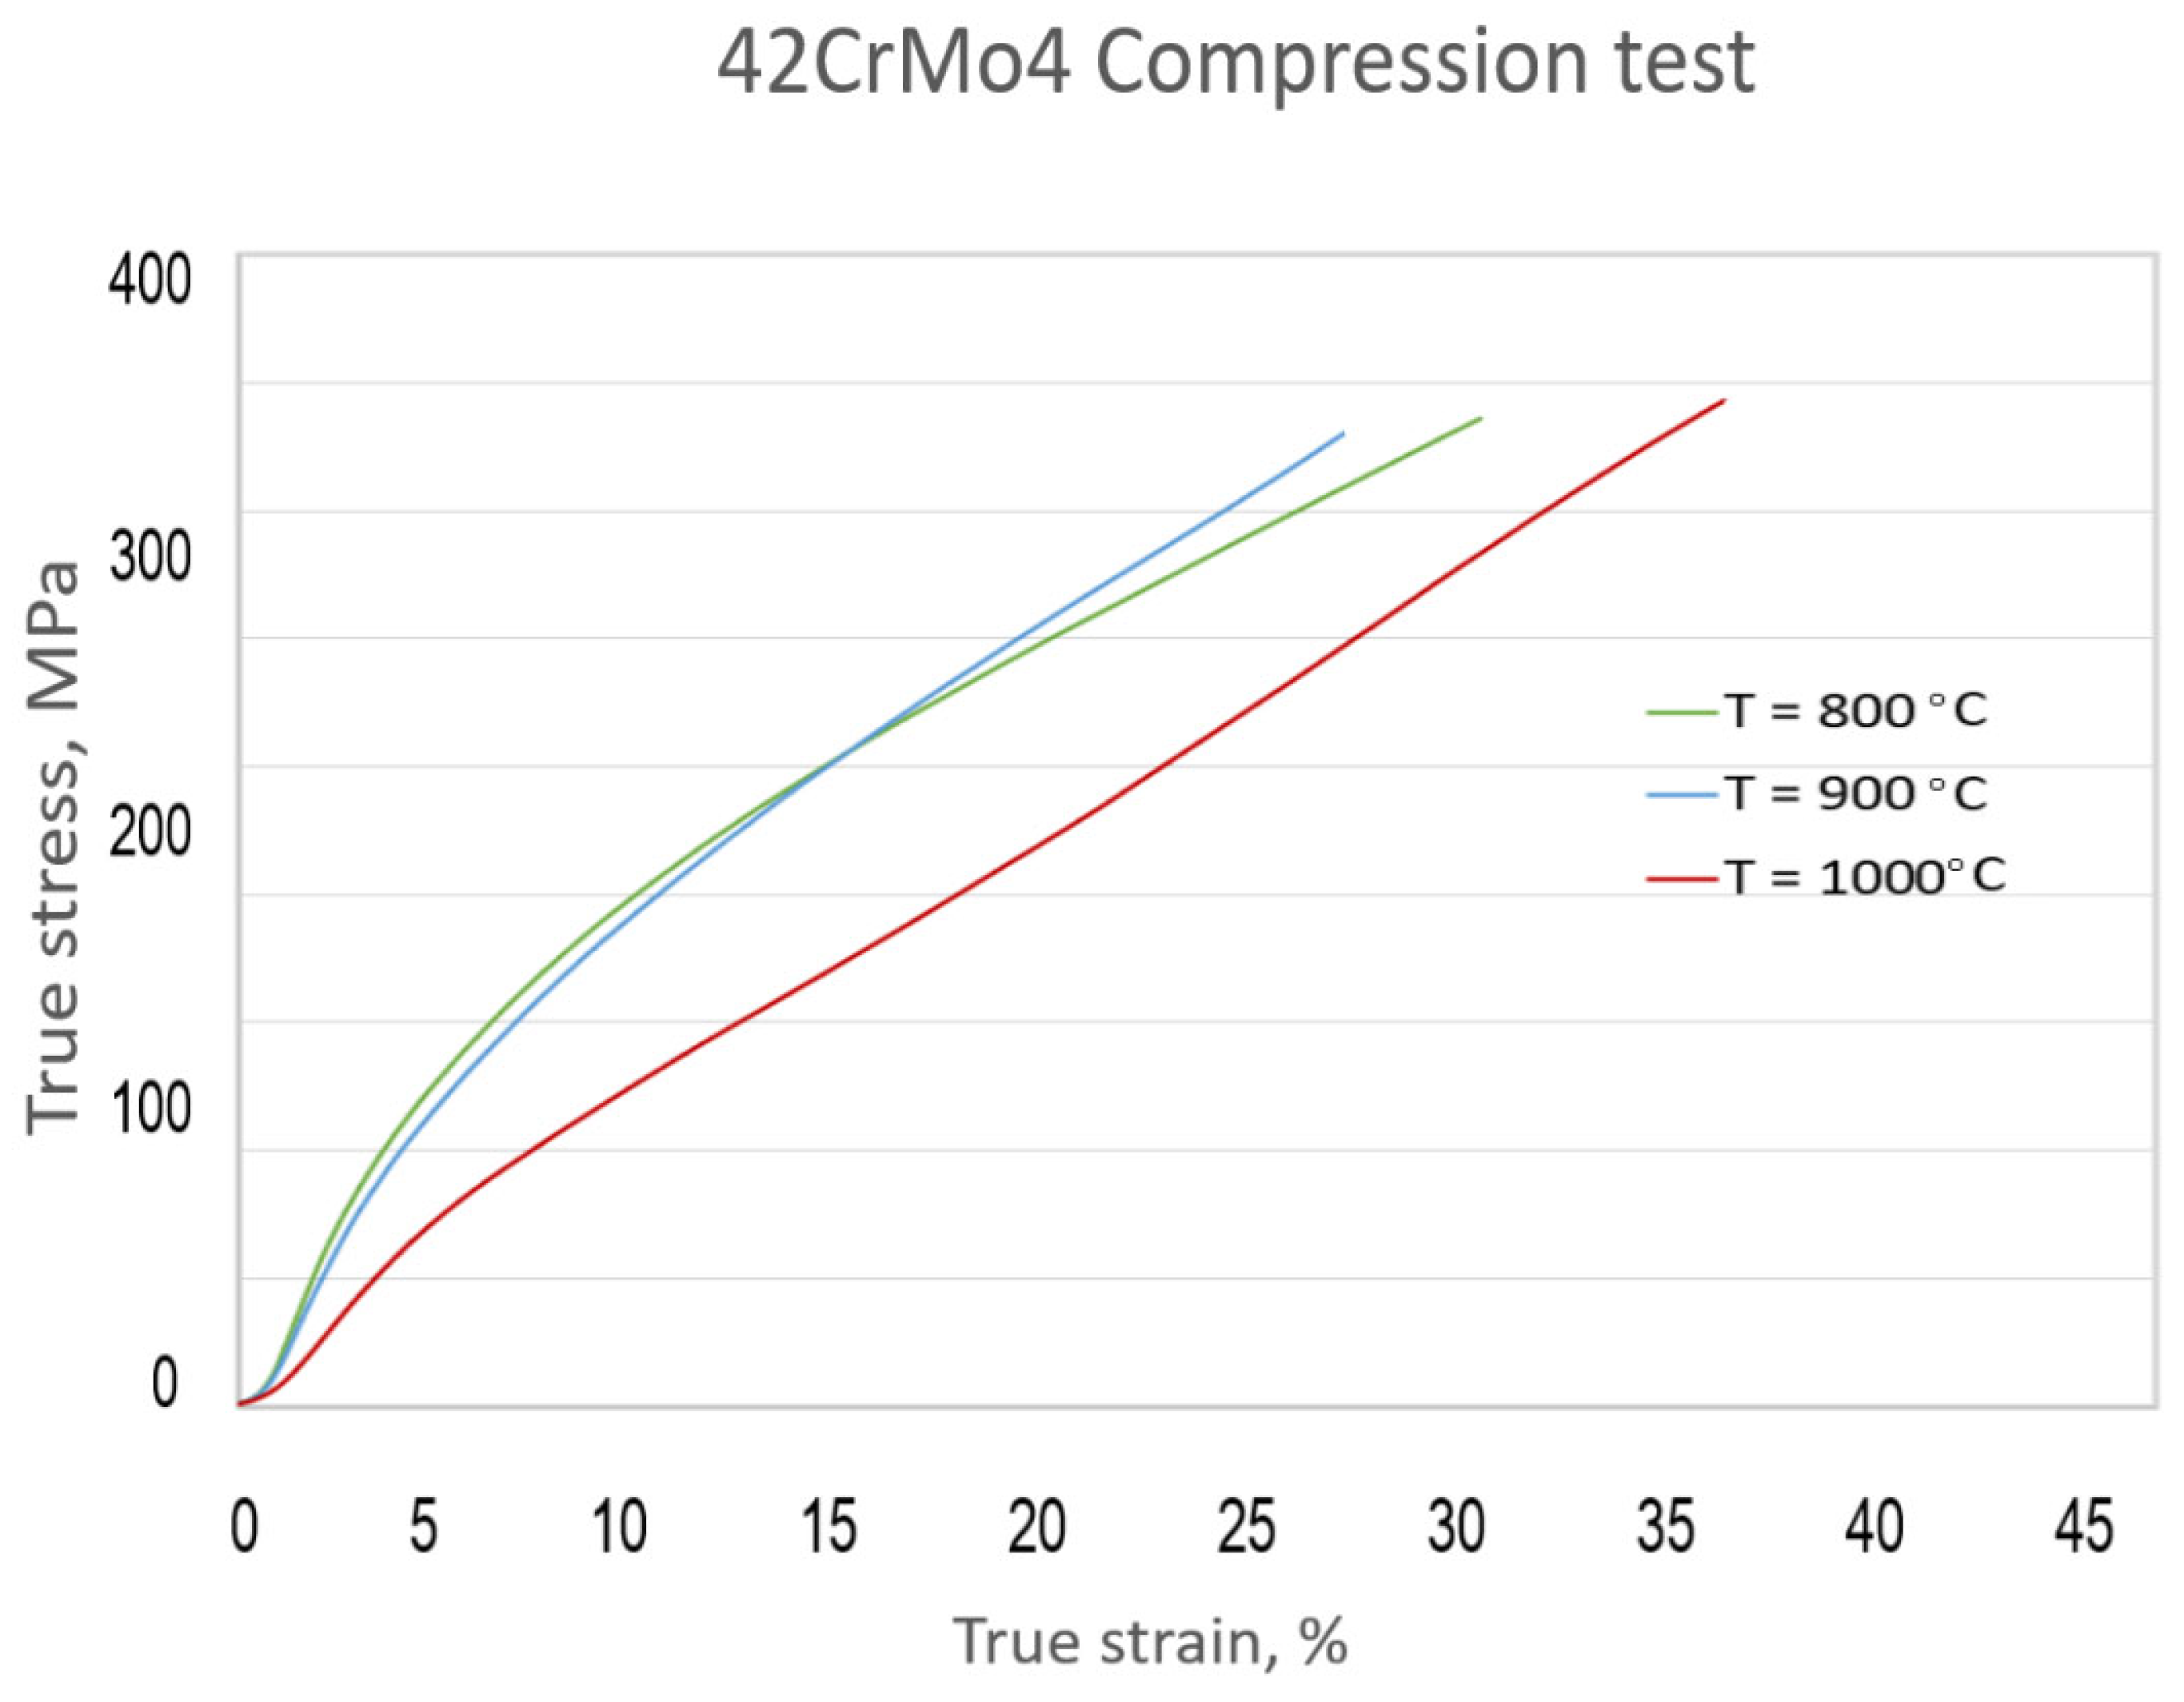
3.2. Compression Tests Behaviour

The compression test is the most general test used to study the formability of materials. Carrying out the test at high temperature raises problems related to the presence of friction on the contact surfaces and the control of the process parameters (temperature, strain rate). The values obtained by the compression test on the press at the temperatures of 800 °C, 900 °C, and 1000 °C are presented in Table 3, Table 4 and Table 5.
The shapes of the specimens resulting from the compression tests for different strain rates and different temperatures are presented in Figure 12, Figure 13 and Figure 14.
The load vs. stroke variation diagram for ε ˙ = 0 .033 s−1 strain rate is shown in Figure 15. Based on this diagram, the tensile stress–true strain diagrams were drawn.
The variation in the compression stress according to the true strain for different temperatures and strain rates is presented in Figure 16, Figure 17 and Figure 18. At a lower strain rate of 0.033 s−1 (Figure 16), an expected increase in compression stresses were obtained by increasing the true strain. When increasing the temperature from 800 °C to 1000 °C, lower values of compressing stresses for all values of strain rates were obtained. In Figure 16 (0.033 s−1), we observe a slight deviation from this rule, in the range 0–0.15 true strain.
Analysing the figures, it can be seen that once the strain rate increases, the true strain is slightly increases, but this depends on the temperature. Thus, at a temperature of 1000 °C, the higher strain of 0.46 is reached at a strain rate of 0.1 s−1. By increasing the strain rate, the compression stress decreases for the same true strain.
Figure 19 shows the variation curves for non-uniformity of deformations obtained at different values of strain rate and temperature.
In all cases, an increase in the non-uniformity of the deformation with the increase in the strain rate can be observed.

3.3. Microstructural Analysis

In order to analyse the influence of temperature and strain rate, the microstructure of the the fracture was examined by SEM.
The images from the scanning electron microscopy recorded for the tensile test specimens at different temperatures and strain rates are presented below. It was found that with the temperature increase, the formability increases too. At the same time, at a higher magnification, the ductile fracture pattern of the specimens can be observed, as seen in Figure 20, Figure 21 and Figure 22.
The low magnification SEM images (25×) show classic cup-and-cone fracture surfaces. High magnification (500×) images are shown for 700 °C (Figure 20), 900 °C (Figure 21) and 1000 °C (Figure 22). Images for different strain rates are presented in Figure 20 and Figure 22: (a,b) 0.001 s−1; (c,d) 0.012 s−1; (e,f) 0.08 s−1. At 900 °C (Figure 21), images are shown for strain rate 0.001 s−1 (a,b) and strain rate 0.08 s−1 (c,d).
Ductile fracture characterized by microvoid coalescence (MVC) in the breaking section was described in all the tensile tests performed. The broken cone-head specimen and the images at 500× magnification highlight the agglomeration of dimples in the breaking surface, where intergranular fracture occurs. All the fracture surfaces are covered with distinct elongated dimples which indicate the ductile nature of the material under these deformation conditions.
A detached embrittlement mechanism is a transgranular fracture in the peripheral region [44] extending from the front of the notch, with detached development along the propagation path of a crack that likely goes through the matrix lattice only (MLD).
The material tested at 700 °C had a higher tenacity. Grain boundaries break at high forces due to incompletely transformed structural constituents. The material has ductile behaviour at high temperatures, due to complete structural transformations that allow a greater reduction in the section.
As the strain rate increases, the ductility increases, but if the fracture aspect is analysed, there is not a large variation. For the three used conditions, the size of the grains decreases as the strain increases. The fracture dimples are reduced as the strain increases.
When increasing the temperature towards 900 °C, the aspect of the fracture changes considerably compared with 700 °C, as can be seen from Figure 21.
For the samples heated at 1000 °C, the shape of the fracture surfaces indicates a ductile fracture mechanism, as presented in Figure 22 for different strain rates. The fractures occurred perpendicular to the stress direction, and seem to be intergranular, as the surface morphology indicates. Compared with the 900 °C samples, at 1000 °C, cracks are visible on the fractured surface. At the very high strain, the fracture is on a very small surface, and is promoted by oxide formation, as the bright areas indicate.
An advanced detached embrittlement is present in the peripheral region at a temperature of 1000 °C under conditions of low strain rate (0.001 s−1).
During deformation at high temperatures, microscopic cavities appear at the grain boundaries, the phenomenon of cavitation. In some situations, the presence of this phenomenon can determine the occurrence of a premature fracture in the material at a much lower strain than would occur in the case of a controlled flow-localization. The strain rate and deformation temperature influence the degree of cavitation. The presence of tensile stress also favours the appearance of the cavity phenomenon.
The microstructures after the compression tests for different deformation conditions are presented in Figure 23. The SEM images show the microstructure in the longitudinal direction of the specimens in Figure 12, Figure 13 and Figure 14 that were subjected to compression.
Following the microscopic analysis, it was observed that after hot plastic deformation by compression, the structural constituents resulting from cooling in the air from the deformation temperature were of the ferrite-pearlitic type (very fine pearlite), as seen in Figure 23b,d,f–h), as well as of the bainitic type. In comparison, for the specimen deformed at room temperature (Figure 23a), the structure is ferrite-pearlitic type, and in the case of ferrite, which appears light in colour, there is a more pronounced elongation perpendicular to the direction of compression.
In the case of a compression test, the cavitation phenomenon is not observed. The microscopic cavities produced during the tensile stress can be removed by a subsequent compression stress. In the case of hot processing, the cavities can lead to the appearance of premature failures during deformation, and they can also result in inferior properties in the final part.
During scanning electron microscope analysis of the surface, many lamellas on the fracture surface were found. These lamellas indicate bainitic structures (Figure 23c,e–j). In Figure 23j, the structure is predominantly bainitic-pearlitic type, grey and darkly coloured.
The nucleation, growth and coalescence of the cavity are the main stages of the cavitation phenomenon, which most often overlap during tensile stress. The possible nucleation mechanisms are the intersection of intergranular boundaries with non-deformable secondary phase particles or grain boundaries, the sliding of grains along their boundaries, and the agglomeration of holidays at the borders between grants [48,49].
Diffusive growth and plasticity-controlled growth are the mechanisms of cavity growth. When the size of the cavity is very small, diffusive growth predominates. With the increase in the size of the cavity, the growth in diffusion decreases very quickly and the growth mechanism through the plastic flow of the surrounding matrix becomes predominant [48,50].
The interconnection of the neighbouring cavities determines the coalescence of the cavity. This is greatly influenced by the sensitivity of the material to the speed of deformation. It can be produced in longitudinal or transverse directions in the studied material. Transverse direction coalescence is more important and can lead to fracture.
Figure 23 shows the microstructure of 42CrMo4 steel compressed at temperatures ranging from 800 °C to 1000 °C at strain rates of 0.1, 0.03, and 0.06 s−1. It shows that temperature has a significant effect on DRX and grain size during hot deformation. The critical strain for recrystallization increases with the strain rate and with decreasing deformation temperature. At 800 °C, the original grains are elongated, and many grains and obvious bulging are irregularly arranged at the edge of the elongated grains. As the temperature rises to 900 °C, the initial grain structure is gradually engulfed, complete dynamic recrystallization occurs throughout the entire microstructure, and the grains are equiaxed, as shown in Figure 23e,f,g. As the temperature rises, the free energy of the system also rises, causing the nucleation rate of dynamic recrystallization to rise. With the increase in temperature from 900 °C to 1000 °C, the average recrystallization grain size is increased. This indicates that the grain size gradually increases with the increase in deformation temperature. The grain size decreases as the strain rate increases to 0,1 s-1, indicating that an accelerating strain rate inhibits the DRX process. At higher strain rates, the heat generated by plastic deformation cannot be released in time, which leads to the local temperature rising and promotes the dynamic recrystallization process.
When analysing the microstructures of specimens deformed at different temperatures with different strain rates, in addition to the presence of pearlite and ferrite that are arranged in a network, in the case of specimens deformed at 800 °C and 900 °C, the presence of formations that have the appearance of upper bainite can be observed.
The working temperatures were chosen in the austenitic range, which according to the specialized literature, is >700 °C. In the temperature range of 700–800 °C, the structure of 42CrMo4 steel changes from BCC to FCC, which explains the change in the curves in Figure 17. In this temperature range, the microstructure is incompletely transformed and of the ferrite-pearlitic type, while above this temperature, the transformation is complete. In the microstructures obtained at a temperature of 700 °C, the transformations were most likely incomplete, and after cooling, a ferrite with bainite was obtained, as well as martensitic microstructures. In the microstructures obtained at a temperature of 800 °C, a complete transformation could be observed, and after cooling, the structure obtained was of martensitic type with traces of ferrite-pearlitic and bainite microstructures due to cooling. At temperatures of 900 and 1000 °C, a complete transformation occurred, and the structure obtained after cooling was of martensitic type with traces of ferrite pearlitic.

4. Conclusions

Following the tests, the influences of different parameters of the deformation process (temperature, strain rate, state of stress) on the formability of the 42CrMo4 alloy were studied. The deformation conditions were temperature (700 °C, 800 °C, 900 °C, 1000 °C) and different strain rates at the two stress states: tensile (0.001833 s−1, 0.012833 s−1, 0.089722 s−1) and compression (0.033 s−1, 0.066 s−1, 0.1 s−1).
As a result of these experimental tests, the following was observed:
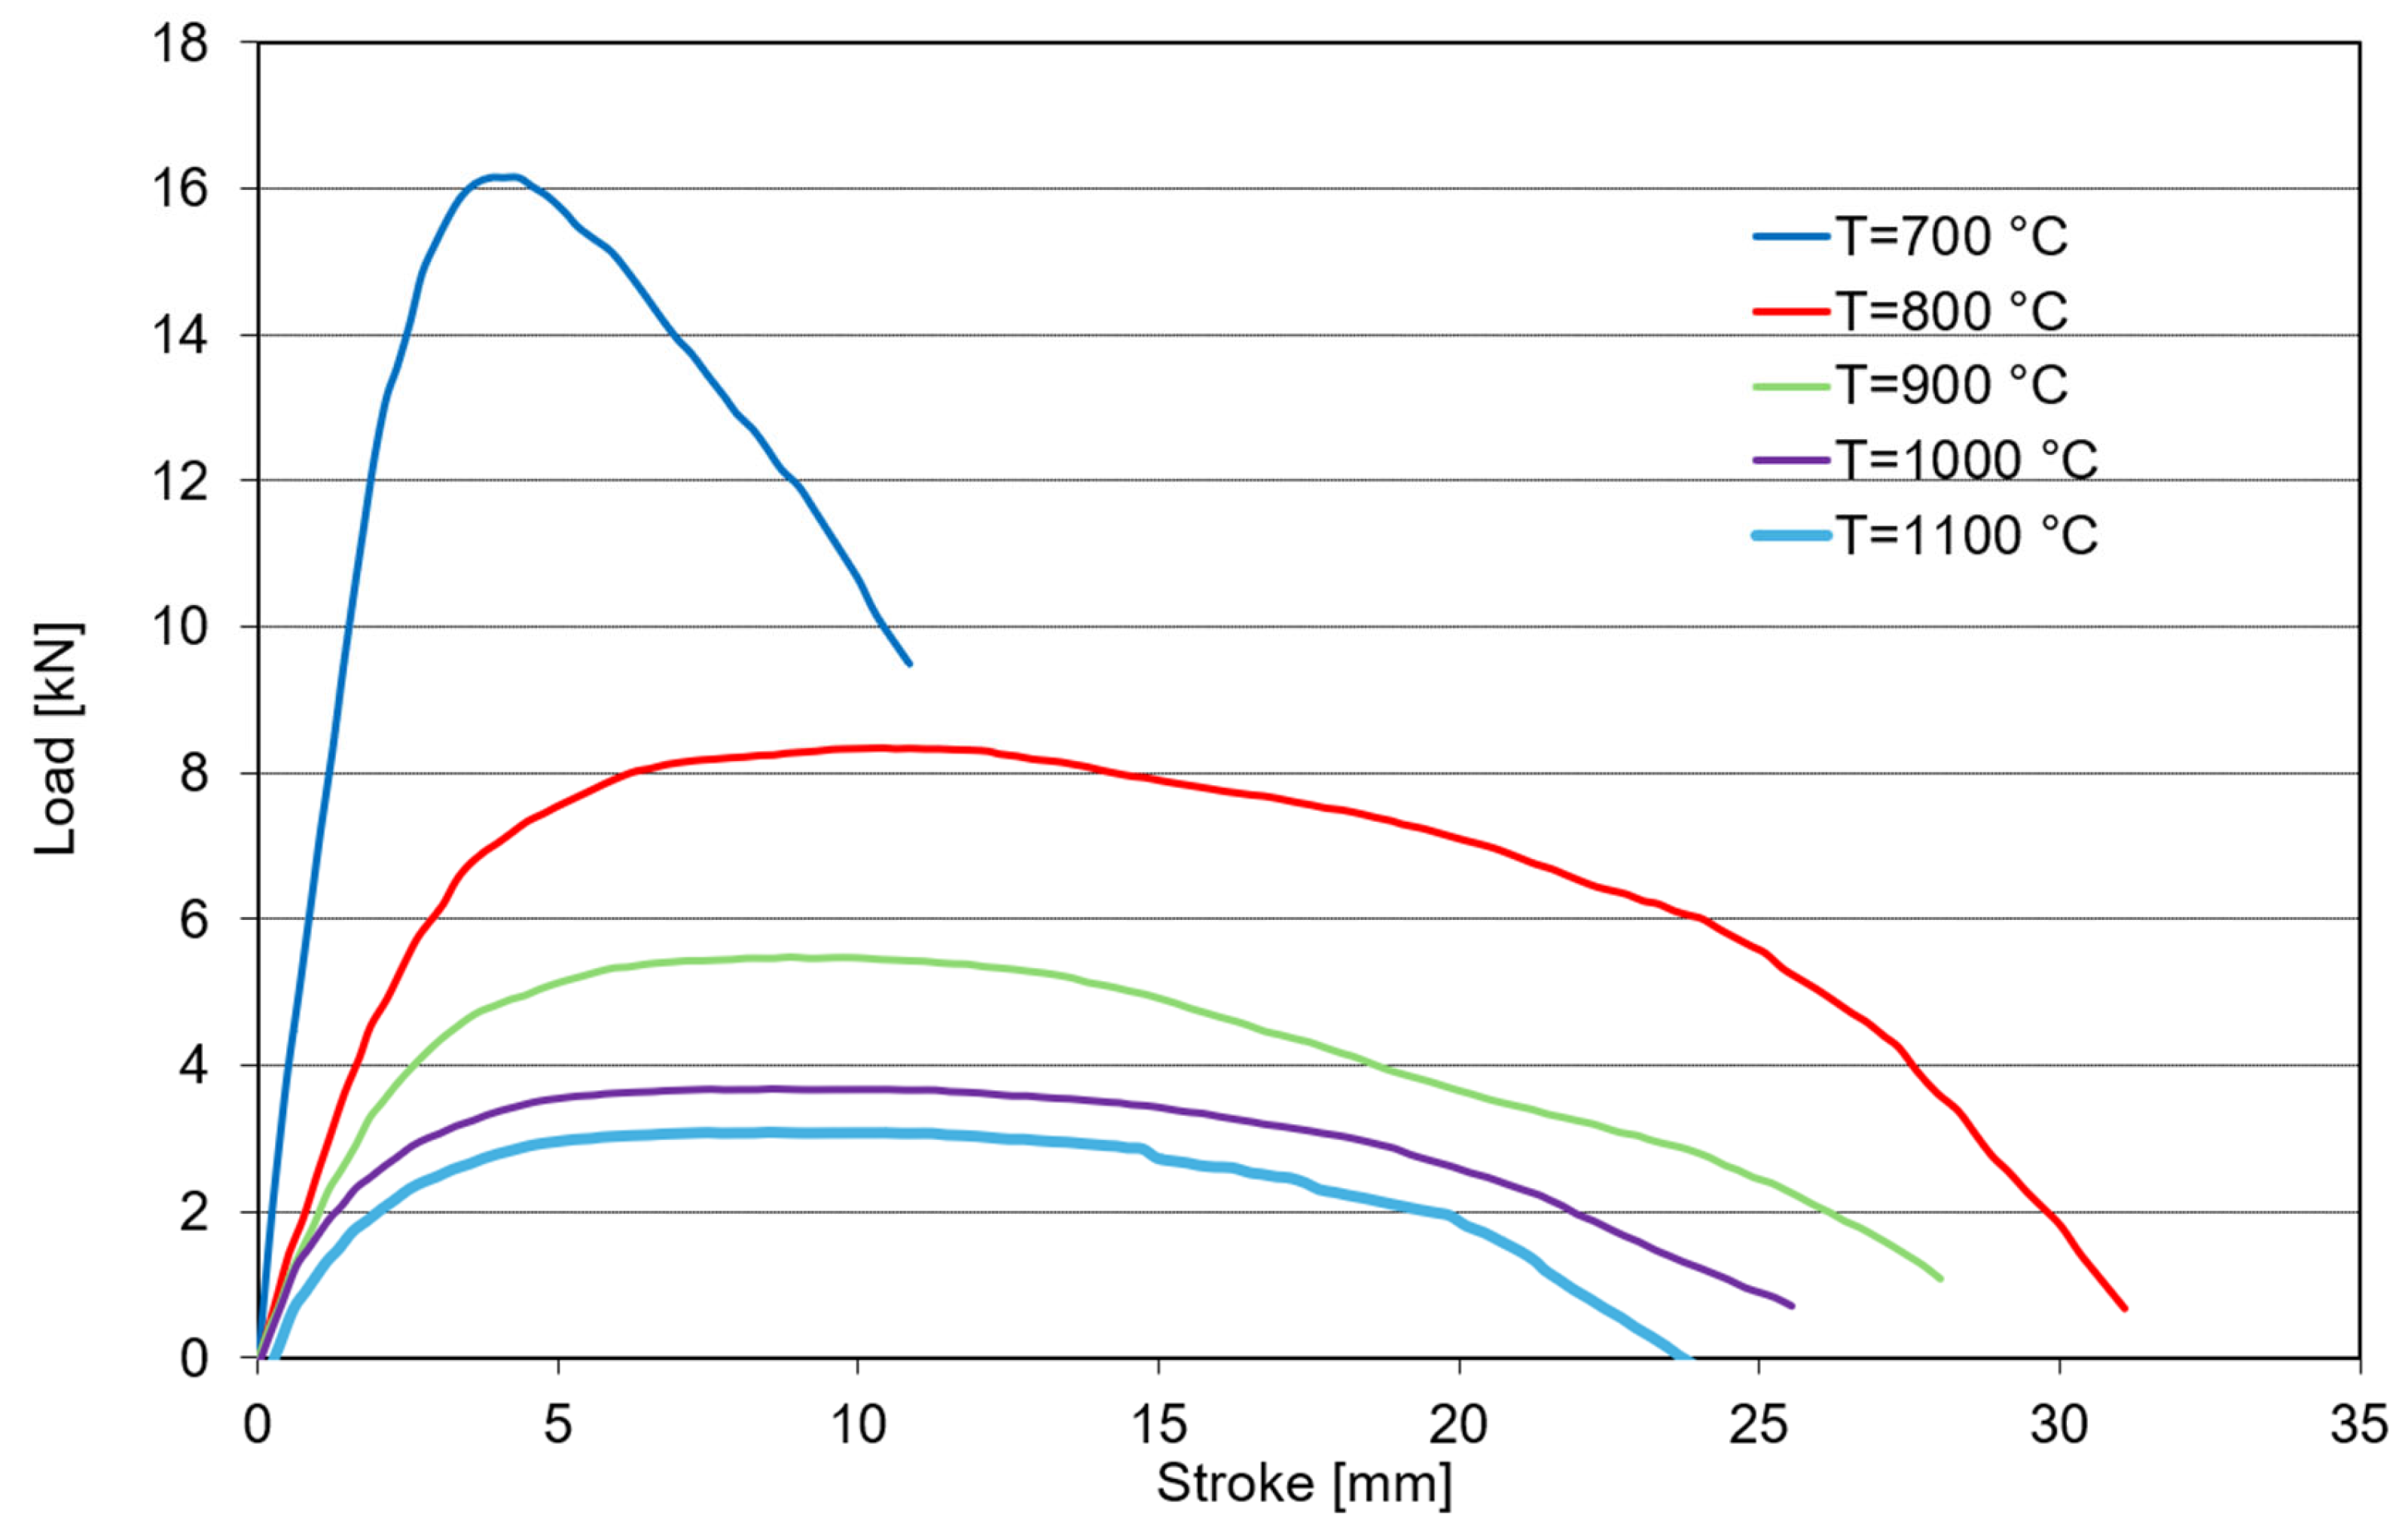
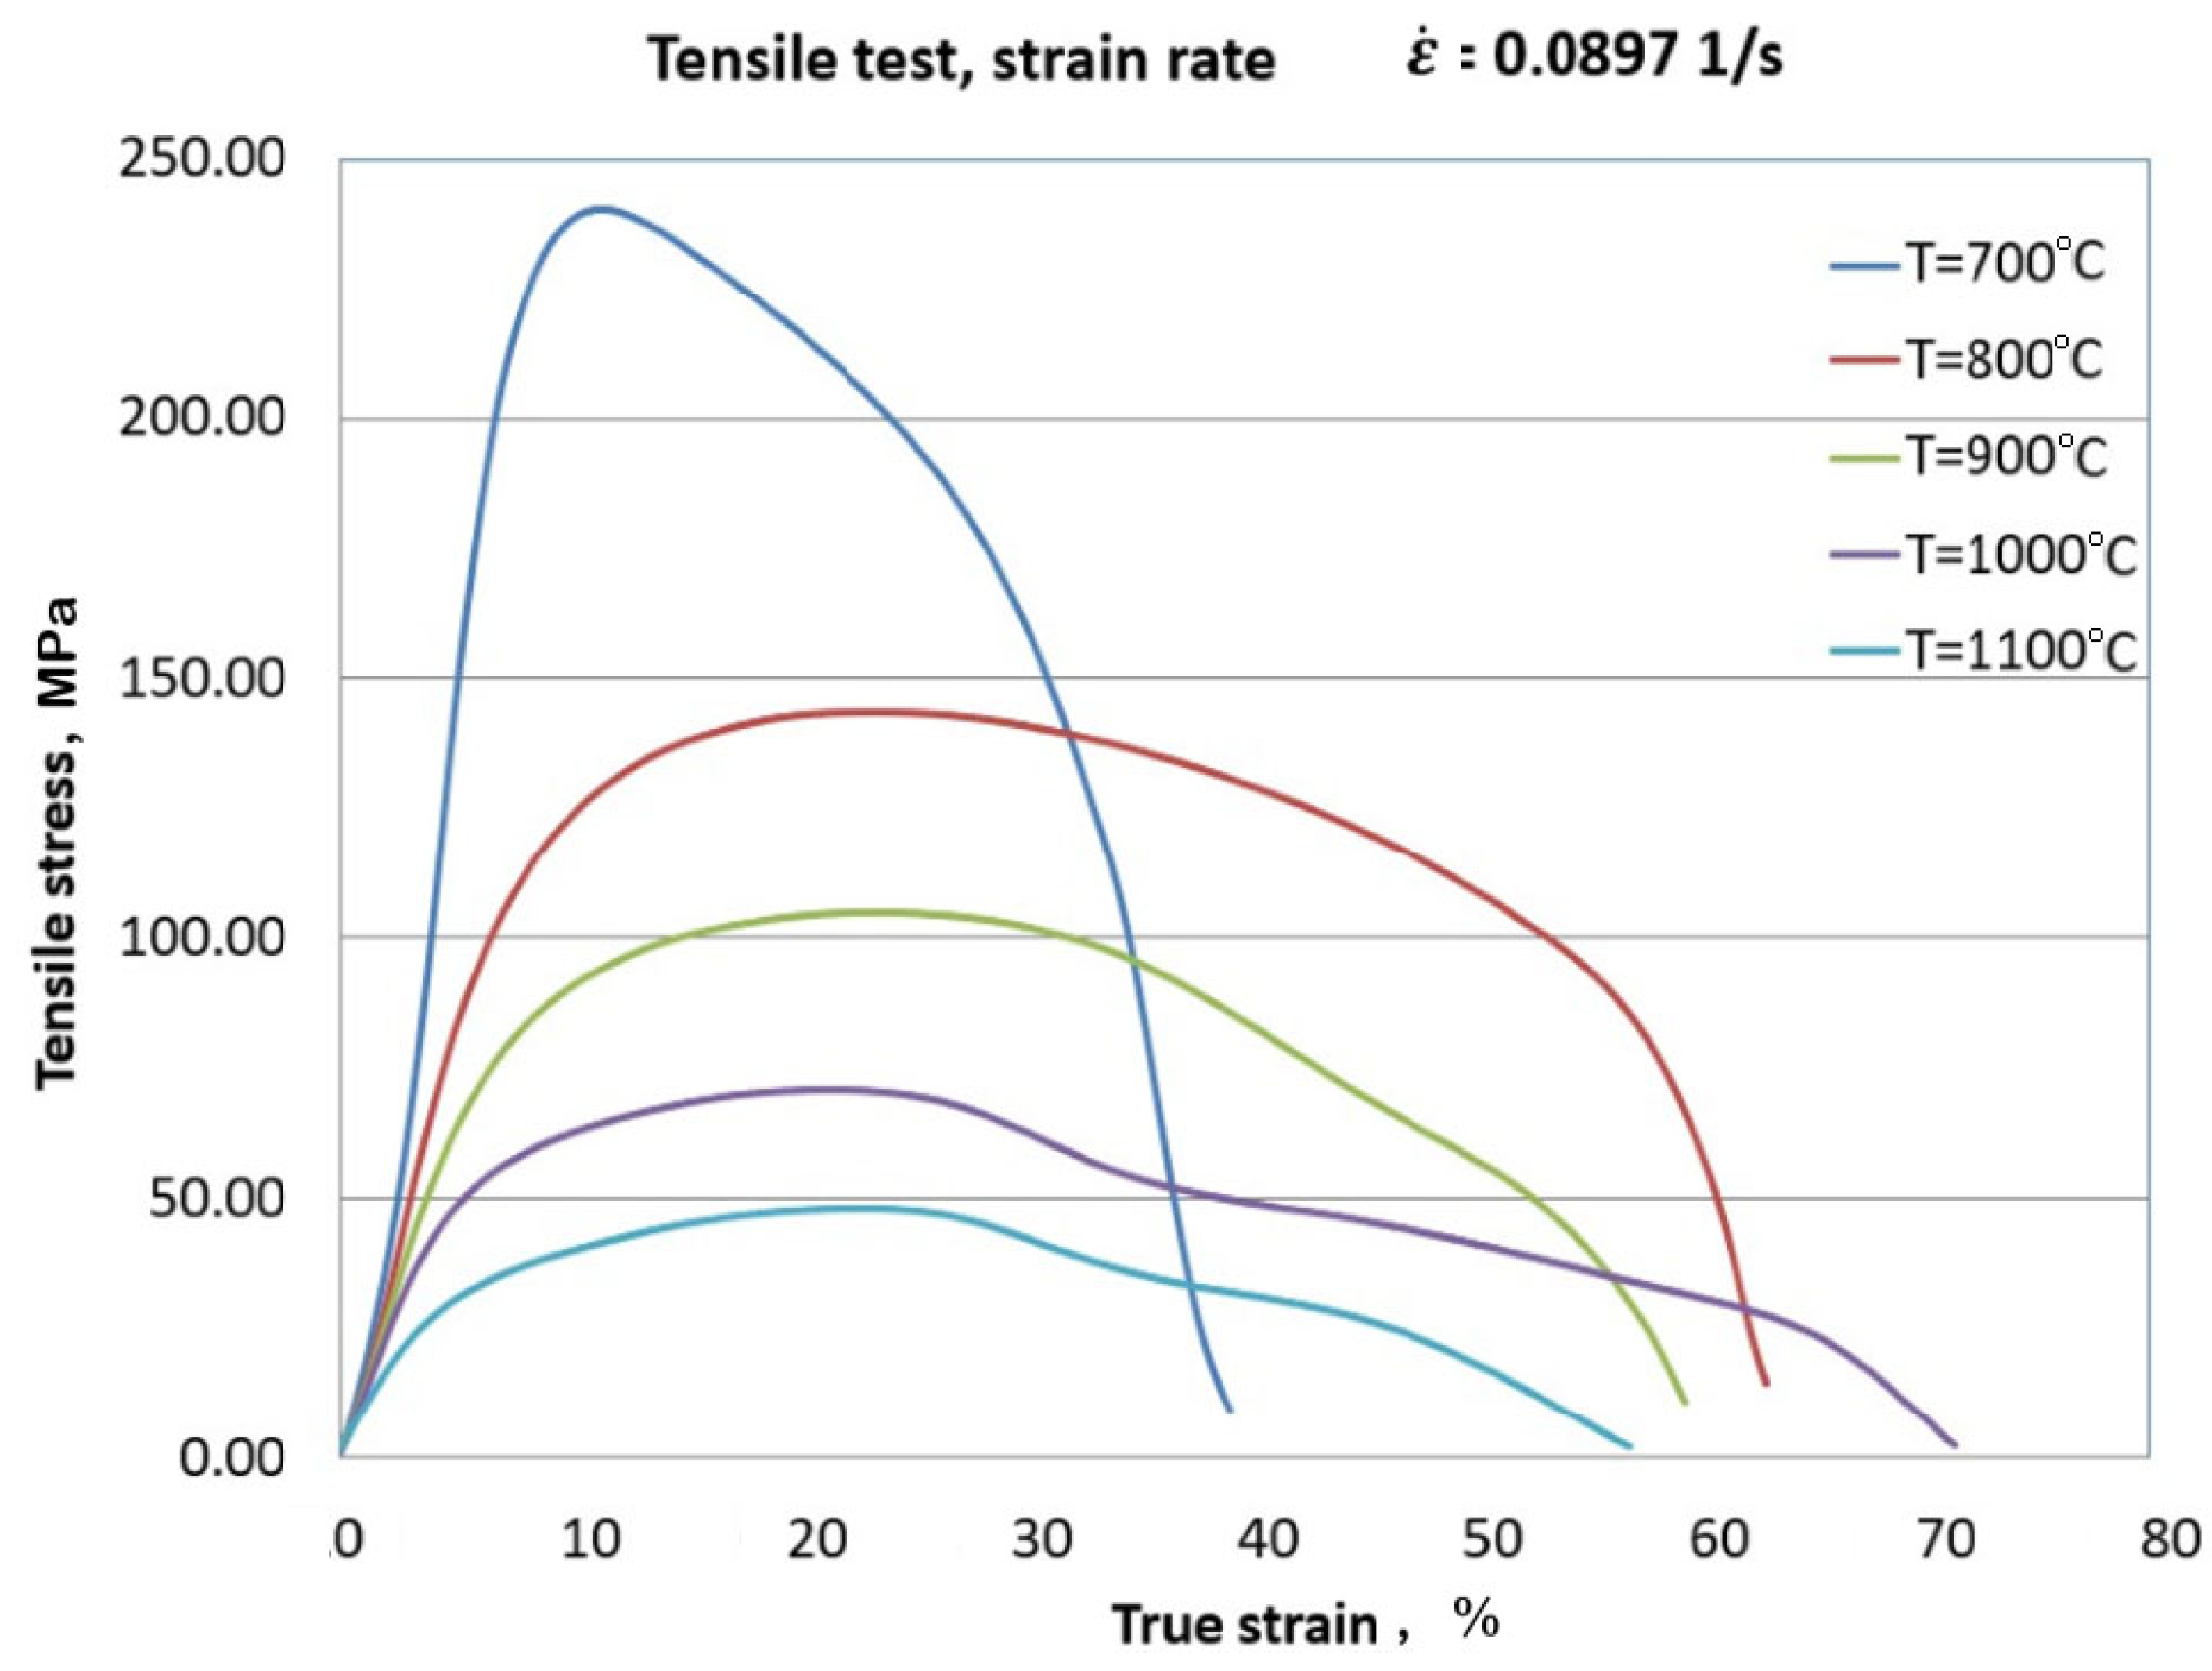
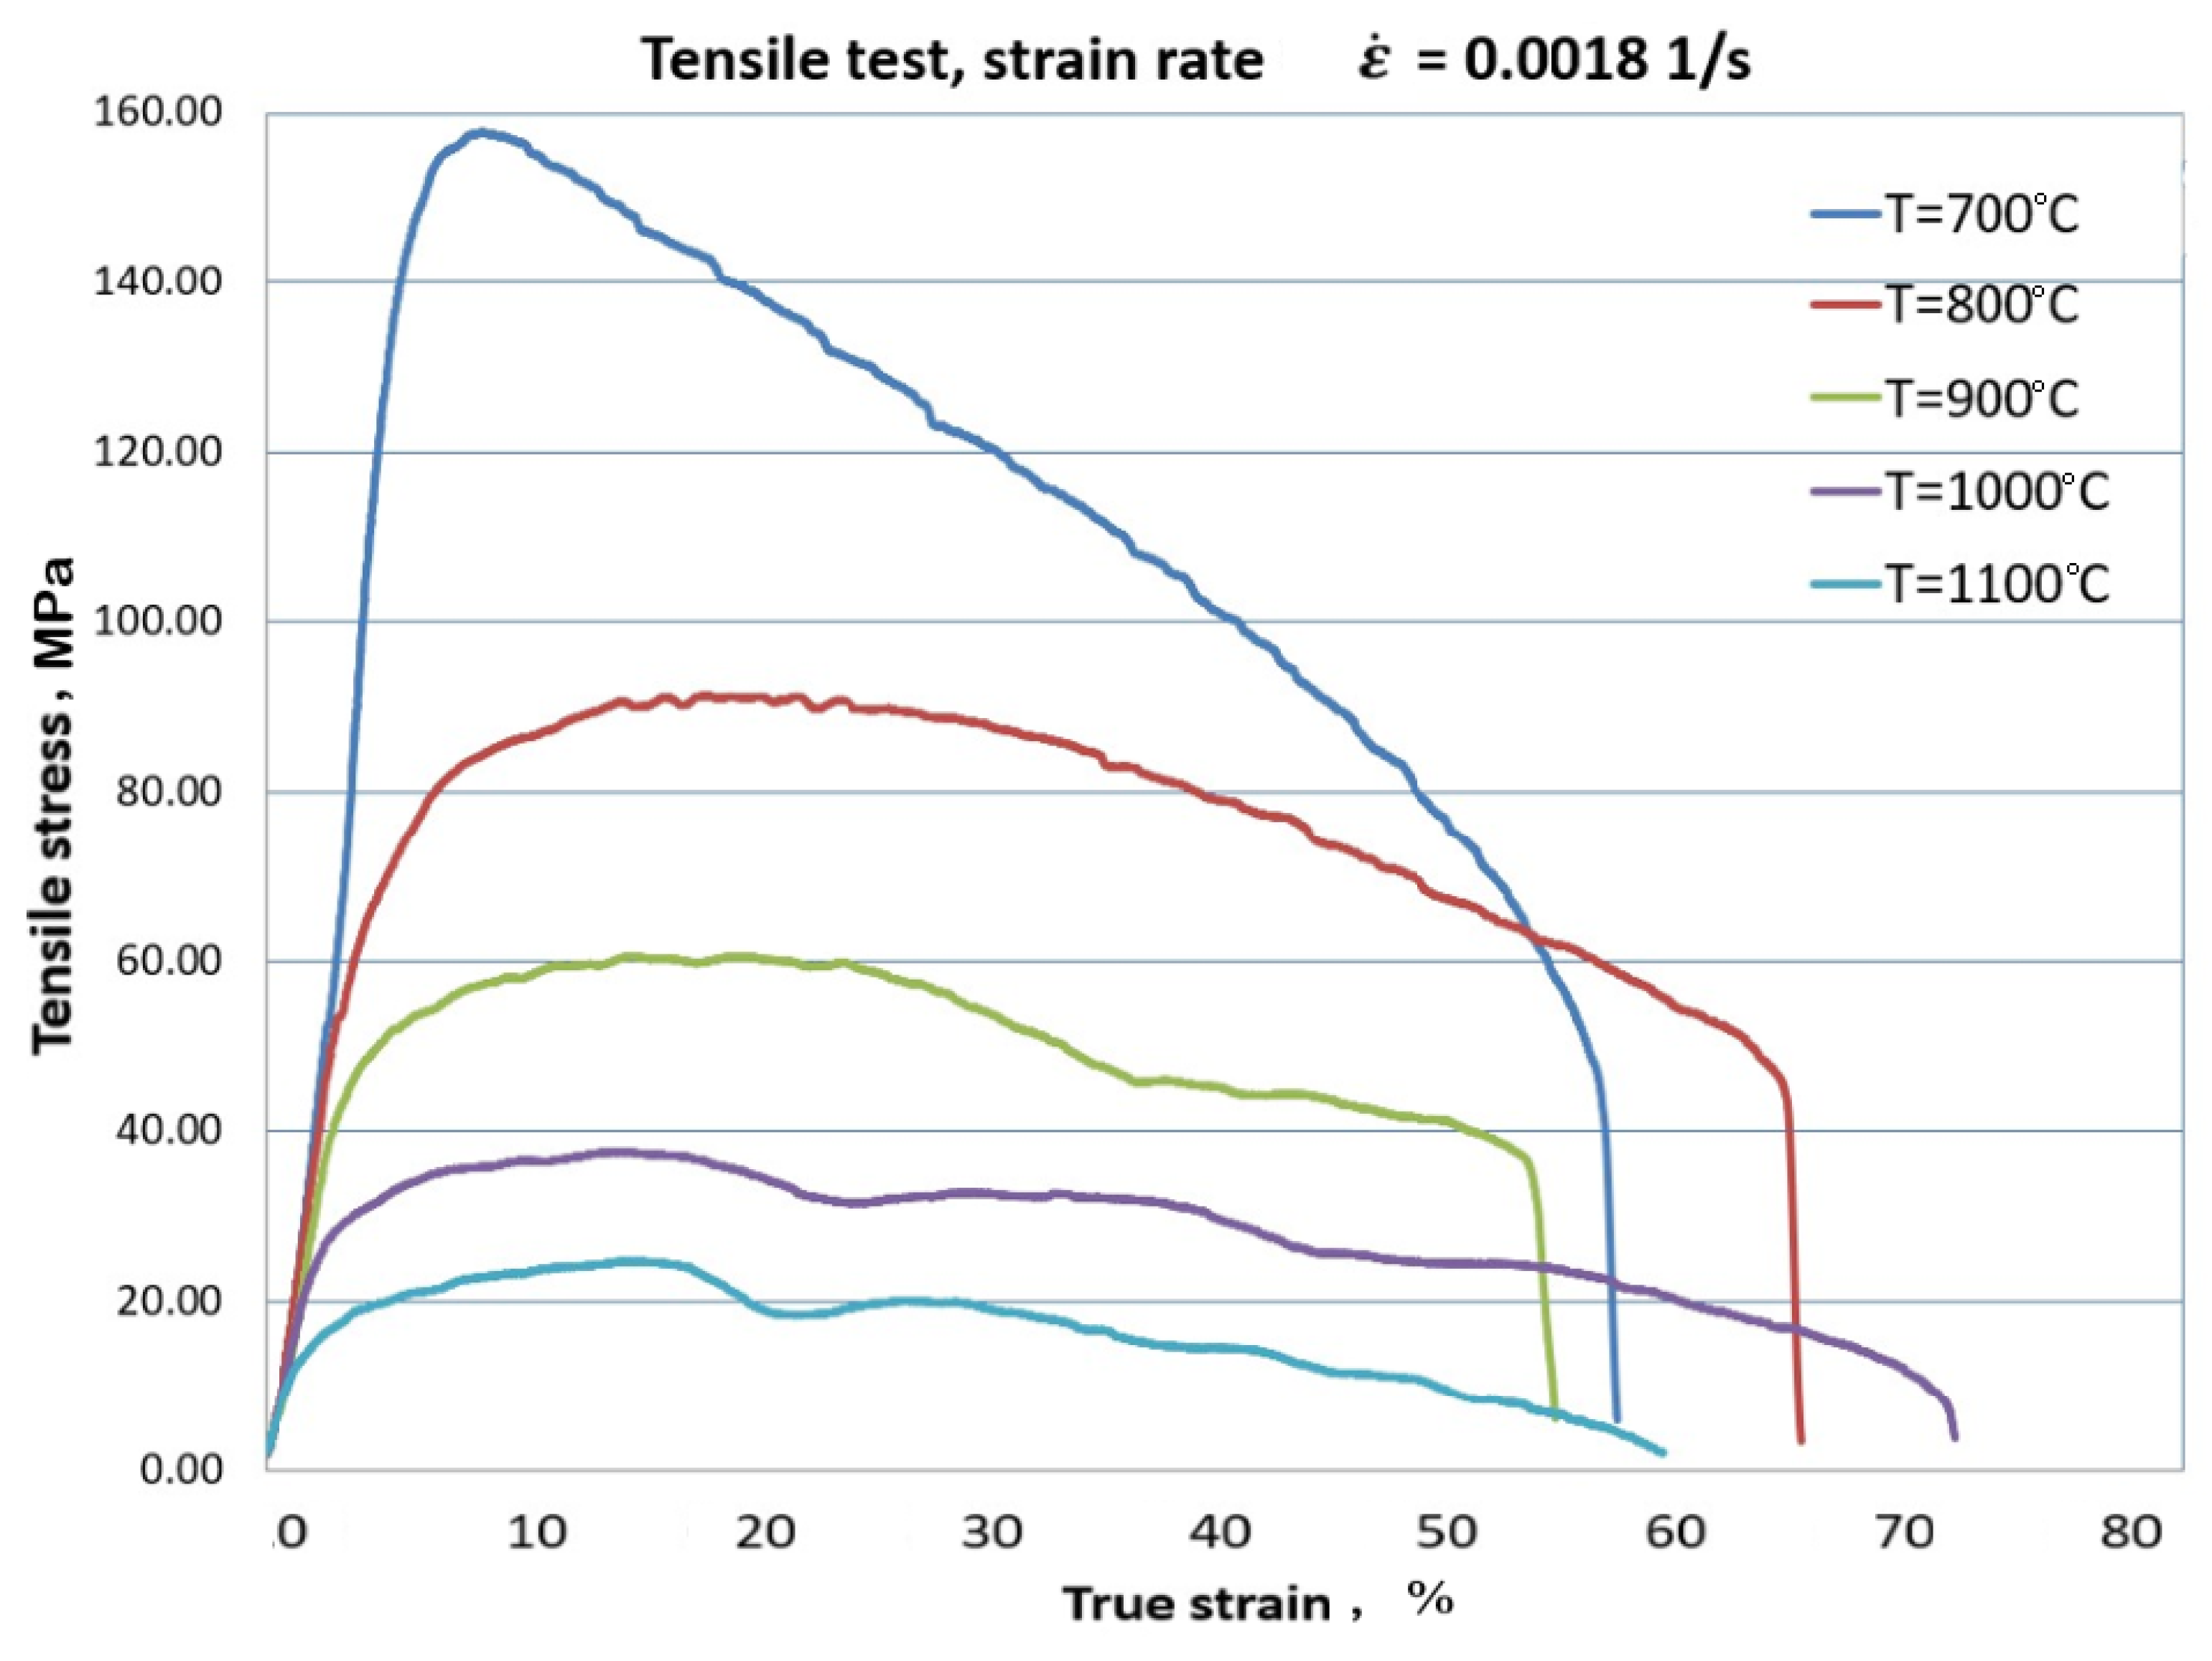
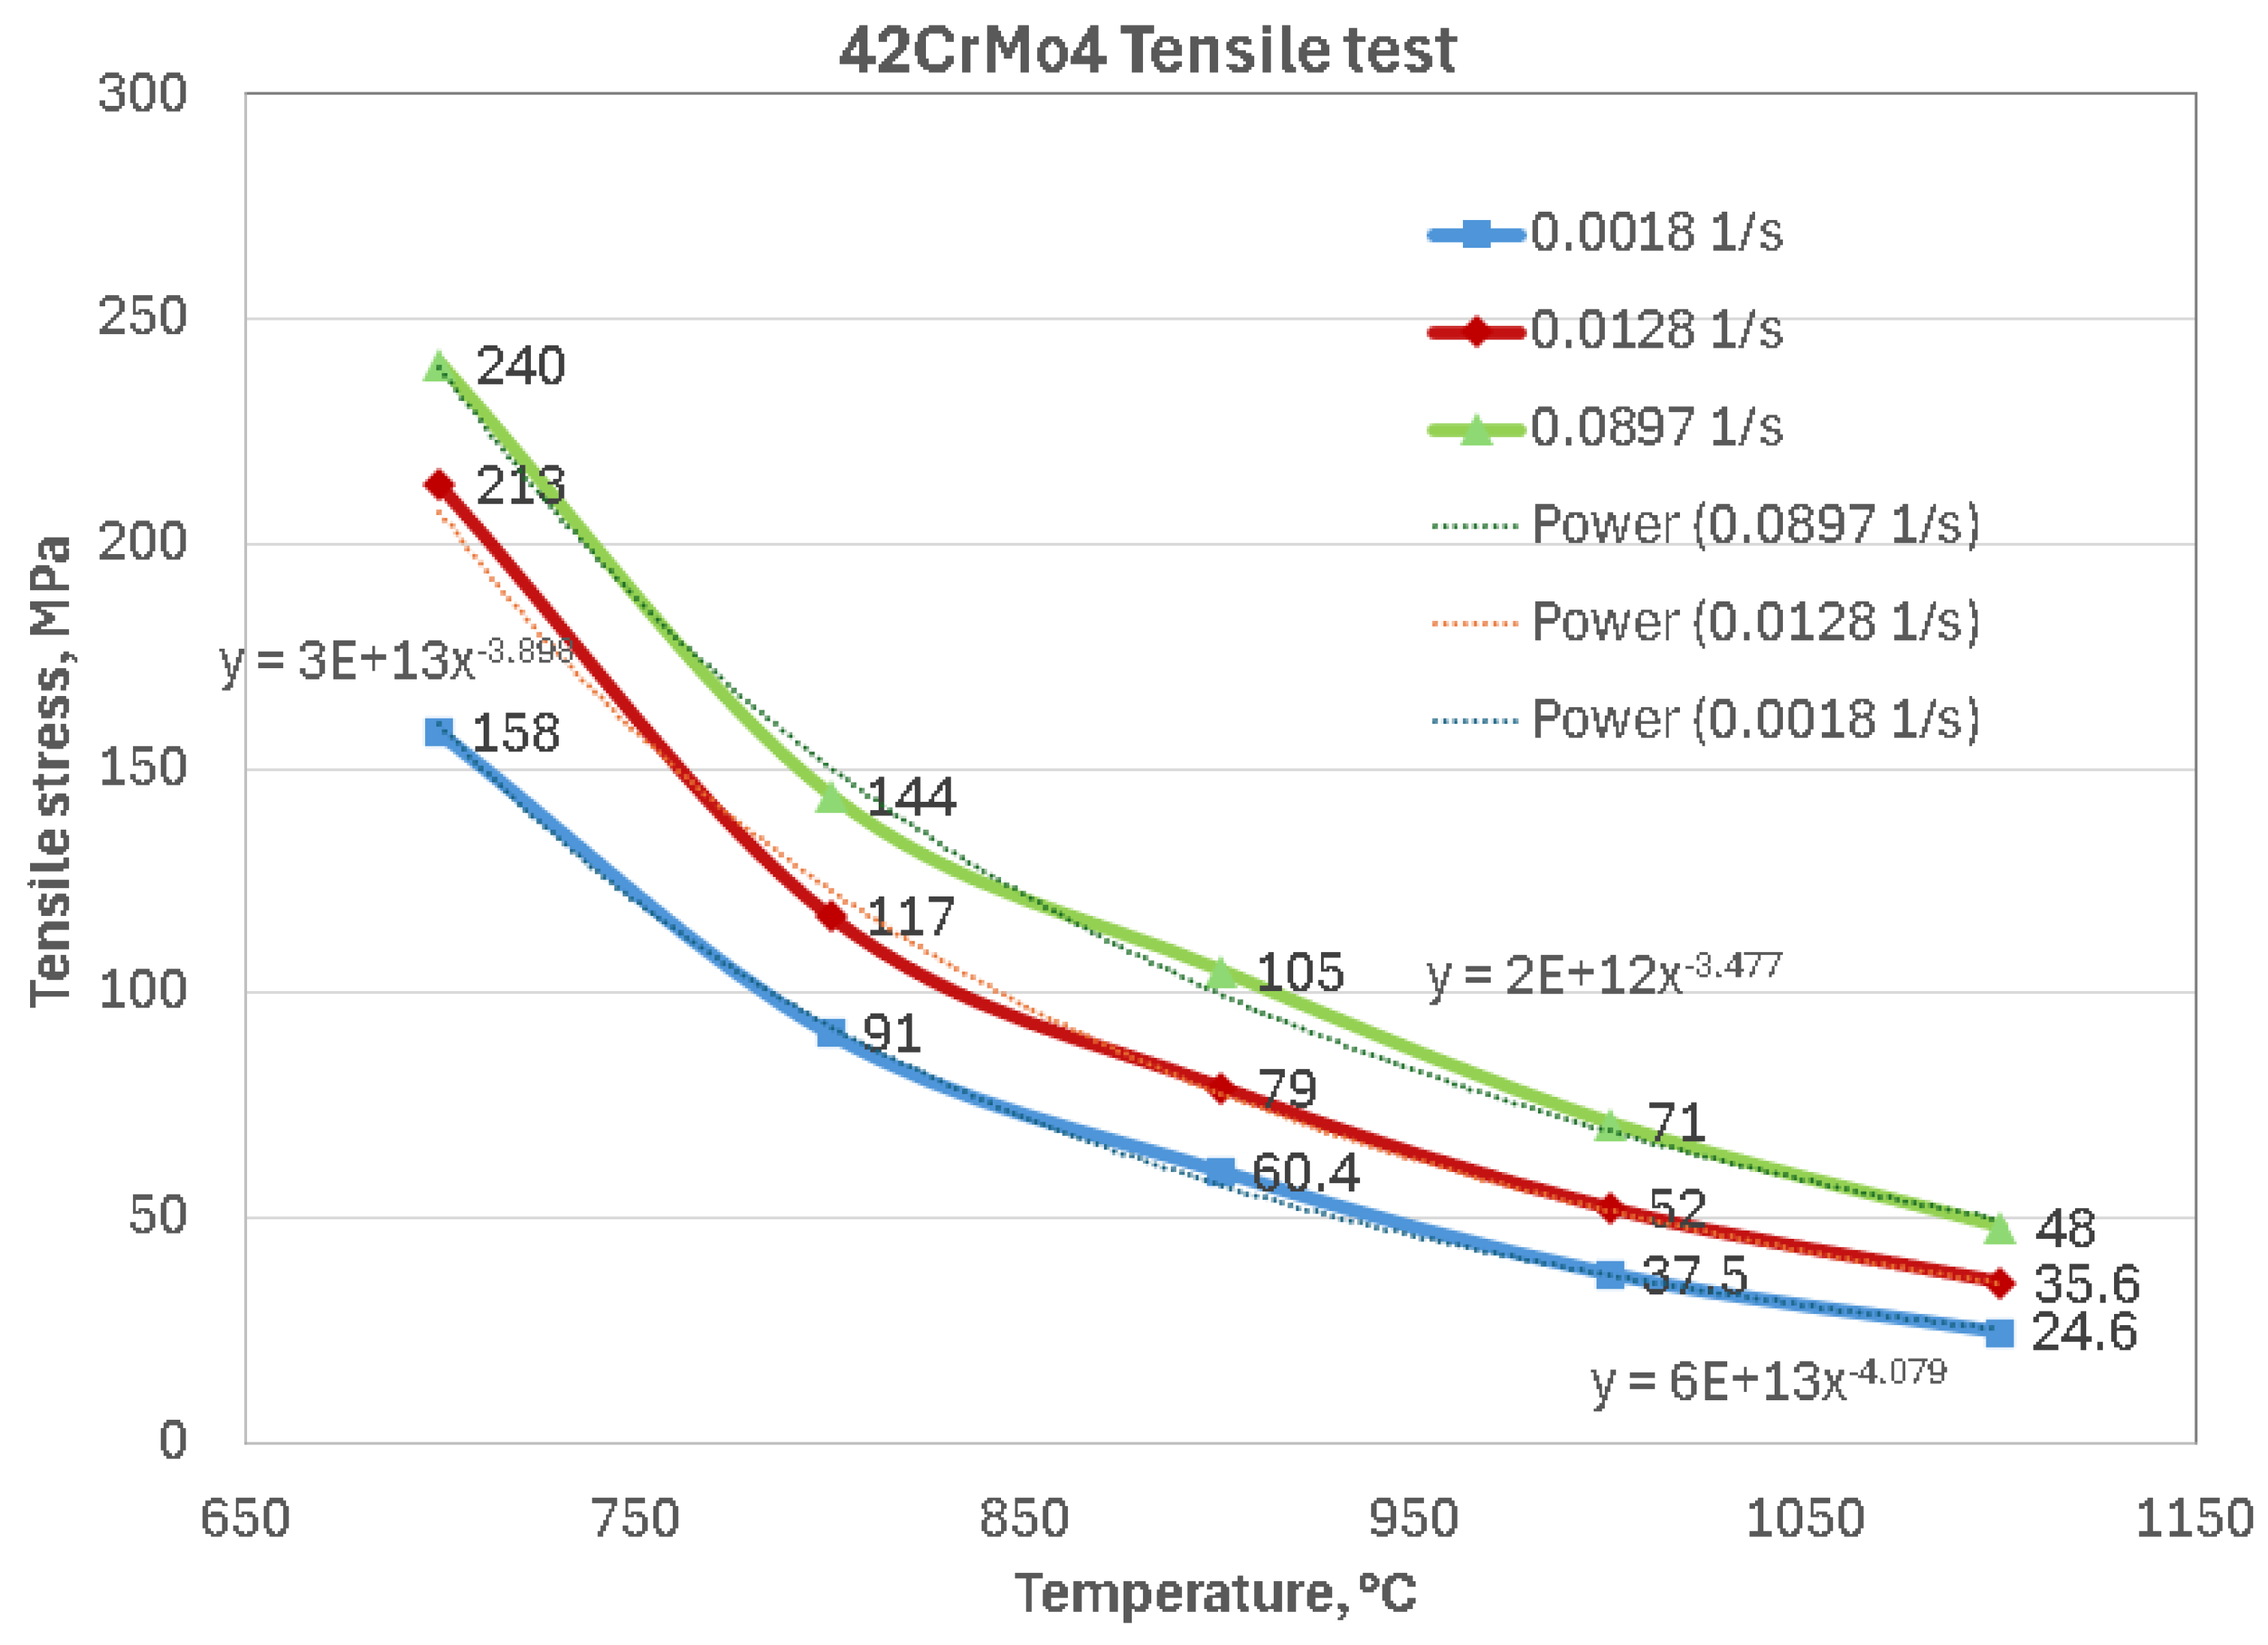
  • Tensile stress significantly depends on temperature and strain rate. Yield stress increases with increasing strain rate and decreases with increasing temperature. As can be seen from Figure 10, the maximum tensile stress value is 240 MPa at the maximum strain rate of 0.0897 s−1, 213 MPa at 0.0128 s−1, and 158 MPa at 0.0018 s−1.
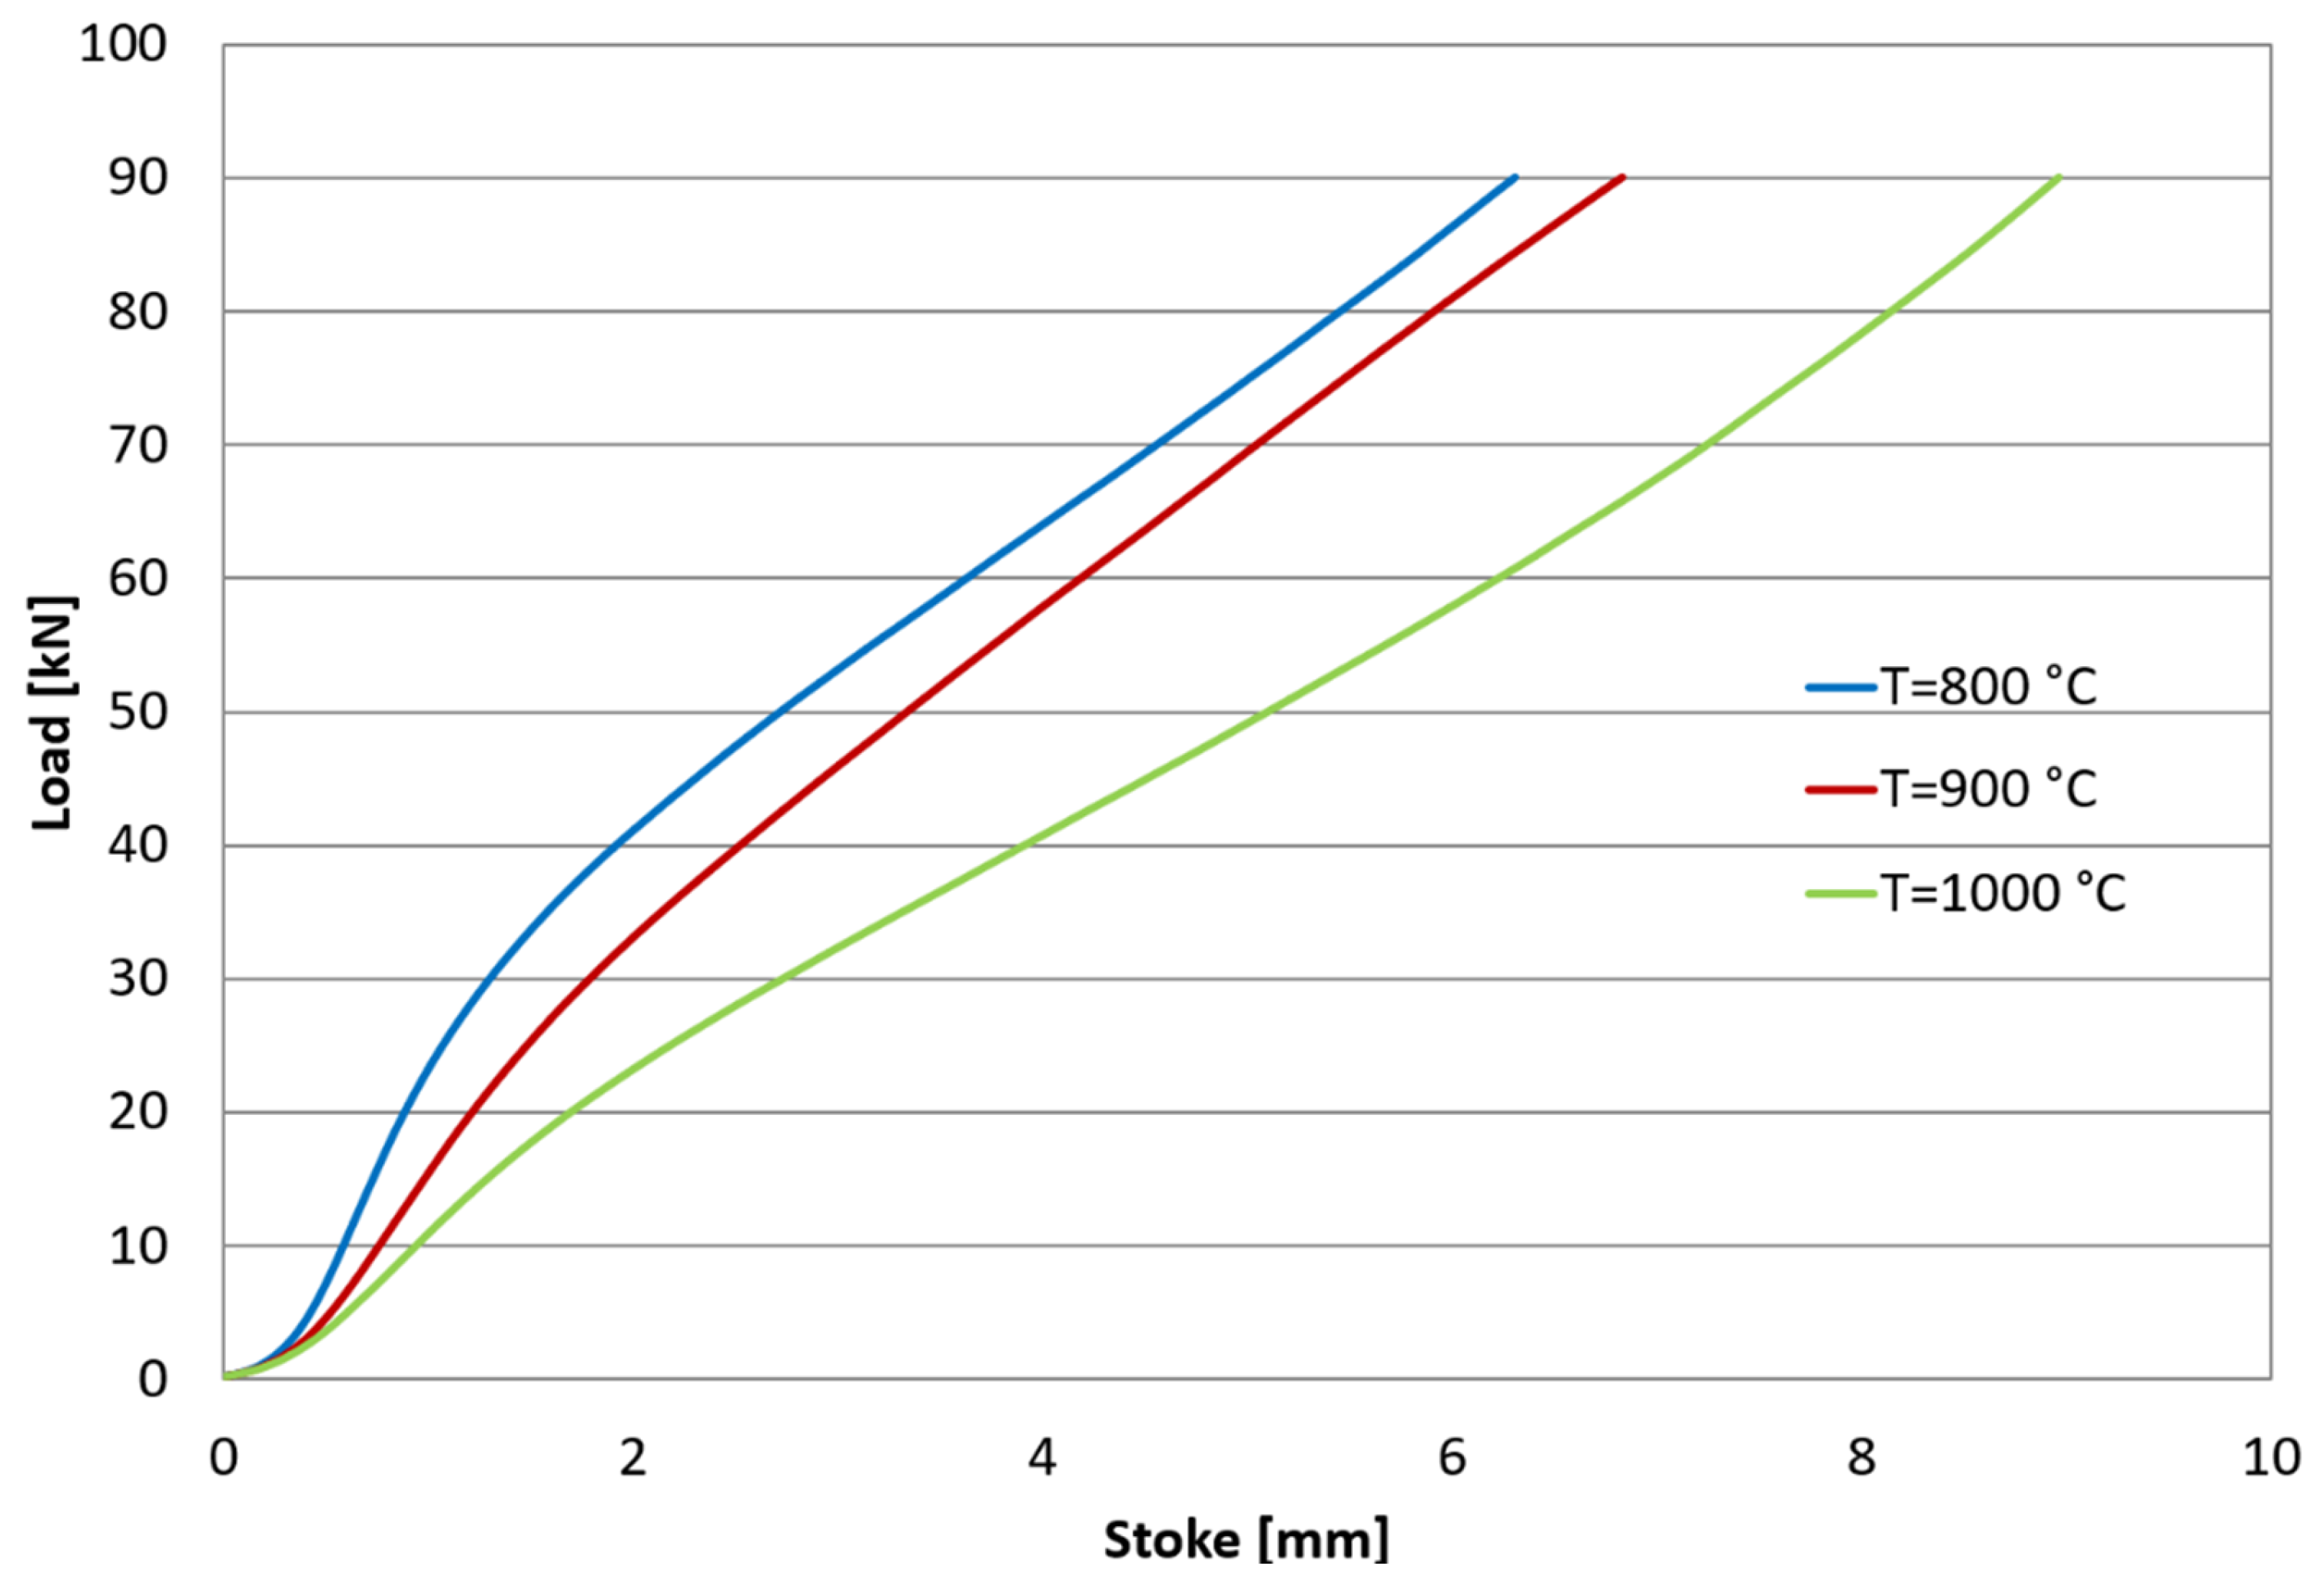
  • The experimental curves show typical characteristics that demonstrate the presence of dynamic recrystallization at high temperatures and low strain rates. At the deformation temperature of 800 °C, 900 °C, 1000 °C, when the balance between hardening and dynamic recovery takes place, the flow curves show a steady phase in which the flow stress is approximately constant.
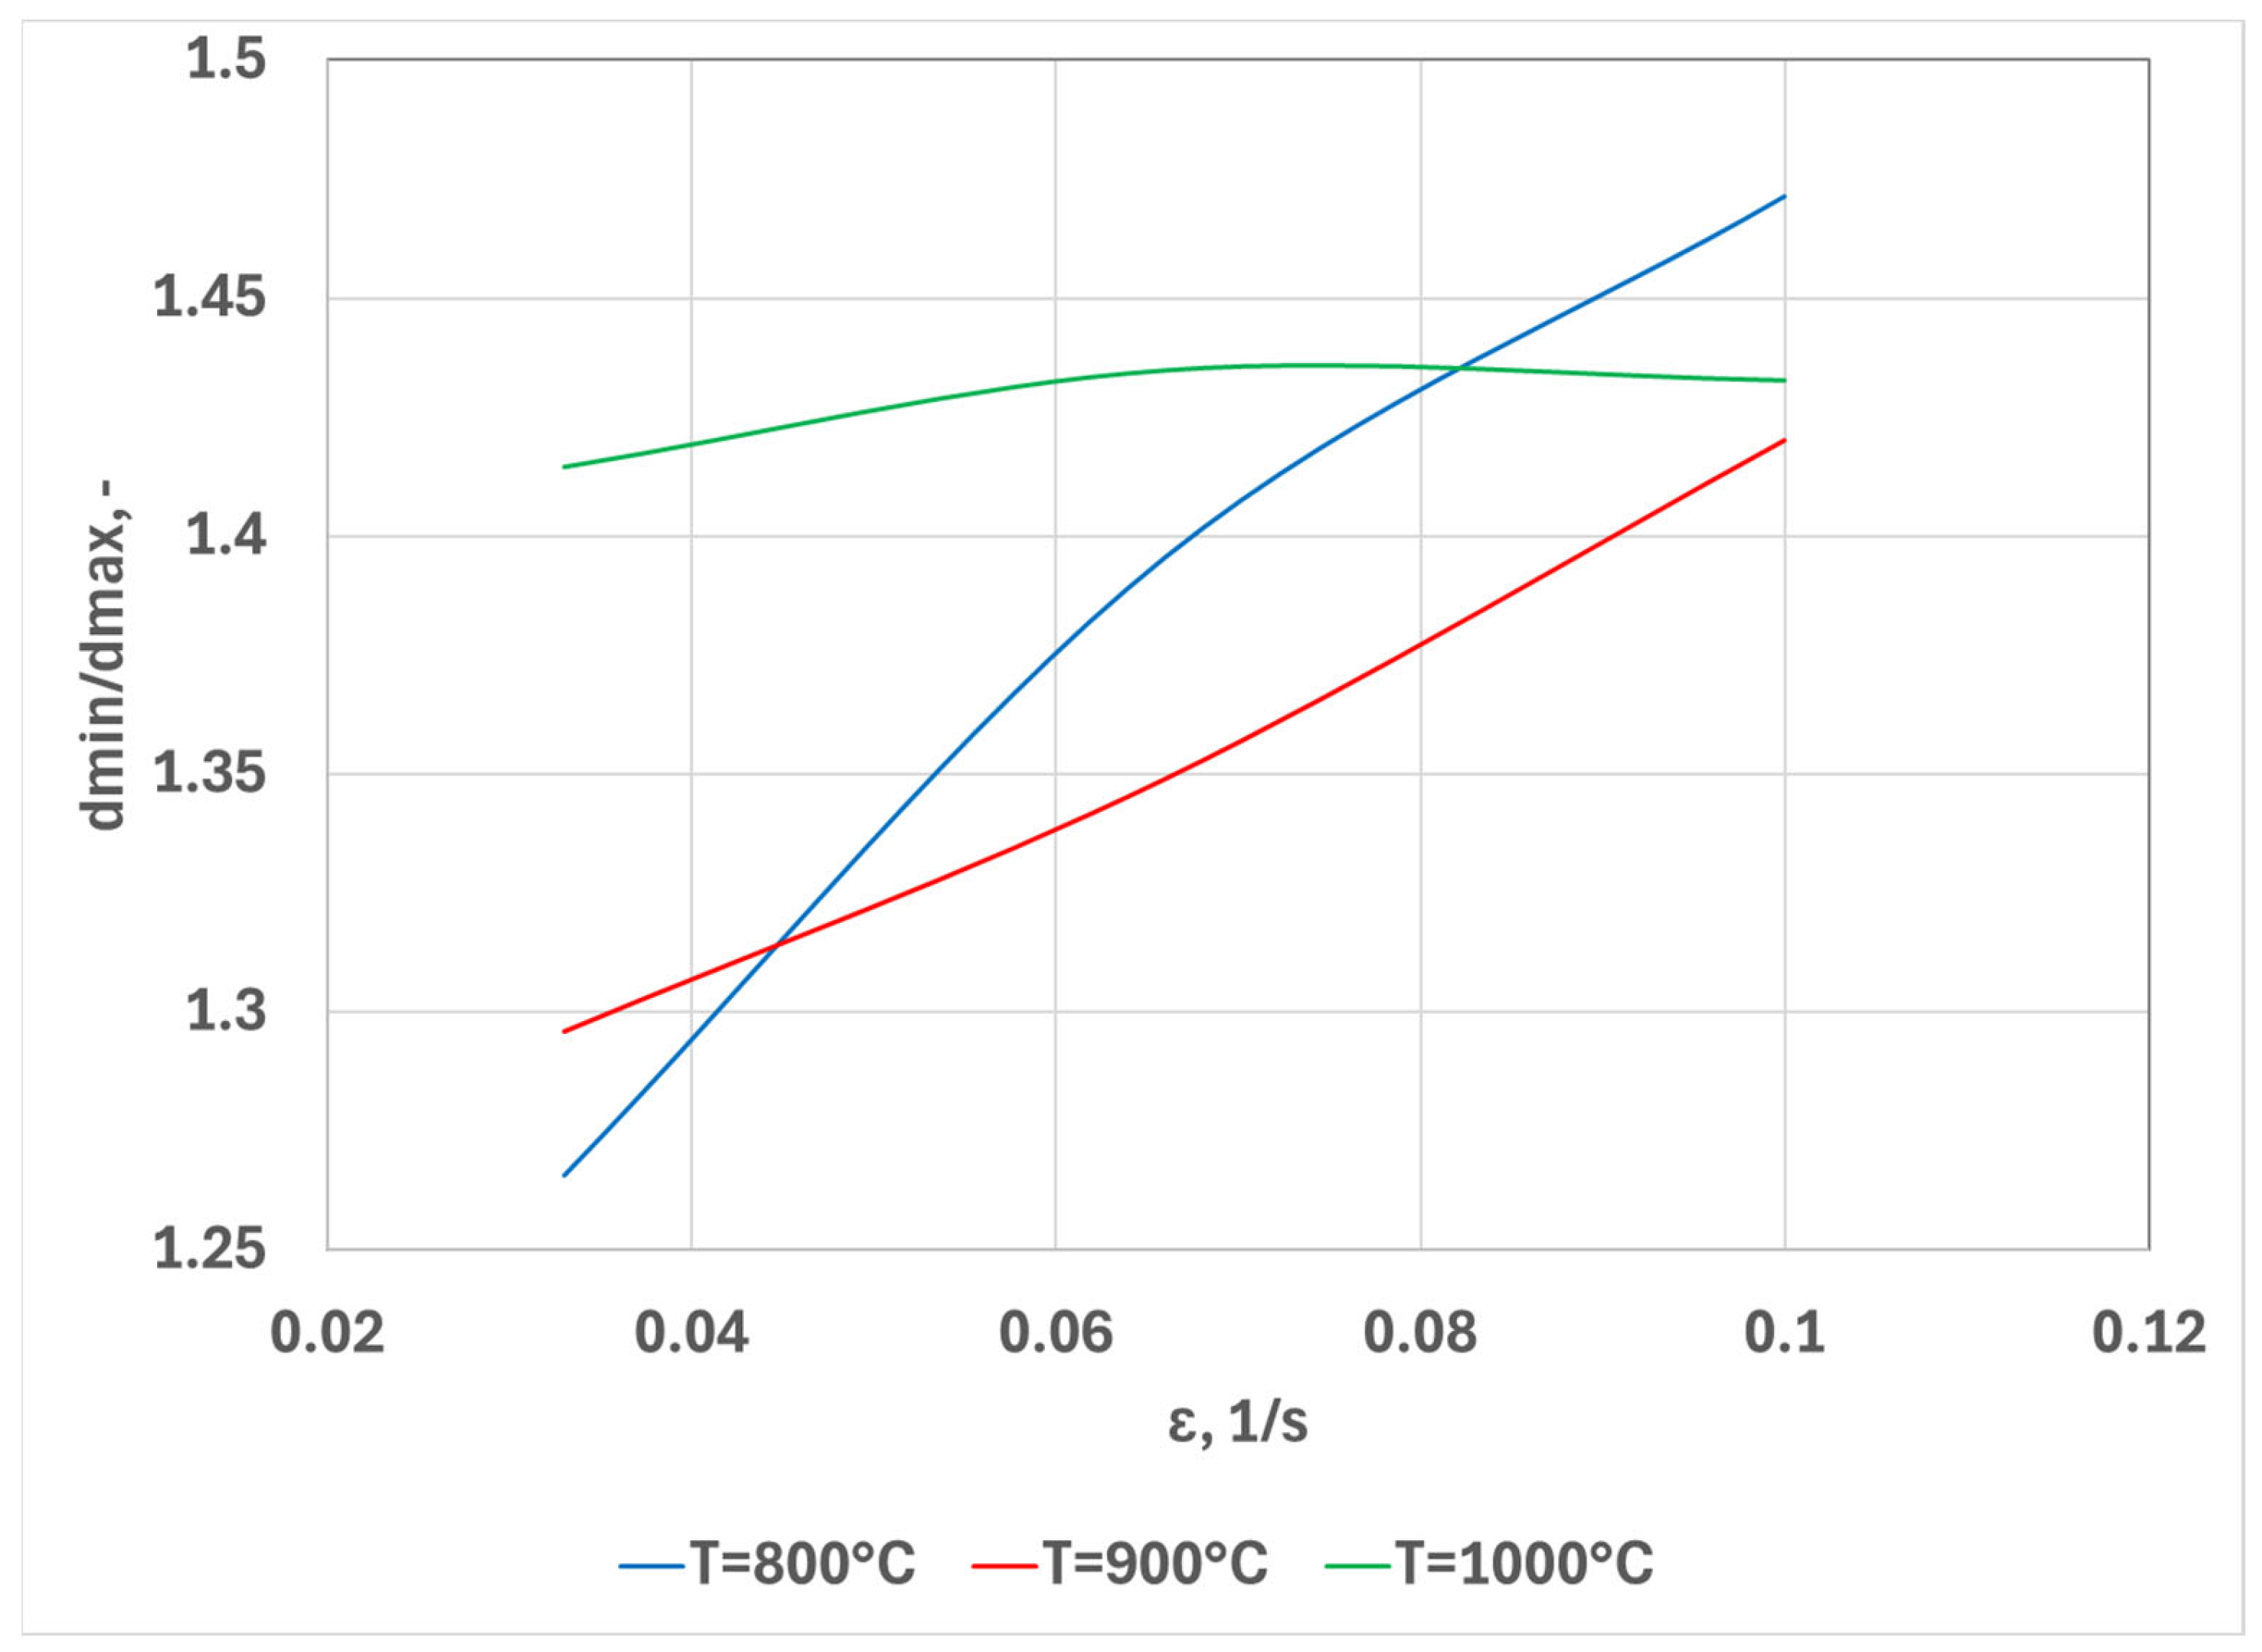
  • In the compression tests, it was observed that once the strain rate increases, the true strain slightly increases, depending on temperature. The greatest non-uniformity of the deformations was observed for the temperature of 1000 °C. With increasing deformation speed, the non-uniformity of the deformations increases. The maximum true strain of 50% was obtained at a temperature of 1000 °C and a strain rate of 0.1 s−1. When reducing the strain rate, the true strain value decreases, as can be seen from Figure 16, Figure 17 and Figure 18.
  • The deformations’ non-uniformity is significantly influenced by the temperature and the strain rate. With increasing temperature, the degree of non-uniformity increases. The greatest non-uniformity of the deformations is observed in the case of the temperature of 1000 °C. From Figure 17, it can be seen that by increasing the strain rate, the deformations’ non-uniformity also increases.
  • The scanning electron microscopy investigations demonstrate the influence of temperature and strain rate on the formability and structural change of the material.
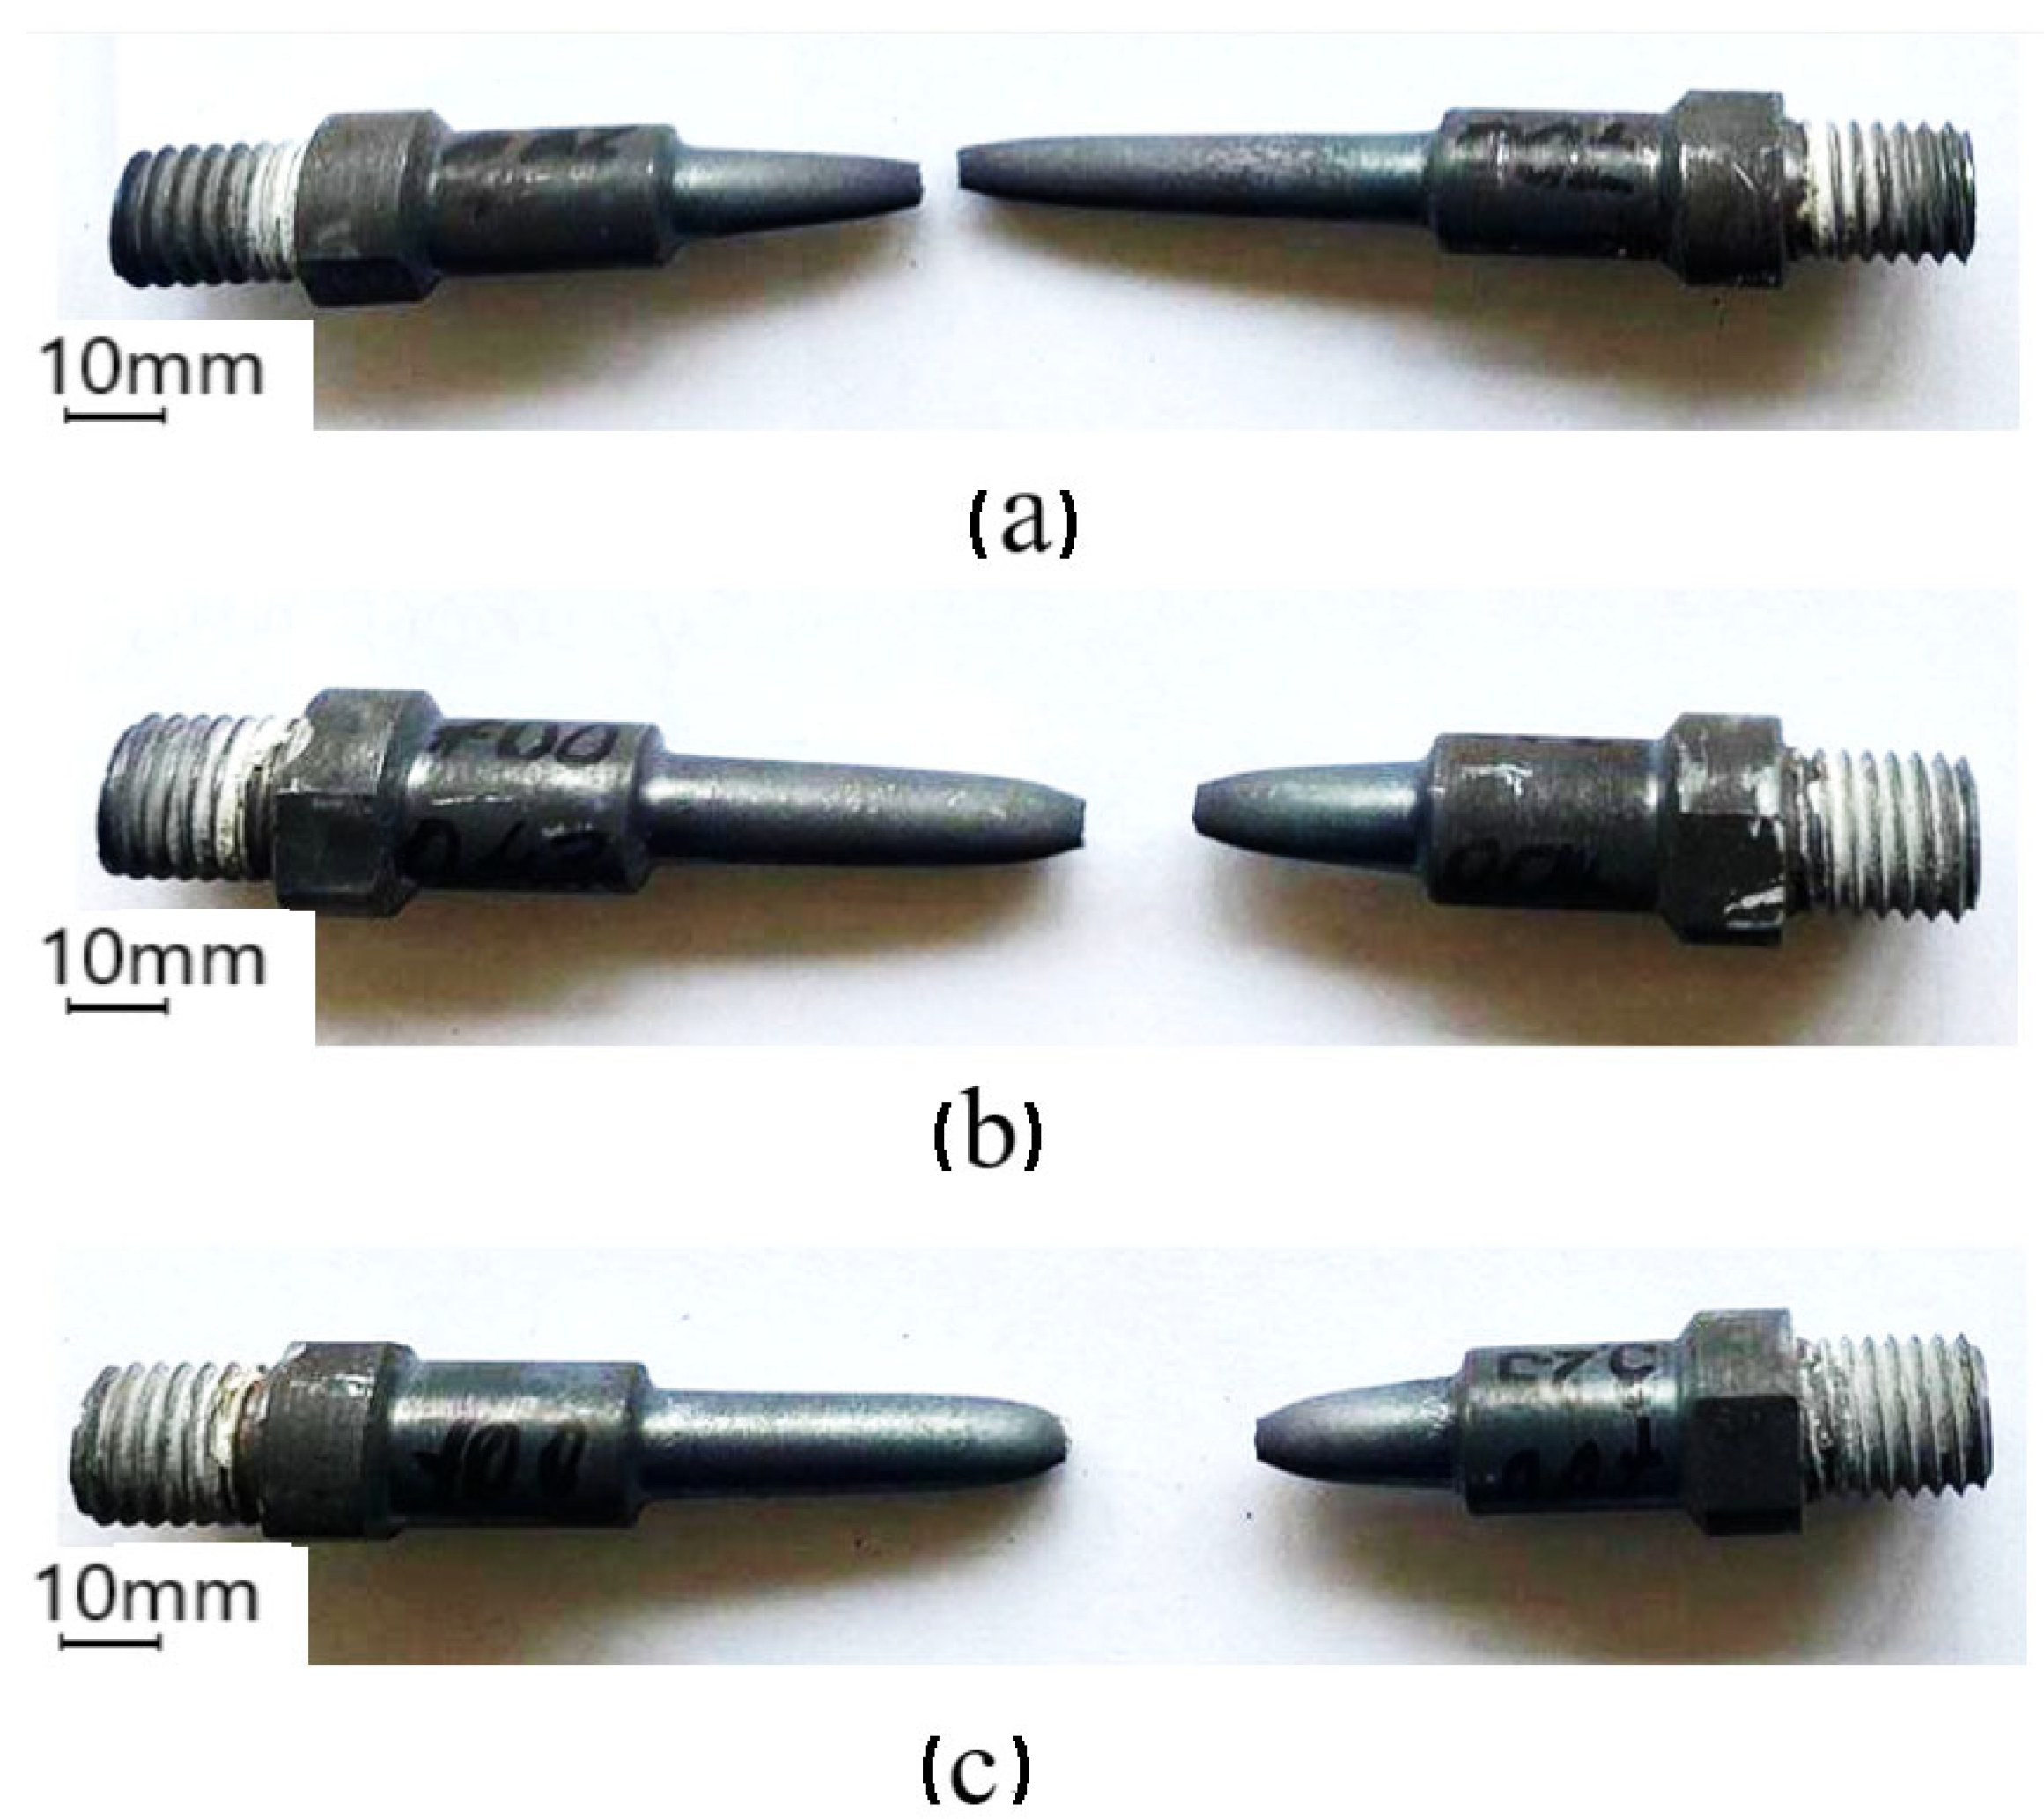
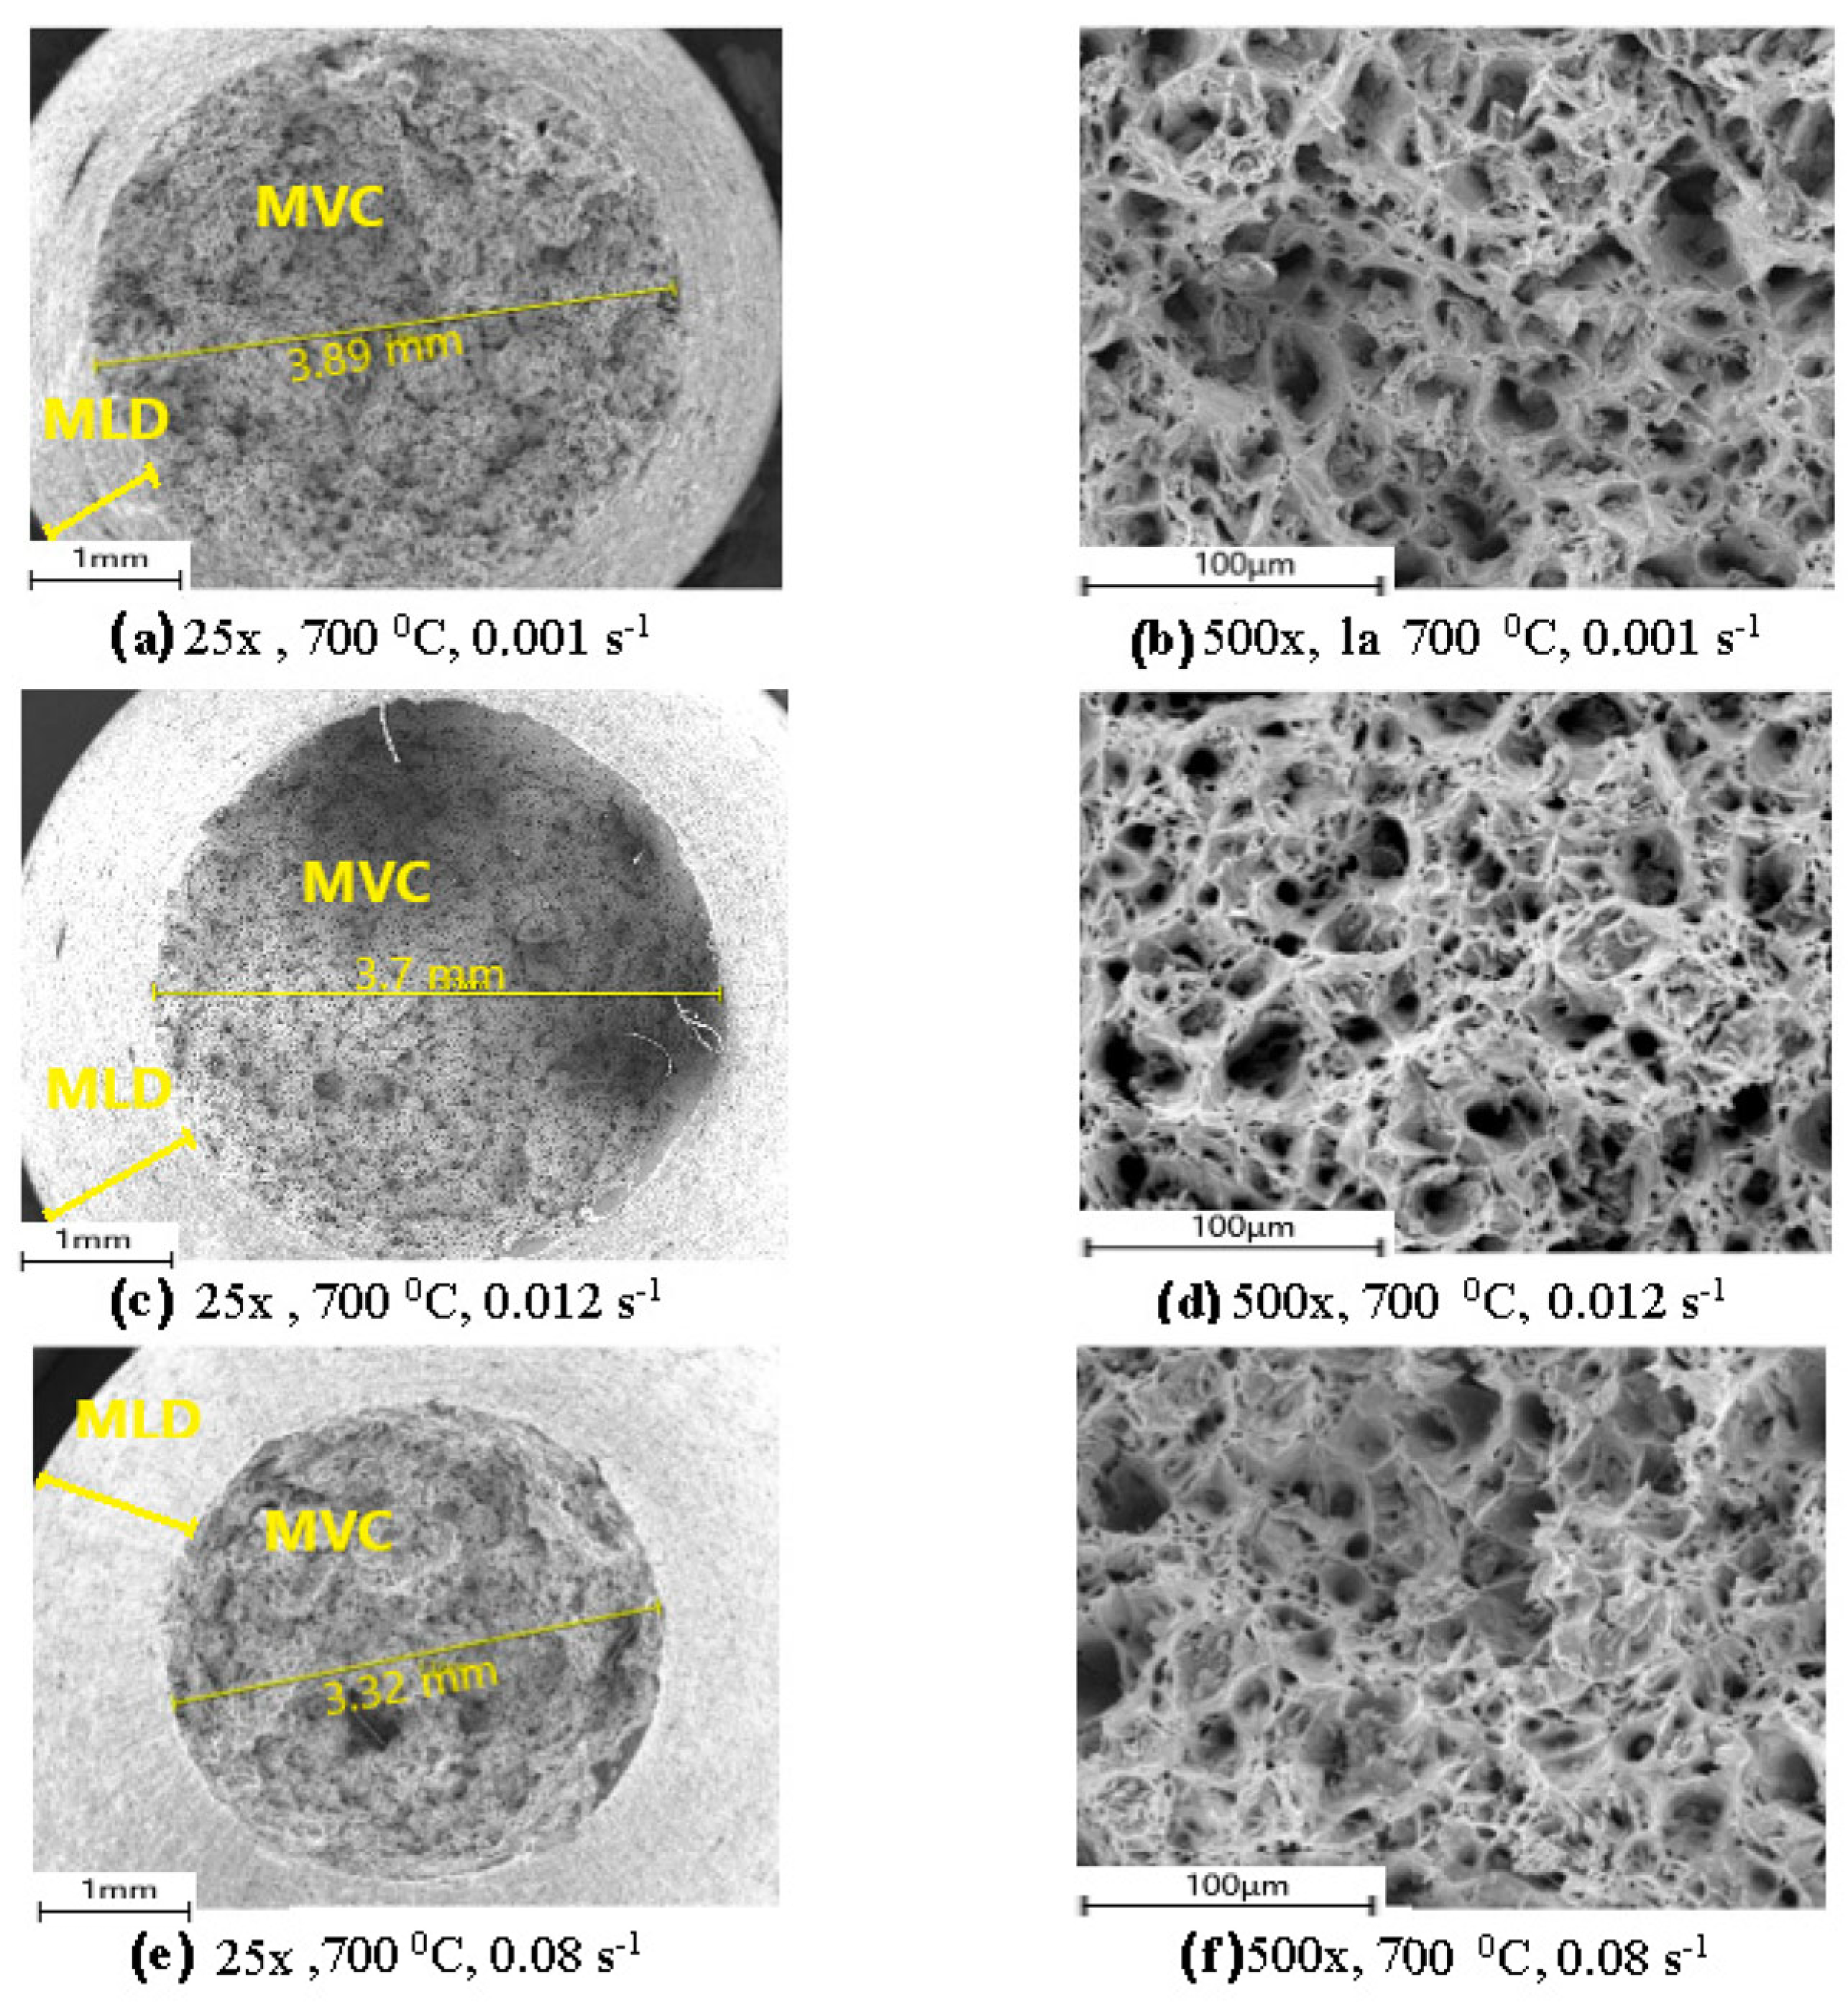
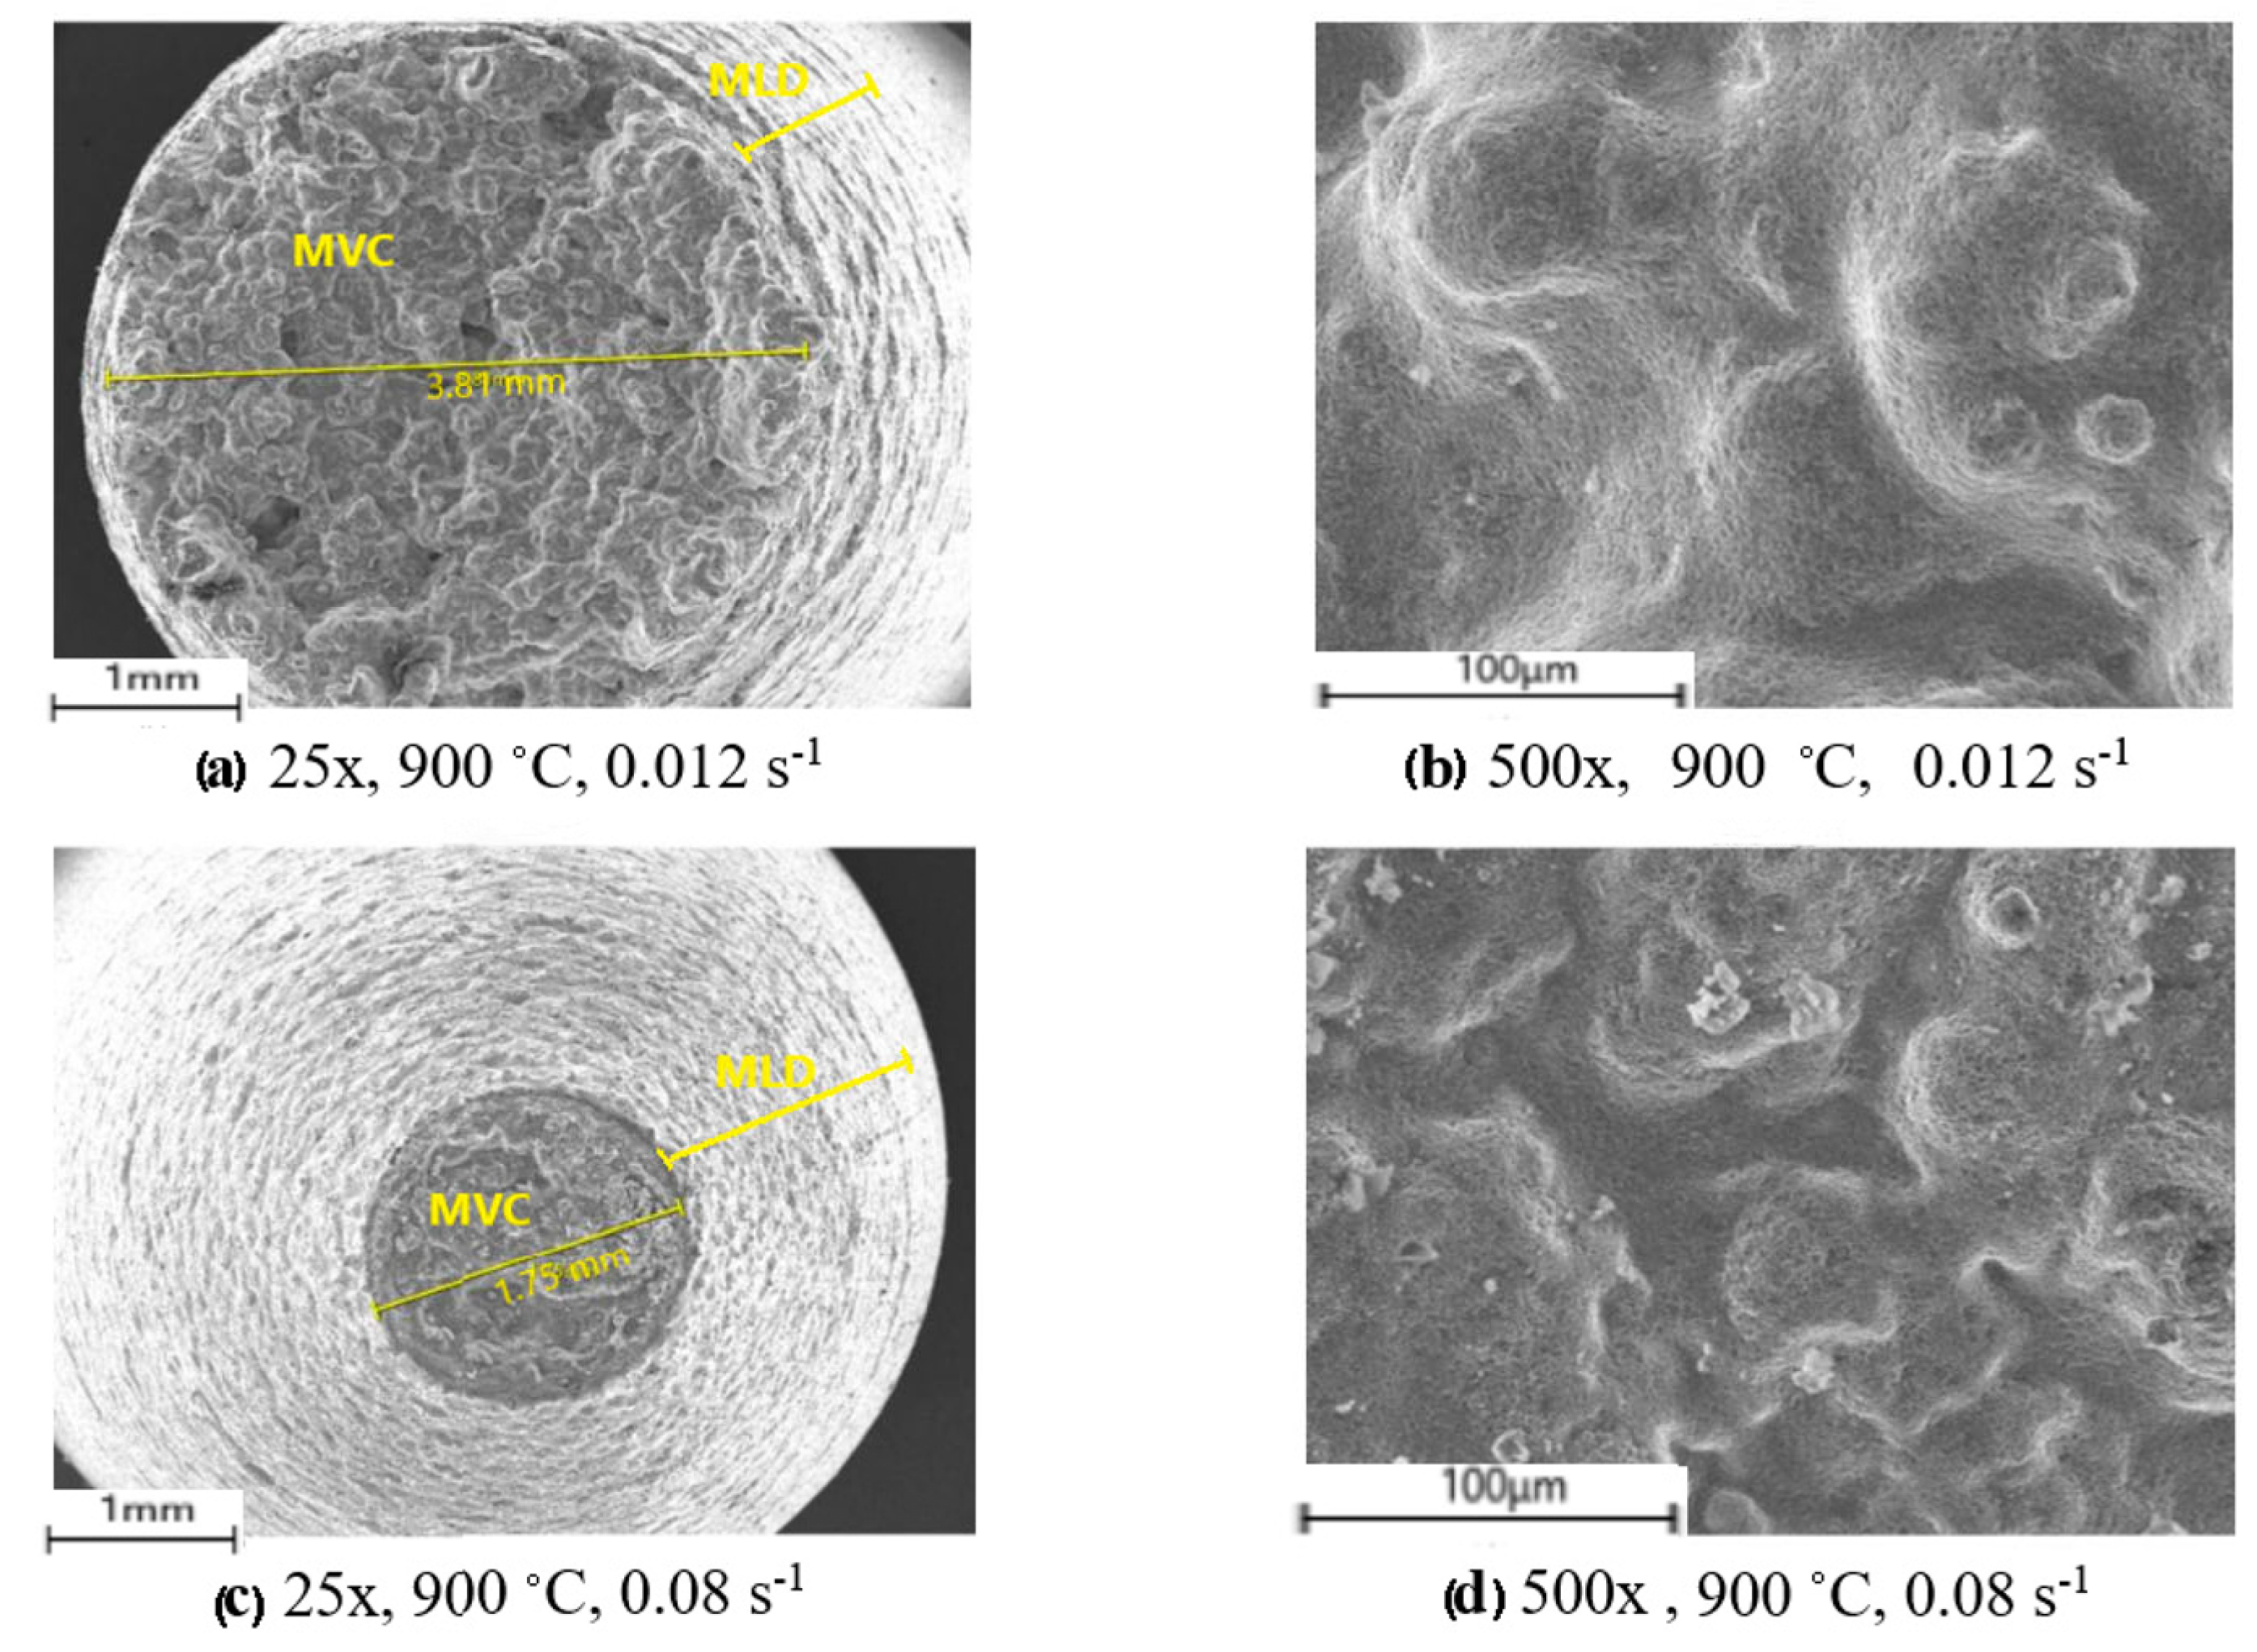
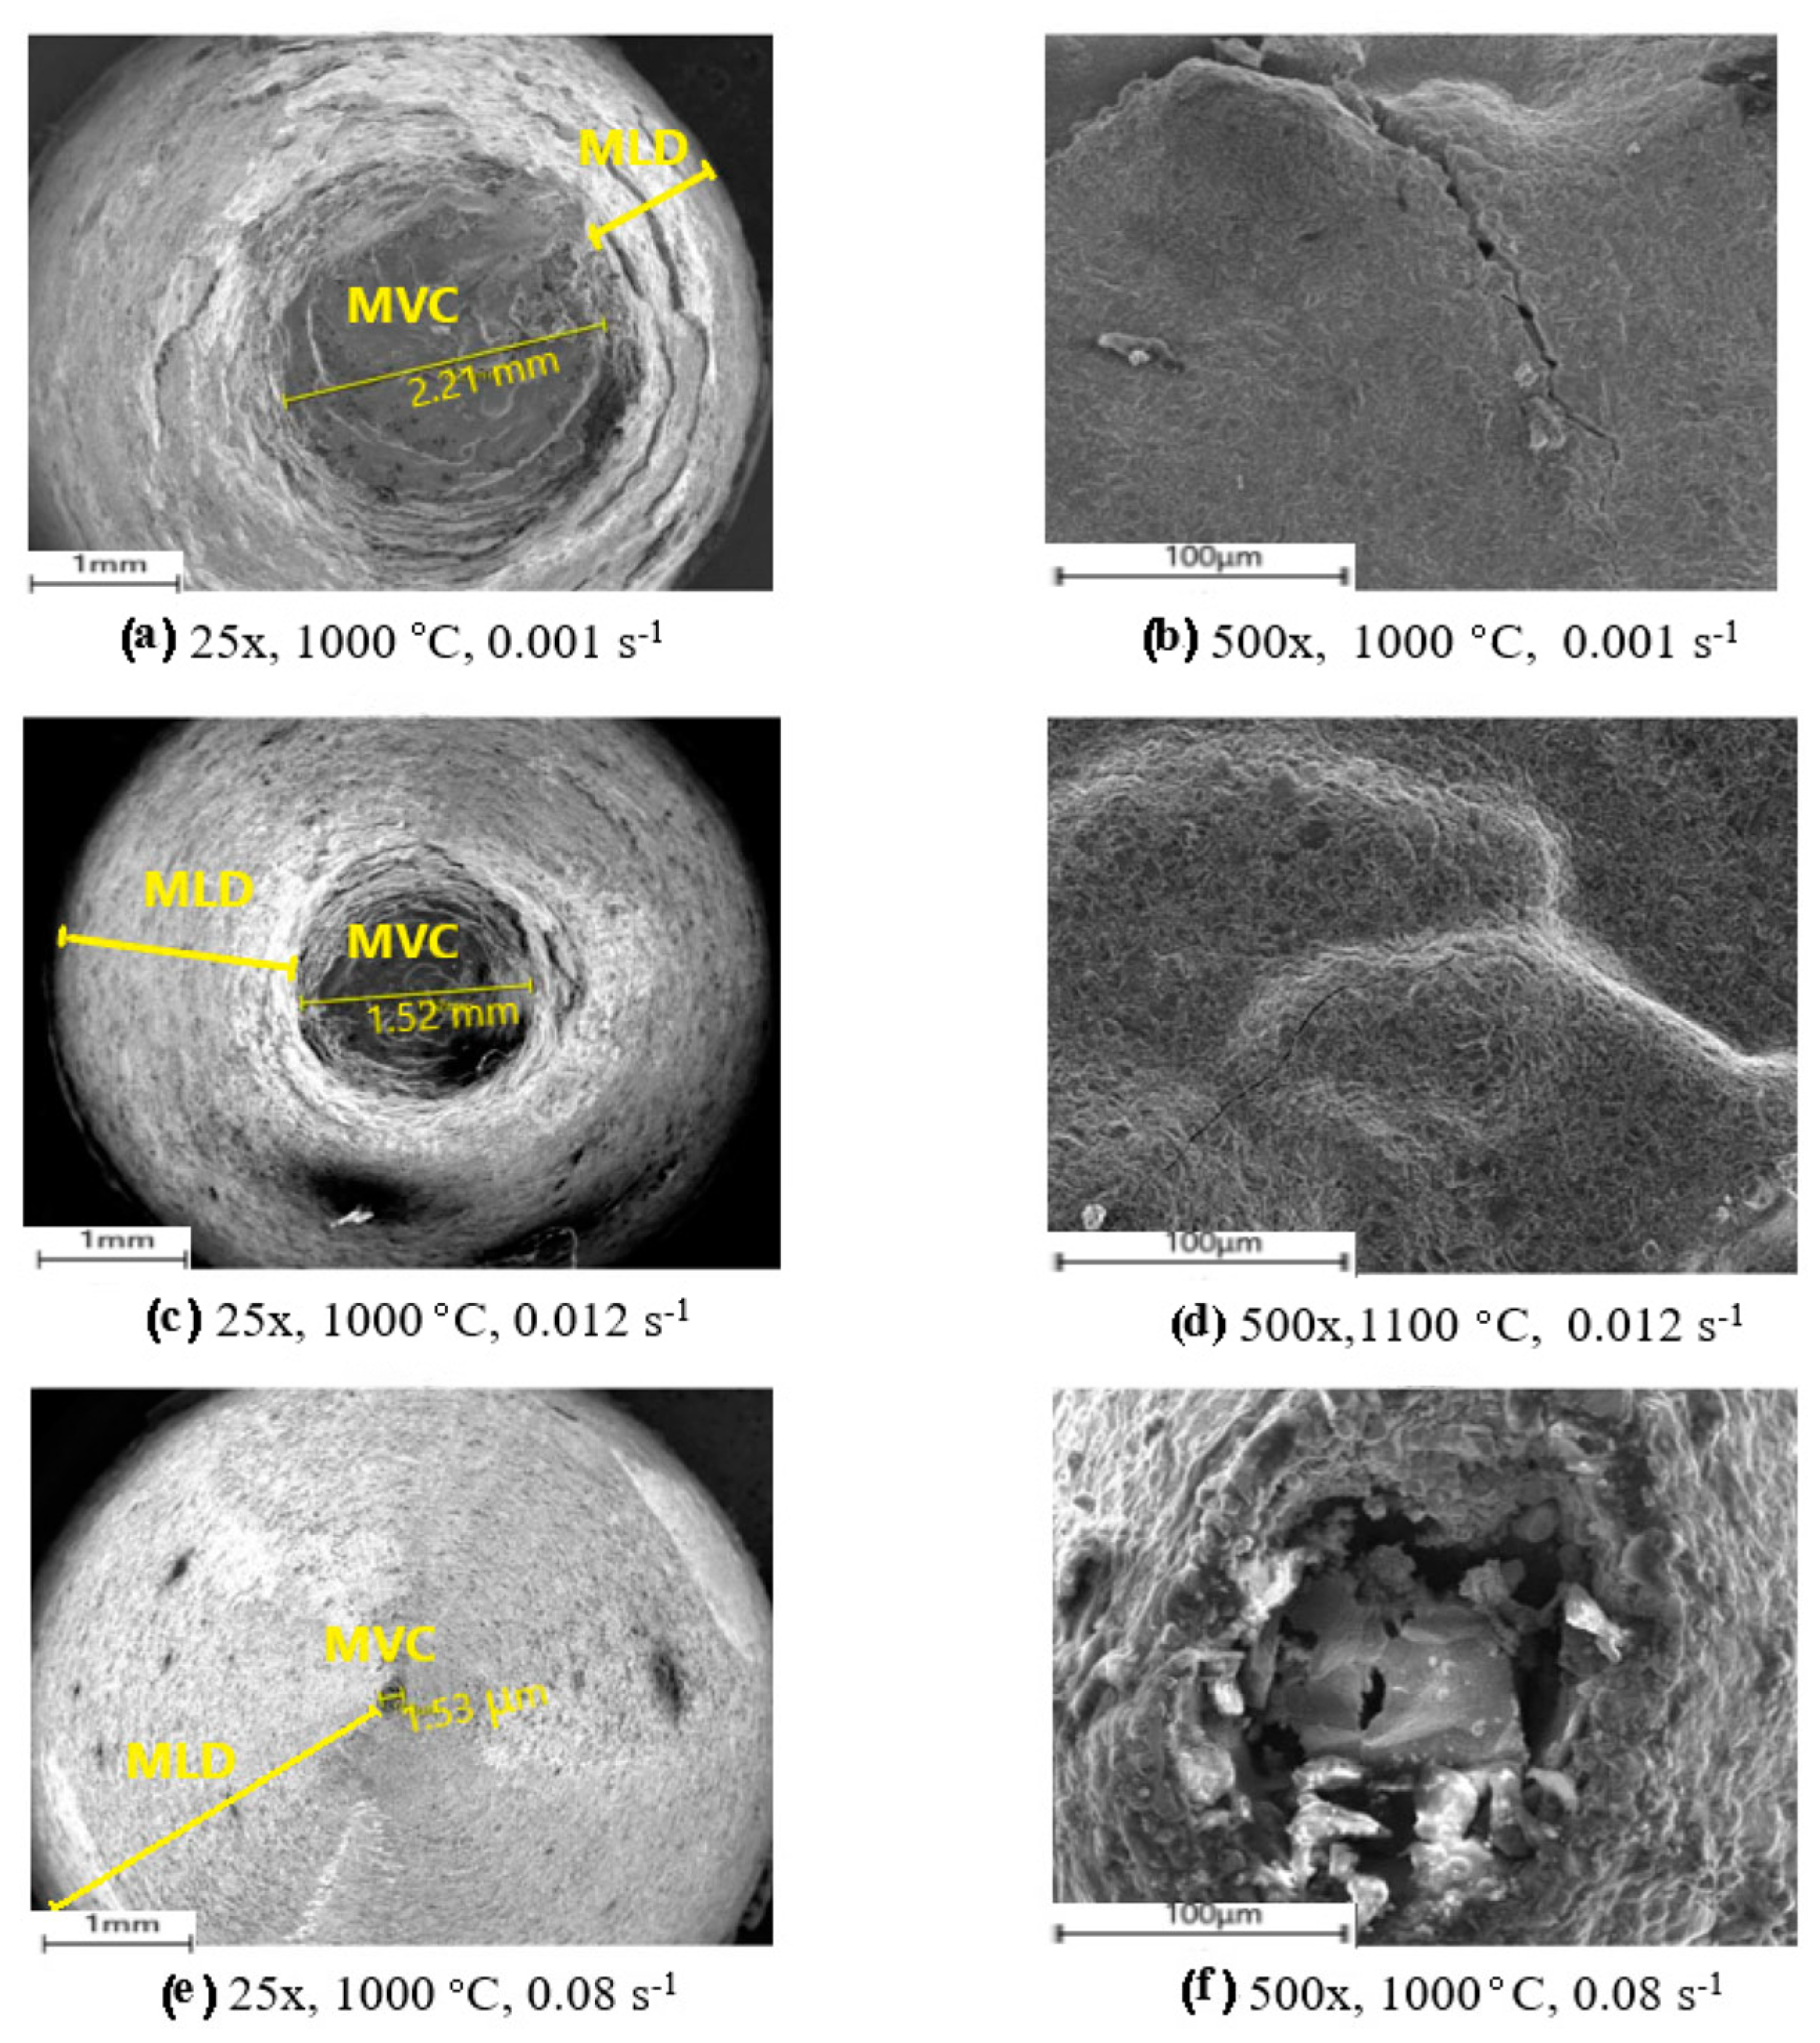
  • For all the presented deformation conditions, the formation of fractures through the ductile fracture mechanism resulted from localized necking and the coalescence of microvoids.
  • The SEM images showed classic cup-and-cone fracture surfaces at low (25×) and high magnification (500×). These were observed at different temperatures (700 °C, Figure 20; 900 °C, Figure 21; 1000 °C, Figure 22). Images for different strain rates ((a,b) 0.001 s−1; (c,d) 0.012 s−1; (e,f) 0.08 s−1) are presented in Figure 20 and Figure 22, while Figure 21 shows images for 900 °C at strain rates of 0.001 s−1 and 0.08 s−1 (a–d).
  • At low values of strain rate (0.001 s−1), the cracks were visibly larger (Figure 22a,b), compared with 0.012 s−1 (Figure 22c,d) and 0.08 s−1 (Figure 22e,f).
  • An advanced detached embrittlement was present in the peripheral region at a temperature of 1000 °C under conditions of low strain rate (0.001 s−1).
  • In the temperature range 700–800 °C, the structure of 42CrMo4 steel changes from BCC to FCC, which explains the change in the curves in Figure 17. The temperature at which the complete austenitic transformation occurs is close to 800 °C.
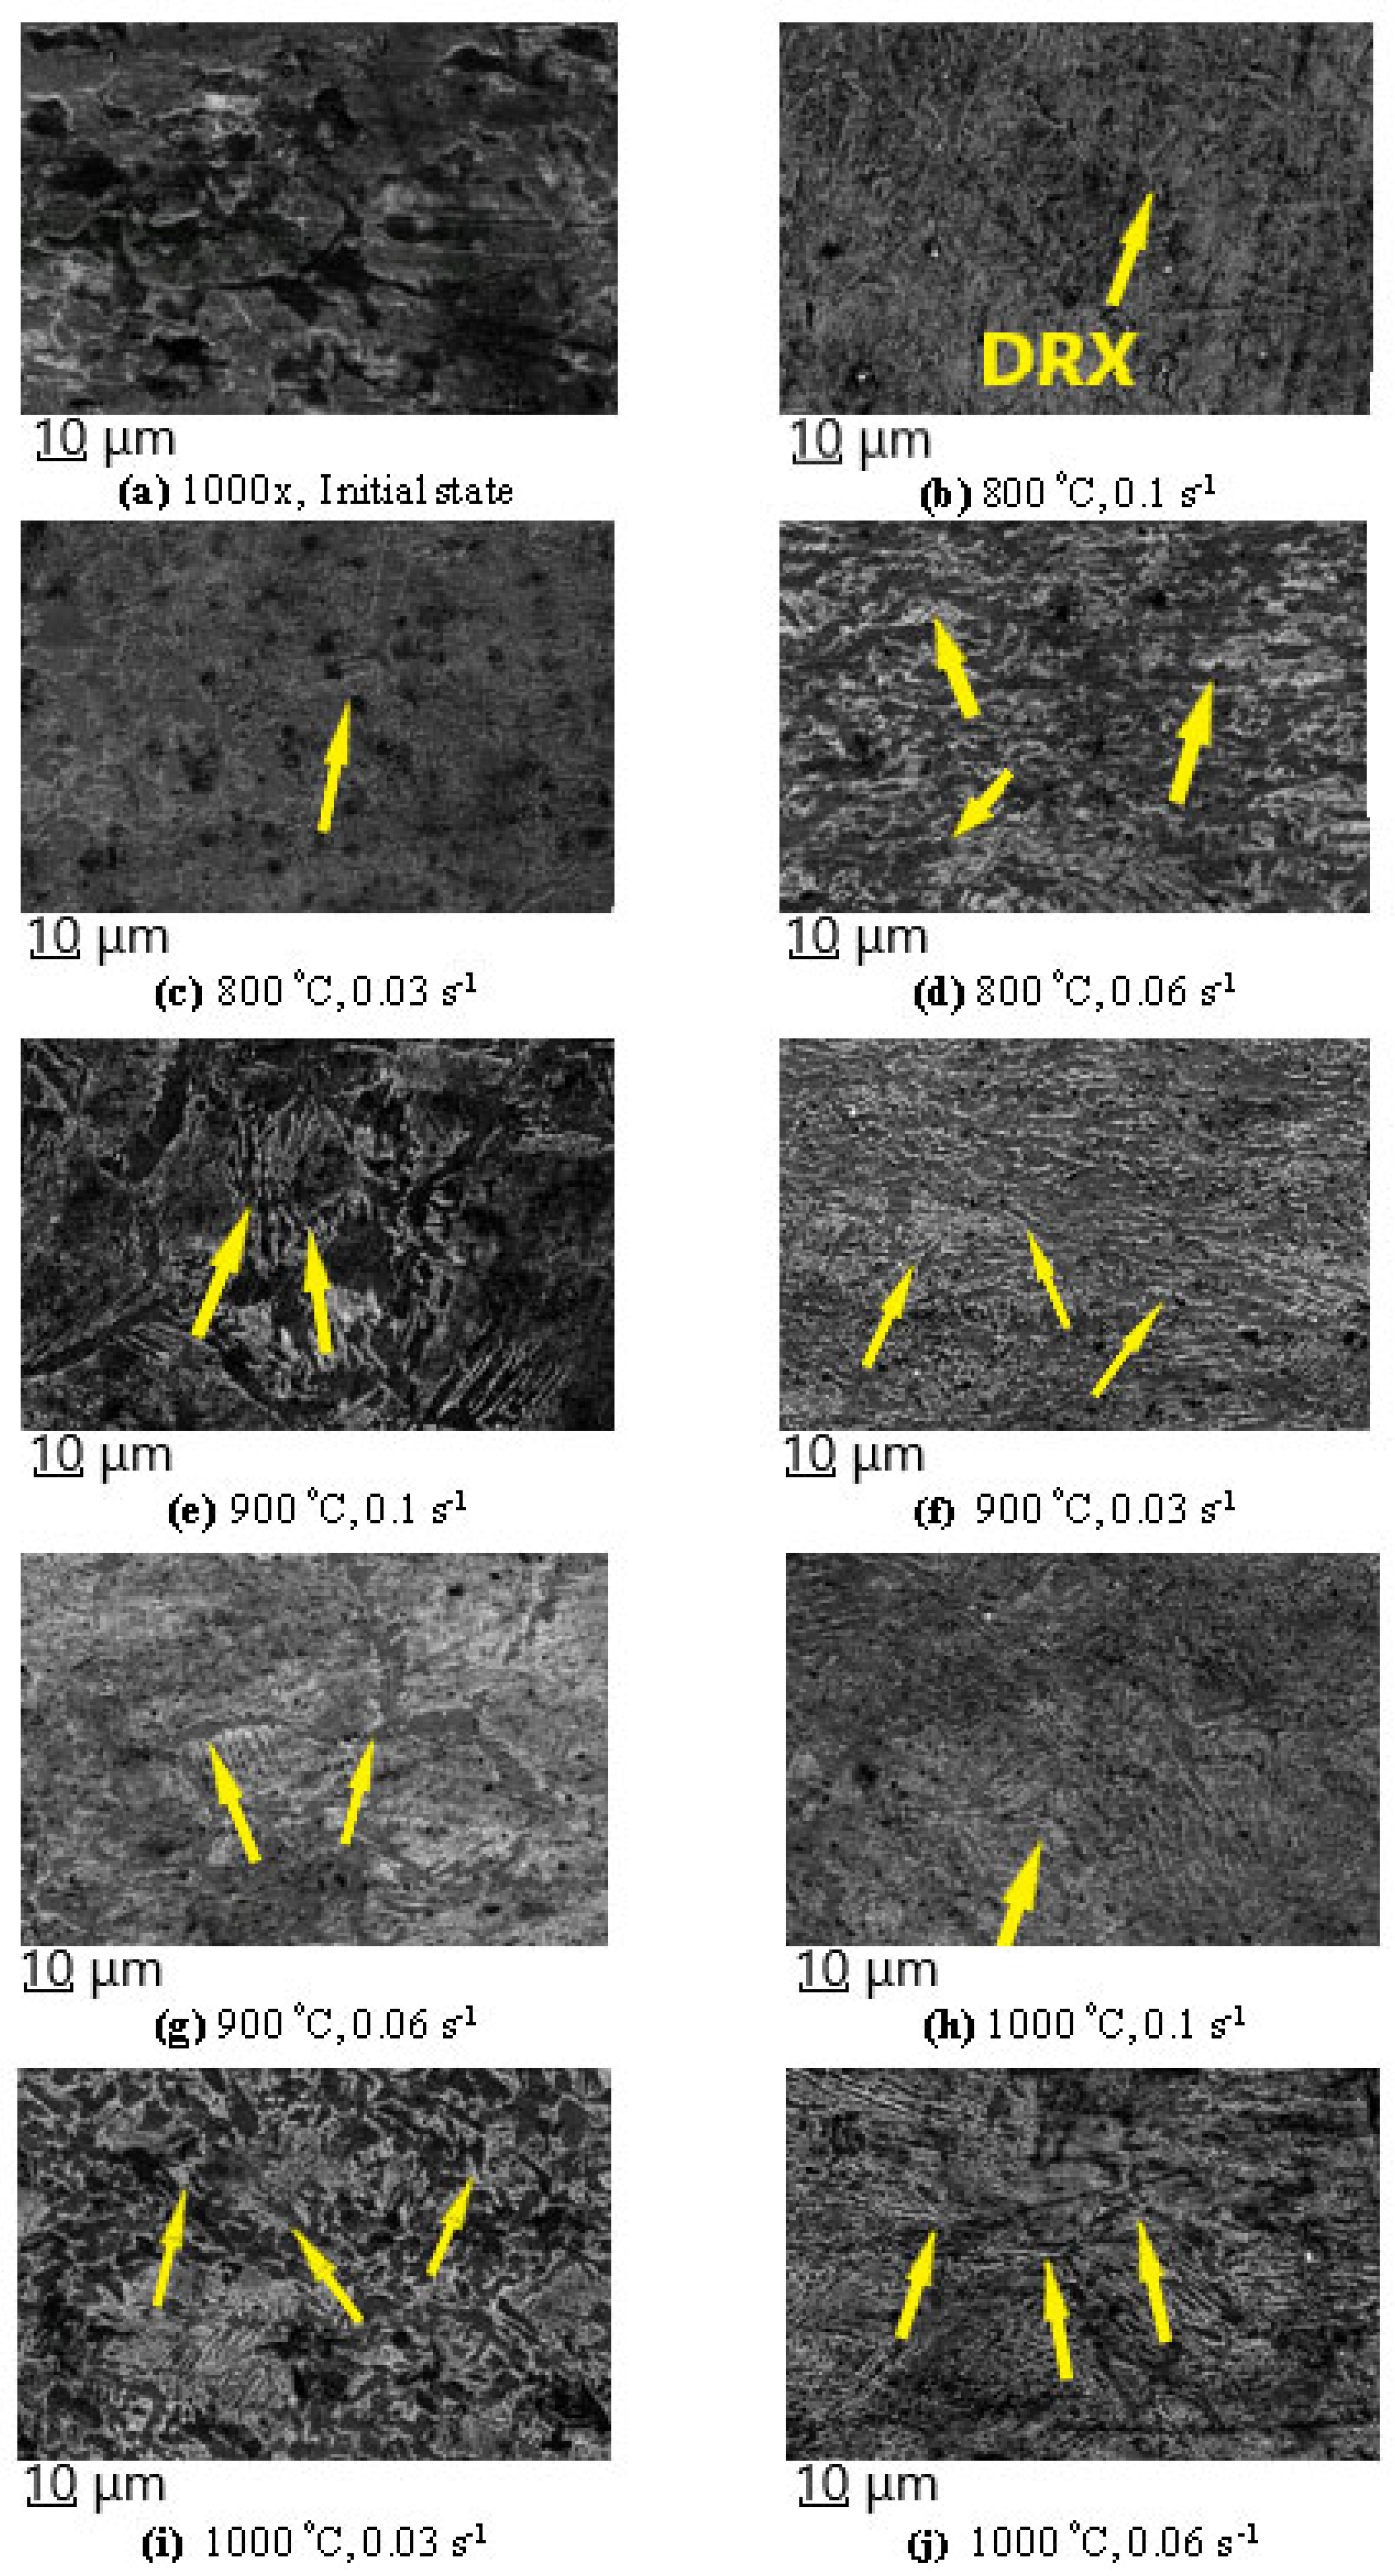
  • DRX evolution was influenced by increasing deformation temperature and decreasing strain rate. The quantity of dynamically recrystallized grains increases at higher temperatures and lower strain rates.
  • By increasing the deformation temperature and reducing the strain rate, the fracture behaviour of 42CrMo4 steel can be improved.

Author Contributions

Conceptualization, M.P. and I.-M.S.-B.; methodology, M.P.; software, F.P. and I.-M.S.-B.; validation, M.P., I.-M.S.-B. and A.N.; formal analysis, M.P., I.-M.S.-B. and D.F.; investigation, M.P., I.-M.S.-B., D.F. and F.P.; resources, M.P., I.-M.S.-B., D.F. and F.P.; data curation, M.P. and I.-M.S.-B.; writing—original draft preparation, M.P. and I.-M.S.-B.; writing—review and editing, M.P. and I.-M.S.-B.; visualization, M.P., I.-M.S.-B. and F.P.; supervision, M.P. and I.-M.S.-B.; funding acquisition, M.P. and I.-M.S.-B. All authors have read and agreed to the published version of the manuscript.

Funding

This research received no external funding.

Data Availability Statement

The original contributions presented in the study are included in the article, further inquiries can be directed to the corresponding author.

Conflicts of Interest

The authors declare no conflicts of interest.

Nomenclature

Tdeformation temperature [°C];
ε ˙ strain rate [s−1];
ε elongation [-];
l0initial length of the specimen [mm];
l1final length of the specimen [mm];
d0initial diameter of the specimen [mm];
d1final diameter of the specimen [mm];
drdiameter of the specimen in the fracture area [mm];
ε 1 longitudinal strains [%];
  ε d transversal strains [%];
Vdeformation speed [mm/s];
h0initial height of the specimen [mm];
h1final height of the specimen [mm];
dminminimum diameter of the deformed specimen [mm];
dmaxmaximum diameter of the deformed specimen [mm].

References

  1. Bilbao, O.; Loizaga, I.; Alonso, J.; Girot, F.; Torregaray, A. 42CrMo4 steel flow behavior characterization for high temperature closed dies hot forging in automotive components applications. Heliyon 2023, 9, E22256. [Google Scholar] [CrossRef] [PubMed]
  2. Imdad, A.; Arniella, V.; Zafra, A.; Belzunce, J. Tensile behaviour of 42CrMo4 steel submitted to annealed, normalized, and quench and tempering heat treatments with in-situ hydrogen charging. Int. J. Hydrogen Energy 2024, 5, 270–280. [Google Scholar] [CrossRef]
  3. Zheng, J.; Feng, Y.; Zhao, Y.; Chen, L. High-Temperature Cyclic Oxidation Behavior and Microstructure Evolution of W- and Ce-Containing 18Cr-Mo Type Ferritic Stainless Steel. Materials 2024, 17, 2230. [Google Scholar] [CrossRef] [PubMed]
  4. Wang, Q.; Wang, Q.; Wang, Q.; Li, C.; Li, K. Effect of Boron on Microstructures and Low-Temperature Impact Toughness of Medium-Carbon CrMo Alloy Steels with Different Quenching Temperatures. Processes 2024, 12, 852. [Google Scholar] [CrossRef]
  5. Wang, H.; Zhai, Y.; Zhou, L.; Zhang, Z. Study on Laser Surface Hardening Behavior of 42CrMo Press Brake Die. Coatings 2021, 11, 997. [Google Scholar] [CrossRef]
  6. Cristea, A.F.; Ninacs, R.; Haragâş, S. Studies regarding the kinematic and functioning of unconventional worm Gear. Acta Tech. Napoc. Ser. Appl. Math. Mech. Eng. 2022, 65, 437–442. [Google Scholar]
  7. Sas-Boca, I.M.; Frunza, D.; Popa, F.; Ilutiu-Varvara, D.A.; Tintelecan, M.C. Influence of Temperature and Strain Rate on Microstructure and Fracture Mechanism of Mild Steel. Procedia Manuf. 2020, 46, 891–898. [Google Scholar] [CrossRef]
  8. Ilhan, E.; Findik, F.; Aslanlar, S. An investigation of the factors affecting the design of drum dryers. Mater. Des. 2003, 24, 503–507. [Google Scholar] [CrossRef]
  9. Bronis, M.; Miko, E.; Nowakowski, L. Analyzing the Effects of the Kinematic System on the Quality of Holes Drilled in 42CrMo4 + QT Steel. Materials 2021, 14, 4046. [Google Scholar] [CrossRef]
  10. González-Pociño, A.; Asensio-Lozano, J.; Álvarez-Antolín, F.; García-Diez, A. Evaluation of Hardness, Sliding Wear and Strength of a Hypoeutectic White Iron with 25%Cr after Heat Treatments. Metals 2021, 11, 947. [Google Scholar] [CrossRef]
  11. Lin, Y.C.; Chen, M.S.; Zhong, J. Microstructural evolution in 42CrMo steel during compression at elevated temperatures. Mater. Lett. 2008, 62, 2136–2139. [Google Scholar] [CrossRef]
  12. Arun, S.; Thakare, A.S.; Butee, S.P.; Kamble, K.R. Improvement in Mechanical Properties of 42CrMo4 Steel Through Novel Thermomechanical Processing Treatment. Metallogr. Microstruct. Anal. 2020, 9, 759–773. [Google Scholar] [CrossRef]
  13. Miokovic, T.; Schulze, V.; Vohringer, O.; Lohe, D. Prediction of phase transformations during laser surface hardening of AISI 4140 including the effects of inhomogeneous austenite formation. Mater. Sci. Eng. A 2006, 435, 547–555. [Google Scholar] [CrossRef]
  14. Nikitin, I.; Besel, M. Correlation between residual stress and plastic strain amplitude during low cycle fatigue of mechanically surface treated austenitic stainless steel AISI 304 and ferritic–pearlitic steel SAE 1045. Mater. Sci. Eng. A 2008, 491, 297–303. [Google Scholar] [CrossRef]
  15. Pop, M.; Frunza, D.; Popa, F.; Neag, A. Aspects Regarding the Hot Fracture Behavior of 42CrMo4 Alloy. Roum. J. Phys. 2017, 62, 1–13. [Google Scholar]
  16. Pop, M.; Neag, A.; Frunza, D.; Popa, F. Thermomechanical study on 42CrMo4 steel formability. Acta Tech. Napoc. Appl. Math. Mech. 2019, 62, 287–294. [Google Scholar]
  17. Lin, Y.C.; Chen, M.S.; Zhong, J. Constitutive modeling for elevated temperature flow behavior of 42CrMo steel. Comput. Mater. Sci. 2008, 42, 470–477. [Google Scholar] [CrossRef]
  18. Krupp, U.; Giertler, A. Surface or Internal Fatigue Crack Initiation during VHCF of Tempered Martensitic and Bainitic Steels: Microstructure and Frequency/Strain Rate Dependency. Metals 2022, 12, 1815. [Google Scholar] [CrossRef]
  19. Totik, Y.; Sadeler, R.; Kaymaz, I. Hot workability of AISI 4140 steel with hot torsion test. J. Mech. Behav. Mater. 2002, 13, 65–72. [Google Scholar]
  20. Lin, Y.C.; Chen, M.S.; Zhong, J. Effect of temperature and strain rate on the compressive deformation behavior of 42CrMo steel. J. Mater. Process Technol. 2008, 205, 308–315. [Google Scholar] [CrossRef]
  21. Lin, Y.C.; Zhang, J.; Zhong, J. Application of neural networks to predict the elevated temperature flow behavior of a low alloy steel. Comput. Mater. Sci. 2008, 43, 752–758. [Google Scholar] [CrossRef]
  22. Quan, G.Z.; Zhao, L.; Chen, T.; Wang, Y.; Mao, Y.P.; Lv, W.Q.; Zhou, J. Identification for the optimal working parameters of as-extruded 42CrMo high-strength steel from a large range of strain, strain rate and temperature. Mater. Sci. Eng. A 2012, 538, 364–373. [Google Scholar] [CrossRef]
  23. Quan, G.Z.; Wang, Y.; Liu, Y.Y.; Zhou, J. Effect of Temperatures and Strain Rates on the Average Size of Grains Refined by Dynamic Recrystallization for as-extruded 42CrMo Steel. Mater. Res. 2013, 16, 1092–1105. [Google Scholar] [CrossRef]
  24. Liu, H.; Cheng, Z.; Yu, W.; Wang, G.; Zhou, J.; Cai, Q. Deformation Behavior and Constitutive Equation of 42CrMo Steel at High Temperature. Metals 2021, 11, 1614. [Google Scholar] [CrossRef]
  25. Szala, M.; Winiarski, G.; Wójcik, Ł.; Bulzak, T. Effect of Annealing Time and Temperature Parameters on the Microstructure, Hardness, and Strain-Hardening Coefficients of 42CrMo4 Steel. Materials 2020, 13, 2022. [Google Scholar] [CrossRef] [PubMed]
  26. Chen, M.S.; Lin, Y.C.; Ma, X.S. The kinetics of dynamic recrystallization of 42CrMo steel. Mater. Sci. Eng. A 2012, 556, 260–266. [Google Scholar] [CrossRef]
  27. Yang, D.; Chen, W.; Zhou, R.; Wang, S.; Ma, Y.; Zan, X.; Peng, L. Microstructure evolution of dynamic recrystallizatin of 42CrMo steel during multi-stage forging by FEM. App Mech. Mater. 2012, 217, 415–418. [Google Scholar] [CrossRef]
  28. Lin, Y.C.; Chen, M.S.; Zhong, J. Study of Static Recrystallization Kinetics in a Low Alloy Steel. Comput. Mater. Sci. 2008, 44, 316–321. [Google Scholar] [CrossRef]
  29. Lin, Y.C.; Chen, M.S.; Zhong, J. Study of Metadynamic Recrystallization Behaviors in a Low Alloy Steel. J. Mater. Process. Technol. 2009, 209, 2477–2482. [Google Scholar] [CrossRef]
  30. Lin, Y.C.; Liu, Y.X.; Liu, G.; Chen, M.S.; Huang, Y.C. Prediction of Ductile Fracture Behaviors for 42CrMo Steel at Elevated Temperatures. JMEPEG 2015, 24, 221–228. [Google Scholar] [CrossRef]
  31. Li, Y.Y.; Zhao, S.D.; Fan, S.Q.; Zhong, B. Plastic Properties and Constitutive Equations of 42CrMo Steel During Warm Forming Process. Mater. Sci. Technol. 2014, 30, 645–652. [Google Scholar] [CrossRef]
  32. Huang, Y.C.; Lin, Y.C.; Deng, J.; Liu, G.; Chen, M.S. Hot tensile deformation behaviors and constitutive model of 42CrMo steel. Mater. Des. 2014, 53, 349–356. [Google Scholar] [CrossRef]
  33. Mžourek, M.; Papuga, J.; Nesládek, M.; Matušů, M.; Čapek, J.; Mára, V. Fatigue Damage Analysis On 42CrMo4+QT Via Critical Volume Approach. Procedia Struct. Integr. 2022, 42, 457–464. [Google Scholar] [CrossRef]
  34. Zhu, Z.; Lu, Y.; Xie, Q.; Li, D.; Gao, N. Mechanical properties and dynamic constitutive model of 42CrMo steel. Mater. Des. 2017, 119, 171–179. [Google Scholar] [CrossRef]
  35. Kim, S.I.; Lee, Y.; Byon, S.M. Study on constitutive relation of AISI4140 steel subject to large strain at elevated temperatures. J. Mater. Process. Technol. 2003, 140, 84–89. [Google Scholar] [CrossRef]
  36. Sheng, Z.Q.; Shivpuri, R. Modeling flow stress of magnesium alloys at elevated temperature. Mater. Sci. Eng. A 2006, 419, 202–208. [Google Scholar] [CrossRef]
  37. Lu, Y.; Zhu, Z.; Li, D.; Xie, Q. Constitutive model of 42CrMo steel under a wide range of strain rates based on crystal plasticity theory. Mater. Sci. Eng. A 2017, 679, 215–222. [Google Scholar] [CrossRef]
  38. Kimm, J.S.; Bergmann, J.A.; Woste, F.; Pohl, F.; Wiederkehr, P.; Theisen, W. Deformation behavior of 42CrMo4 over a wide range of temperatures and strain rates in Split-Hopkinson pressure bar tests. Mater. Sci. Eng. A 2021, 826, 141953. [Google Scholar] [CrossRef]
  39. Jonšta, P.; Jonšta, Z.; Brožová, S.; Ingaldi, M.; Pietraszek, J.; Klimecka-Tatar, D. The Effect of Rare Earth Metals Alloying on the Internal Quality of Industrially Produced Heavy Steel Forgings. Materials 2021, 14, 5160. [Google Scholar] [CrossRef]
  40. Zhang, J.; Zhao, M.-C.; Tian, Y.; Zhang, J.; Wang, Z.; Zhao, Y.-C.; Peng, L. Simultaneous Enhancement of Strength and Sulfide Stress Cracking Resistance of Hot-Rolled Pressure Vessel Steel Q345 via a Quenching and Tempering Treatment. Materials 2024, 17, 1636. [Google Scholar] [CrossRef]
  41. Ferreira, A.A.; Darabi, R.; Sousa, J.P.; Cruz, J.M.; Reis, A.R.; Vieira, M.F. Optimization of Direct Laser Deposition of a Martensitic Steel Powder (Metco 42C) on 42CrMo4 Steel. Metals 2021, 11, 672. [Google Scholar] [CrossRef]
  42. Mirzaee, M.; Keshmiri, H.; Ebrahimi, G.R.; Momeni, A. Dynamic recrystallization and precipitation in low carbon low alloy steel 26NiCrMoV 14-5. Mater. Sci. Eng. A 2012, 551, 25–31. [Google Scholar] [CrossRef]
  43. Arniella, V.; Zafra, A.; Álvarez, G.; Belzunce, J.; Rodríguez, C. Comparative study of embrittlement of quenched and tempered steels in hydrogen environments. Int. J. Hydrogen Energy 2022, 47, 17056–17068. [Google Scholar] [CrossRef]
  44. Andreatta, F.; Zanocco, M.; Virgilio, S.; Machetta, P.; Silvonen, A.; Lanzutti, A.; Fedrizzi, L. Localized attack at inclusions in 42CrMo4 QT steel. Electrochim. Acta 2023, 462, 142754. [Google Scholar] [CrossRef]
  45. Peral, L.B.; Díaz, A.; Arniella, V.; Belzunce, J.; Alegre, J.M.; Cuesta, I.I. Influence of hydrogen on the hydraulic fracture behavior of a 42CrMo4 steel welds: Effect of the prior austenite grain size. Eng. Fract. Mech. 2023, 289, 109414. [Google Scholar] [CrossRef]
  46. Polášek, M.; Krbata, M.; Eckert, M.; Mikuš, P.; Cíger, R. Contact Fatigue Resistance of Gun Barrel Steels. Procedia Struct. Integr. 2023, 43, 306–311. [Google Scholar] [CrossRef]
  47. EN 10083-3: 2006; Steels for Quenching and Tempering. Technical Delivery Conditions for Alloy Steels. DIN Deutsches Institut für Normung: Berlin, Germany, 2006.
  48. Dieter, G.; Kuhn, H.; Semiatin, S. Handbook of Workability and Process Design; ASM International: Materials Park, OH, USA, 2003; pp. 47–56. [Google Scholar]
  49. Edward, G.H.; Ashby, M.F. Intergranular Fracture During Powder-Law Creep. Acta Metall. 1979, 27, 1505–1518. [Google Scholar] [CrossRef]
  50. Chokshi, A.H. The Development of Cavity Growth Maps for Superplastic Materials. J. Mater. Sci. 1986, 21, 2073–2082. [Google Scholar] [CrossRef]
Figure 1. The hot tensile tests. (a) Dimensions of the tensile specimen. (b) Vertical furnace with electric heating.
Metals 14 00647 g001
Figure 2. The hot compression tests. (a) Compression test specimen and area deformation, I-III area deformations. (b) Carbolite type electric furnace. (c) Hydraulic Heckert-EDZ-20S testing machine.
Metals 14 00647 g002
Figure 3. Tensile tests at T = 1000 °C and different strain rates conditions: (a) ε ˙ = 0.001833 s−1; (b) ε ˙ = 0.012833 s−1; and (c) ε ˙ = 0.089722 s−1.
Metals 14 00647 g003
Figure 4. Tensile tests at T = 900 °C and different strain rates conditions: (a) ε ˙ = 0.001833 s−1; (b) ε ˙ = 0.012833 s−1; and (c) ε ˙ = 0.089722 s−1.
Metals 14 00647 g004
Figure 5. Tensile tests at T = 800 °C and different strain rates conditions: (a) ε ˙ = 0.001833 s−1; (b) ε ˙ = 0.012833 s−1; and (c) ε ˙ = 0.089722 s−1.
Metals 14 00647 g005
Figure 6. Tensile tests at T = 700 °C and different strain rates conditions: (a) ε ˙ = 0.001833 s−1; (b) ε ˙ = 0.012833 s−1; and (c) ε ˙ = 0.089722 s−1.
Metals 14 00647 g006
Figure 7. The load vs. stroke variation diagram for ε ˙ = 0 .0897 s−1.
Metals 14 00647 g007
Figure 8. Variation in tensile stress as a function of true strain, at a strain rate of ε ˙ = 0 .0897 s−1.
Metals 14 00647 g008
Figure 9. Variation in tensile stress as a function of true strain, at strain rate of ε ˙ = 0 .0128 s−1.
Metals 14 00647 g009
Figure 10. Variation in tensile stress as a function of true strain, at strain rate of ε ˙ = 0 .0018 s−1.
Metals 14 00647 g010
Figure 11. Variation in tensile stress with temperature for different strain rates.
Metals 14 00647 g011
Figure 12. Compression tests at T = 800 °C. (a) ε ˙ = 0 .033 s−1, (b) ε ˙ = 0.066 s−1, (c) ε ˙ = 0 .1 s−1.
Metals 14 00647 g012
Figure 13. Compression tests at T = 900 °C. (a) ε ˙ = 0 .033 s−1, (b) ε ˙ = 0.066 s−1, (c) ε ˙ = 0 .1 s−1.
Metals 14 00647 g013
Figure 14. Compression tests at T = 1000 °C. (a) ε ˙ = 0 .033 s−1, (b) ε ˙ = 0 .066 s−1, (c) ε ˙ = 0 .1 s−1.
Metals 14 00647 g014
Figure 15. The load vs. stroke variation diagram, ε ˙ = 0 .033 s−1.
Metals 14 00647 g015
Figure 16. The variation in the compression stress vs. true strain, ε ˙ = 0 .033 s−1.
Metals 14 00647 g016
Figure 17. The variation in the compression stress vs. true strain, ε ˙ = 0 .066 s−1.
Metals 14 00647 g017
Figure 18. The variation in the compression stress vs. true strain, ε ˙ = 0 .1 s−1.
Metals 14 00647 g018
Figure 19. The variation in deformation non-uniformity vs. strain rate at different values of the strain rate and temperature.
Metals 14 00647 g019
Figure 20. SEM microstructures after the tensile tests for different strain rates at 700 °C: (a) 25×, 0.001 s−1; (b) 500×, 0.001 s−1; (c) 25×, 0.012 s−1; (d) 500×, 0.012 s−1; (e) 25×, 0.08 s−1; and (f) 500×, 0.001 s−1.
Metals 14 00647 g020
Figure 21. SEM microstructures after the tensile tests for different deformation conditions (900 °C): (a) 25×, 0.012 s−1; (b) 500×, 0.012 s−1; (c) 25×, 0.08 s−1; and (d) 500×, 0.08 s−1.
Metals 14 00647 g021
Figure 22. SEM microstructures after the tensile tests for different deformation conditions (1000 °C): (a) 25×, 0.001 s−1; (b) 500×, 0.001 s−1; (c) 25×, 0.012 s−1; (d) 500×, 0.012 s−1; (e) 25×, 0.08 s−1; and (f) 500×, 0.001 s−1.
Metals 14 00647 g022
Figure 23. SEM microstructures after the compression tests for different deformation conditions (800 °C, 900 °C and 1000 °C) at magnification 1000×: (a) Initial state, 0.001 s−1; (b) 800 °C, 0.1 s−1; (c) 800 °C, 0.06 s−1; (d) 800 °C, 0.03 s−1; (e) 900 °C, 0.1 s−1; (f) 900 °C, 0.06 s−1; (g) 900 °C, 0.03 s−1; (h) 1000 °C, 0.1 s−1; (i) 1000 °C, 0.06 s−1; and (j) 1000 °C, 0.03 s−1.
Metals 14 00647 g023
Table 1. The chemical composition of 42CrMo4 steel (wt.%).
CSiMnPSCrMo
0.38–0.45Max 0.40.6–0.9Max 0.025Max 0.0350.9–1.20.15–0.3
Table 2. Experimental results.
Crt No.Materiall0
[mm]
d0
[mm]
l1
[mm]
d1
[mm]
dr
[mm]
εl
[%]
ε d
[%]
V
[m/s]
ε ˙
[s−1]
T
[°C]
142CrMo436859.65.16.30.6555560.3630.0660.0018331000
242CrMo436857.05.06.50.5833330.3750.0660.001833950
342CrMo436856.74.36.50.5750000.4630.0660.001833900
442CrMo436856.33.96.30.5638890.5130.0660.001833850
542CrMo436856.02.96.80.5555560.6380.0660.001833800
642CrMo436849.93.45.50.3861110.5750.0660.001833750
742CrMo436842.22.37.50.1722220.7130.0660.001833700
842CrMo436861.23.96.70.7000000.5130.4620.0128331000
942CrMo436853.73.06.10.4916670.6250.4620.012833900
1042CrMo436850.02.85.80.3888890.6500.4620.012833800
1142CrMo436848.02.65.60.3333330.6750.4620.012833700
1242CrMo436863.55.56.40.7638890.3133.2300.0897221000
1342CrMo436863.13.06.00.7527780.6253.2300.089722900
1442CrMo436859.72.66.10.6583330.6753.2300.089722800
1542CrMo436843.52.27.50.2083330.7253.2300.089722700
Table 3. Experimental values of the compression test at the temperature of 800 °C.
Crt. No.MaterialT
[°C]
d0
[mm]
h0
[mm]
V
[m/s]
dmin
[mm]
dmax
[mm]
h1
[mm]
εh
[%]
εd
[%]
d m i n d m a x
[-]
ε ˙
[s−1]
1.42CrMo480018300.00318.352717.10.430.51.471390.1
2.42CrMo480018300.00218.225.419.20.360.411.3956040.066
3.42CrMo480018300.00118.2523.1 23.20.220.281.2657530.033
Table 4. Experimental values of the compression test at the temperature of 900 °C.
Crt. No.MaterialT
[°C]
d0
[mm]
h0
[mm]
V
[m/s]
dmin
[mm]
dmax
[mm]
h1
[mm]
εh
[%]
εd
[%]
d m i n d m a x
[-]
ε ˙
[s−1]
1.42CrMo490018300.00319.527.715.7 0.470.531.4200.1
2.42CrMo490018300.00220.627.818.10.390.541.3490.066
3.42CrMo490018300.00123.330.221.90.270.671.2960.033
Table 5. Experimental values of the compression test at the temperature of 1000 °C.
Crt. No.MaterialT
[°C]
d0
[mm]
h0
[mm]
V
[m/s]
dmin
[mm]
dmax
[mm]
h1
[mm]
εh
[%]
εd
[%]
d m i n d m a x
[-]
ε ˙
[s−1]
1.42CrMo4100018300.00320.83013.10.560.661.432690.1
2.42CrMo4100018300.00218.426.418.30.390.461.434780.066
3.42CrMo4100018300.00118.4526.121.10.290.451.414630.033
Disclaimer/Publisher’s Note: The statements, opinions and data contained in all publications are solely those of the individual author(s) and contributor(s) and not of MDPI and/or the editor(s). MDPI and/or the editor(s) disclaim responsibility for any injury to people or property resulting from any ideas, methods, instructions or products referred to in the content.

