Abstract
The structural design of steel–titanium composite plates significantly affects their corrosion resistance. To investigate the impact of defects of different shapes and sizes on the corrosion behavior of steel–titanium composite plates, this study designed six types of defects and conducted a series of characterization tests. The results showed that due to the galvanic interaction between carbon steel and titanium alloy, small defects initially accelerate corrosion, resulting in 50% to 200% more corrosion weight loss compared to large defects. However, in the later stages of immersion, the corrosion rate of small defects decreased by up to 35%, which was attributed to the accumulation of protective corrosion products. Additionally, there is an inverse relationship between the corrosion rate and the thickness ratio of the composite plate. The reduction in the area of Q345B also results in additional corrosion loss of up to 32%.
1. Introduction
Steel–titanium composite plate plates [1,2,3,4], as an emerging class of composite materials, capitalize on the synergistic benefits of carbon steel’s superior mechanical properties and cost-effectiveness, coupled with the corrosion resistance of titanium alloys [5,6]. This combination has led to their extensive application in various large-scale infrastructure projects, such as bridges, pipelines, and offshore platforms, offering significant advantages in terms of cost-effectiveness and corrosion resistance. However, due to their unique structure and inevitable defects, steel–titanium composite plates still face significant corrosion challenges in harsh marine environments characterized by high humidity, high temperatures, and corrosive ions [7,8,9,10].
Previous studies have extensively explored the corrosion behavior of these composite plates in marine environments [11,12,13], focusing on aspects such as surface corrosion, electrochemical behavior, and long-term stability. Li et al. investigated the performance of 316L stainless steel and A6 carbon steel composite plates under neutral salt spray tests, observing significant elemental overlap at the composite interface [12]. Patnaik et al. indicated that the coupling of titanium with steel accelerates the corrosion of steel due to titanium’s more noble position in the electrochemical series [13]. Prolonged exposure led to accelerated corrosion along the interface of A6 carbon steel components, surpassing the corrosion rate of the carbon steel matrix. Li et al.’s results indicate that the corrosion of titanium–steel composite plates is influenced by various corrosion behaviors in both the near-interface and far-interface regions [5,6]. In regions far from the interface unaffected by galvanic effects, the corrosion reaction begins with localized corrosion, which then transitions to uniform corrosion. At the interface, carbon steel experiences accelerated corrosion through galvanic effects in the early stages. In the later stages, once the corrosion at the interface reaches a certain level, it transitions to a combined action of galvanic corrosion and crevice corrosion.
In marine environments, various factors significantly influence the corrosion of titanium-clad steel plates. Salinity, temperature, pH levels, and oxygen concentrations are pivotal in determining the rate and nature of corrosion [14,15,16,17,18,19]. These environmental variables can either accelerate corrosive processes or, in some instances, help form protective barriers on the materials [20,21]. Liu et al. studied the corrosion behavior of steel–titanium composite plates in different marine environments [22]. The composite interface area has a complex, layered structure and can be divided into five areas. Among them, areas III and IV have higher electrochemical activity and are corrosion-inducing areas. The microcurrent in zone III is twice that of carbon steel and titanium. At the same time, the accumulation of Cr in the corrosion product layer promotes the generation of α-FeOOH, further improving the protection of the corrosion product layer. Furthermore, effective strategies for corrosion prevention are essential in extending the lifespan of these composite materials. Techniques such as applying protective coatings, implementing cathodic protection, or modifying the alloy composition are commonly employed. However, the effectiveness of these strategies varies based on environmental conditions and the specific application of the material. Additionally, the long-term durability and maintenance of titanium-clad steel plates in harsh marine environments remain a critical concern. Regular maintenance practices, proactive inspection schedules, and timely repairs play a crucial role in ensuring the structural integrity and performance of these materials over time.
The presence of surface defects has been identified as a critical factor exacerbating corrosion in composite plates. Hu et al. examined the galvanic corrosion behavior of Titanium-Clad Steel Plates (TCSP) with defects penetrating the titanium layer from the side and underside [11]. The galvanic corrosion on the TCSP side resulted in extensive pitting corrosion, with pits distributed differently across splash zones, tidal zones, and submerged areas. Severe corrosion occurred beneath TCSP titanium layer defects, with the size of the defect impacting the density of corrosion products. Zhao et al.’s research showed that defects increased the corrosion rate, and while welds did not alter the structure of the corrosion product film, defects led to a lack of protective corrosion products [23]. Additionally, defects invariably increase the corrosion rate. Under flowing systems, samples with shallow defects tended to deepen radially, and under high shear rates [24], the upper and rear edges of defects showed tendencies to deepen and expand the affected area. However, existing studies lack a comprehensive understanding of the corrosion mechanisms and influencing factors of various sizes and types of defects, leaving knowledge gaps that require further exploration to address practical engineering challenges.
To deepen the understanding of the corrosion behavior of titanium–steel composite plates in marine environments, this study focuses on pinpointing corrosion mechanisms in simulated marine solutions, examining point defects [25,26,27], surface defects, and samples with varying thickness ratios [28]. Through systematic experimental investigations, this research aims to enhance the understanding of the corrosion mechanisms of titanium–steel composite plates in marine settings, providing crucial insights for the design of more corrosion-resistant engineering materials.
2. Materials and Methods
2.1. Immersion Test
This study conducts a comprehensive examination of the corrosion resistance of titanium–steel composite plates, specifically focusing on different types of surface defects and varying thickness ratios. The experimental design was structured into four distinct periods: 7, 15, 30, and 45 days. The simulated marine environment for these experiments was using Xisha simulated solution, comprising 0.1 wt% NaCl, 0.05 wt% Na2SO4, and 0.05 wt% CaCl2, with a pH maintained at 4.9.
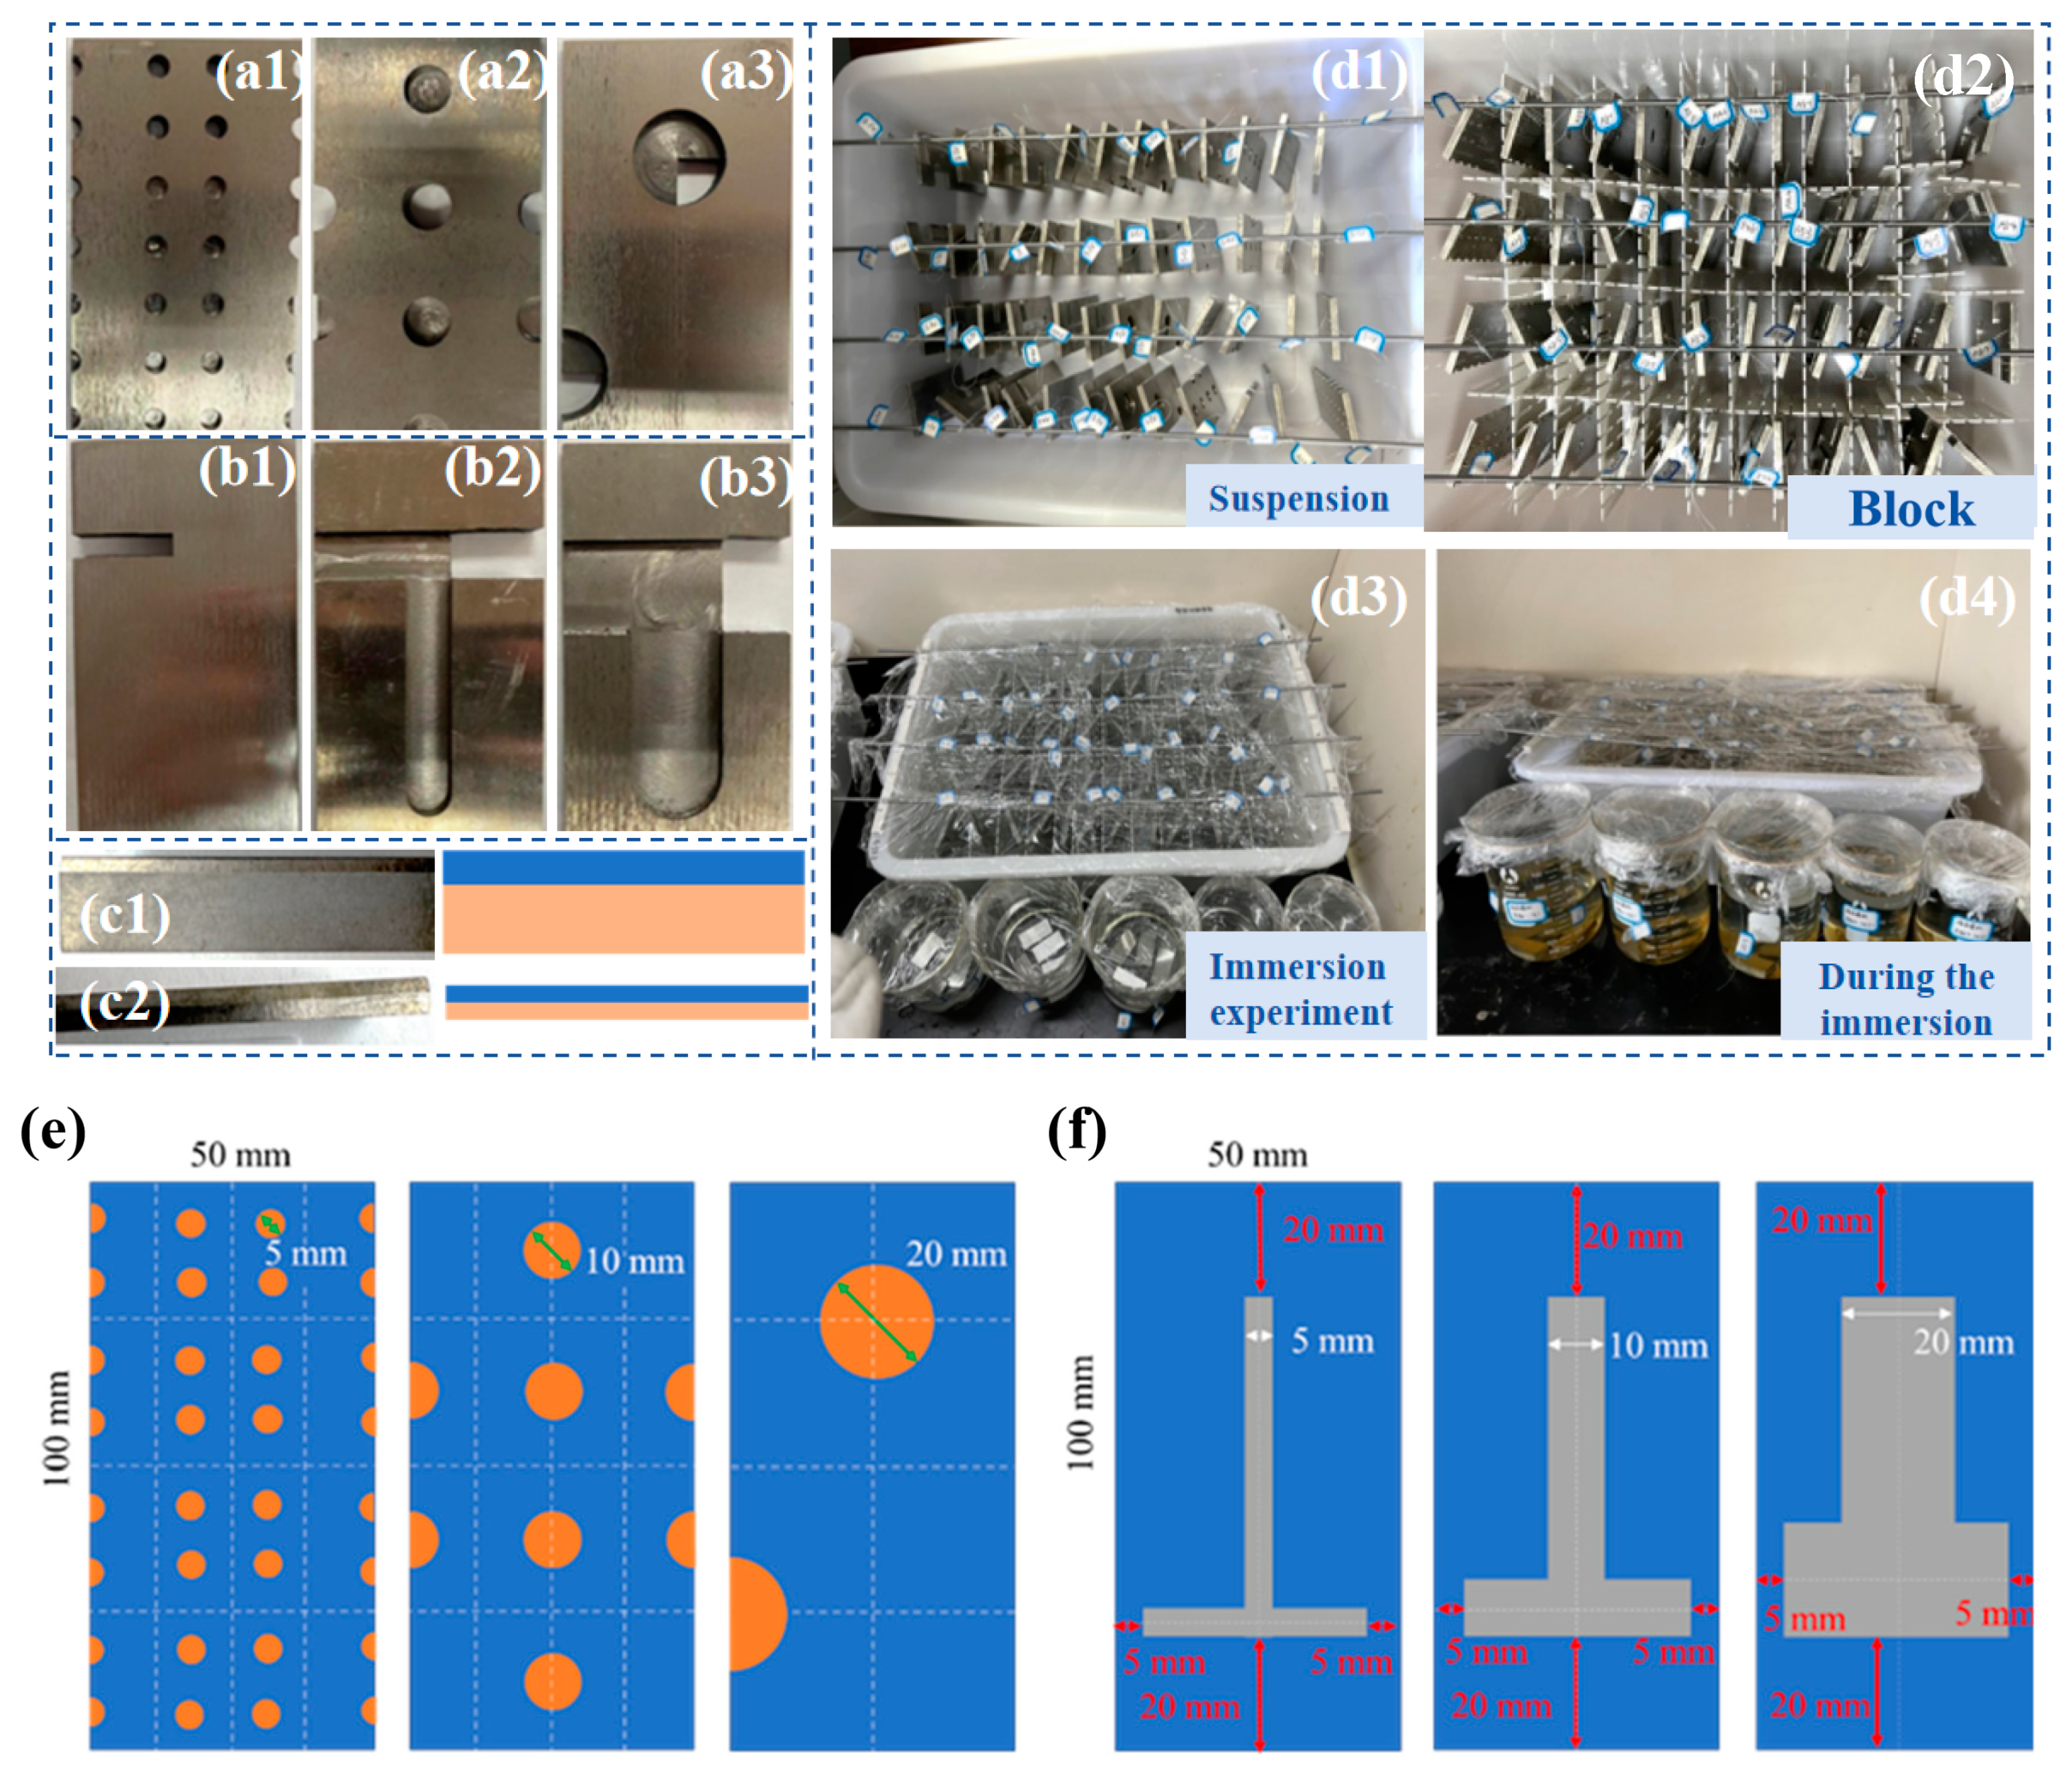
The experimental samples were categorized into three distinct groups based on their defect types and thickness ratios, as illustrated in Figure 1a–c. The first two groups comprised three sets of point defect samples and three sets of line defect samples, respectively. In these groups, the titanium plates were consistently 2 mm thick, while the Q345B steel plates were 4 mm thick. The third group consisted of two types of titanium–steel composite plates with varying thickness ratios. The specific thicknesses of the titanium and Q345B steel in this group are depicted in Figure 1(c1,c2), designed with ratios of 1:4 and 1:1, respectively. The sample size and structural design of three types of point defects and three types of line defects are shown in Figure 1e,f. The chemical compositions of titanium alloy plate and carbon steel are shown in Table 1 and Table 2, respectively.
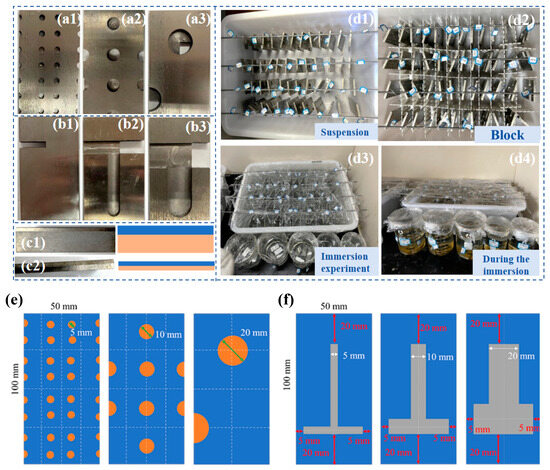
Figure 1.
Preparation process for specimen immersion and initial state after immersion. (a1–a3) are samples with three types of point defects, (b1–b3) are samples with three types of point defects, (c1,c2) are samples with two different thickness ratios, (d1–d4) show the four main steps of the immersion experiment, (e) is the design drawing of three point defect samples, (f) is the design drawing of three line defect samples.

Table 1.
Chemical composition of titanium (wt%).
Table 2.
Chemical composition of Q345B low alloy steel (wt%).
2.2. Weight Loss Measurement
In this investigation, eight carbon steel specimens were methodically prepared, each exhibiting varying exposed areas from 5.598 cm2 to 17.6 cm2. The initial preparation of each sample involved a standard procedure of polishing, followed by degreasing using acetone and subsequent cleansing with anhydrous ethanol. Upon drying, their initial weights were meticulously recorded. The samples were then subjected to a series of four immersion cycles, during which the non-experimental areas were carefully sealed. After each cycle, the corrosion morphology was documented to track progressive changes.
The removal of rust was carried out in accordance with the GB/T16545-1996 standards [29], employing a designated solution and conducting the procedure within a fume hood to ensure safety and accuracy. Following this, each specimen underwent ultrasonic cleaning and was extensively rinsed with distilled water and anhydrous ethanol, after which they were dried, and their post-corrosion weights were accurately measured. To avoid errors, all measurements were performed three times and averaged in the final results.
To elucidate the influence of surface defects on the corrosion resistance of the specimens, a detailed examination of their surface micromorphology post-rust removal was conducted using a scanning electron microscope (SEM, ZEISS Gemini SEM 500, Jena, Germany).
2.3. Electrochemical Testing
Electrochemical measurement is carried out in PARSTAT4000A (AMETEK, San Diego, CA, USA) electrochemical workstation. A standard three-electrode system comprising a saturated calomel electrode (SCE) as the reference electrode, a Pt plate as the counter electrode (CE), and specimens as the working electrode (WE) were hired in the electrochemical test. Before the electrochemical experiment, the open circuit potential was measured for 60 min until it reached a stable state. When the dynamic polarization curve is measured, the scanning rate is 0.5 mV/s, and the scanning potential ranges from 0.5VvsOCP to 0.5VvsOCP. EIS tests were performed over the frequency range of 100 kHz to 0.01 Hz at open-circuit potential (OCP) with a 10 mV sinusoidal amplitude. The EIS data were analyzed using the ZsimpWin 3.1 software. The test solution was consistent with the soaking experiment. The displayed results are selected based on tests conducted three times or more to ensure the reproducibility of the experiment.
3. Results
3.1. The Impact of Point Defects
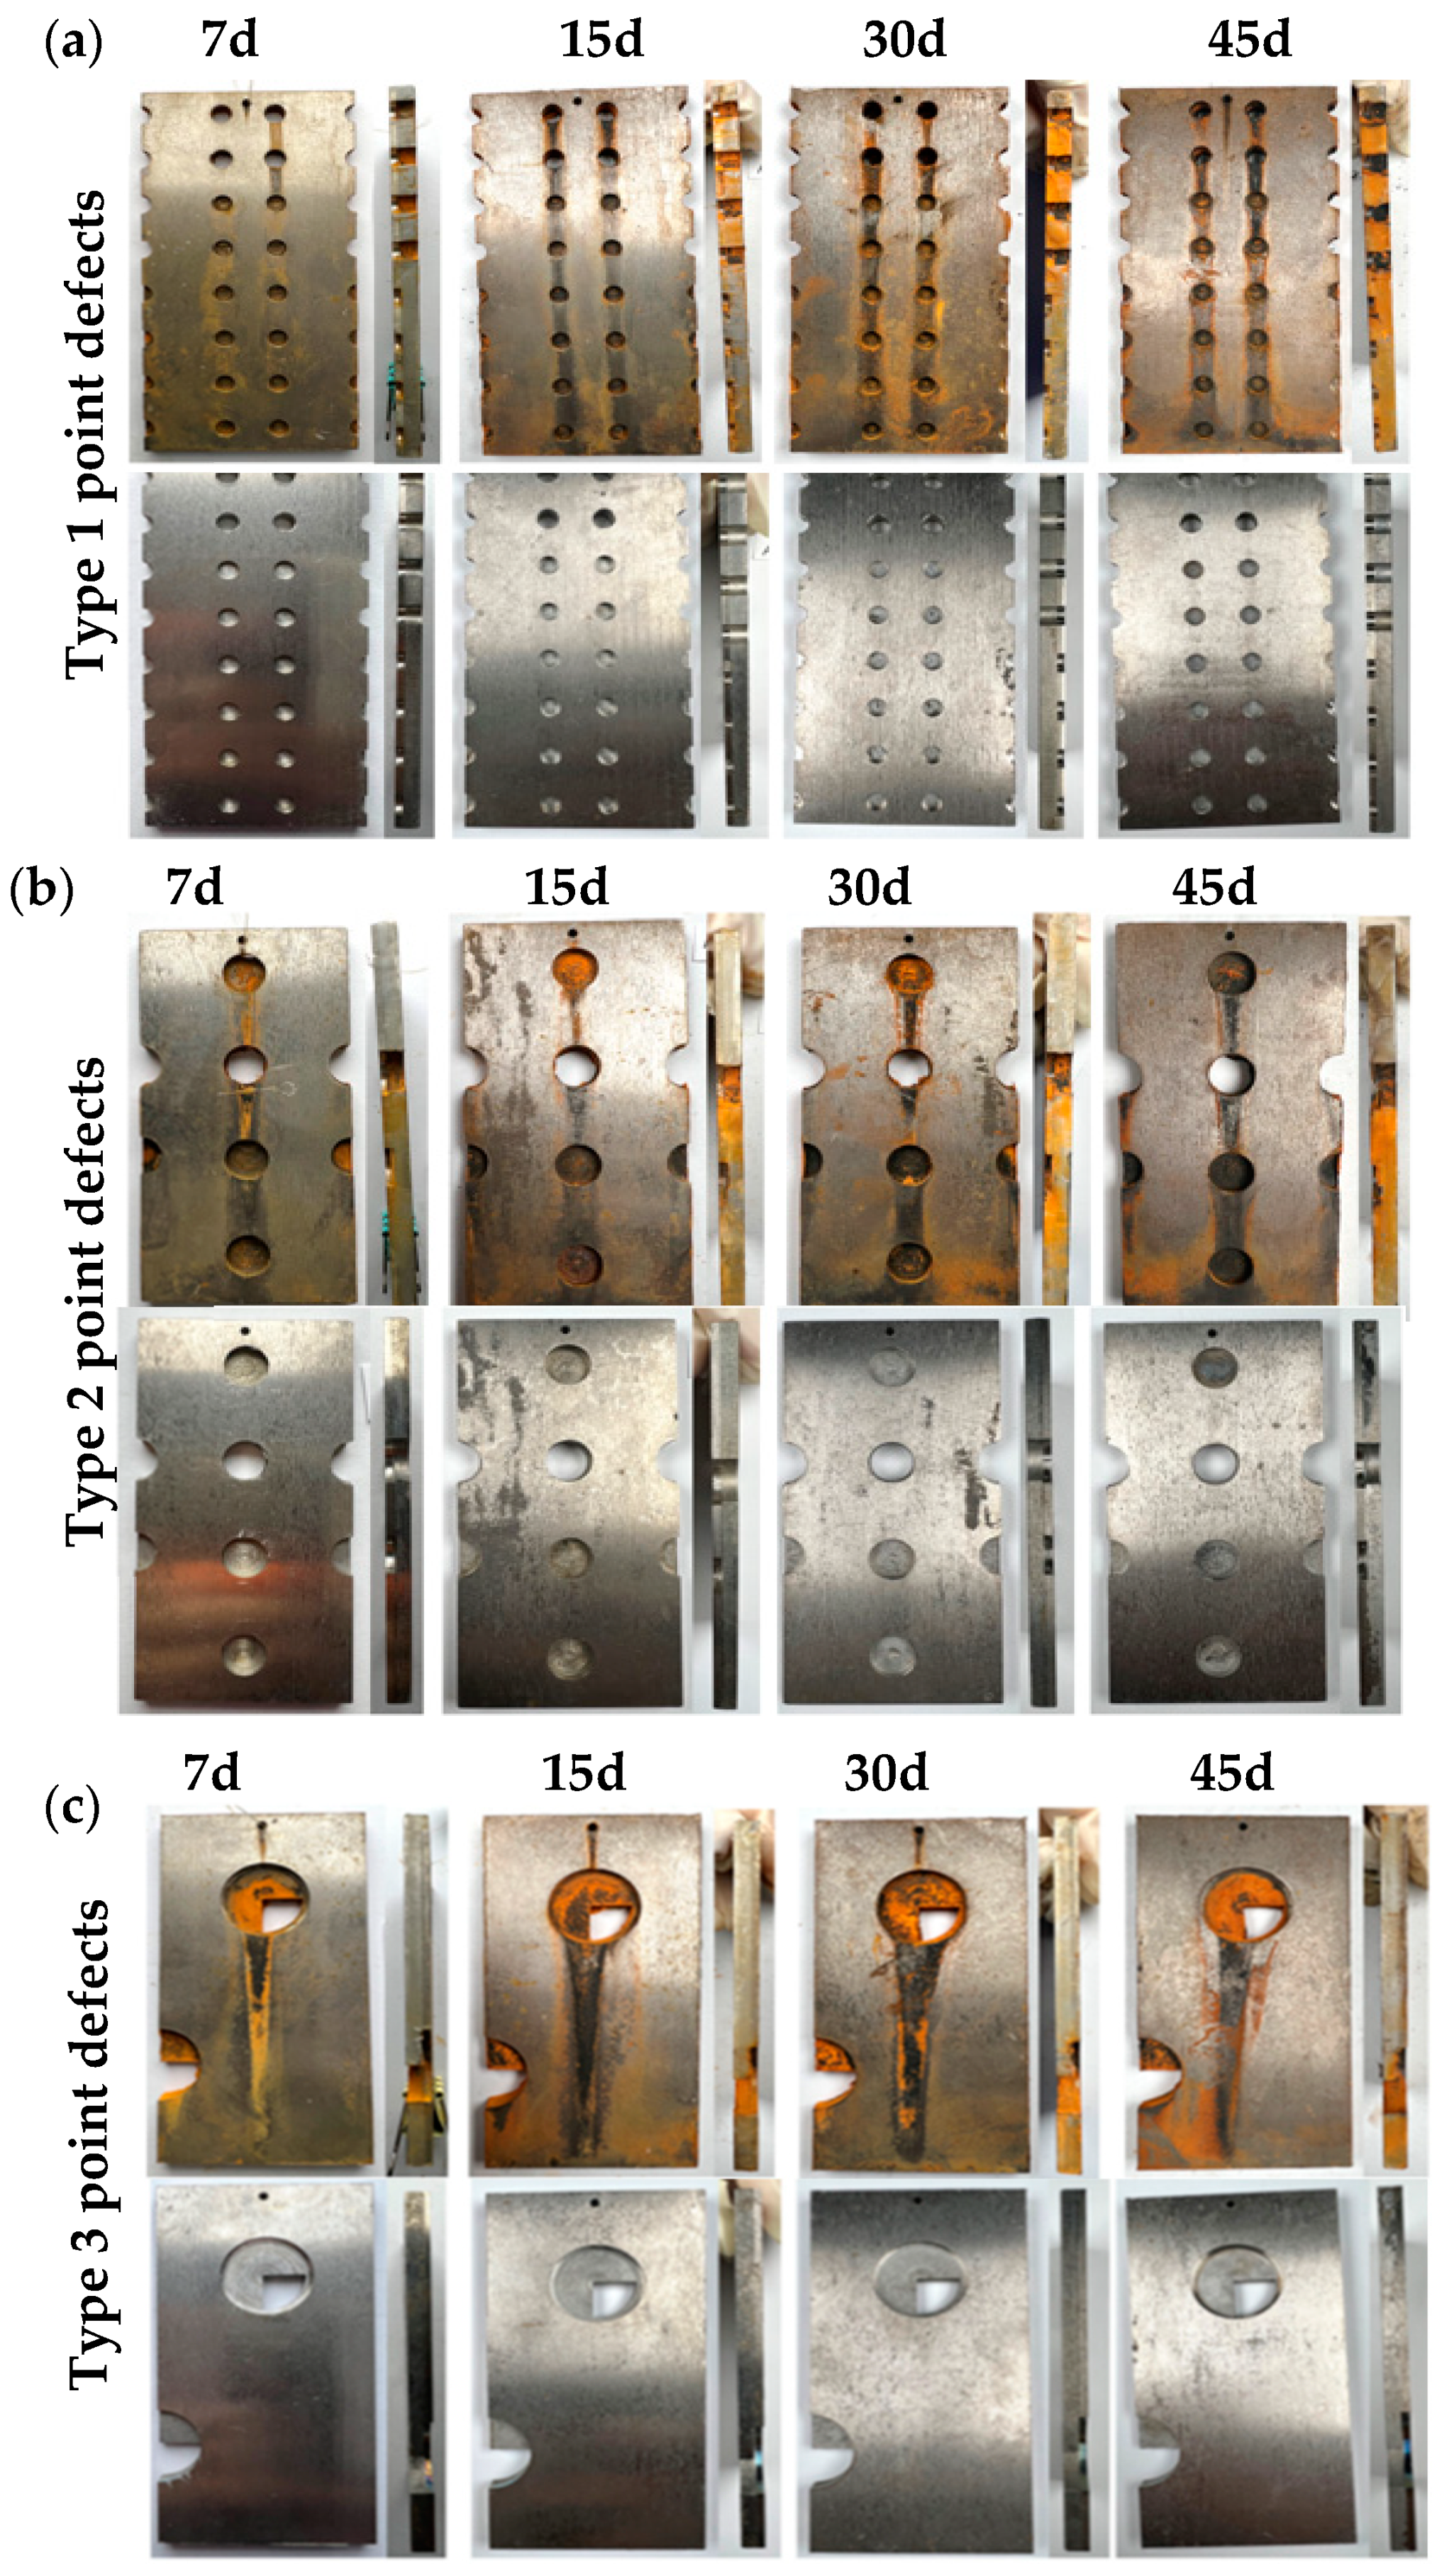
In Figure 2a, the first type of point defects shows these trends: After 7 days, slight corrosion products accumulate around the through-hole, while noticeable corrosion, indicated by red rust traces, appears in the non-through-hole area. At 15 days, rust layers significantly increase in both regions, with noticeable corrosion products at the hole and exposed carbon steel edges. By 30 days, surface rust flow is significantly enhanced for both defect types. After 45 days, despite a slight increase in corrosion products and rust flow, the corrosion rate slows, with minimal changes from the 30-day mark. The titanium plate remains uncorroded, while the carbon steel surface shows progressively deepening corrosion over time. In Figure 2b, the second type of point defect shows limited rust layer accumulation in both through-hole and non-through-hole regions after 7 days of immersion testing, with red rust streaks on the titanium plate surface. With increased immersion time, corrosion products continue to accumulate in the through-hole area and gradually increase in the non-through-hole area, filling the holes and accumulating externally. The proportion of loose, easily detached red rust decreases, while dense rust layers significantly accumulate in the hole defect area, and red rust streaks on the titanium plate deepen. After rust removal, corrosion traces inside the holes are slight at early stages but become more pronounced with time, forming corrosion pits on the hole surfaces. In Figure 2c, the third type of point defect shows more pronounced corrosion in both the through-hole and surrounding non-through-hole areas. With prolonged immersion, corrosion products gradually cover the entire exposed carbon steel surface, and red rust streaks become more prominent. After rust removal, the dissolution of the steel matrix at the hole-like defect areas is evident, with corrosion traces deepening over time.

Figure 2.
Macroscopic corrosion morphologies of different point-defect samples in simulated marine solution after various immersion durations: (a) type I point defects; (b) type II point defects; (c) type III point defects.
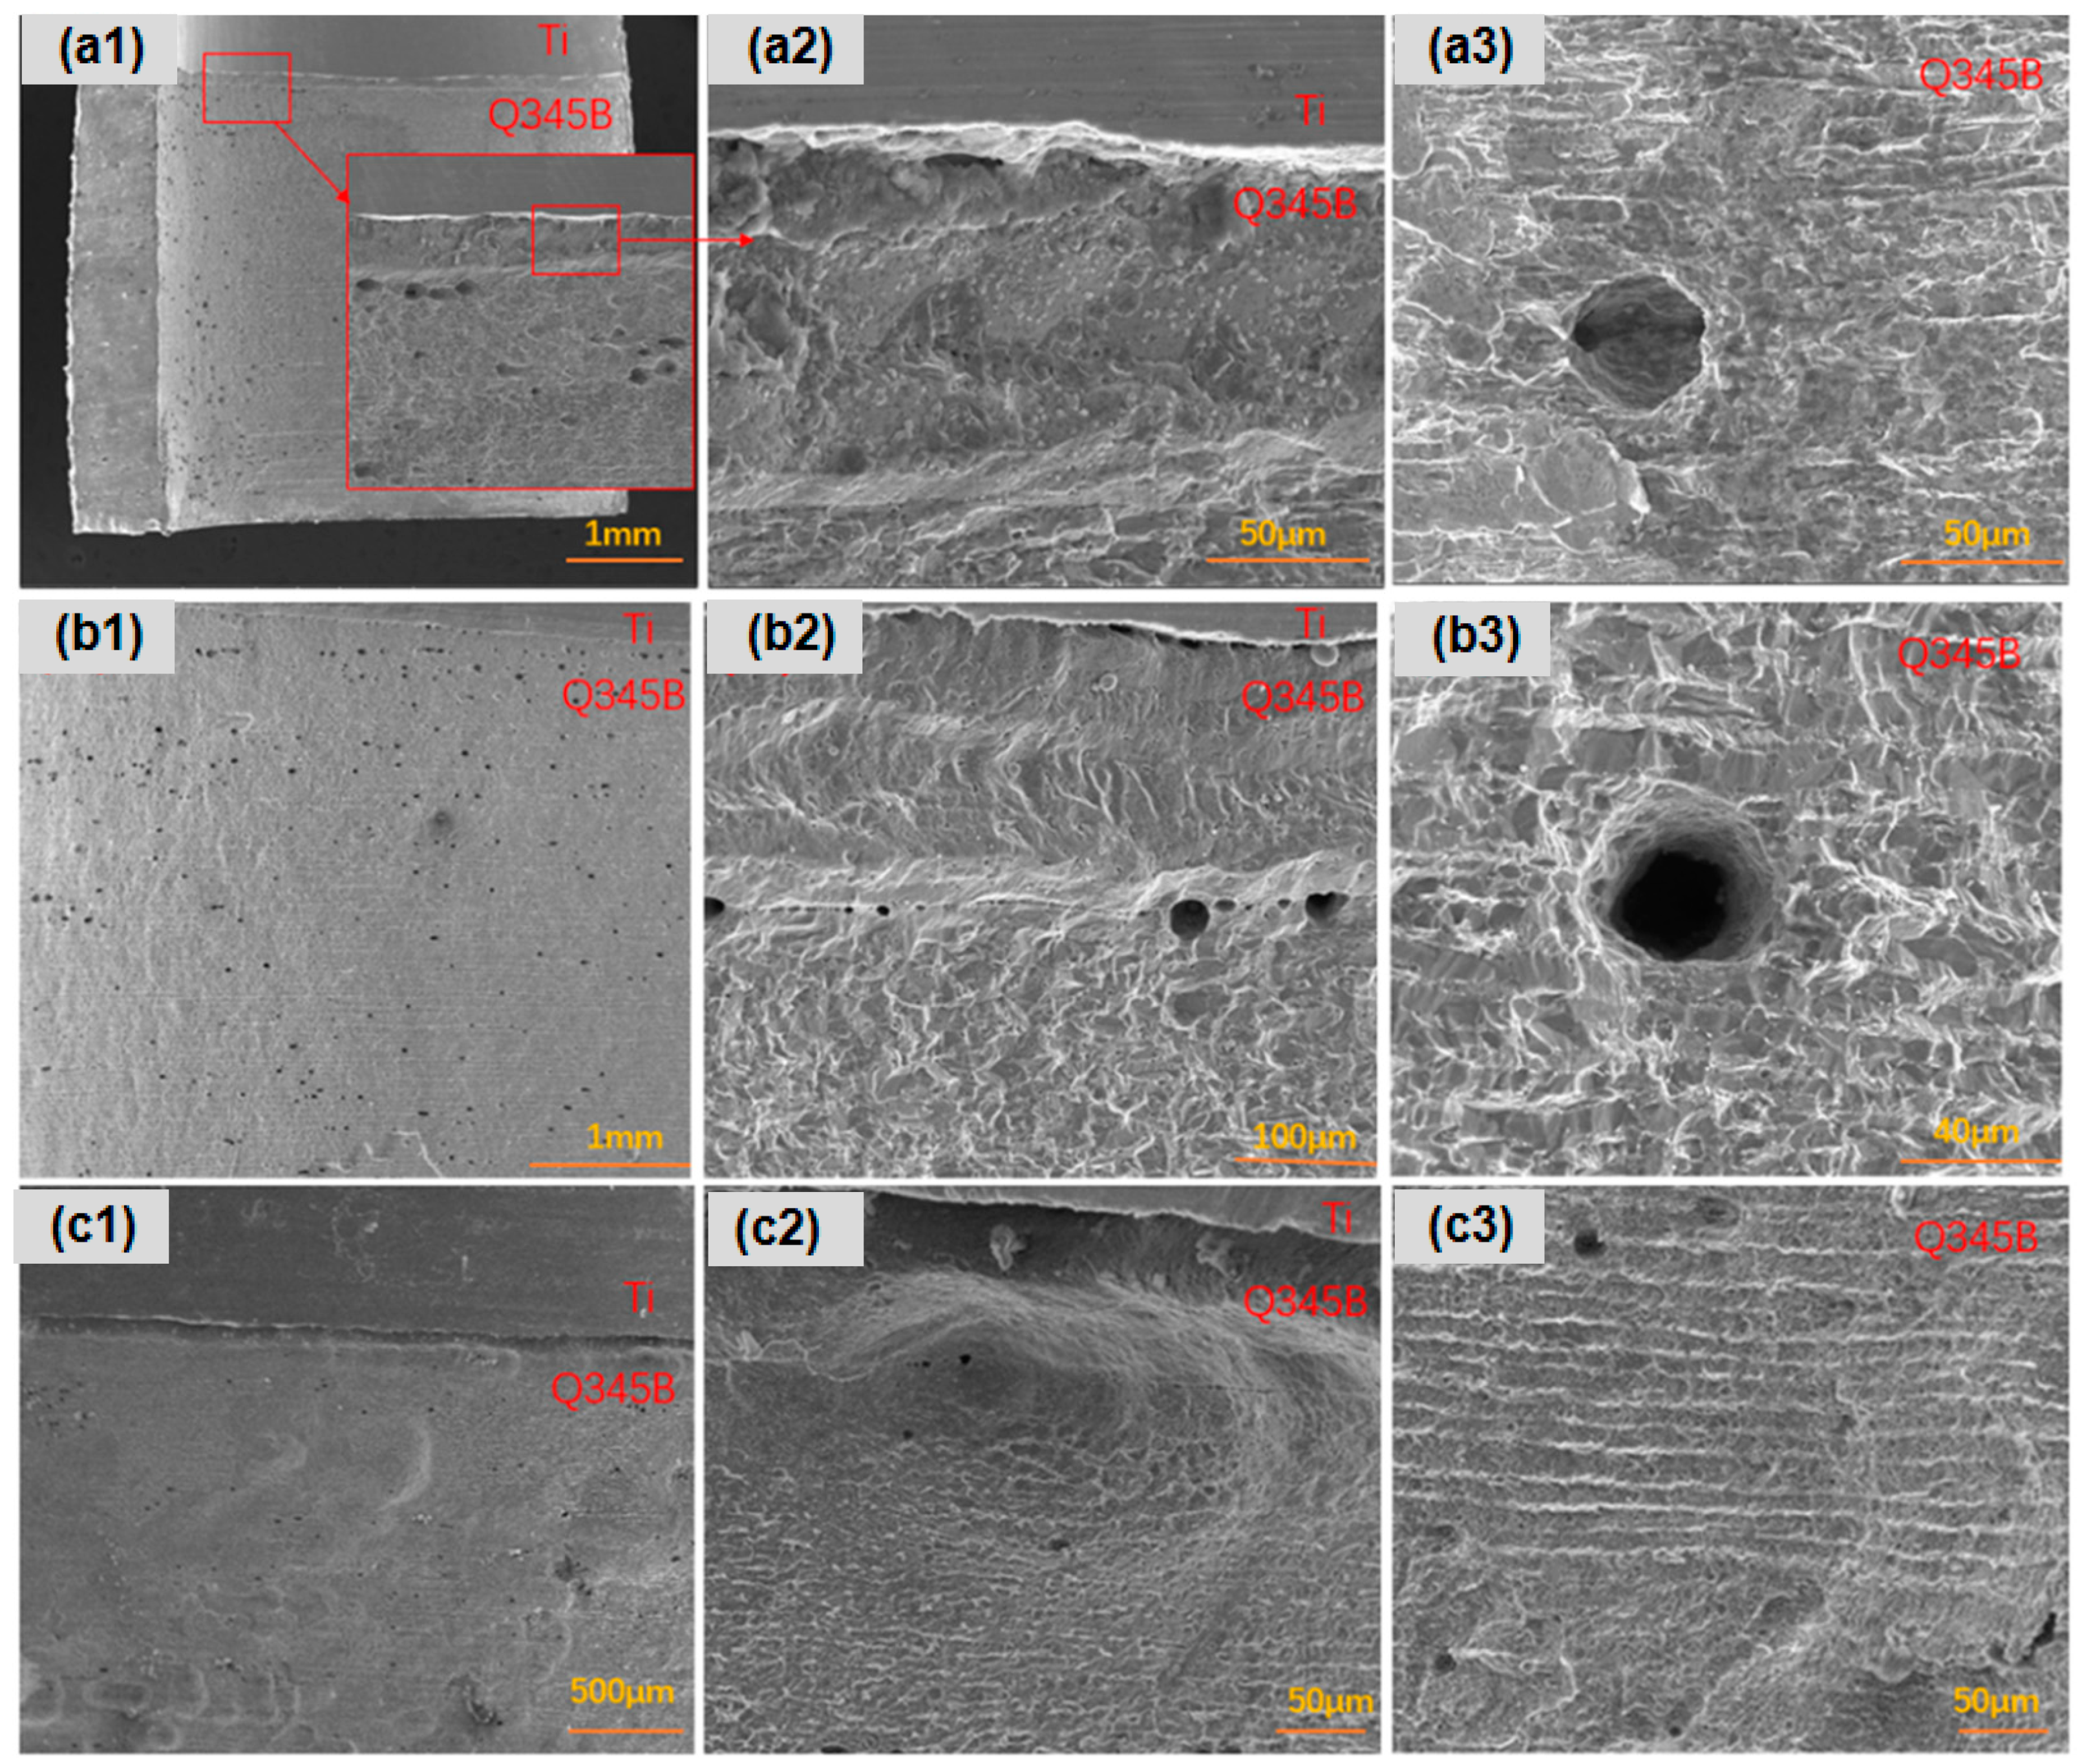
After 45 days of immersion in a simulated marine solution, detailed observations were made on the corrosion behavior of three types of point-defect titanium–steel composite plates. As shown in Figure 3, the carbon steel surface with type I point defects exhibited significant longitudinal corrosion, especially in areas far from the composite plate (Figure 3a). Type II point defects displayed dense pitting on the carbon steel longitudinal surface, particularly in regions distant from the composite plate, with small, deep pits at the composite interface (Figure 3b). Type III point defects exhibited uniform longitudinal corrosion in the titanium–steel composite plates, with smaller and shallower pits (Figure 3c).
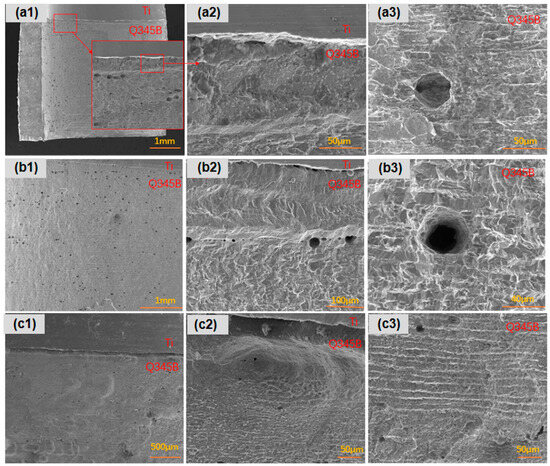
Figure 3.
Longitudinal corrosion morphologies of point-defect samples after 45-day marine immersion. (a1–a3) are type I point defects; (b1–b3) are type II point defects; (c1–c3) are type III point defects.
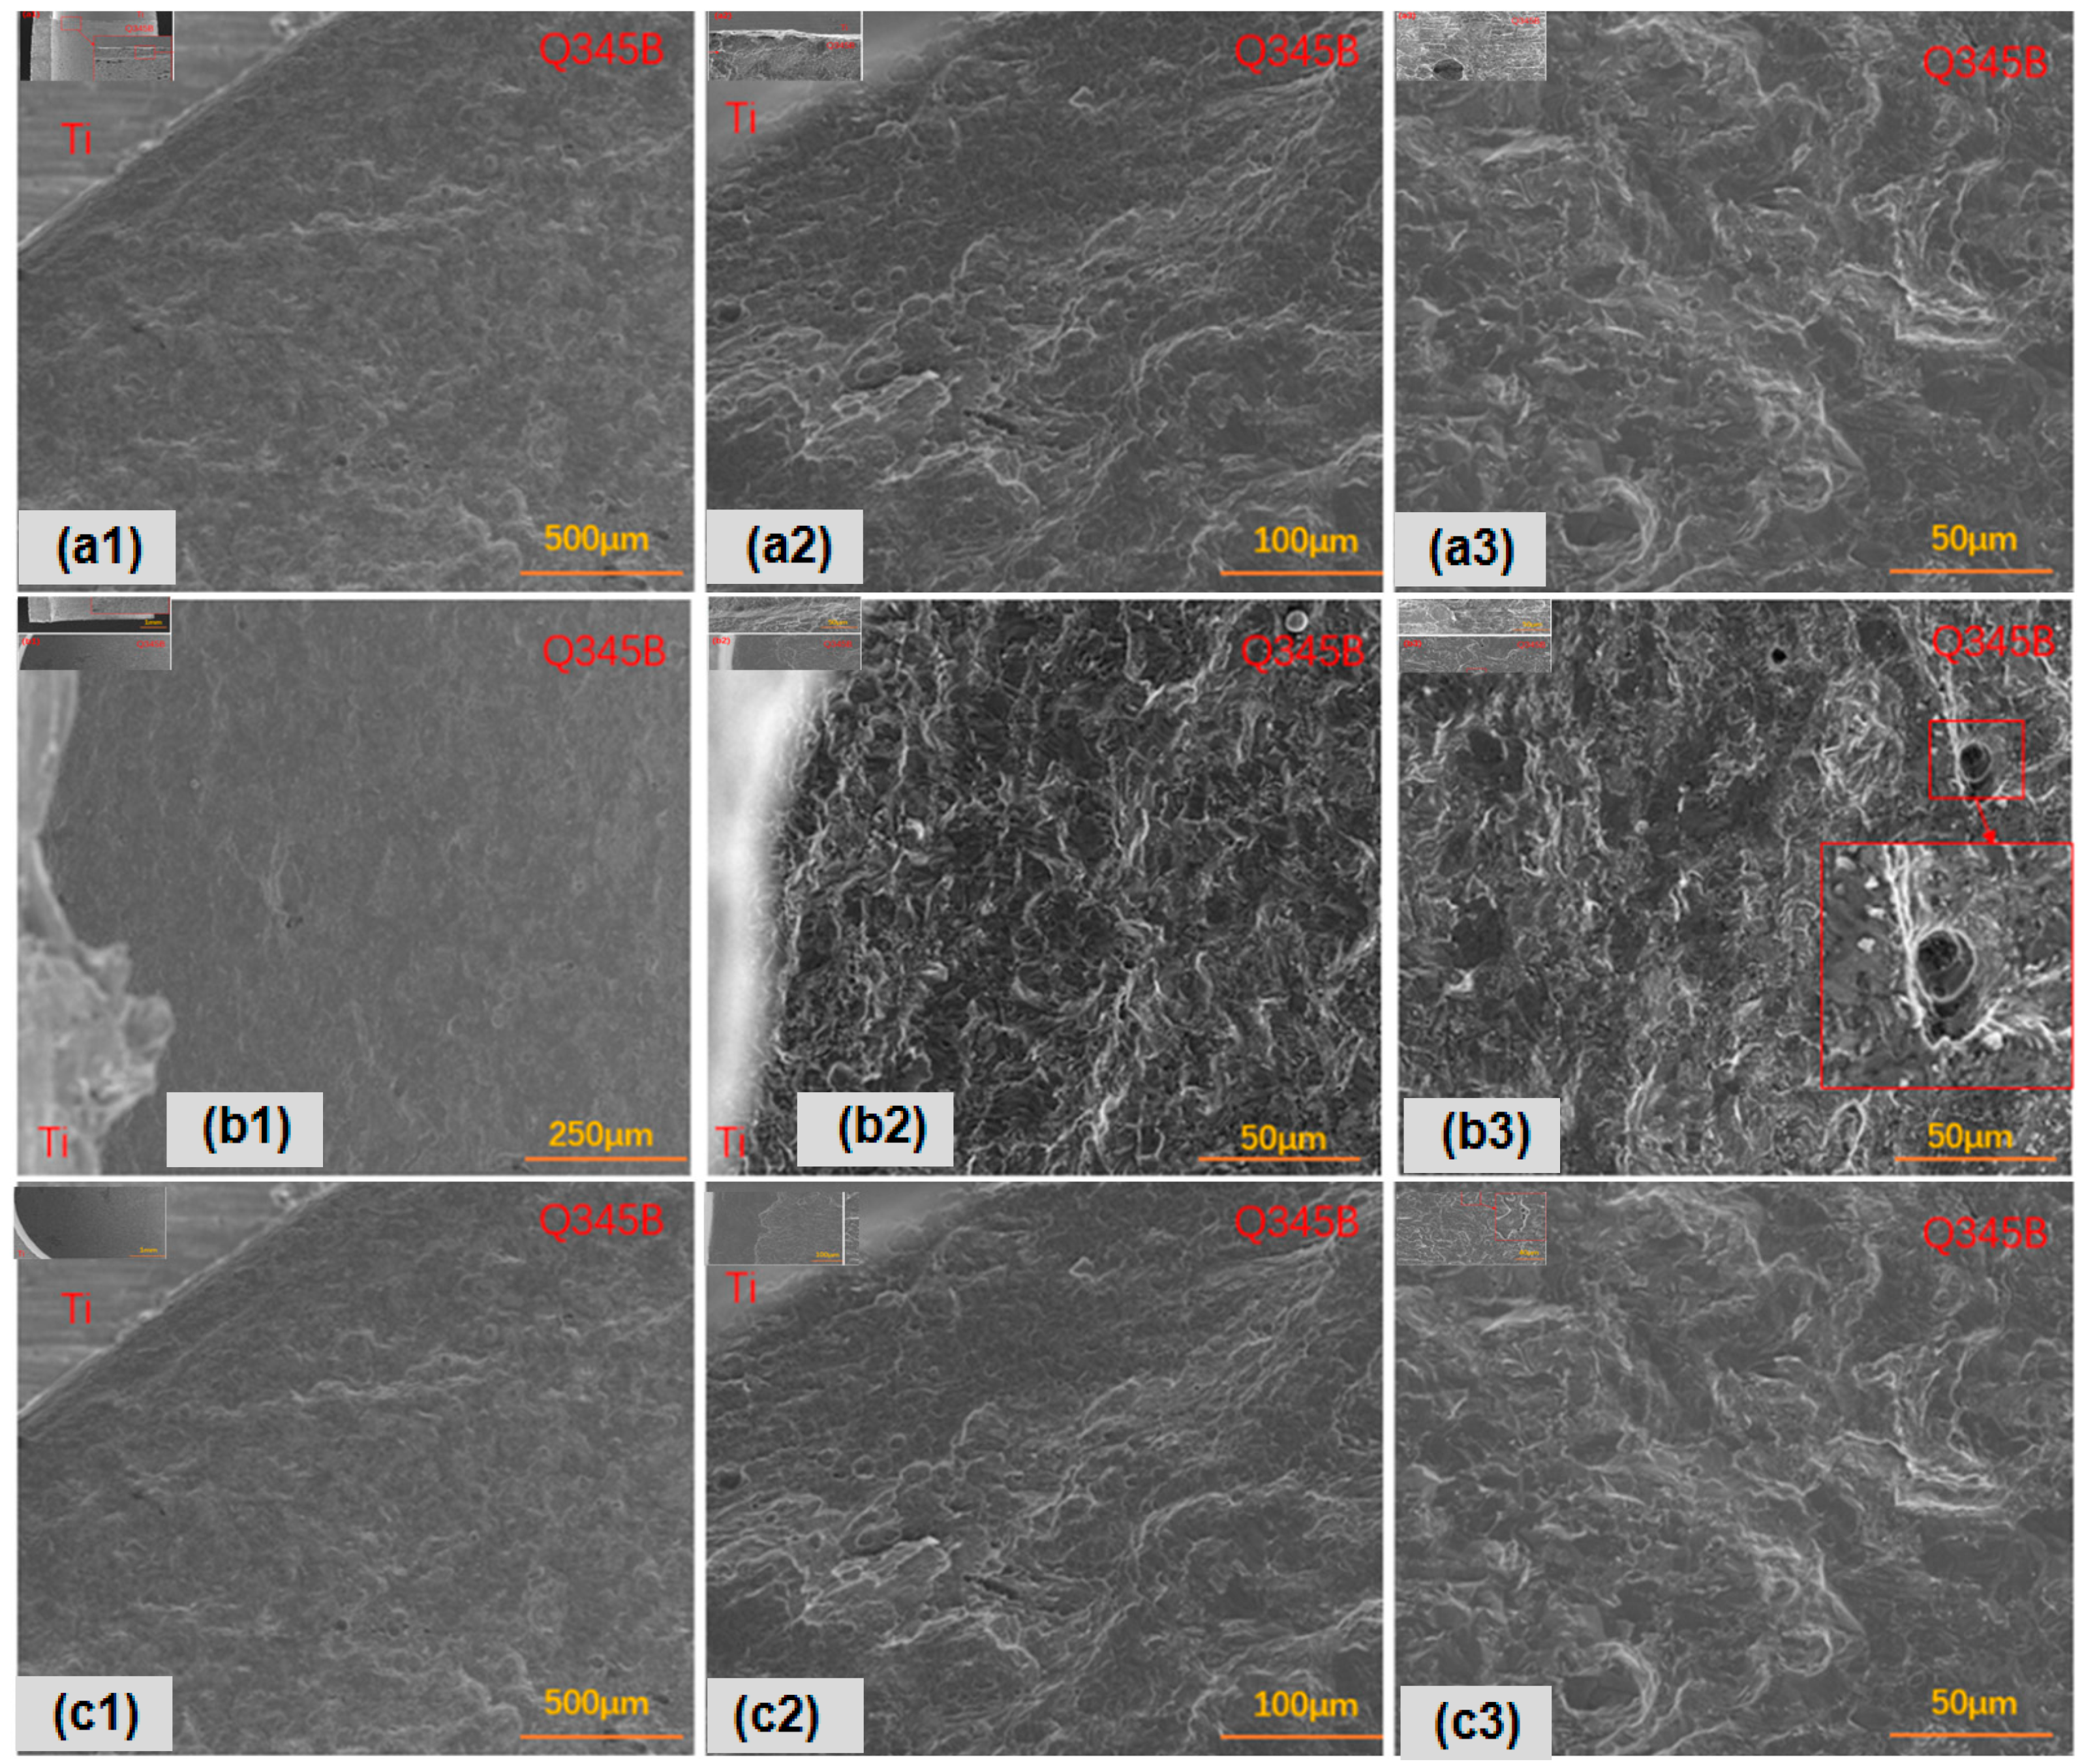
In contrast, focusing on surface corrosion, as shown in Figure 4, the titanium–steel composite plate with type I point defects exhibited uniform surface corrosion, with larger corrosion pits and notable pitting. Longitudinal galvanic corrosion of titanium–steel was more pronounced (Figure 4a). Type II point defects also showed uniform surface corrosion, but the pits were smaller and shallower, with more evident accelerated longitudinal galvanic corrosion (Figure 4b). Lastly, the titanium–steel composite plate with type III point defects exhibited uniform surface corrosion (Figure 4c). Due to the differences between ferrite and pearlite, deeper surface corrosion mainly occurred in ferrite areas, with less accelerated galvanic corrosion.

Figure 4.
Transverse corrosion morphologies of point-defect samples after 45-day marine immersion: (a1–a3) are type I point defects; (b1–b3) are type II point defects; (c1–c3) are type III point defects.
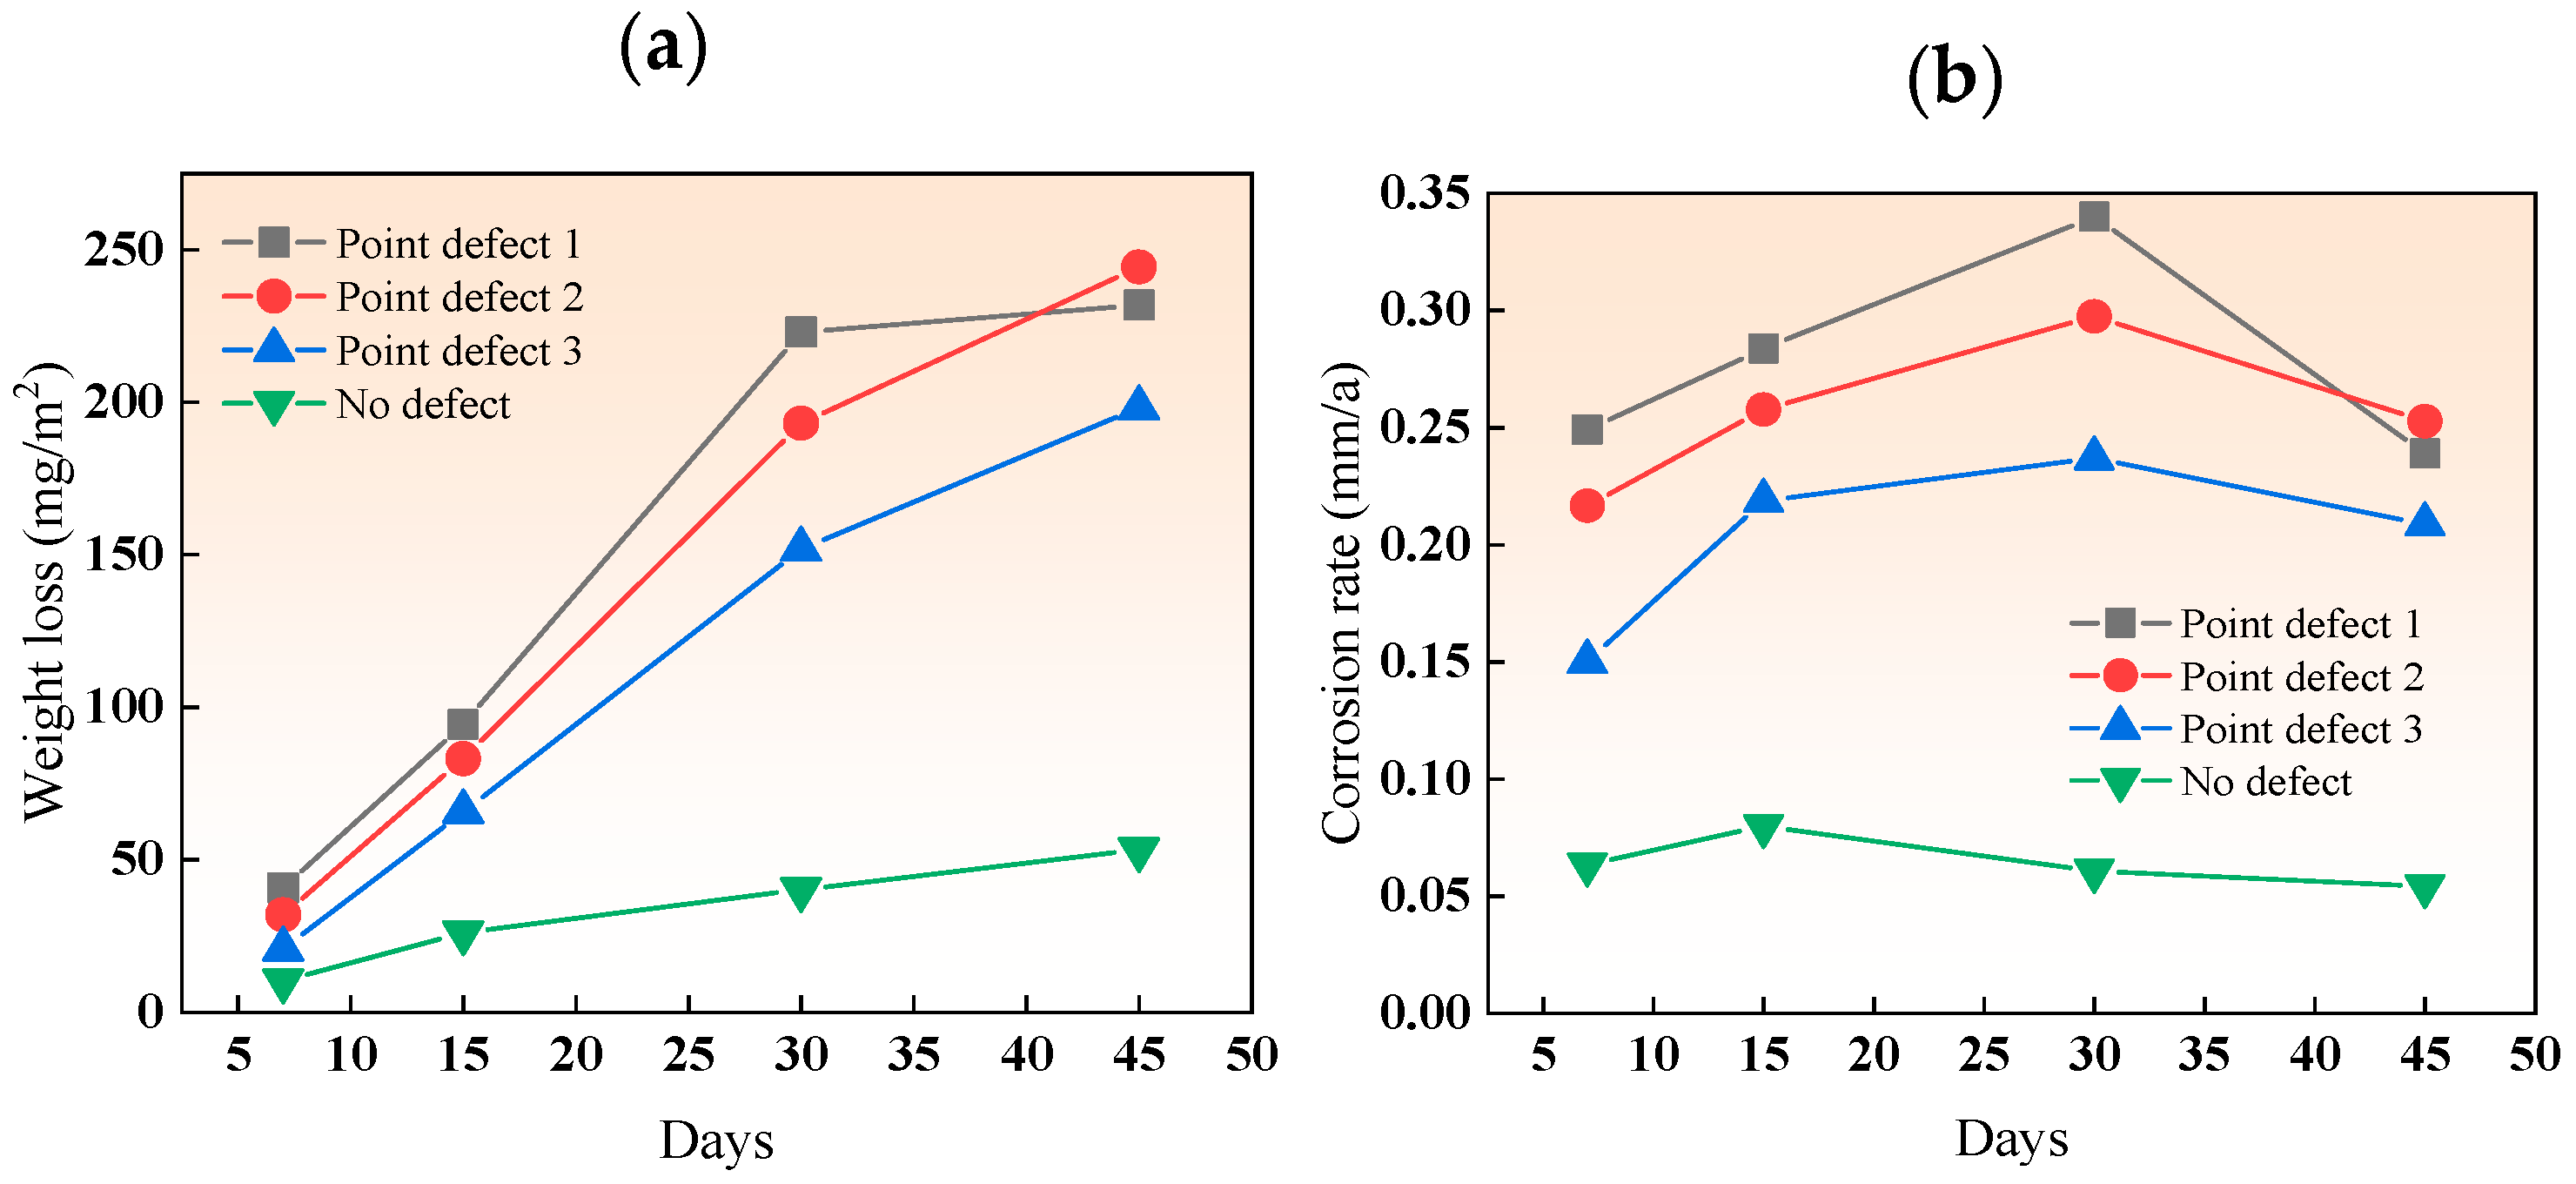
Figure 5 shows the weight loss and corrosion rate of the three types of point-defect samples in the simulated marine solution after various immersion durations. The increasing weight loss for all three types of point defects indicates an intensifying degree of corrosion. The corrosion rate increased in the first three cycles and decreased in the fourth cycle (45 days) due to the early formation of loose, easily detachable corrosion products. Among them, the corrosion rate of point defect 1 dropped by 35%, and the corrosion rate of point defect 2 dropped by 16%.
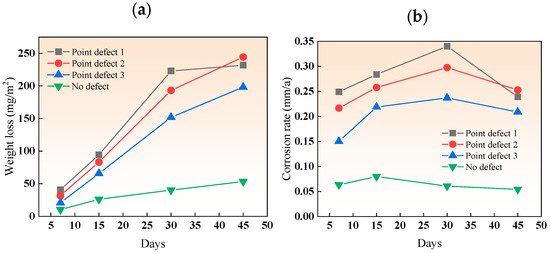
Figure 5.
(a) Weight loss and (b) corrosion rate of different point-defect samples in simulated marine solution after various immersion durations.
Over time, these products accumulated and became denser and harder to detach, forming a protective layer and reducing the corrosion rate of carbon steel. In the simulated marine solution, the period of increased corrosion rate for the three types of point defects was longer than in a neutral salt spray environment. This is because the titanium–steel composite plates corroded more severely in the salt spray environment, forming a dense corrosion product film more quickly, hence the reduction in corrosion rate starting in the third cycle. The decrease in corrosion rate with increasing defect size is due to the significant effect of galvanic acceleration in small-sized defects. In the fourth cycle, the accumulation of corrosion products in type I point defects provided some protection to the carbon steel, leading to a reduced corrosion rate. The delay in the onset of the decrease in the rate of type I point defects, compared to salt spray, is due to the overall lower corrosion rate in the simulated marine solution, making it difficult to accumulate enough products to fill the entire defect hole early on.
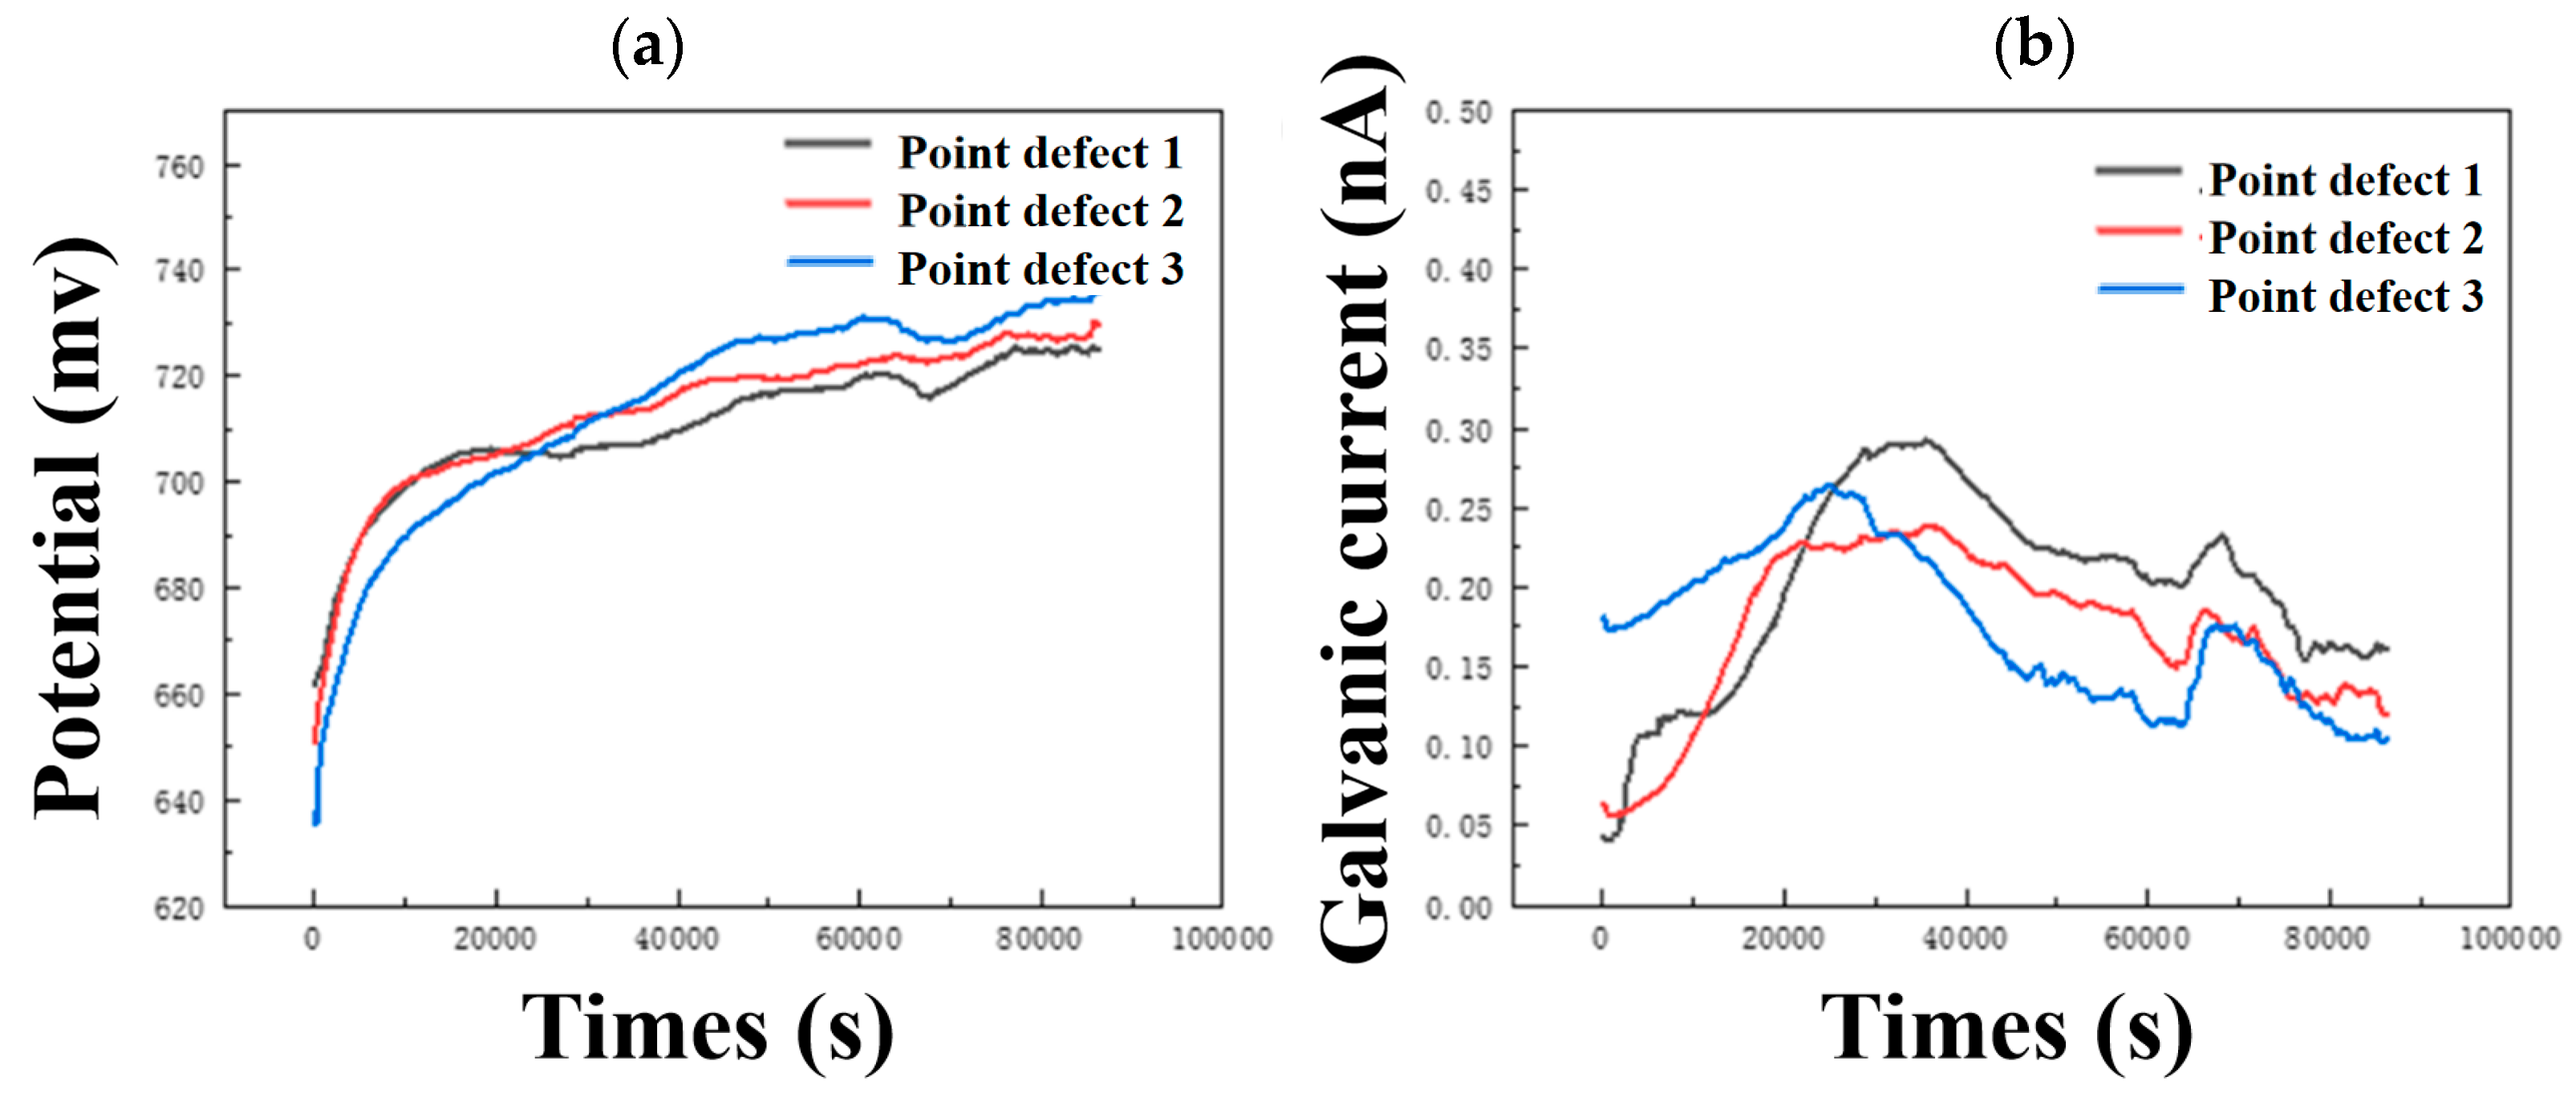
It can be seen from Figure 6a that the potentials of composite plates with three different point defects are very close to the self-corrosion potential of carbon steel. As the size of point defects increases, the potential shifts slightly positively. The galvanic current shifts slightly negatively with increasing point defect size. The galvanic potential and galvanic current change slightly with the size of point defects, and the corrosion rate of titanium/steel galvanic pairs with small-size point defects is slightly larger, which is consistent with the weight loss and characterization results.
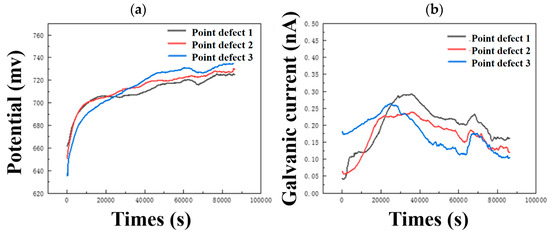
Figure 6.
Continuous monitoring results of (a) open circuit potential and (b) galvanic current of three different point defect samples.
3.2. The Impact of Linear Defects
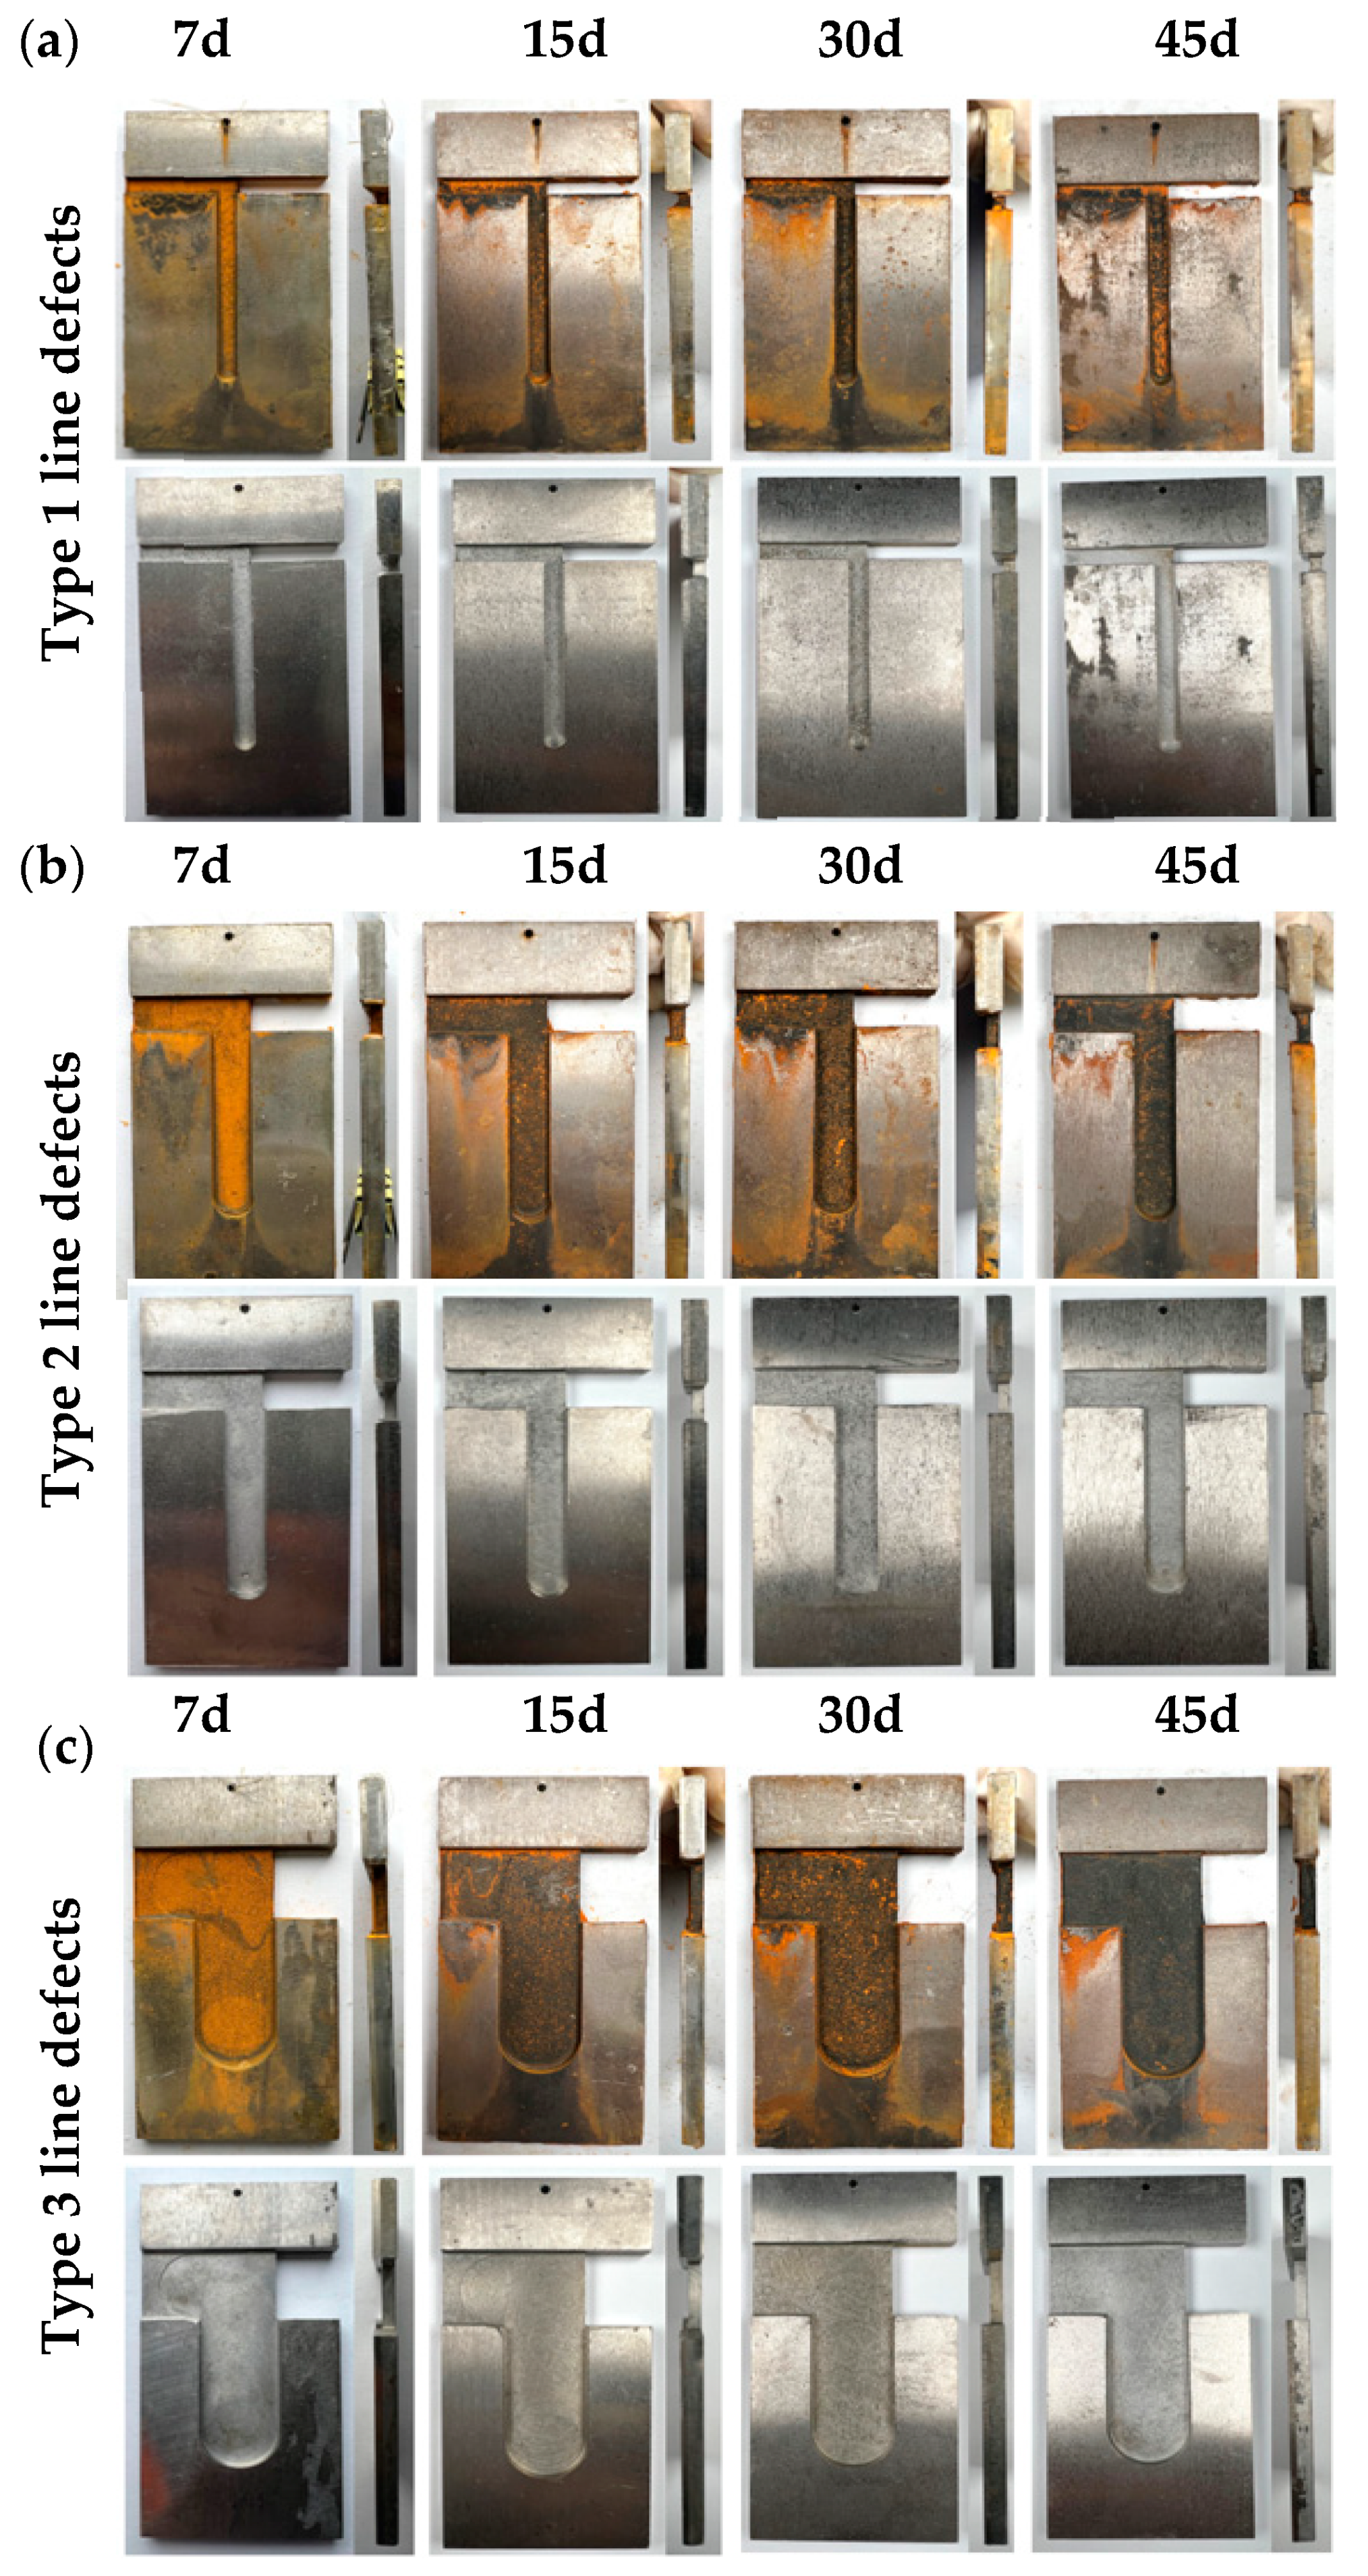
As shown in Figure 7a, with increasing immersion time, significant corrosion occurred inside the linear defects, with corrosion products accumulating within these defects. After an initial 7-day immersion, the exposed carbon steel areas were filled with easily detachable red rust due to the narrowness of type I linear defects and the ease of filling these defects with galvanic corrosion when in contact with titanium. With time, the corrosion intensified, and the rust layer became denser and continued to accumulate. After derusting, the titanium alloy surface of the titanium–steel composite plate was visibly uncorroded, with a metallic luster, while the carbon steel surface inside the linear defects became rougher and showed clear signs of corrosion, which deepened over time. Figure 7b shows the corrosion morphology of type II linear defect samples after various immersion durations. After 7 days of immersion, the entire surface of the linear defect was covered with an orange-yellow rust layer, which, after 15 days, transformed into a denser corrosion product in about 80% of the area, with continuous accumulation and formation of more dense rust layers over time. After derusting, the titanium alloy surface was uncorroded, but the carbon steel surface inside the linear defects became increasingly rough, showing clear signs of deepening corrosion. Figure 7c shows the corrosion morphology of type III linear defect samples in a simulated marine environment after various immersion durations. The exposed carbon steel areas inside the linear defects were uniformly covered with corrosion products, which were not very dense initially, exposing the carbon steel substrate. As immersion time increased, more corrosion products accumulated, increasing their density. After 45 days, all exposed carbon steel substrates were covered with corrosion products. After derusting, the exposed carbon steel areas showed uniform corrosion, which deepened over time.
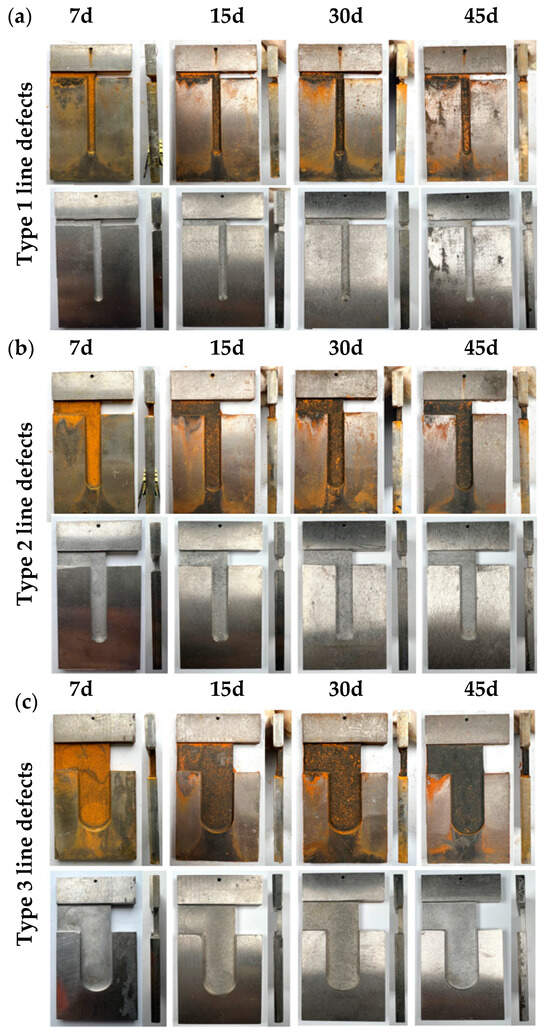
Figure 7.
Macroscopic corrosion morphologies of linear-defect samples post various immersion durations: (a) type I linear defects; (b) type II linear defects; (c) type III linear defects.
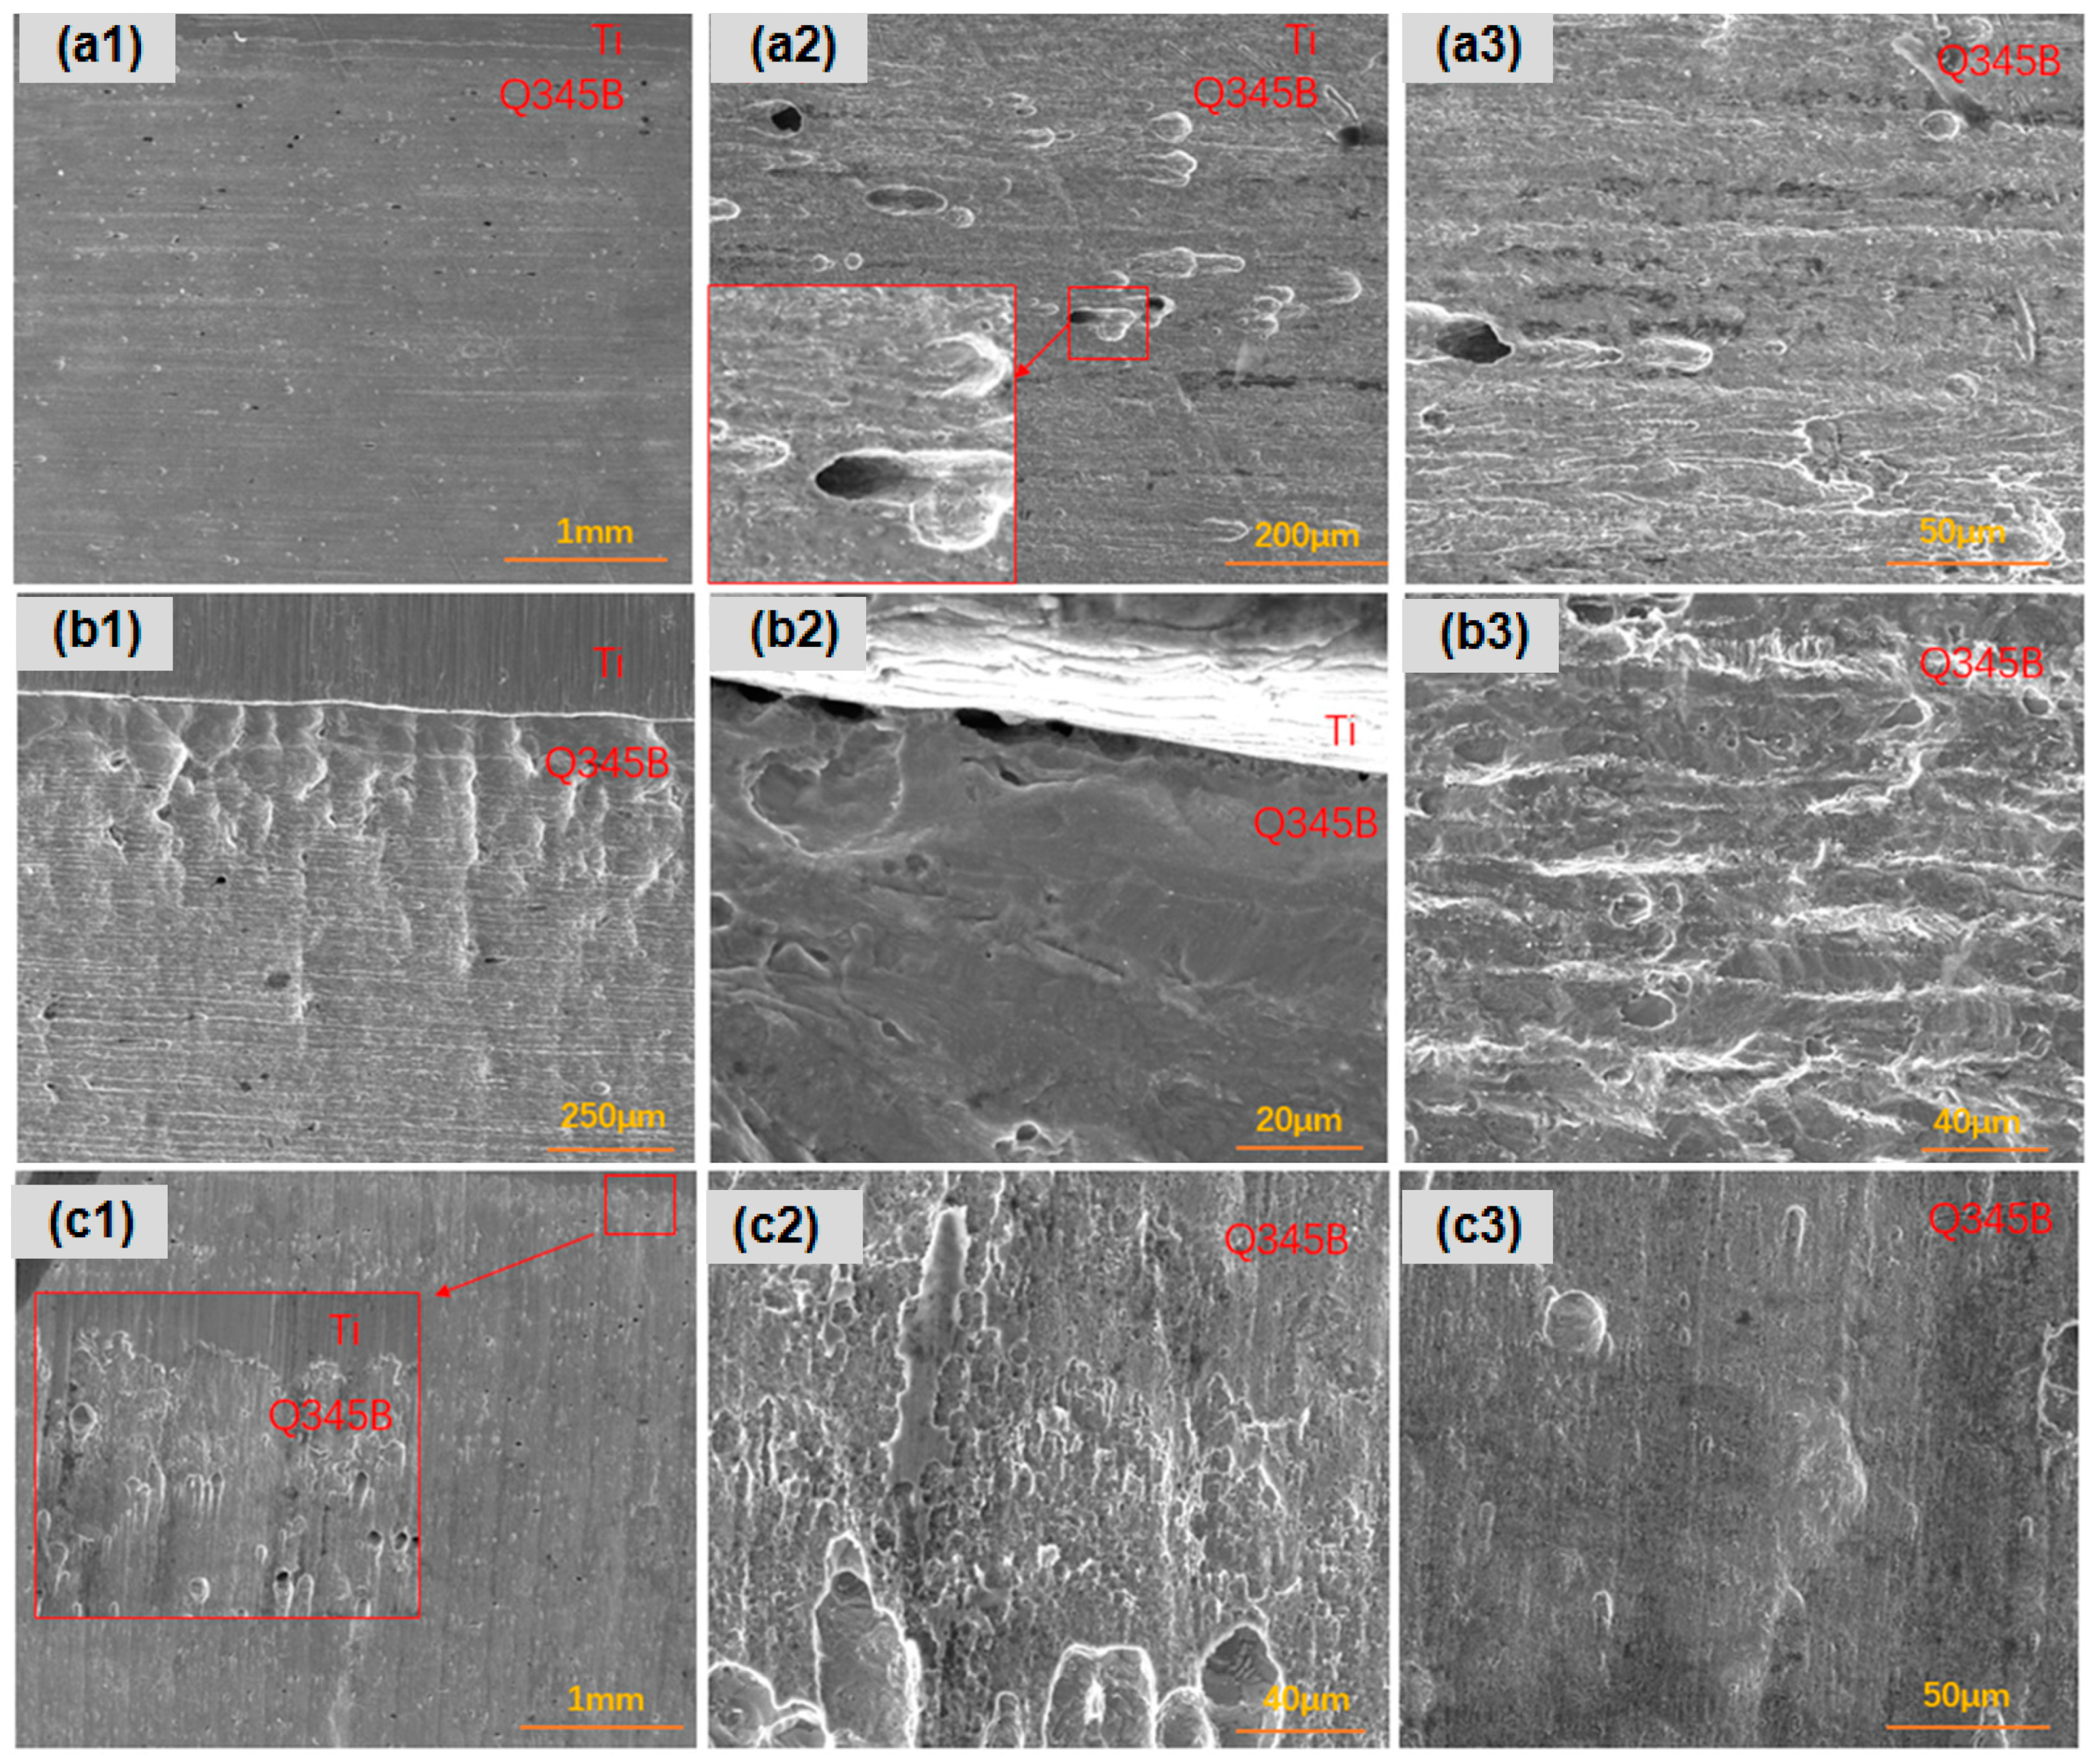
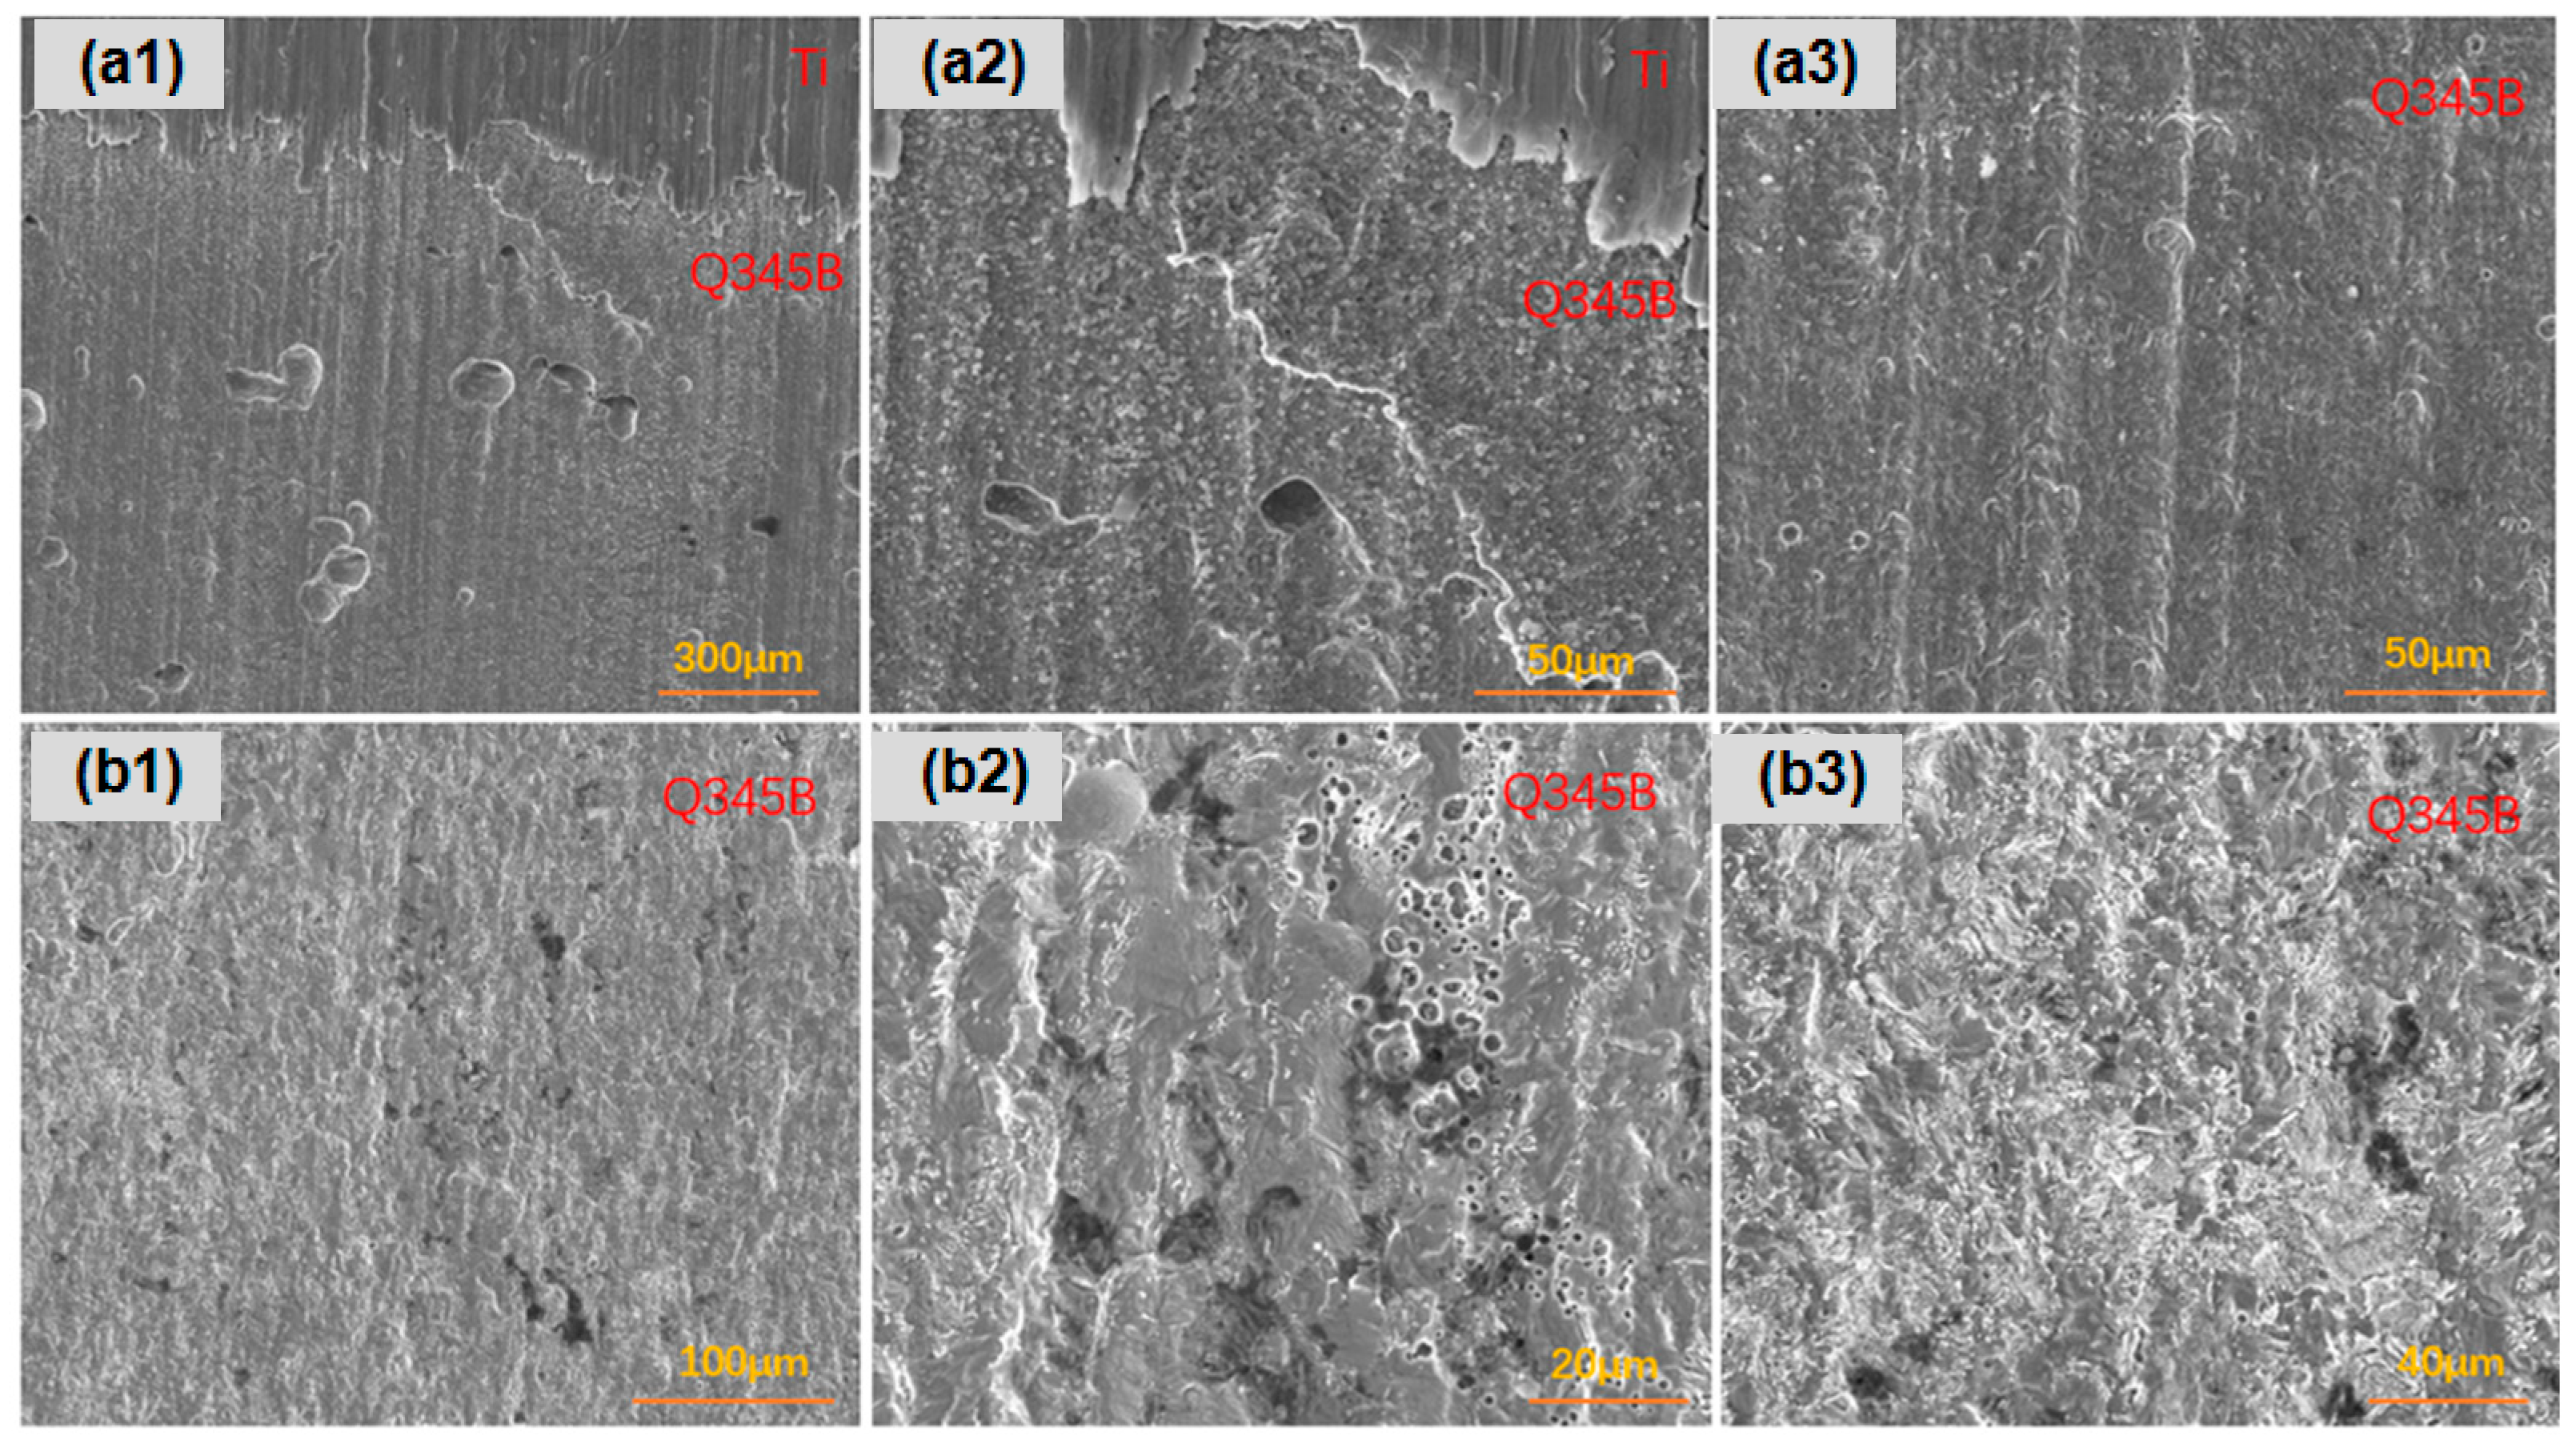
After 45 days of immersion in the simulated marine solution, the titanium–steel composite plates with three types of linear defects showed unique characteristics in terms of longitudinal corrosion. As shown in Figure 8, for type I linear defects, the surface point defects of the titanium–steel composite plate exhibited uniform corrosion, but the corrosion depth was slightly greater in areas closer to the titanium. Type II linear defects showed a difference in the density of pitting pits along the longitudinal direction of the carbon steel, especially with denser pits near the composite interface, accompanied by deeper pits and slight delamination. Additionally, longitudinal corrugated corrosion morphologies were observed due to sample processing. Lastly, the situation with type III linear defects was that the carbon steel had more and larger pitting pits near the composite interface, deeper in depth, while areas farther from the interface exhibited uniform corrosion.
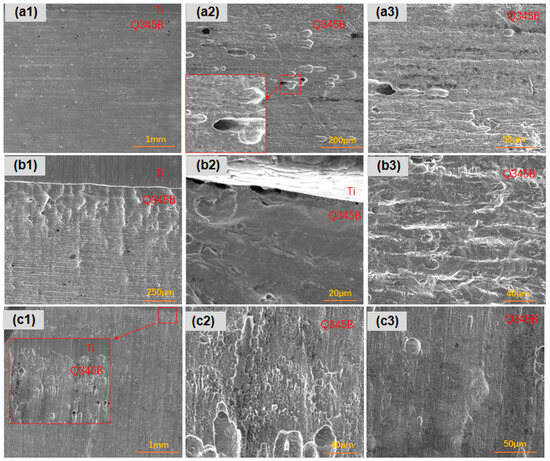
Figure 8.
Longitudinal corrosion morphologies of linear-defect samples after 45-day marine immersion: (a1–a3) are type I linear defects; (b1–b3) are type II linear defects; (c1–c3) are type III linear defects.
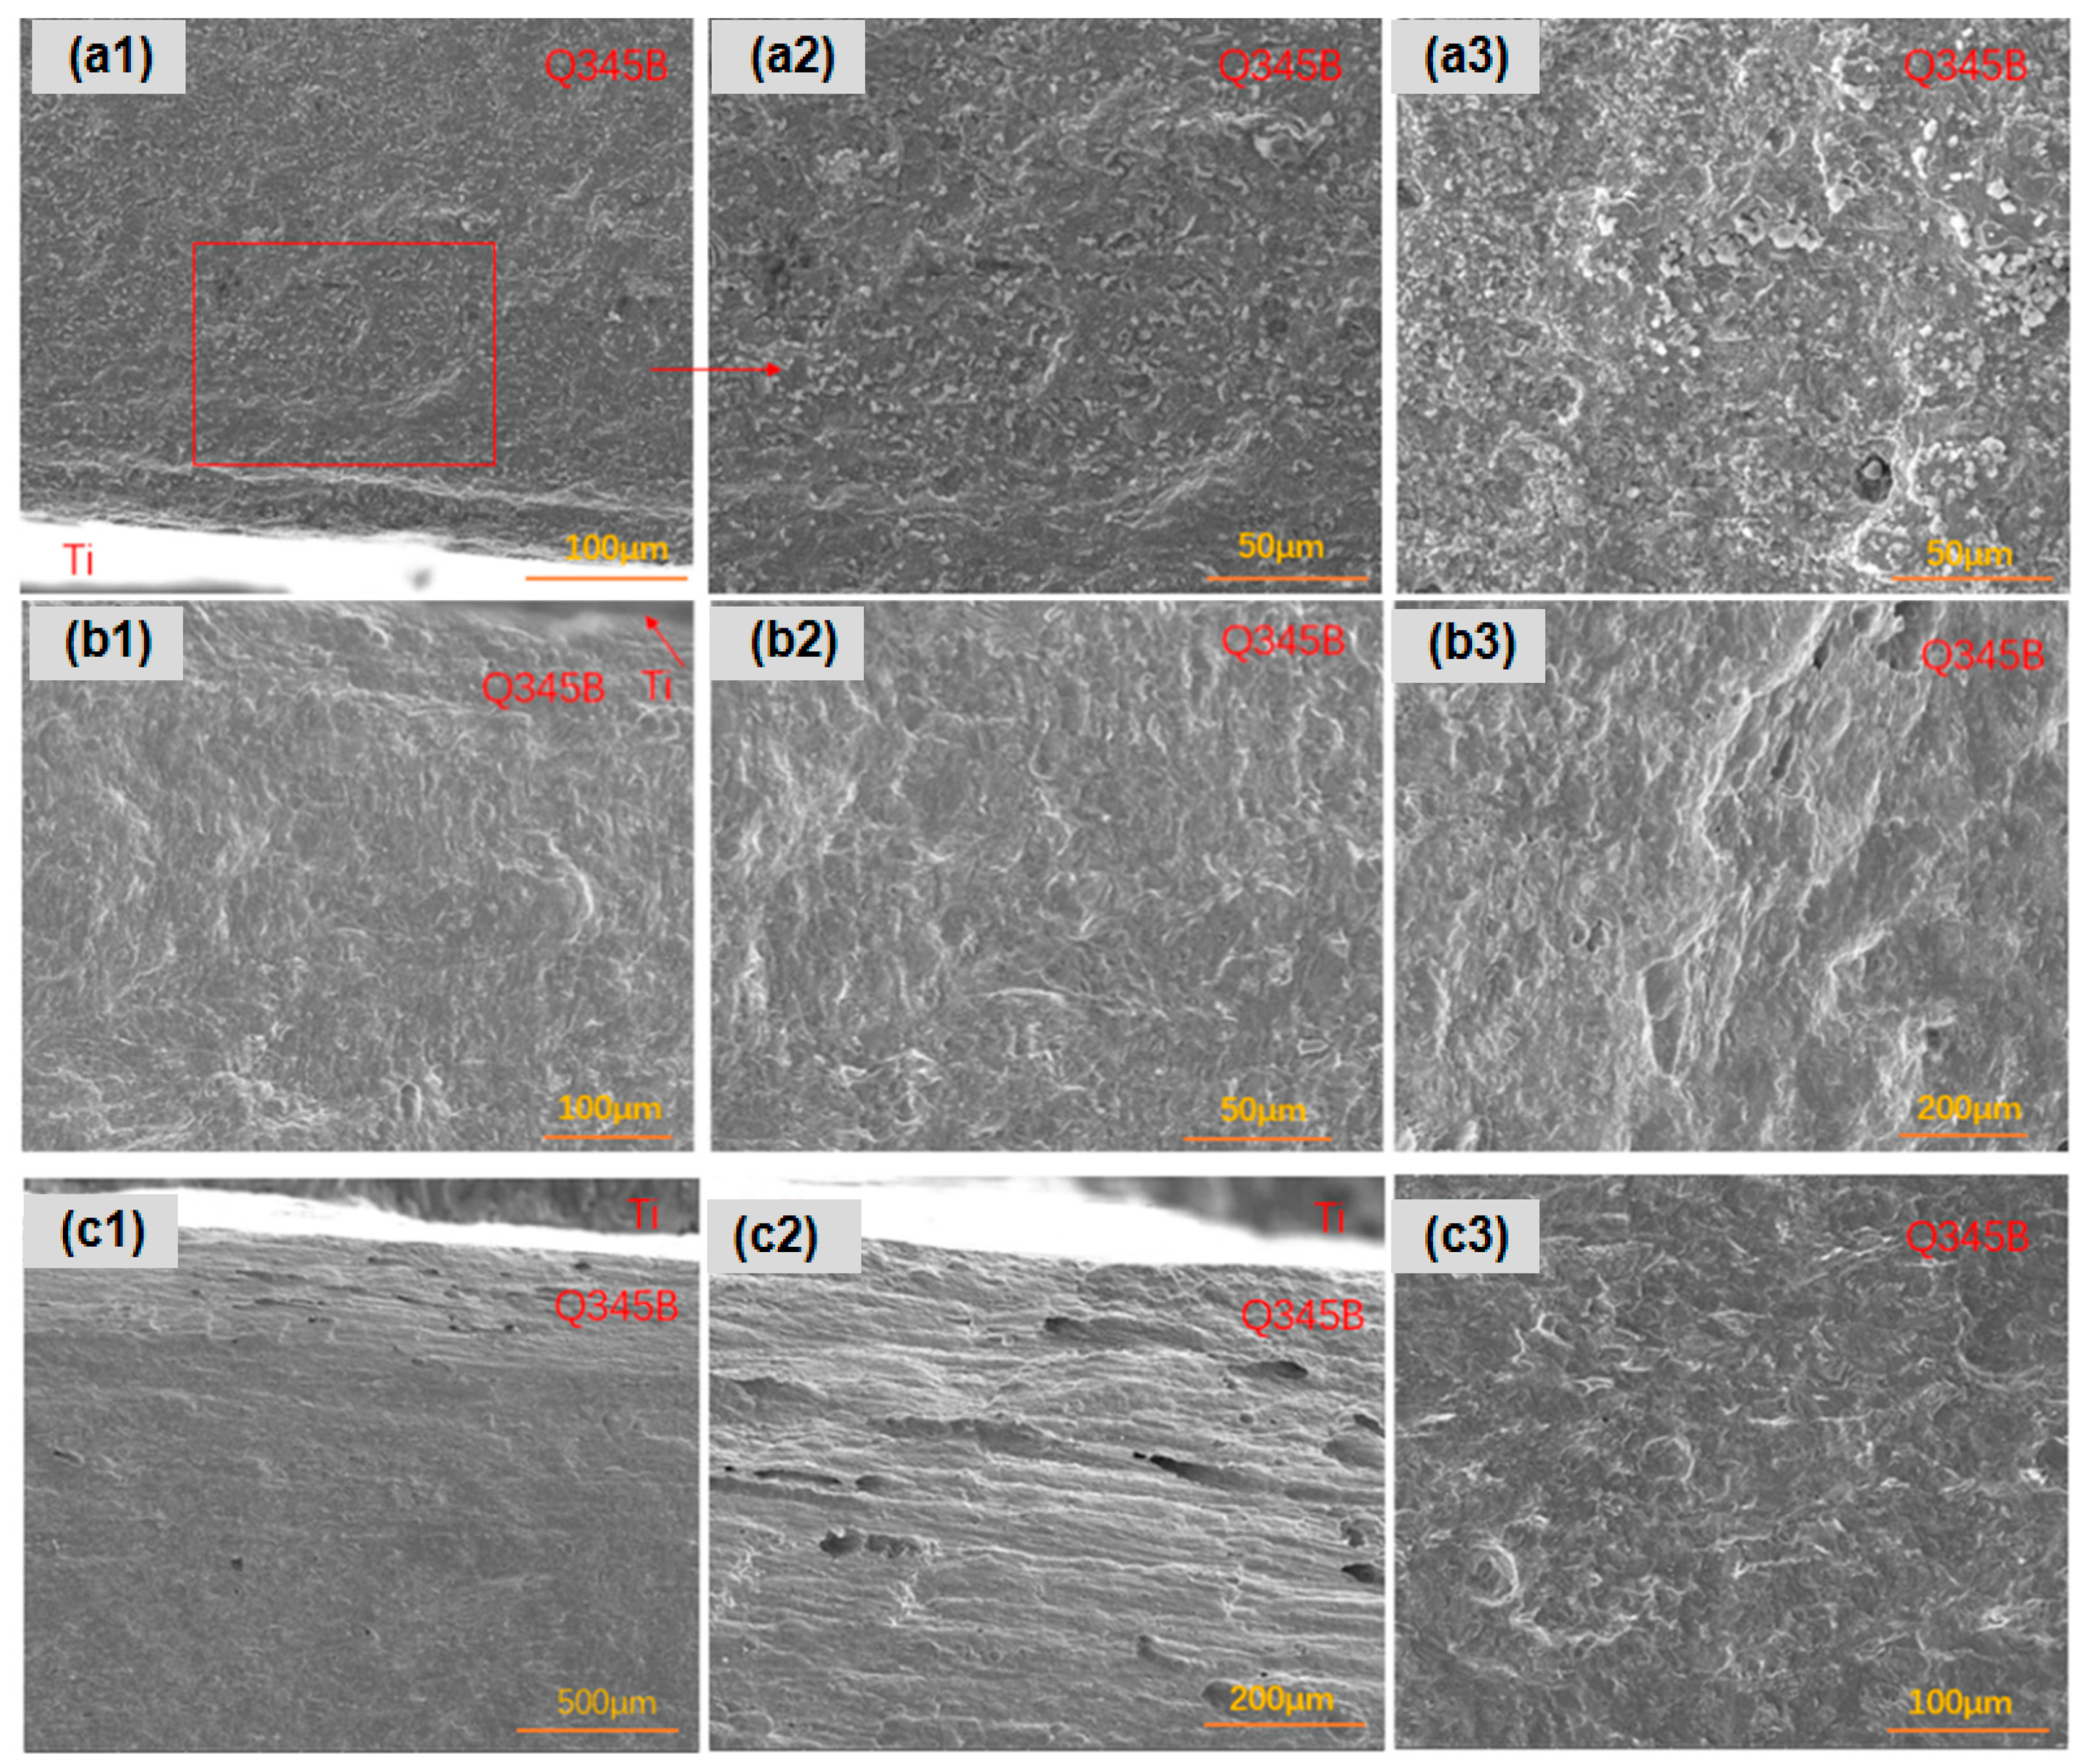
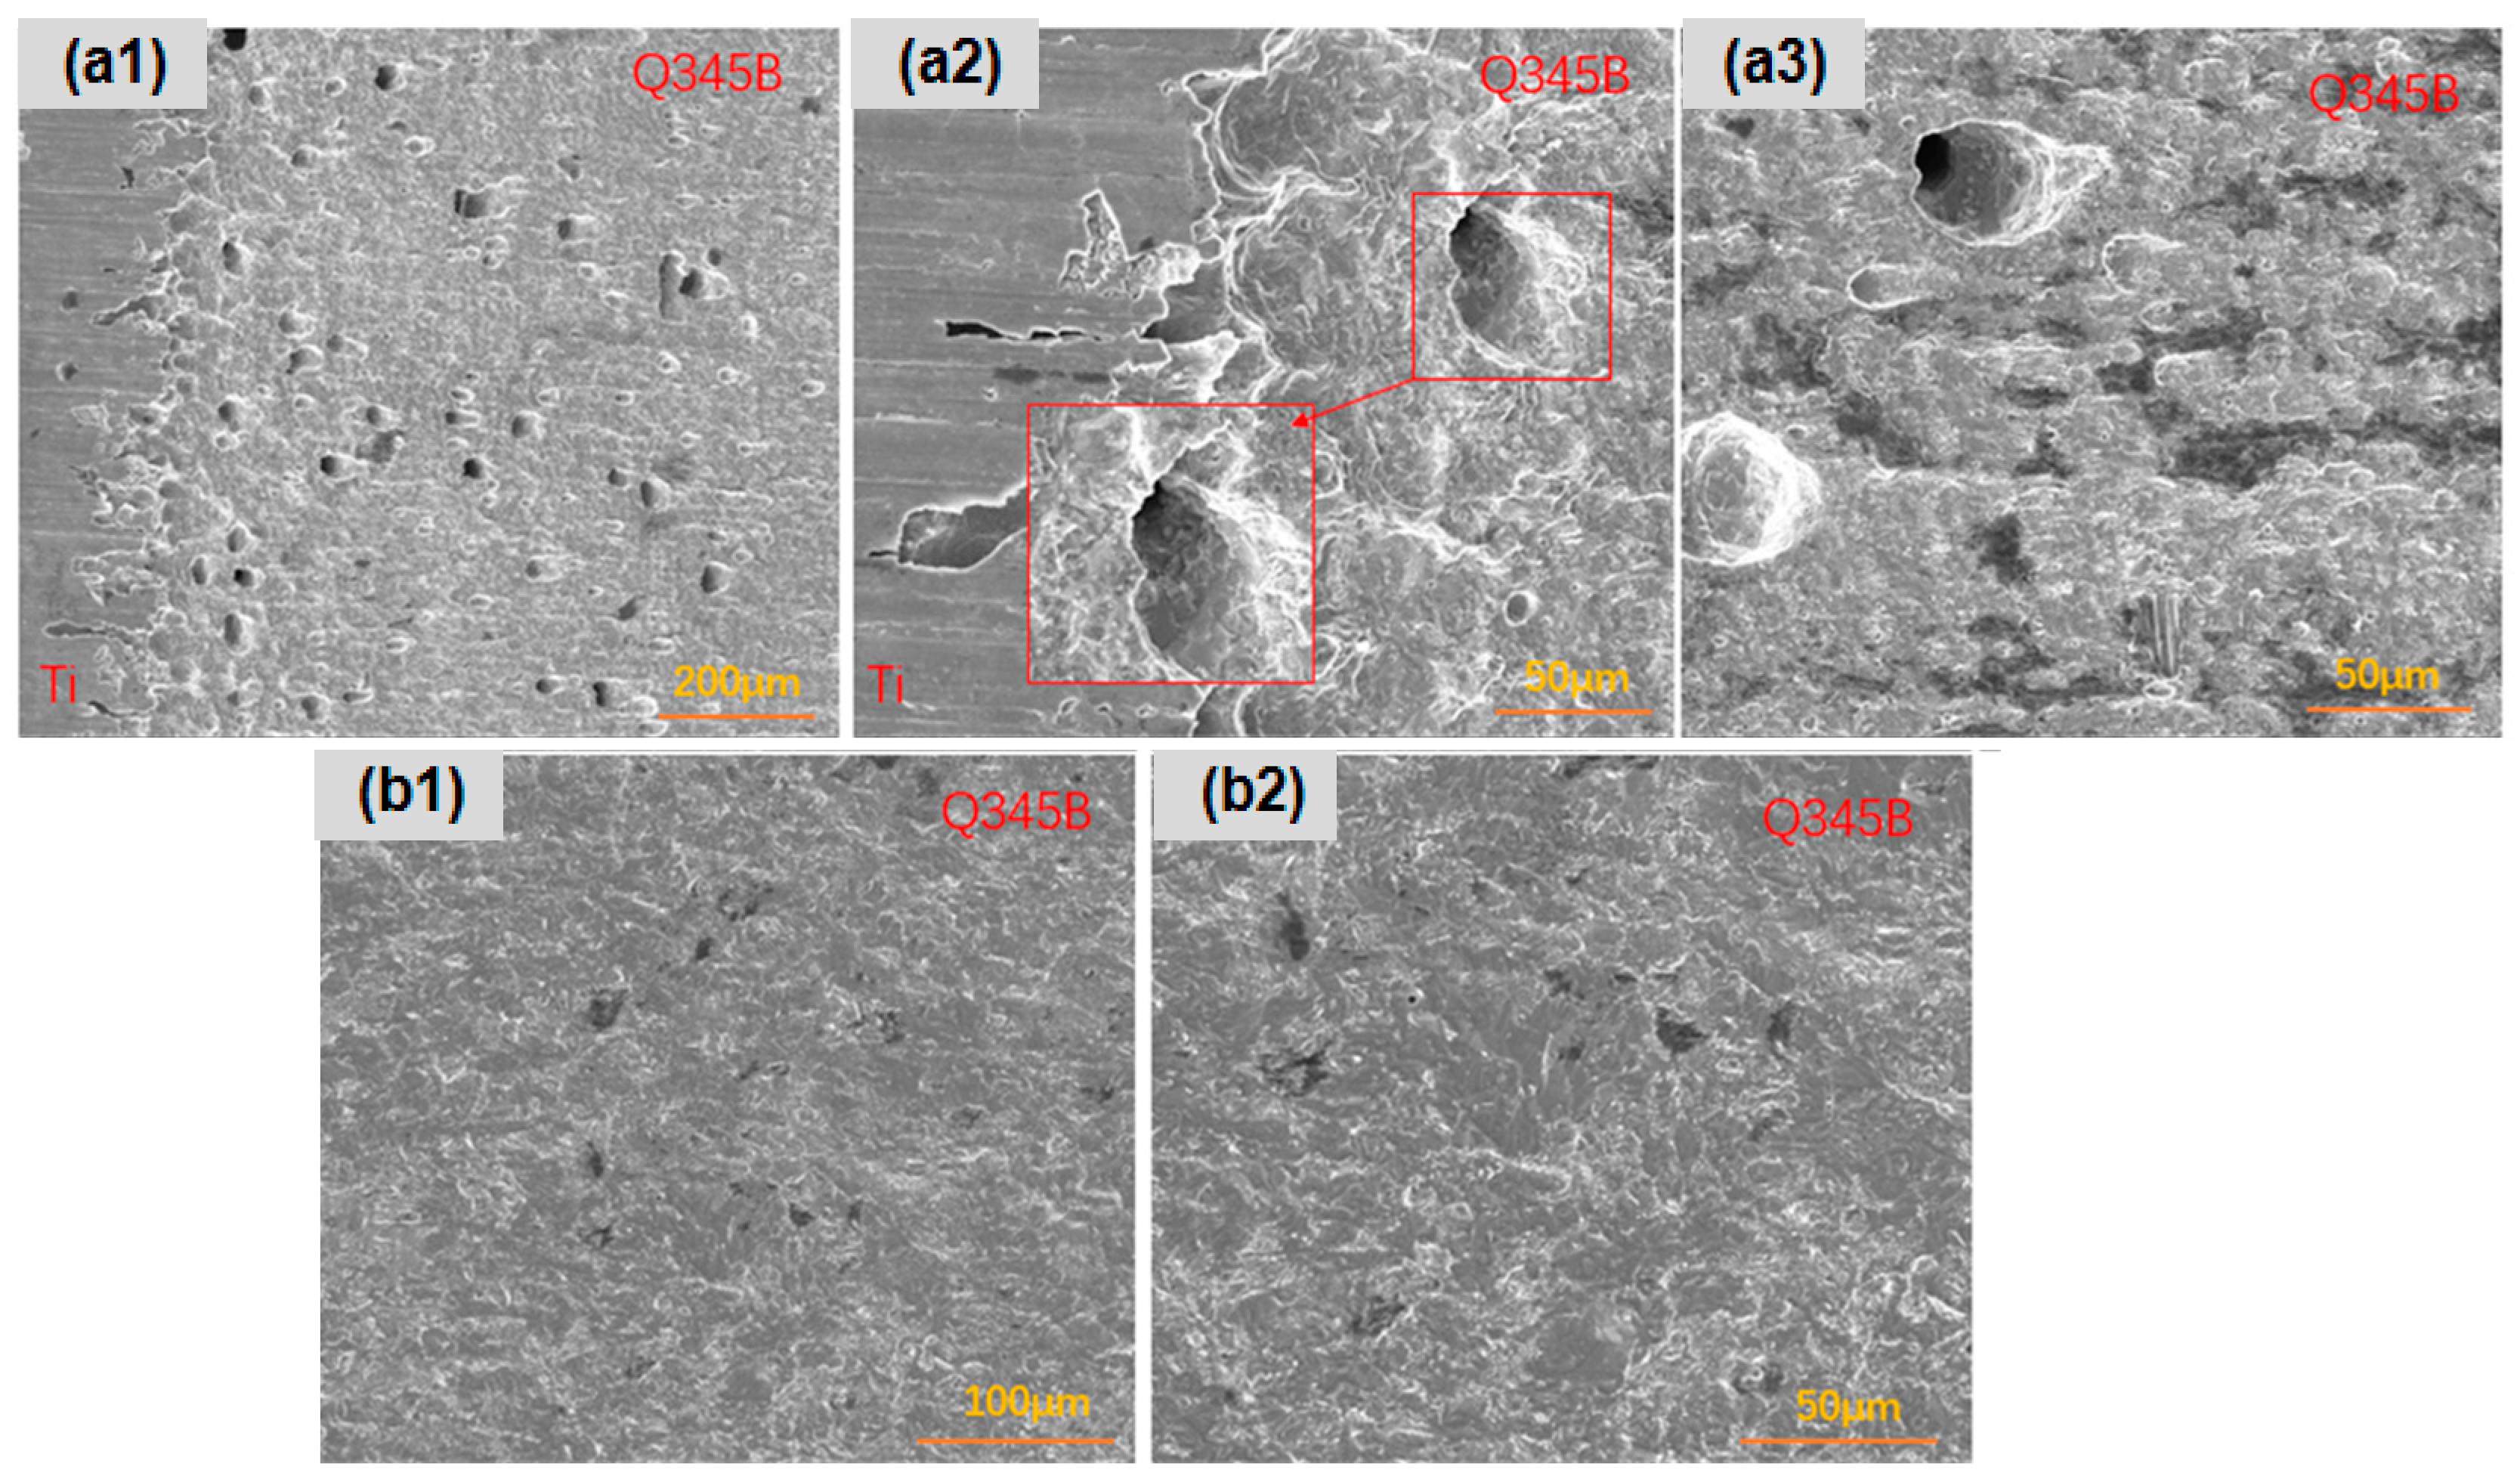
Regarding surface corrosion, the titanium–steel composite plates with three types of linear defects exhibited distinct characteristics. As shown in Figure 9, for type I linear defects, the titanium–steel composite plate displayed uniform corrosion at the surface defect sites, with varying depths, particularly near the titanium. This type also showed pronounced longitudinal galvanic corrosion effects. In type II linear defects, pitting was present, but overall surface corrosion was uniform, with smaller and shallower pits. Longitudinal galvanic corrosion effects were also observed. Lastly, for type III linear defects, the titanium–steel composite plate had dense pitting near the titanium but uniform corrosion in areas farther away, with less pronounced longitudinal galvanic corrosion effects compared to the other types.
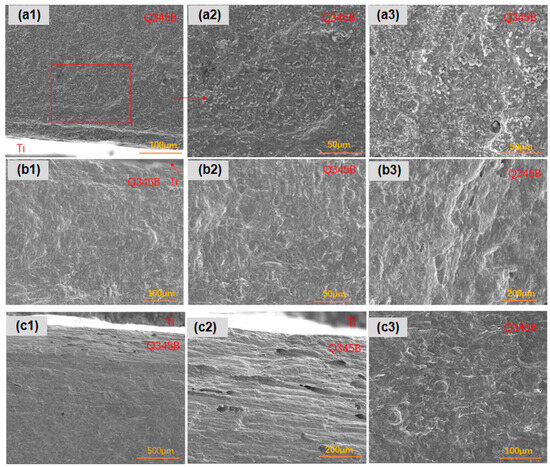
Figure 9.
Transverse corrosion morphologies of linear-defect samples after 45-day marine immersion: (a1–a3) are type I linear defects; (b1–b3) are type II linear defects; (c1–c3) are type III linear defects.
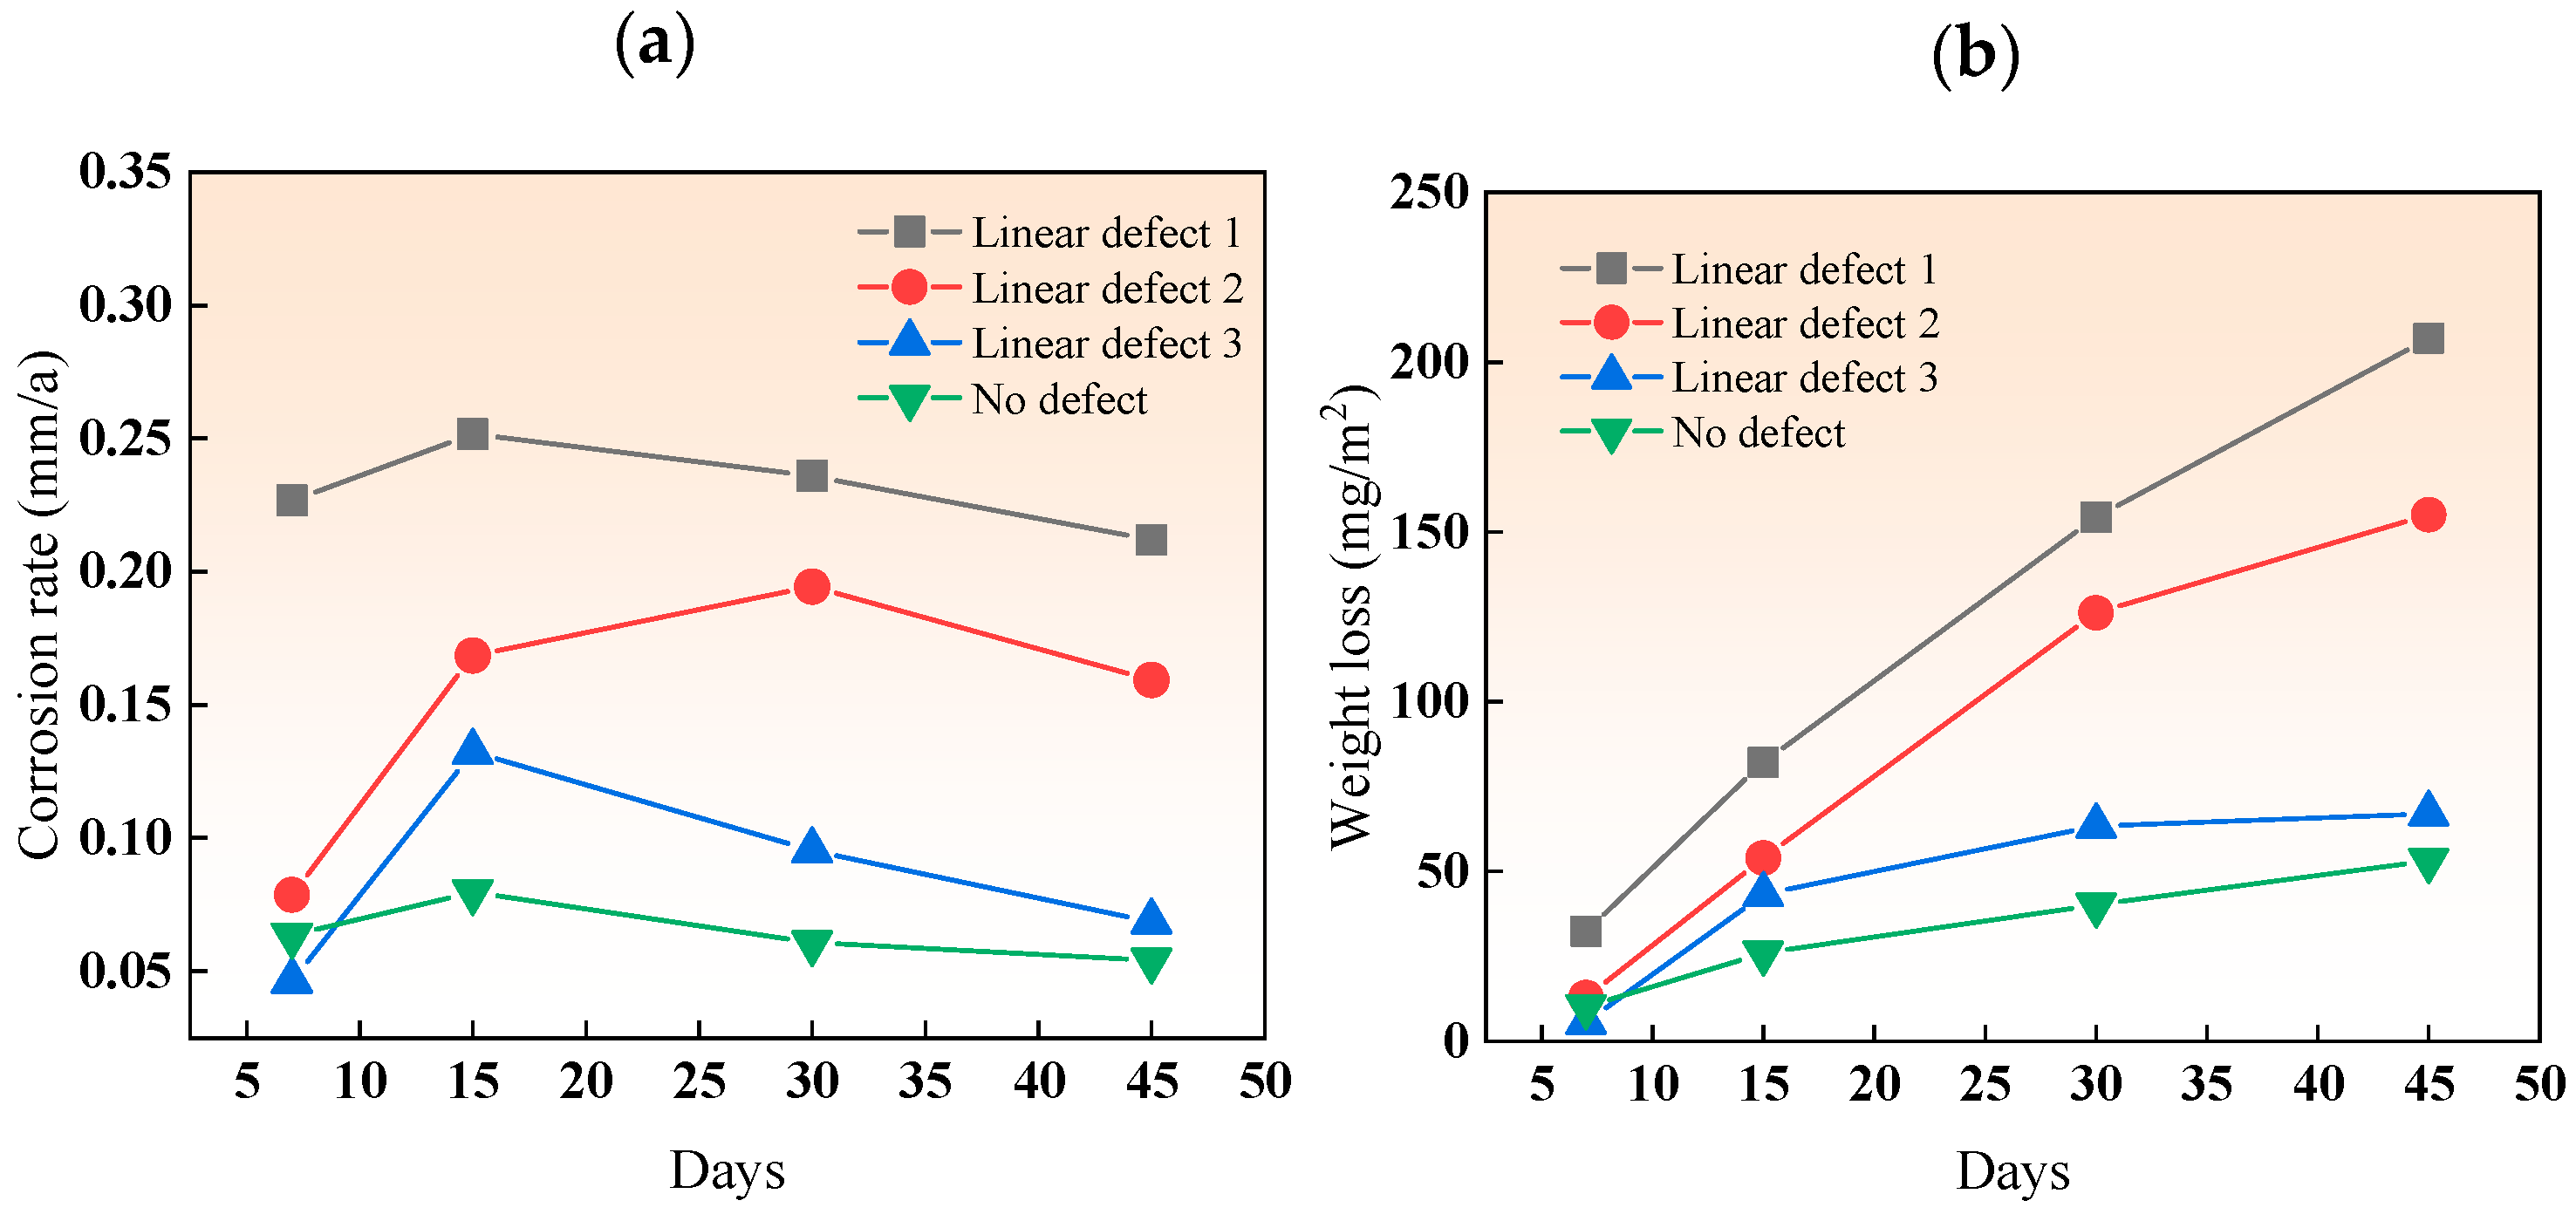
In the simulated marine solution, the weight loss and corrosion rate of the three types of linear defects after various immersion durations are shown in Figure 10. The corrosion rate pattern for all three types of linear defects was relatively uniform, increasing initially and then decreasing due to the early formation of loose, easily detachable corrosion products. With time, the products accumulated and became denser and harder to detach, forming a protective layer on the substrate and reducing the corrosion rate. The corrosion rate of the composite plates with linear defects decreased from type I to type III as the size of the linear defects increased, reducing the area affected by the galvanic acceleration of the titanium–steel couple. The reason for the difference in behavior compared to point defects is that, although linear defects have the same width as point defects, they are continuous along the length, making it harder for corrosion products to accumulate in linear defects than in point defects. Similar to point defects, the corrosion rate of smaller line defects (types 1 and 2) decreases more, about 20%, in the later stages of immersion.
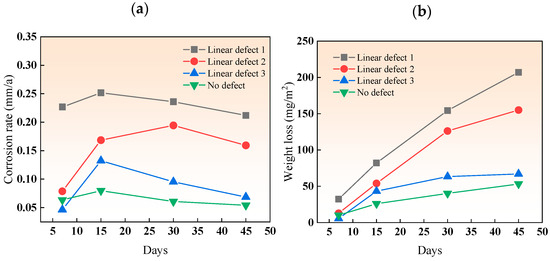
Figure 10.
(a) Corrosion rate and (b) weight loss of linear-defect samples after various immersion durations.
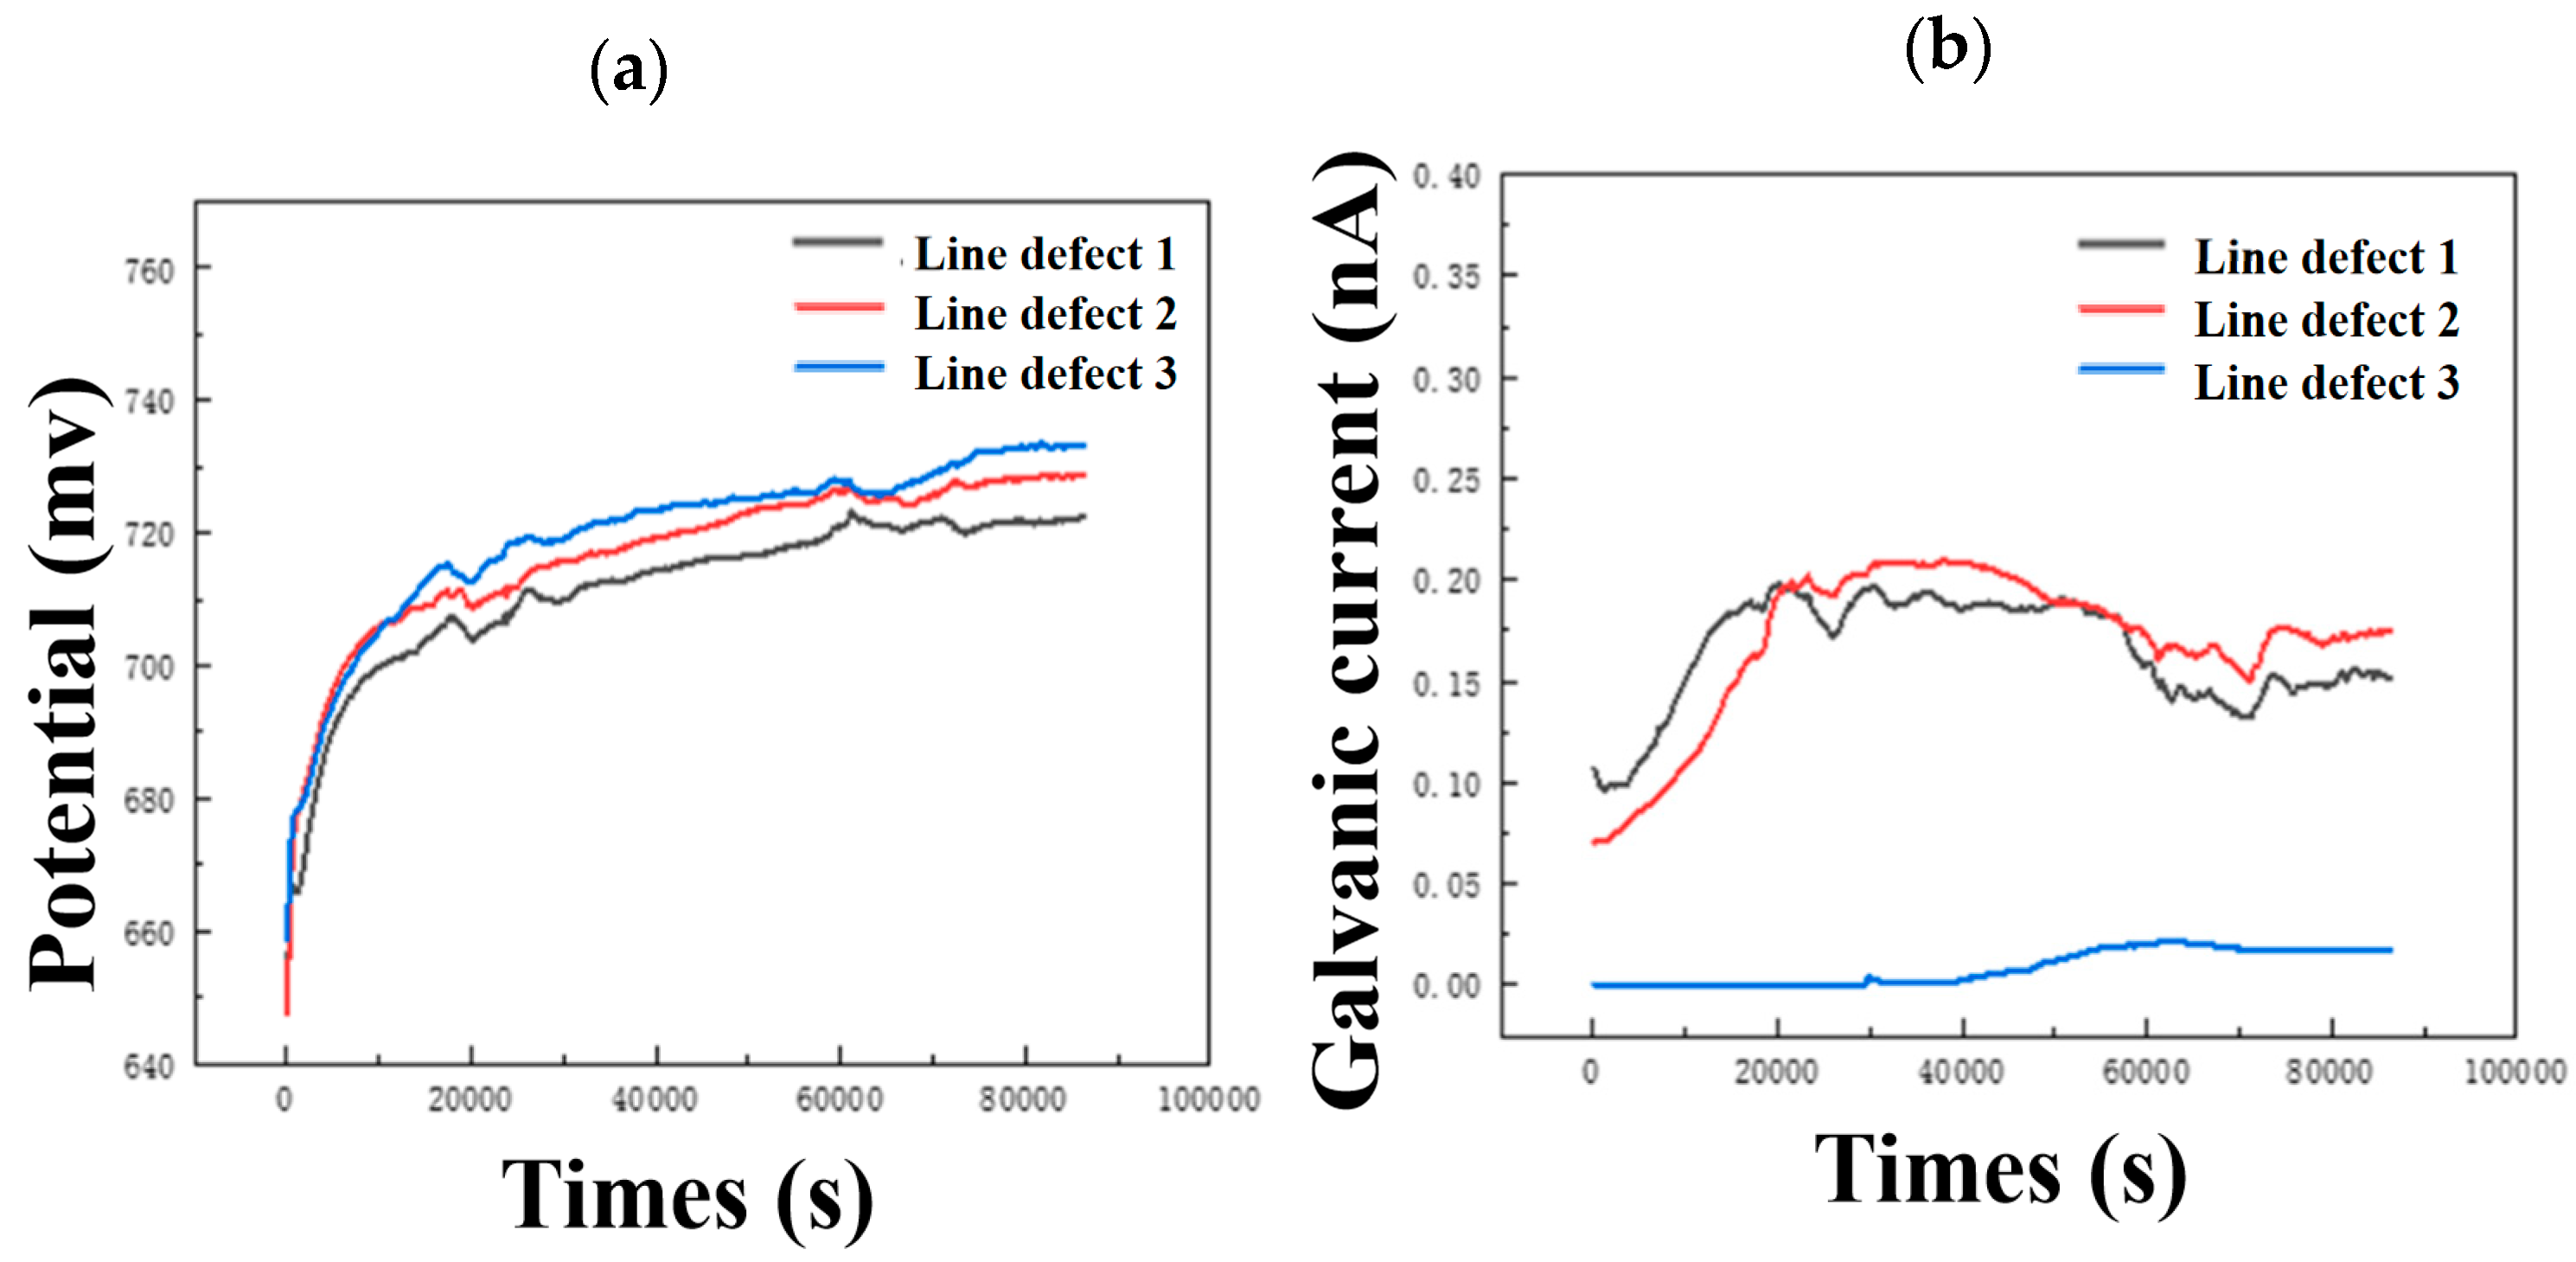
It can be seen from Figure 11a that as the size of the linear defect increases, the potential shifts slightly positively. On the contrary, the galvanic current shifts negatively with the increase in line defect size, and when the line defect size increases to type 3, the negative shift of the curve is very large. This shows that increasing the size of line defects in composite plates can slow down corrosion to a certain extent, which is consistent with the weight loss and characterization results.

Figure 11.
Continuous monitoring results of (a) open circuit potential and (b) galvanic current of three different line defect samples.
3.3. Impact of Different Thickness Ratios on the Corrosion of Titanium–Steel Composite Plates
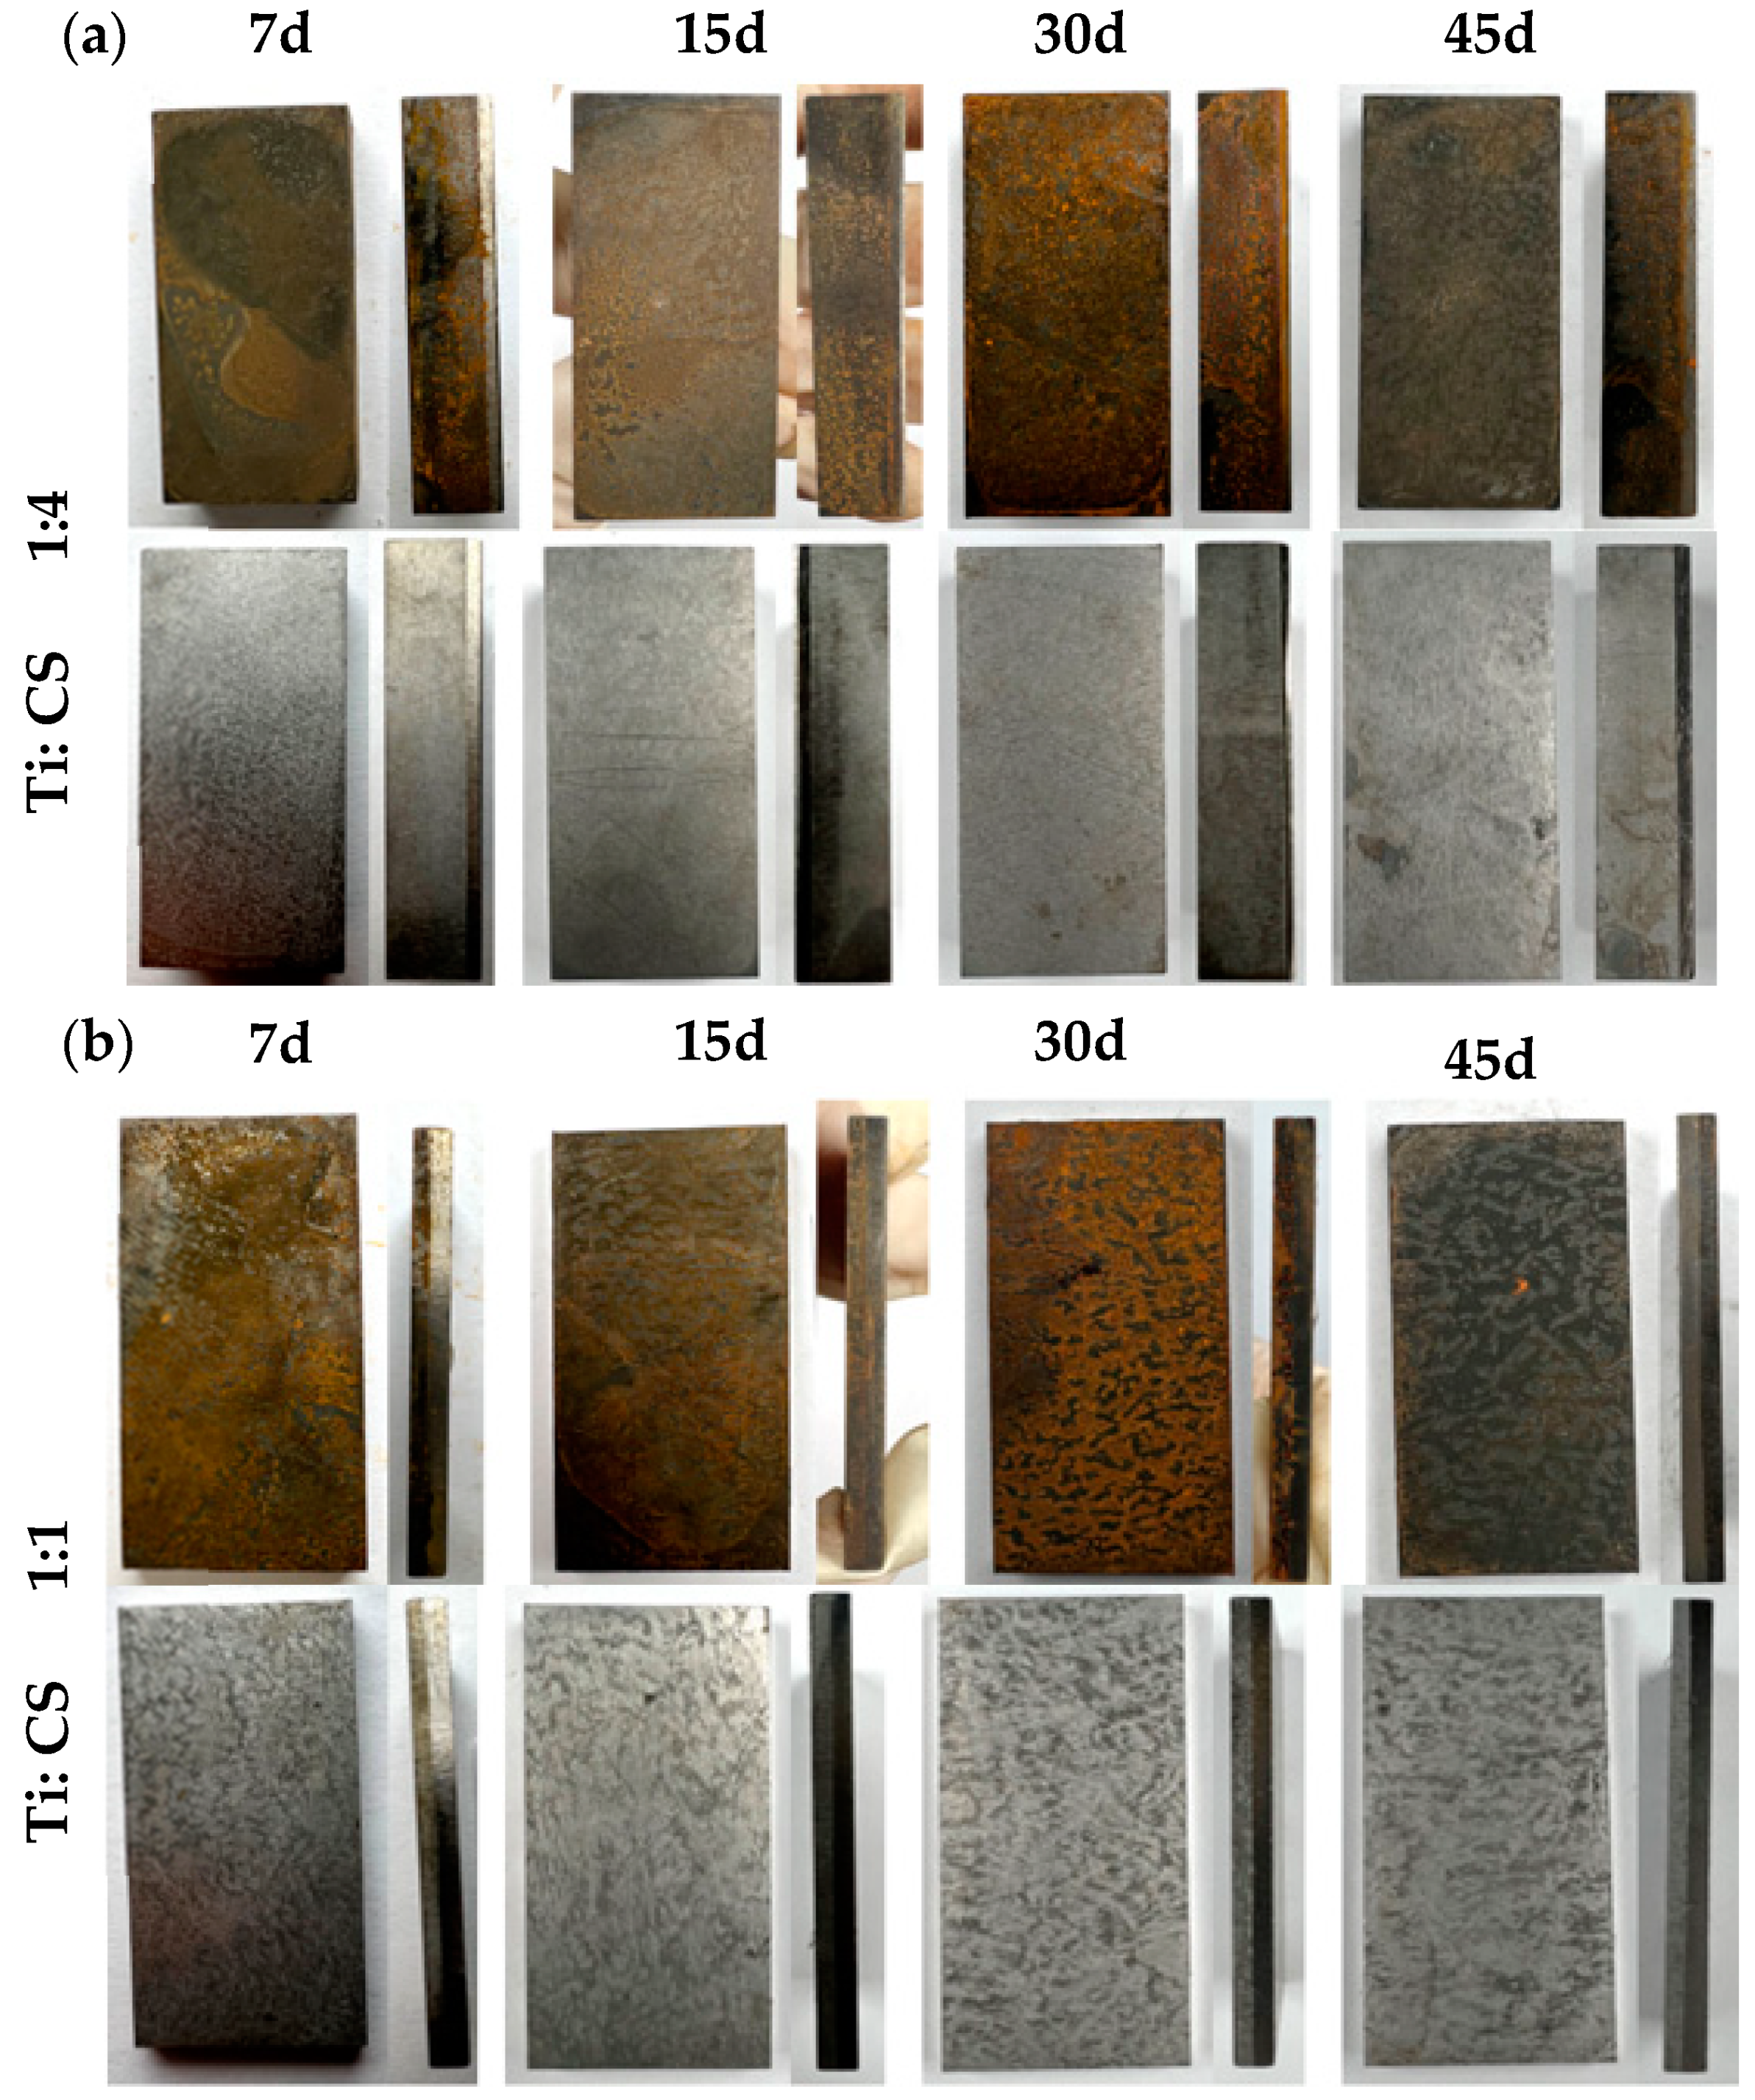
Figure 12a reveals the corrosion patterns of 1:4 thickness ratio titanium–steel composite plates after varying immersion times in a simulated marine environment. The carbon steel on the titanium plate’s reverse side corrodes, with corrosion deepening and product accumulation increasing over time. The side touching the titanium showed similar trends, with pronounced corrosion at the interface. Figure 12b displays similar findings for 1:1 thickness ratio plates, showing increased surface corrosion over time. After de-rusting, the carbon steel side shows severe corrosion, worsening with time. Initially, no holes were evident at the interface, but they appeared after 30 days.
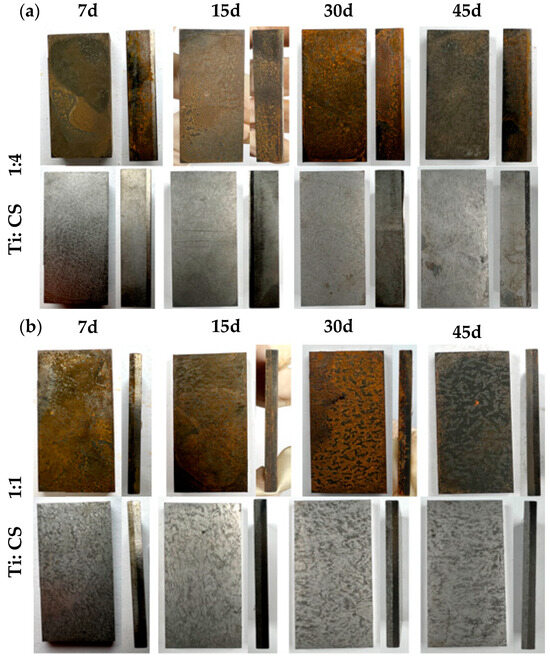
Figure 12.
Compares the corrosion morphologies of composite plates with (a) 1:4 and (b) 1:1 thickness ratios after marine environment immersion tests.
For the titanium–steel composite plate with a thickness ratio of 1:4 immersed in a marine simulated solution for 45 days, as shown in Figure 13, the carbon steel along the longitudinal direction exhibited more numerous, larger, and deeper pitting near the composite interface compared to farther regions, where corrosion was more uniform. The carbon steel surface showed uniform corrosion with pit presence.
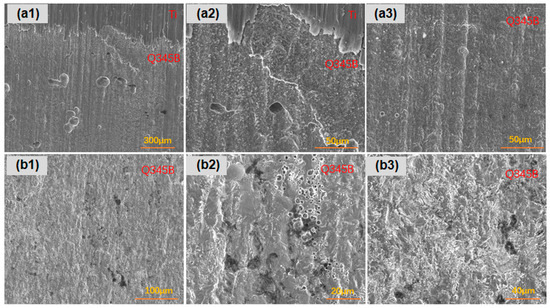
Figure 13.
The corrosion morphology of the titanium–steel specimen with a thickness ratio of 1:4 after 45 days of immersion in a simulated marine solution, post-rust removal: (a1–a3) are longitudinally; (b1–b3) are laterally.
As shown in Figure 14, for the titanium–steel composite plate with a thickness ratio of 1:1 immersed for 45 days, the corrosion along the longitudinal direction was more severe near the composite interface, with more pits that were larger and deeper compared to farther regions. The overall corrosion severity was greater than that of the plate, with a thickness ratio of 1:4. The carbon steel surface showed uniform corrosion with pit presence.

Figure 14.
The corrosion morphology of the titanium–steel specimen with a thickness ratio of 1:1 after 45 days of immersion in a simulated marine solution, post-rust removal: (a1–a3) are longitudinally; (b1,b2) are laterally.
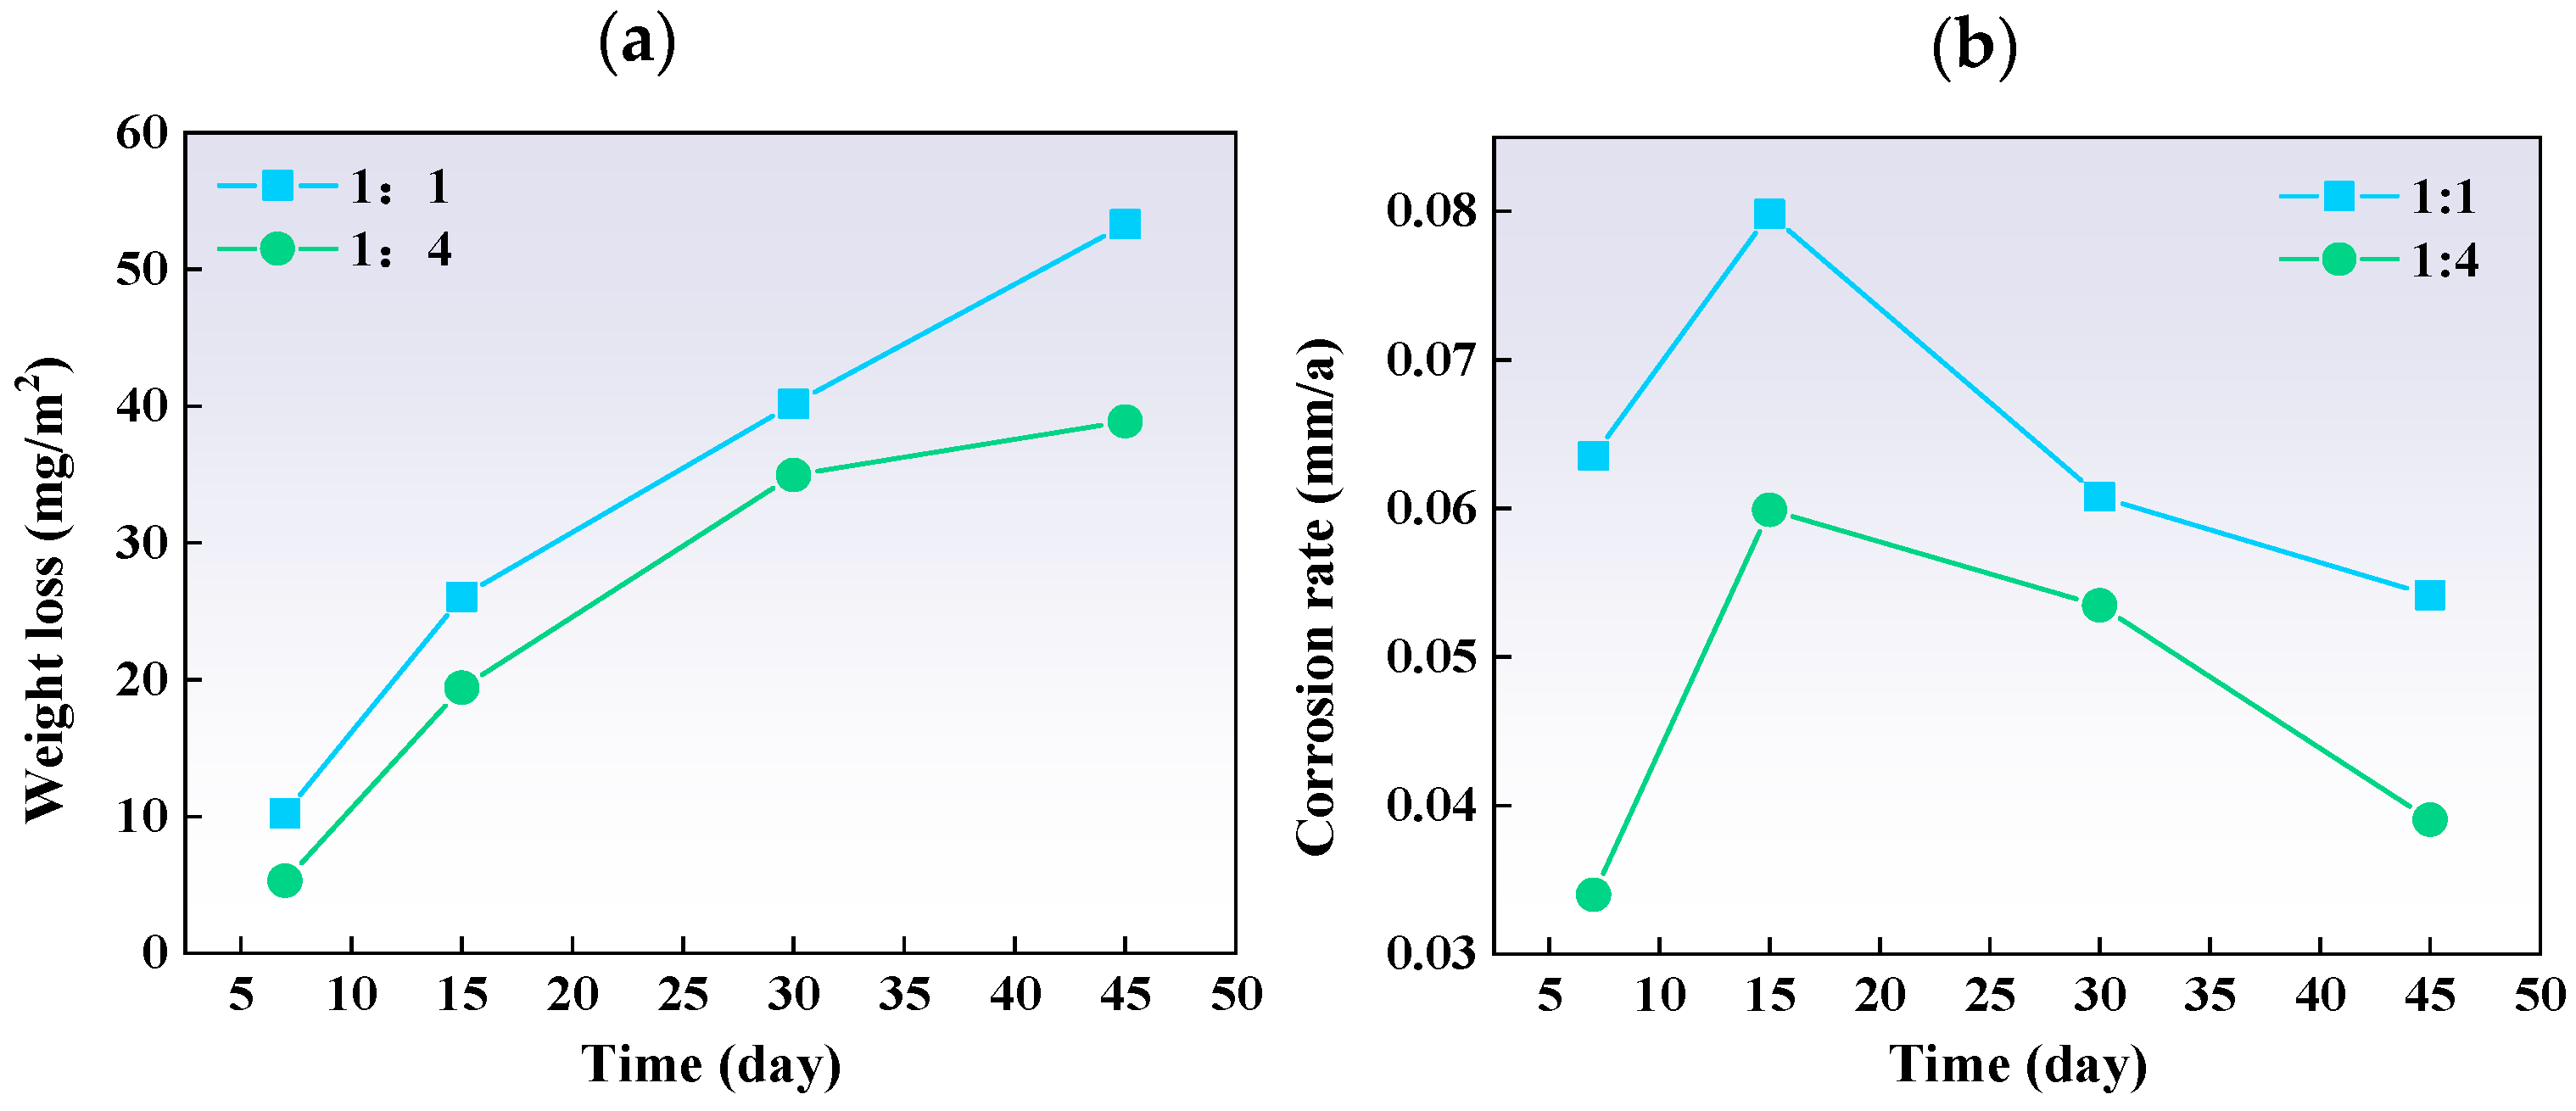
Figure 15 indicates that for both ratios, weight loss and corrosion severity increased over time. The corrosion rates showed an initial increase, followed by a decrease, suggesting that corrosion products eventually form a protective layer. The corrosion rate per unit area was higher in the 1:1 ratio plate than in the 1:4 plate, mainly due to changes in the carbon steel component.
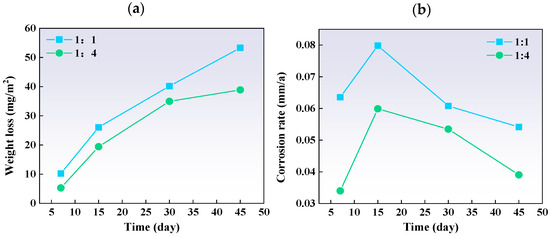
Figure 15.
The (a) weight loss and (b) corrosion rate of different thickness ratio titanium–steel composite plate samples after immersion tests.
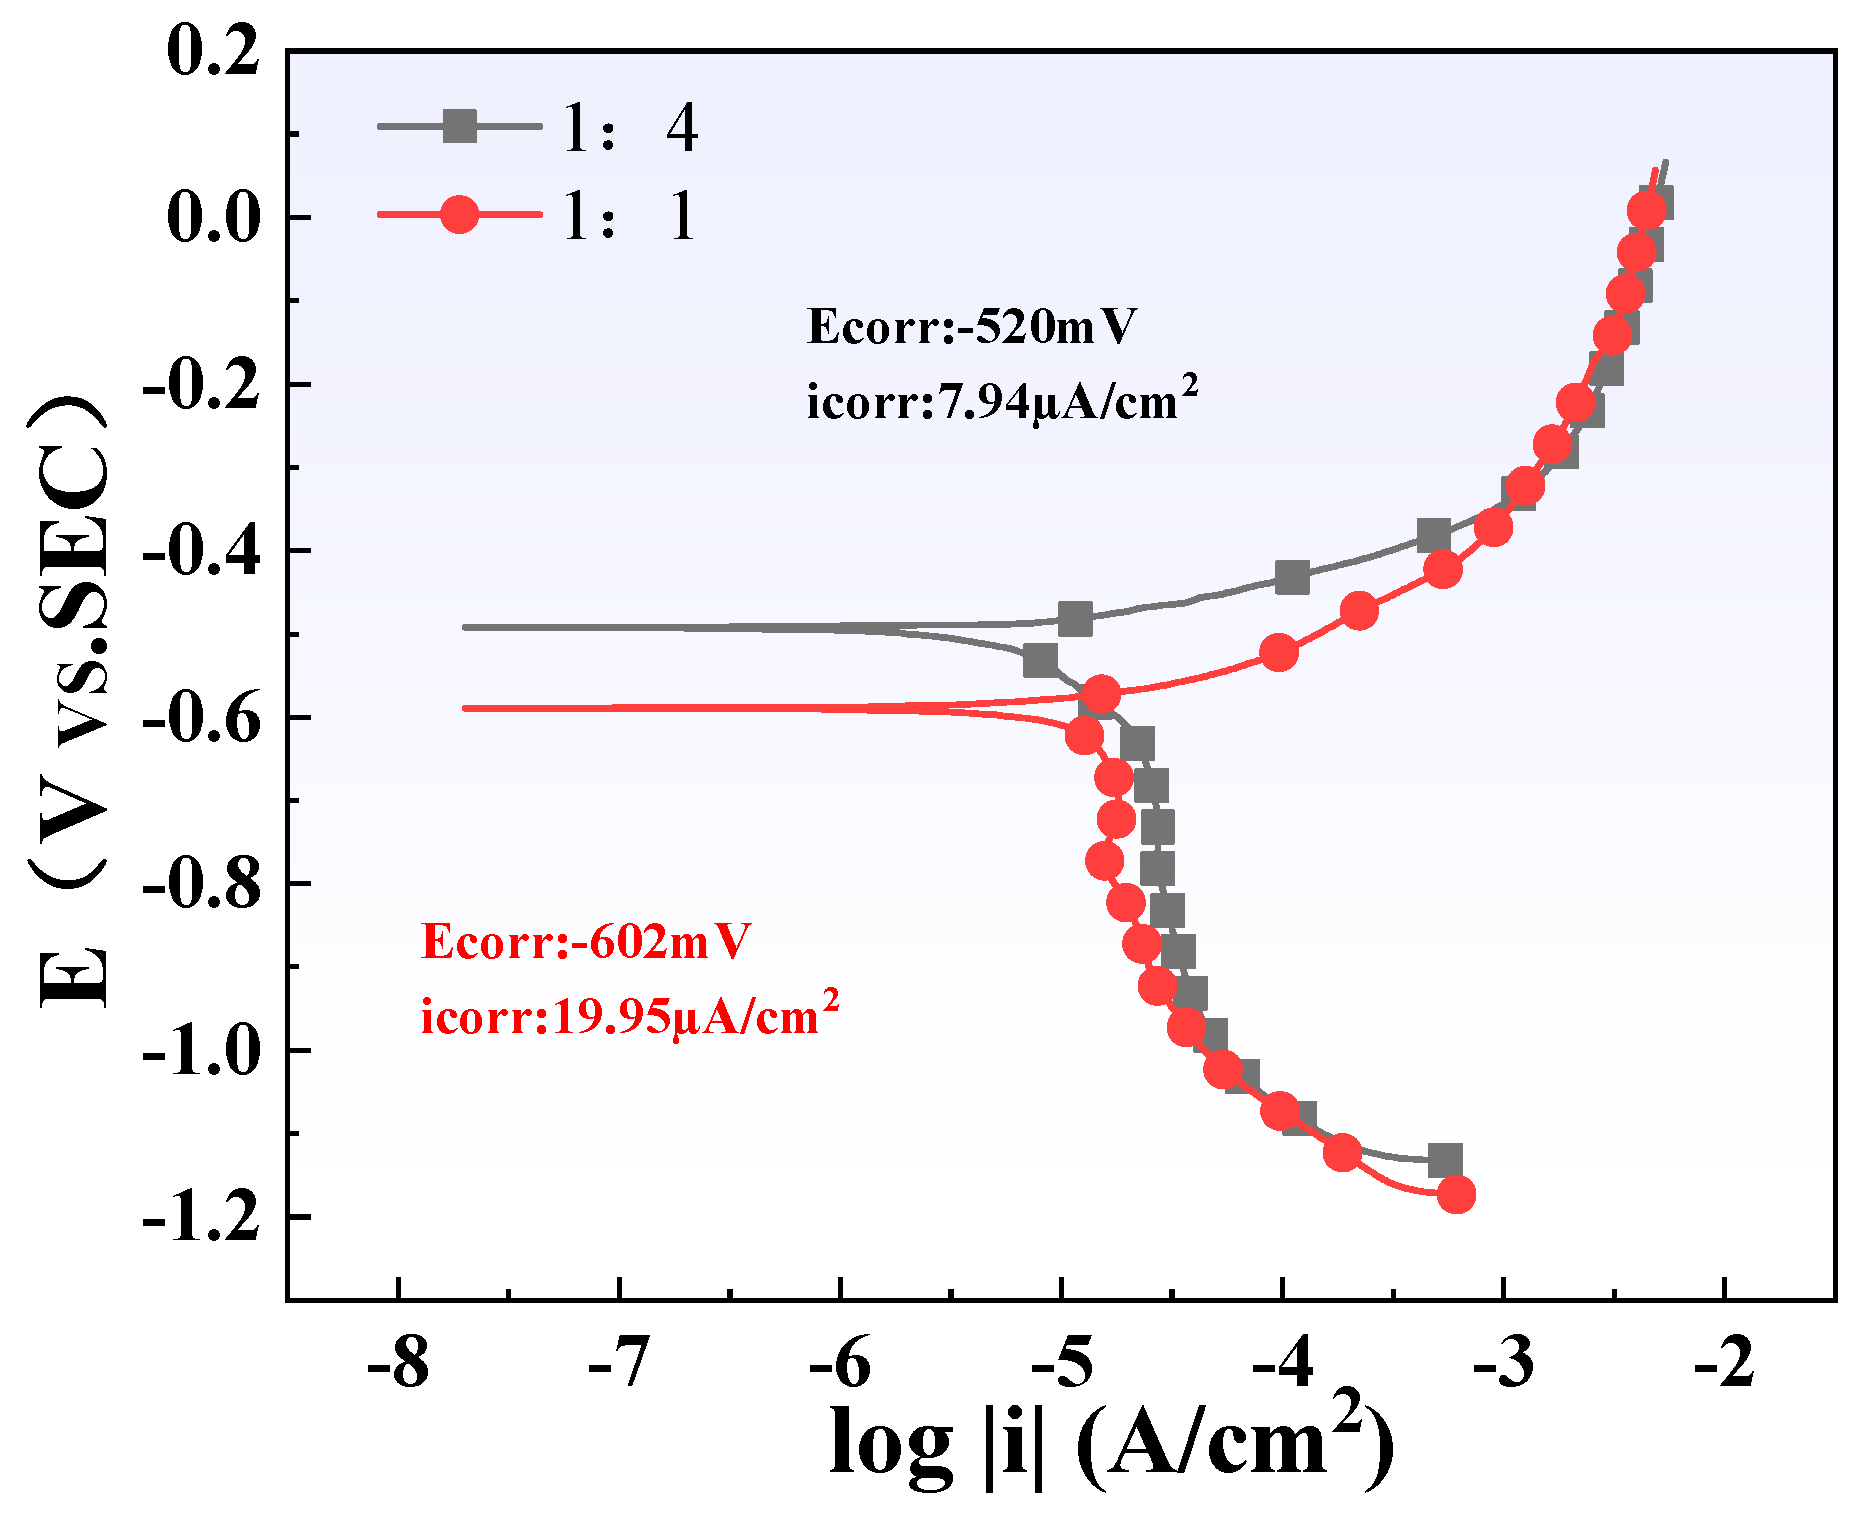
The polarization curves of two different titanium/carbon steel thickness ratio samples (1:1 and 1:4) in the simulated solution are shown in Figure 16. The cathodic process of all curves is clearly dominated by electron transfer, and their anodic process is controlled by the dissolution of the Q345B matrix. The fitting results show that the thicker the carbon steel, that is, the larger its area, the lower its corrosion current density (icorr). This is consistent with the results of weight loss and microscopic characterization.
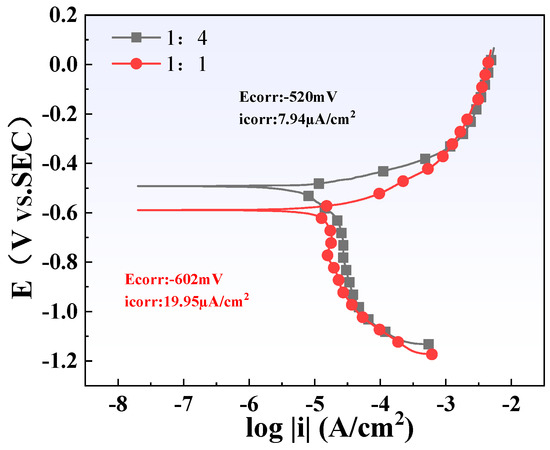
Figure 16.
Electrochemical polarization curve test results of steel plates with different thickness ratios.
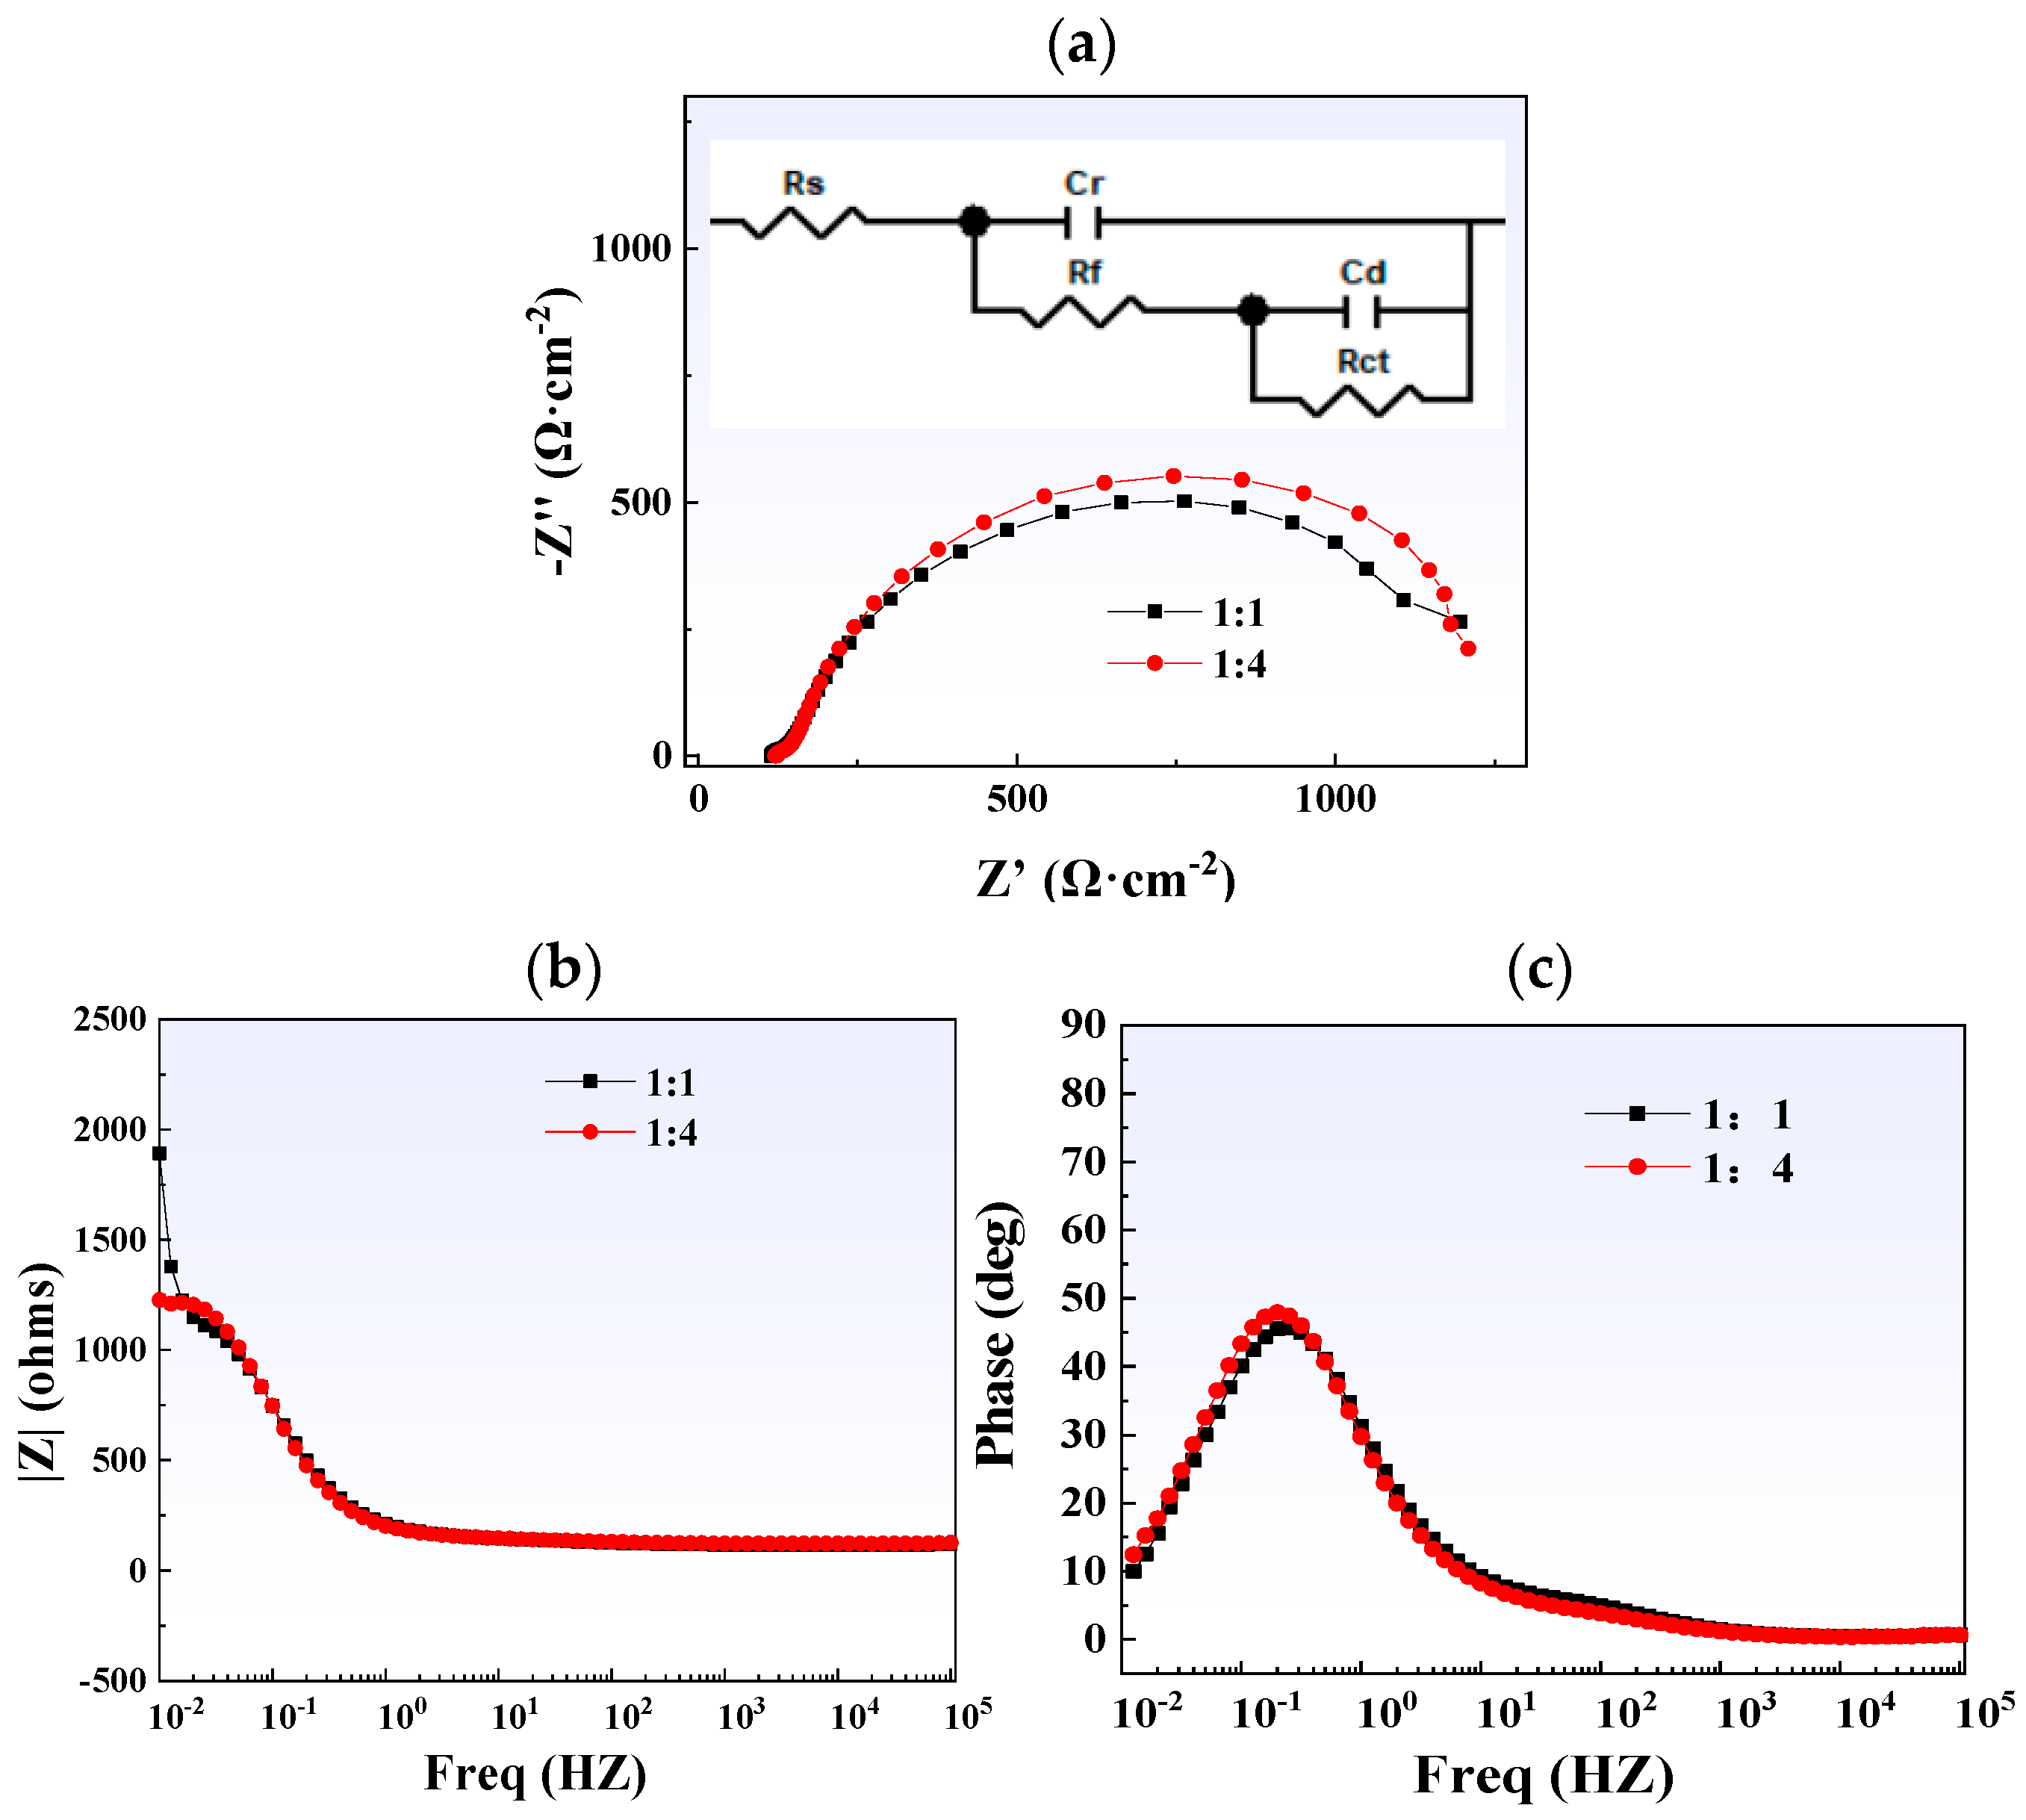
Figure 17 shows the results of electrochemical impedance spectroscopy testing. Both curves on the Nyquist plot exhibit a single semicircular arc, indicating that their electrochemical kinetics are controlled by charge transfer. It is worth noting that compared with the 1:1 titanium/carbon steel composite plate, the curve corresponding to the titanium alloy of the 1:4 titanium/carbon steel composite plate has a larger radius. Rs in the equivalent circuit diagram represents the solution resistance, Rf and CPEf are the resistance and capacitance of the membrane, respectively, and Rct represents the charge transfer resistance. Fitting results show that thicker carbon steel can provide composite plates with higher charge transfer resistance (Table 3), thereby slowing down corrosion.
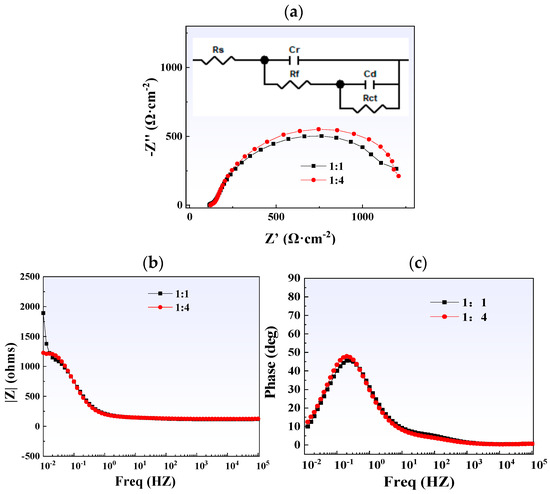
Figure 17.
Electrochemical impedance spectroscopy test results of steel plates with different thickness ratios: (a) Nyquist plot (with the equivalent circuit shown as an inset); (b) Bode-phase plot; (c) Bode-|Z| plot.
Table 3.
EIS fitting parameters of steel plates with different thickness ratios.
4. Discussion
4.1. Small-Scale Defects and Corrosion Dynamics
In the context of minor defects, the exposed carbon steel area, in conjunction with the adjacent titanium alloy, forms a galvanic couple [30,31,32]. This electrochemical interaction can be represented by the following reactions:
The galvanic coupling significantly accelerates the oxidation of iron, subsequently leading to a rapid accumulation of corrosion products, predominantly iron oxides and hydroxides [33,34,35]. These corrosion products, over time, obstruct the diffusion paths for oxygen and chloride ions [36,37], thus impeding further corrosion. This phenomenon can be described by the formation of a semi-permeable barrier [38,39]:
However, in larger defects, the localized galvanic effect is more pronounced at the defect edges, leading to preferential corrosion in these regions. The hypothesis is that the central areas of larger defects, being relatively isolated from the galvanic interaction, experience a slower corrosion rate. This observation suggests a non-uniform corrosion pattern influenced by defect size and distribution [40,41,42].
4.2. Impact of Thickness Ratio on Corrosion Rate
The corrosion rate per unit exposed area of titanium–steel composite plates increases as the thickness ratio decreases. This phenomenon can be primarily attributed to the variations in surface area ratios between the anodic and cathodic regions [43,44], influenced by the constant dimensions of the titanium alloy (cathode) and the variable dimensions of the carbon steel (anode). In detail, the titanium alloy maintains a consistent cathodic surface area, while the anodic area of carbon steel varies. This variation leads to a fluctuating anodic-to-cathodic area ratio, which is a crucial factor in galvanic corrosion [45,46,47,48]. The electrochemical principle that governs this behavior is based on the fact that the corrosion rate through the galvanic couple is a function of the surface area of both the anode and cathode.
As the anodic area decreases, the anodic current density increases. This increase in current density at the anode leads to a more rapid dissolution of the carbon steel, thereby accelerating the overall corrosion process. Moreover, this inverse relationship between anodic area and corrosion rate underlines the significance of balancing the thickness ratio in composite material design. A smaller anodic area concentrates the galvanic effect, intensifying the local corrosion [49]. Furthermore, the observed phenomenon suggests that the distribution of the galvanic current over the anodic surface is not uniform, especially in the case of varying thickness ratios. This non-uniform distribution can lead to localized areas of severe corrosion, which could compromise the structural integrity of the composite material.
Therefore, optimizing the thickness ratio in the design of titanium–steel composite materials is not only about achieving the desired mechanical properties but also about mitigating the corrosion rate. This optimization would involve a careful balance between the structural requirements and the corrosion resistance properties, possibly leading to innovative designs that extend the lifespan and enhance the durability of such materials in corrosive environments.
4.3. Corrosion Mechanisms of Defective Titanium/Steel Composite Plates
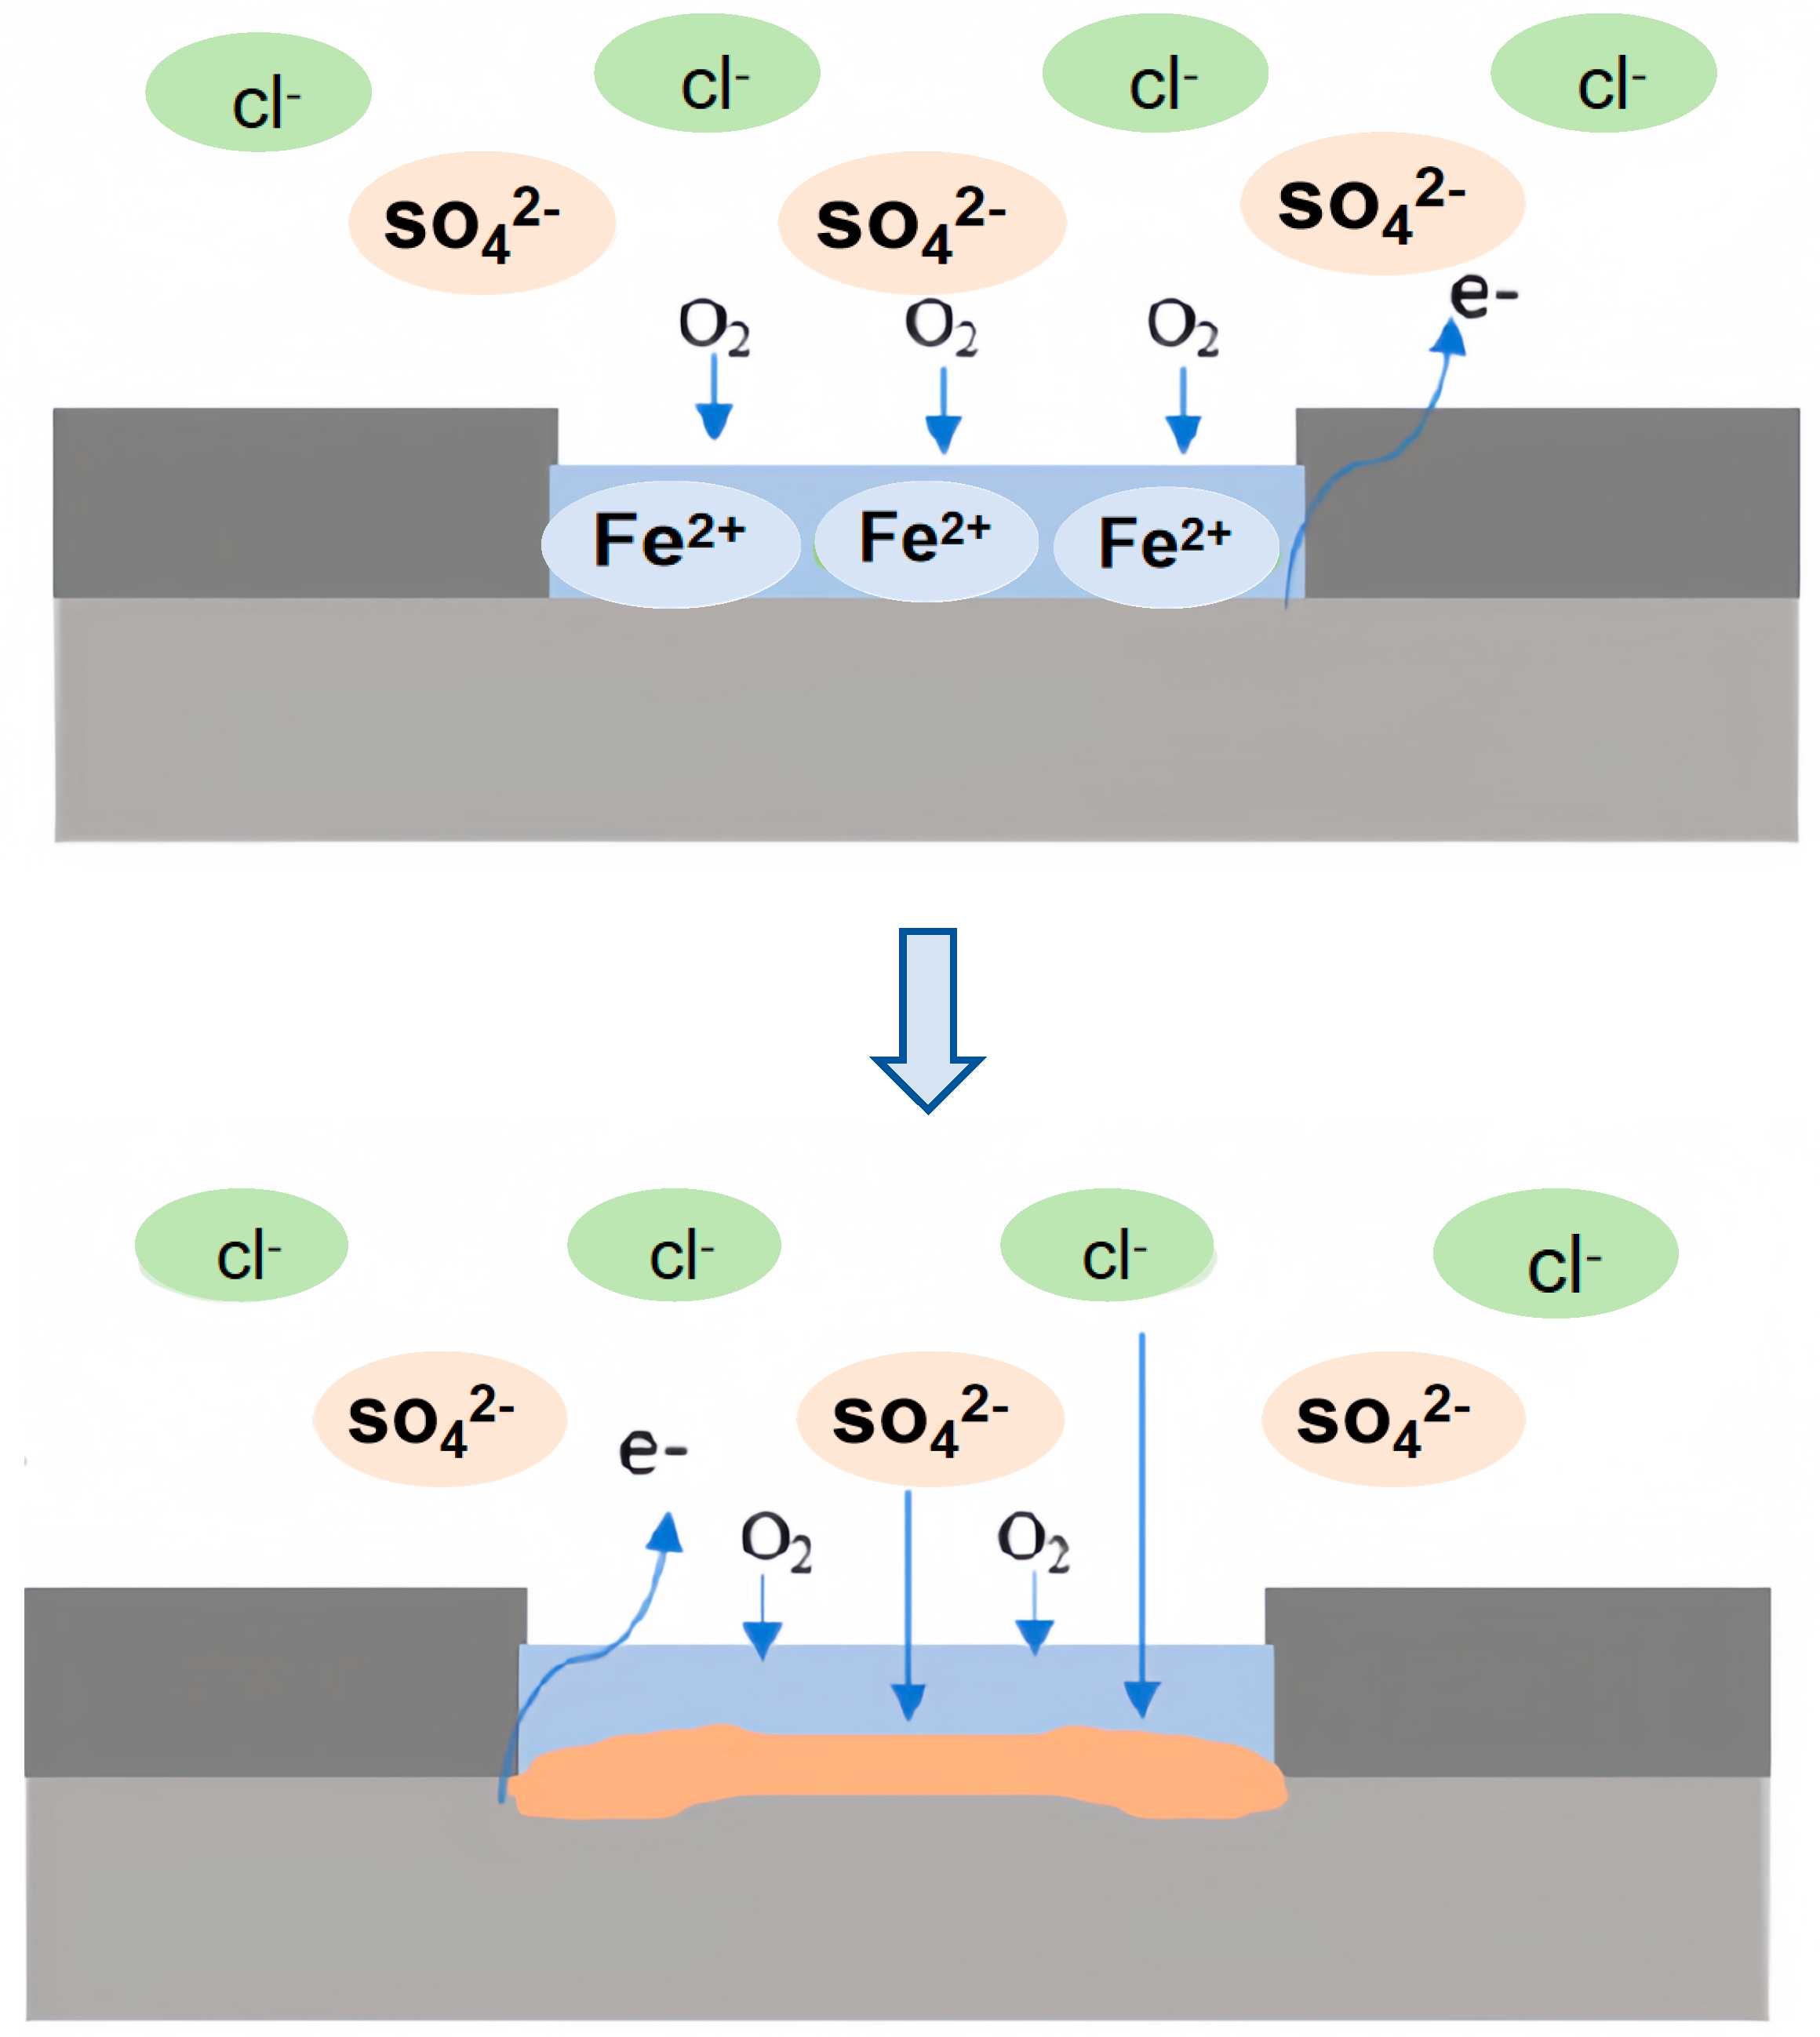
In simulated oceanic solutions, the corrosive attack on carbon steel involves a complex interaction of ions, primarily Cl− [50,51,52], SO42− [52,53], and Ca2+ [50,54]. The presence of Cl− and SO42− ions disrupts the passive layer of iron, potentially through the following reactions:
These reactions lead to the breakdown of passivity and acceleration of corrosion, often resulting in pitting corrosion [55,56]. On the other hand, Ca2+ ions are hypothesized to play a role in inhibiting corrosion by decreasing the porosity of the corrosion product film, although their limited concentration in this study resulted in a minimal protective effect.
At the anode, the dissolution of carbon steel, as previously mentioned, is coupled with the oxygen reduction reaction at the cathode, primarily occurring on the titanium alloy:
The proximity of carbon steel to titanium alloy exacerbates the corrosion at the interface, suggesting that the galvanic interaction plays a pivotal role in the localized corrosion dynamics (Figure 18).
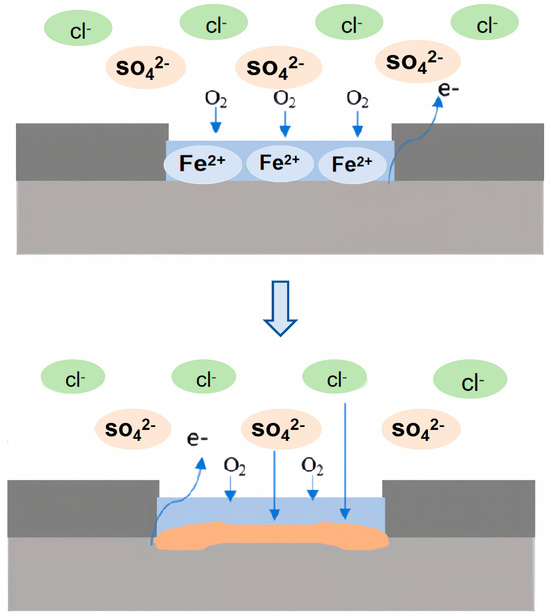
Figure 18.
Corrosion mechanism diagram of titanium/steel composite plate in marine simulated environment.
5. Conclusions
In summary, our study reveals that the corrosion mechanism of titanium/steel composite plates in a simulated marine environment is complex and significantly influenced by defect size and thickness ratio:
- (1)
- Small-scale defects accelerate initial corrosion but eventually lead to a decrease in corrosion rate due to the buildup of protective corrosion products. Larger defects show a more localized corrosion impact.
- (2)
- The overall corrosion rate in a simulated marine environment has a distinct negative correlation with defect size.
- (3)
- When the thickness of the anode carbon steel in the composite plate increases, both RCT and RF increase and the corrosion loss is reduced by 32%, which can slow down the corrosion rate.
Author Contributions
Conceptualization, J.J. and F.L.; methodology, J.J., B.W. and X.C.; software, B.W.; validation, N.L.; formal analysis, N.L. and J.J.; investigation, C.L.; resources, C.L.; data curation, J.J. and F.L.; writing—original draft preparation, J.J.; writing—review and editing, B.W. and N.L.; visualization, F.L.; supervision, C.L. and X.C.; project administration, X.C. and C.L.; funding acquisition, C.L. and X.C. All authors have read and agreed to the published version of the manuscript.
Funding
The authors are grateful for the financial support from the National Key Research and Development Plan of China (2021YFB3701700) and the National Natural Science Foundation of China (No. 52374323).
Data Availability Statement
The raw data supporting the conclusions of this article will be made available by the authors on request.
Conflicts of Interest
Authors Jianbo Jiang and Fangfang Liu were employed by the company Ansteel Beijing Research Institute Co., Ltd. The remaining authors declare that the research was conducted in the absence of any commercial or financial relationships that could be construed as a potential conflict of interest.
References
- Su, H.; Luo, X.B.; Chai, F.; Shen, J.C.; Sun, X.J.; Lu, F. Manufacturing technology and application trends of titanium clad steel plates. J. Iron Steel Res. Int. 2015, 22, 977–982. [Google Scholar] [CrossRef]
- Yu, C.; Qi, Z.C.; Yu, H.; Xu, C.; Xiao, H. Microstructural and mechanical properties of hot roll bonded titanium alloy/low carbon steel plate. J. Mater. Eng. Perform. 2018, 27, 1664–1672. [Google Scholar] [CrossRef]
- Atasoy, E.; Kahraman, N. Diffusion bonding of commercially pure titanium to low carbon steel using a silver interlayer. Mater. Charact. 2008, 59, 1481–1490. [Google Scholar] [CrossRef]
- Kahraman, N.; Gülenç, B.; Findik, F. Joining of titanium/stainless steel by explosive welding and effect on interface. J. Mater. Process. Technol. 2005, 169, 127–133. [Google Scholar] [CrossRef]
- Manikandan, P.; Hokamoto, K.; Deribas, A.A.; Raghukandan, K.; Tomoshige, R. Explosive welding of titanium/stainless steel by controlling energetic conditions. Mater. Trans. 2006, 47, 2049–2055. [Google Scholar] [CrossRef]
- Hayes, J.; Richards, R. The use of titanium and stainless steel in fracture fixation. Expert Rev. Med. Devices 2010, 7, 843–853. [Google Scholar] [CrossRef] [PubMed]
- Procópio, L. The role of biofilms in the corrosion of steel in marine environments. World J. Microbiol. Biotechnol. 2019, 35, 73. [Google Scholar] [CrossRef] [PubMed]
- Madrid, F.M.G.; Soliz, A.; Cáceres, L.; Salazar-Avalos, S.; Guzmán, D.; Gálvez, E. Corrosion of Reinforced A630-420H Steel in Direct Contact with NaCl Solution. Materials 2023, 16, 6017. [Google Scholar] [CrossRef] [PubMed]
- Vera, R.; Bagnara, M.; Henríquez, R.; Muñoz, L.; Rojas, P.; Díaz-Gómez, A. Performance of Anticorrosive Paint Systems for Carbon Steel in the Antarctic Marine Environment. Materials 2023, 16, 5713. [Google Scholar] [CrossRef]
- Qiu, L.; Zhao, D.; Zheng, S.; Gong, A.; Liu, Z.; Su, Y.; Liu, Z. Inhibition Effect of Pseudomonas stutzeri on the Corrosion of X70 Pipeline Steel Caused by Sulfate-Reducing Bacteria. Materials 2023, 16, 2896. [Google Scholar] [CrossRef]
- Hu, J.; Huang, H.; Deng, P.; Wang, G.; Wu, M.; Liu, W. Galvanic corrosion behavior of titanium-clad steel plate in the marine environment. Mater. Corros. 2022, 73, 887–896. [Google Scholar] [CrossRef]
- Liu, Y.; Zheng, Z.; Long, J.; Xu, Z.; Jiao, S.; Qiao, Y.; Zheng, K.; Yin, F. Corrosion behaviour of hot-rolled 316L stainless steel-A6 carbon steel composite steel plate for marine environment. J. Mater. Res. Technol. 2023, 26, 556–570. [Google Scholar] [CrossRef]
- Patnaik, A.; Shan, X.; Adams, M.; Srivatsan, T.S.; Menzemer, C.C.; Payer, J. Isolating Corrosion of Steel Plates Coupled with Titanium. Adv. Steel Constr. 2014, 10, 216–233. [Google Scholar]
- El Ibrahimi, B.; Jmiai, A.; El Mouaden, K.; Baddouh, A.; El Issami, S.; Bazzi, L.; Hilali, M. Effect of solution’s pH and molecular structure of three linear α-amino acids on the corrosion of tin in salt solution: A combined experimental and theoretical approach. J. Mol. Struct. 2019, 1196, 105–118. [Google Scholar] [CrossRef]
- Abbas, M.; Shafiee, M. An overview of maintenance management strategies for corroded steel structures in extreme marine environments. Mar. Struct. 2020, 71, 102718. [Google Scholar] [CrossRef]
- Islam, M.; Sakairi, M. Corrosion inhibition of mild steel by metal cations in high pH simulated fresh water at different temperatures. Corros. Sci. 2019, 153, 100–108. [Google Scholar] [CrossRef]
- Alamri, A.H. Localized corrosion and mitigation approach of steel materials used in oil and gas pipelines–An overview. Eng. Fail. Anal. 2020, 116, 104735. [Google Scholar] [CrossRef]
- Zhang, W.; Oswal, H.; Renew, J.; Ellison, K.; Huang, C.H. Removal of heavy metals by aged zero-valent iron from flue-gas-desulfurization brine under high salt and temperature conditions. J. Hazard. Mater. 2019, 373, 572–579. [Google Scholar] [CrossRef] [PubMed]
- Zhi, Y.; Jin, Z.; Lu, L.; Yang, T.; Zhou, D.; Pei, Z.; Wu, D.; Fu, D.; Zhang, D.; Li, X. Improving atmospheric corrosion prediction through key environmental factor identification by random forest-based model. Corros. Sci. 2021, 178, 109084. [Google Scholar] [CrossRef]
- Farh, H.; Seghier, M.; Zayed, T. A comprehensive review of corrosion protection and control techniques for metallic pipelines. Eng. Fail. Anal. 2023, 143, 106885. [Google Scholar] [CrossRef]
- Ge, T.; Zhao, W.; Wu, X.; Lan, X.; Zhang, Y.; Qiang, Y.; He, Y. Incorporation of electroconductive carbon fibers to achieve enhanced anti-corrosion performance of zinc rich coatings. J. Colloid Interface Sci. 2020, 567, 113–125. [Google Scholar] [CrossRef] [PubMed]
- Liu, Y.; Zheng, Z.; Xu, L.; Xu, Z.; Yin, F.; Zheng, K. Unraveling the interfacial structure of TA2 titanium-A36 steel composite plate and its corrosion behavior in marine environment. Corros. Sci. 2024, 230, 111923. [Google Scholar] [CrossRef]
- Zhao, X.; Qi, Y.; Wang, J.; Peng, T.; Zhang, Z.; Li, K. Effect of Weld and Surface Defects on the Corrosion Behavior of Nickel Aluminum Bronze in 3.5% NaCl Solution. Metals 2020, 10, 1227. [Google Scholar] [CrossRef]
- Zhang, D.; Yang, L.; Tan, Z.; Xing, S.; Bai, S.; Wei, E.; Tang, X.; Jin, Y. Corrosion behavior of X65 steel at different depths of pitting defects under local flow conditions. Exp. Therm. Fluid Sci. 2021, 124, 110333. [Google Scholar] [CrossRef]
- Li, Y.; Macdonald, D.D.; Yang, J.; Qiu, J.; Wang, S. Point defect model for the corrosion of steels in supercritical water: Part I, film growth kinetics. Corros. Sci. 2020, 163, 108280. [Google Scholar] [CrossRef]
- Macdonald, D. The history of the Point Defect Model for the passive state: A brief review of film growth aspects. Electrochim. Acta 2011, 56, 1761–1772. [Google Scholar] [CrossRef]
- Cheung, G.S.P.; Peng, B.; Bian, Z.; Shen, Y.; Darvell, B.W. Defects in ProTaper S1 instruments after clinical use: Fractographic examination. Int. Endod. J. 2005, 38, 802–809. [Google Scholar] [CrossRef] [PubMed]
- Silva, J.E.; Garbatov, Y.; Soares, C.G. Ultimate strength assessment of rectangular steel plates subjected to a random localised corrosion degradation. Eng. Struct. 2013, 52, 295–305. [Google Scholar] [CrossRef]
- GB/T16545-1996; Corrosion of Metals and Alloys. Removal of Corrosion Products from Corrosion Specimens. National Steel Standardization Technical Committee: Beijing, China, 1996.
- Rahimi, E.; Rafsanjani-Abbasi, A.; Imani, A.; Hosseinpour, S.; Davoodi, A. Insights into galvanic corrosion behavior of Ti-Cu dissimilar joint: Effect of microstructure and volta potential. Materials 2018, 11, 1820. [Google Scholar] [CrossRef]
- Jadhav, N.; Gelling, V. The use of localized electrochemical techniques for corrosion studies. J. Electrochem. Soc. 2019, 166, C3461. [Google Scholar] [CrossRef]
- De Oliveira, M.C.L.; Da Silva, R.M.P.; Souto, R.M.; Antunes, R.A. Investigating local corrosion processes of magnesium alloys with scanning probe electrochemical techniques: A review. J. Magnes. Alloys 2022, 11, 2997–3030. [Google Scholar] [CrossRef]
- Chan, E. Magnetite and Its Galvanic Effect on the Corrosion of Carbon Steel under Carbon Dioxide Environments. Ph.D. Thesis, Curtin University, Bentley, Australia, 2011. [Google Scholar]
- McMahon, M.E.; Santucci, R.J., Jr.; Glover, C.F.; Kannan, B.; Walsh, Z.R.; Scully, J.R. A review of modern assessment methods for metal and metal-oxide based primers for substrate corrosion protection. Front. Mater. 2019, 6, 190. [Google Scholar] [CrossRef]
- AlAbbas, F.M.; Williamson, C.; Bhola, S.M.; Spear, J.R.; Olson, D.L.; Mishra, B.; Kakpovbia, A.E. Microbial corrosion in linepipe steel under the influence of a sulfate-reducing consortium isolated from an oil field. J. Mater. Eng. Perform. 2013, 22, 3517–3529. [Google Scholar] [CrossRef]
- Liu, L.; Li, Y.; Wang, F. Electrochemical corrosion behavior of nanocrystalline materials—A review. J. Mater. Sci. Technol. 2010, 26, 1–14. [Google Scholar] [CrossRef]
- Wong, H.S.; Zhao, Y.X.; Karimi, A.R.; Buenfeld, N.R.; Jin, W.L. On the penetration of corrosion products from reinforcing steel into concrete due to chloride-induced corrosion. Corros. Sci. 2010, 52, 2469–2480. [Google Scholar] [CrossRef]
- Ding, Y.; Gutiérrez-Ariza, C.M.; Zheng, M.; Felgate, A.; Lawes, A.; Sainz-Díaz, C.I.; Cartwright, J.H.; Cardoso, S.S. Downward fingering accompanies upward tube growth in a chemical garden grown in a vertical confined geometry. Phys. Chem. Chem. Phys. 2022, 24, 17841–17851. [Google Scholar] [CrossRef] [PubMed]
- Maj, M.; Ubysz, A. The reasons for the loss of polyurea coatings adhesion to the concrete substrate in chemically aggressive water tanks. Eng. Fail. Anal. 2022, 142, 106774. [Google Scholar] [CrossRef]
- Zhang, X.; Jiang, C.; Chen, Y.; Memon, S.A.; Lun, P.; Sun, H.; Ren, J.; Wang, J. Study on the non-uniformity of rust layer and residual rebar caused by pitting corrosion in mortar. Constr. Build. Mater. 2023, 406, 133442. [Google Scholar] [CrossRef]
- Luo, G.; Zhang, K.; Zhu, W.; Chen, T.; Yang, X.; Yang, S.; Xu, Y. Effect of non-uniform corrosion on the cracking propagation of the RC specimens. Constr. Build. Mater. 2021, 270, 121460. [Google Scholar] [CrossRef]
- Wang, F.; Xue, X.; Hua, J.; Chen, Z.; Huang, L.; Wang, N.; Jin, J. Non-uniform corrosion influences on mechanical performances of stainless-clad bimetallic steel bars. Mar. Struct. 2022, 86, 103276. [Google Scholar] [CrossRef]
- Ogle, K.; Baudu, V.; Garrigues, L.; Philippe, X. Localized electrochemical methods applied to cut edge corrosion. J. Electrochem. Soc. 2000, 147, 3654. [Google Scholar] [CrossRef]
- Pasupuleti, S.B.; Srikanth, S.; Dominguez-Benetton, X.; Mohan, S.V.; Pant, D. Dual gas diffusion cathode design for microbial fuel cell (MFC): Optimizing the suitable mode of operation in terms of bioelectrochemical and bioelectro-kinetic evaluation. J. Chem. Technol. Biotechnol. 2016, 91, 624–639. [Google Scholar] [CrossRef]
- Shi, L.; Song, Y.; Zhao, P.; Wang, H.; Dong, K.; Shan, D.; Han, E.H. Variations of galvanic currents and corrosion forms of 2024/Q235/304 tri-metallic couple with multivariable cathode/anode area ratios: Experiments and modeling. Electrochim. Acta 2020, 359, 136947. [Google Scholar] [CrossRef]
- Okonkwo, B.O.; Ming, H.; Wang, J.; Han, E.H.; Rahimi, E.; Davoodi, A.; Hosseinpour, S. A new method to determine the synergistic effects of area ratio and microstructure on the galvanic corrosion of LAS A508/309 L/308 L SS dissimilar metals weld. J. Mater. Sci. Technol. 2021, 78, 38–50. [Google Scholar] [CrossRef]
- Nakatsugawa, I.; Chino, Y. Effect of area ratio on the galvanic corrosion of AZX611 magnesium alloy/A6N01 aluminum alloy joint. Mater. Trans. 2021, 62, 1764–1770. [Google Scholar] [CrossRef]
- Song, G.; Johannesson, B.; Hapugoda, S.; StJohn, D. Galvanic corrosion of magnesium alloy AZ91D in contact with an alu-minium alloy, steel and zinc. Corros. Sci. 2004, 46, 955–977. [Google Scholar] [CrossRef]
- Yin, Z.; He, R.; Chen, Y.; Yin, Z.; Yan, K.; Wang, K.; Yan, H.; Song, H.; Yin, C.; Guan, H.; et al. Effects of surface micro–galvanic corrosion and corrosive film on the corrosion resistance of AZ91–xNd alloys. Appl. Surf. Sci. 2021, 536, 147761. [Google Scholar] [CrossRef]
- Song, Q.; Nie, J.; Wu, D.; Hu, Y.; Chen, Y. Effect of SO42−, Cl− and Mg2+ on the system of CSH and Ca(OH)2. Constr. Build. Mater. 2021, 285, 122955. [Google Scholar] [CrossRef]
- Krivenko, P.; Rudenko, I.; Konstantynovskyi, O.; Vaičiukynienė, D. Mitigation of corrosion initiated by Cl− and SO42−-ions in blast furnace cement concrete mixed with sea water. Materials 2022, 15, 3003. [Google Scholar] [CrossRef]
- Feng, X.; Yan, Q.; Zhu, C.; Chen, Z.; Lu, X.; Lu, S. Corrosion Performance of 201 low-Nickel Stainless Steel Anchor in Cl– Contaminated Underground Water with Various Concentrations of SO42− and HCO3−. J. Electrochem. Soc. 2022, 169, 021507. [Google Scholar] [CrossRef]
- Bonilla, A.; Argiz, C.; Moragues, A.; Gálvez, J.C. Effect of Sulfate Ions on Galvanized Post-Tensioned Steel Corrosion in Alkaline Solutions and the Interaction with Other Ions. Materials 2022, 15, 3950. [Google Scholar] [CrossRef] [PubMed]
- Abd El Haleem, S.M.; Abd El Wanees, S.; Abd El Aal, E.E.; Diab, A. Environmental factors affecting the corrosion behavior of reinforcing steel II. Role of some anions in the initiation and inhibition of pitting corrosion of steel in Ca(OH)2 solutions. Corros. Sci. 2010, 52, 292–302. [Google Scholar] [CrossRef]
- Ogunleye, D.; Odulanmi, A.; Fayomi, S. Corrosion Characteristics and Passive Behavioral Responses. IOP Conf. Ser. Mater. Sci. Eng. 2021, 1107, 012234. [Google Scholar] [CrossRef]
- Green, W.K. Steel reinforcement corrosion in concrete–an overview of some fundamentals. Corros. Eng. Sci. Technol. 2020, 55, 289–302. [Google Scholar] [CrossRef]
Disclaimer/Publisher’s Note: The statements, opinions and data contained in all publications are solely those of the individual author(s) and contributor(s) and not of MDPI and/or the editor(s). MDPI and/or the editor(s) disclaim responsibility for any injury to people or property resulting from any ideas, methods, instructions or products referred to in the content. |
© 2024 by the authors. Licensee MDPI, Basel, Switzerland. This article is an open access article distributed under the terms and conditions of the Creative Commons Attribution (CC BY) license (https://creativecommons.org/licenses/by/4.0/).