
A Metal Accelerator Approach for Discharging Cylindrical Lithium-Ion Batteries in a Salt Solution


Abstract

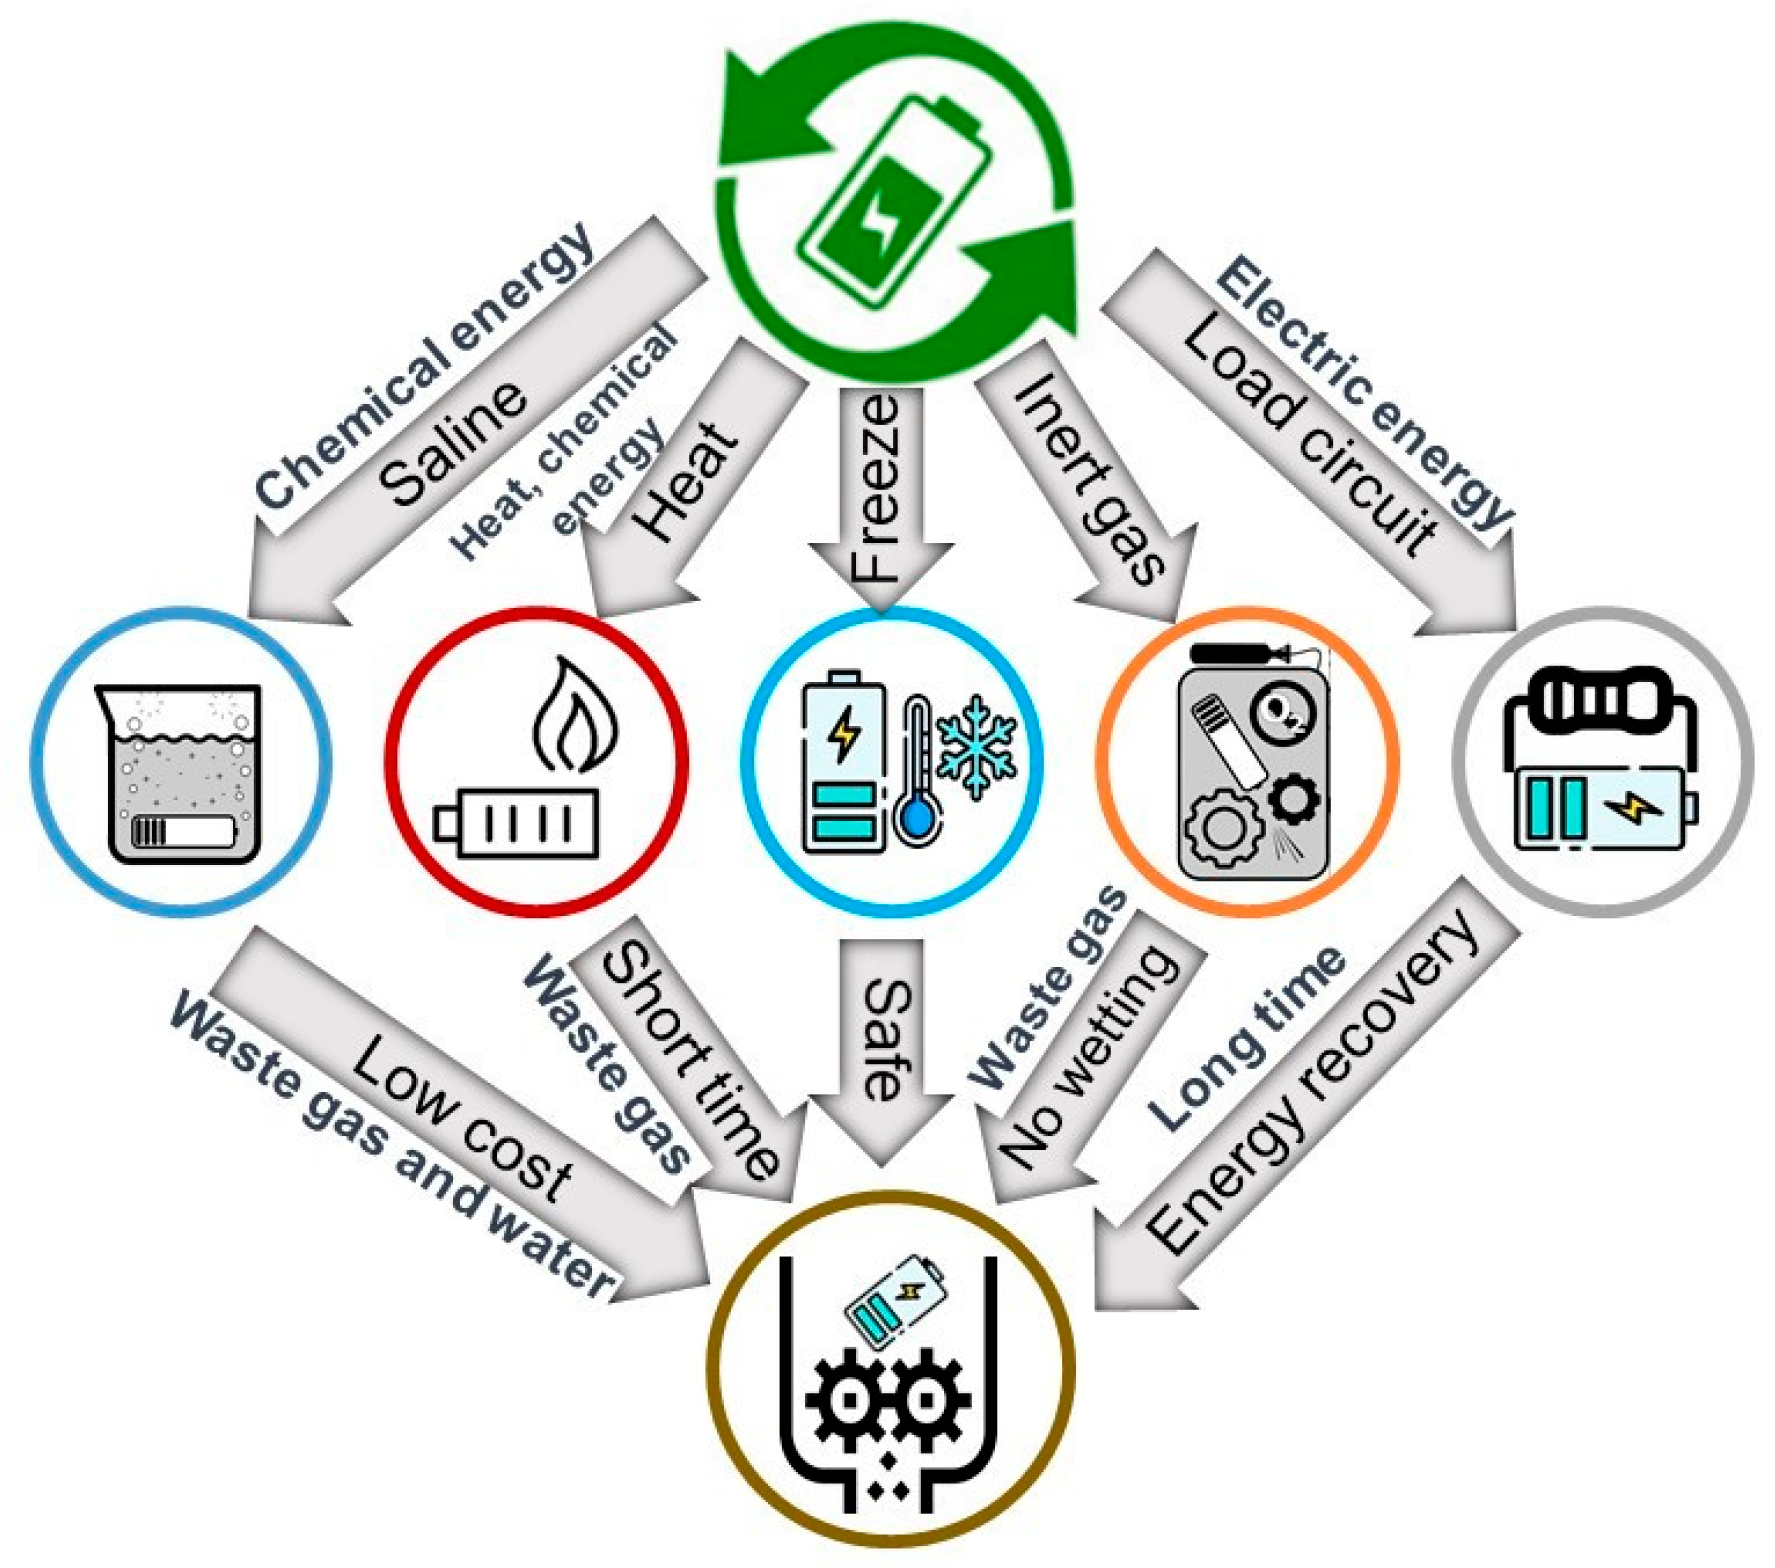
1. Introduction
2. Materials and Methods
2.1. Experimental Materials
2.2. Experimental Procedures
2.3. Analysis Methods
3. Results and Discussion
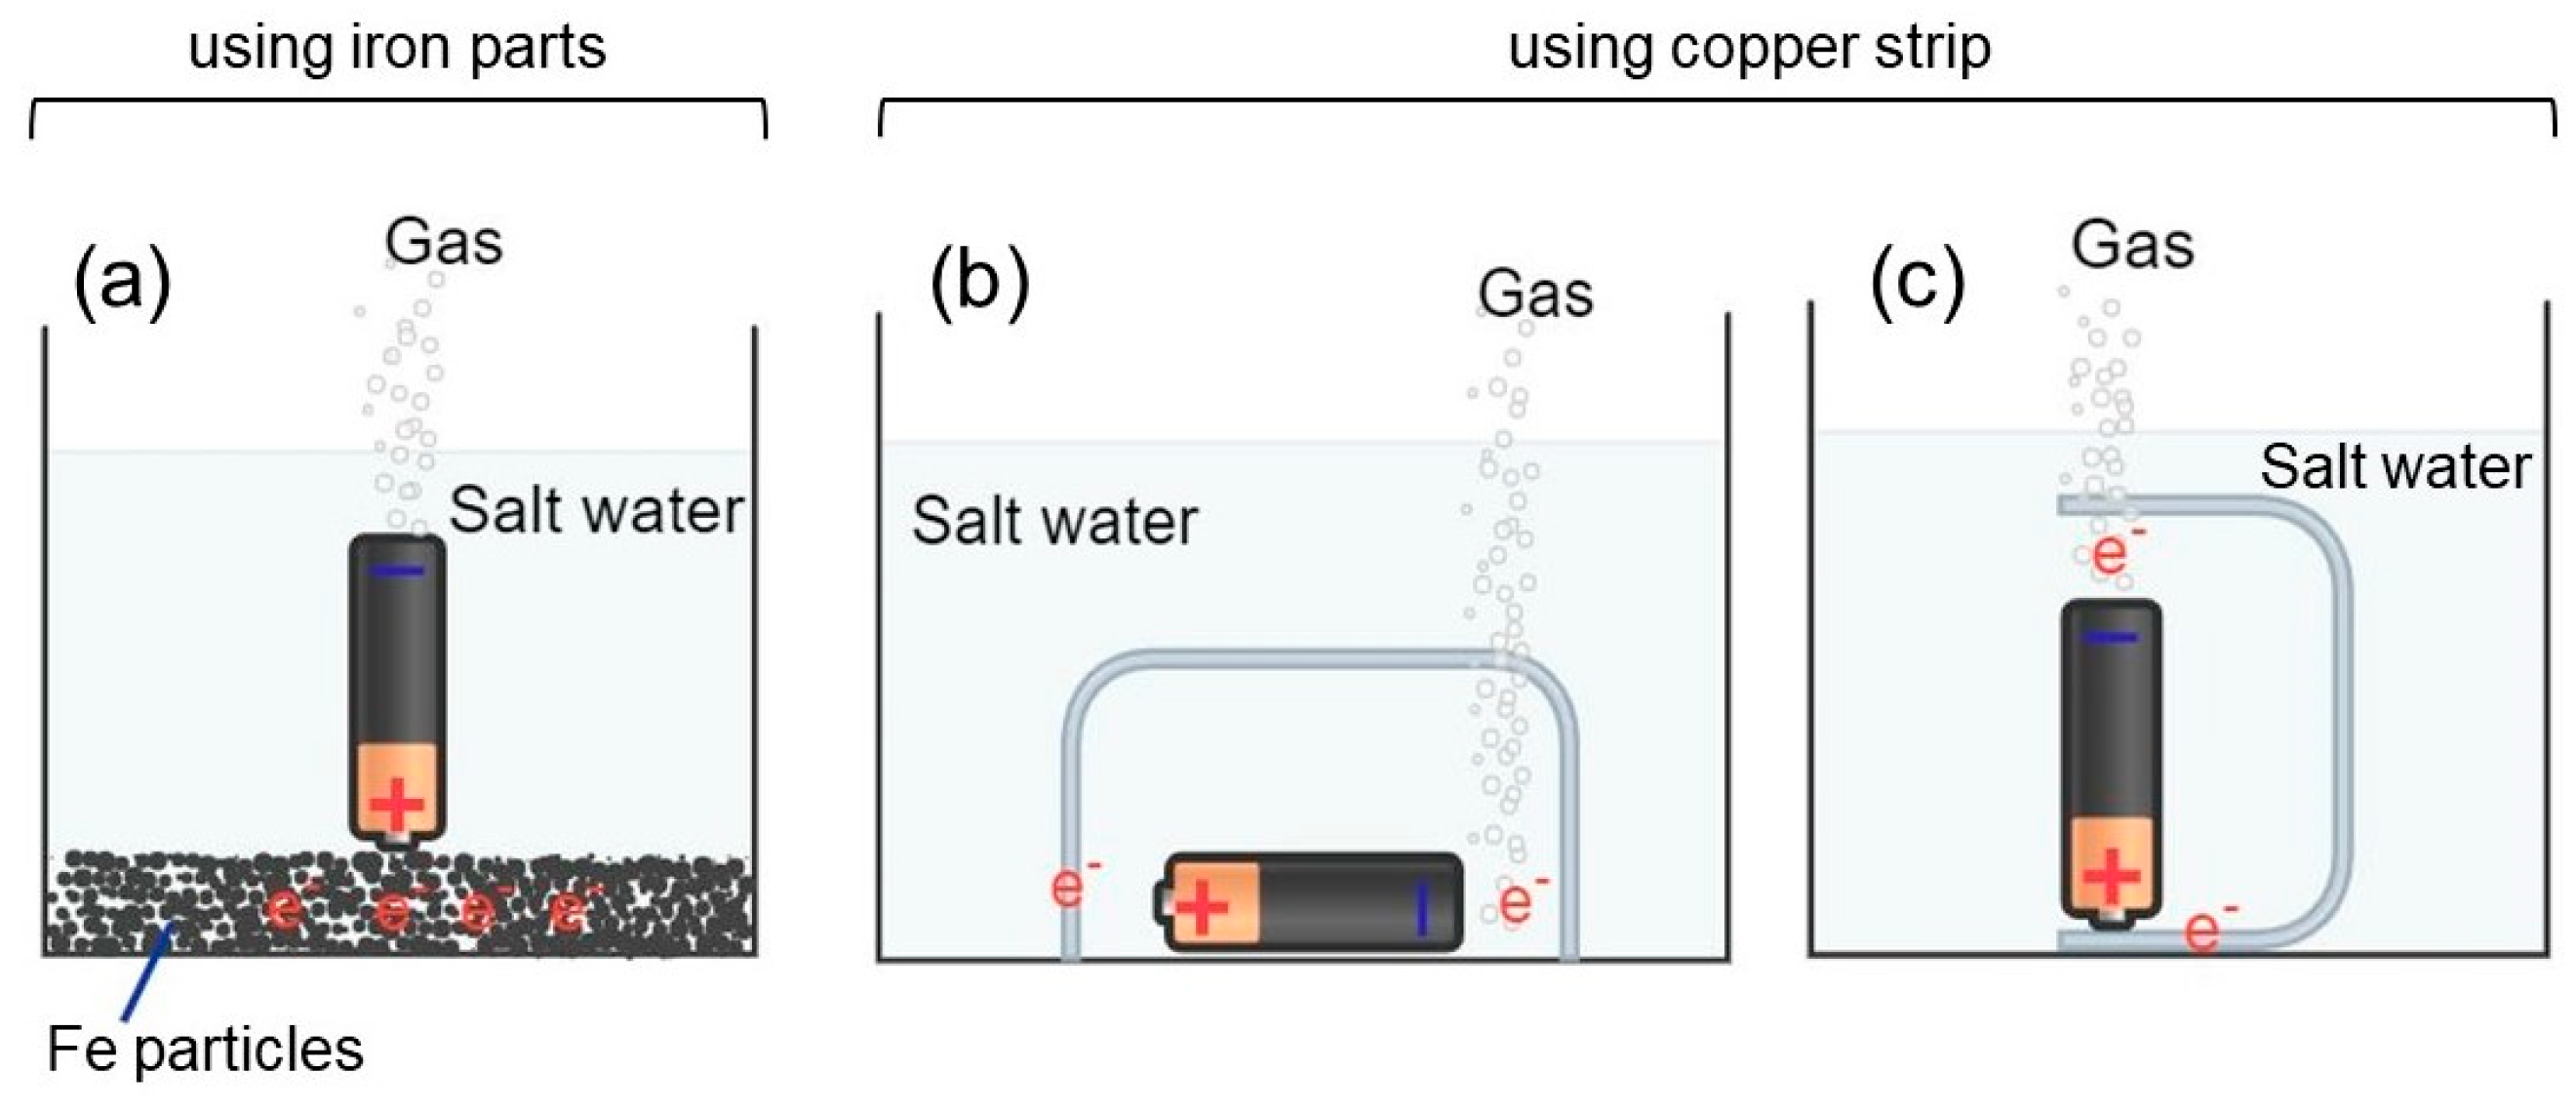
3.1. Discharge in Salt Water Using a Bed of Iron Particles
3.2. Battery Discharge in Salt Water Using a Copper Conductor
3.2.1. Battery Discharge Using a Copper Conductor Not in Contact with the Battery
3.2.2. Battery Discharge Using a Copper Conductor in Contact with the Battery
3.3. Theoretical Framework for Discharging Process
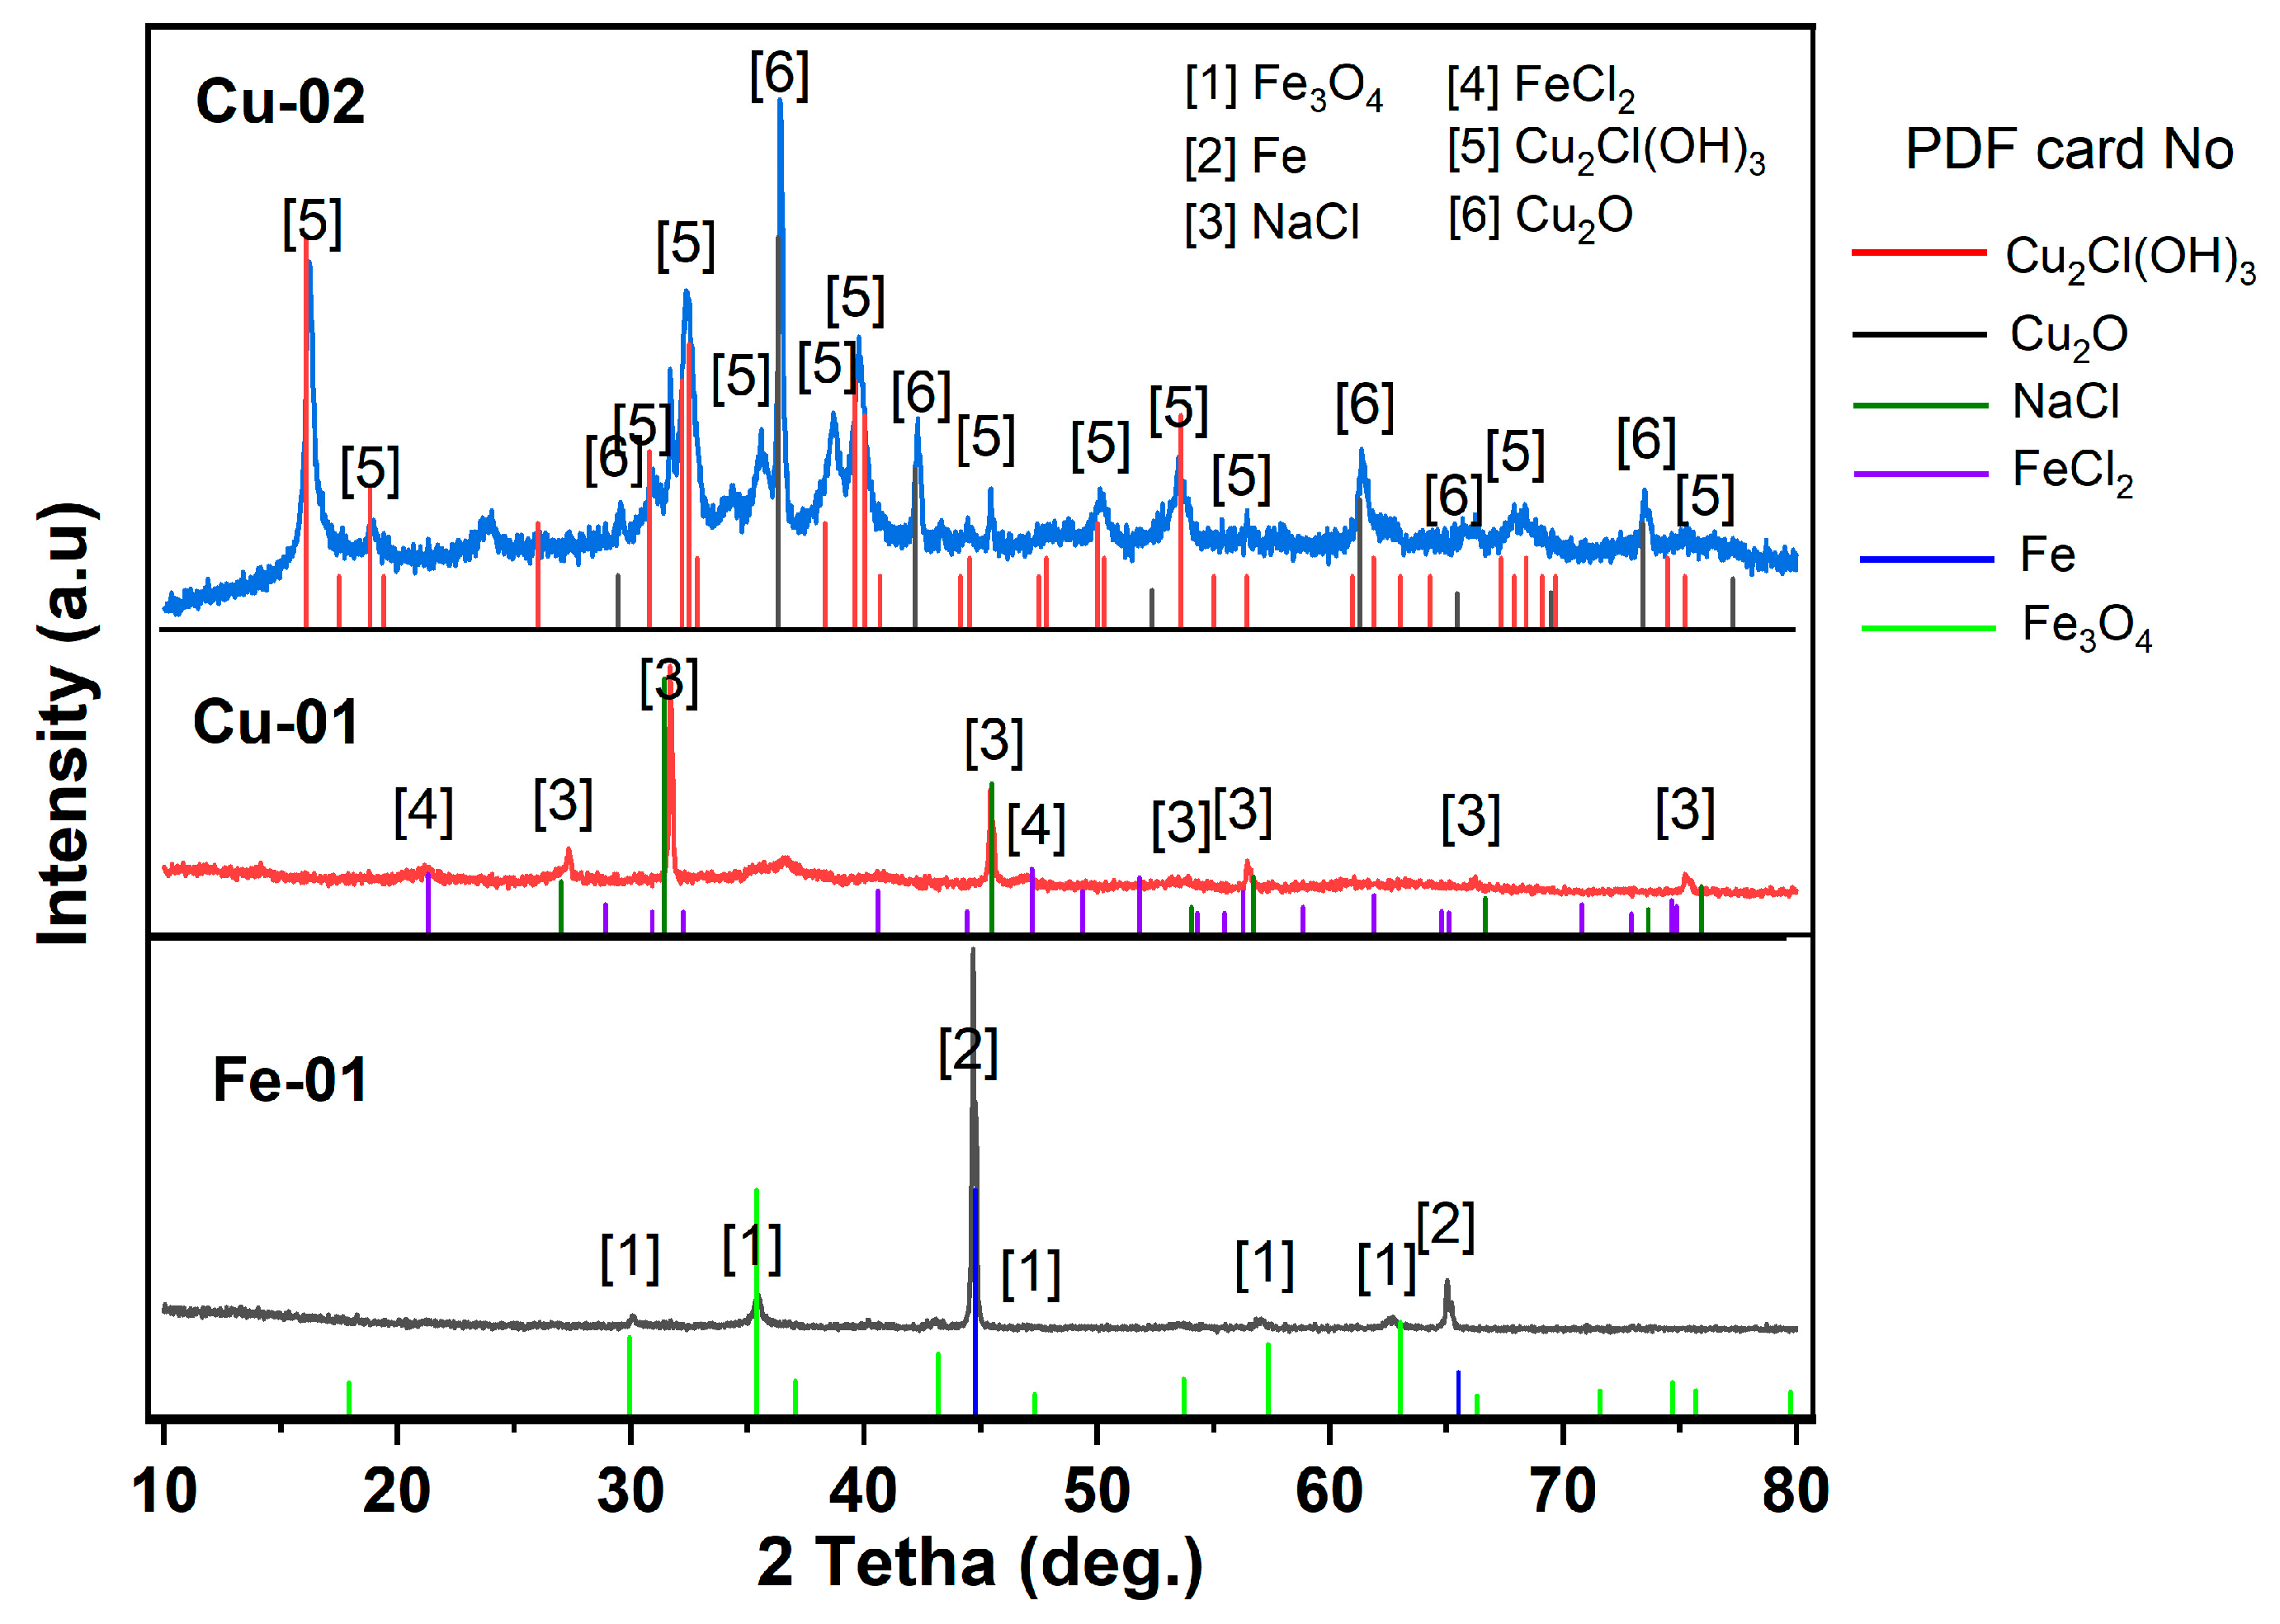
3.4. Chemical Analysis of Precipitates
3.5. Comparing Battery Discharge Approaches in Electrolyte Solution
4. Conclusions
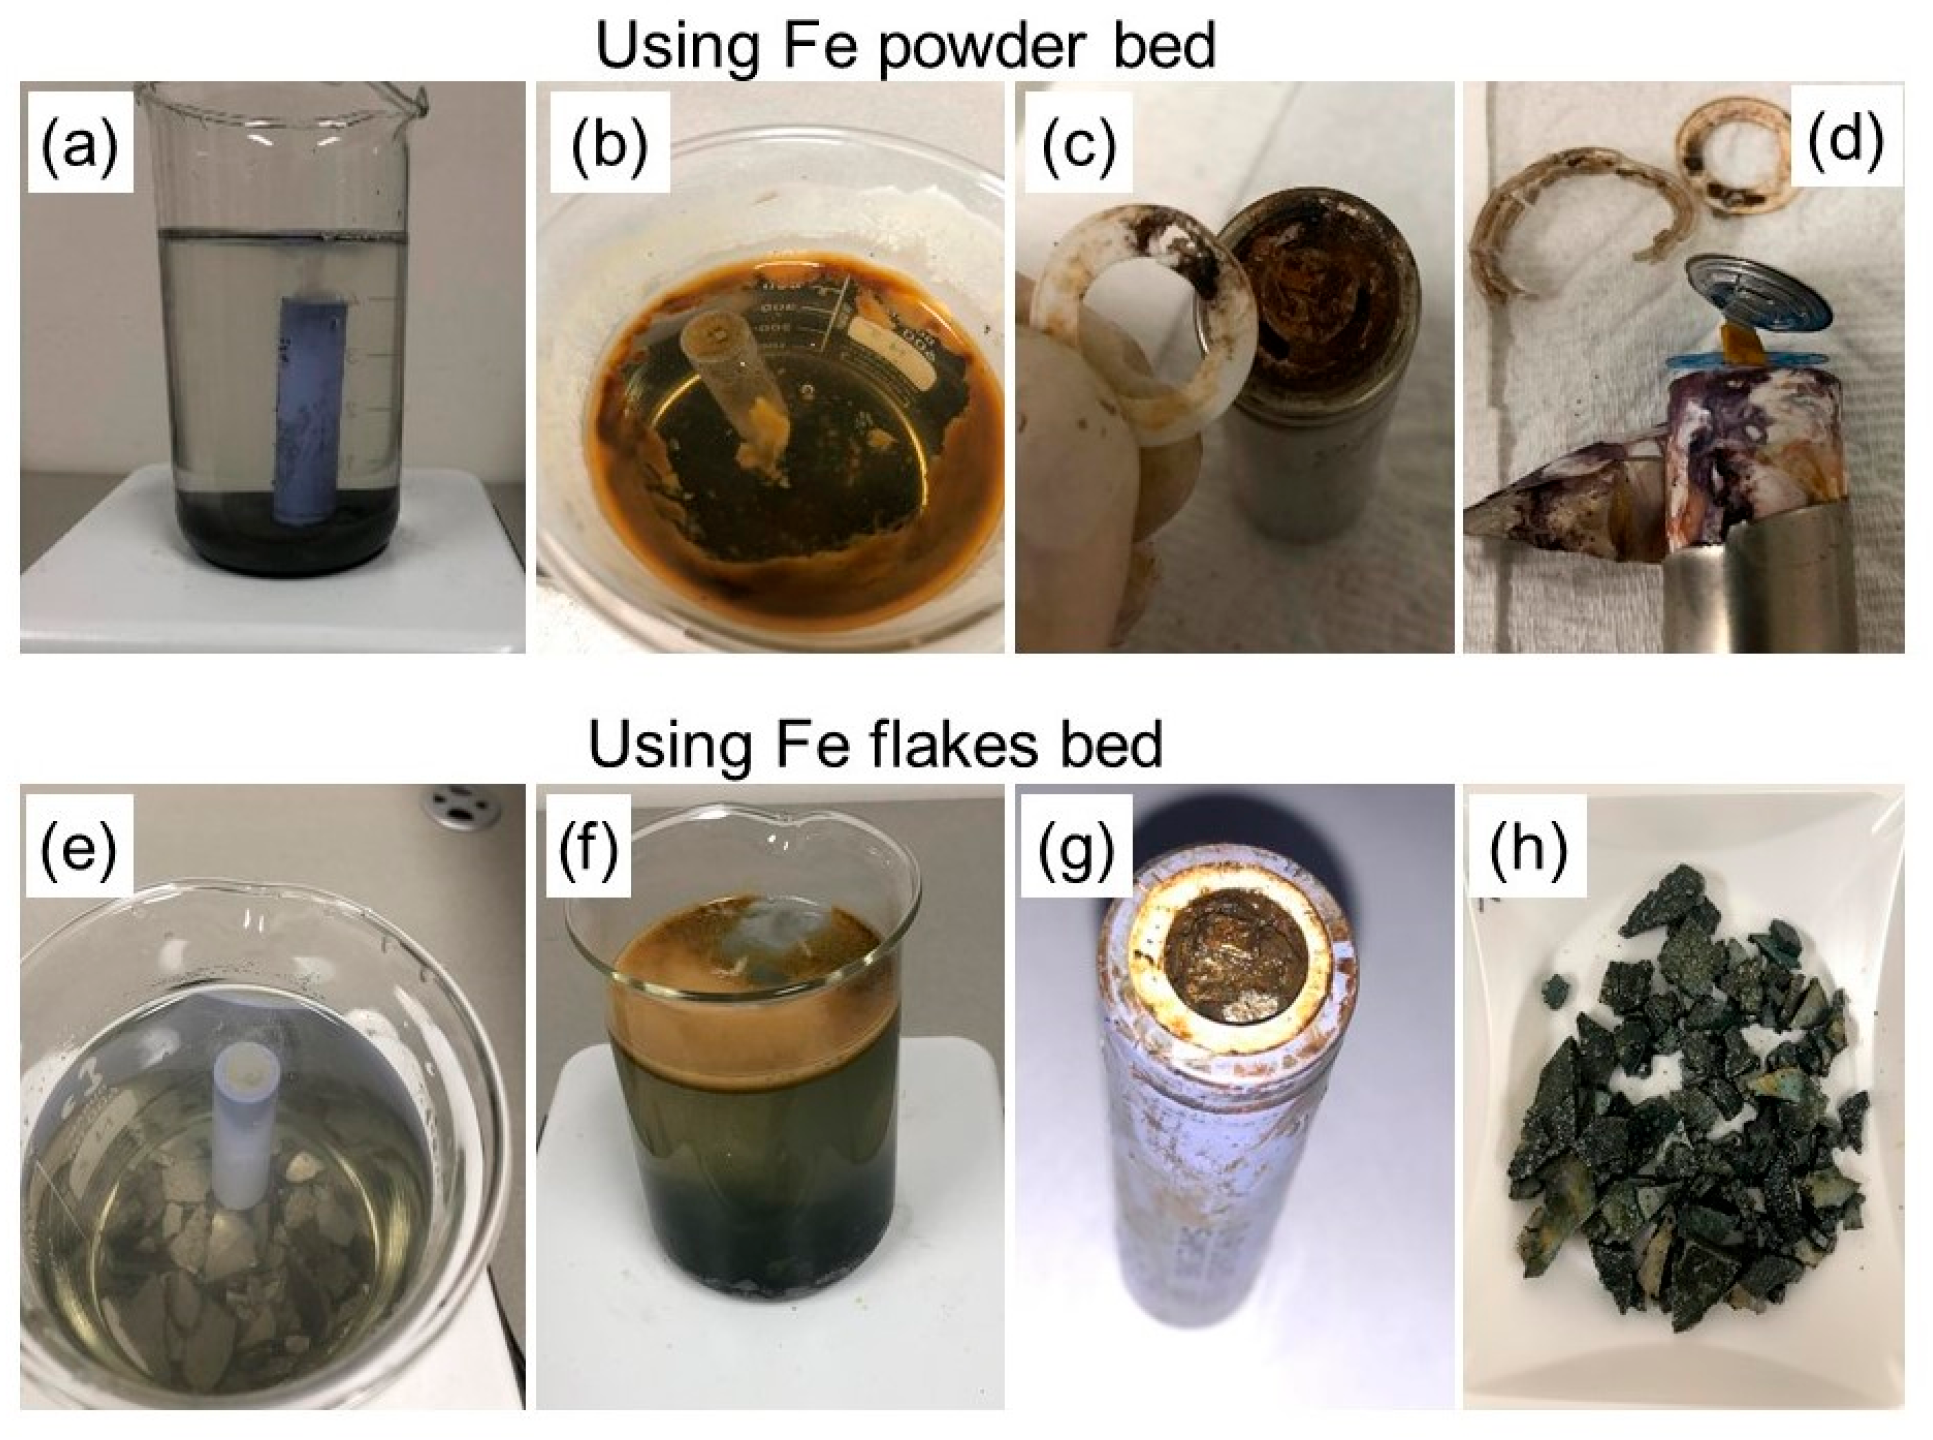
- The objective of this method was to study how iron powder and flakes affect battery voltage, and specifically their ability to reduce it. In the case of a battery immersed in iron powder, the discharge rate was 99.5% within the first 4 h. However, the use of iron flakes resulted in a voltage drop of 99.8% after a longer duration of 12 h. Through this method, it was found that the voltage could be decreased without causing any corrosion to the components of the battery.
- One of the drawbacks associated with this method is the susceptibility of iron to oxidation and chlorination reactions during the discharge process, leading to the contamination of the solution with precipitates primarily composed of iron Fe3O4 oxides. However, it has been suggested that by repurposing the extremely fine iron oxide into a by-product, the economic benefit can be significantly boosted.
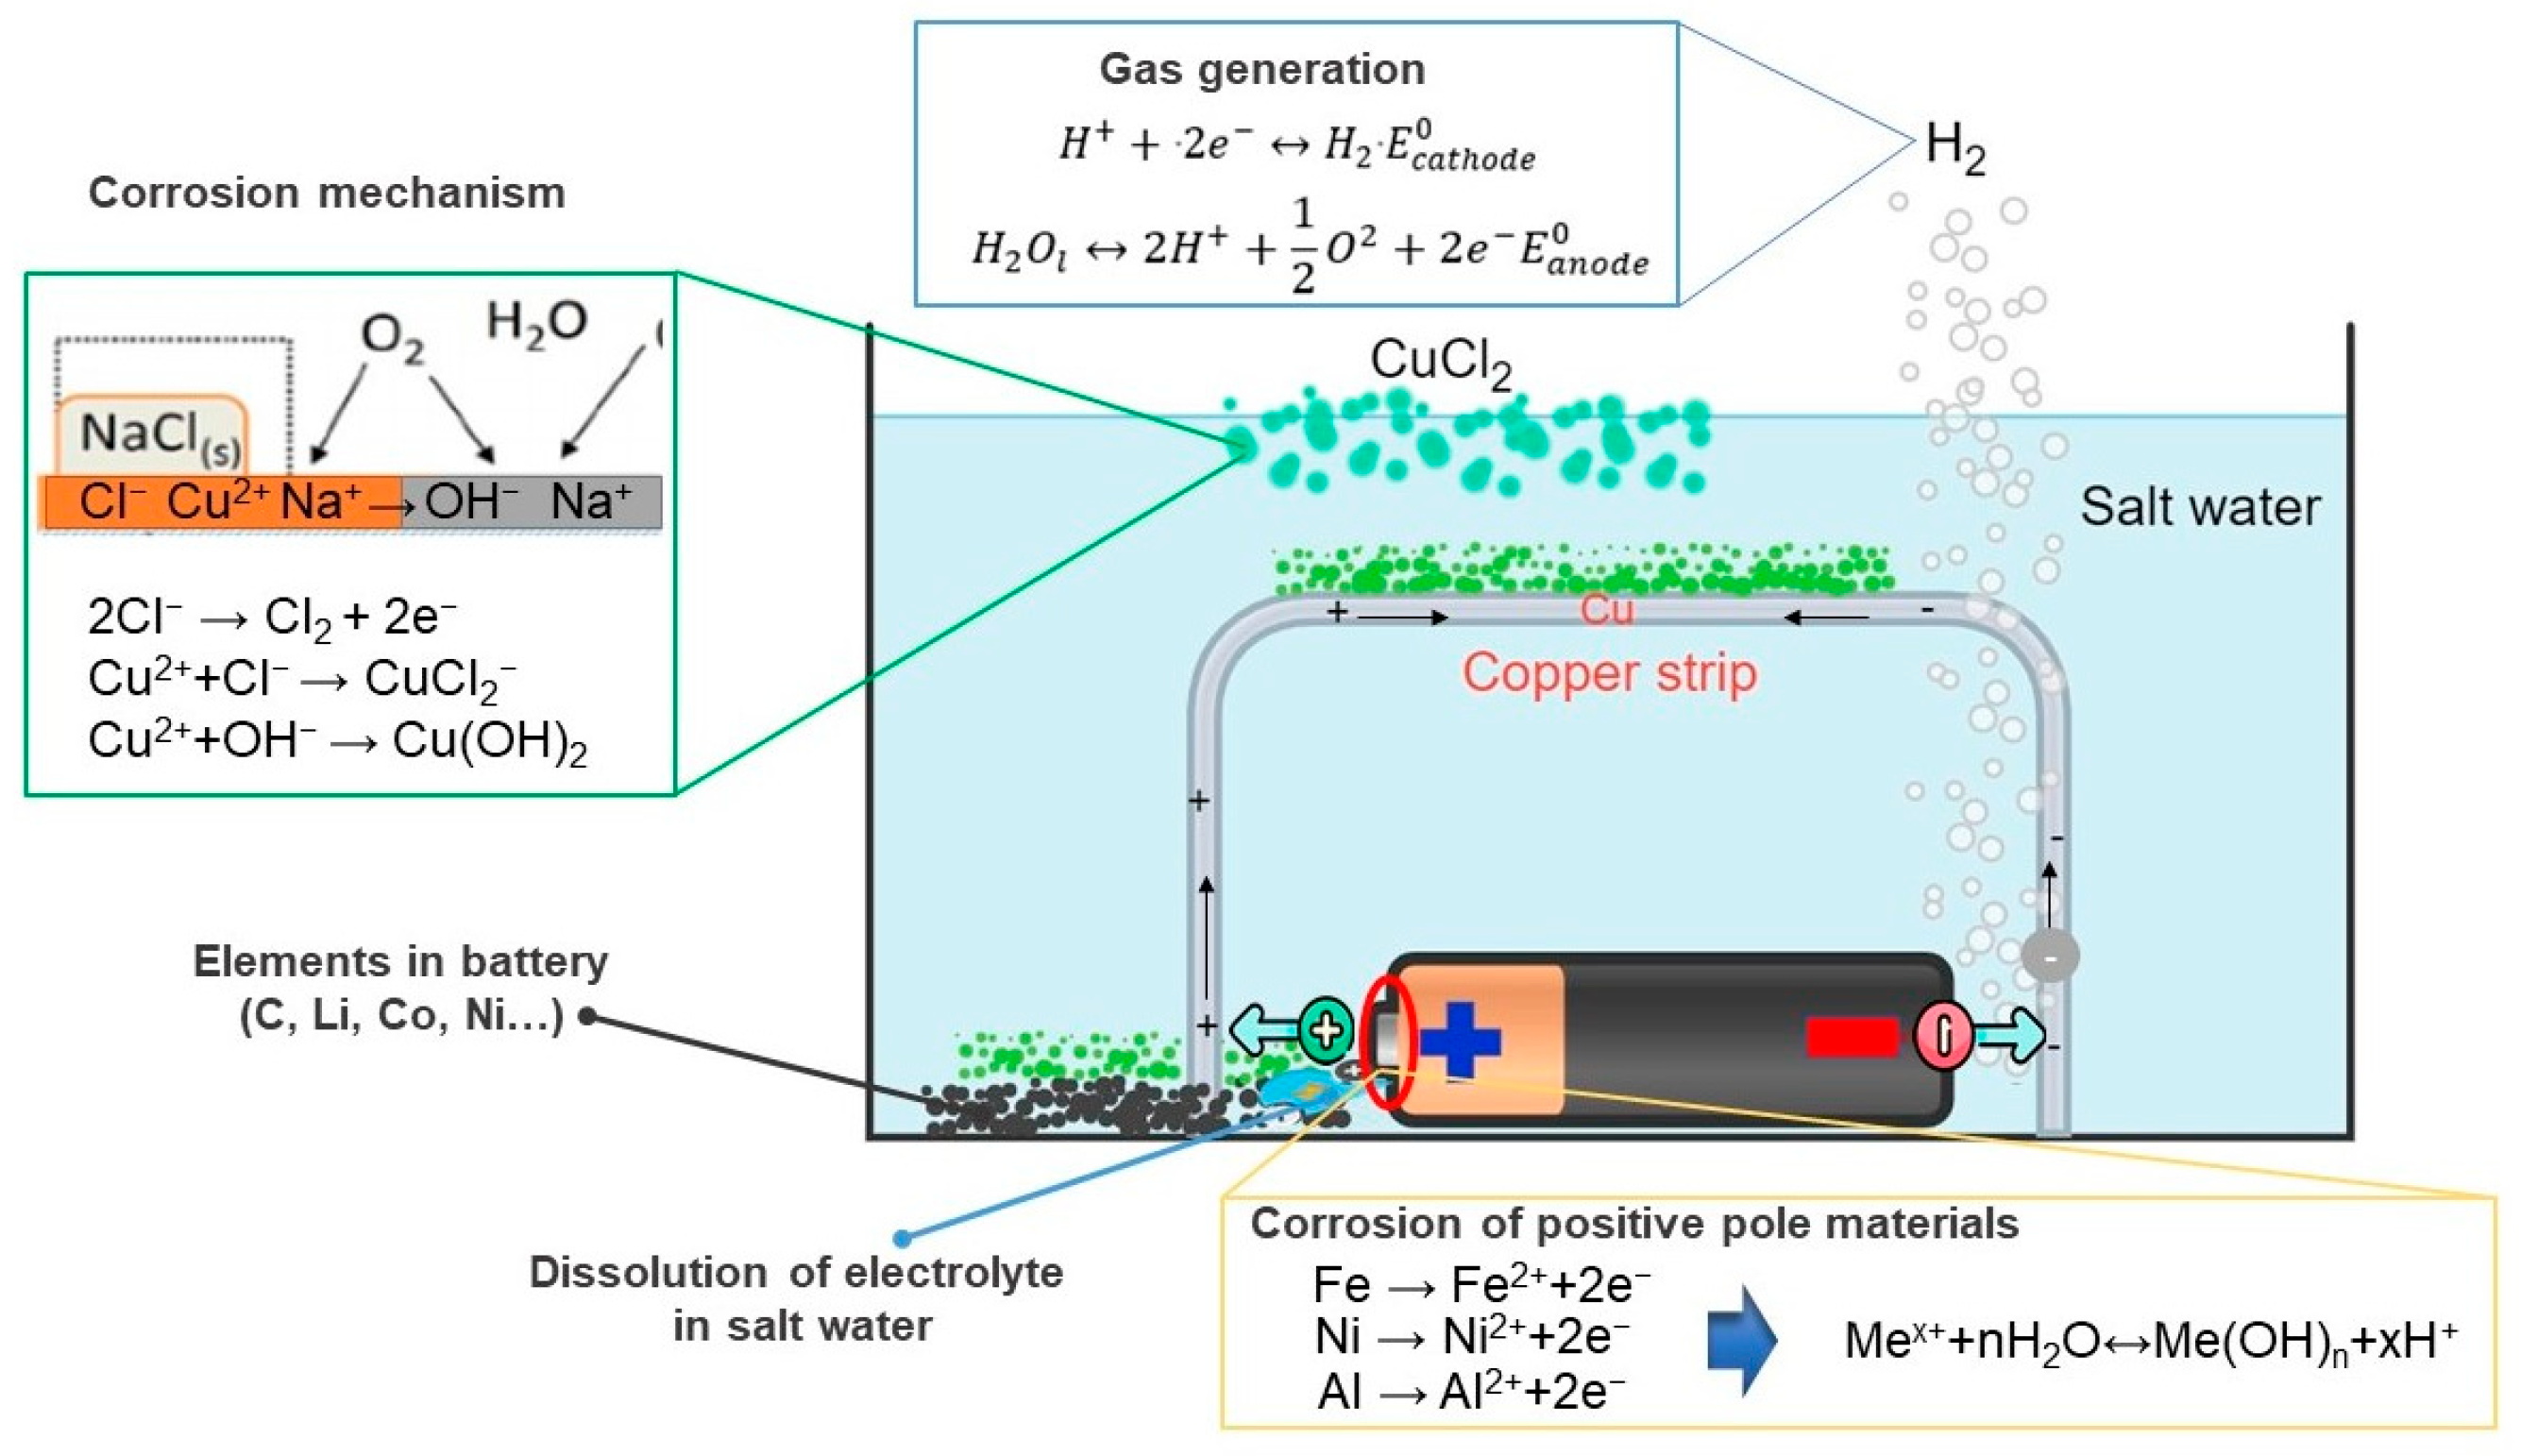
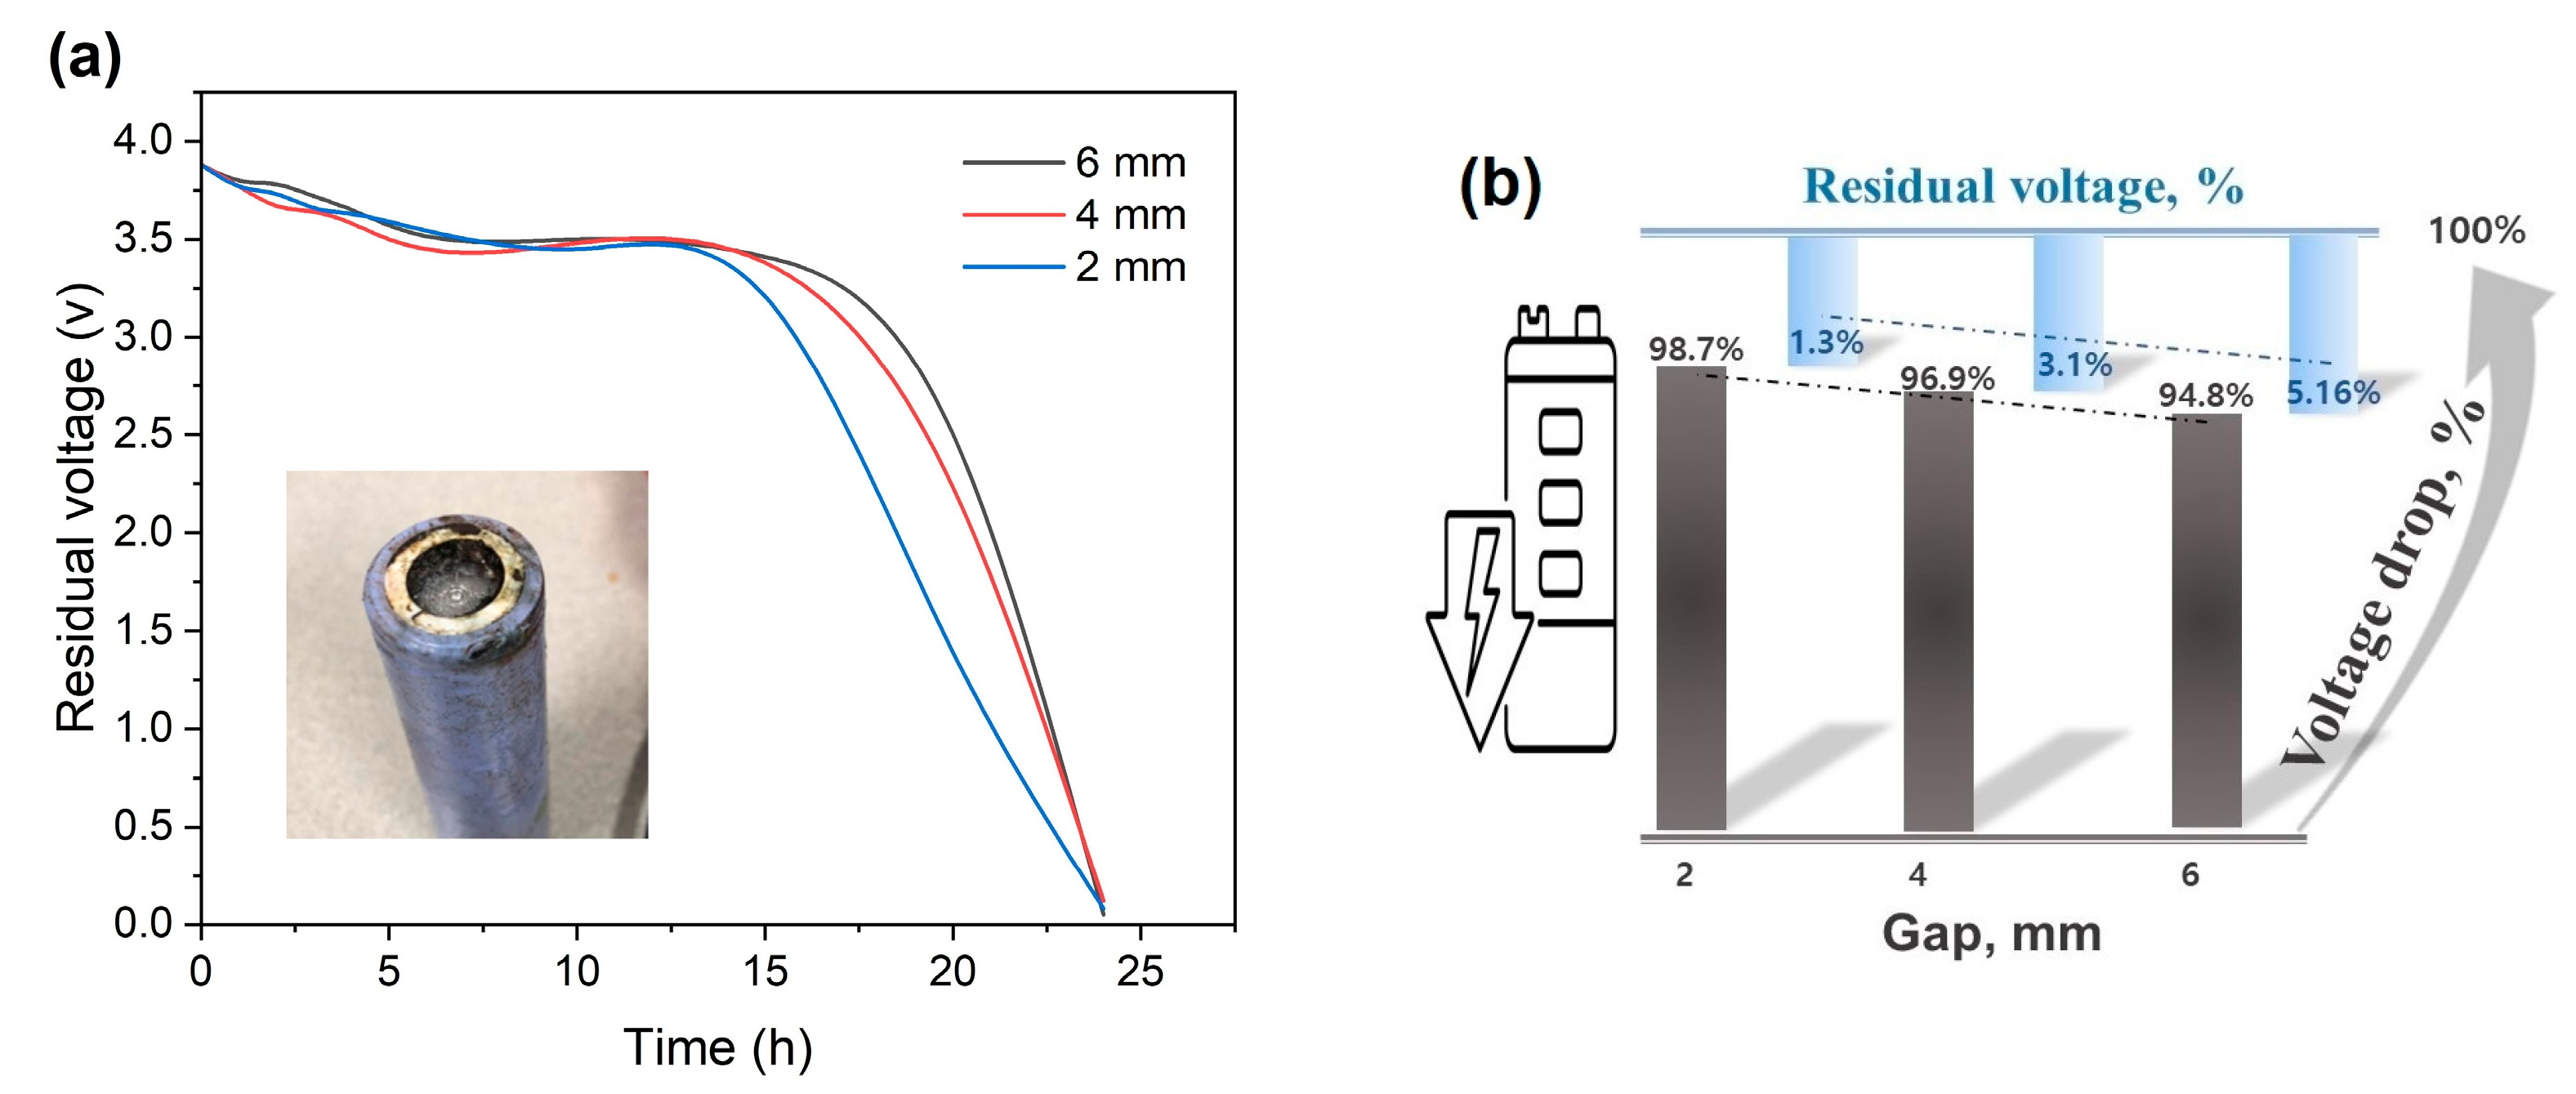
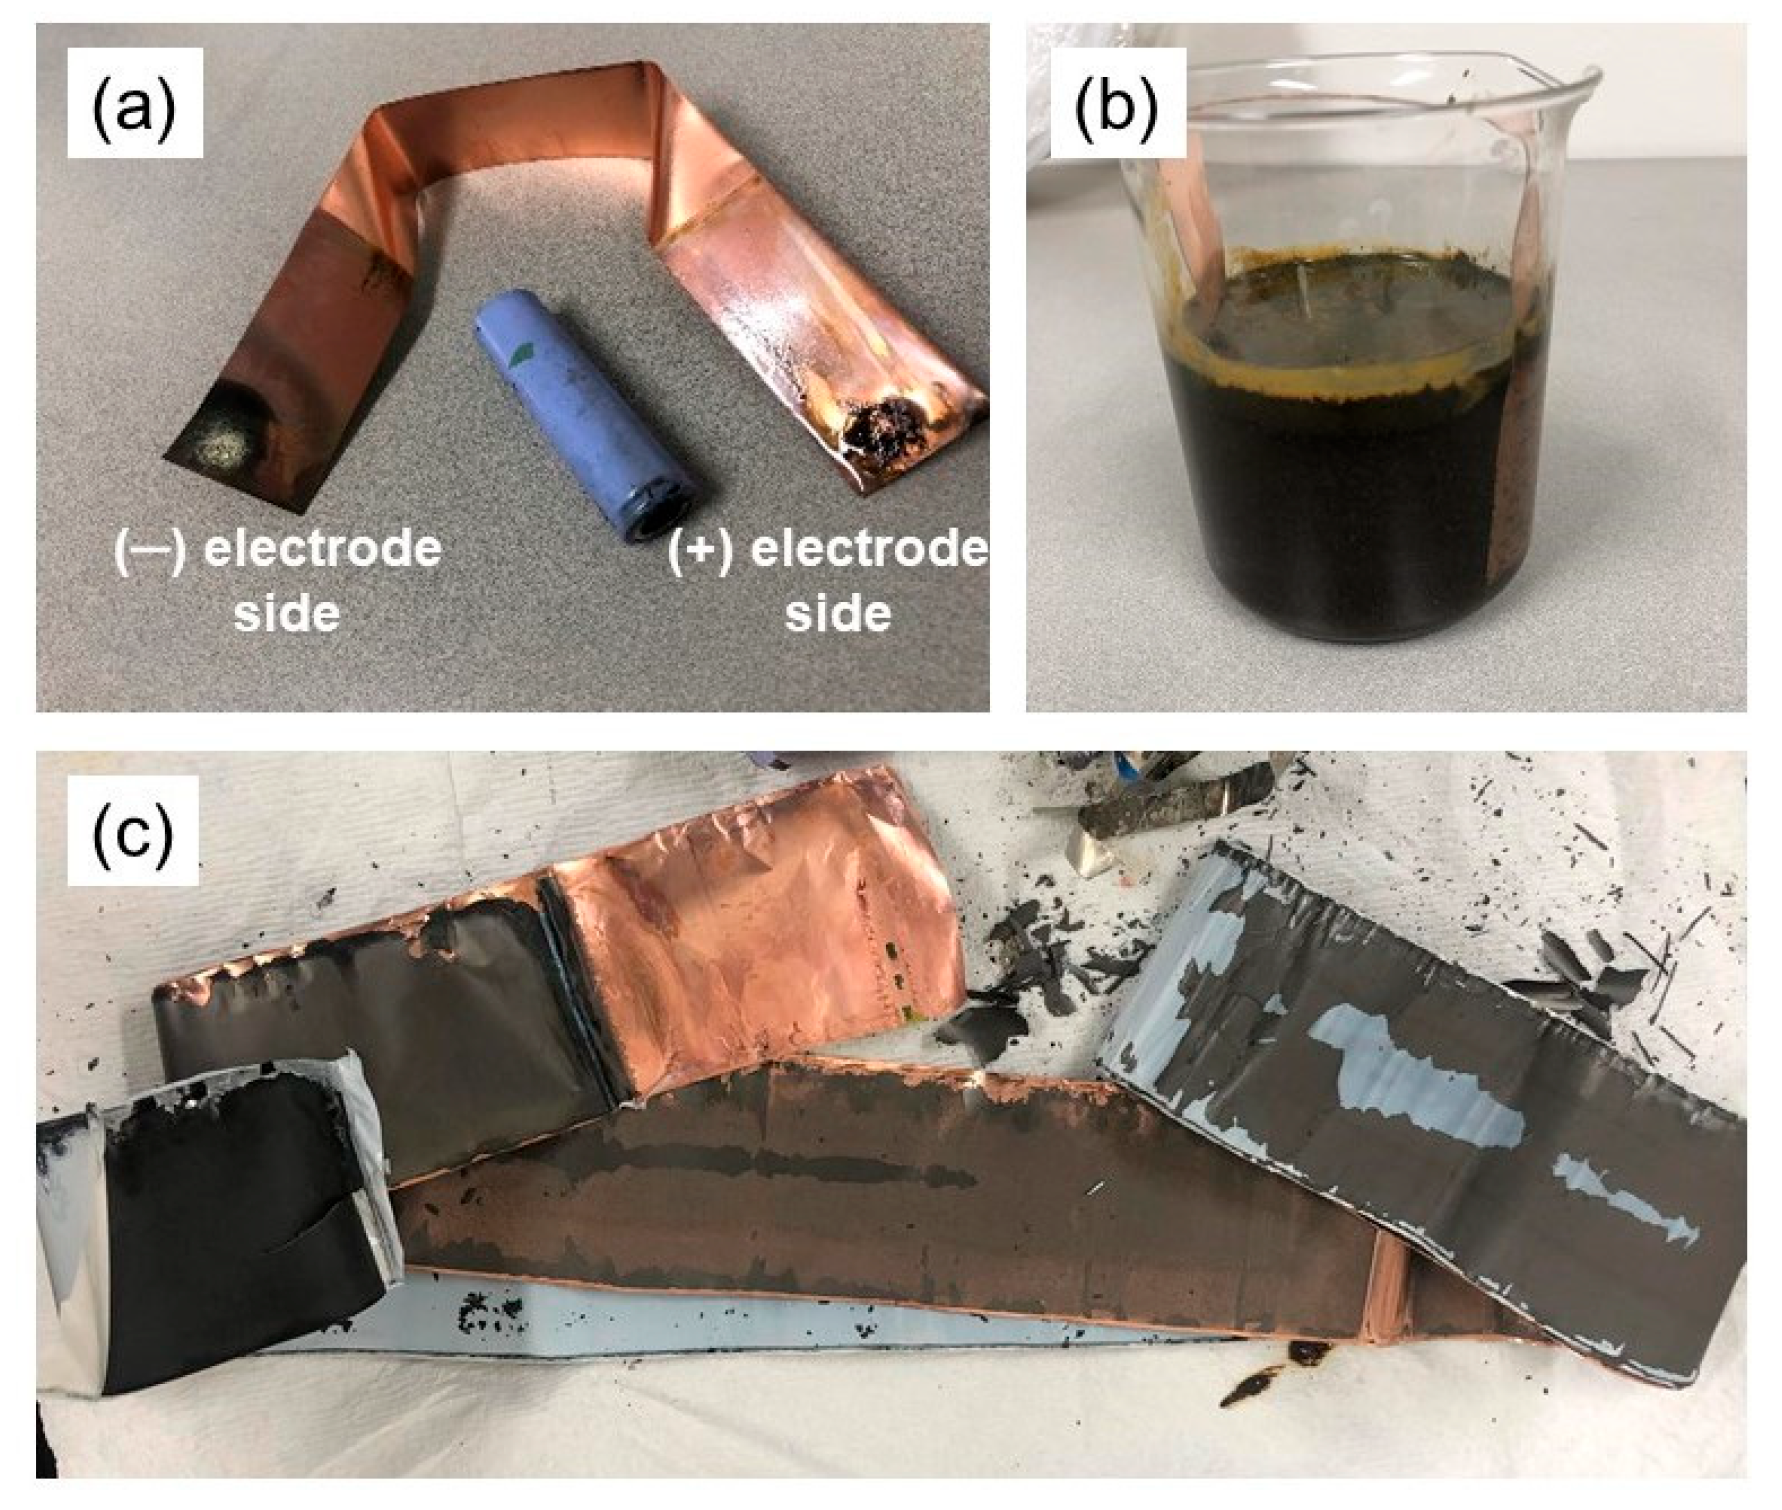
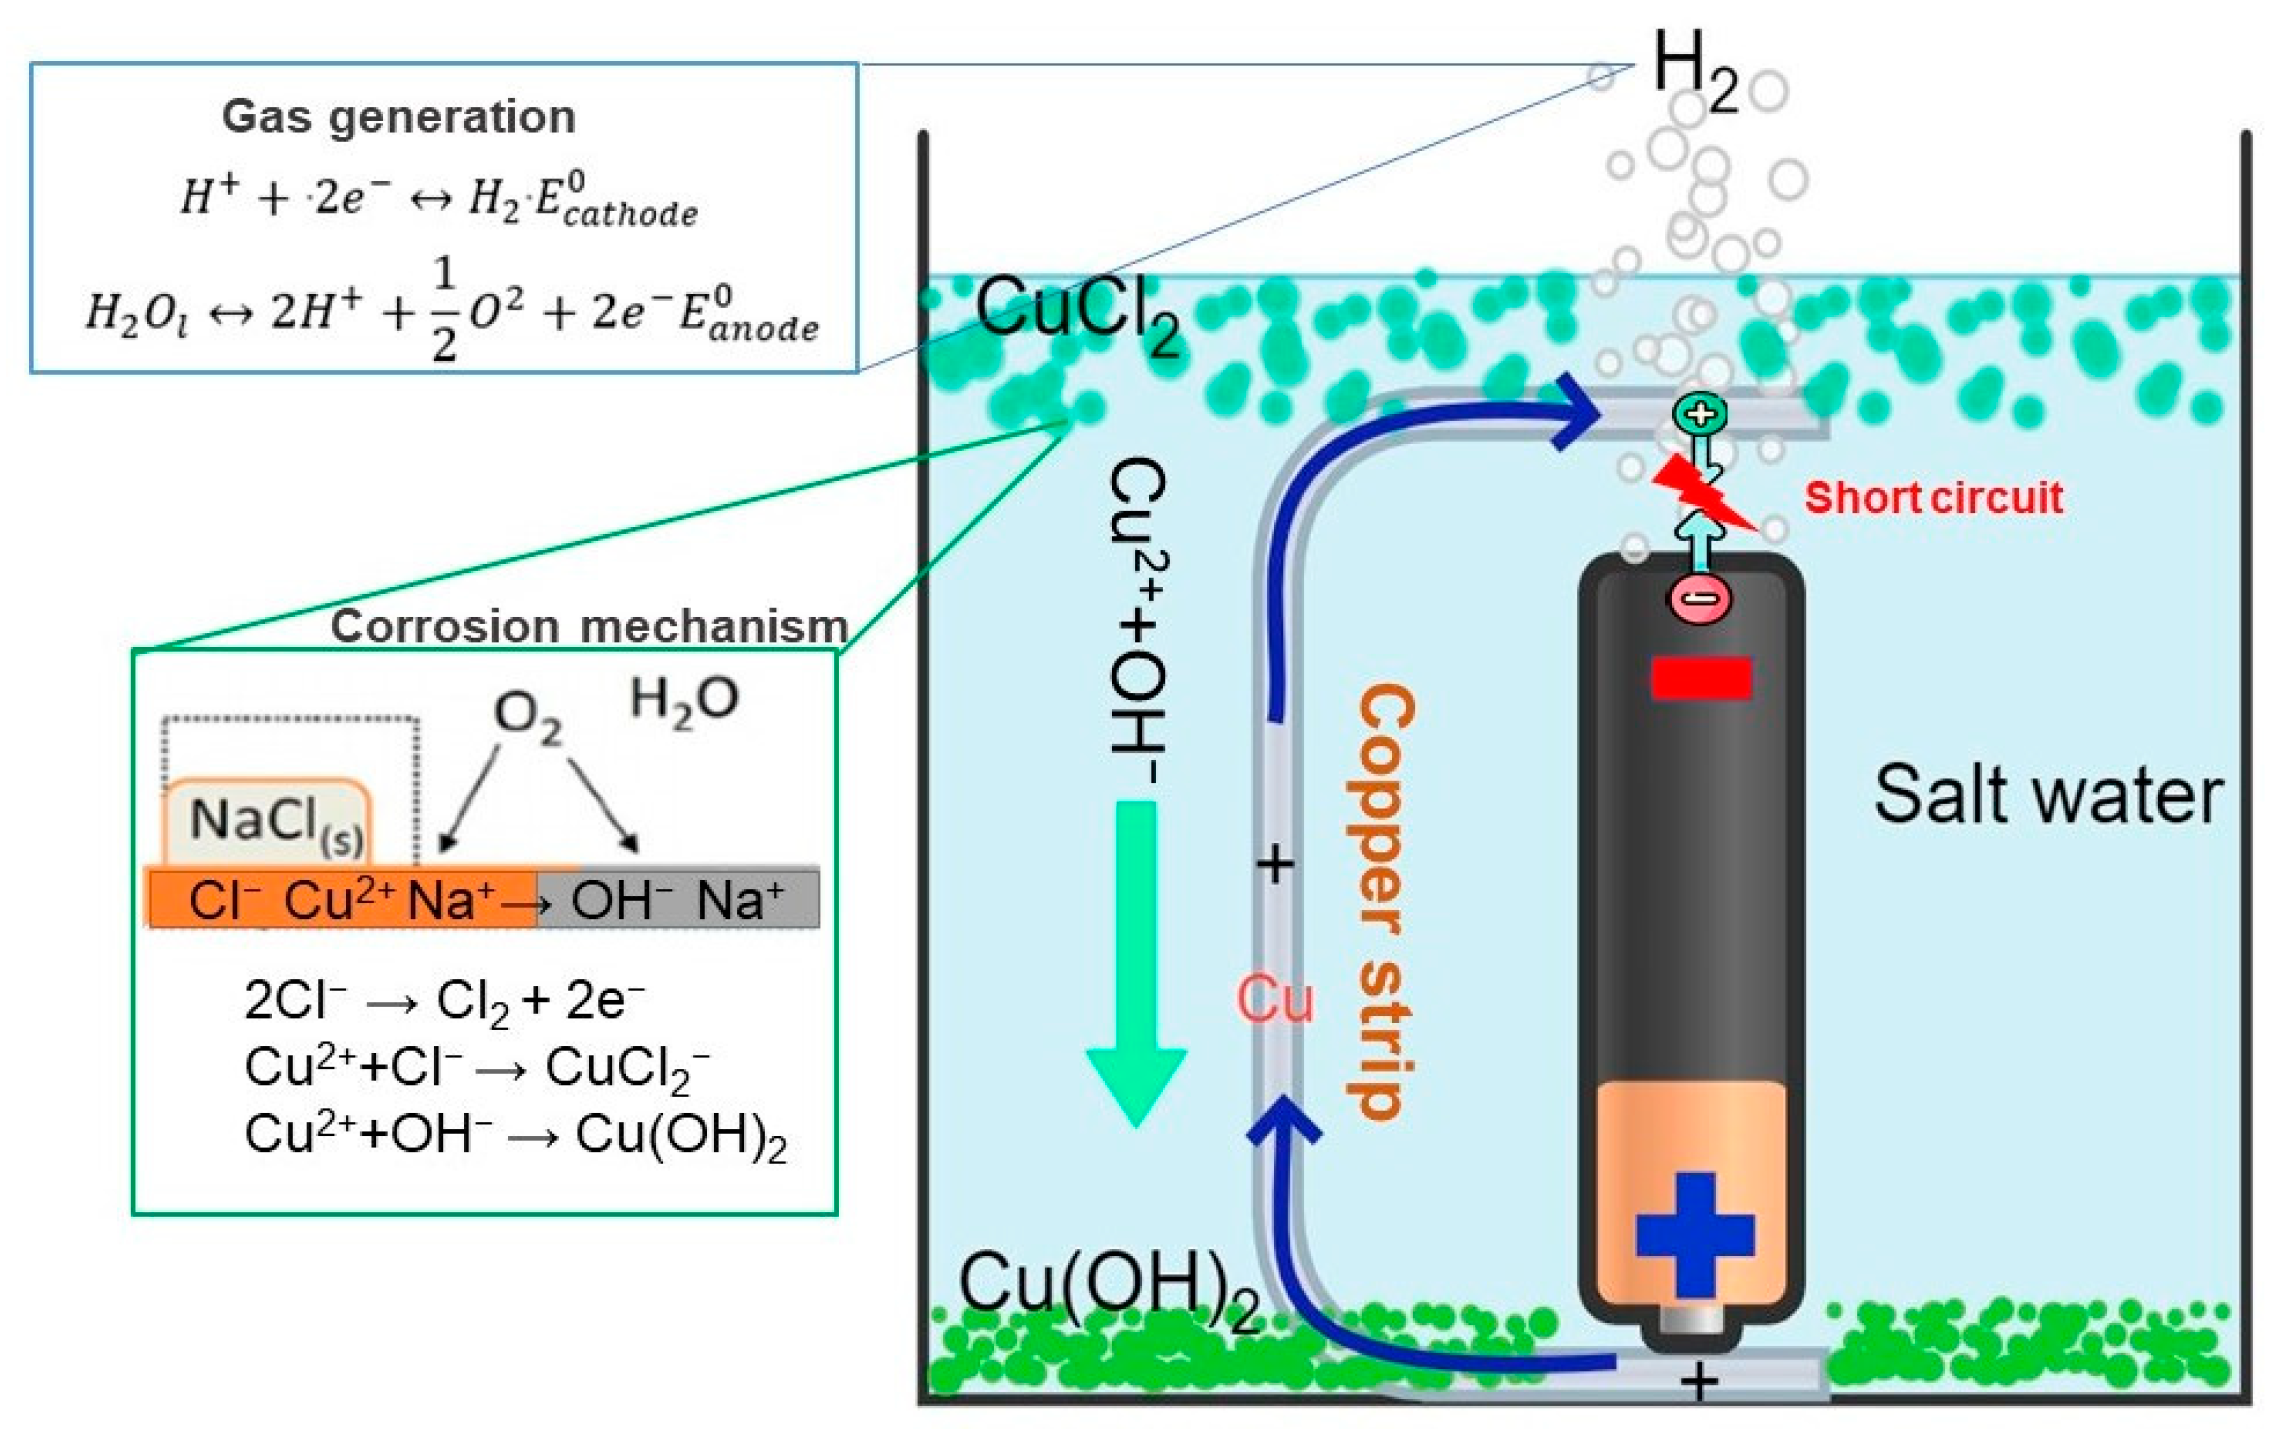
- By employing the second technique, the battery was discharged through a process that entailed both contacting and not contacting the copper conductor with the battery. In cases where there was no contact, it was observed that the battery’s steel cap and aluminum valve tend to corrode easily, leading to the dissolution of the anode and cathode elements into the solution, thereby causing pollution. Due to these reasons, this particular method was considered inconvenient. Conversely, in situations where only the positive pole of the battery was in contact with the copper conductor and the other end of the conductor was placed at gaps of 2, 4, our 6 mm from the negative pole, there was no evidence of corrosion present in any of the battery components. Contrary to expectations, it was found that the copper conductor on the negative pole of the battery had undergone corrosion. Within 8 h, this method caused the battery voltage to drop to approximately 90%. As the gap size decreased, it was verified that the discharge rate tended to increase.
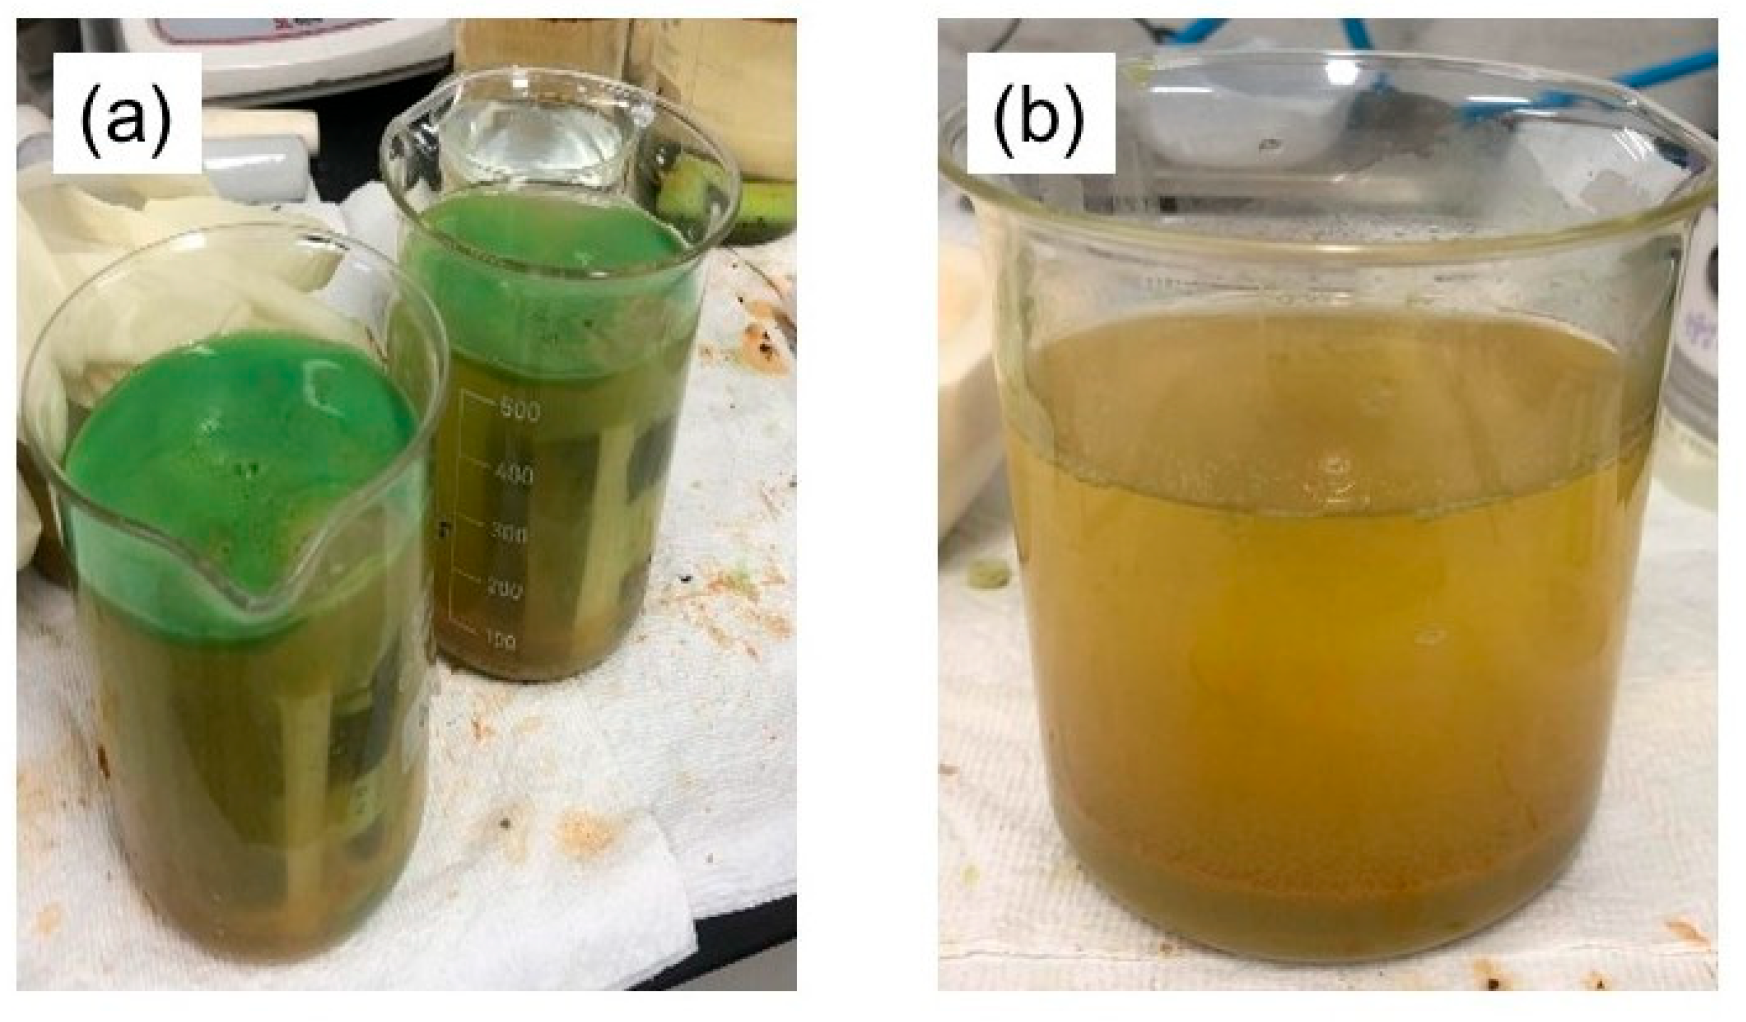
- Through the utilization of XRF and XRD analyses, it was confirmed that CuCl2·3Cu(OH)2 and Cu2O compounds were present, indicating that these compounds were generated and precipitated in the solution due to the corrosion of copper. This precipitate has the potential to transform and produce copper by-products with practical uses.
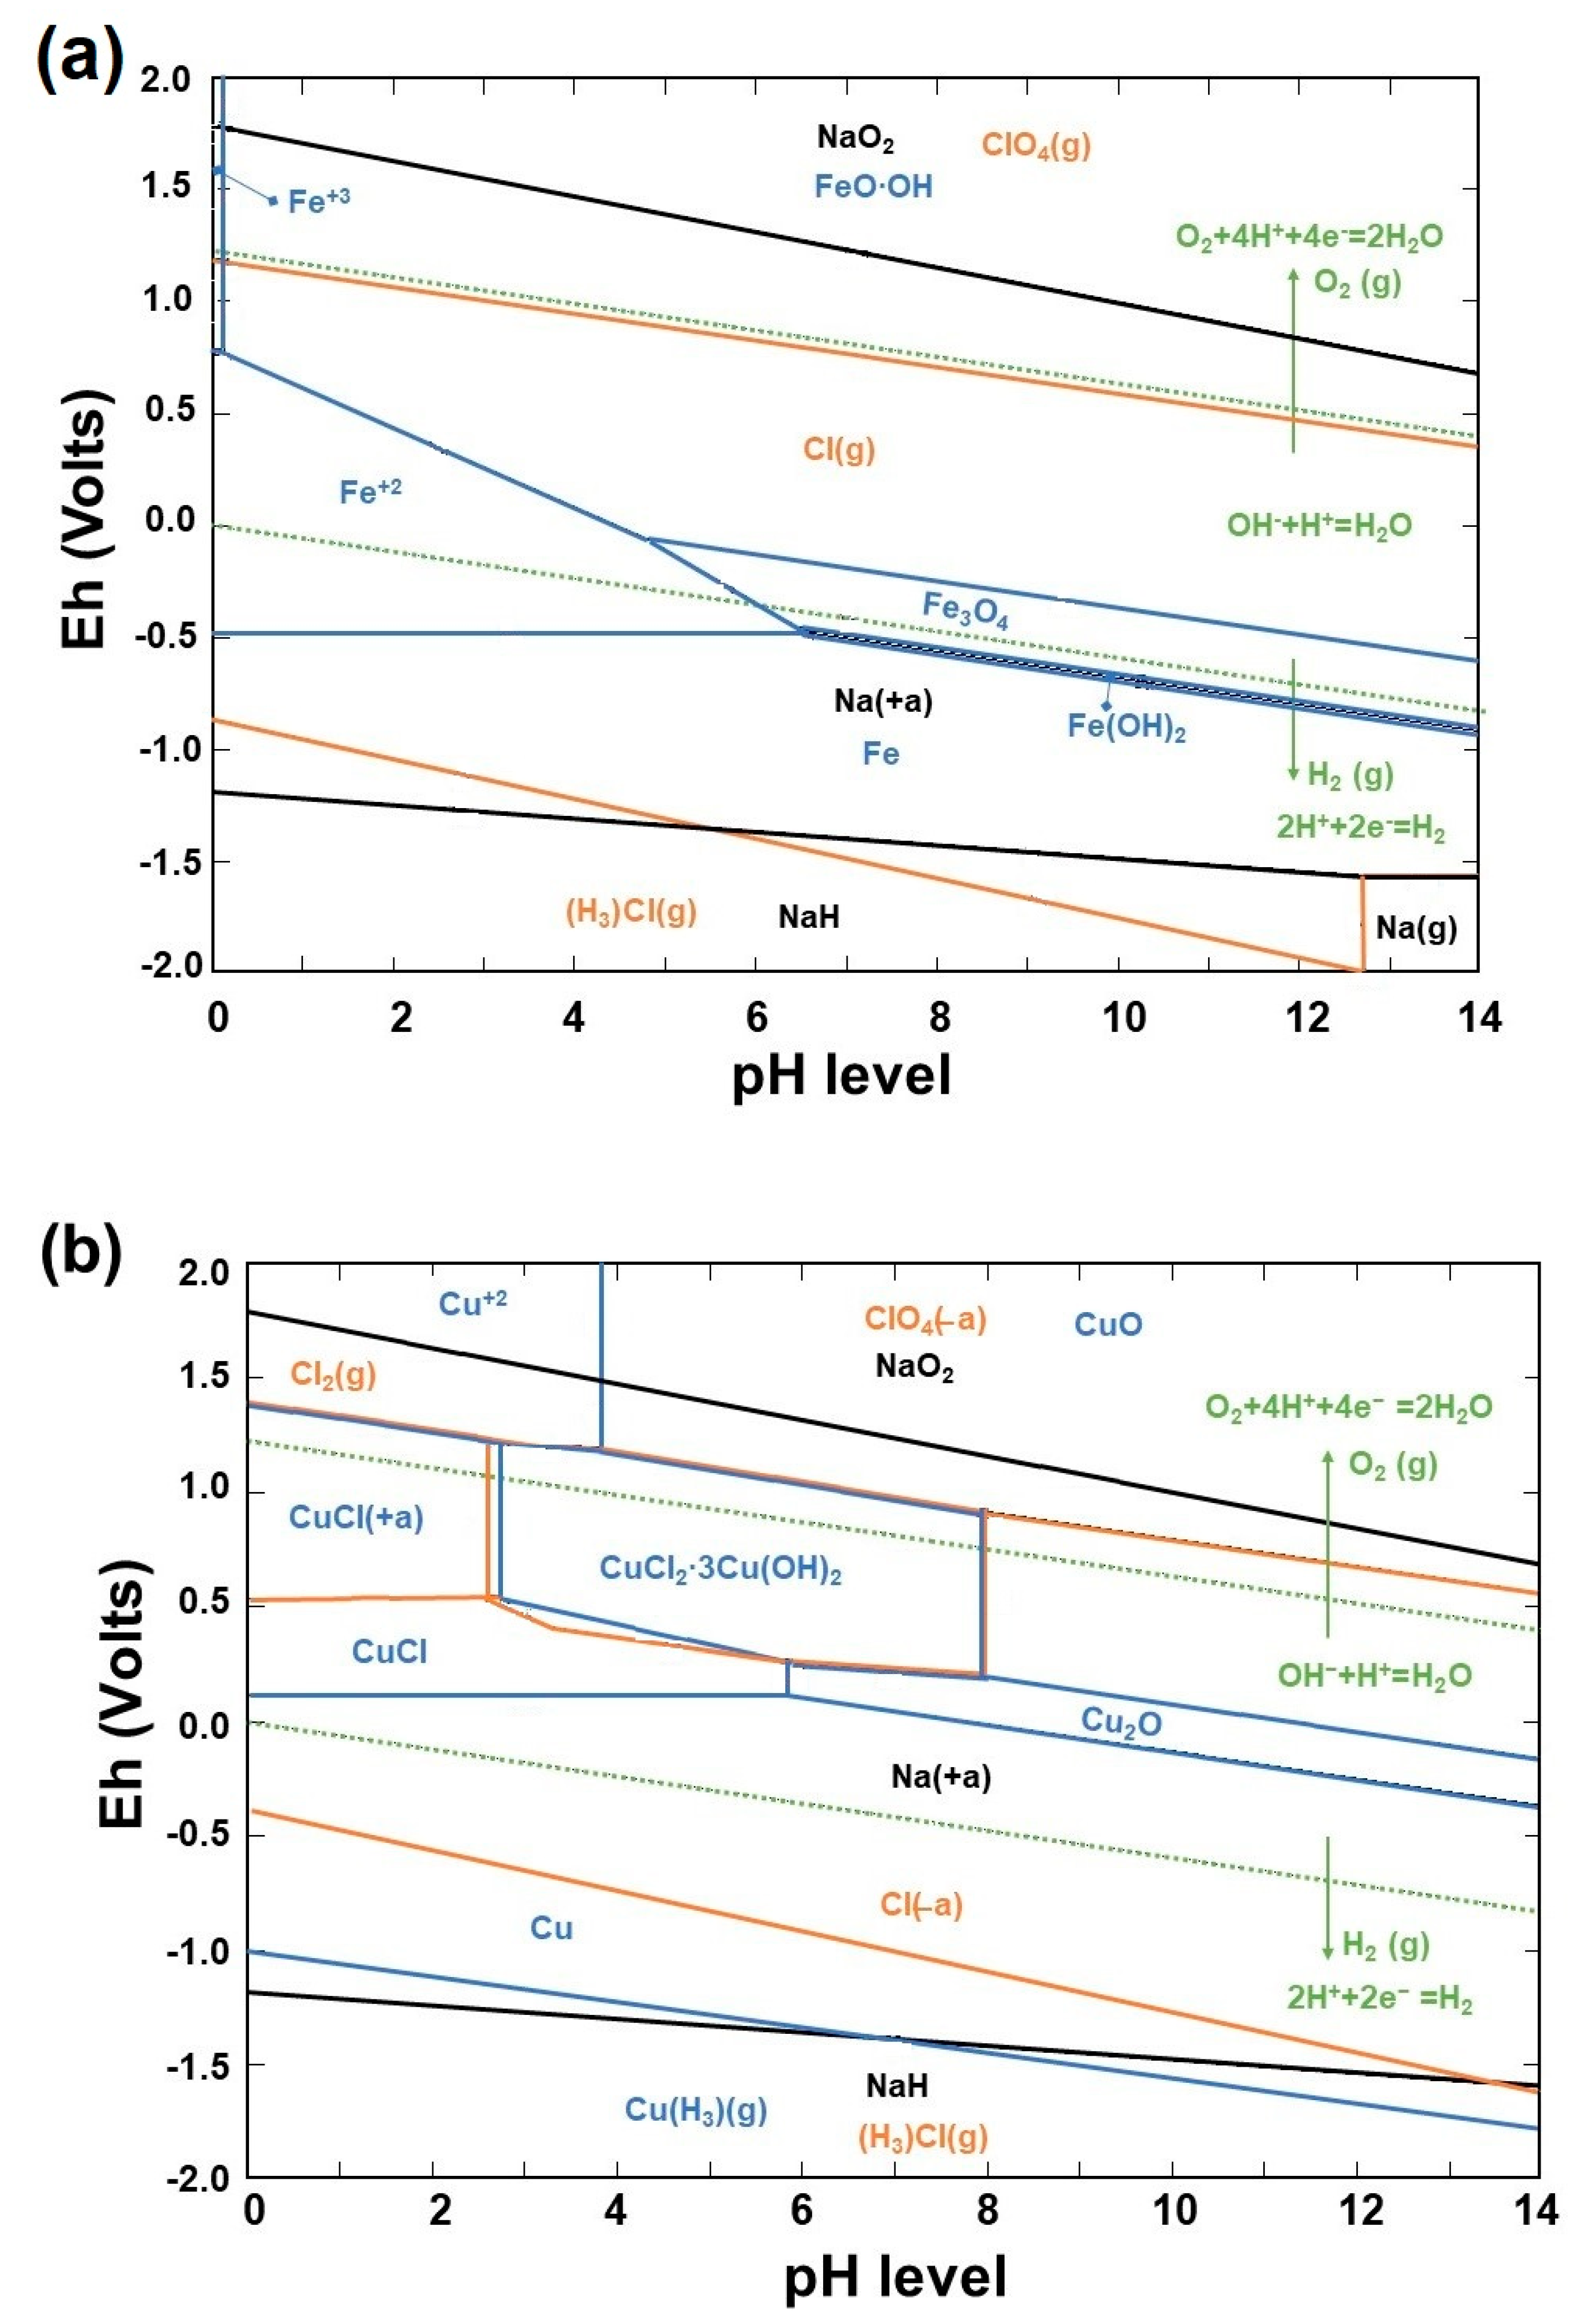
- This study focused on explaining the oxidation states of elements in the Fe-Na-Cl and Cu-Na-Cl systems, and specifically those that are locally predominant. This was achieved by utilizing the theoretical framework provided by the Eh–pH diagram and electrochemical reactions, which were based on the HSC-62 Chemistry database. The intention is for the reader to gain a better understanding of these new methods by presenting them in a wider context.
Author Contributions
Funding
Data Availability Statement
Conflicts of Interest
References
- Hadrien, B.; Marion, L.; Nicolas, L. The future of lithium-ion batteries: Exploring expert conceptions, market trends, and price scenarios. Energy Res. Soc. Sci. 2022, 93, 102850. [Google Scholar] [CrossRef]
- Fazel, M.; Mehrdad, S. A comprehensive overview of electric vehicle batteries market. Adv. Electr. Eng. 2023, 3, 100127. [Google Scholar] [CrossRef]
- Kostiantyn, T.; Dmitry, B.; Glenn, G.A.; Gleb, Y. Battery materials for low-cost electric transportation. Mater. Today. 2021, 42, 57–72. [Google Scholar] [CrossRef]
- Beth, E.M.; Kathryn, E.T.; Nuria, T.R. A Perspective on the Sustainability of Cathode Materials used in Lithium-Ion Batteries. Adv. Energy Mater. 2021, 11, 2102028. [Google Scholar] [CrossRef]
- Ralls, A.M.; Leong, K.; Clayton, J.; Fuelling, P.; Mercer, C.; Navarro, V.; Menezes, P.L. The Role of Lithium-Ion Batteries in the Growing Trend of Electric Vehicles. Materials 2023, 16, 6063. [Google Scholar] [CrossRef]
- Shabbir, A.; Paul, A.N.; Kevin, G.G.; Naresh, S.; Dennis, W.D. Cost and energy demand of producing nickel manganese cobalt cathode material for lithium ion batteries. J. Power Sources 2017, 342, 733–740. [Google Scholar] [CrossRef]
- Zhao, Y.; Pohl, O.; Bhatt, A.; Collis, G.; Mahon, P.; Rüther, T.; Hollenkamp, A. A Review on Battery Market Trends, Second-Life Reuse, and Recycling. Sustain. Chem. 2021, 2, 167–205. [Google Scholar] [CrossRef]
- Hayder, A.; Hassan, A.K.; Michael, G.P. Circular economy of Li Batteries: Technologies and trends. J. Energy Storage. 2021, 40, 102690. [Google Scholar] [CrossRef]
- Zachary, J.B.; Robert, E.B.; Xiang, Y.; Jia, M. Lithium-Ion Battery Recycling—Overview of Techniques and Trends. ACS Energy Lett. 2022, 7, 712–719. [Google Scholar] [CrossRef]
- Brian, M.; Qinghua, T.; Xueyi, G.; Kinnor, C.; Dawei, Y. Pyrometallurgical options for recycling spent lithium-ion batteries: A comprehensive review. J. Power Sources 2021, 491, 229622. [Google Scholar] [CrossRef]
- Gautam, M.; Rohit, J.; Arunabh, M.; Kamalesh, K.S. A review on recycling of lithium-ion batteries to recover critical metals. J. Environ. Chem. Eng. 2022, 10, 108534. [Google Scholar] [CrossRef]
- Zsolt, D.; Truong, D.; Tibor, K. A review on recycling of spent lithium-ion batteries. Energy Rep. 2023, 9, 6362–6395. [Google Scholar] [CrossRef]
- Stefan, W.K.; Eva, G.; Thomas, N.; Aleksander, J.; Michael, A.; Bettina, R.; Silvia, S.; Harald, R.; Roland, P.; Helmut, A.; et al. Recycling chains for lithium-ion batteries: A critical examination of current challenges, opportunities and process dependencies. Waste Manag. 2022, 138, 125–139. [Google Scholar] [CrossRef] [PubMed]
- Wei-Qing, P.; Song, G.; Zi-Wen, G.; Zi, W.; Jiao, G. Effect of explosion impact on the electrical performance and appearance of lithium-ion battery. J. Loss Prev. Process Ind. 2024, 89, 105309. [Google Scholar] [CrossRef]
- Zhang, X.C.; Zhang, T.; Liu, N.N.; Wu, X.N.; Han, H.L.; Wang, Q.L.; Zhang, Y.J. Dynamic crushing behaviors and failure of cylindrical lithium-ion batteries subjected to impact loading. Eng. Fail. Anal. 2023, 154, 107653. [Google Scholar] [CrossRef]
- Roberto, S.; James, S.S.; Vannessa, G.; Neil, R.; Emma, K. A review of physical processes used in the safe recycling of lithium ion batteries. Sustain. Mater. Technol. 2020, 25, 00197. [Google Scholar] [CrossRef]
- Mohammad, S.; Probir, K.R.; Tamanna, S.; Ashley, F.; Jahedul, I.C.; Rishad, A.; Kailong, L. A review on second-life of Li-ion batteries: Prospects, challenges, and issues. Energy. 2022, 241, 122881. [Google Scholar] [CrossRef]
- Kim, S.; Bang, J.; Yoo, J.; Shin, Y.; Bae, J.; Jeong, J.; Kim, K.; Dong, P.; Kwon, K. A comprehensive review on the pretreatment process in lithium-ion battery recycling. J. Clean. Prod. 2021, 294, 126329. [Google Scholar] [CrossRef]
- Hao, W.; Guorui, Q.; Yang, J.; Zhou, S.; Li, B.; Wei, Y. An effective and cleaner discharge method of spent lithium batteries. J. Energy Storage 2022, 54, 105383. [Google Scholar] [CrossRef]
- Shi, M.; Ren, Y.; Cao, J.; Kuang, Z.; Zhuo, X.; Xie, H. Current Situation and Development Prospects of Discharge Pretreatment during Recycling of Lithium-ion Batteries: A Review. Batter. Supercaps 2024, 7, e202300477. [Google Scholar] [CrossRef]
- Kim, S.; Yang, D.; Rhee, K.; Sohn, J. Recycling process of spent battery modules in used hybrid electric vehicles using physical/chemical treatments. Res. Chem. Intermed. 2014, 40, 2447–2456. [Google Scholar] [CrossRef]
- Harper, G.; Sommerville, R.; Kendrick, E.; Driscoll, L.; Slater, P.; Stolkin, R.; Walton, A.; Christensen, P.; Heidrich, O.; Lambert, S.; et al. Recycling lithium-ion batteries from electric vehicles. Nature 2019, 575, 75–86. [Google Scholar] [CrossRef] [PubMed]
- Al-Asheh, S.; Aidan, A.; Allawi, T.; Hammoud, F.; Al Ali, H.; Al Khamiri, M. Treatment and recycling of spent lithium-based batteries: A review. J. Mater. Cycles Waste Manag. 2024, 26, 76–95. [Google Scholar] [CrossRef]
- Neumann, J.; Petranikova, M.; Meeus, M.; Gamarra, J.D.; Younesi, R.; Winter, M.; Nowak, S. Recycling of Lithium-Ion Batteries—Current State of the Art, Circular Economy, and Next Generation Recycling. Adv. Energy Mater. 2022, 12, 2102917. [Google Scholar] [CrossRef]
- Vinayak, A.K.; Xu, Z.; Li, G.; Wang, X. Current Trends in Sourcing, Recycling, and Regeneration of Spent Lithium-Ion Batteries—A Review. J. Renew. 2023, 3, 294–315. [Google Scholar] [CrossRef]
- Zhang, Y.S.; Schneider, K.; Qiu, H.; Zhu, H.L. A perspective of low carbon lithium-ion battery recycling technology. Carbon Capture Sci. Technol. 2022, 5, 100074. [Google Scholar] [CrossRef]
- Khodadadmahmoudi, G.; Javdan Tabar, K.; Homayouni, A.H.; Chehreh Chelgani, S. Recycling spent lithium batteries—An overview of pretreatment flowsheet development based on metallurgical factors. Environ. Technol. Rev. 2023, 12, 2248559. [Google Scholar] [CrossRef]
- Pražanová, A.; Pilnaj, D.; Plachý, Z.; Knap, V. Techno-Environmental Evaluation of Recycling Pretreatment of Cylindrical Lithium-Ion Battery: Discharging via Salt-Based Solution. In Proceedings of the 2023 46th International Spring Seminar on Electronics Technology (ISSE), Timisoara, Romania, 10–14 May 2023. [Google Scholar] [CrossRef]
- Xiao, J.; Guo, J.; Zhan, L.; Xu, Z. A cleaner approach to the discharge process of spent lithium ion batteries in different solutions. J. Clean. Prod. 2020, 55, 120064. [Google Scholar] [CrossRef]
- Lin, P.Y.; Qi, Z.; Ting, Q.; Jia, L. An environmentally friendly discharge technology to pretreat spent lithium-ion batteries. J. Clean. Produc. 2020, 245, 118820. [Google Scholar] [CrossRef]
- James, S.S.; Anna, A.R.; Agata, G.; James, M.; Maryam, M.; Rob, S.; Emma, K. Aqueous solution discharge of cylindrical lithium-ion cells. Sustain. Mater. Technol. 2019, 22, e00110. [Google Scholar] [CrossRef]
- Fang, Z.; Duan, Q.; Peng, Q.; Wei, Z.; Cao, H.; Sun, J.; Wang, Q. Comparative study of chemical discharge strategy to pretreat spent lithium-ion batteries for safe, efficient, and environmentally friendly recycling. J. Clean. Produc. 2022, 359, 132116. [Google Scholar] [CrossRef]
- Hassan, R.; Eero, K.; Rodrigo, S.G.; Annukka, S.A. Voltage behavior in lithium-ion batteries after electrochemical discharge and its implications on the safety of recycling processes. J. Energy Storage 2021, 35, 102323. [Google Scholar] [CrossRef]
- Mohammad, M.T.; Milad, J.; Alireza, B. Discharge of lithium-ion batteries in salt solutions for safer storage, transport, and resource recovery. Waste Manag. Res. 2021, 40, 402–409. [Google Scholar] [CrossRef] [PubMed]
- Severi, O.; Mari, L.; Annukka, S.A.; Rodrigo, S.G. Challenging the concept of electrochemical discharge using salt solutions for lithium-ion batteries recycling. Waste Manag. 2018, 76, 242–249. [Google Scholar] [CrossRef] [PubMed]
- Nicole, S.N. Safe, Sustainable Discharge of Electric Vehicle Batteries as a Pretreatment Step to Crushing in the Recycling Process. Master’s Thesis, KTH School of Industrial Engineering and Management, Division of Heat and Power Technology, Stockholm, Sweden, 2019. Available online: http://diva-portal.org/smash/get/diva2:1339943/FULLTEXT01.pdf (accessed on 22 December 2020).
- Mahjabin, N.; Ali, M.; Babak, G.A.; Shahram, D. CFD simulation of an industrial copper electrowinning cell. Hydrometallurgy. 2015, 153, 88–97. [Google Scholar] [CrossRef]
- Gamburg, Y.D.; Zangari, G. Theory and Practice of Metal Electrodeposition; Springer Science: New York, NY, USA, 2011; pp. 15–18. [Google Scholar]
- Tennakone, K. Hydrogen from brine electrolysis: A new approach. Int. J. Hydrog. Energy 1989, 14, 681–682. [Google Scholar] [CrossRef]
- Harry, R.; Niki, H.; Krystin, R. The quantification and application of handheld energy-dispersive x-ray fluorescence (ED-XRF) in mudrock chemostratigraphy and geochemistry. Chem. Geol. 2012, 324, 122–131. [Google Scholar] [CrossRef]
- Gaines, J.M.; Kohlhepp, J.T.; Eemeren, J.W.; Elfrink, R.J.G.; Roozeboom, F.; de Jonge, W.J.M. The (001) Surface of Fe3O4 Grown Epitaxially on MgO and Characterized by Scanning Tunneling Microscopy. MRS Proc. 1997, 474, 191. [Google Scholar] [CrossRef]
- Alibeigi, S.; Vaezi, M.R. Phase Transformation of Iron Oxide Nanoparticles by Varying the Molar Ratio of Fe2+:Fe3+. Chem. Eng. Technol. 2008, 31, 1591–1596. [Google Scholar] [CrossRef]
- Mai, H.H.; David, N.M.; Martina, M. Thermal phase design of ultrathin magnetic iron oxide films: From Fe3O4 to γ-Fe2O3 and FeO. J. Mater. Chem. C 2020, 8, 1335–1343. [Google Scholar] [CrossRef]
- Amalia, D.; Singh, P.; Zhang, W.; Nikoloski, A.N. Discharging of Spent Cylindrical Lithium-Ion Batteries in Sodium Hydroxide and Sodium Chloride for a Safe Recycling Process. JOM 2023, 75, 4946–4957. [Google Scholar] [CrossRef]


| Concentration | Salt in Water, g per 500 mL | pH |
|---|---|---|
| 20 wt.% | 10 | 10.49 |
| Sample | Element, wt.% | ||||||||||
|---|---|---|---|---|---|---|---|---|---|---|---|
| Fe2O3 | Cl | Al2O3 | MnO | Co2O3 | Cr2O3 | CuO | Na2O | NiO | SO3 | P2O5 | |
| Fe-01 | 95.99 | 2.43 | 0.79 | 0.45 | 0.21 | 0.12 | - | - | - | - | - |
| Cu-01 | 31.43 | 23.06 | 20.88 | - | - | - | 1.69 | 22.13 | 0.53 | 0.10 | 0.16 |
| Cu-02 | 2.82 | 11.48 | - | - | - | - | 82.26 | 2.83 | - | - | - |
| Electrolyte Solution | Accelerator | Discharge Efficiency | Discharge Timing | Ref. |
|---|---|---|---|---|
| 20% NaCl | Fe powder and flakes, Cu strip | ~100% ~94% | within 4 h, over 8 h | Erdenebold et al. |
| NaCl, Na2CO3, Na2SO4, and MnSO4 | Copper powder, graphite flakes | Completely | over 48 h | Hao et al. [19] |
| 5% K2CO3, 5% Na2CO3 at 50 °C | Steel staples | ~0.5 V | 4–5 h | Nicole [36] |
| 5–10% NaCl, NaOH | Pt wire electrodes | ~0.25 mAH | within 20 h | Amalia et al. [44] |
| 1–2 mol/L MnSO4 | no | 71.12% | 5 h | Jiefeng et al. [29] |
| 0.4–1.2 mol/L NaCl, MnSO4, ZnSO4, and FeSO4 | no | ~0.5 V | 180 min | Lin et al. [30] Zheng et al. [32] |
| >5% NaCl, NaOH, NaNO2, K2CO3, NH3, and NaHSO4, Na2CO3, KBr, (NH4)2CO3, and NH4HCO3 | no | >75% | 10 h 2 h | James et al. [31] Hassan et al. [33] |
| 5–20% NaCl, MnSO4, ZnSO4, and FeSO4 | Fe flakes, Zn powder Pt wire electrodes | Completely | 4.4 h | Severi et al. [35] |
| 12–20% NaCl, Na2S, and MgSO4, 25–60 °C | Cu wire electrodes | Completely | 2–10 h | Mohammad et al. [34] |
Disclaimer/Publisher’s Note: The statements, opinions and data contained in all publications are solely those of the individual author(s) and contributor(s) and not of MDPI and/or the editor(s). MDPI and/or the editor(s) disclaim responsibility for any injury to people or property resulting from any ideas, methods, instructions or products referred to in the content. |
© 2024 by the authors. Licensee MDPI, Basel, Switzerland. This article is an open access article distributed under the terms and conditions of the Creative Commons Attribution (CC BY) license (https://creativecommons.org/licenses/by/4.0/).
Share and Cite
Urtnasan, E.; Wang, J.-P. A Metal Accelerator Approach for Discharging Cylindrical Lithium-Ion Batteries in a Salt Solution. Metals 2024, 14, 657. https://doi.org/10.3390/met14060657
Urtnasan E, Wang J-P. A Metal Accelerator Approach for Discharging Cylindrical Lithium-Ion Batteries in a Salt Solution. Metals. 2024; 14(6):657. https://doi.org/10.3390/met14060657
Chicago/Turabian StyleUrtnasan, Erdenebold, and Jei-Pil Wang. 2024. "A Metal Accelerator Approach for Discharging Cylindrical Lithium-Ion Batteries in a Salt Solution" Metals 14, no. 6: 657. https://doi.org/10.3390/met14060657
APA StyleUrtnasan, E., & Wang, J.-P. (2024). A Metal Accelerator Approach for Discharging Cylindrical Lithium-Ion Batteries in a Salt Solution. Metals, 14(6), 657. https://doi.org/10.3390/met14060657