Effect of Al Content on the Microstructure and Properties of Zn-Al Solder Alloys

Abstract
:1. Introduction
2. Experimental Details
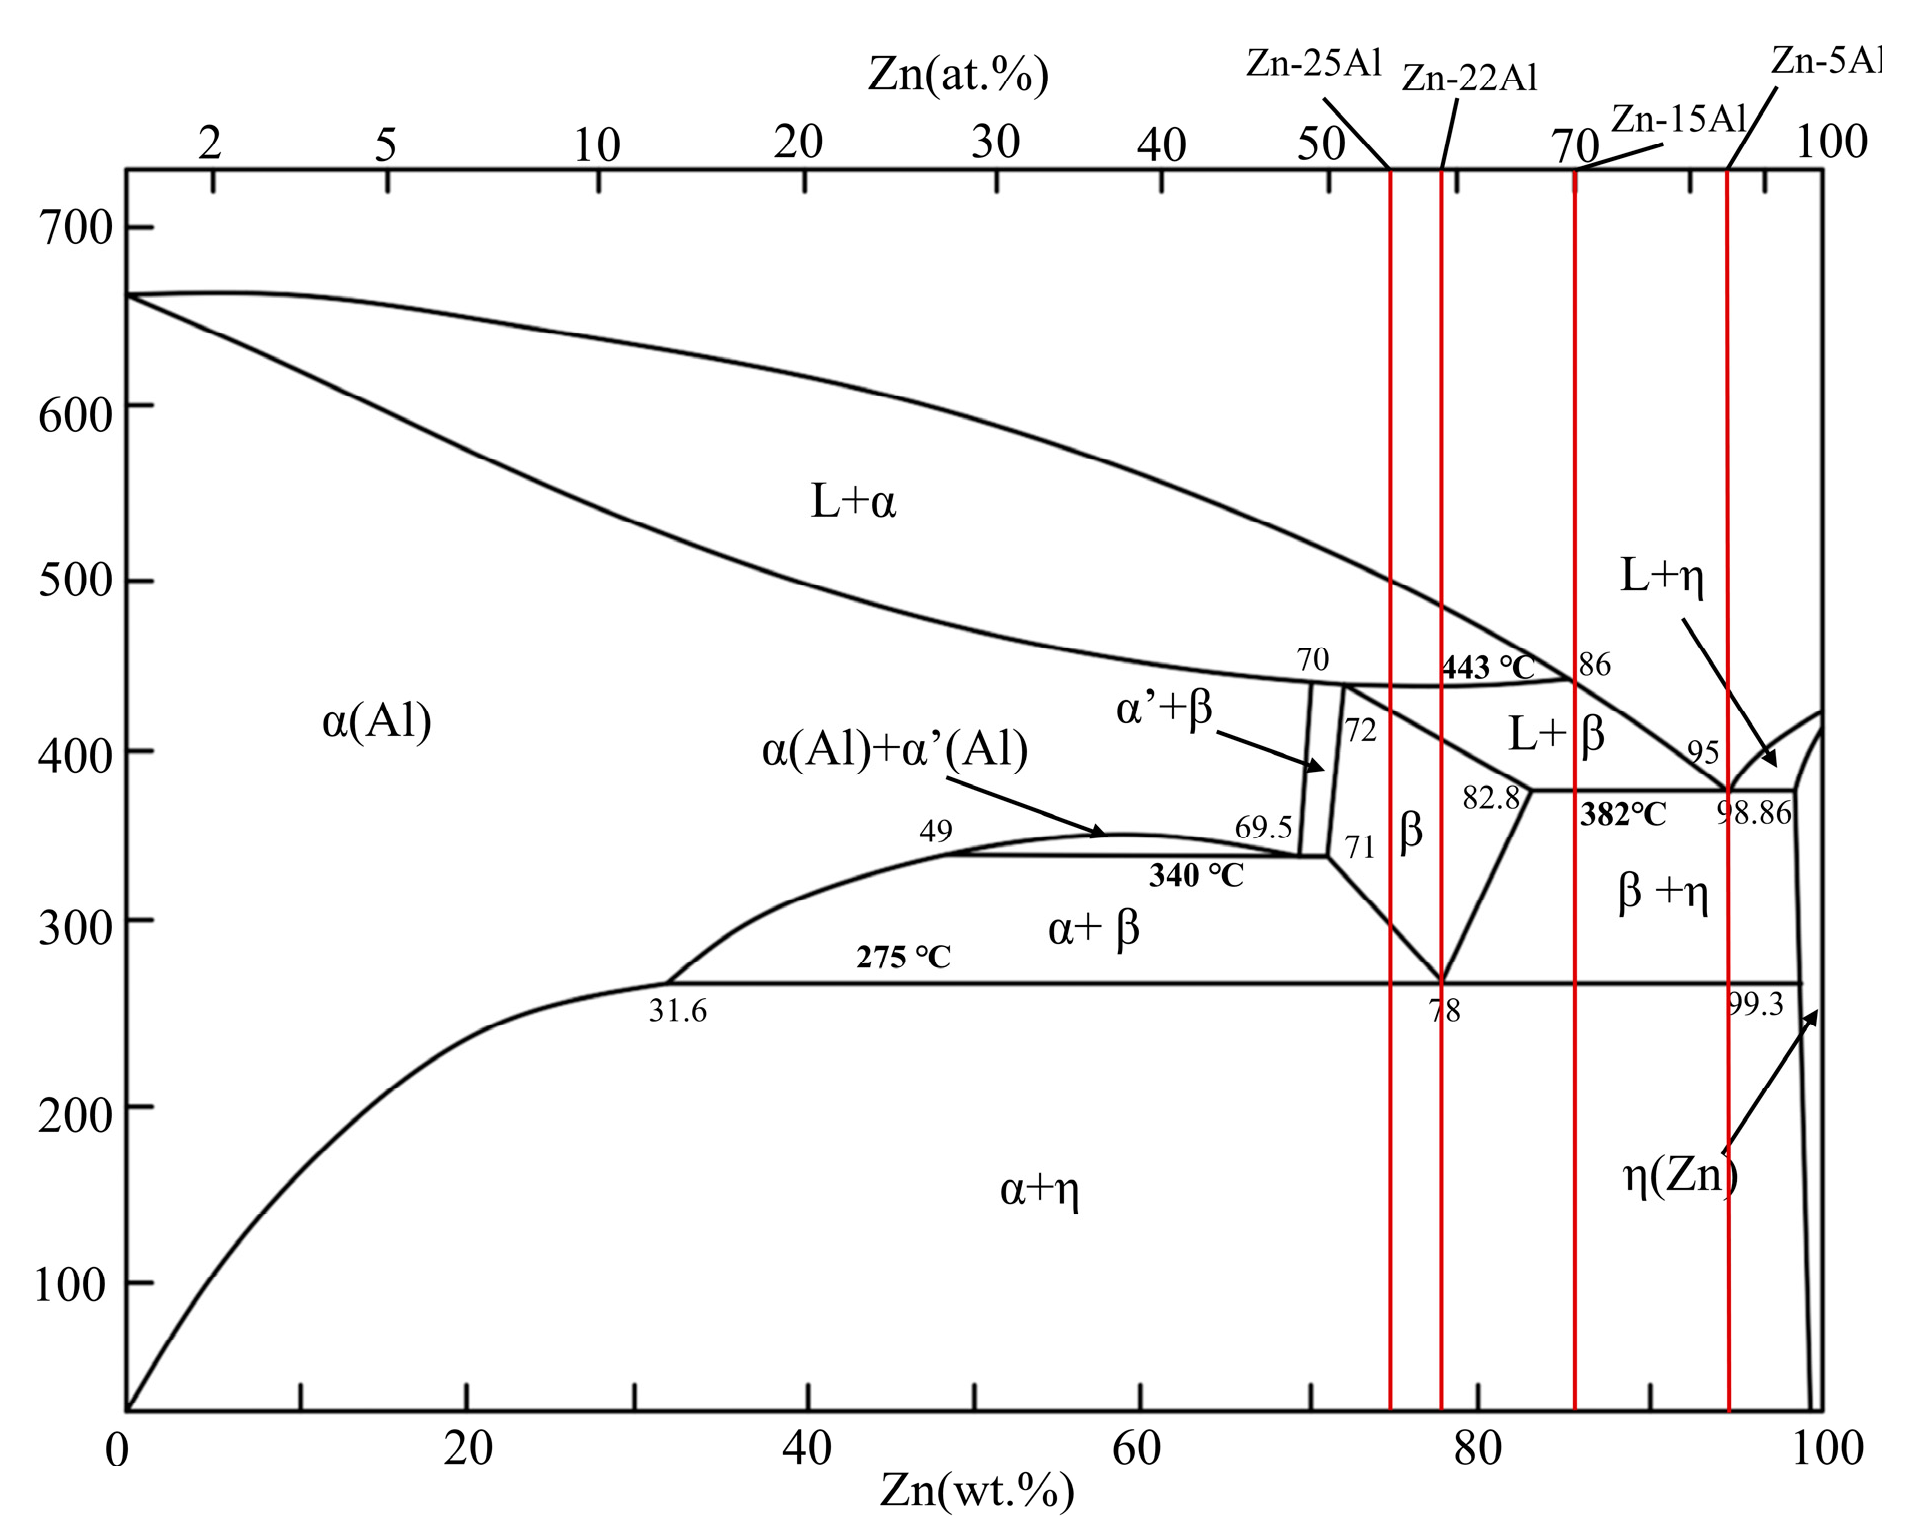
2.1. Preparation of Samples
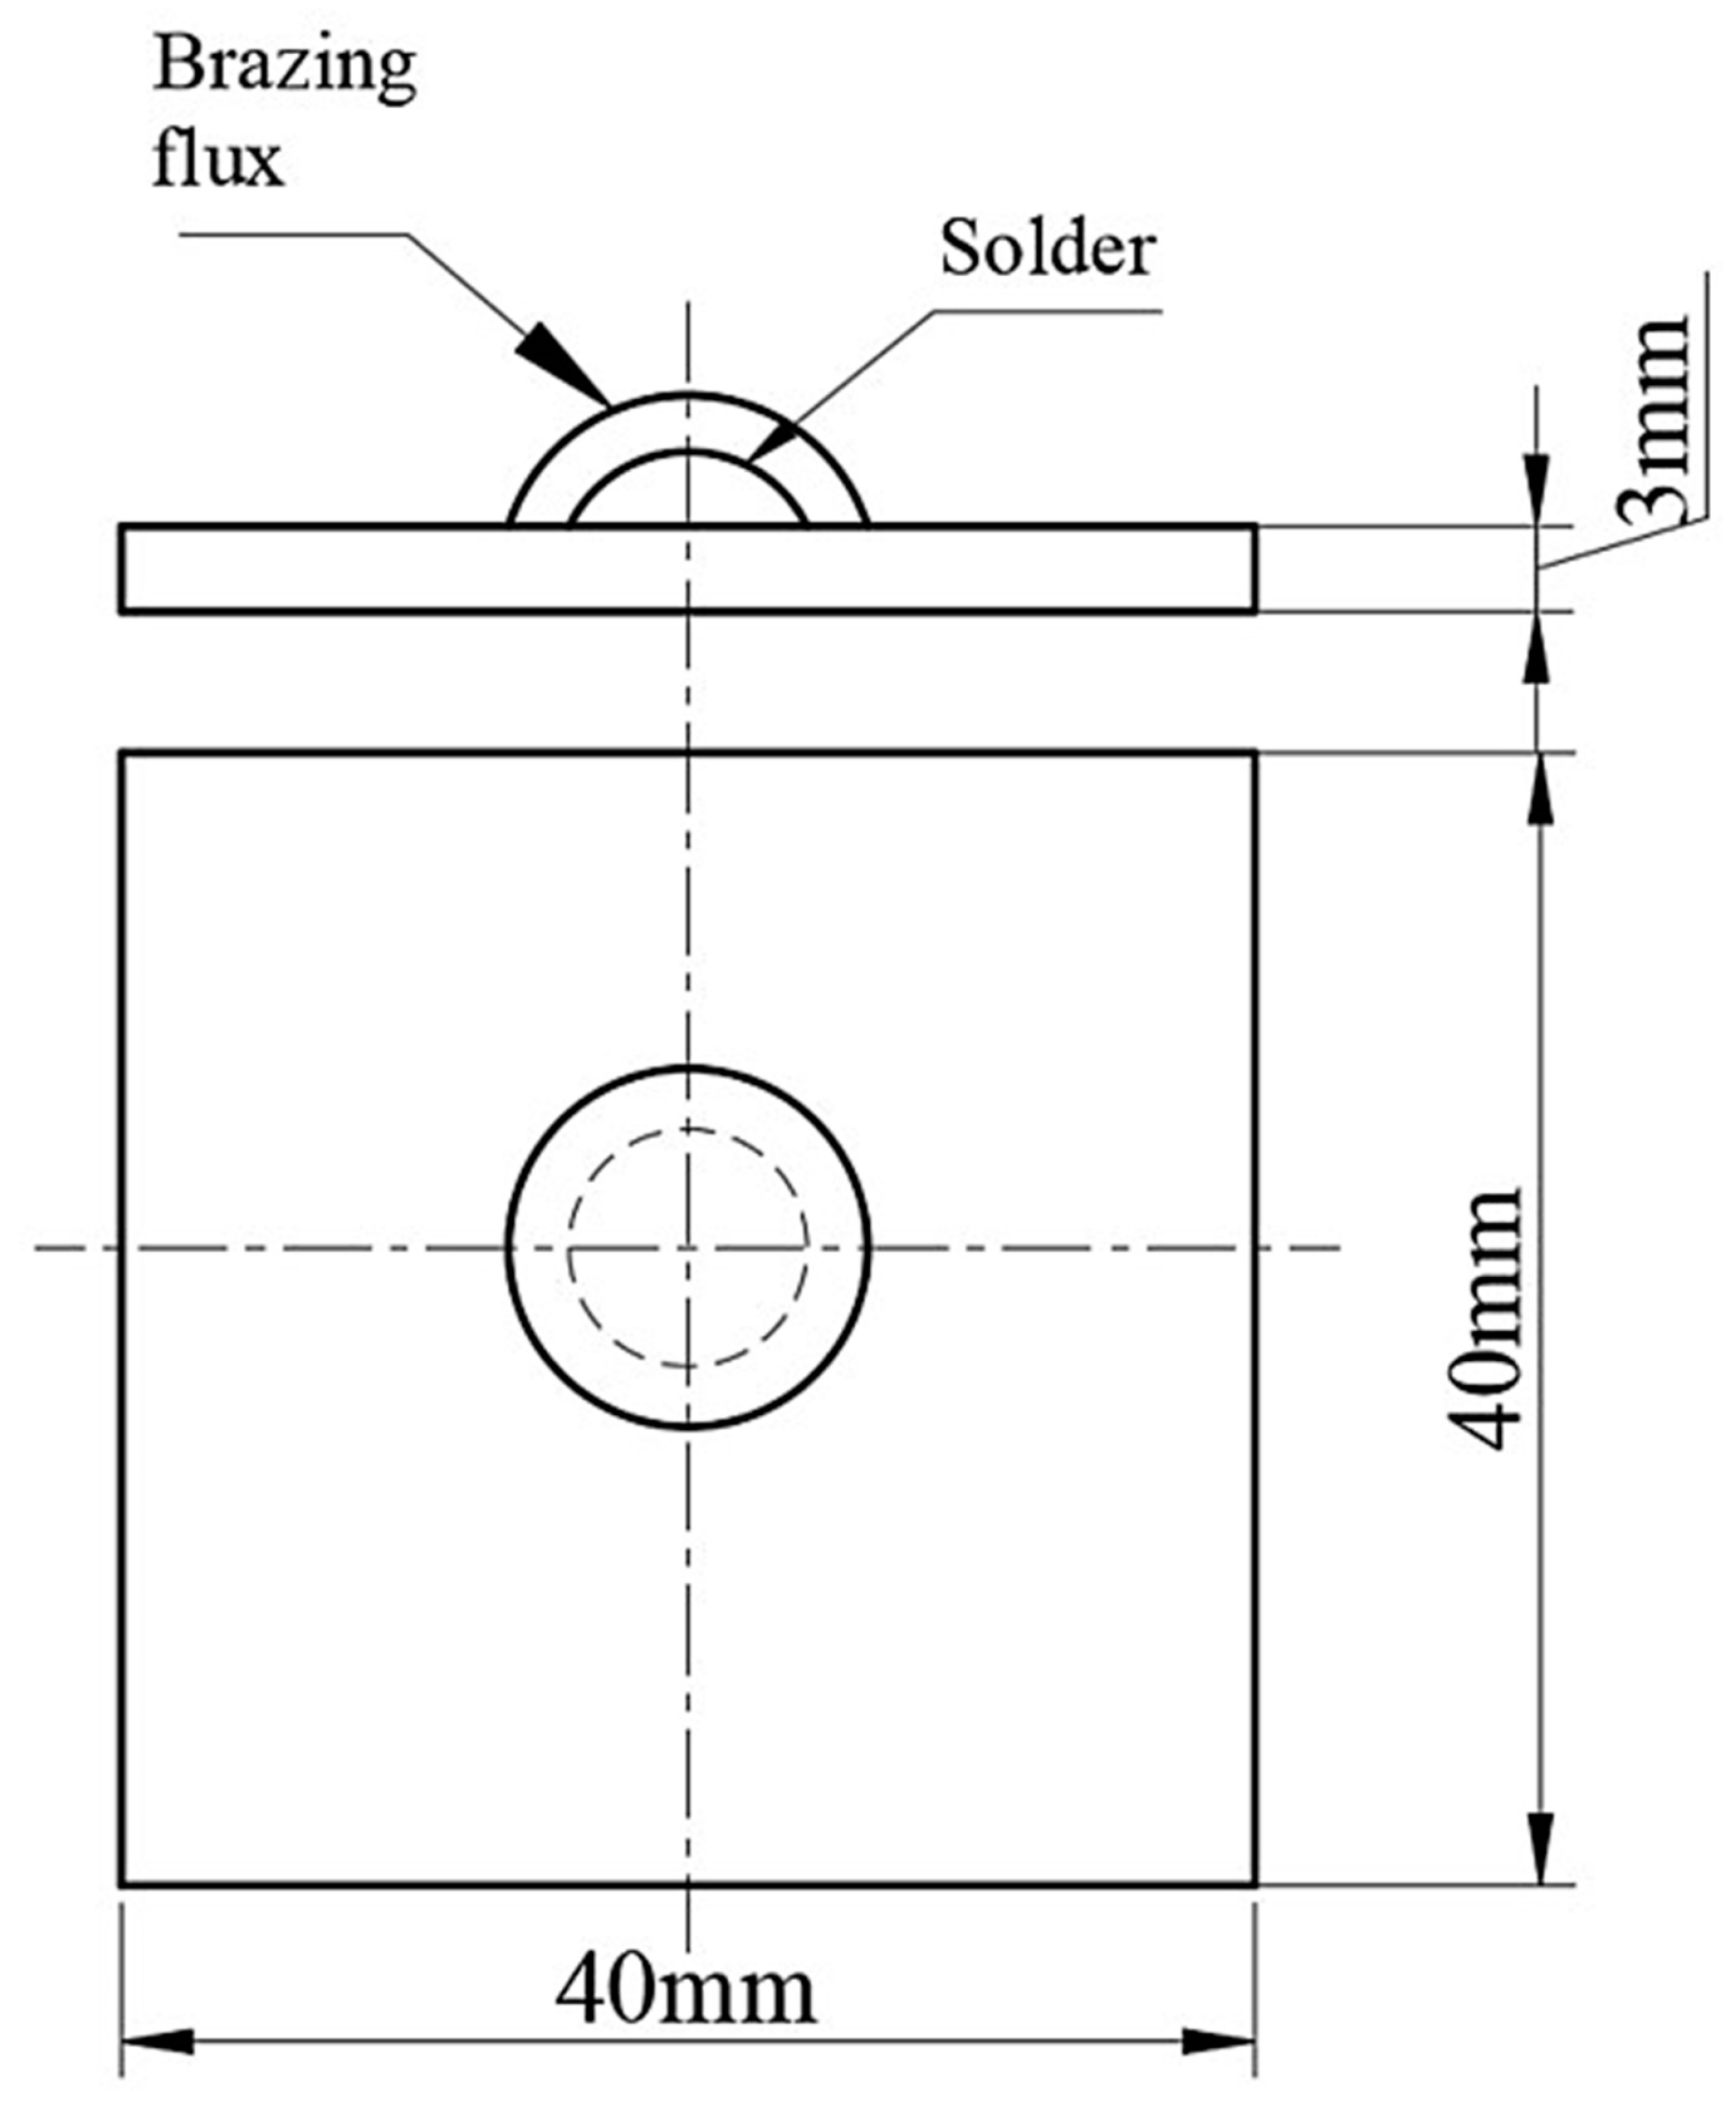
2.2. Experimental Procedure
3. Results and Discussion
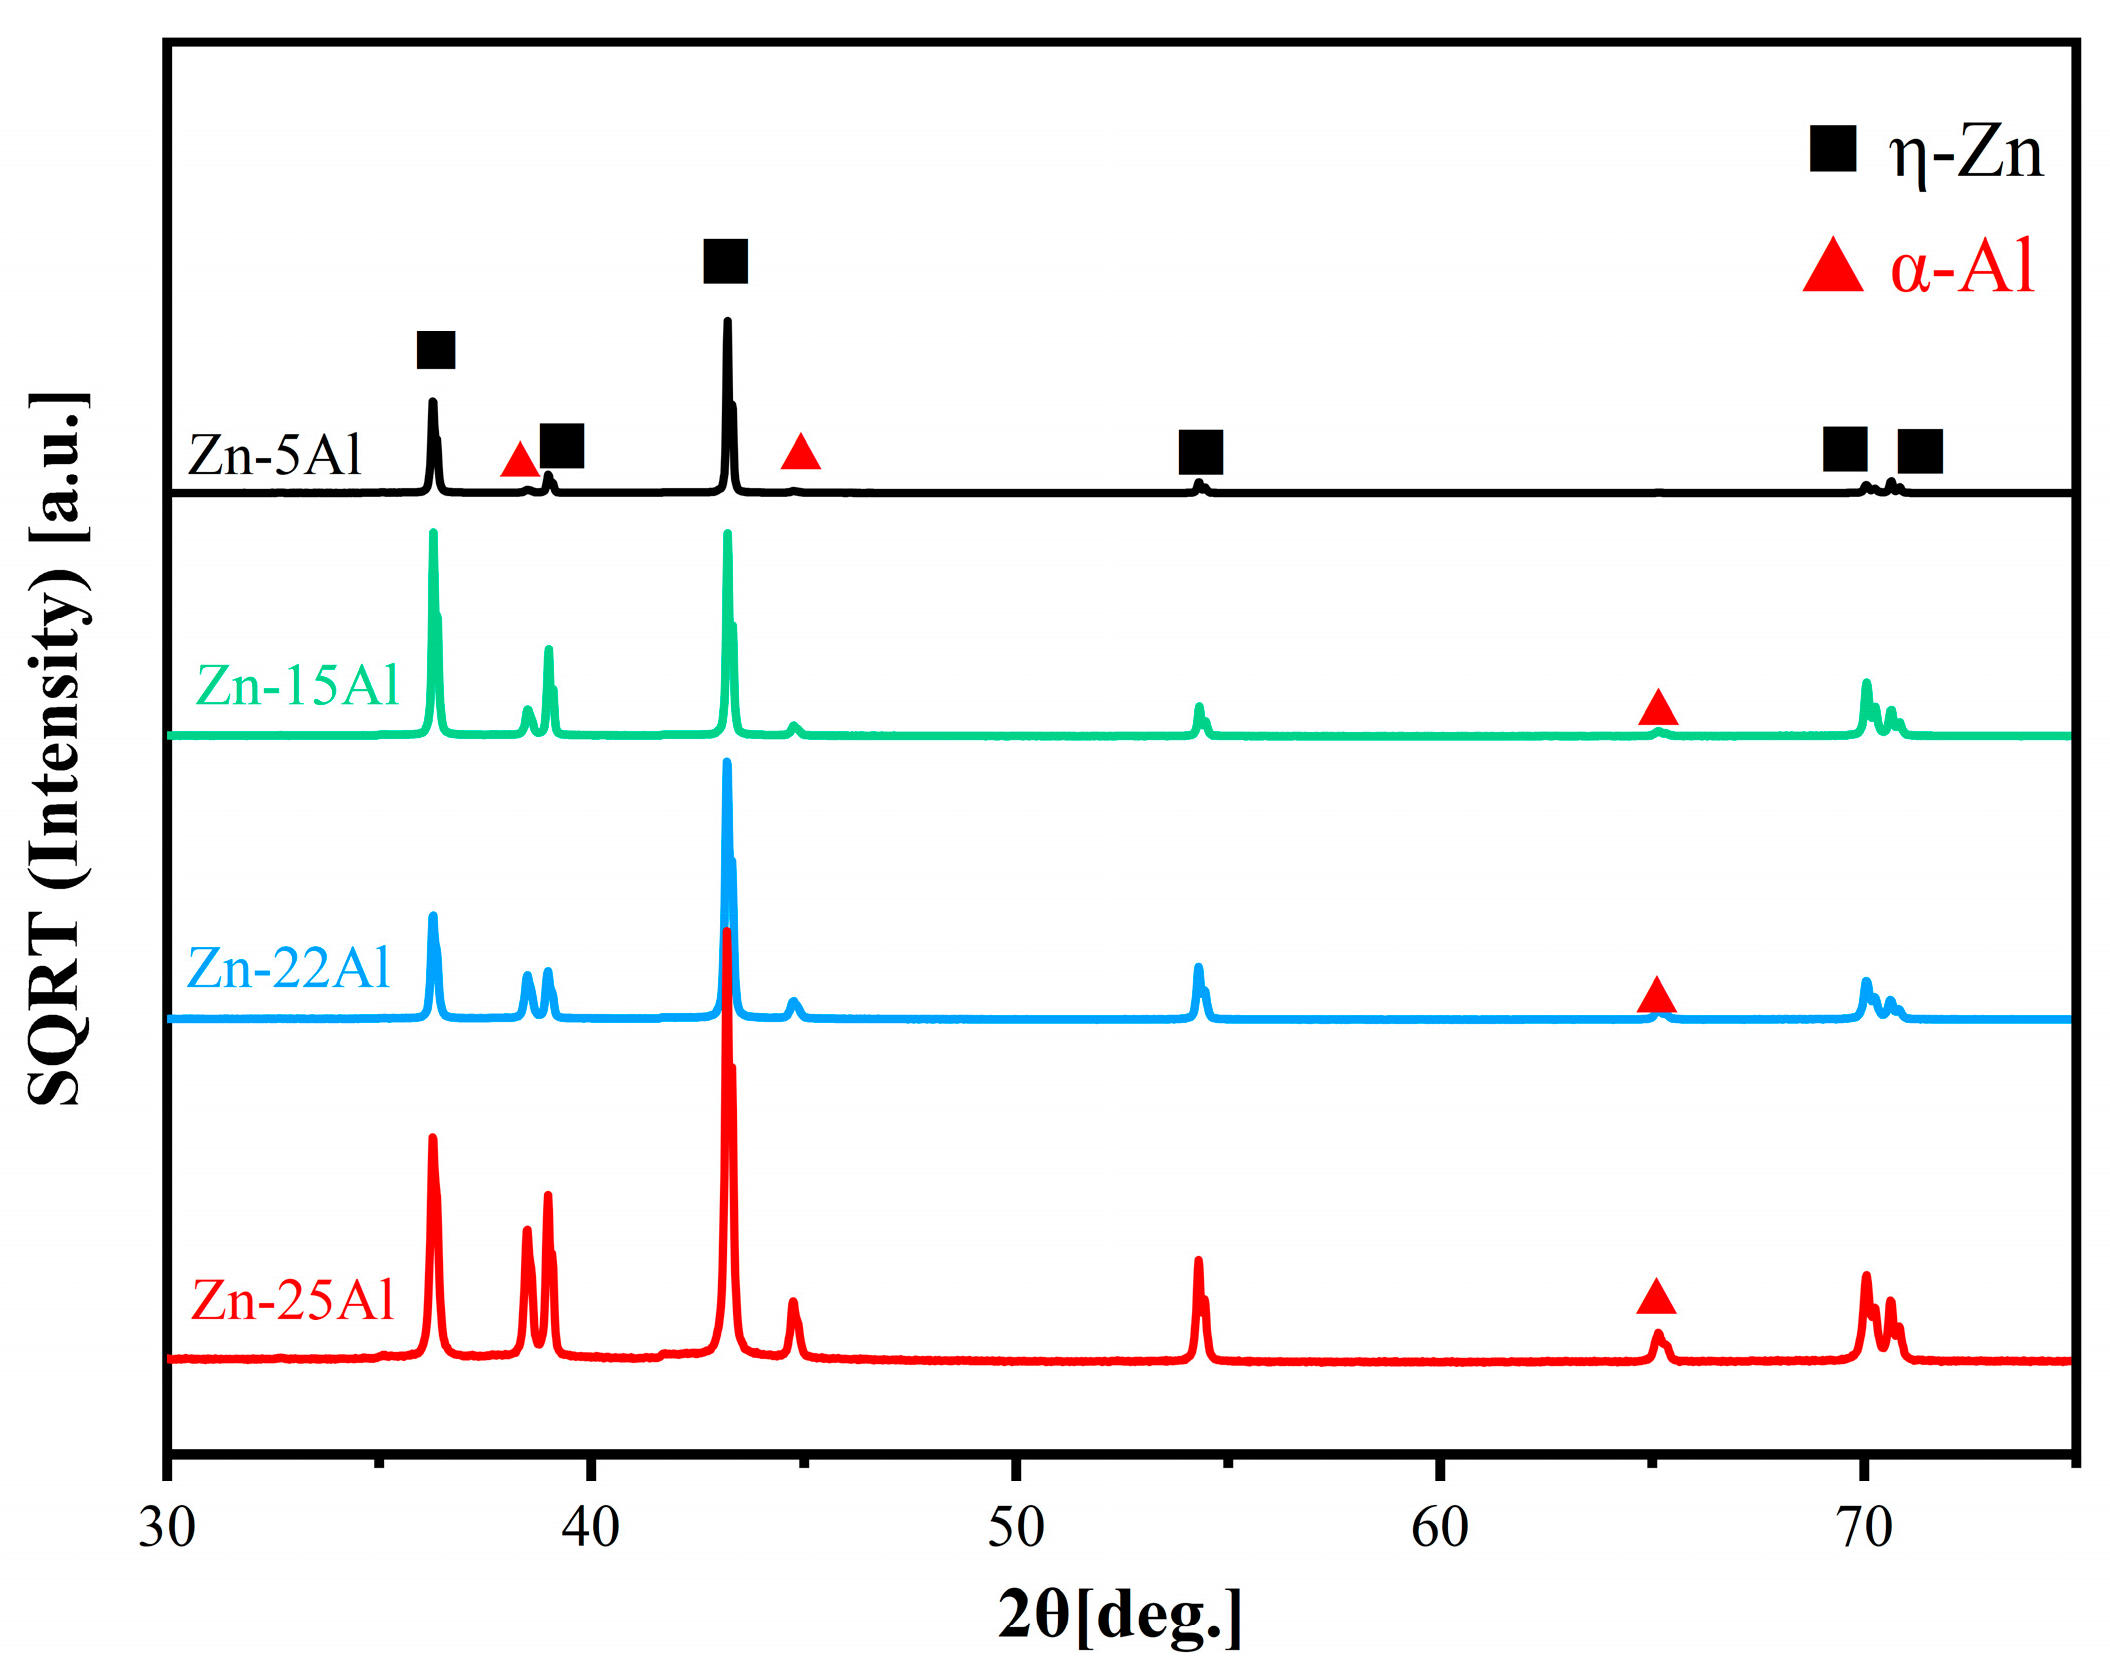
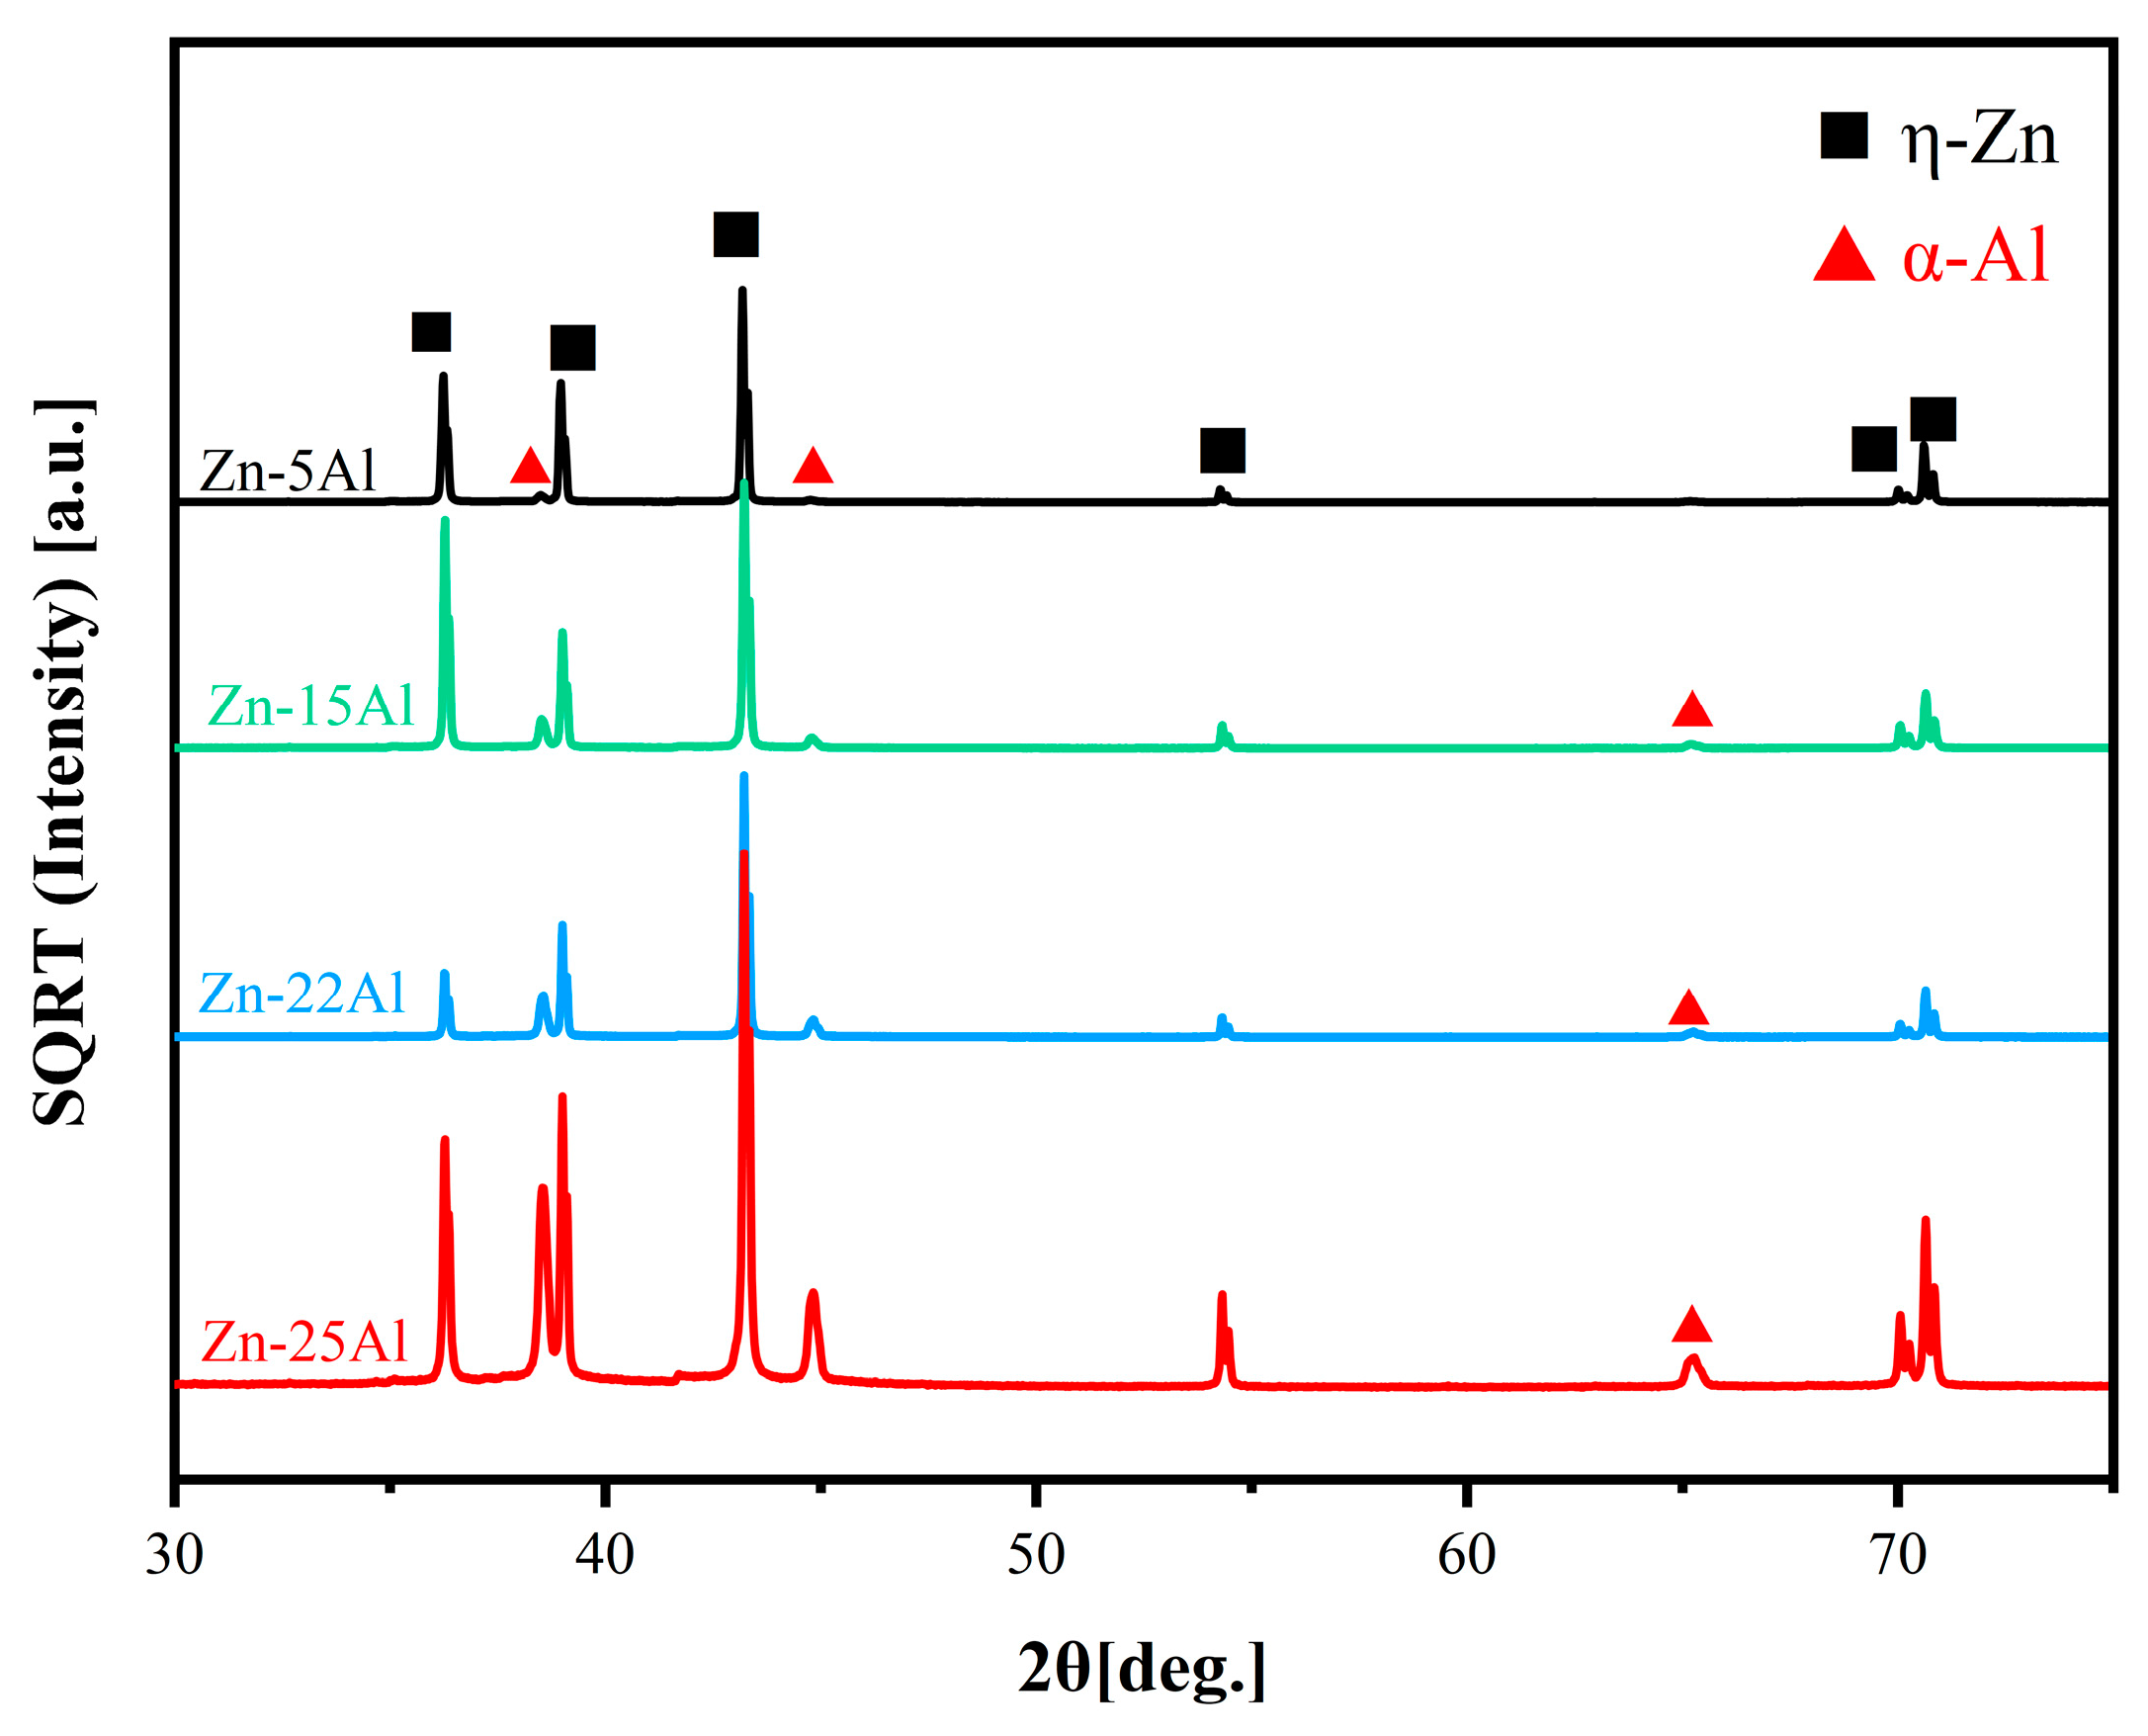
3.1. Microstructure Analysis
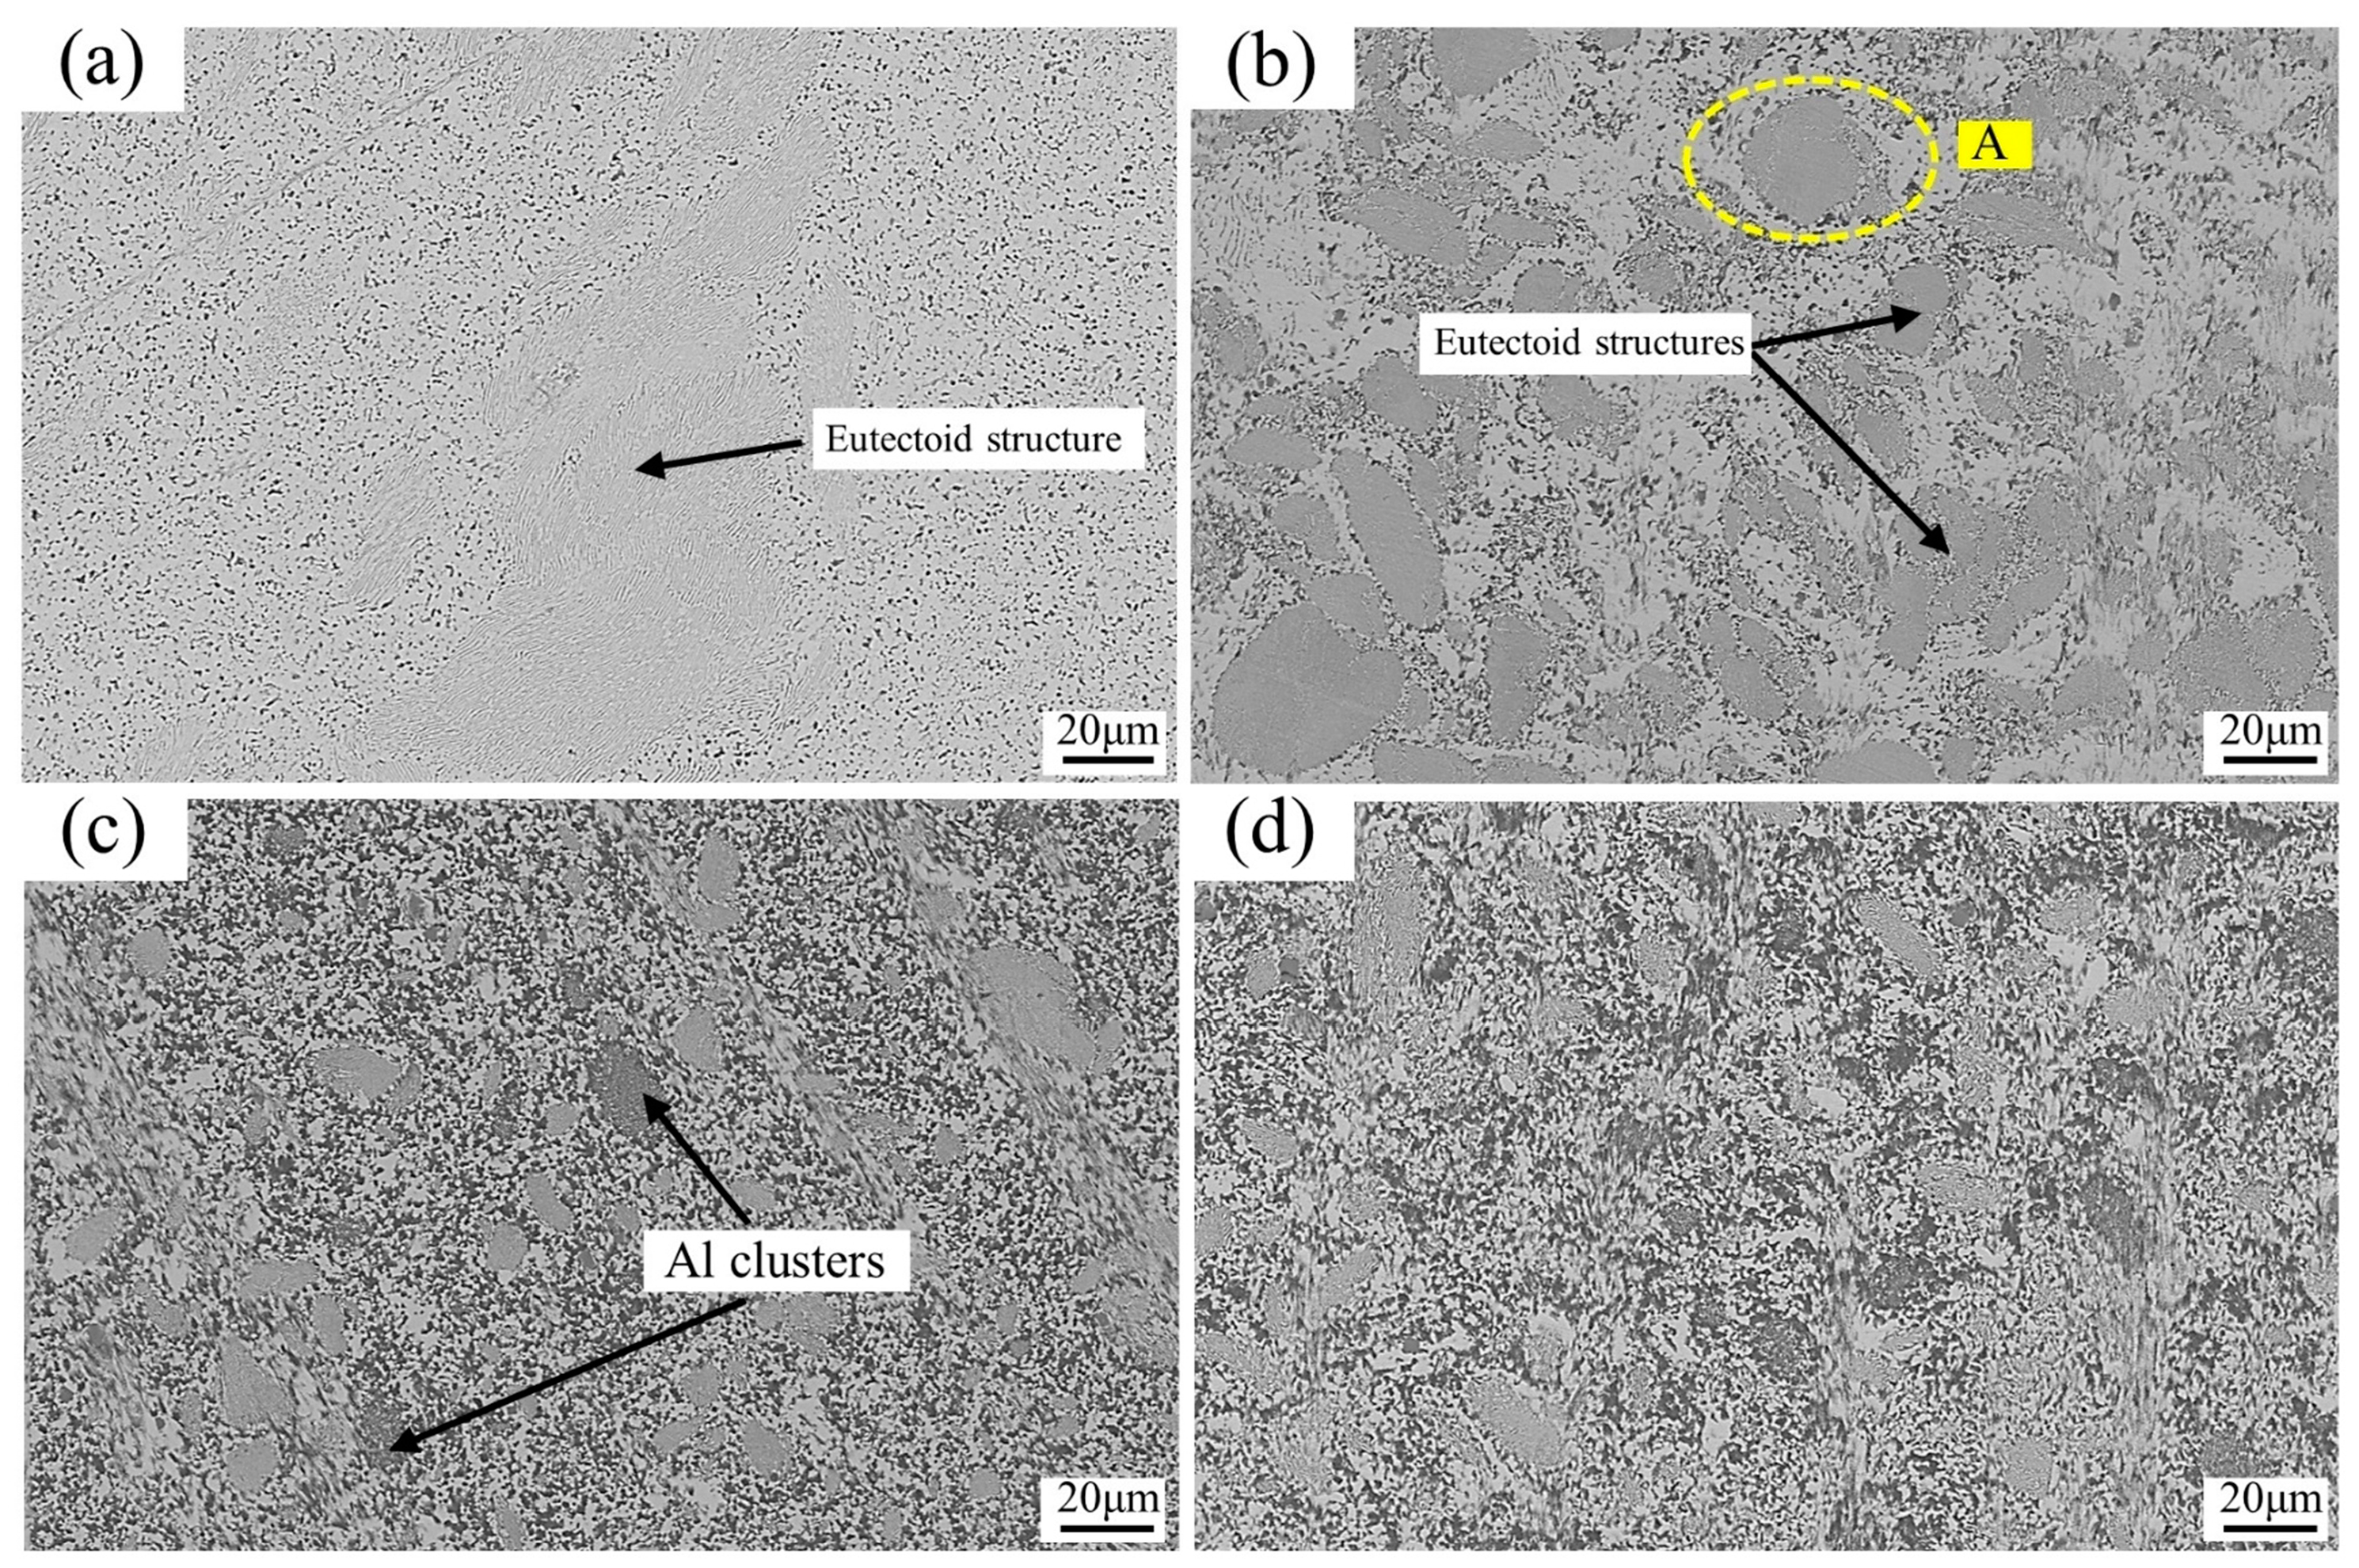
3.1.1. Microstructure of as-Cast Alloys
3.1.2. Microstructure of Alloys in the Extruded State
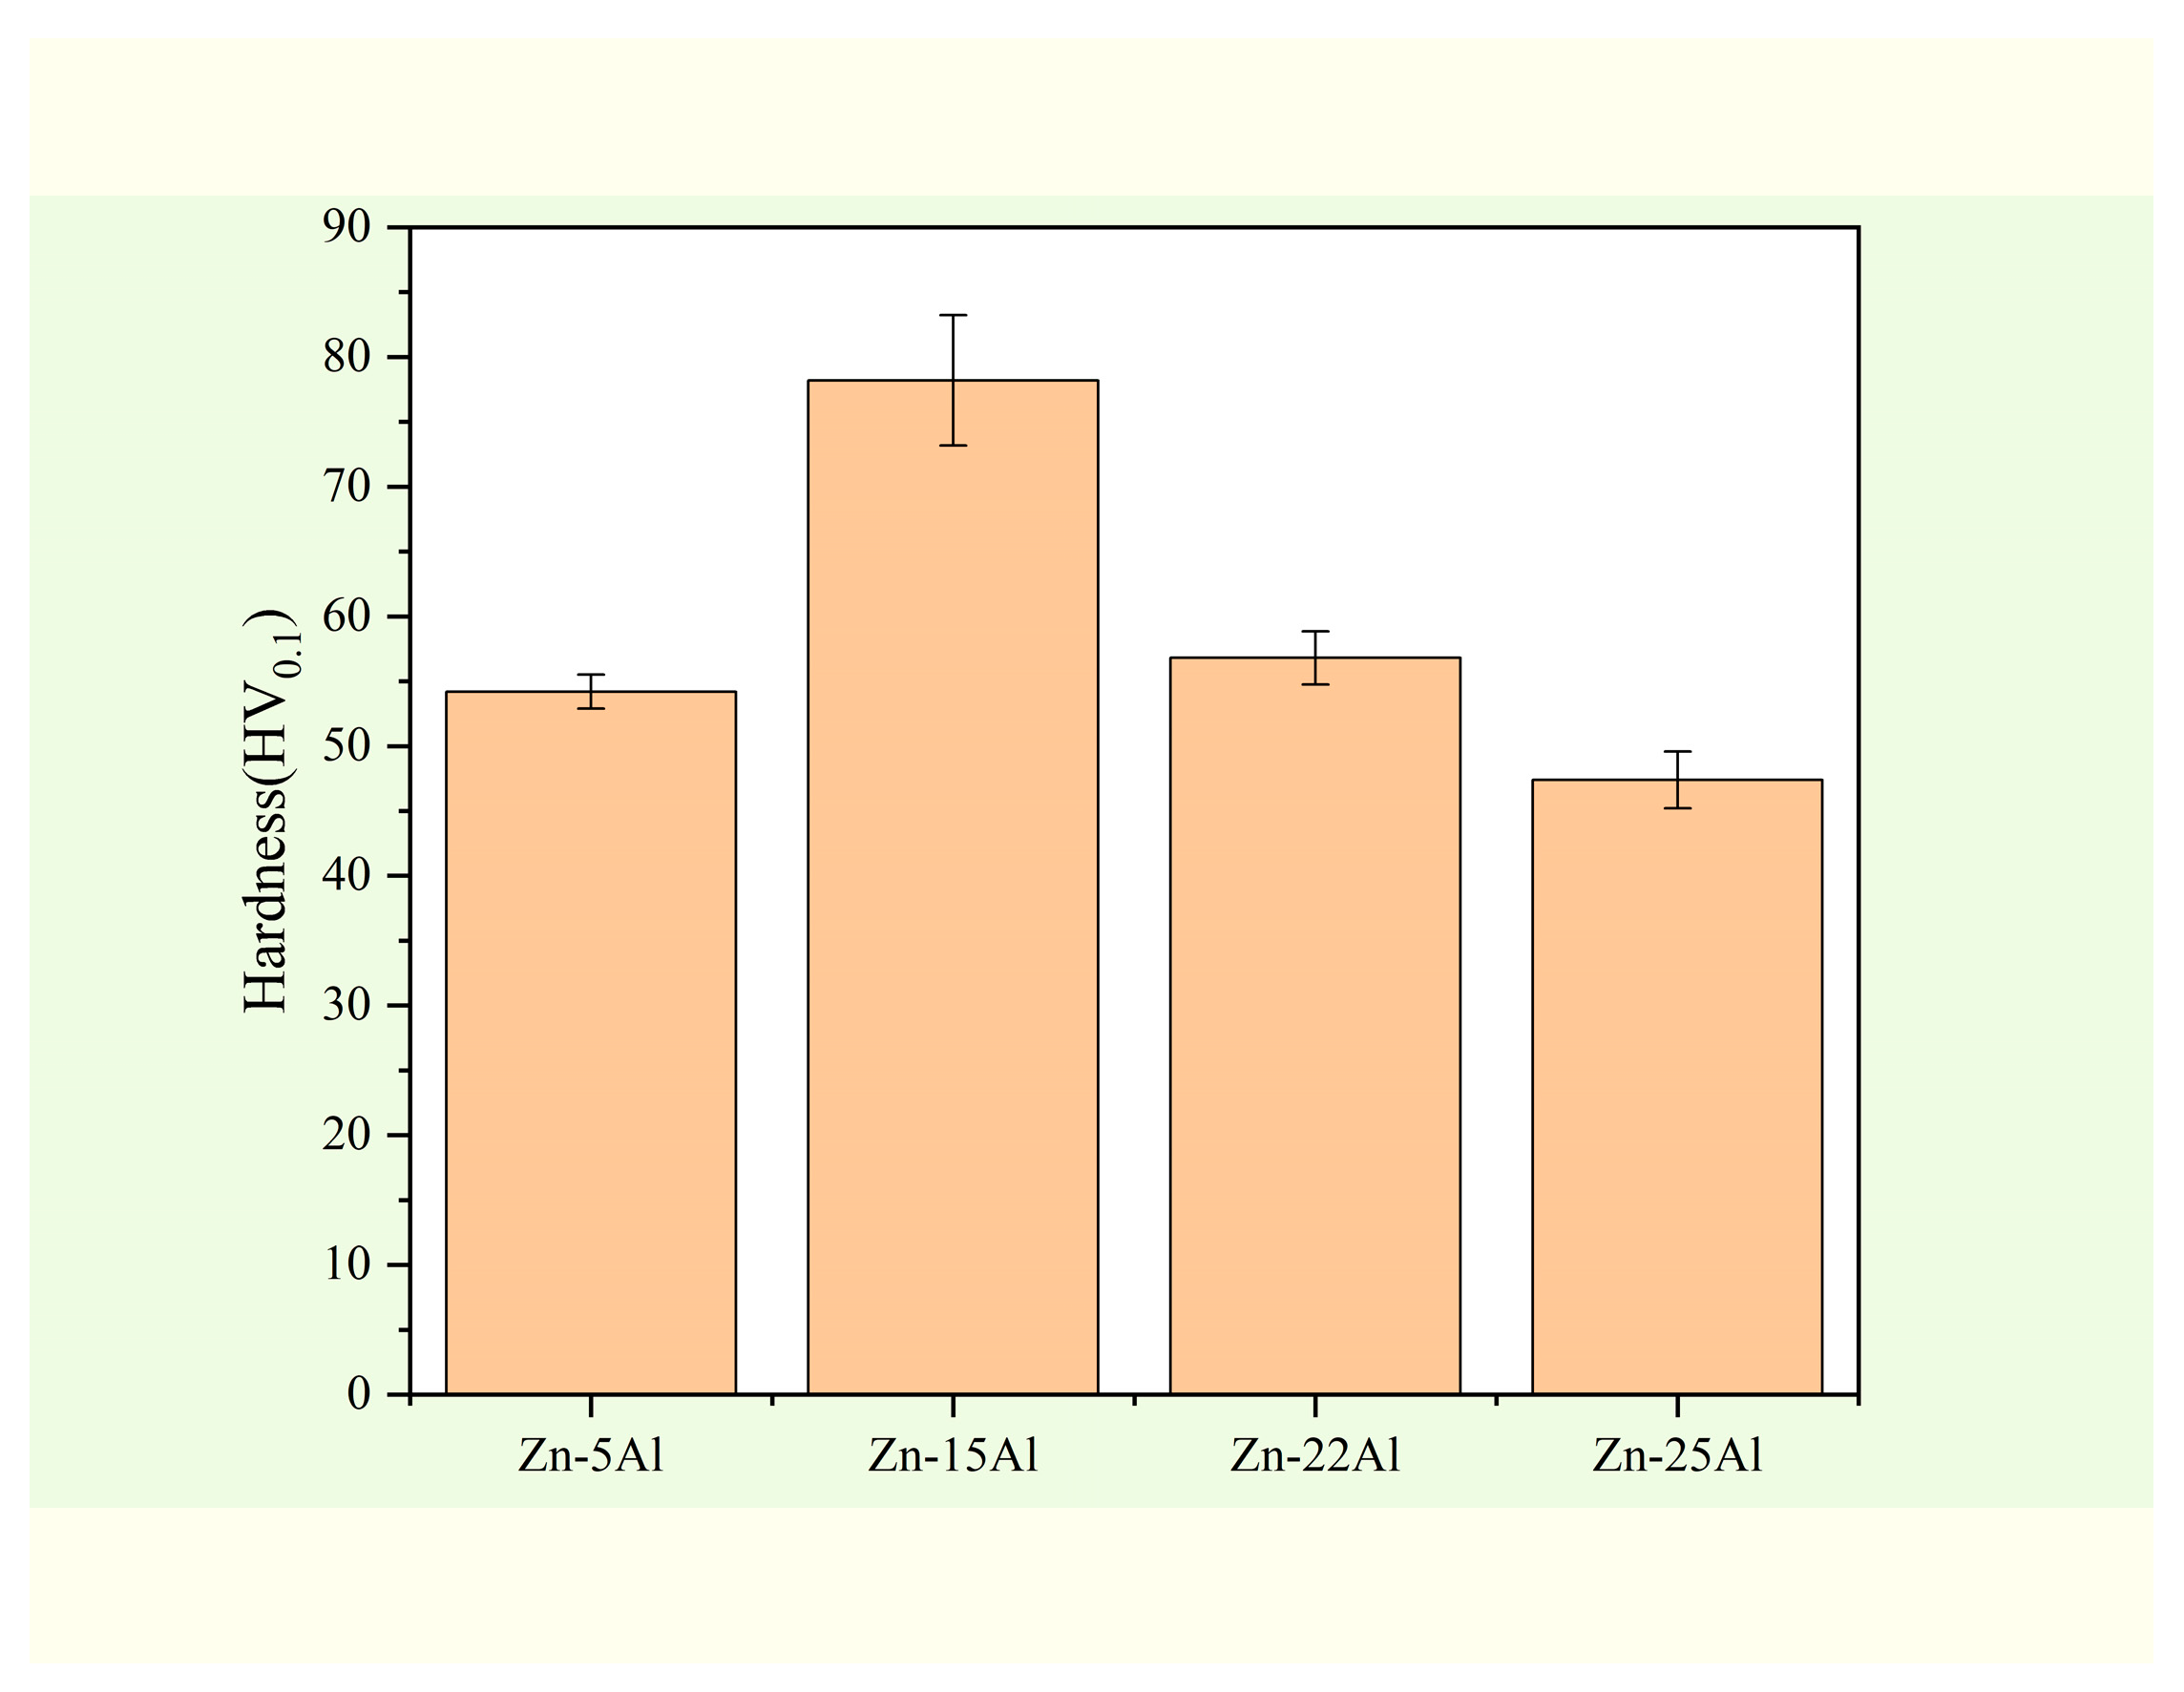
3.2. Mechanical Properties
3.2.1. Microhardness Test
3.2.2. Tensile Test
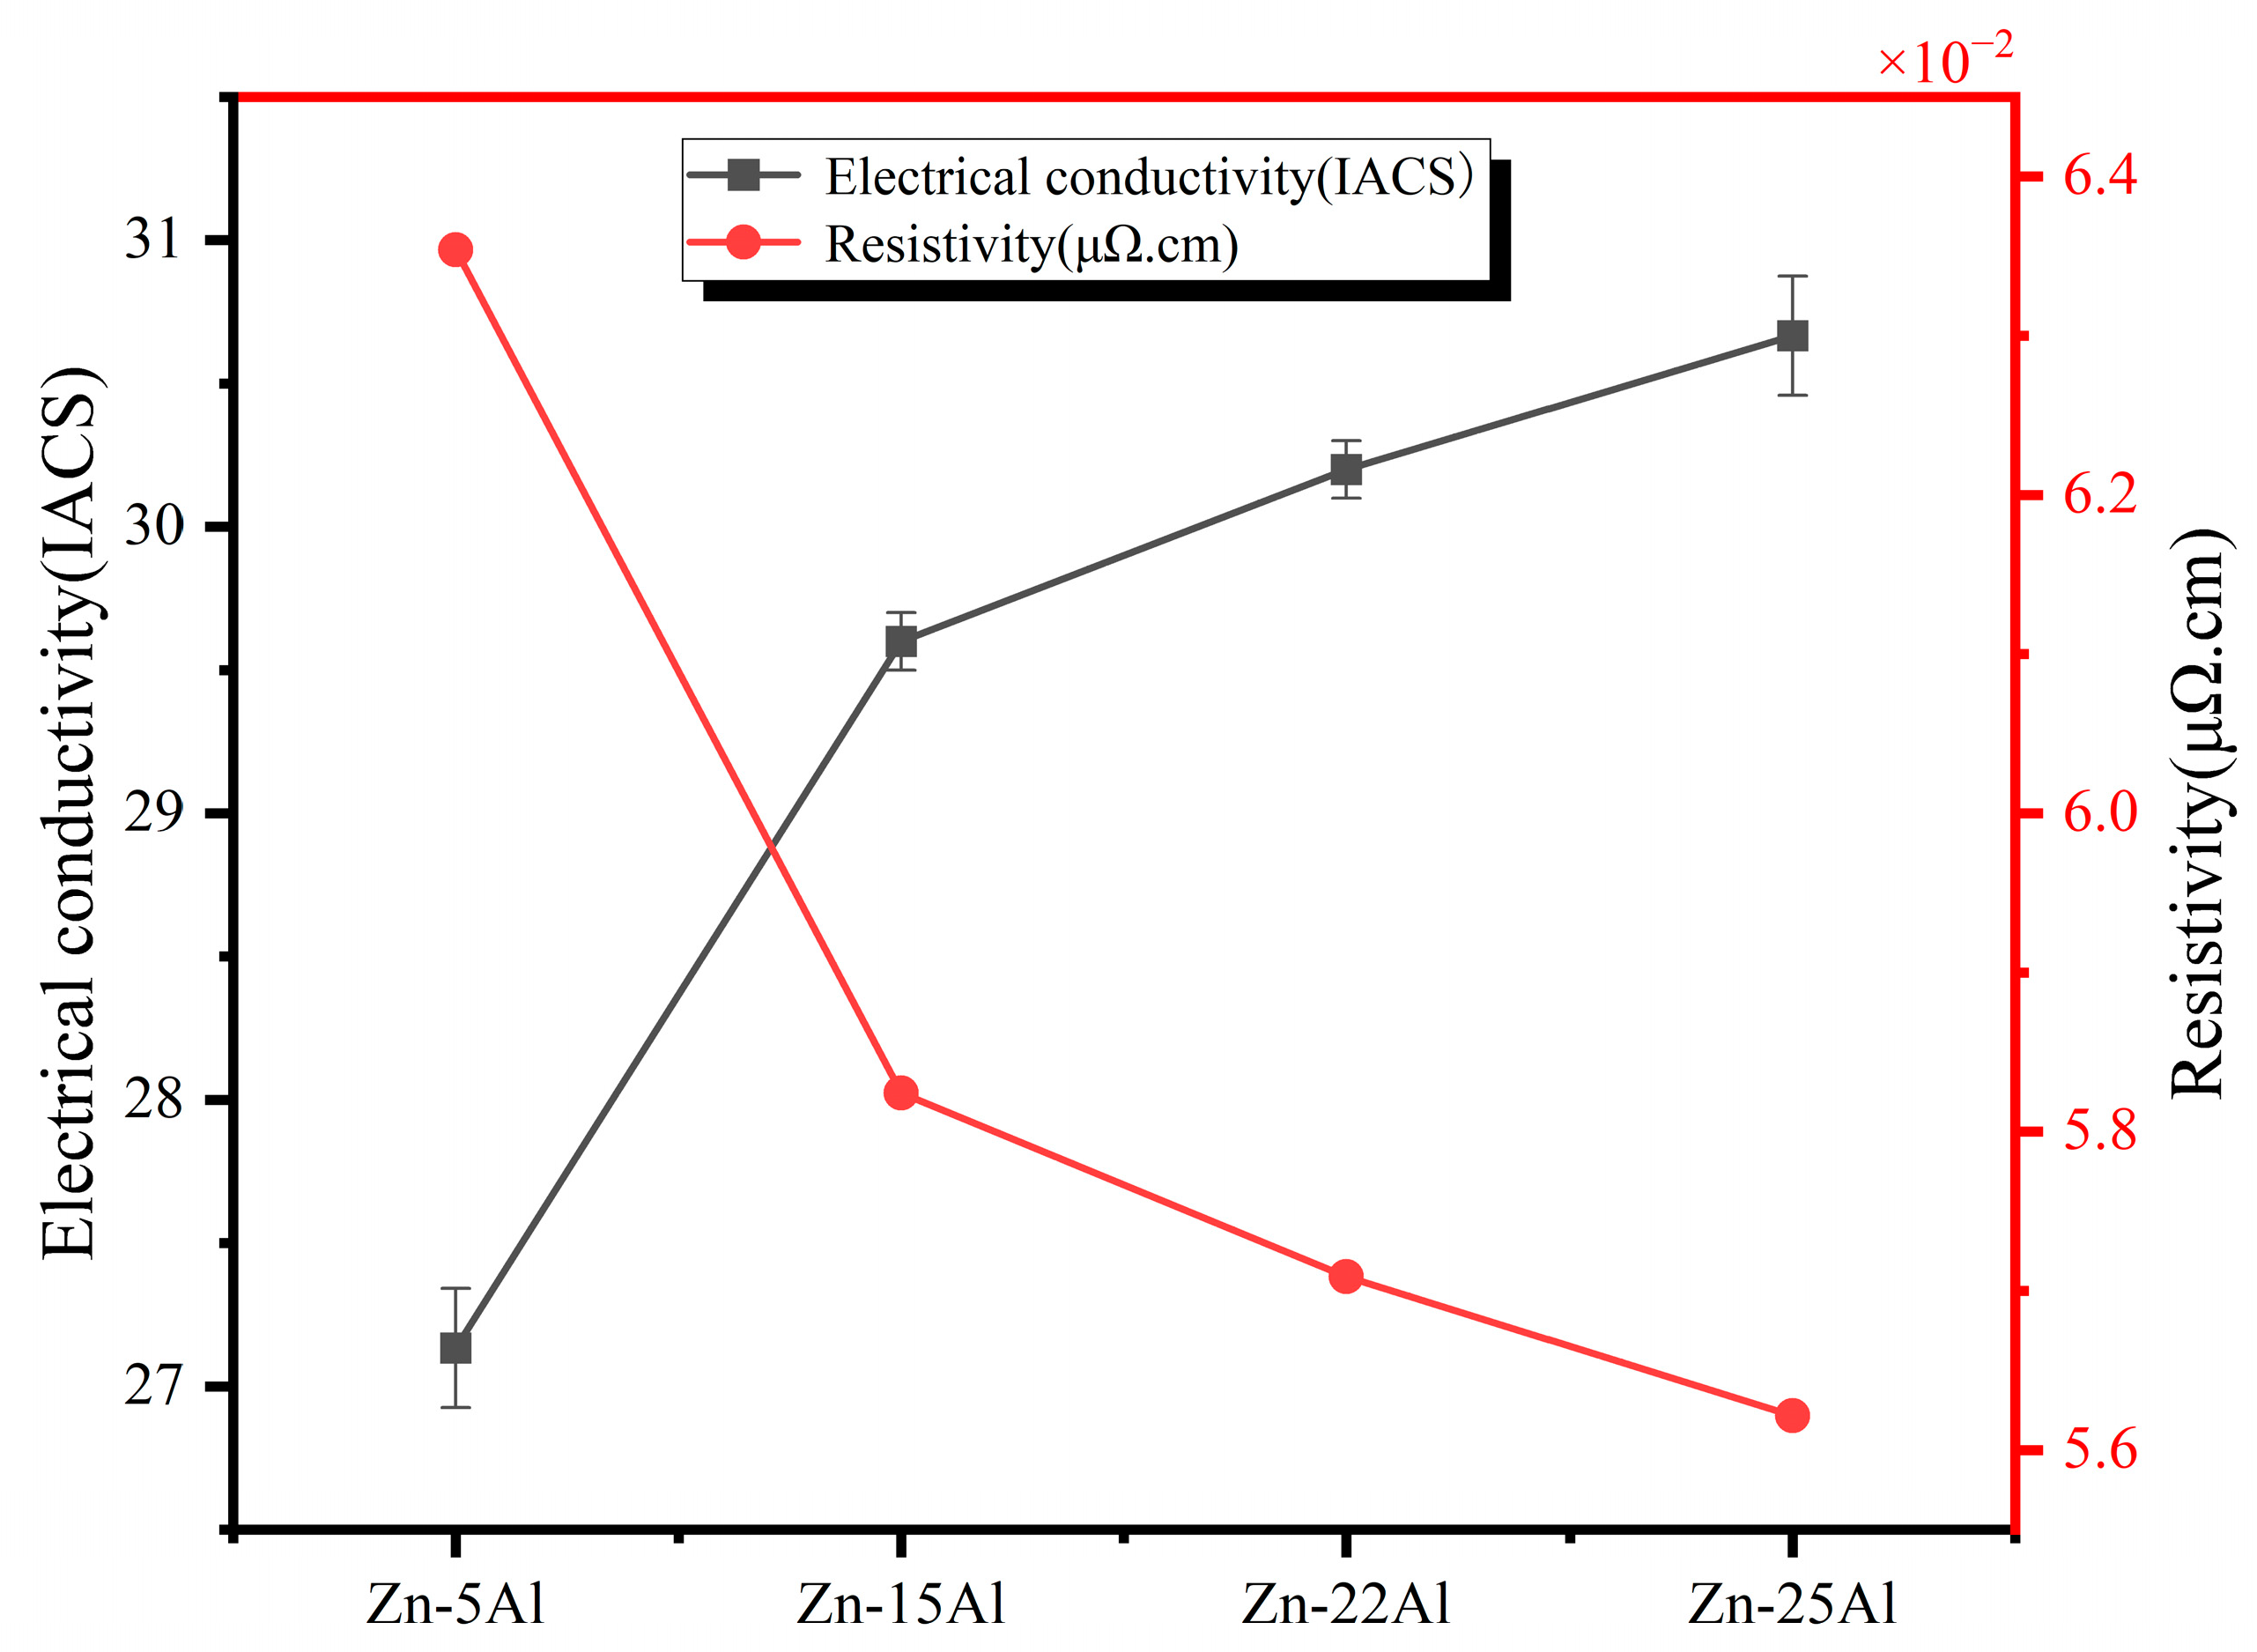
3.3. Electrical Property
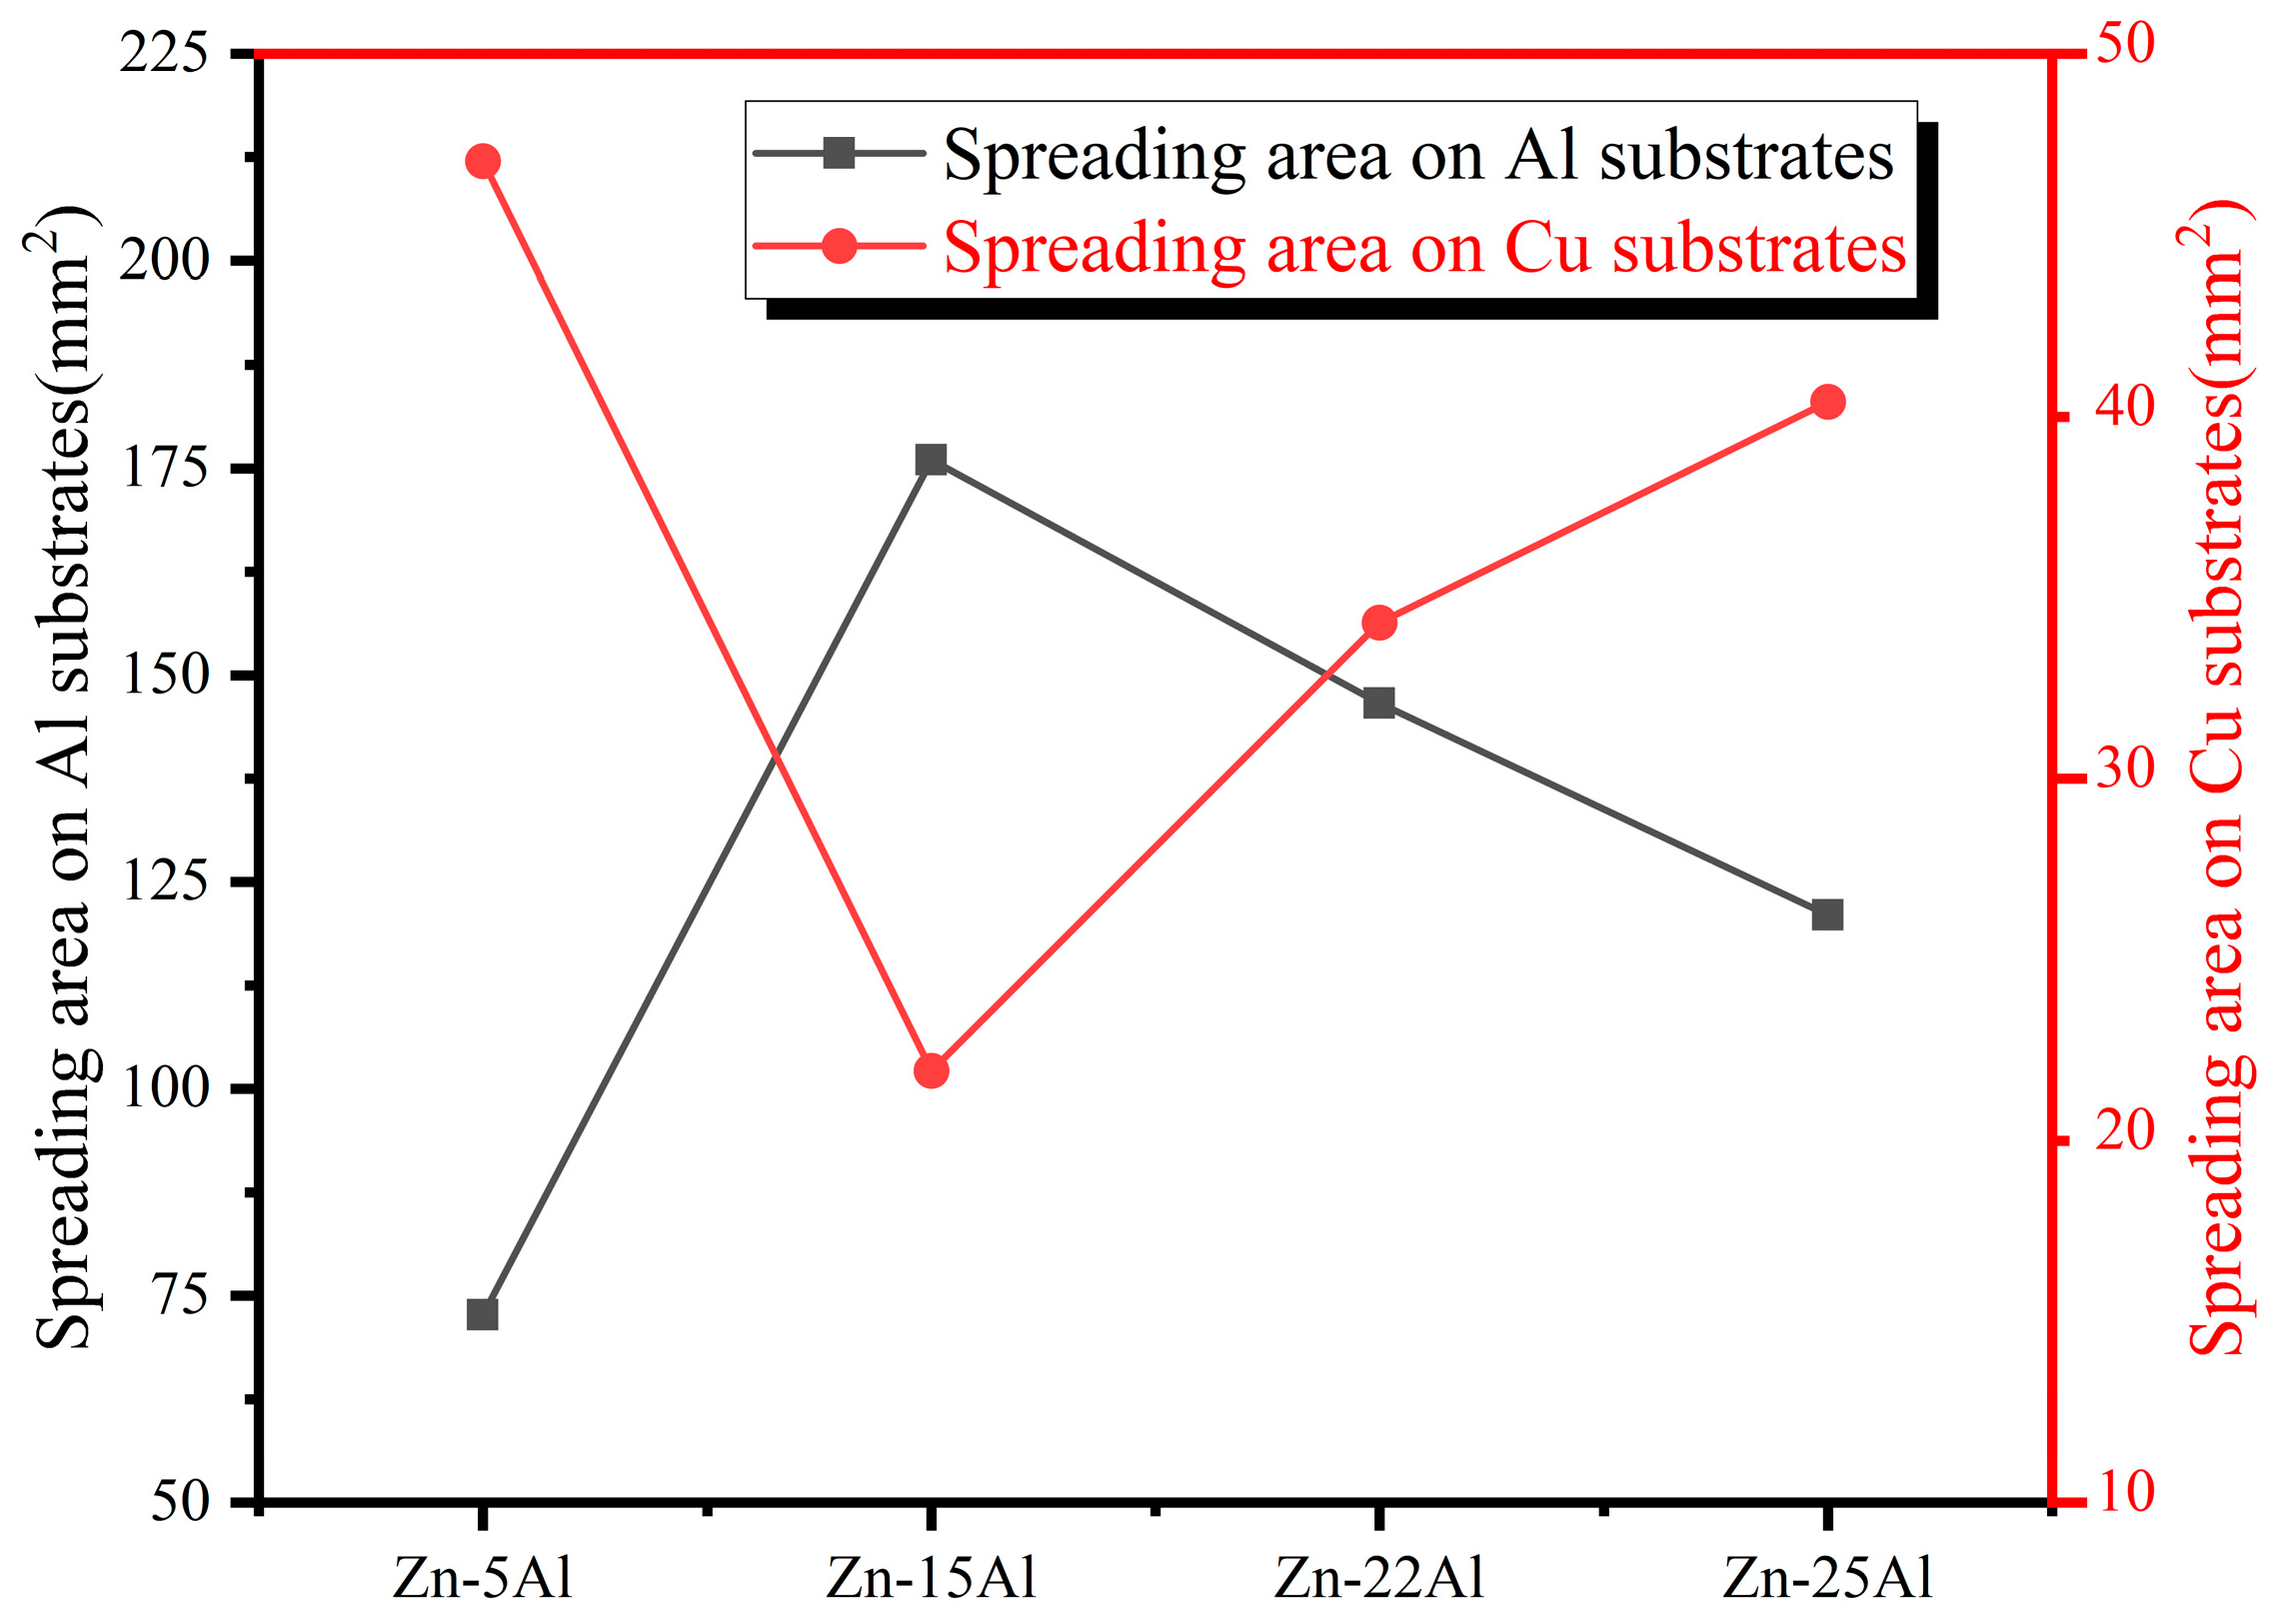
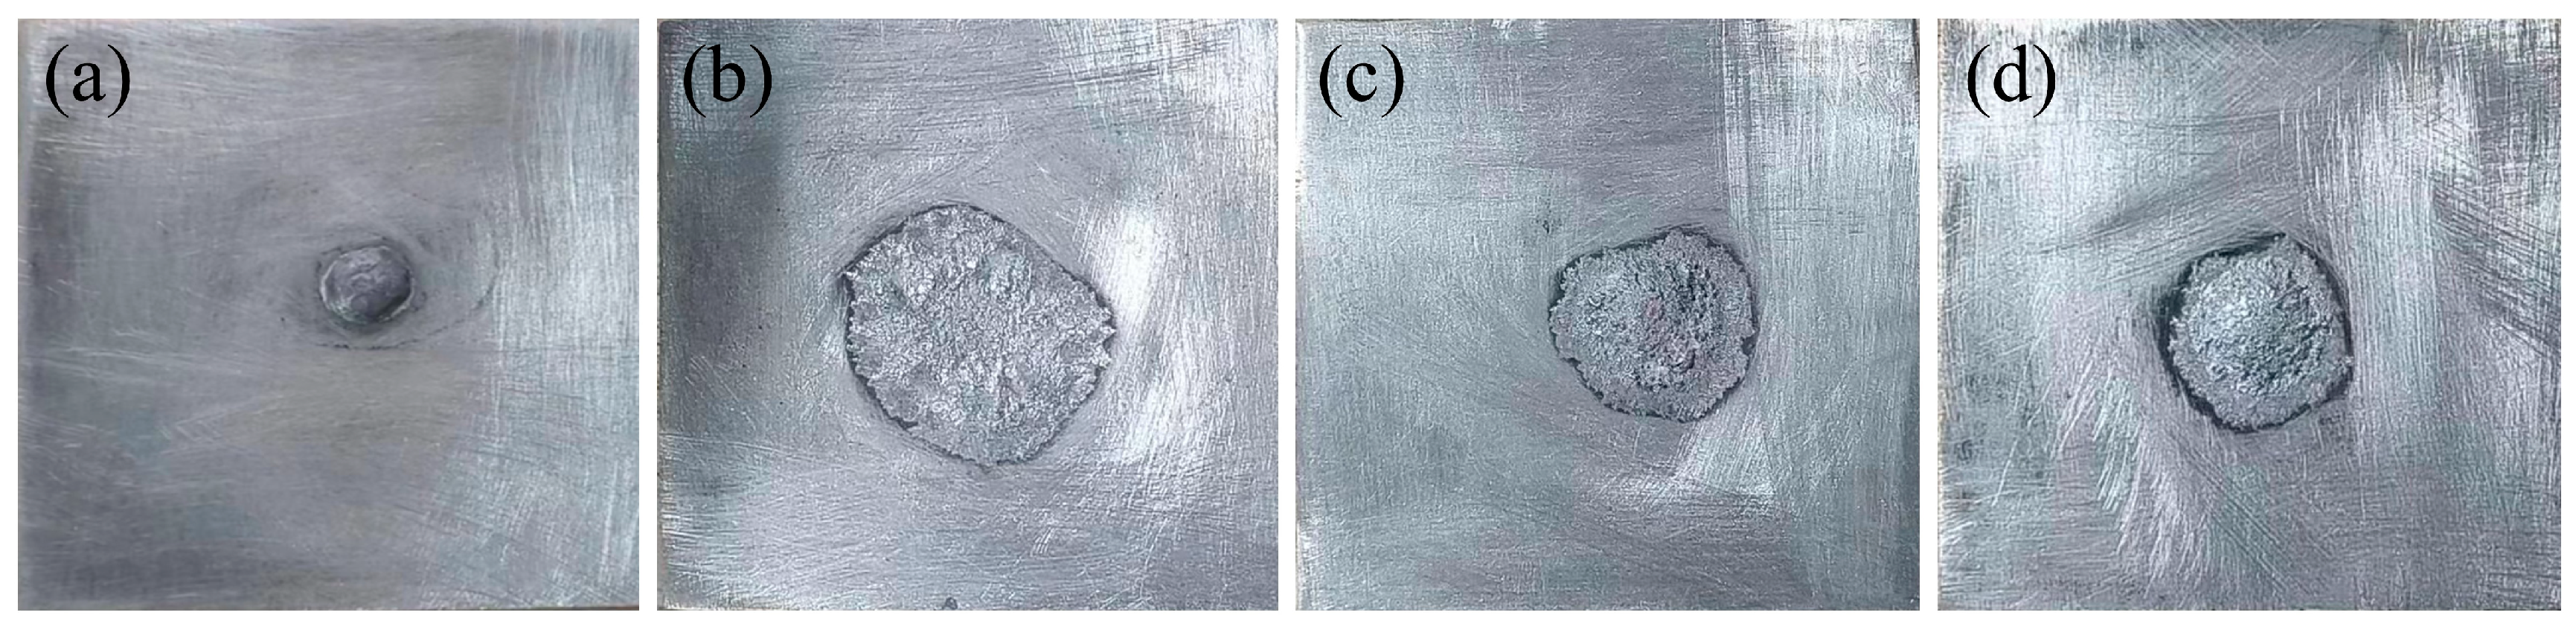
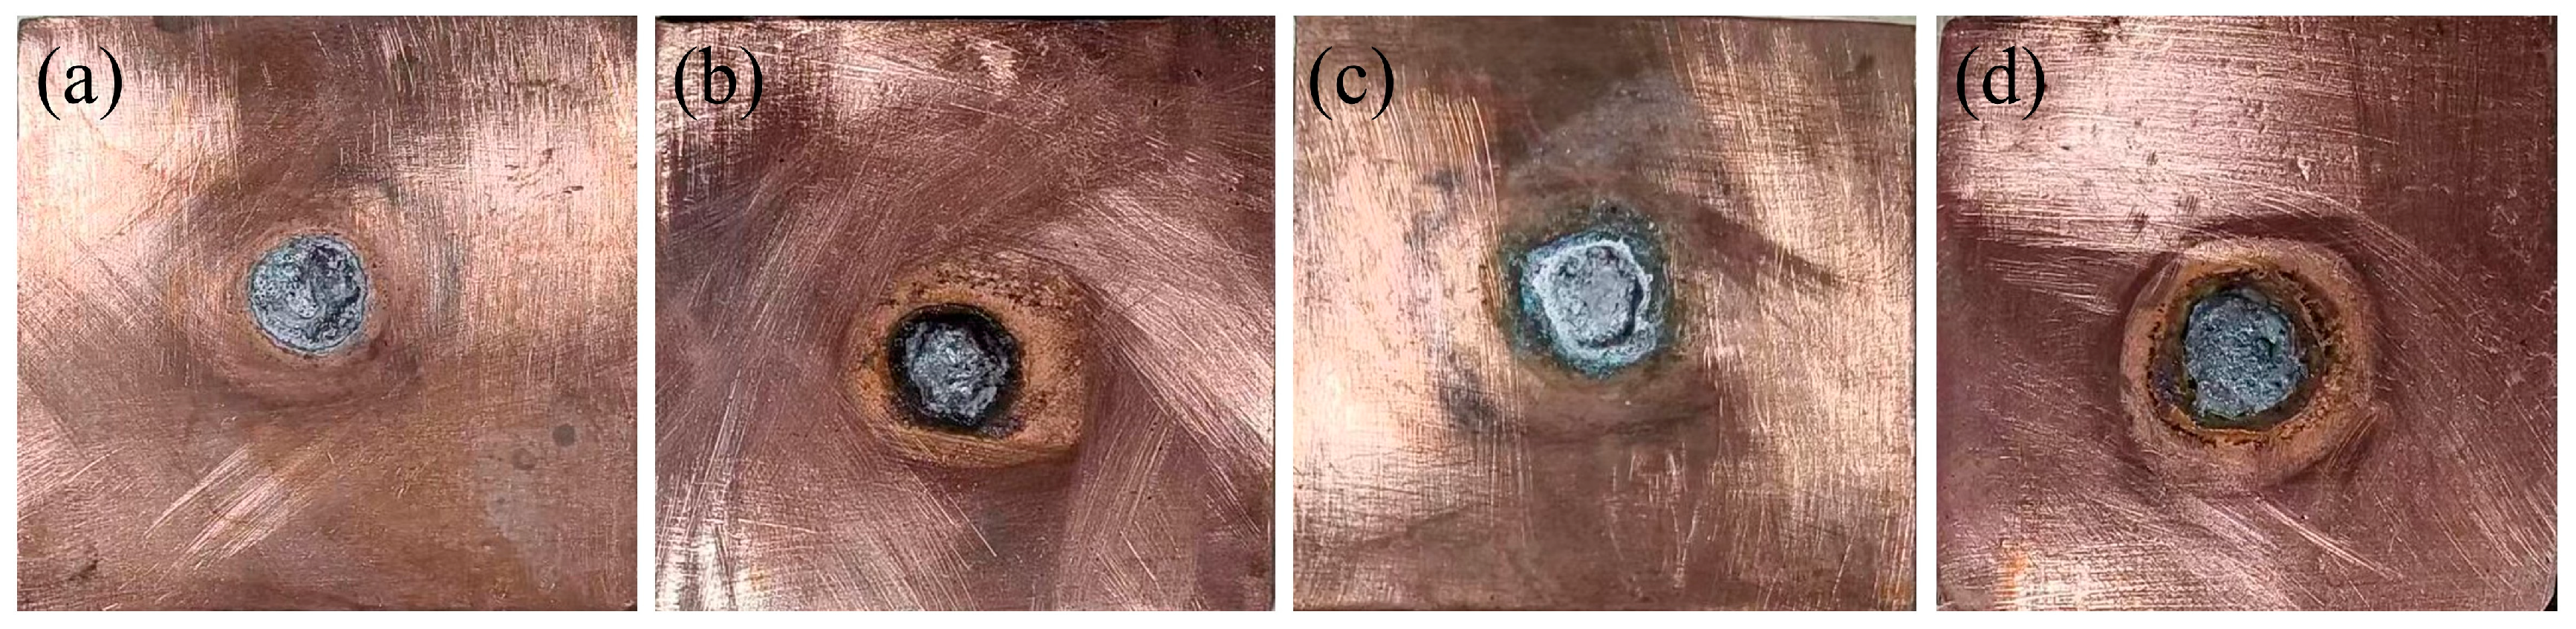
3.4. Wetting Ability
3.5. Corrosion Resistance
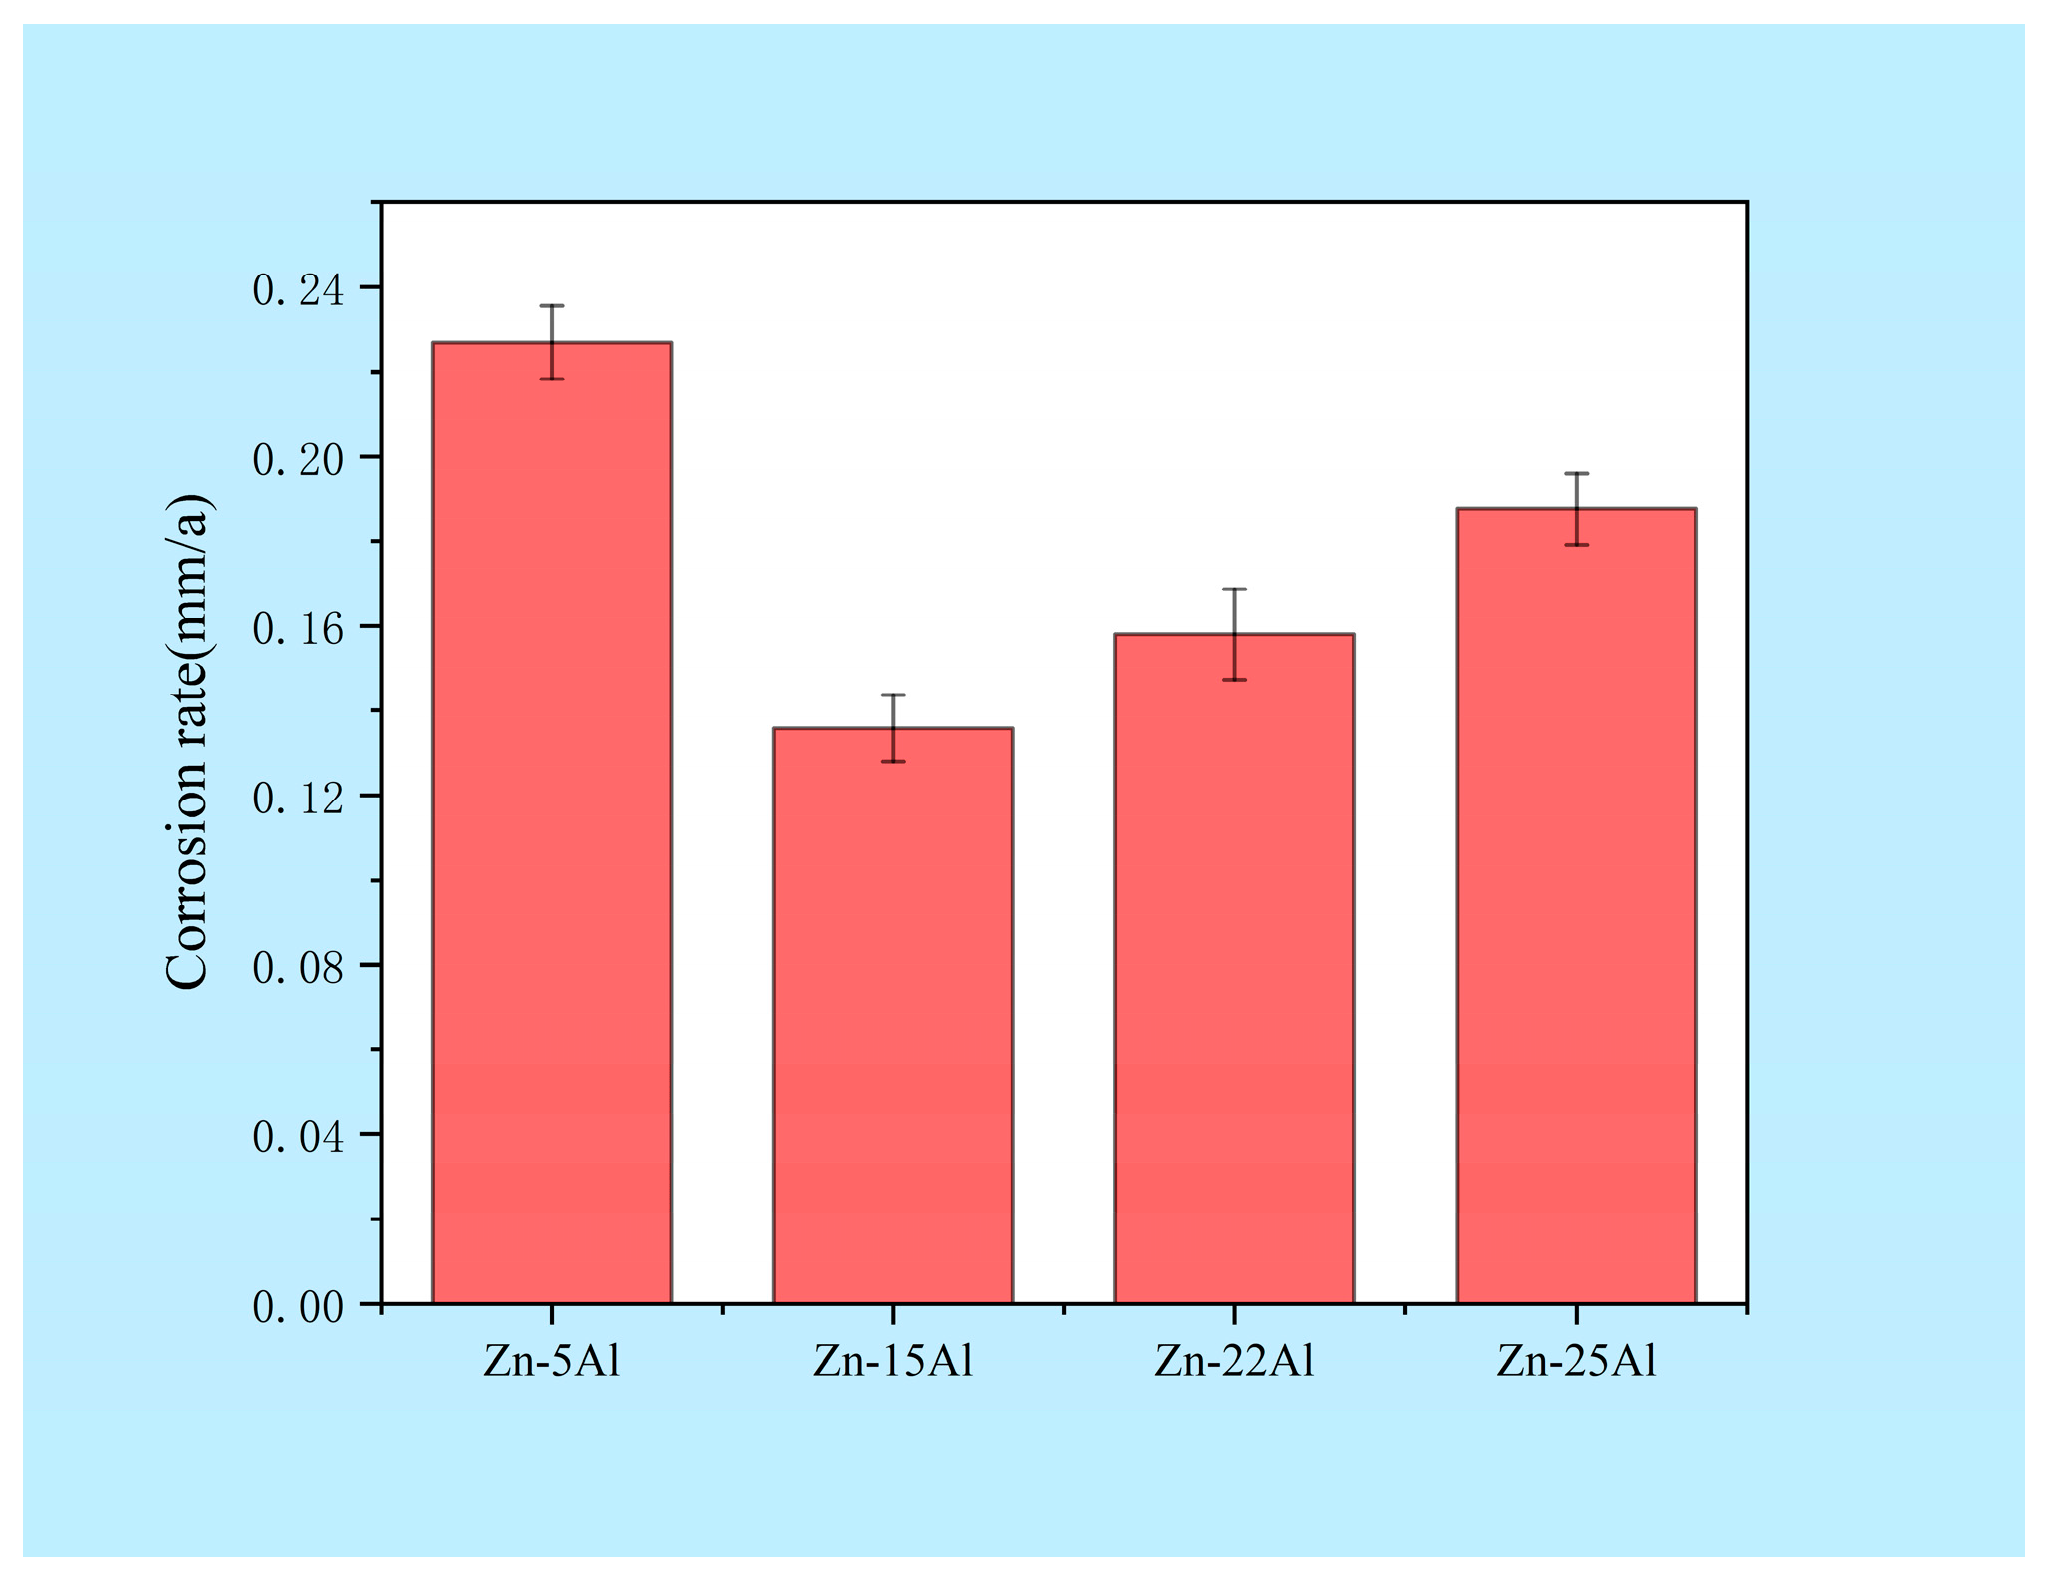
3.5.1. Effect of Al Content on the Rate of Self-Corrosion of Zn-Al Alloys
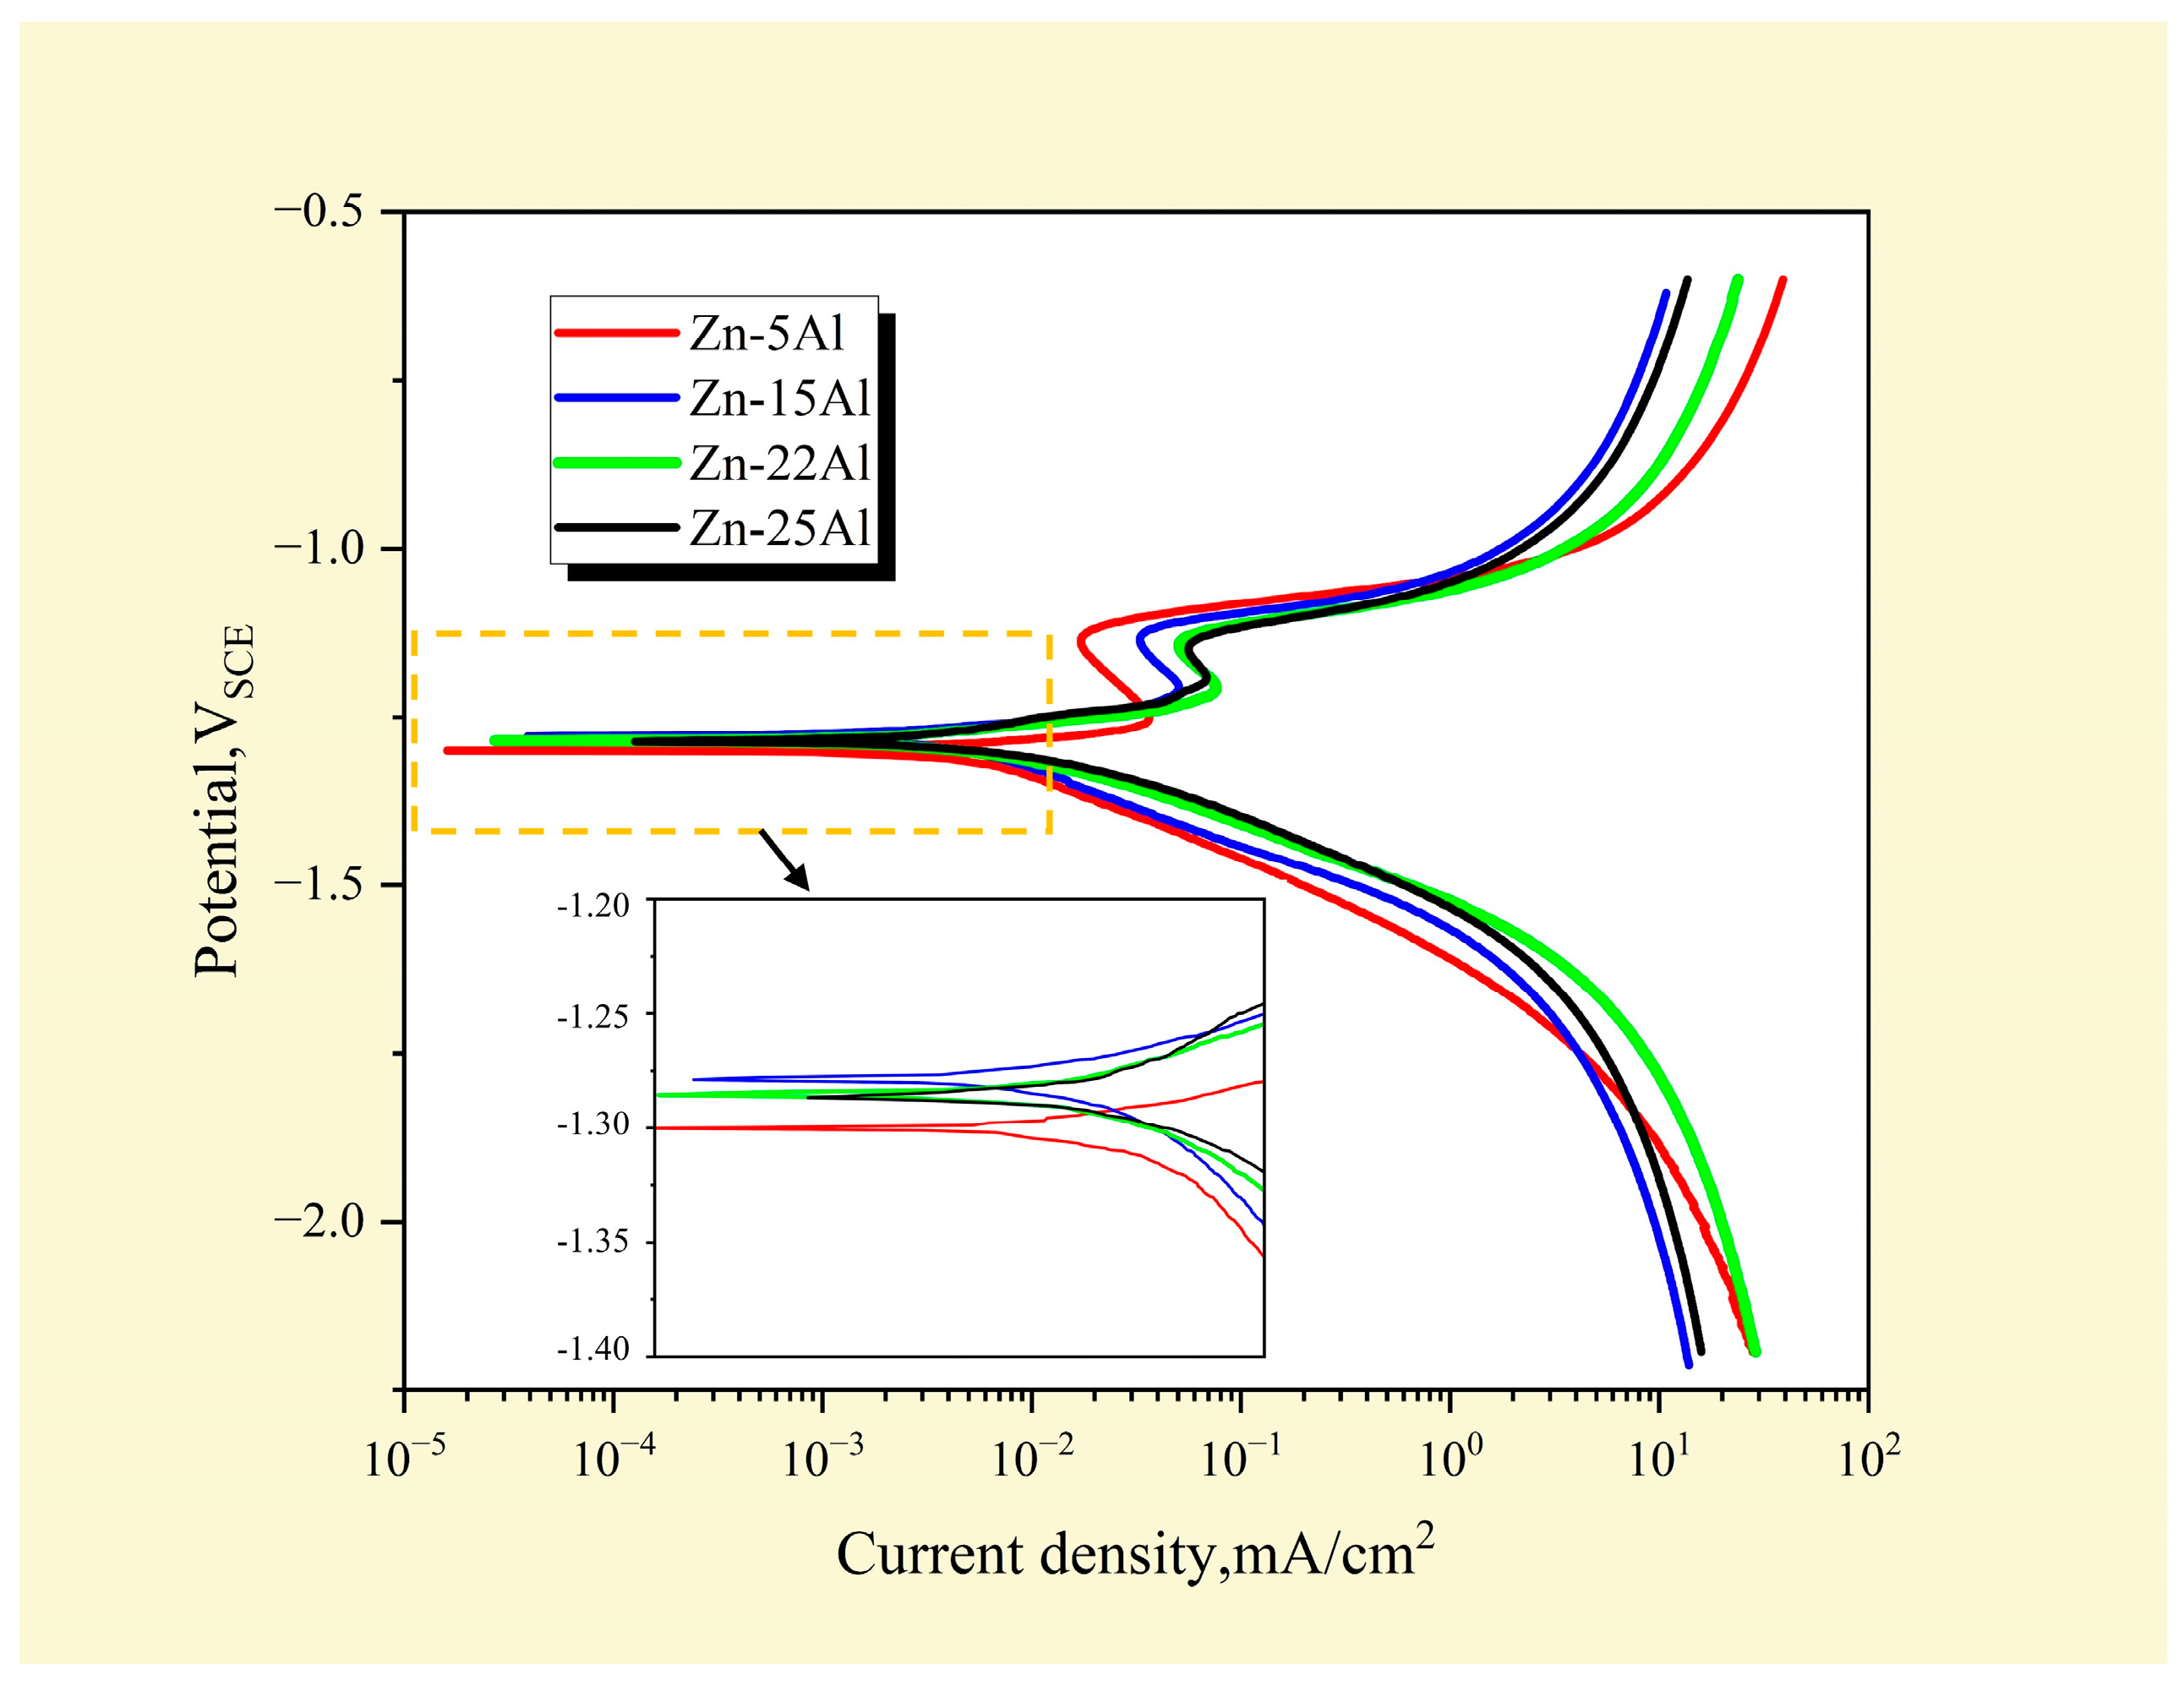
3.5.2. Effect of Al Content on the Self-Corrosion Potential of Alloys
4. Conclusions
Author Contributions
Funding
Data Availability Statement
Acknowledgments
Conflicts of Interest
References
- Liu, S.; Zhang, D.; Chu, B. Effect of the addition of Sb and rare-earth elements La and Nd on the properties of Cu/6061Al with Zn–10Al–5Cu filler metals. J. Mater. Sci. Mater. Electron. 2018, 29, 17137–17143. [Google Scholar] [CrossRef]
- Ye, Z.; Huang, J.; Yang, H.; Liu, T.; Yang, J.; Chen, S. Effect of Si addition on corrosion behavior-s of Cu/Al dissimilar joint brazed with novel Zn-Al-xSi filler metals. J. Mater. Res. Technol. 2019, 8, 5171–5179. [Google Scholar] [CrossRef]
- Yang, H.; Huang, J.; Chen, S.; Zhao, X.; Wang, Q.; Li, D. Influence of the composition of Zn-Al filler metal on the interfacial structure and property of Cu/Zn-Al/Al brazed joint. J. Acta Metall. Sin. 2015, 51, 364–370. [Google Scholar] [CrossRef]
- Xiao, Y.; Ji, H.; Li, M.; Kim, J. Ultrasound-assisted brazing of Cu/Al dissimilar metals using a Zn-3Al filler metal. Mater. Des. 2013, 52, 740–747. [Google Scholar] [CrossRef]
- Kim, D.; Baek, S.; Nishijima, M.; Lee, H.-C.; Geng, P.; Ma, N.; Zhang, Z.; Park, H.; Chen, C.; Lee, S.J.; et al. Toward defect-less and minimized work-hardening loss implementation of Al alloy/high-purity Cu dissimilar lap joints by refill friction stir spot welding for battery tab-to-busbar applications. Mater. Sci. Eng. A 2024, 892, 146089. [Google Scholar] [CrossRef]
- Liu, J.; Cao, B. Microstructure characteristics and mechanical properties of the Cu/Al dissimilar joints by electric current assisted ultrasonic welding. J. Mater. Process. Technol. 2021, 297, 117239. [Google Scholar] [CrossRef]
- You, J.; Zhao, Y.; Dong, C.; Su, Y. Improving the microstructure and mechanical properties of Al-Cu dissimilar joints by ultrasonic dynamic-stationary shoulder friction stir welding. J. Mater. Process. Technol. 2023, 311, 117812. [Google Scholar] [CrossRef]
- Ali, S.; Shin, J. Improvement in weld quality of Al and Cu joints using dual-beam laser welding. J. Manuf. Process. 2024, 119, 499–510. [Google Scholar] [CrossRef]
- Zhou, Y.; Li, C.; Shen, T.; Chen, D.; Wang, X.; Ma, Y. Interfacial microstructure of multi-layered Al–Cu joint by electromagnetic pulse welding. J. Mater. Res. Technol. 2023, 25, 2446–2454. [Google Scholar] [CrossRef]
- Dang, Z.; Qin, G.; Li, T. Microstructure evolution and tensile strength of Al/Cu inertia friction welded joint. J. Mater. Res. Technol. 2023, 27, 4023–4031. [Google Scholar] [CrossRef]
- Feng, M.; Wang, Z.; Ao, S.; Ren, L.; Wang, P. Ultrasonic spot welding of open-cell Cu foam and Al plate: A study on the quality of joints. J. Mater. Res. Technol. 2024, 29, 196–212. [Google Scholar] [CrossRef]
- Wang, X.; Yan, F.; Li, X.; Wang, C. Induction diffusion brazing of copper to aluminium. Sci. Technol. Weld. Join. 2017, 22, 170–175. [Google Scholar] [CrossRef]
- Xiao, Y.; Ji, H.; Li, M.; Kim, J. Ultrasound-induced equiaxial flower-like CuZn5/Al composite microstructure formation in Al/Zn-Al/Cu joint. Mater. Sci. Eng. A 2014, 594, 135–139. [Google Scholar] [CrossRef]
- Feng, J.; Xue, S.B.; Lou, J.Y.; Lou, Y.B.; Wang, S.Q. Microstructure and properties of Cu/Al joints brazed with Zn-Al filler metals. Trans. Nonferrous Met. Soc. 2012, 22, 281–287. [Google Scholar] [CrossRef]
- Schwartz, M.M. Brazing, 2nd ed.; ASM International: Materials Park, OH, USA, 2003. [Google Scholar]
- Geng, C.; Jia, Y.; Ma, X.; Jia, Y.; Mu, Y.; Wang, G.; Li, C.; Peng, J.; Bao, Q. Mechanical properties and oxidation resistance of Sn-Zn-xCu (2.3 ≤ x ≤ 20.2) solder alloys prepared by high-throughput strategy. Manuf. Lett. 2021, 27, 47–52. [Google Scholar] [CrossRef]
- Li, H.X.; Feng, Y.D.; Shen, W.J.; Lü, C.Y.; Zheng, W.J.; Gang, M.A.; Jin, Z.P.; He, Y.M.; Yang, J.G. Microstructure and mechanical properties of Cu/Al joints brazed using (Cu, Ni, Zr, Er)-modified Al—Si filler alloys. Trans. Nonferrous Met. Soc. China 2022, 32, 3623–3634. [Google Scholar] [CrossRef]
- Berlanga Labari, C.; Albístur Goñi, A.; Balerdi Azpilicueta, P.; Gutiérrez Peinado, M.; Fernandez Carrasquilla, J. Study and selection of the most appropriate filler materials for an Al/Cu brazing joint in cooling circuits. Mater. Manuf. Process. 2011, 26, 236–241. [Google Scholar] [CrossRef]
- Niu, Z.; Ye, Z.; Huang, J.; Yang, H.; Yang, J.; Chen, S. Interfacial structure and properties of Cu/Al joints brazed with Zn-Al filler metals. Mater. Charact. 2018, 138, 78–88. [Google Scholar] [CrossRef]
- Sun, H.; Yu, G.; Chen, S.; Huang, J.; Yang, J. Effect of Zn-Al filler metals on the characteristics of the joint made by the high-frequency induction brazing of 304 stainless steel and 6A02 aluminum. J. Manuf. Process. 2021, 68, 961–972. [Google Scholar] [CrossRef]
- Hasan, M.M.; Sharif, A.; Gafur, M.A. Characteristics of eutectic and near-eutectic Zn-Al alloys as high-temperature lead-free solders. J. Mater. Sci. Mater. Electron. 2020, 31, 1691–1702. [Google Scholar] [CrossRef]
- Huang, J.; Long, W.; Zhong, S. Effect of Al element in Zn-Al fillers on the corrosion resistance of Cu/Al brazed joints. J. Mech. Sci. Technol. 2020, 34, 711–717. [Google Scholar] [CrossRef]
- Yang, L.; Li, H.Y.; Jiang, H.F.; Lu, X.C. Effects of heat treatment on microstructure and mechanical properties of ZA27 alloy. Trans. Nonferrous Met. Soc. China 2013, 23, 642–649. [Google Scholar] [CrossRef]
- Zhang, Y.; Yang, L.; Zeng, X.; Zheng, B.; Song, Z. The mechanism of anneal-hardening phenomenon in extruded Zn-Al alloys. Mater. Des. 2013, 50, 223–229. [Google Scholar] [CrossRef]
- Yan, X.; Liu, S.; Long, W.; Huang, J.; Zhang, L.; Chen, Y. The effect of homogenization treatment on microstructure and properties of ZnAl15 solder. Mater. Des. 2013, 45, 440–445. [Google Scholar] [CrossRef]
- Yan, X.; Liu, S.; Long, W.; Huang, J.; Zhang, L.; Chen, Y. Stress corrosion crack of ZnAl15 alloys in hot and humid environment. Mater. Lett. 2013, 93, 183–186. [Google Scholar] [CrossRef]
- Sun, S.; Li, D.; Liu, D.; Yang, B.; Ren, Y.; Qin, G. Microstructure and mechanical properties of continuous casting and extrusion Zn–15 wt% Al alloys. Mater. Lett. 2020, 261, 127090. [Google Scholar] [CrossRef]
- Ge, Z.; Huang, C.; Qi, L.; Tang, L.; You, S.Y. Effects of Er addition and cooling rate on the corrosion resistance of Zn-5Al alloys. Mater. Sci. Technol. 2023, 39, 1030–1038. [Google Scholar] [CrossRef]
- Zhu, Y.; Hinojosa, J.; Yue, T.M.; Lee, W.B. Structural evolution in a continuously cast eutectoid Zn-Al-based alloy. Mater. Charact. 2002, 48, 315–322. [Google Scholar] [CrossRef]
- Zhang, M. The Effect of Al and Ag on the Properties of Zn-Al Solder and the Related Mechanism Study. Ph.D. Thesis, Nanjing University of Aeronautics and Astronautics, Nanjing, China, 2012. [Google Scholar]
- Yu, R.; Li, Y.; Liu, S.; Long, W.; Chen, Y. Microstructural and damp-heat corrosion characteristics of Zn-2 wt.% Al solder alloys containing trace Ag. Mater. Res. Express 2018, 6, 026550. [Google Scholar] [CrossRef]
- Peter, I.; Agapie, M.; Varga, B. Dendritic segregation of Zn-Al eutectoid alloys. Metals 2018, 8, 924. [Google Scholar] [CrossRef]
- Kang, N.; Na, H.S.; Kim, S.J.; Kang, C.Y. Alloy design of Zn-Al–Cu solder for ultra high temperatures. J. Alloys Compd. 2009, 467, 246–250. [Google Scholar] [CrossRef]
- Raeisinia, B.; Poole, W.; Lloyd, D.J. Examination of precipitation in the aluminum alloy AA6111 using electrical resistivity measurements. Mater. Sci. Eng. A 2006, 420, 245–249. [Google Scholar] [CrossRef]
- Wang, H.; Xue, S.; Chen, W.; Wang, J. Effect of Ag, Al, Ga addition on wettability of Sn-9 Zn lead-free solder. Trans. China Weld. Inst. 2007, 8, 33–36. [Google Scholar]
- Chen, W.; Xue, S.; Wang, H.; Hu, Y. Effects of Ag on properties of Sn-9Zn lead-free solder. Rare Met. Mater. Eng. 2010, 39, 1702–1706. [Google Scholar] [CrossRef]
- Gancarz, T.; Pstruś, J.; Fima, P.; Mosińska, S. Thermal properties and wetting behavior of high temperature Zn-Al-In solders. J. Mater. Eng. Perform. 2012, 21, 599–605. [Google Scholar] [CrossRef]
- Huang, S.; Long, W.; Lu, Q.; Jiu, Y.; Zhong, S.; Bao, L.; Zhao, Y. Research on the corrosion resistance of Cu-Al joints brazed with flux-cored Zn-2Al filler metal. Mater. Res. Express 2019, 6, 056560. [Google Scholar] [CrossRef]
- Zhou, X.; Shi, W.; Xiang, S. Improving corrosion resistance of Zn–5Al (wt.%) alloy by microalloying with samarium. J. Rare Earth 2023, 41, 1636–1644. [Google Scholar] [CrossRef]
- Perez, N. Electrochemistry and Corrosion Science; Springer: Berlin, Germany, 2004; p. 412. [Google Scholar]
- Yu, Z.Y.; Zheng, K.H.; Li, X.T.; Xia, P.; Xu, J.; Sun, J.; Zhou, N.; Pan, F. Effect of Ti6Al4V reinforcement particles on the mechanical, wear, and corrosion properties of AZ91D magnesium matrix composites. J. Mater. Res. Technol. 2023, 26, 7395–7411. [Google Scholar] [CrossRef]
- Rosalbino, F.; Angelini, E.; Macciò, D.; Saccone, A.; Delfino, S. Application of EIS to assess the effect of rare earths small addition on the corrosion behaviour of Zn–5% Al (Galfan) alloy in neutral aerated sodium chloride solution. Electrochim. Acta 2009, 54, 1204–1209. [Google Scholar] [CrossRef]
- Yang, L.J.; Zeng, X.D.; Zhang, Y.M.; He, J.; Song, Z.L. Evolution of atmospheric corrosion of superplastic Zn-Al alloys exposed to an industrial environment. Mater. Corros. 2015, 66, 1169–1180. [Google Scholar] [CrossRef]
- Yao, C.; Tay, S.L.; Zhu, T.; Shang, H.; Gao, W. Effects of Mg content on microstructure and electrochemical properties of Zn-Al–Mg alloys. J. Alloys Compd. 2015, 645, 131–136. [Google Scholar] [CrossRef]


| Location | Zn | Al |
|---|---|---|
| 1 | 97.26 | 2.74 |
| 2 | 96.02 | 3.98 |
| 3 | 74.69 | 25.31 |
| 4 | 75.14 | 24.86 |
| Location | Zn | Al |
|---|---|---|
| 5 | 92.57 | 7.43 |
| 6 | 93.12 | 6.88 |
| 7 | 35.67 | 64.33 |
| 8 | 34.82 | 65.18 |
| 9 | 26.79 | 73.21 |
| Sample | Zn-5Al | Zn-15Al | Zn-22Al | Zn-25Al |
|---|---|---|---|---|
| Rm (MPa) | 210 | 233 | 221 | 231 |
| Rp 0.2(MPa) | 152 | 167 | 161 | 165 |
| Elongation (%) | 115.2 | 116.88 | 139.8 | 107.48 |
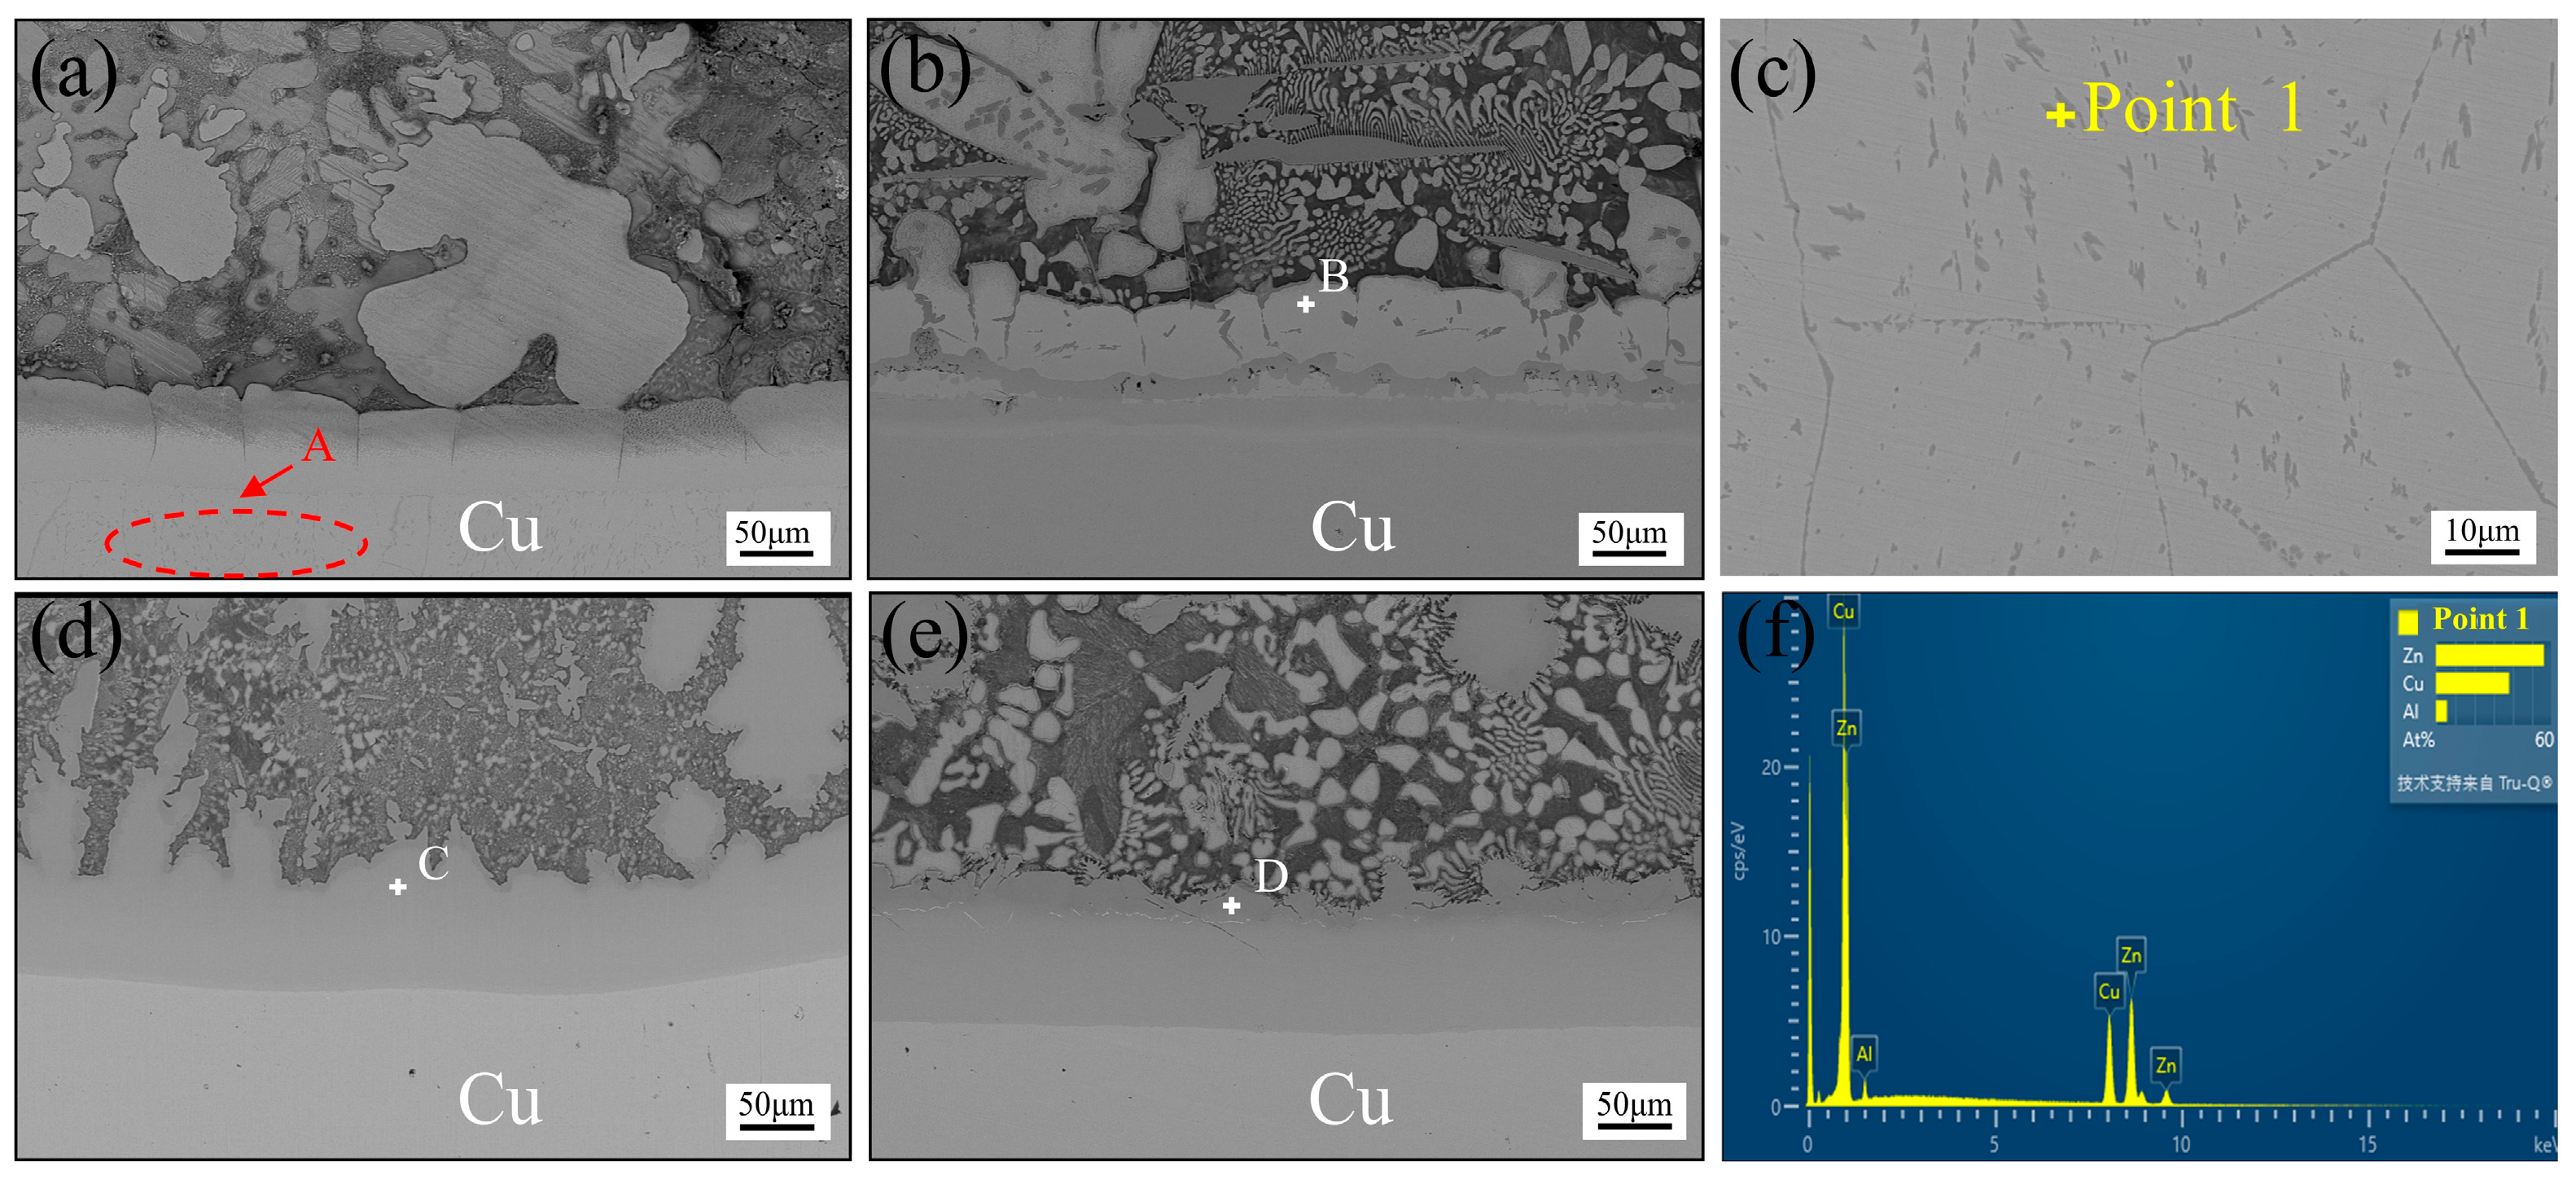
| Location | Zn | Cu | Al |
|---|---|---|---|
| A (Point 1) | 56.20 | 38.06 | 5.74 |
| B | 66.61 | 24.92 | 8.47 |
| C | 17.10 | 44.12 | 38.78 |
| D | 8.88 | 39.03 | 52.09 |
| Sample | Icorr/μA·cm−2 | Ecorr/VSCE |
|---|---|---|
| Zn-5Al | 10.21 | −1.31 |
| Zn-15Al | 5.64 | −1.28 |
| Zn-22Al | 9.09 | −1.28 |
| Zn-25Al | 11.47 | −1.29 |
Disclaimer/Publisher’s Note: The statements, opinions and data contained in all publications are solely those of the individual author(s) and contributor(s) and not of MDPI and/or the editor(s). MDPI and/or the editor(s) disclaim responsibility for any injury to people or property resulting from any ideas, methods, instructions or products referred to in the content. |
© 2024 by the authors. Licensee MDPI, Basel, Switzerland. This article is an open access article distributed under the terms and conditions of the Creative Commons Attribution (CC BY) license (https://creativecommons.org/licenses/by/4.0/).
Share and Cite
Zhai, Y.; Wang, T.; Liu, M.; Zhou, N.; Li, X. Effect of Al Content on the Microstructure and Properties of Zn-Al Solder Alloys. Metals 2024, 14, 689. https://doi.org/10.3390/met14060689
Zhai Y, Wang T, Liu M, Zhou N, Li X. Effect of Al Content on the Microstructure and Properties of Zn-Al Solder Alloys. Metals. 2024; 14(6):689. https://doi.org/10.3390/met14060689
Chicago/Turabian StyleZhai, Yunlong, Tianguo Wang, Mingyang Liu, Nan Zhou, and Xintao Li. 2024. "Effect of Al Content on the Microstructure and Properties of Zn-Al Solder Alloys" Metals 14, no. 6: 689. https://doi.org/10.3390/met14060689
APA StyleZhai, Y., Wang, T., Liu, M., Zhou, N., & Li, X. (2024). Effect of Al Content on the Microstructure and Properties of Zn-Al Solder Alloys. Metals, 14(6), 689. https://doi.org/10.3390/met14060689