Article

A Model for the Temperature Distribution in a Rolled Joint in a CANDU Reactor Exploiting the Decomposition of the β-Zr Phase

by
Glenn A. McRae
*,
Malcolm Griffiths
and
Christopher E. Coleman
Mechanical and Aerospace Engineering, Carleton University, Ottawa, ON K1S 5B6, Canada
*
Author to whom correspondence should be addressed.
Metals 2024, 14(6), 692; https://doi.org/10.3390/met14060692
Submission received: 1 May 2024 / Revised: 25 May 2024 / Accepted: 7 June 2024 / Published: 11 June 2024

Abstract

:
A competing-rates model is presented to account for operational changes in the metastable β-Zr phase of the Zr-2.5Nb alloy used to make CANDU reactor pressure tubes and is used to predict temperature gradients at the outlet rolled joints using the decomposition of the β-Zr phase as a proxy for temperature. High temperatures decompose the β phase by enhancing the formation of small particles of ω and α phases. Fast neutron flux causes the ω and α phases to shrink. This process is assumed to depend on the total volume of the particles, because they are comparable to, or smaller than, the size of the neutron displacement cascades. The barrier energy for thermal growth was determined to be 2.43 eV, when an Arrhenius A factor of 1013/s was assumed. The cross section for (ω+α)-phase shrinkage is 24.5 barns for Zr-2.5Nb irradiated in CANDU reactors. Assuming that the shrinkage is dominated by the migration of self-interstitial point defects, a defect production efficiency of 1.4% was found.

1. Introduction

In July 2021, Bruce Power reported high concentrations of hydrogen isotopes, Heq, in the Zr-2.5Nb pressure tubes of some rolled joints in Units 3 and 6 that were beyond licensing limits of 120 ppm up to 211 ppm [1], where ppm has units of mg Heq/kg Zr, and where Heq equals the protium concentration plus one half of the deuterium concentration. In the same month, the Canadian Nuclear Safety Commission (CNSC) issued an order requiring that, prior to restart, reactor operators needed to demonstrate that (a) hydrogen isotope concentrations were within allowed limits and/or (b) that no flaws were present in the regions where the industry models failed to conservatively predict elevated hydrogen isotope concentrations [2]. It was the opinion of CNSC staff that the industry “does not have a mechanistic understanding of the phenomenon nor validated models as a result of this finding” of elevated Heq in the Zr-2.5Nb alloy at the rolled joints of some pressure tubes [3].
The concentration of hydrogen isotopes at the outlet rolled joints is higher at the top of the horizontally aligned tubes (i.e., at the 12 o’clock positions when viewed in axial directions) than at the bottoms (i.e., 6 o’clock positions) by up to 200 ppm [1]. This circumferential variation in Heq is thought to result from a circumferential temperature gradient [1] with the top of the tube about 20 K colder than the bottom. Temperatures are difficult to measure directly during reactor operation, but the temperature can be inferred from the thermal decomposition of the β-Zr phase.
The Zr-2.5Nb used to make CANDU pressure tubes is a multi-phase alloy composed predominantly of elongated α-zirconium grains surrounded intermittently by metastable β zirconium in which the Nb concentration is enriched. The method used to produce CANDU pressure tubes is described in [4]. For temperatures below 750 K, the metastable β phase transforms over time into ω phase [5,6,7,8]. The ω phase appears as small particles that are depleted in β-stabilizing elements such as Fe and Nb, which are subsequently enriched in the remaining β phase (see Figure 1). During the transformation process, the concentration of Fe and Nb in the β phase continues to increase because these elements, which are expelled by the growing depleted regions, are dispersed over a smaller volume of remaining β phase. Eventually, the small ω phase particles transform to α-phase, and finally only α-phase and fully transformed β phase (β-Nb) remain. Neutron irradiation acts in opposition to this thermal decomposition of the β phase. There is evidence that irradiation decreases the volume fraction of the ω and α phases and simultaneously decreases the niobium concentration in the surrounding β region [9,10]. The purpose of this paper is to develop and test a simple ‘competing-rates’ model to explain these observations in the β phase and then to use this model to estimate circumferential temperature gradients at the outlet rolled joints.

2. Experimental

The data analyzed in this study have been reported elsewhere. The unirradiated Zr-2.5Nb samples were cut from as-extruded CANDU pressure tubes that were fabricated from β-quenched hollow billets (i.e., water quenched from 1323 K in the β phase and extruded in the (α + β) phase at 1093 K). The tubes were 27% cold worked, but they did not receive the final 24 h 673 K autoclave treatment that provides stress relief and a protective surface oxide as tubes receive before installation. The irradiated samples were cut from tubes removed from CANDU reactors. The %Nb composition of the enriched β phase used in this study was the average of the values determined by analysis of the reflections from the (200) and (110) planes associated with β-phase X-ray diffraction lines. The measurements can be found in Table 1, Table 2 and Table 3 along with corresponding variables such as fluence, time, and temperature.

3. Theory

Neutron irradiation produces a cascade of displaced atoms in a metal. After the cascade, when the initial neutron collision event has subsided, most of the displaced atoms will have returned to equivalent lattice positions so that the net displacement mixing of atoms is small [12]. For atoms displaced across a phase boundary, the result is that the boundary becomes more diffuse; the concentrations at the boundary will no longer change as abruptly. This is a local effect that depends on the size and energy of the cascade, as well as the annealing temperature and time. In this study, the phase boundaries are interfaces between particles and their surroundings. The particles are comprised of ω and α phases, both of which have hexagonal-close-packed (hcp) crystal structures, and the surrounding matrix is in the body-centered-cubic (bcc) β phase. The current study develops a model of the formation and dissolution of hcp phases in the bcc β phase because of irradiation and temperature.
Cascade mixing by ballistic transport at an interface occurs to a depth similar to the extent of the cascade. For large particles, the total volume affected would be roughly equal to this depth multiplied by the particle surface area, summed over the particle size distribution. However, if the particle sizes are similar to, or much smaller than, the extent of the neutron-displacement cascade, then the total volume effected is just the total volume of the small particles. The size of the hcp particles that grow in the bcc β-Zr phase [5,6,7,8] is smaller than, or similar to, the size of the neutron-displacement cascade [12], and hence, the ballistic mixing probability is assumed to depend on the total volume of these particles. Neutron bombardment shrinks the small hcp particles and thereby reduces their volume at a rate that then should be proportional to the neutron flux and the number of atoms in the hcp phase. Opposing this reduction is the thermal process, which is assumed to have an Arrhenius rate that depends on how far the system is from equilibrium. It has been suggested that this behavior can be understood by simple models in which the thermal rate to form precipitates is counteracted by ballistic transport [13].
Within the bcc β phase, the ω and α hcp-phases grow and evaporate subject to thermal and irradiation effects. Thermally, the metastable bcc β phase decomposes. The decomposition may or may not involve ω phase formation depending on the geometry of the phase, which controls the proximity of surfaces. The bcc β phase shrinks as the Nb concentration increases until thermal equilibrium is achieved. Typically, for temperatures below the monotectoid, the equilibrium Nb concentration is between 85 and 95 at% and there is no ω phase remaining even if some formed as an intermediate part of the decomposition [10]. During the fabrication of Zr-2.5Nb pressure tubes, after extrusion and cold-drawing, the beta-phase has a Nb concentration of about 30% Nb [8] and contains no ω phase. It is a metastable phase often referred to as β-Zr. During the final stress-relief treatment (nominally 24 h at 673 K) the ω phase nucleates and grows at the expense of the bcc phase. The whole structure is in a metastable state whether or not it contains ω phase. The ω phase shrinks when irradiated with neutrons and one expects some mixing at the α/β interface so that the overall effect is to reduce the Nb concentration and increase the volume fraction of the bcc component of the β phase. The rate of change in the number of atoms in the hcp phase, n hcp , is presumed to obey a rate equation in terms of a temperature-dependent gain and a neutron-flux dependent loss:
d n hcp d t = k ( T ) ( n bcc n bcc eq ) σ Φ n hcp
k(T) is a temperature-dependent rate constant (s−1) that is assumed to follow Arrhenius behavior with a frequency factor A and an activation energy E:
k ( T ) = A exp E R T
where R = 8.63 × 10⁻⁵ eV K−1atom−1 (8.314 J K−1mole−1), σ is a ‘reactor-dependent’ cross section (barns = 10−28 m2), Φ is the fast neutron flux in number of neutrons per m2s for energies greater than 1 MeV, and n bcc eq is the equilibrium number of atoms in the bcc phase, n bcc . For the present purpose, the ω and α phases are treated as a single hcp phase.
The hcp particles are presumed to grow or shrink within the confines of the metastable bcc β phase such that
n T = n hcp + n bcc
where n T is the total number of atoms. Equation (3) can be rearranged so that n bcc can be eliminated in Equation (1) by substitution. The result can be integrated given the limits   i n hcp at time zero and   f n hcp at time t. The solution is
  f n hcp =   i n hcp k ( T ) ( n T n bcc eq ) σ Φ + k ( T ) exp [ ( σ Φ + k ( T ) ) t ] + k ( T ) ( n T n bcc eq ) σ Φ + k ( T )
The first term is the transient, which ‘decays’ to a small contribution for large values of the exponential argument, i.e., high fluence (Φ × t) or high thermal rate and long times. The second term is the ‘steady state’ solution.
The fractional concentration of niobium in the bcc β phase can be related to the amount of the hcp phase, because as the ω phase particles grow, niobium is expelled and concentrated in the remaining β phase, and as the ω phase particles shrink the niobium is diluted over the increased volume of the β phase. The monotectoid Nb concentration is approximately 20% (by weight or by atom percent) [14]: this is the percentage of niobium in the β phase when the amount of the hcp phase is zero. The total amount of Nb is 0.20 n T and the fractional concentration of niobium in the β phase is
N β = 0.20 n T n T   f n hcp
where it is assumed that the niobium concentration in the hcp phase is negligible. The initial fractional Nb concentration,   i N β , can be obtained by substituting n hcp =   i n hcp into Equation (5), which can then be rearranged to give
  i n hcp = n T ( 1 0.20   i N β )
In the same way, with the equilibrium fractional Nb concentration, N β eq , at the reactor-operating temperatures:
n hcp eq = n T ( 1 0.20 N β eq )
so that with Equation (3)
n T n bcc eq = ( 1 0.20 N β eq ) n T
Substitution of Equations (6) and (8) into (4) and the result into (5) yields the model equation:
N β = 0.20 / 1 ( 1 0.20   i N β ) ( 1 0.20 N β eq ) k ( T ) σ Φ + k ( T ) exp [ ( σ Φ + k ( T ) ) t ] ( 1 0.20 N β eq ) k ( T ) σ Φ + k ( T )
The model equation is a function of flux, fluence, time, and temperature, although of the first three variables only two are independent.

4. Results

The model given by Equation (9) was tested with the experimental data in Table 1, Table 2 and Table 3 using weighted non-linear least squares regression; the determined model parameters are listed in Table 4. The experimental values of Nβ used in this study were the averages of the measured values determined from β-phase diffraction lines from the (200) plane that is normal to the radial direction of the tube and the (110) plane that is normal to the longitudinal direction of the tube: the average compensates for intergranular stresses [8]. Each measured value was assumed to have 7% experimental error, which was used to weight each datum in the regression. The weighted χ2 per degree of freedom was 1.9 for the regression; R2 was 0.93.
The data analyzed in this study were all obtained from specimens taken from commercial CANDU pressure tubes. The unirradiated material is described in [8,11]; it came from a tube manufactured in the usual way, except it did not receive the final 24 h anneal at 673 K so that iNβ for these measurements was expected to be lower than the typical value for installed tubes. The value prior to the anneal should be closer to the monotectoid composition (≈20% [14]); the anneal partially decomposes the β phase making iNβ higher for tubes installed in a reactor. The values of iNβ obtained from the regression are consistent with these expectations (see Table 4). The value obtained for iNβ for the ex-service tubes was within the range of the few measurements available from offcut analyses and is consistent with the value expected because of the 673 K pre-installation heat treatment received by the pressure tubes [6]. The precision of the experimentally determined value suggests that the average initial β-phase variability in the tubes is small.
It was not possible to determine A and E independently from the current data, so in the least-squares regression, the pre-exponential factor in the Arrhenius expression, A, was fixed at 1013s−1 because it is expected to be roughly equal to the ‘effective’ atomic vibration frequency [12,15].
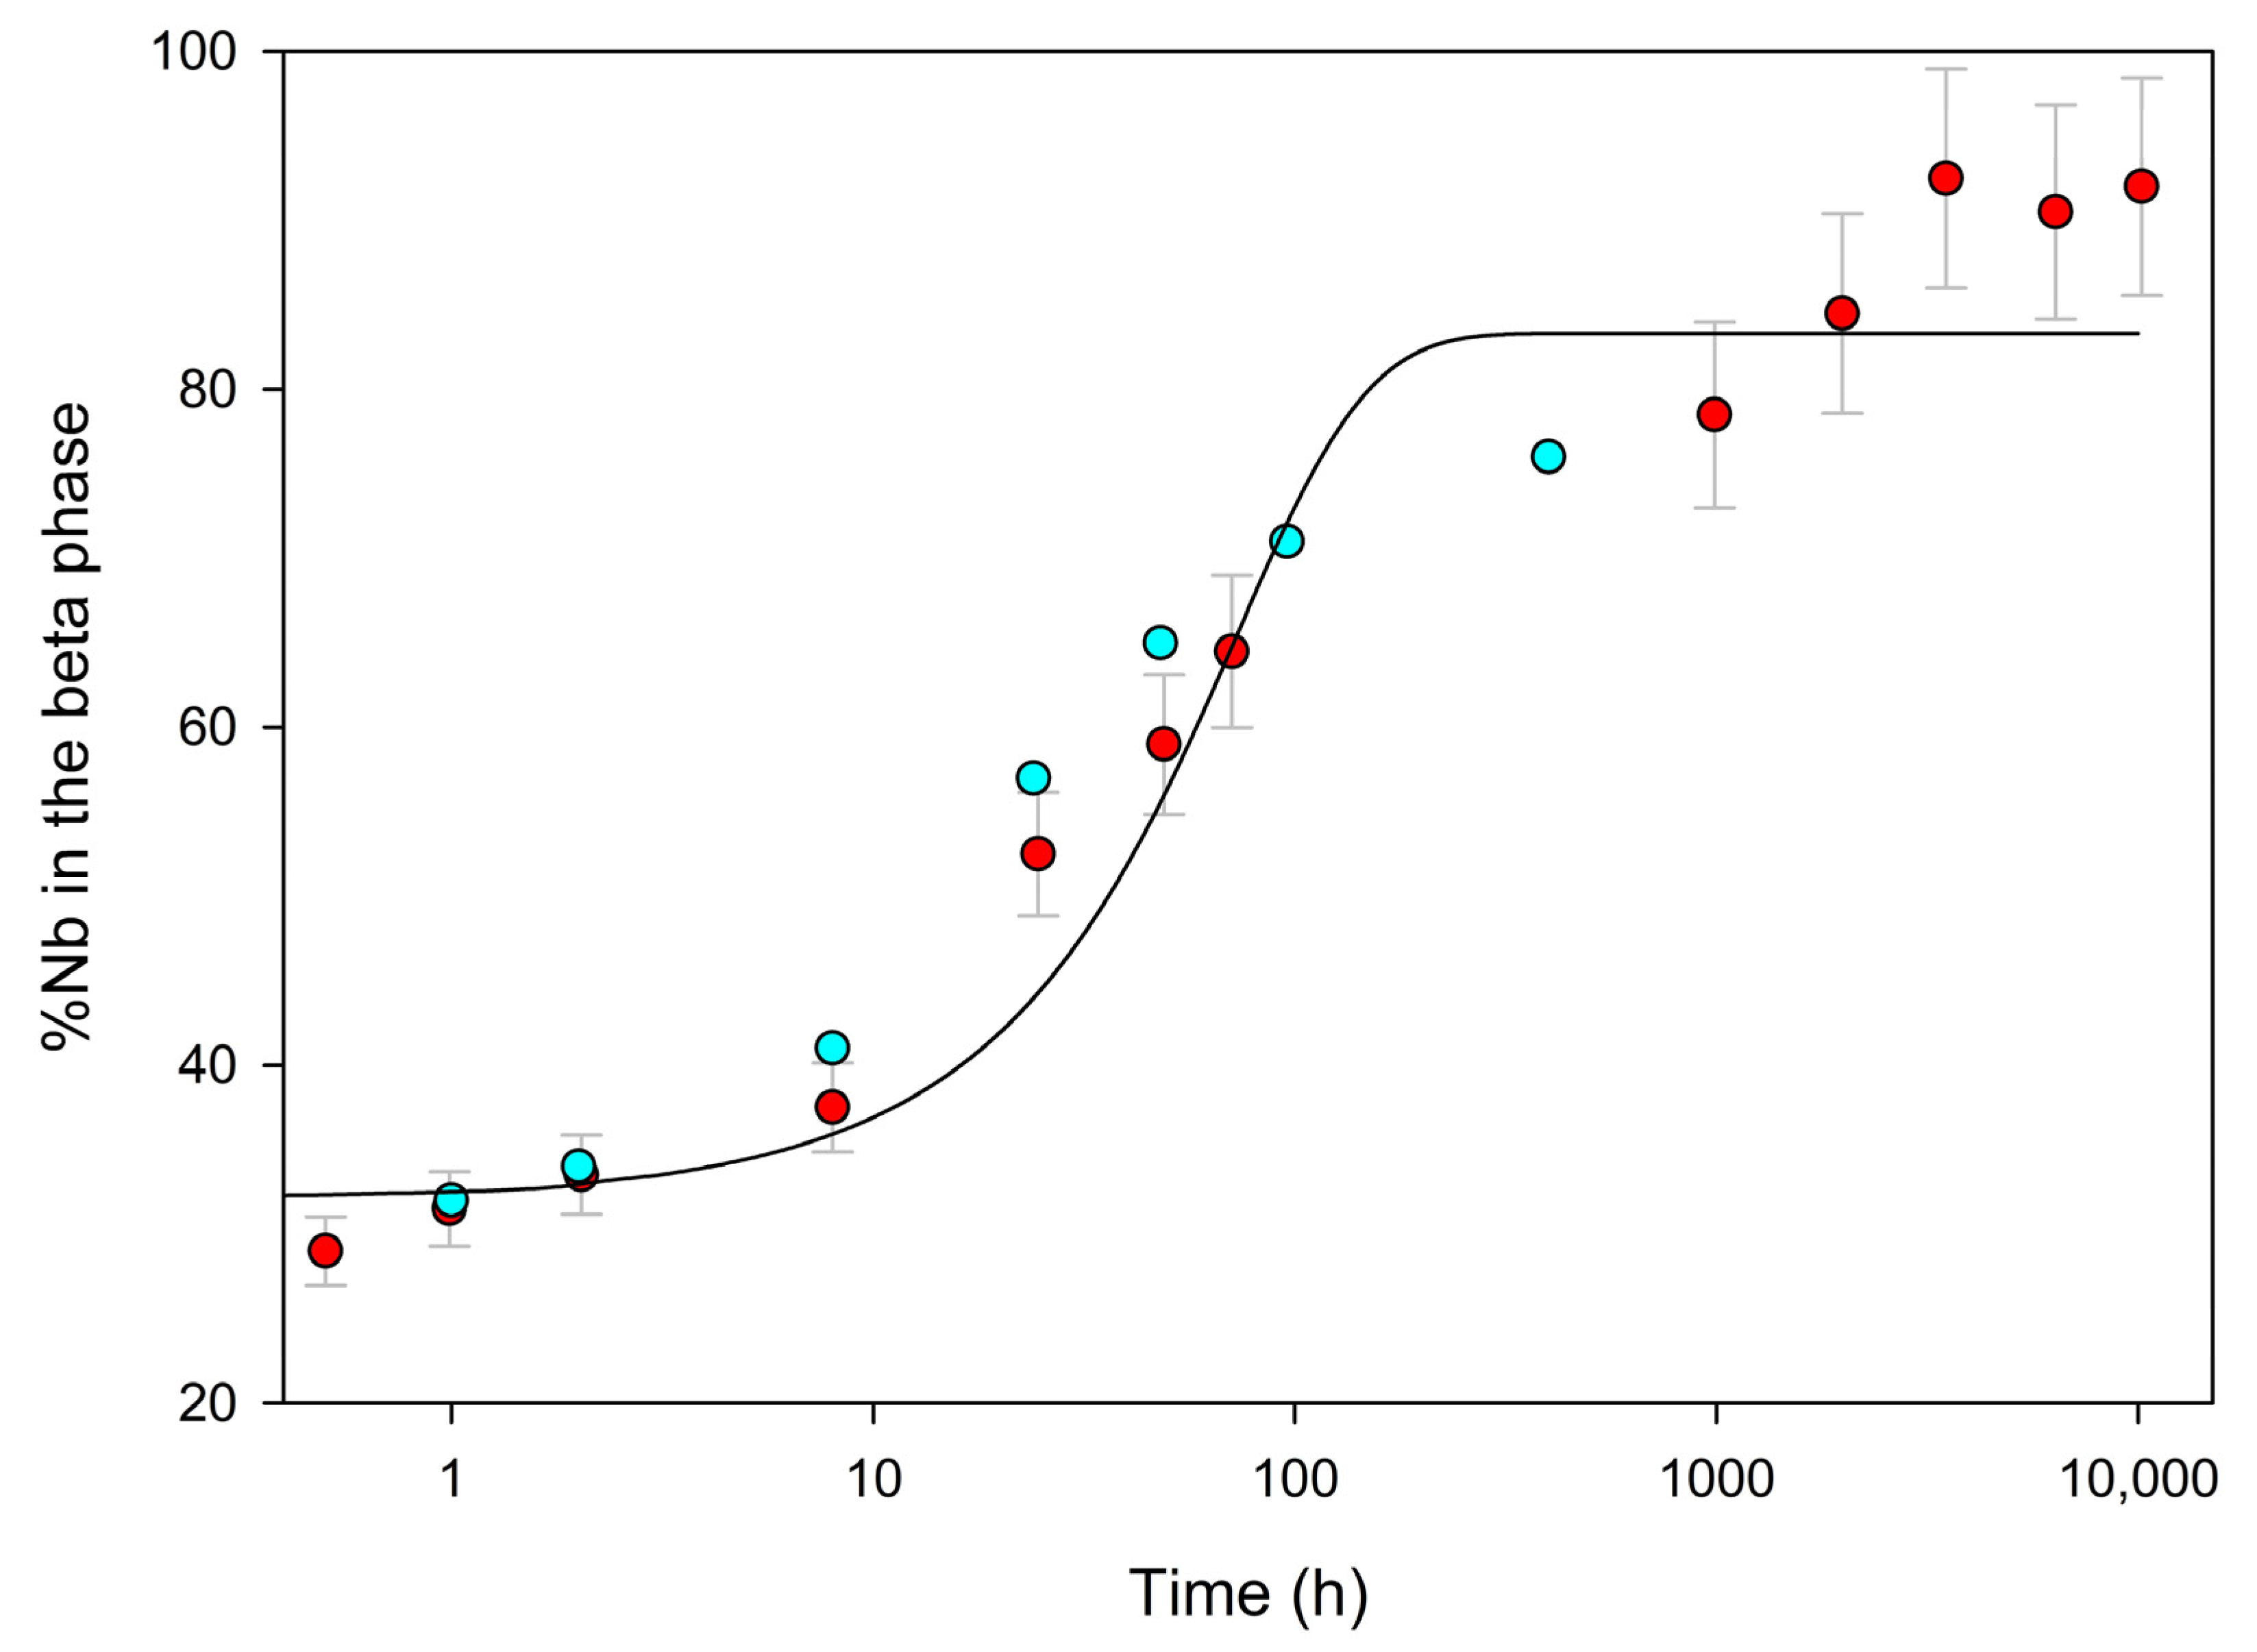
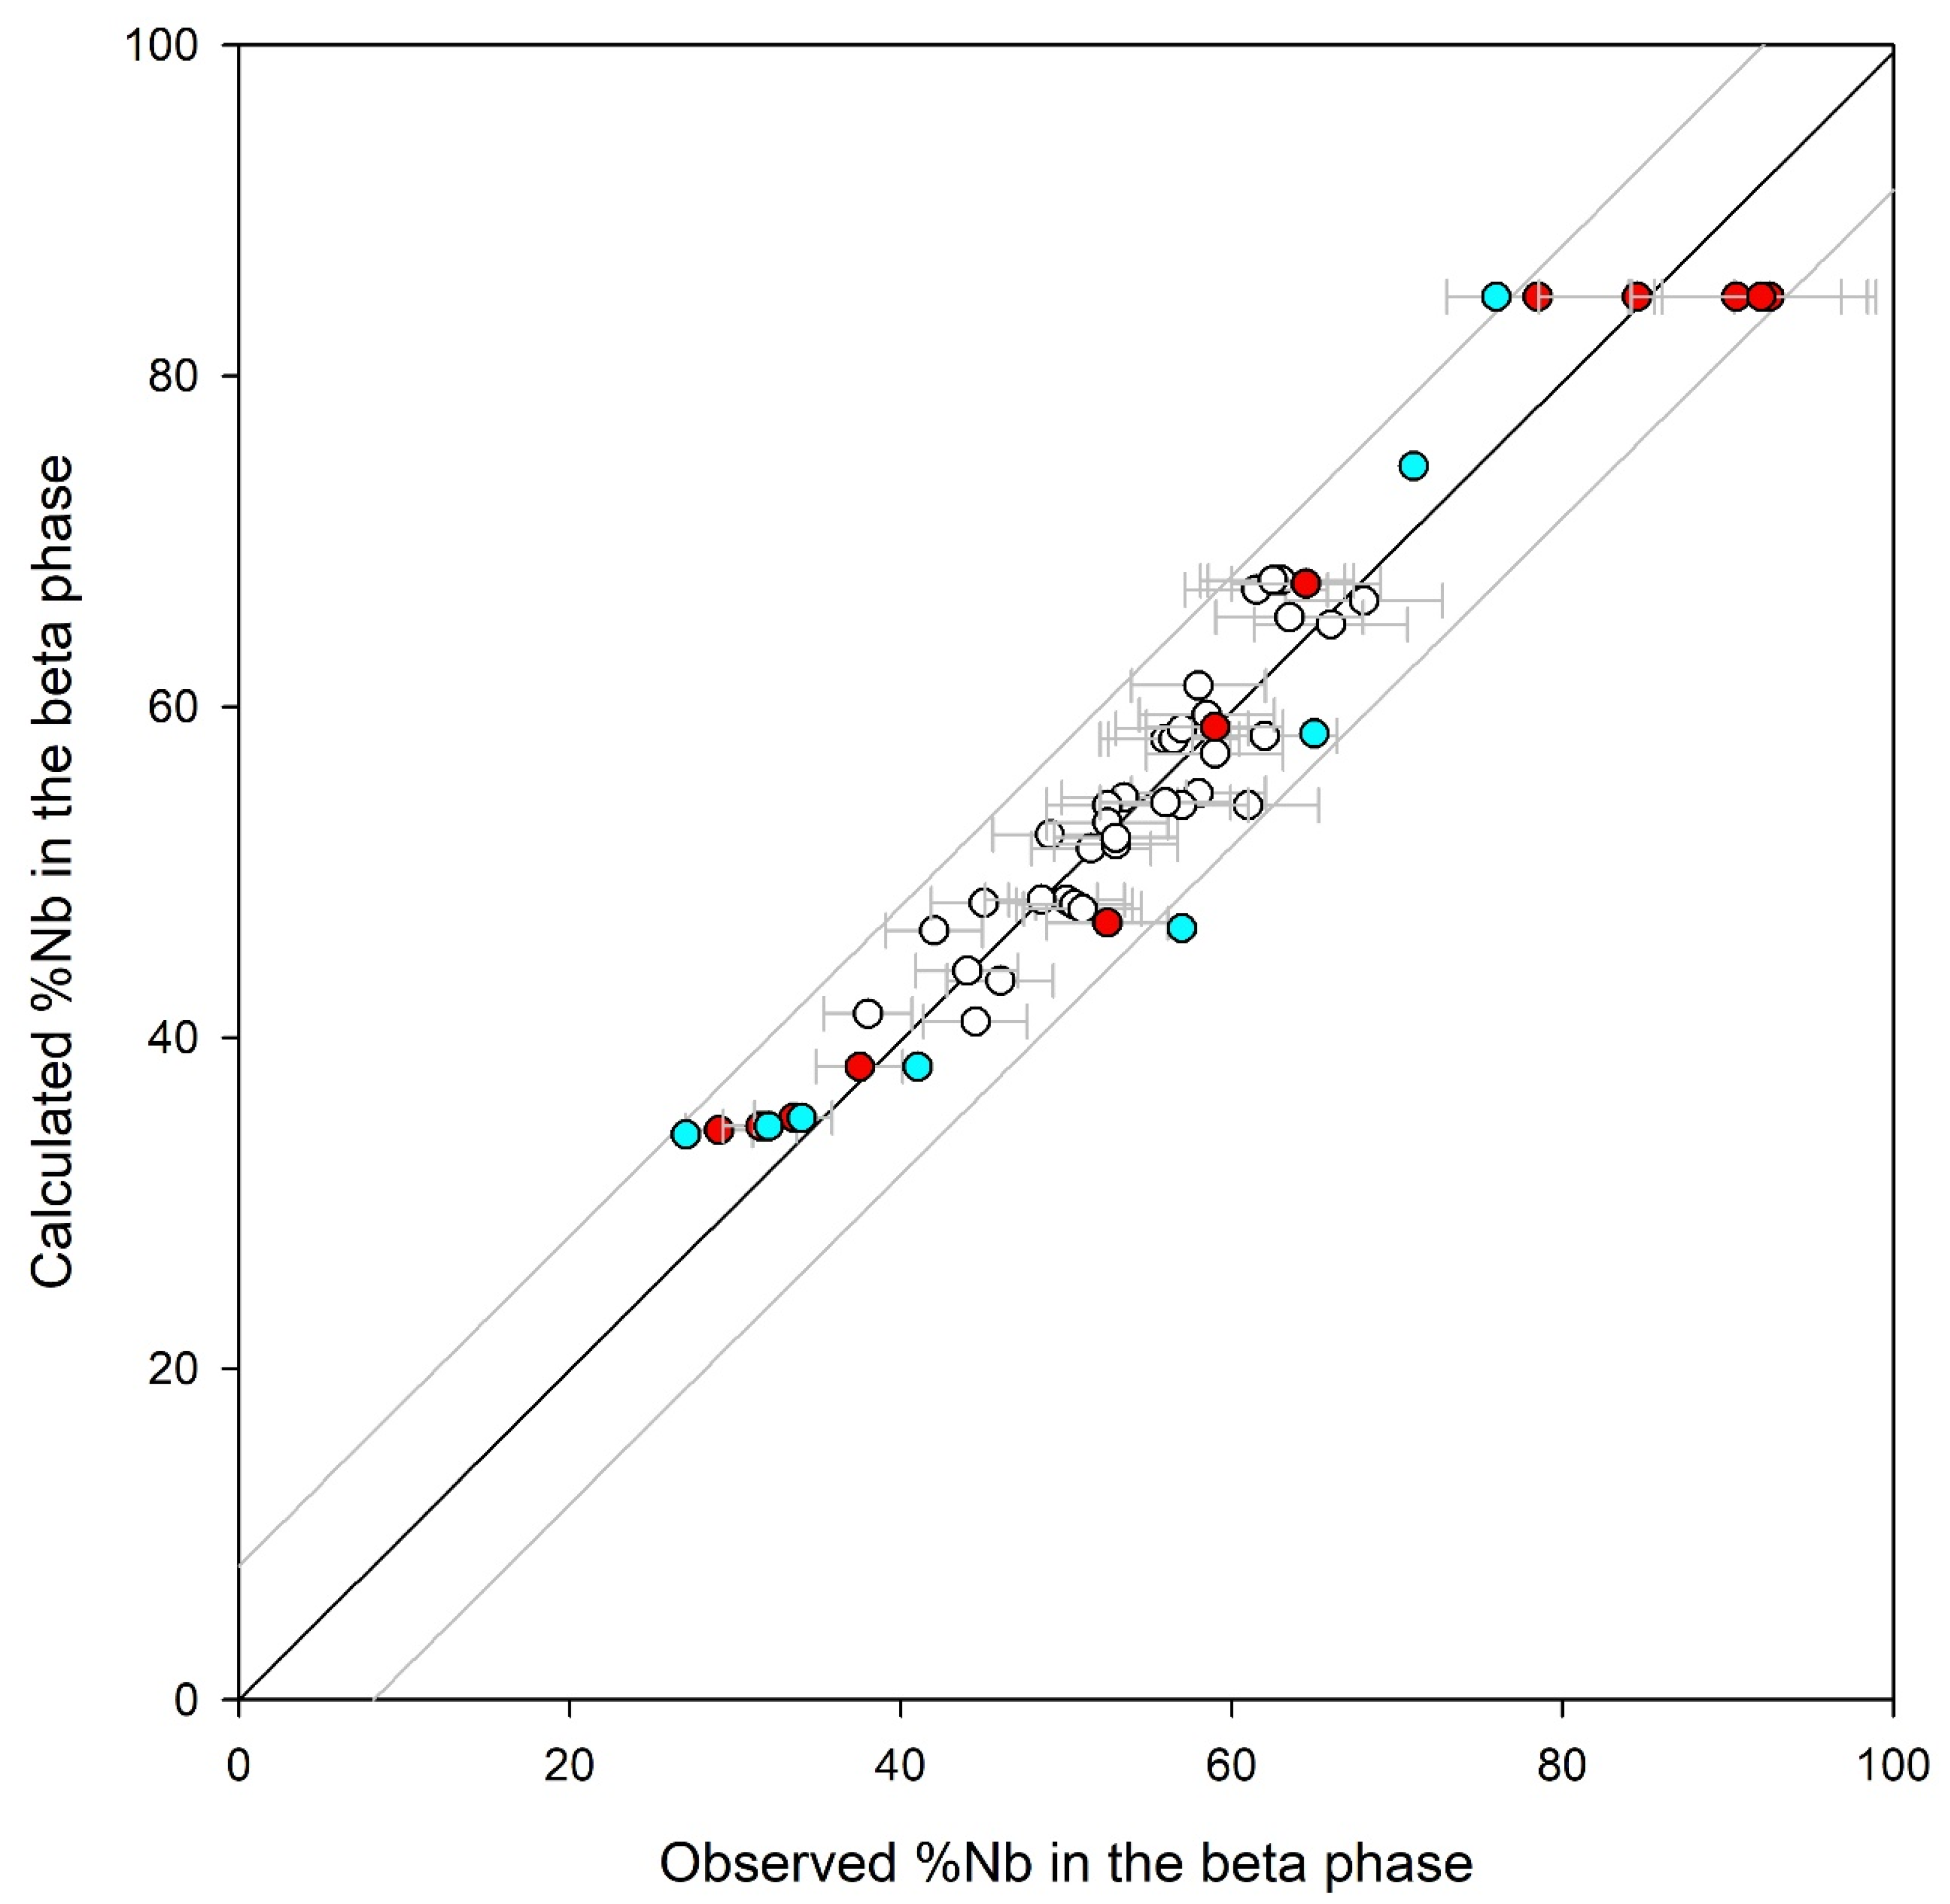
A plot of the time dependence of the observed and calculated fractional niobium concentrations for the unirradiated material is shown in Figure 2. The observed and calculated fractional niobium concentrations are shown in Figure 3.

5. Discussion

In the competing-rates description, temperature-dependent growth moderates the flux-dependent loss of the hcp phase (Equation (1)) that is found interspersed in the metastable β-Zr phase of Zr-2.5Nb (Figure 1). Over time, the bcc β-Zr phase transforms into the energetically favored niobium-depleted hcp ω phase, which eventually transforms into hcp α phase [5,6]. During this transformation, the niobium concentration is enriched in the remaining β-Zr phase until the equilibrium value for β-Nb is reached: eqNβ = (85 ± 2)% (Table 4), which was determined assuming the same value in the model for temperatures between 521 and 673 K. It agrees with the value reported in [14] (i.e., 84.8%) obtained from metallography and hardness measurements. Higher values for eqNβ inferred from measurements of the solid solubility of zirconium in niobium at the monotectoid at (893 ± 10) K are reported to be as high as 94% based on X-ray diffraction (XRD) [16]. High values have been attributed to the effect of stress on XRD measurements; dilatational components could exist even when the deviatoric components are relaxed [8]. Equilibrium %Nb measurements made with EDX-analysis and a TEM are typically 8 percentage points lower than XRD measurements [8]. The TEM measurements are not subject to the same stress effects that affect XRD measurements, so TEM measurements provide a better estimate of eqNβ. All the measurements of %Nb analyzed in this work were determined with XRD values averaged over reflections from the (110) and (200) planes to compensate for deviatoric stresses.
The rate-determining step for the isothermal transformation of the bcc β phase to the hcp ω and α phases is diffusion-limited concentration fluctuations that create Nb-lean regions [17,18]. The activation energy for Nb migration by self-diffusion in the close-packed α Zr (2.69 eV/atom, [19]) should be an upper limit for the diffusion-controlled formation of the hcp phases. A reasonable lower limit is the energy barrier for diffusion of niobium in the much more open bcc β-Zr, which is 1.4 eV/atom [18,20]. The barrier energy determined in this study for the growth of hcp phase from bcc phase (2.43 ± 0.01 eV/atom; Table 4) is within the expected limits. The determined barrier energy is known precisely, but not accurately because of the uncertainty in A: varying the value A is held at in the regression by a factor of ten changes E by 0.1 eV/atom. The cross section in Table 4 is only applicable to CANDU reactors. Different locations in other reactors will have different flux spectral profiles and the cross section will have to be modified accordingly. The cross section for the total displacements per atom (dpa) per fluence resulting from the fast neutron flux cascade has been calculated with the computer program DISPKAN developed by Woo [21] (this program contains most of the recommended procedures found in the program RICE originally developed at ORNL by Jenkins [22]), along with the database ENDF/B, versions 4 to 6: the result for neutron energies above 1 MeV is 1710 barns for CANDU reactors. This is a gross value that includes the fraction of displaced atoms that end up in equivalent positions; vacant sites and interstitial atoms created in the cascade subsequently migrate if the temperature is sufficiently high to form interstitial and vacancy clusters, or they mutually annihilate, or are absorbed on dislocation lines and at grain boundaries. In this study, the mobile self-interstitial production efficiency is 1.4% of the total cascade damage cross section. This damage ‘efficiency’ is similar to the values predicted to produce freely migrating defects (FMDs) in nuclear reactors [23,24,25] and consistent with values used to calculate in-reactor creep [26]: FMDs are those vacancies and interstitials that escape spontaneous recombination and clustering.
During irradiation, the diffusion of substitutional solute atoms such as Nb is enhanced by the augmentation of the steady-state vacancy concentration by FMDs. However, if the rate of defect production is small enough (as it is in a CANDU reactor) and the sink density is high enough (effectively reducing the concentration of vacancy FMDs) then thermal processes will be more-or-less independent of the neutron flux, as we have assumed in the model. The freely migrating vacancies are available to contribute to processes dependent on diffusion such as the thermal decomposition of the β phase, which is separate from the ballistic mixing caused by irradiation but will affect the balance between mixing and reformation if there are sufficient vacancies remaining in the steady state to make a substantial additional contribution to the thermal vacancy concentration. Vacancy and interstitial production from atomic displacement in the vicinity of a boundary between the omega phase and the β-Zr phase will lead to the reduction of the omega phase. For example, a neutron can ballistically displace Zr atoms in the omega phase to a position far from the interface into the β-Zr phase. Recall that the omega phase is made mostly of zirconium atoms so the flux of ballistic atoms will be mostly zirconium atoms. This process will leave behind vacancies at the interface. Atoms in the beta phase will combine with these vacancies so that the β-Zr phase will be seen to encroach on the omega phase, filling in for the lost zirconium atoms—the concentration of Nb in the β-Zr phase will decrease because of the increased volume of the beta phase. From a far distance, it will appear like the omega phase is evaporating: the neutron flux produces a flux of freely migrating zirconium atoms radiating from a shrinking omega particle. Thus, it is proposed that the product of the cross section and the flux in Equation (1) is a direct measure of atomic displacement rate. Self-interstitials may also be expected to migrate from the more closely packed omega and alpha phases into the less densely packed body-centered cubic phase. The free energy difference for self-interstitial atoms in the two phases will enhance the net self-interstitial migration across the interface.
The picture presented in this work suggests an explanation for why neutron flux drives the β phase away from equilibrium (i.e., to lower values of %Nb in the β phase), whereas in the α phase, flux causes Nb-rich precipitates of the equilibrium β-Nb phase to form. In the α phase, radiation-enhanced diffusion of niobium is given as a reason for the increased rate towards the equilibrium state [27,28]. In the β phase, the diffusion of niobium, and hence the rate to equilibrium, should also be enhanced by irradiation, although perhaps not as significantly, because the niobium is much less constrained to move in the much more open bcc β phase compared with the close-packed α phase. The solution suggested by this work is that irradiation enhancement of niobium diffusion in the β phase is very small (so small that a flux-dependent activation energy and/or a pre-exponential factor was not required to fit the data) and that cascade mixing across the bcc-hcp interfaces in the β phase region is responsible for the trend away from equilibrium. Ultimately, this is because of the small size of the hcp particles relative to the extent of the cascade.
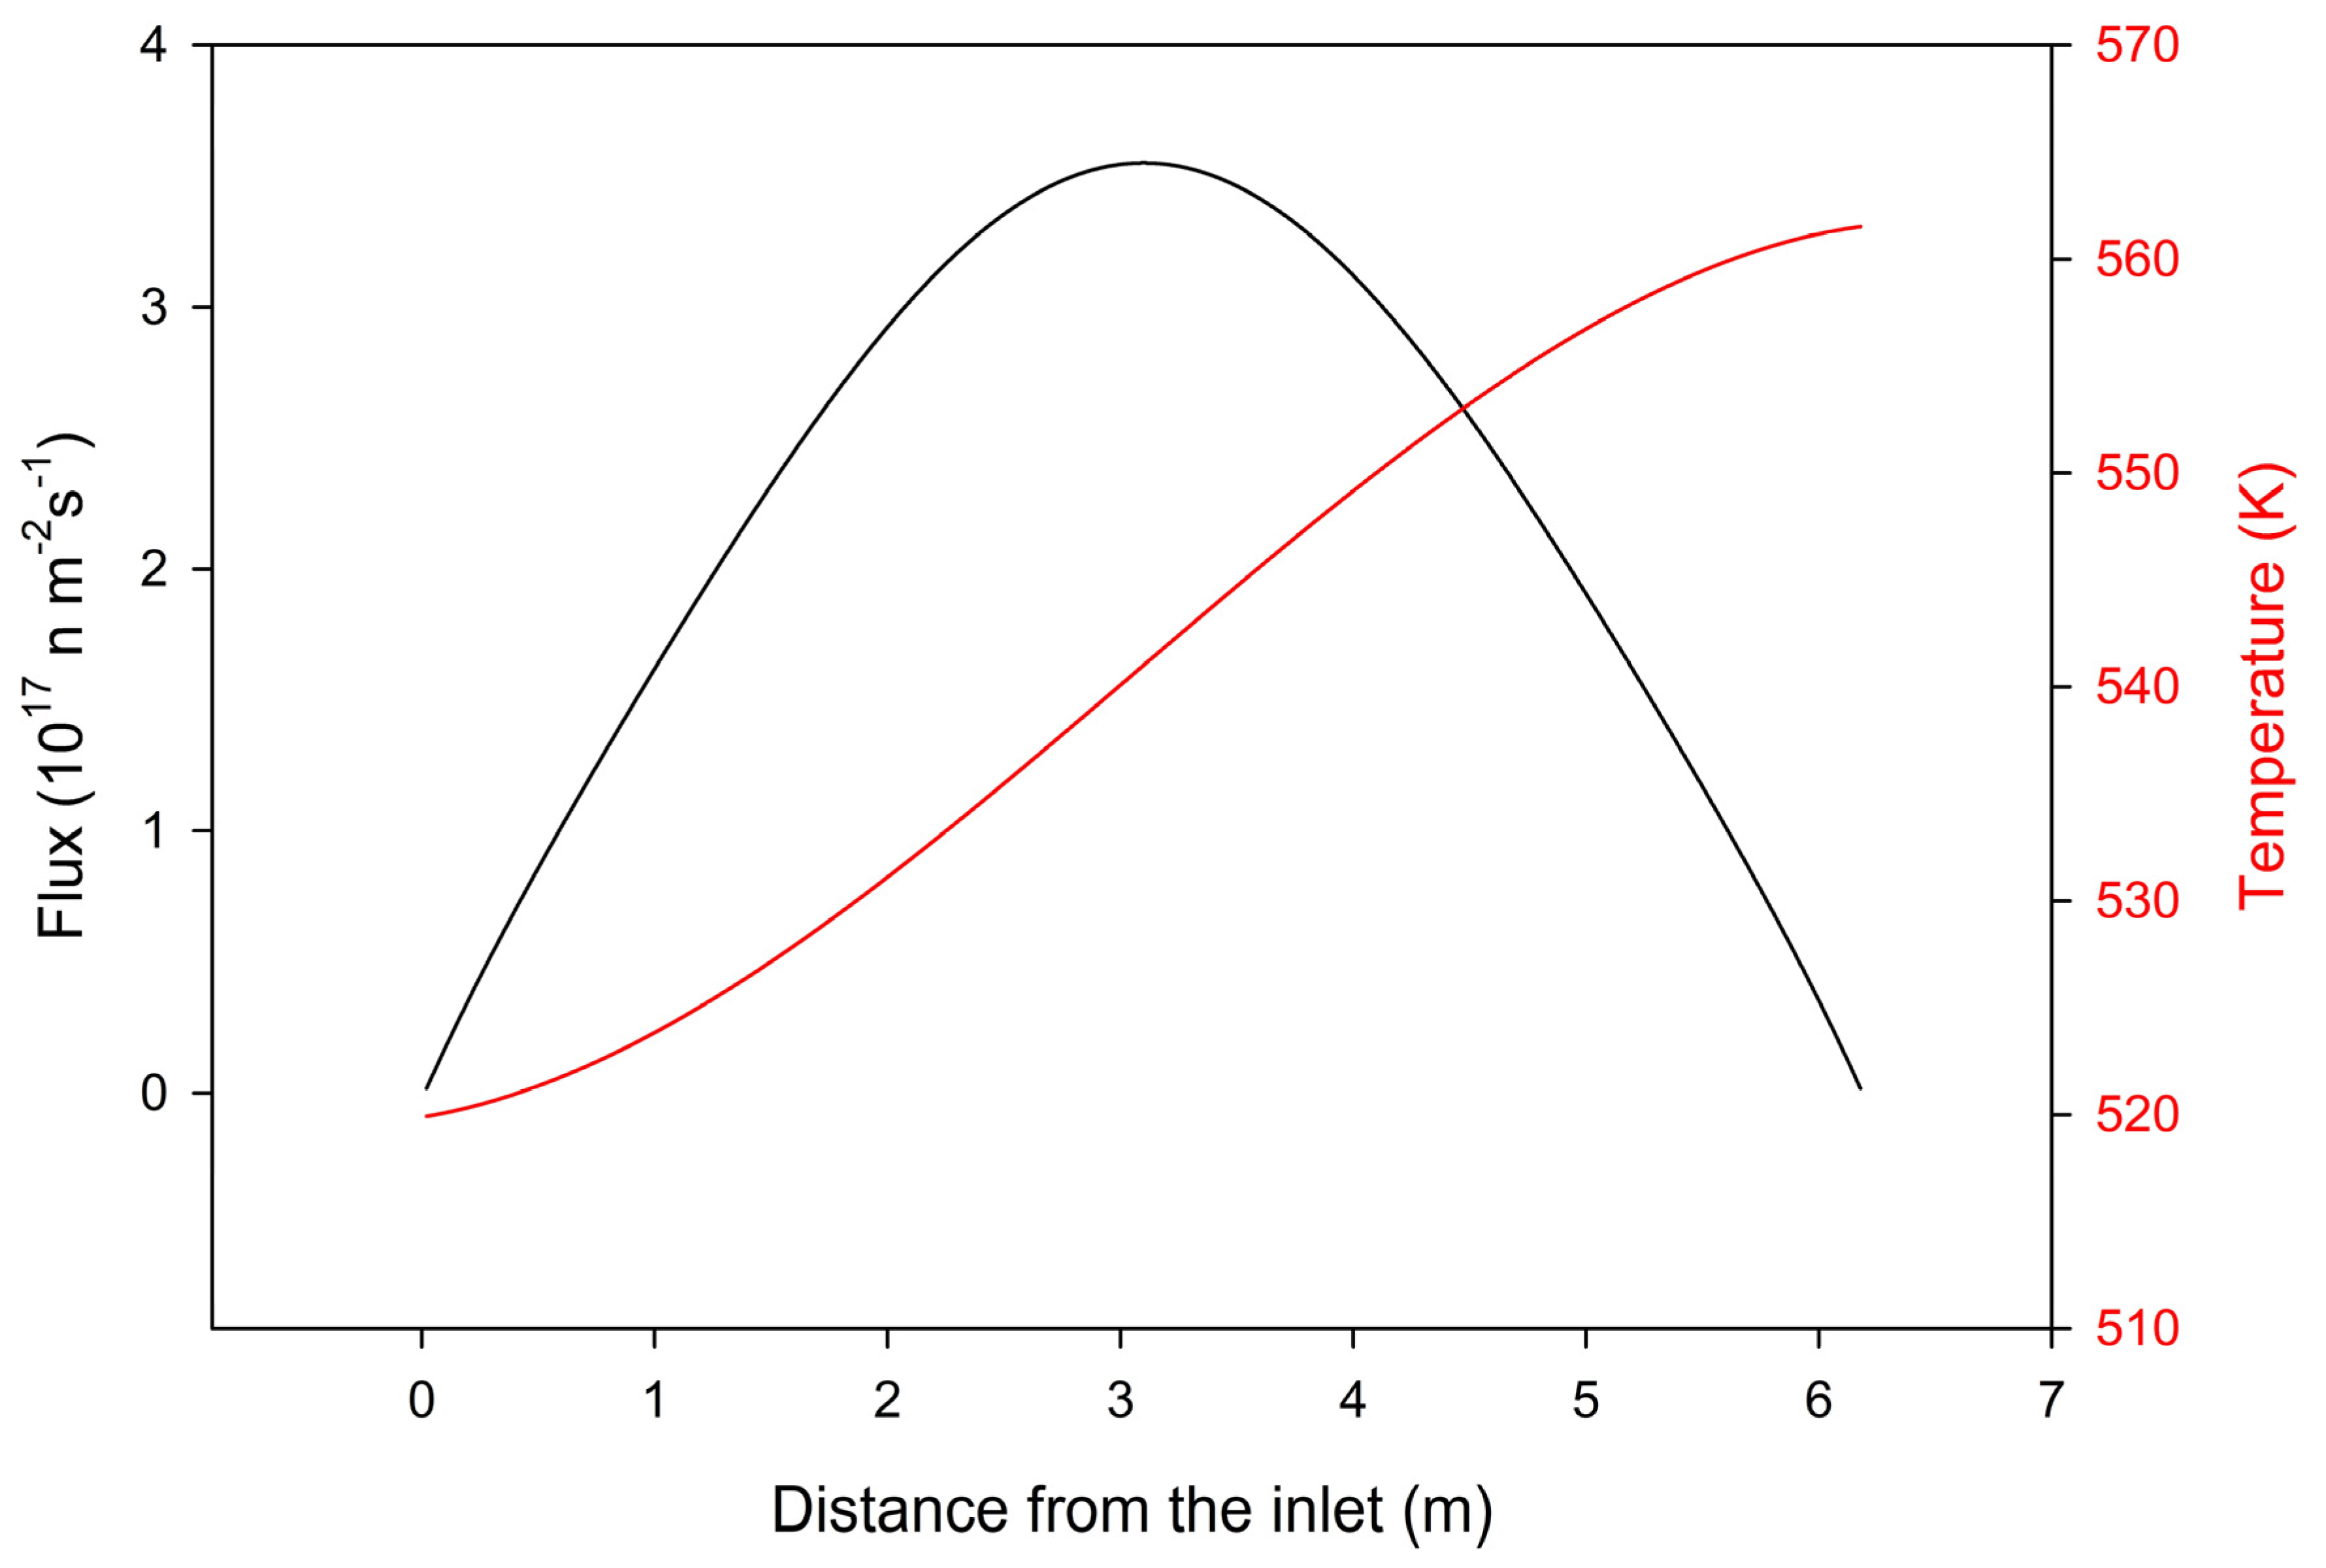
Equation (9) and the parameters in Table 4 can be used to calculate the %Nb in the β phase for pressure tubes in CANDU reactors (see Figure 4). Perhaps the most distinctive features are the points where the effects of temperature and flux cancel and the %Nb in the β phase remains at its initial value (most obviously seen at 5.5 m in Figure 4). For positions between and outside these points, the %Nb decreases and increases, respectively, until the steady-state values are reached well after thirty years. It would be interesting to see what β phase irradiation damage exists at the points where the effects of temperature and flux cancel.
Figure 4. %Nb simulation for a CANDU reactor pressure tube. This plot slows how %Nb changes along the length of an operating reactor pressure tube for various times (0 to 25 years). Also shown are the ‘long time’ steady-state values. These simulations are produced with Equation (9) and the parameters in Table 4, and a representative temperature and flux profile along the length of a CANDU pressure tube (Figure 5). The points where the effects of temperature and flux cancel are at ≈ 0.0 and ≈ 5.5 m.
Metals 14 00692 g004
Figure 5. Representative temperature and flux profiles for a CANDU reactor.
Metals 14 00692 g005
The current work suggests that the simple picture of displacement-induced mixing (i.e., omega phase precipitates dissolving by ballistic transport) competing with a thermally activated segregation process provides a reasonable representation of the extent of the decomposition of the β-Zr phase in operating CANDU Zr-2.5Nb pressure tubes. However, the model is based on several assumptions that may not have been adequately tested by the current data set. For instance, problems with the assumption that the ω and α phases can be treated as a single entity could be difficult to see because the data might not be sufficiently representative of high and low %Nb concentrations where the distinction should be more evident. Further studies are required to refine this picture.
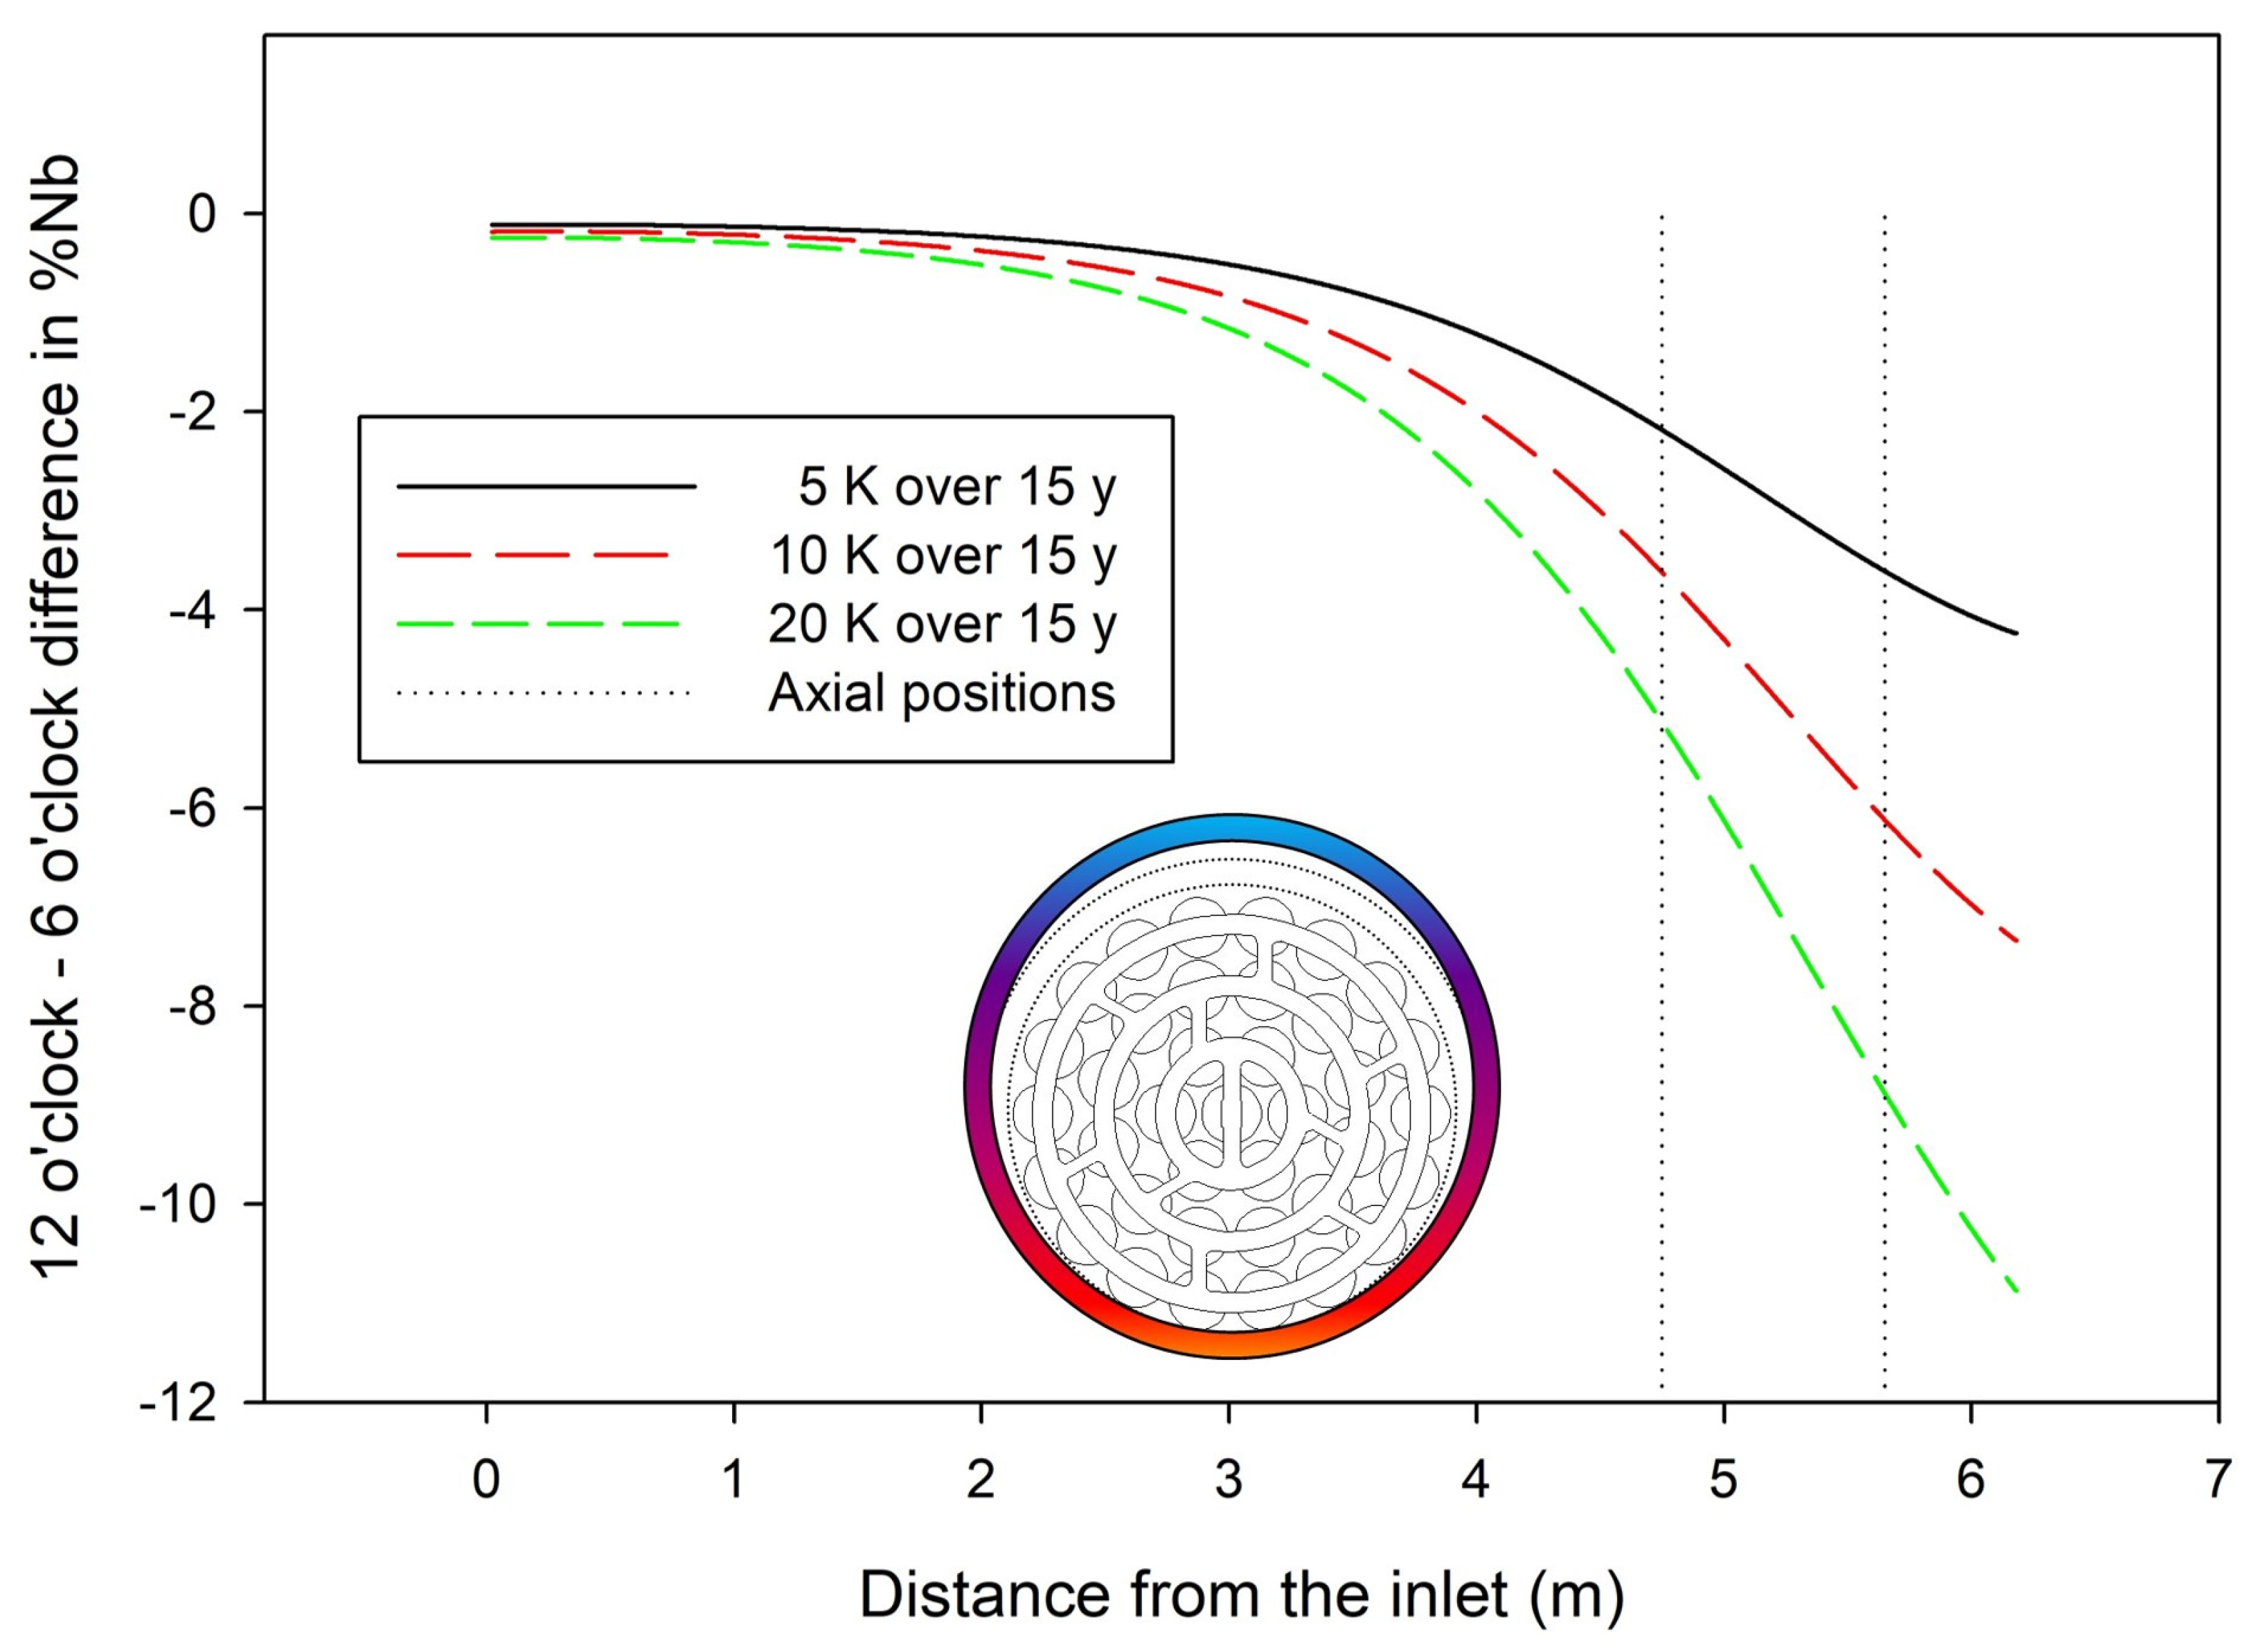
There is no indication in the data or the analysis that the temperatures at the outlet should be lower than reported. Circumferential hydrogen concentration gradients at the outlet rolled joint suggest that the temperature at the top of horizontal CANDU pressure tubes (i.e., 12 o’clock position) might be 20 K lower than currently predicted because of coolant flow bypass that occurs when the coolant flows above, instead of through, the fuel bundles because of diametral expansion of the pressure tube axially up to about 5 m from the inlet after services of more than 15 years [29]. The data in Table 1 are sparse at long times at outlets (i.e., for distances greater than about 6 m), but there is no indication from the predictions of the model that there is anything untoward about the temperatures. Sometimes circumferential %Nb differences are seen that are attributed to flow bypass. Temperature gradients cannot easily be inferred from these differences. Increases in %Nb in the β phase will lessen with time when the temperature at the 12 o’clock position is lowered because of flow bypass, the temperature at the 6 o’clock position remaining unchanged. There are several scenarios that depend on how bypass might change temperatures. For instance, the top-bottom (i.e., 12 o’clock–6 o’clock) difference in %Nb will reach a minimum value that depends on the %Nb when ‘significant’ bypass occurred and the time at temperature after which the measurement was made. As an example, for a top–bottom temperature difference of −10 K starting at 10 years, the top–bottom difference in %Nb is −5.6 percentage points after a total time of 15 years, −7 percentage points after 17 years, reaches a minimum value of −8 percentage points at 22 y, then rises to −7 after 30 years and −3.5 after 45 years; these values were estimated using the no-flux version of Equation (9) appropriate near rolled joints. Ultimately the values of %Nb at the bottom and top of the tube will approach the same equilibrium value so that no top–bottom differences in %Nb will be observed. Estimating the circumferential temperature gradient from circumferential %Nb gradients is not an easy task given the unknowns regarding the temperature history of flow bypass and the effect on the temperature over time at the location of interest in the pressure tube. The same change in %Nb can be found for different temperatures for different times, making unique solutions difficult to find. The problem is underdetermined.
Figure 6 shows additional ‘bypass’ scenarios for how %Nb changes when the temperature at the top of the tube (i.e., 12 o’clock location) is assumed to decrease, relative to the temperature at the bottom of the tube, linearly with time to values 5, 10, and 20 K lower after 15 years, calculated with Equation (9) and the parameters in Table 4. Measured top–bottom differences in %Nb in a removed pressure tube after 15 years of service have been reported: %Nb differences of 3.7 and 4 at 4.75 m and 5.6 m, respectively [29]. These differences in %Nb correspond to top–bottom temperature differences between −5 and −10 K after 15 years in Figure 6.
These current predictions of top–bottom temperature differences between 5 and 10 K because of flow bypass are in accord with calculations of axial hydrogen concentration profiles in-core from the outlet rolled joint. There was no need to modify temperatures in the axial hydrogen profile model to account for such small top-bottom temperatures; −20 K differences would have noticeably altered the hydrogen profiles [30]. These current predicted top–bottom temperature differences are also in accord with circumferential hydrogen concentration gradients calculated using the heat of transport of hydrogen when hydrides are present [31]. In addition, top–bottom temperature differences less than 5 K have been estimated using thermohydraulic codes and CANDU fuel bundle powers [32].
Finally, Equation (9) can be used to calculate the endothermic temperature associated with hydride dissolution in reactors. Hydrogen partitions between the α and β phases. The extent of partitioning can be determined by equating the chemical potentials of hydrogen in both phases and deriving a formula for the total hydrogen concentration in terms of the dissolution temperature. Hydrogen forms precipitates only in the α phase during reactor operation. Changes in the amount of α and β phases in pressure tubes in reactors change the concentration of hydrogen in the α phase and the corresponding endothermic temperature. Thus, the temperature at which hydrides dissolve can be estimated [33]. Hydride precipitation during operation is to be avoided because hydrides embrittle the tubes [34] and can lead to failure by delayed hydride cracking [35,36].

6. Conclusions

A competing-rates description of the hcp phase that forms within the bcc phase of Zr-2.5Nb, in terms of temperature-dependent gain and irradiation-induced loss, has resulted in a formula for the evolution of the hcp phase in terms of flux, fluence, time, and temperature. This formalism has been fitted with measurements of niobium concentrations in the β phase at reactor-relevant temperatures made with and without irradiation. The results show that this simple model can account for the observed variations in niobium concentration in the β phase of irradiated Zr-2.5Nb pressure tubes. The apparent barrier energy for hcp phase growth is found to be 2.43 eV if an Arrhenius A factor of 1013/s is assumed. The hcp phase is postulated to grow in the bcc β phase by diffusion of niobium atoms away from regions that then become ω and α, and the determined barrier energy is within the range expected for a bcc-hcp transition structure.
The ω and α particles are presumed to ‘dissolve’ when atoms are displaced, creating vacancies and interstitials across an (ω and α)-β interface. The fitted model cross section of 24.5 barns for CANDU reactors suggests that 1.4% of the original displaced atoms caused by the cascade are involved in the dissolution process.
The model predicts a top–bottom temperature difference of 5 to 10 K after about 15 years at the outlet rolled joints of CANDU pressure tubes that have undergone diametral expansion, leading to coolant flow bypass.

Author Contributions

Conceptualization, G.A.M., M.G. and C.E.C.; visualization, G.A.M., M.G. and C.E.C.; data curation, M.G.; formal analysis, G.A.M.; writing—original draft preparation, G.A.M.; writing—review and editing, G.A.M., M.G. and C.E.C. All authors have read and agreed to the published version of the manuscript.

Funding

This research received no external funding.

Data Availability Statement

Data are contained within the article.

Acknowledgments

Thank you to Nikos Christodoulou for discussions about the computer program DISPKAN.

Conflicts of Interest

The authors declare that they have no conflicts of interest.

References

  1. Canadian Nuclear Safety Commission, 19–20 July 2021, CMD 21-M37. 3 September 2021 Commission Meeting. Available online: https://www.cnsc-ccsn.gc.ca/eng/the-commission/meetings/cmd/ (accessed on 10 June 2024).
  2. 20210726-Designated-Officer-Order-to-Bruce-Power.pdf (Nuclearsafety.gc.ca), Canadian Nuclear Safety Commission, 26 July 2021. Available online: https://www.cnsc-ccsn.gc.ca/eng/acts-and-regulations/regulatory-action/bruce-power/ (accessed on 10 June 2024).
  3. Canadian Nuclear Safety Commission, 24 March 2022, Event Initial Report CMD 22-M16. 24 March 2022 Commission Meeting. Available online: https://www.cnsc-ccsn.gc.ca/eng/the-commission/meetings/cmd/ (accessed on 10 June 2024).
  4. Cheadle, B.A. The development of Zr-2.5Nb pressure tubes for CANDU reactors. J. ASTM Int. 2010, 7, 67–87. [Google Scholar] [CrossRef]
  5. Winton, J.; Murgatroyd, R.A. The effect of variations in composition and heat treatment on the properties of Z-Nb alloys. Electrochem. Technol. 1966, 4, 358–365. [Google Scholar]
  6. Cheadle, B.A.; Aldridge, S.A. The transformation and age hardening behaviour of Zr-19 WT% Nb. J. Nucl. Mater. 1973, 47, 255–258. [Google Scholar] [CrossRef]
  7. Dey, G.K.; Singh, R.N.; Tewari, R.; Srivastava, D.; Banerjee, S.A. Metastability of the β-phase in Zr-rich Zr-Nb alloys. J. Nucl. Mater. 1995, 224, 146–157. [Google Scholar] [CrossRef]
  8. Griffiths, M.; Winegar, J.E.; Buyers, A. The transformation behaviour of the beta phase in Zr-2.5wt%Nb pressure tubes. J. Nucl. Mater. 2008, 383, 28–33. [Google Scholar] [CrossRef]
  9. Griffiths, M.; Chow, P.C.K.; Coleman, C.E.; Holt, R.A.; Sagat, S.; Urbanic, V.F. Evolution of microstructure in zirconium alloy core components of nuclear reactors during service. ASTM STP 1993, 1175, 1077–1110. [Google Scholar]
  10. Griffiths, M.; Mecke, J.F.; Winegar, J.E. Evolution of microstructure in zirconium alloys during irradiation. In Zirconium in the Nuclear Industry: Eleventh International Symposium; ASTM International: West Conshohocken, PA, USA, 1997. [Google Scholar]
  11. Khatamian, D. Effect of β-Zr decomposition on the solubility limits for H in Zr-2.5Nb. J. Alloys Compd. 2003, 356, 22–26. [Google Scholar] [CrossRef]
  12. Olander, D.R. Fundamental Aspects of Nuclear Reactor Fuel Elements; TID-26711-P1; National Technical Information Service, U.S. Department of Commerce: Springfield, MA, USA, 1976. [Google Scholar]
  13. Wollenberger, H. Phase transformations under irradiation. J. Nucl. Mater. 1994, 216, 63–77. [Google Scholar] [CrossRef]
  14. Lundin, C.E.; Cox, R.H. The determination of the equilibrium phase diagram, zirconium-niobium. In Proceedings of the SAEC Symposium on Zirconium Alloy Development, Pleasanton, CA, USA, 12–14 November 1962; GEAP-4089. Volume 1, pp. 9.1–9.35. [Google Scholar]
  15. Boltaks, B.I. Diffusion in Semiconductors; Academic Press: New York, NY, USA, 1963. [Google Scholar]
  16. Abriata, J.P.; Bolcich, J.C. The Nb-Zr (Niobium-Zirconium) System. Bull. Alloy Phase Diagr. 1982, 3, 34–44. [Google Scholar] [CrossRef]
  17. Sikka, S.K.; Vohra, Y.K.; Chidambaram, R. Omega phase in materials. Prog. Mater. Sci. 1982, 27, 245–310. [Google Scholar] [CrossRef]
  18. Hood, G.M.; Zou, H.; Schultz, R.J.; Matsuura, N.; Roy, J.A.; Jackman, J.A. Self- and Hf Diffusion in α-Zr and in Dilute, Fe-Free, Zr(Ti) and Zr(Nb) Alloys. Defect Diffus. Forum 1997, 143–147, 49–54. [Google Scholar]
  19. Hood, G.M.; Zou, H.; Schultz, R.J.; Matsuura, N. Nb Diffusion in Single-Crystal α-Zr. Defect Diffus. Forum 1997, 143–147, 55–60. [Google Scholar] [CrossRef]
  20. Douglass, D.L. The Metallurgy of Zirconium. Int. At. Energy Rev. 1971, 53, 53084330. [Google Scholar]
  21. Woo, C.H. Neutron-Induced Displacement Damage Analysis (with Particular Reference to Zirconium). AECL-6189. 1978. Available online: https://inis.iaea.org/collection/NCLCollectionStore/_Public/10/490/10490755.pdf (accessed on 10 June 2024).
  22. Jenkins, J.D. Rice: A Program to Calculate Primary Recoil Atom Spectra from ENDF/B Data; Technical Report ORNL-TM-2707; Oak Ridge National Laboratory: Oak Ridge, TN, USA, 1970. [Google Scholar]
  23. Naundorf, V. On the origin of freely migrating defects in ion and neutron irradiated metals. J. Nucl. Mater. 1991, 182, 254–257. [Google Scholar] [CrossRef]
  24. Rehn, L.E.; Birtcher, R.C. Experimental studies of free defect generation during irradiation—Implications for reactor environments. J. Nucl. Mater. 1993, 205, 31–39. [Google Scholar] [CrossRef]
  25. Lemaignan, C. Irradiation damage, The Metallurgy of Zirconium. Vol. 2. Chap. 6. IAEA. 2023. Available online: https://www-pub.iaea.org/MTCD/Publications/PDF/AdditionalVolumes/PUB1943/Vol2/Pub1943-Vol2-Web.pdf (accessed on 10 June 2024).
  26. Adamson, R.B.; Coleman, C.E.; Griffiths, M. Irradiation creep and growth of zirconium alloys: A critical review. J. Nucl. Mater. 2019, 521, 167–244. [Google Scholar] [CrossRef]
  27. Coleman, C.E.; Gilbert, R.W.; Carpenter, G.J.C.; Weatherly, G.C. Precipitation in Zr-2.5Nb during neutron irradiation. Phase stability during irradiation. AIME 1981, 587–599. [Google Scholar]
  28. Urbanic, V.F.; Griffiths, M. Microstructural aspects of corrosion and hydrogen ingress in Zr-2.5Nb. ASTM STP 1998, 1354, 641–656. [Google Scholar]
  29. Bickel, G.A.; Griffiths, M.; Chaput, H.; Buyers, A.; Coleman, C.E. Modelling Irradiation Damage in Zr-2.5Nb and its Effect on Delayed Hydride Cracking Growth Rate. ASTM-STP 2015, 1543, 800–829. [Google Scholar]
  30. McRae, G.A.; Coleman, C.E. Deuterium concentration profiles at the rolled joints of CANDU fuel channels. J. Nucl. Mater. 2023, 573, 154128. [Google Scholar] [CrossRef]
  31. McRae, G.A.; Coleman, C.E. Heat of transport for hydrogen and hydrides in Zircaloy. J. Nucl. Sci. Technol. 2024, accepted. [Google Scholar] [CrossRef]
  32. Greening, F. CNSC Staff Update on Elevated Hydrogen Equivalent Concentration Discovery Events in the Pressure Tubes of Reactors in Extended Operation, Addendum 2. Canadian Nuclear Safety Commission. CMD 22-M37.4. 1–3 November 2022 Commission Meeting. Available online: https://www.cnsc-ccsn.gc.ca/eng/the-commission/meetings/cmd/ (accessed on 10 June 2024).
  33. McRae, G.A. A Model for Hydrogen Terminal Solid Solubility during Hydride Dissolution in Neutron-Irradiated Zr-2.5Nb Pressure Tubes. Available on Request by Email from CANDU Owners Group [email protected] COG-04-1032 2006.
  34. Muehlenkamp, G.T.; Schwope, A.D. Effect of Hydrogen on the Mechanical Properties of Zirconium and Its Tin Alloys; Report, No. BMI-845; US Atomic Energy Commission: Washington, DC, USA, 1953. [Google Scholar]
  35. Perryman, E.C.W. Pickering pressure tube cracking experience. Nucl. Energy 1978, 17, 95–105. [Google Scholar]
  36. McRae, G.A.; Coleman, C.E. Thermodynamics and Kinetics of Delayed Hydride Cracking in Zirconium Alloys: A review. J. Nucl. Mater. 2024, 155006. [Google Scholar] [CrossRef]
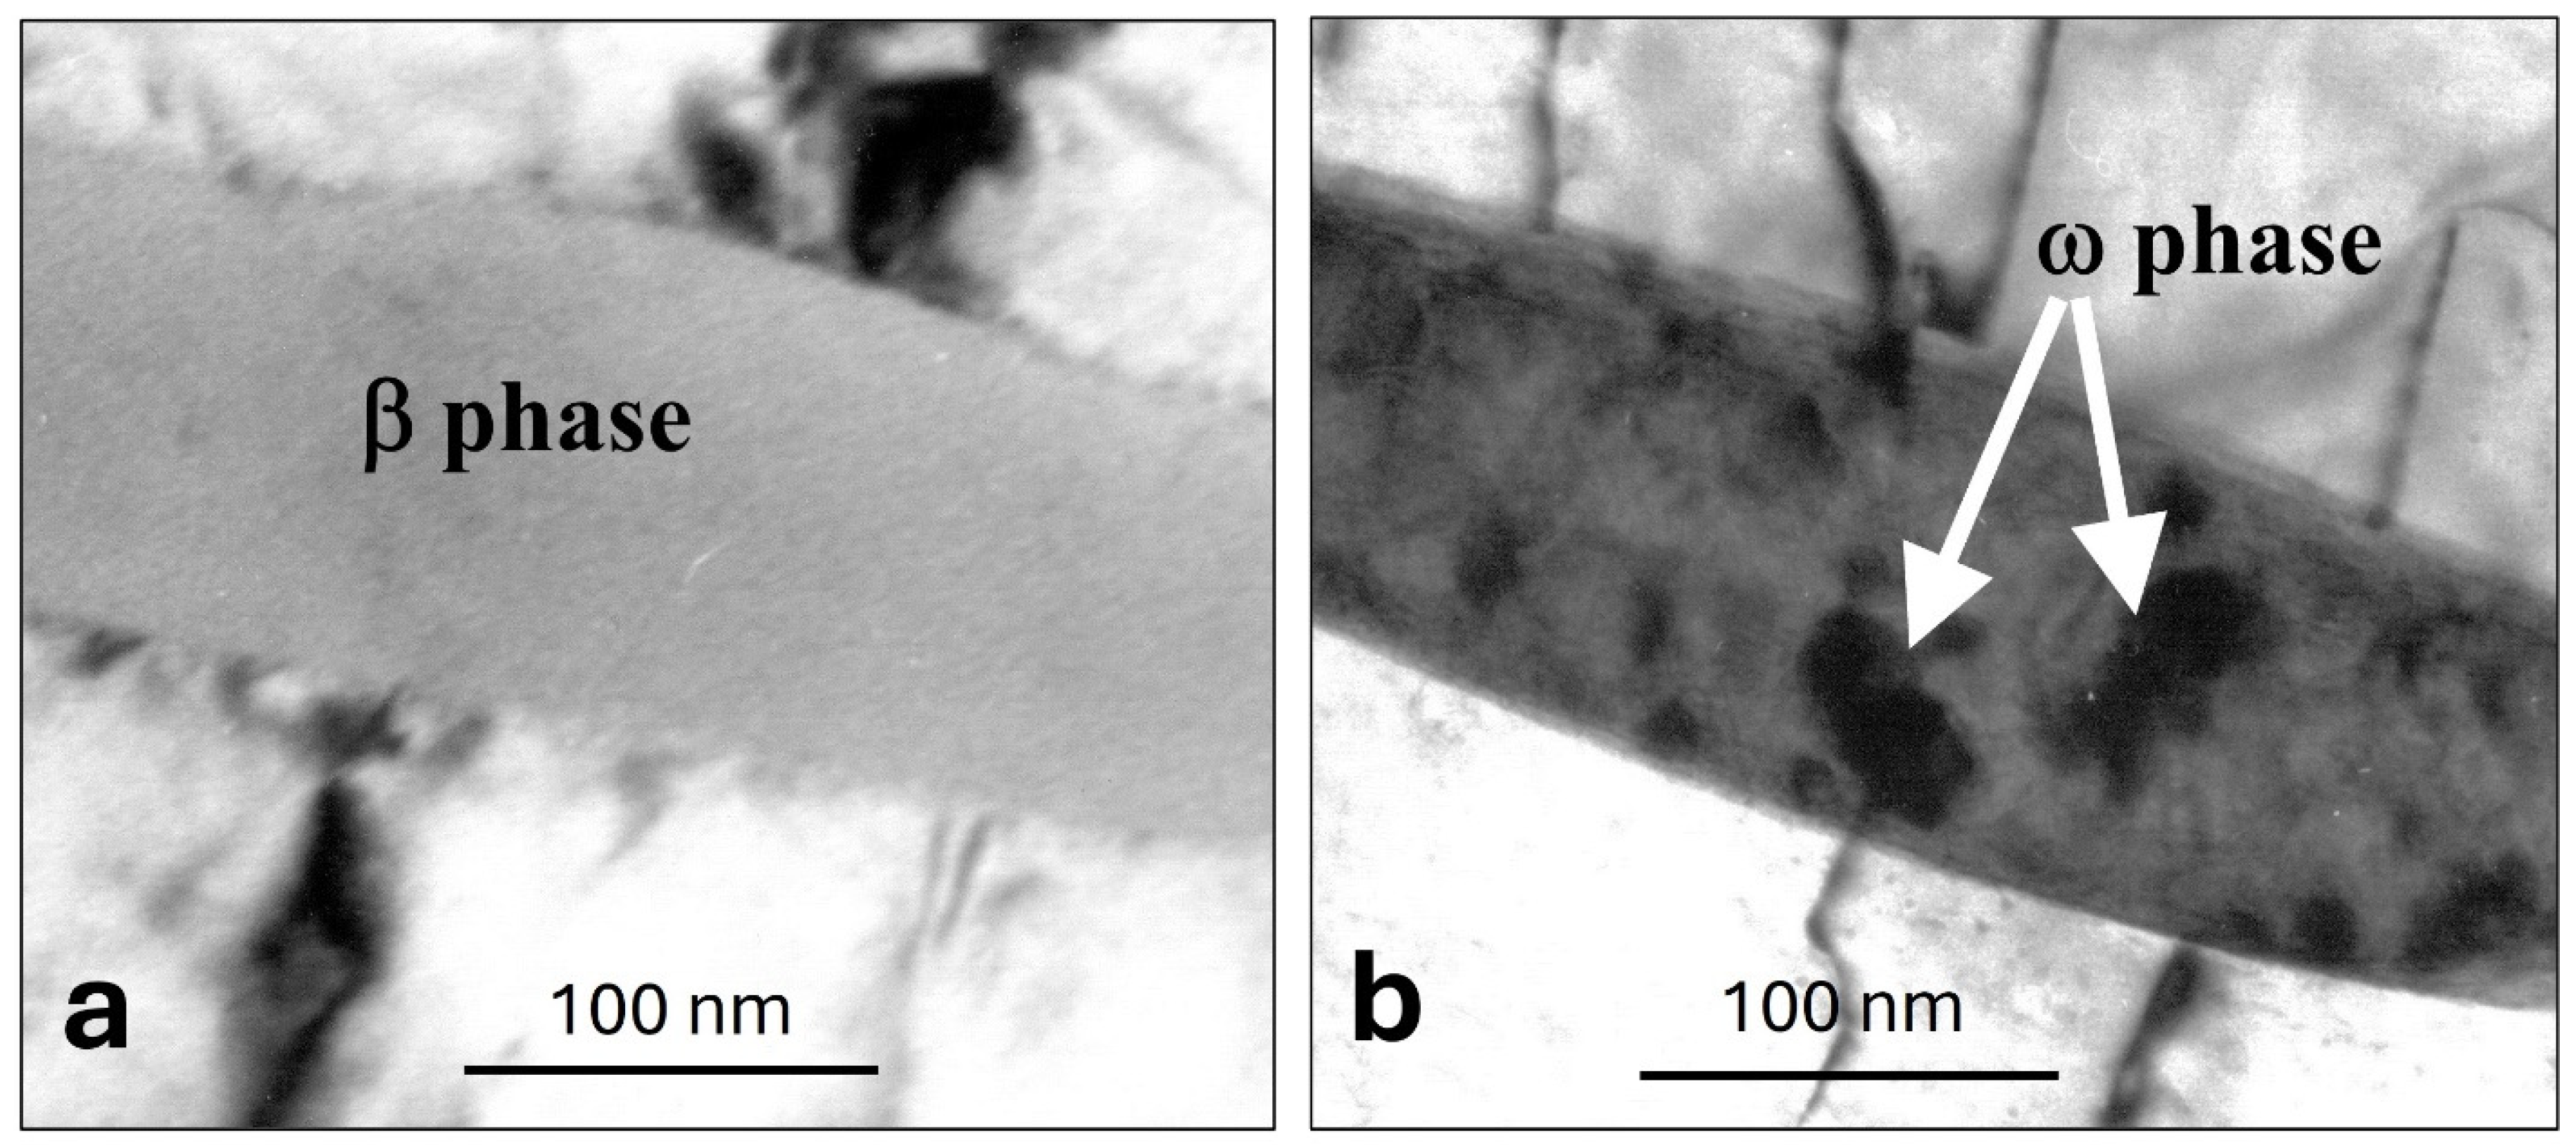
Figure 1. Electron micrographs showing examples of the thermal decomposition of the β-Zr phase (seen as a ribbon stretching from about 10 o’clock to 3 o’clock in the micrographs) in the α-phase matrix of Zr-2.5Nb: (a) as extruded—single bcc β phase containing 20 wt% Nb; (b) after autoclaving 24 h at 673 K—Nb depleted, hcp ω phase embedded in a Nb enriched β phase. The ω phase appears as small black particles in the β-Zr phase ribbon.
Metals 14 00692 g001
Figure 2. Thermal decomposition of the β phase at 673 K (the red markers with error bars are adapted from [8] (Table 2), the cyan markers without error bars are adapted from [11], see Table 3). The curve in the plot was calculated with Equation (9), and the best-fit parameters in Table 4.
Metals 14 00692 g002
Figure 3. Observed Nβ values compared with those calculated from Equation (9) and the best-fit parameters in Table 4. The open markers are data from material irradiated in Bruce, Lepreau, and Pickering reactors (Table 1). The red markers with error bars are adapted from [8] (Table 2), and the cyan-colored markers without error bars are adapted from [11] (Table 3), these are the results obtained for unirradiated material shown in Figure 2.
Metals 14 00692 g003
Figure 6. Differences in %Nb predicted at 12 o’clock and 6 o’clock after 15 years for different final top–bottom temperature differences. The temperatures at the 12 o’clock locations are assumed to decrease linearly with time from those values shown in Figure 5 because of flow bypass. After 15 years, the temperatures at the 12 o’clock locations are 5, 10, and 20 K lower at the top 12 o’clock location than at the bottom 6 o’clock location; the bottom temperatures do not vary with time from the values in Figure 5. The inset shows an axial view of a fuel bundle resting on the bottom of a pressure tube that has experienced diametral expansion. Coolant flowing above the bundle is cooler because it does not pass through the bundle; the implication is that the pressure tube is cooler at the top relative to the bottom. The vertical lines denote axial positions where there are top–bottom %Nb measurements.
Metals 14 00692 g006
Table 1. %Nb measured by X-ray diffraction analysis of specimens from removed CANDU pressure tubes.
Inlet Distance (m)Fluence
(×1025 n/m2)
Time
(years)
Temperature (K)Nβ (%)
(110)
Nβ (%)
(200)
Nβ (%)
Average
Obs-Calc
0.100.109.55521516558.03.2
0.500.351.46521576561.07.0
0.130.206.23522426553.5−1.0
0.804.6010.40522414342.0−4.4
0.603.5611.93522454545.0−3.1
0.200.5014.10523546057.03.0
0.503.4814.10523505050.01.7
0.503.4814.10523504748.50.2
0.200.5014.10523505552.5−1.5
3.101.301.67542514749.0−3.2
3.200.941.46543505552.5−0.5
3.0610.7814.10543474244.53.6
0.522.115.92543515251.50.1
3.0010.3713.39544393738.0−3.4
3.458.2010.40545474546.02.6
3.307.946.26552474144.00.0
5.303.2112.77554575556.01.8
4.907.4110.40557544750.52.5
4.848.7613.39557544851.03.2
4.842.843.84558545253.01.3
5.882.2013.39561595758.0−3.3
6.100.6013.39561636966.01.0
5.804.5814.10562575556.0−2.0
5.804.5814.10562575656.5−1.5
5.803.3611.93562575757.0−1.7
6.200.2012.77562607668.01.6
6.100.5014.10563636363.0−4.6
6.200.1510.40563567163.5−1.9
5.502.888.14563605859.01.9
3.953.243.56563555153.00.9
6.130.5013.39563606361.5−5.5
6.100.5014.10563636262.5−5.1
6.210.023.00563576762.03.8
5.802.739.55564605758.5−1.0
Table 2. %Nb measured by X-ray diffraction analysis of unirradiated specimens from a CANDU pressure tube that was not stress relieved- adapted from Ref. [8].
Time
(h)
Temperature (K)Nβ (%)
(110)
Nβ (%)
(200)
Nβ (%)
Average
Obs-Calc
0.5673243429−5.4
1673263731.5−3.1
2673283933.5−1.7
8673324337.5−0.7
24673446152.55.6
496735464590.2
71673606964.5−2.9
989673778078.5−6.3
1986673838684.5−0.3
3500673879892.57.7
6373673879490.55.7
10,1816739094927.2
Table 3. %Nb measured by X-ray diffraction analysis of unirradiated specimens from a CANDU pressure tube that was not stress relieved—adapted from Ref. [11].
Time
(h)
Temperature (K)Nβ (%)Obs-Calc
067327−7.1
167332−2.6
267334−1.1
8673412.8
246735710.4
48673656.6
9667371−3.5
40067376−8.8
Table 4. Determined model parameters.
σ24.5 (±4) barns
iNβ (no flux)0.34 ± 0.01
iNβ (irradiated)0.55 ± 0.01
eqNβ (523−573)K0.85± 0.02
E2.43 (±0.01) eV/atom
Afixed at 1013s−1
Disclaimer/Publisher’s Note: The statements, opinions and data contained in all publications are solely those of the individual author(s) and contributor(s) and not of MDPI and/or the editor(s). MDPI and/or the editor(s) disclaim responsibility for any injury to people or property resulting from any ideas, methods, instructions or products referred to in the content.