Article

Effect of Roller Burnishing and Slide Roller Burnishing on Fatigue Strength of AISI 304 Steel: Comparative Analysis

1
Department of Material Science and Mechanics of Materials, Technical University of Gabrovo, 5300 Gabrovo, Bulgaria
2
Department of Mechanical Engineering Equipment and Technologies, Technical University of Gabrovo, 5300 Gabrovo, Bulgaria
3
Department of Material Sciences, Technical University of Varna, 9010 Varna, Bulgaria
*
Author to whom correspondence should be addressed.
Metals 2024, 14(6), 710; https://doi.org/10.3390/met14060710
Submission received: 18 May 2024 / Revised: 12 June 2024 / Accepted: 13 June 2024 / Published: 15 June 2024

Abstract

:
The new slide roller burnishing (SRB) method has been developed to produce mirror-like surfaces. Unlike conventional roller burnishing (RB), SRB is implemented through a unique device that allows the axes of the deforming roller and the rotary workpiece to cross, resulting in a relative sliding velocity that can be controlled (in magnitude and direction) by varying the crossing angle. In the present work, the effect of SRB on the fatigue behavior of AISI 316 steel fatigue specimens was investigated by comparing it with conventional RB using the following basic correlation in surface engineering: finishing–surface integrity (SI)–operating behavior. To obtain a more representative picture of the comparison, we implemented each method (RB and SRB) with two combinations of governing factors—(A) a radius of the roller toroidal surface of 3 mm, a burnishing force of 250 N, and a feed rate of 0.05 mm/rev (RB-A and SRB-A), and (B) a radius of the roller toroidal surface of 4 mm, a burnishing force of 550 N, and a feed rate of 0.11 mm/rev (RB-B and SRB- B). Both SRB-A (a crossing angle of –45°) and SRB-B (a crossing angle of –30°) achieved mirror-finish surfaces. SRB-B lead to the greatest fatigue strength and, thus, the longest fatigue life among all tested processes. SRB-B created the deepest zone (>0.5 mm) with residual compressive macro-stresses and a clearly defined modified surface layer, whose thickness of more than 20 μm is about twice that created by the other three processes.

1. Introduction

The surface layers (SLs) of engineering components are directly exposed to various impacts (mechanical, thermal, chemical, and physical) as a result of their interactions with other elements and the environment. These components’ metals and alloys possess a non-uniform crystal structure characterized by many micro-defects. Some defects are introduced in the blank-making process (metallurgical defects), and others appear during the machining process. As a result, the degradation of structural elements due to fatigue, wear, and corrosion occurs primarily in the SL and depends primarily on a combination of the topographic, mechanical, physical, chemical, and metallurgical properties of the SL, known as surface integrity (SI). Thus, modifying only the SL is the basis of the modern multi-disciplinary direction of surface engineering (SE), whose purpose is to develop efficient and cost-effective finishing processes to improve SI in correlation with the operational behavior of the respective components.
Classifications are available according to different characteristics of the various processes within the scope of SE [1,2]. According to the chemical composition change, the three main techniques for SL modification are as follows: (1) the diffusion of new chemical elements in the SL; (2) the addition of new material in the form of coatings or thin films; and (3) SL modification without changing the chemical composition of the material. The latter is the object of the present study.
Cost-effective SE processes without changing the chemical composition of the material are based on surface cold working (SCW) methods [3,4,5]. The essence of SCW lies in the surface plastic deformation of an SL at a temperature lower than the material’s recrystallization temperature. In addition, SCW methods are eco-friendly, as the mass of the components is conserved. The two types of SCW methods are dynamic and static [6].
Dynamic methods (e.g., shot peening, laser shock peening, and water cavitation) can be applied to complex surfaces. With static SCW methods (i.e., burnishing methods), the surface plastic deformation is continuous over time, and the equivalent plastic strain can be controlled using the corresponding technological parameters (governing factors). A significant advantage of burnishing methods is their implementation on conventional and CNC machines; thus, they are suitable for finishing rotary and flat surfaces. Regardless of the burnishing method of classification [6], the type of contact between the deforming element and the treated surface (i.e., rolling or sliding friction) has a determining role for the SI. In some cases [6], slide burnishing (SB) provides less roughness, significantly greater microhardness, larger-in-absolute-value compressive residual stresses, and, as a result, a greater mega-cycle fatigue strength compared to roller burnishing (RB) and deep rolling, because of the greater equivalent plastic strain of the SLs and near-subsurface layers.
The deforming element in SB typically has a spherical tip and, less often, a cylindrical tip [6]. The most common SB method is diamond deforming, which employs diamond deforming elements. Synthetic polycrystalline composites are the most commonly used diamond [7,8,9,10]. Other hard materials, such as single-crystal diamond [11,12,13], hard alloys [14,15,16,17,18], and hardened steel [19,20], are used occasionally. Recent research on SB on the correlation between SI and the operating behavior of slide-burnished metallic components was reviewed in [21].
Maximov et al. presented a new static SCW method for finishing cylindrical surfaces, called slide roller burnishing (SRB) [22]. Similar to the conventional RB method, SRB uses a deforming roller with a toroidal working surface, but its axis crosses that of the workpiece at an angle (i.e., a crossing angle). As a result, a relative sliding velocity occurs in the contact zone between the roller and the treated surface. The magnitude and direction of this sliding velocity can be controlled by adjusting the crossing angle.
Of the three main burnishing effects (smoothing, cold work, and beneficial compressive residual stresses) on SLs, the significantly lower roughness (resulting in mirror-like surfaces) is the indisputable advantage of SRB over RB. For example, in [22], AISI 316 steel exhibited a roughness improvement of 42%, while the surface microhardness improvement was only 7%. In addition, SRB achieves an oriented (anisotropic) surface texture. As a result, SRB is particularly suitable for finishing cylindrical structural elements made of stainless steel, whose typical applications require excellent corrosion resistance and very low roughness. These requirements are crucial for structural elements in the automotive and transport, aviation, medical equipment, and food industries. In these applications, the structural elements are subjected to dynamic or cyclic loads, and thus, the material fatigue is critical.
The authors of [21] established that in order to increase the fatigue life and limit, the corresponding finishing must provide an appropriate combination of the following SI characteristics: low roughness, increased microhardness, compressive axial and hoop residual stresses, and a modified microstructure. This correlation has been confirmed experimentally for different austenitic stainless steel grades [10,23,24].
The research discussed in [22] determined the optimal values of the governing factors (radius of the roller toroidal surface, r; burnishing force, F b ; feed rate, f; and crossing angle, α) for three SRB processes—smoothing, hardening, and mixed—in the treatment of AISI 316 stainless steel. They established “finishing—SI characteristics” correlations for these optimized SRB processes with the following SI characteristics: 2D height roughness parameters—Ra, Rq, Rp, and Rv; skewness, Rsk, and kurtosis, Rku, shape parameters; surface microhardness; and axial and hoop residual stress distributions.
To fully evaluate the effect of the relevant SRB processes on SI, we need a database comprising the microhardness profile and the microstructure near the SL. In addition to the markedly low 2D height roughness parameters, all three SRB processes provide negative skewness and kurtosis with values equal to or greater than three. In the case of a low integral roughness, Ra (or Rq), this combination of shape roughness parameters improves lubrication and reduces friction and sliding wear [25,26]. However, according to Zabala et al. [27], these shape parameters worsen the fatigue behavior.
Thus, we are interested in evaluating the influence of the skewness, Rsk, and kurtosis, Rku, shape parameters on fatigue behavior. Of note, the specified geometric and physical–mechanical characteristics of SI are interdependent, collectively affecting the operational behavior (including fatigue) of the respective components. For instance, the surface plastic deformation causes smoothing and strain hardening effects, which are evaluated based on the surface texture parameters, microhardness profile, residual stress distribution, and microstructure evolution. On the one hand, cyclic loading causes an evolution of the microstructure, leading to the relaxation of the introduced residual compressive stresses. On the other hand, the desired fatigue strength can be obtained for combinations of SI characteristics corresponding to different finishing processes. Therefore, for a comprehensive evaluation of the impact of the obtained SI characteristics and the effectiveness of optimized SRB processes on fatigue behavior, we need to determine the SI–fatigue behavior correlation.
This study aims to evaluate the effectiveness of the SRB method for increasing the fatigue life and fatigue limit of the most-used-grade austenitic stainless steel, AISI 304, based on a comparison with the conventional RB method. The present study extends our previous work [22], which described SRB kinematics in detail.

2. Materials and Methods

This study employed AISI 304 austenitic stainless steel in the form of hot-rolled bars with a 20 mm diameter in the as-received state. We established the chemical composition via optical emission spectrometry. Tensile tests at room temperature (20 °C) were conducted using a Zwick/Roell Vibrophore 100 testing machine (Ulm, Germany). The main mechanical characteristics were defined as the arithmetic mean values of three specimens [28] (Figure 1a). The hardness was measured via a VEB-WPM tester (Markkleeberg, Germany) with a spherical-ended indenter that had a diameter of 2.5 mm, a loading of 63 kg, and a holding time of 10 s.
RB and SRB (Figure 2) were implemented on an Index Traub CNC lathe (Esslingen am Neckar, Germany) using Vasco 6000 lubricant.
The specific difference between SRB and RB is the contact type between the deforming roller and the treated surface—sliding friction and rolling, respectively. The kinematics of the two methods (the feed motion is turned off) are schematically shown in Figure 3. In RB, the deforming roller performs clean rolling on the processed surface (Figure 3a). Due to the crossing of the axes at SRB, a relative sliding velocity occurs at the contact point, O, between the roller and the surface, v O , r slide , (Figure 3b.2), which is set by the workpiece angular velocity, ω w , and the crossing angle, α.
The governing factors were the radius, r , of the roller toroidal surface; the burnishing force, F b ; the feed rate, f ; and the velocity, v , of a point along the burnished surface. Specific combinations of governing factors defined different burnishing processes. According to Ecoroll [29], two processes are critical in practice—smoothing and hardening.
The main goal of the smoothing process is to achieve a mirror-finish surface and a high surface bearing ratio, while the hardening process aims to increase fatigue life and fatigue strength by inducing significant residual compressive stresses and work hardening in the SL. This study employed the optimal governing factors for smoothing and hardening RB processes that were obtained in [22] for AISI 316 steel. In addition, the optimal values of the angle, α (the crossing angle between the workpiece and deforming roller axes), for smoothing and hardening SRB processes are α = 45 ° and α = 30 ° , respectively [22], and these values are used in this work. The tested steel in [22] was AISI 316, which has a significantly lower yield limit, tensile strength and hardness, and greater elongation than the AISI 304 steel used in the present study.
Four processes were defined for this study, using the governing factor magnitudes in Table 1—RB-A, SRB-A, RB-B, and SRB-B—corresponding to the smoothing and hardening processes established in [22] for AISI 316 steel. The deforming rollers, having a diameter of 26 mm, were made of 1.3343 tool steel. After heat treatment, the measured hardness was 63 HRC.
The steel’s 2D roughness parameters were measured using a Mitutoyo Surftest SJ-210 surface roughness tester (Kawasaki, Japan) and the average arithmetic values from the measurements on six equally spaced sample generatrixes were obtained.
A ZHVµ Zwick/Roell microhardness tester (Ulm, Germany) was used to establish the microhardness of the surface (0.05 kgf loading) and the microhardness profile along the depth (0.01 kgf loading), with a holding time of 10 s. The final surface microhardness value was considered to be the median of the clustering of ten measurements.
To determine the content of strain-induced martensite in the surface layer (relative to austenite), we used a Bruker D8 Advance diffractometer (Billerica, MA, USA) and a DIFFRAC.Dquant V1.5 specialized software developed by Bruker [30]. The characteristics of the residual stress X-ray measurement are shown in Table 2.
The microstructures and surface fractures were observed via scanning electron microscopy (SEM, Zeiss Evo 10, Jena, Germany).
Rotating bending fatigue tests were conducted on a UBM testing machine (Markkleeberg, Germany). The loading frequency was 50 Hz in air. Each specimen was tested to complete destruction. Exceptions include the samples that reached a cycle fatigue strength of 10 6 , after which the test was terminated. The specimen geometry [31] is depicted in Figure 1b. Five groups of specimens were manufactured. The first group was treated by turning and polishing and served as a reference condition (RC). Polishing was carried out to satisfy the requirements of the relevant standard for the surface roughness of the fatigue specimens. The remaining four groups were treated using RB-A, SRB-A, RB-B, and SRB-B processes. The burnishing processes were carried out after turning without polishing.
The strategy used in the fatigue tests and repeatedly verified in our long-term practice for specimens made of hot-rolled steel bars is as follows: (1) larger number of experimental points; (2) one specimen for an experimental point (i.e., stress amplitude) and a small step change of the stress amplitude, starting from the maximum stress, usually 85–90% of the tensile strength; and (3) when a larger deviation from the outlined trend is obtained at a given point, which is usually contributed by multiple stochastic causes, the test is repeated at the same experimental point until a stable result is obtained.

3. Results and Discussion

3.1. Material Measurements

Table 3 shows the chemical composition of the used AISI 304 steel. The remaining chemical elements (complementing up to 100 wt%) are Al, Pb, Sn, B, Zr, Se, and Sb. The main mechanical characteristics are shown in Table 4.

3.2. SI Characteristics

3.2.1. Roughness

The average roughness before burnishing, R a init , was 0.482 μm. A comparison of the evaluation profiles obtained through RB and SRB is shown in Figure 4; Table 5 lists the 2D roughness parameters obtained via turning, RB, and SRB. The SRB-A and SRB-B processes led to significantly lower height and functional roughness parameters, more negative skewness, and a kurtosis value greater than three, compared to the results of the RB-A and RB-B processes. The shape roughness parameters (Rsk and Rku) directly influence the operational behavior of the corresponding component [32,33].
According to [25,26], the combination of low amplitude parameters with significant negative skewness and a kurtosis value greater than three is a condition for higher wear resistance in the lubrication condition. However, the authors of [27] found that more negative skewness can worsen the fatigue behavior, because the deep valleys (in which mixed and boundary lubrication friction modes act as lubricant micro-reservoirs) are potential stress concentrators. In contrast to [22], where the processed material was significantly softer and ductile, the RB-B and SRB-B processes in the present study led to lower values of amplitude and functional roughness parameters than those using the RB-A and SRB-A processes. In addition, both the RB-B and SRB-B processes resulted in smaller absolute values of skewness and kurtosis compared to the RB-A and SRB-A processes. Based on [25,26,27], we expect that the SRB-A process improves the tribological behavior of the processed component. Still, it is less effective in improving fatigue strength than the RB-A process.
Figure 5a visualizes the comparison for the most commonly used roughness parameter, Ra. The results obtained (0.186 μm and 0.105 μm) using RB are compatible with those reported in [24,34]. Using a single-pass RB with a toroidal roller, Ben Moussa et al. [24] achieved R a = 0.14   μ m for 304 steel (yield limit 320 MPa and tensile strength 615 MPa). By means of single-pass hydrostatic ball burnishing, de Oliveira et al. [34] achieved R a = 0.12 0.15   μ m for 304 steel (207 MPa and 586 MPa).
SRB-A and SRB-B reduced the roughness parameter, Ra, by seven and nine times, respectively, compared to fine turning, thus, yielding mirror-like surfaces. The values of the roughness parameter, Ra, (0.073 and 0.055 μm) are lower than those obtained through single-pass diamond burnishing (DB). Maximov et al. [35,36] achieved R a = 0.09   μ m for 304 steel (432 MPa and 734 MPa) and R a = 0.06 0.09   μ m for 316 steel (510 MPa and 642 MPa). This result indicates the advantage of the new SRB method under the smoothing effect criterion.

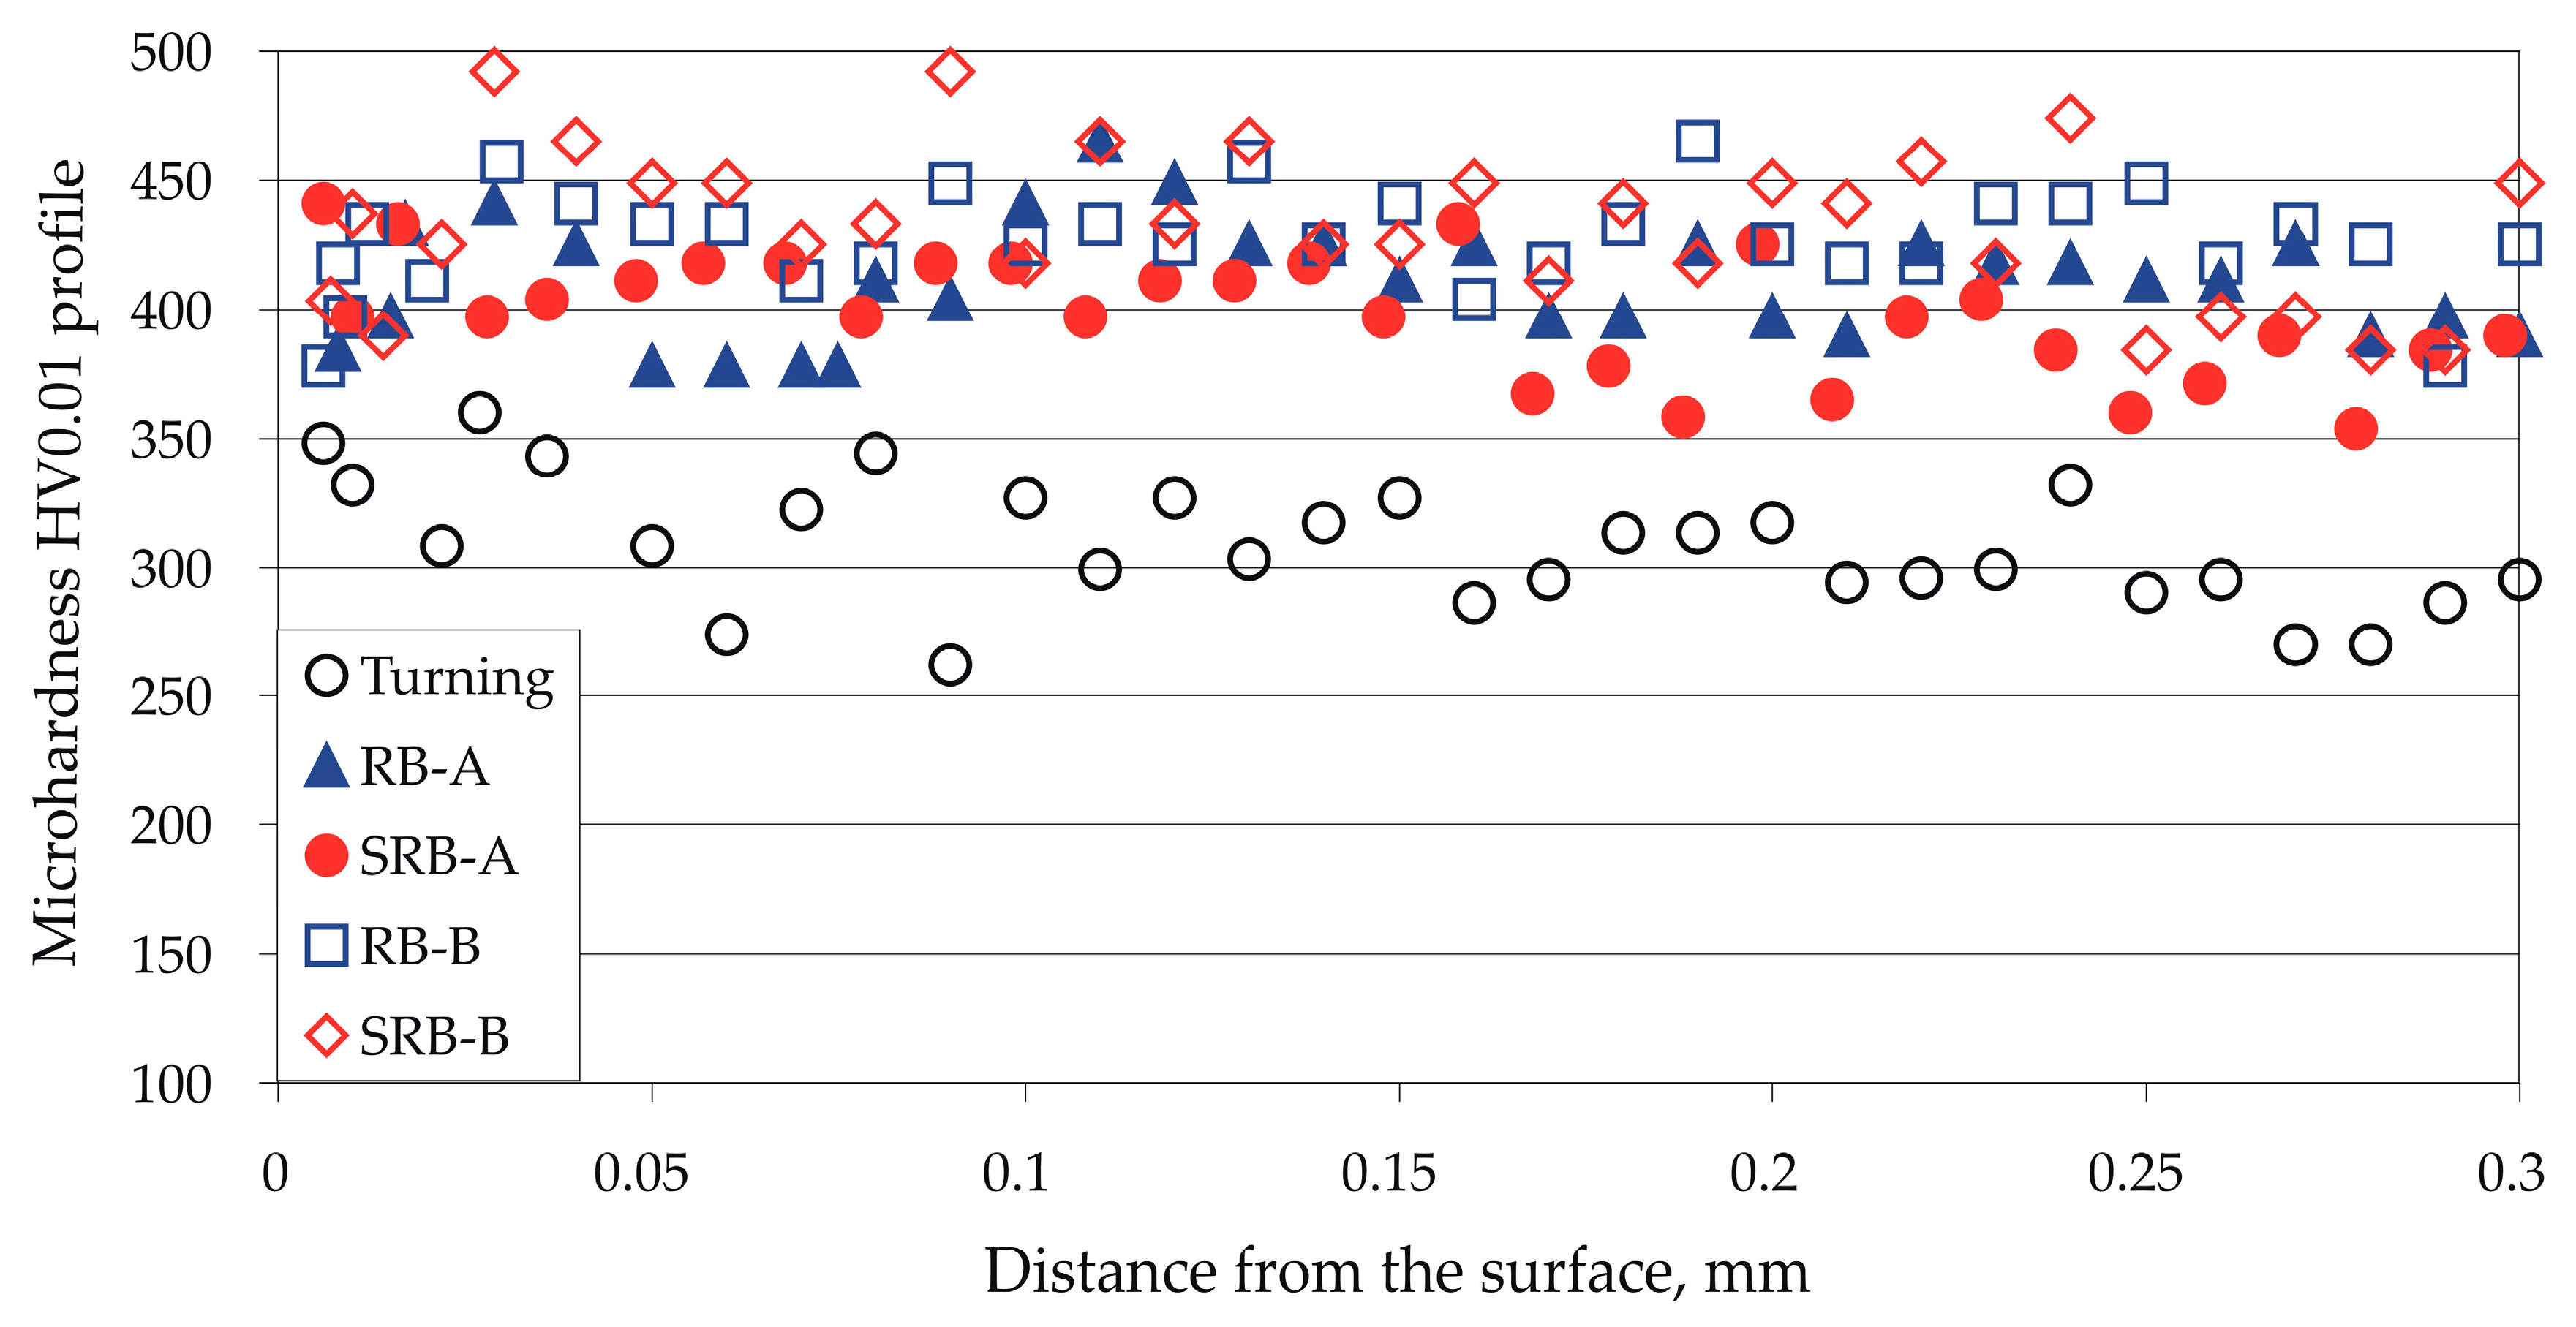
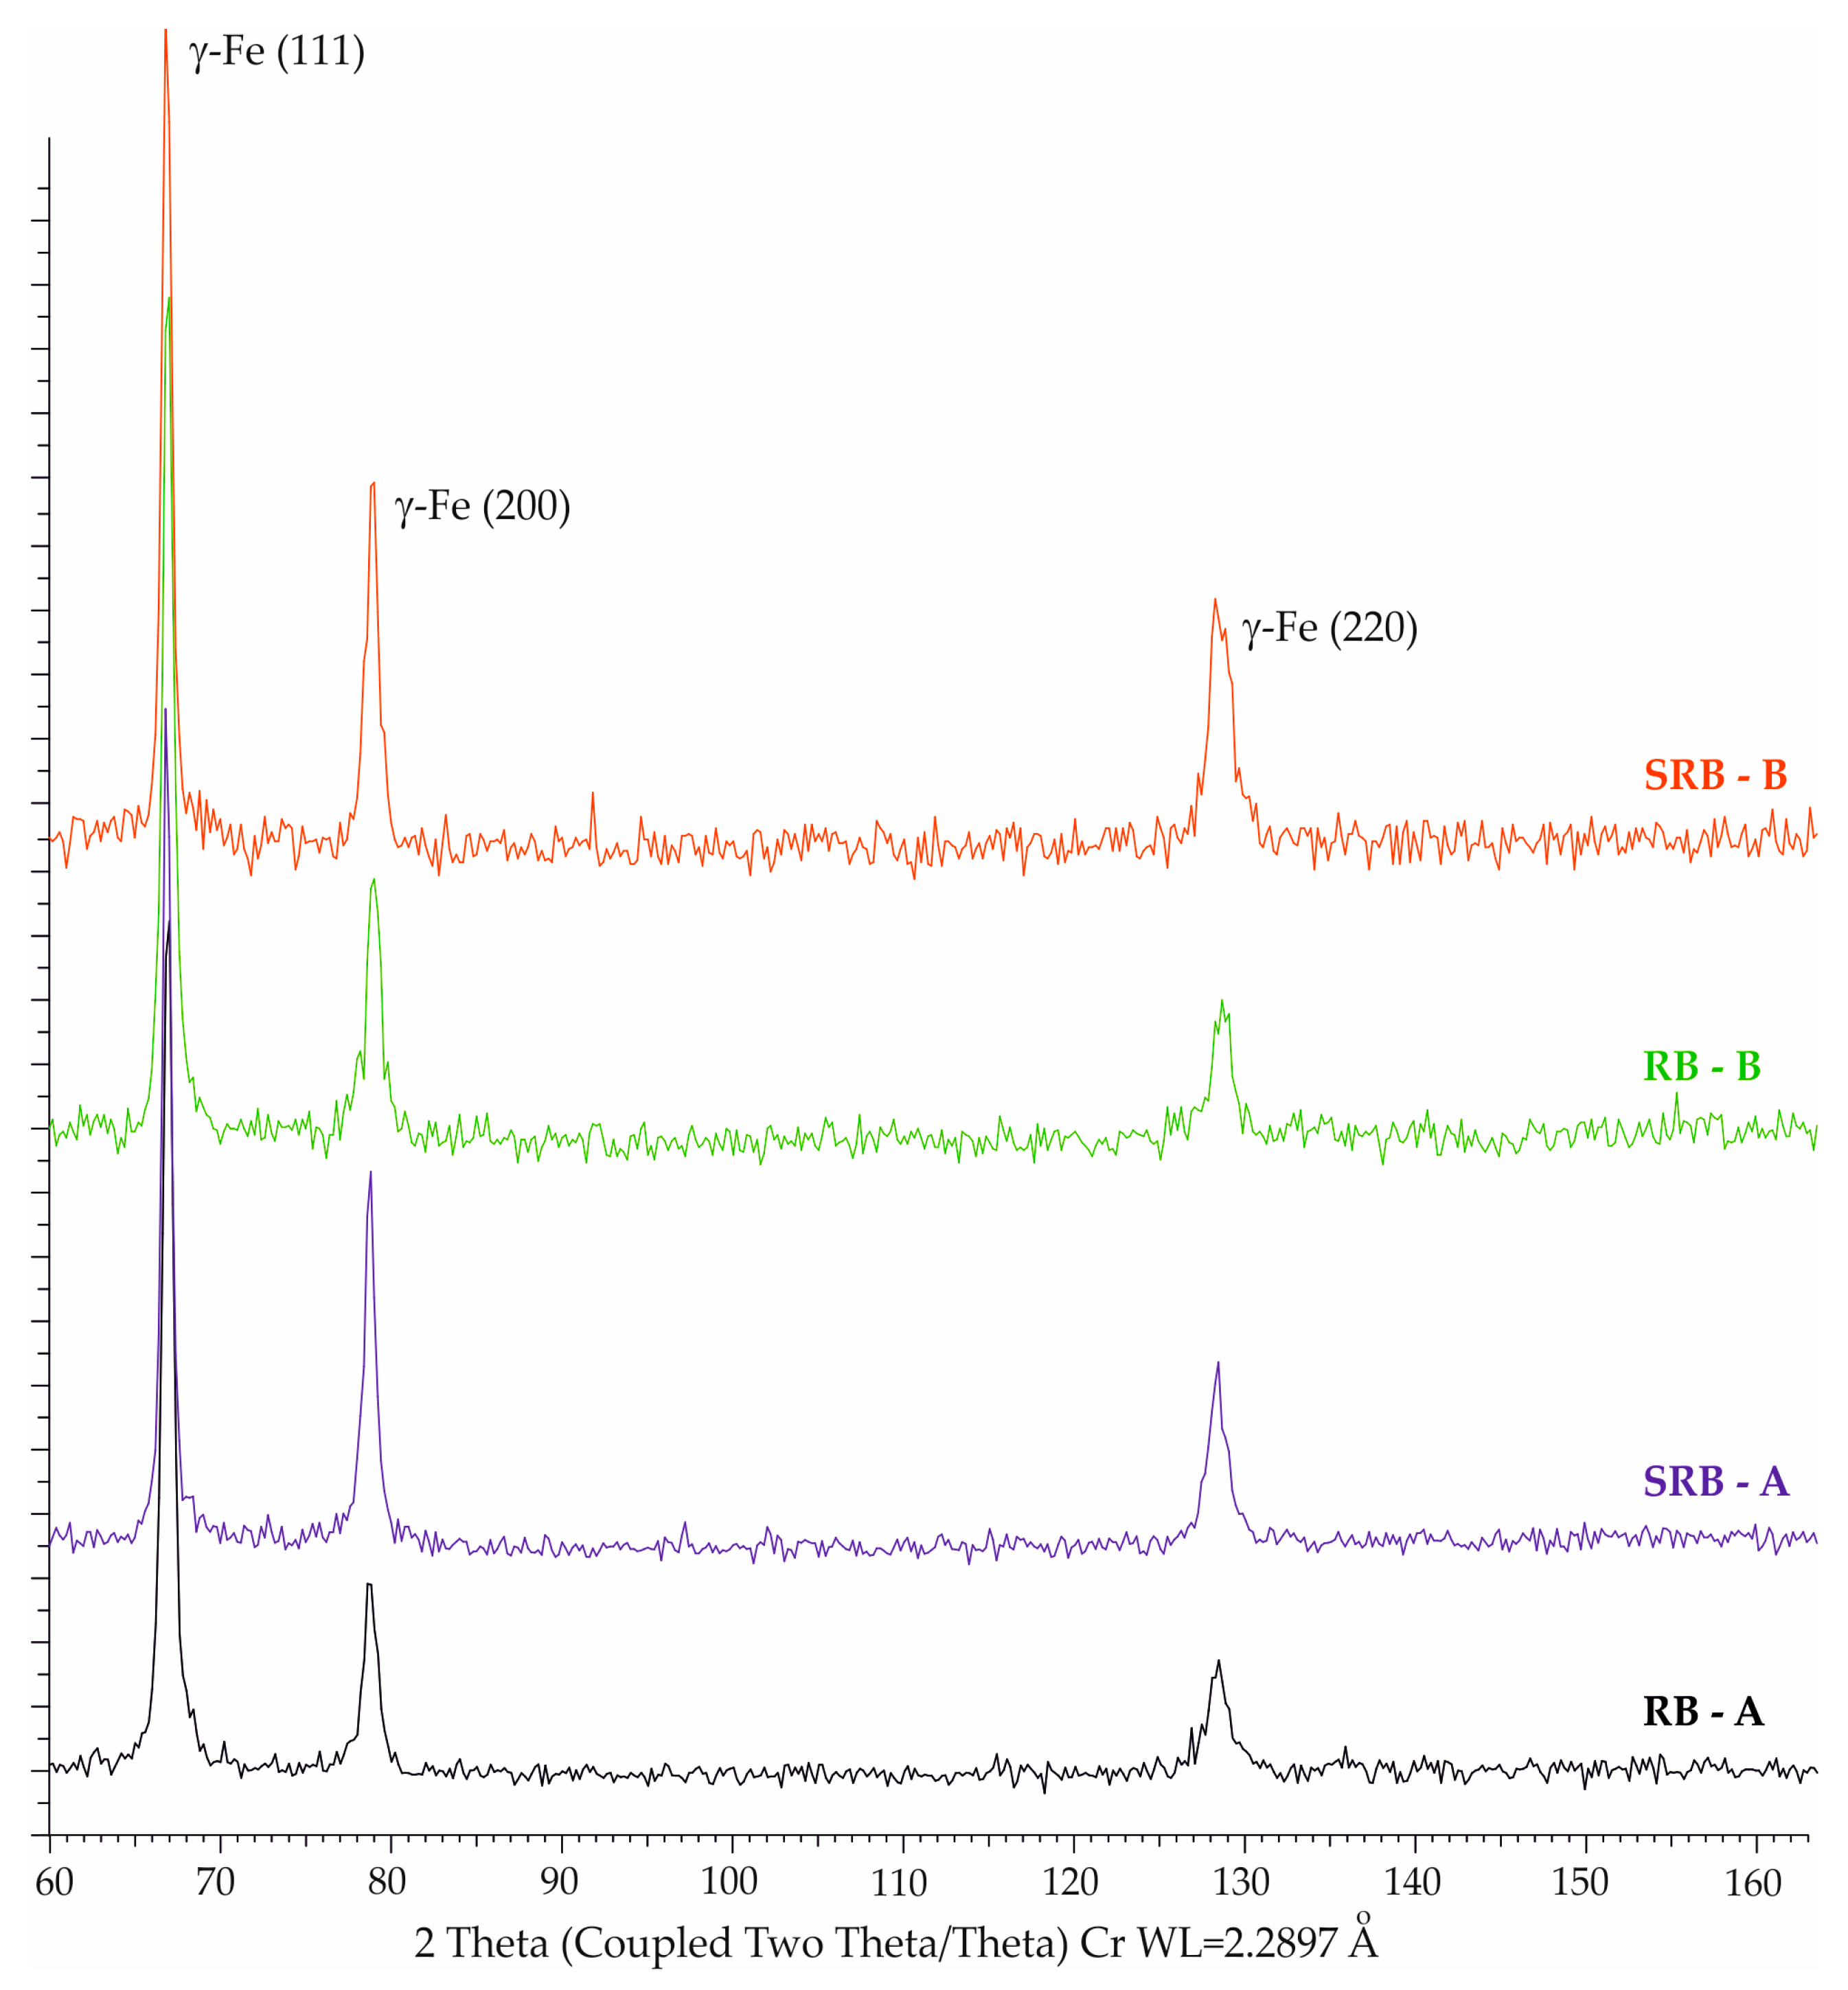
3.2.2. Microhardness and Phase Analysis Results

Figure 5b shows a comparison of the surface microhardness obtained using different processes. All burnishing processes yielded a higher surface microhardness compared to turning—RB-A showed the largest difference (32%), and SRB-B had the smallest difference (9%). Both RB processes led to a greater microhardness compared to the SRB processes. One reason for this may be the larger area of contact between the deforming roll and the processed surface in SRB [22], since, for equal burnishing forces, a larger contact area results in a smaller equivalent plastic deformation of the surface and a lower amount of strain hardening of the material.
Although the RB-B and SRB-B processes used a higher burnishing force (550 N), they caused a lower surface microhardness compared to the corresponding RB-A and SRB-A processes, which were implemented at 250 N. This phenomenon was due to the large difference in the feed rate for the two pairs of processes—RB-B and SRB-B used a feed rate of 0.11 mm/rev, while that of the RB-A and SRB-A processes was 0.05 mm/rev. With other parameters being equal, the higher feed rate creates a decreasing surface microhardness [22] due to the decreasing overlapping effect, which decreases cyclic hardening. This effect was established by the authors of [37].
Vickers microhardness testing was performed on the polished cross-sections to obtain the microhardness distribution along the depth from the surface (Figure 6). All burnishing processes achieved a higher microhardness along the depth compared to turning. In contrast to the observed trend at the surface, where the effect of slower feed prevailed over the effect of higher burnishing force, the RB-B and SRB-B processes caused greater microhardness below the surface compared to the RB-A and SRB-A processes. The reason for this is that the overlapping effect decreases beneath the surface.
The phase analysis outcomes are shown in Figure 7. The presence of strain-induced α’-martensite was not observed.

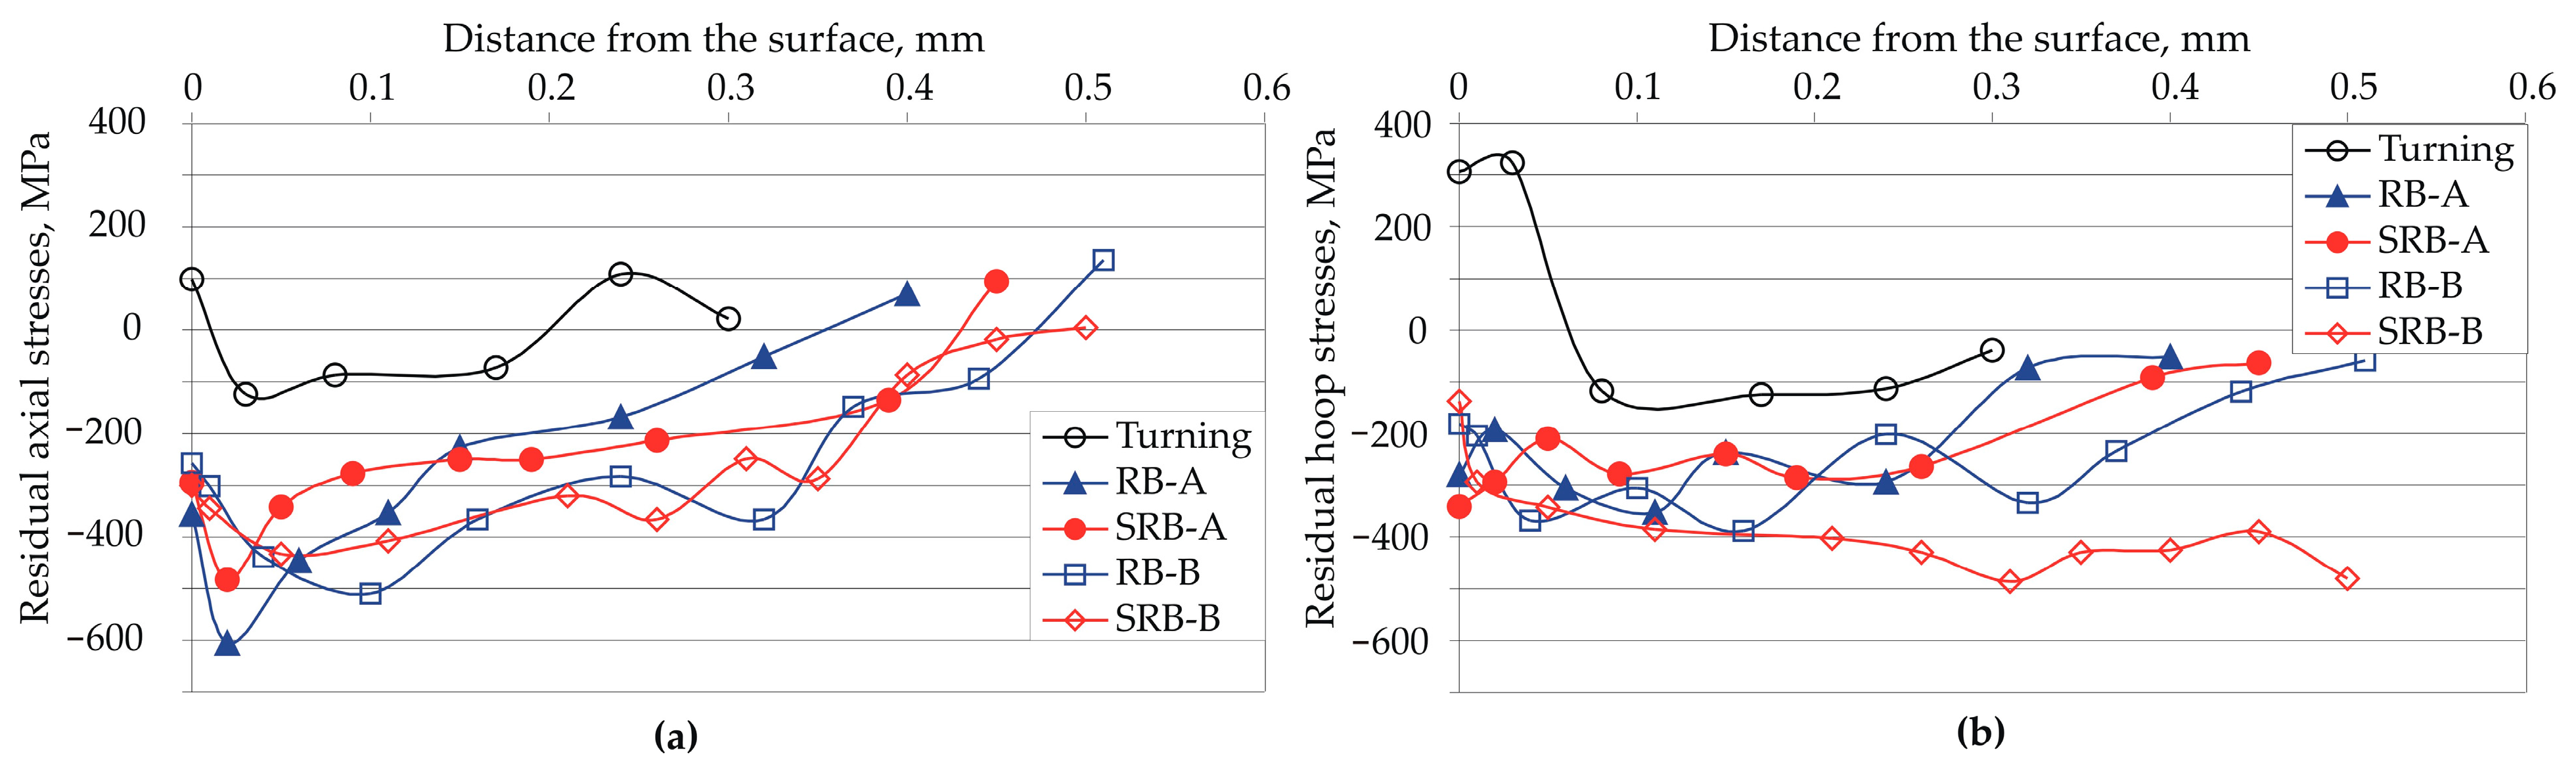
3.2.3. Residual Stresses

Figure 8 shows the residual stress distribution obtained using the various processes, and Table 6 shows the errors in residual stress measurement. The turning introduced tensile residual stresses in the surface layer. All burnishing processes introduced significant compressive residual stresses at an increased depth compared to turning. Compared to the A processes, RB-B and SRB-B, with the higher burnishing force (550 N), created deeper compressive zones, and the maximum compressive residual stresses were further away from the surface. However, the RB-A and SRB-A processes provided the largest surface residual compressive stresses. Each SRB process created a deeper zone of residual compressive stresses compared to the corresponding conventional RB processes. This effect was more pronounced in the residual hoop stresses (Figure 8b).
In general, the trends characterizing the residual stress distribution for the four burnishing processes are largely similar to those for the microhardness distribution, since the residual stresses and microhardness have a common physical basis—the equivalent plastic deformation, depending mostly on the burnishing force, and the cyclic hardening effect, which is primarily a function of the feed rate.

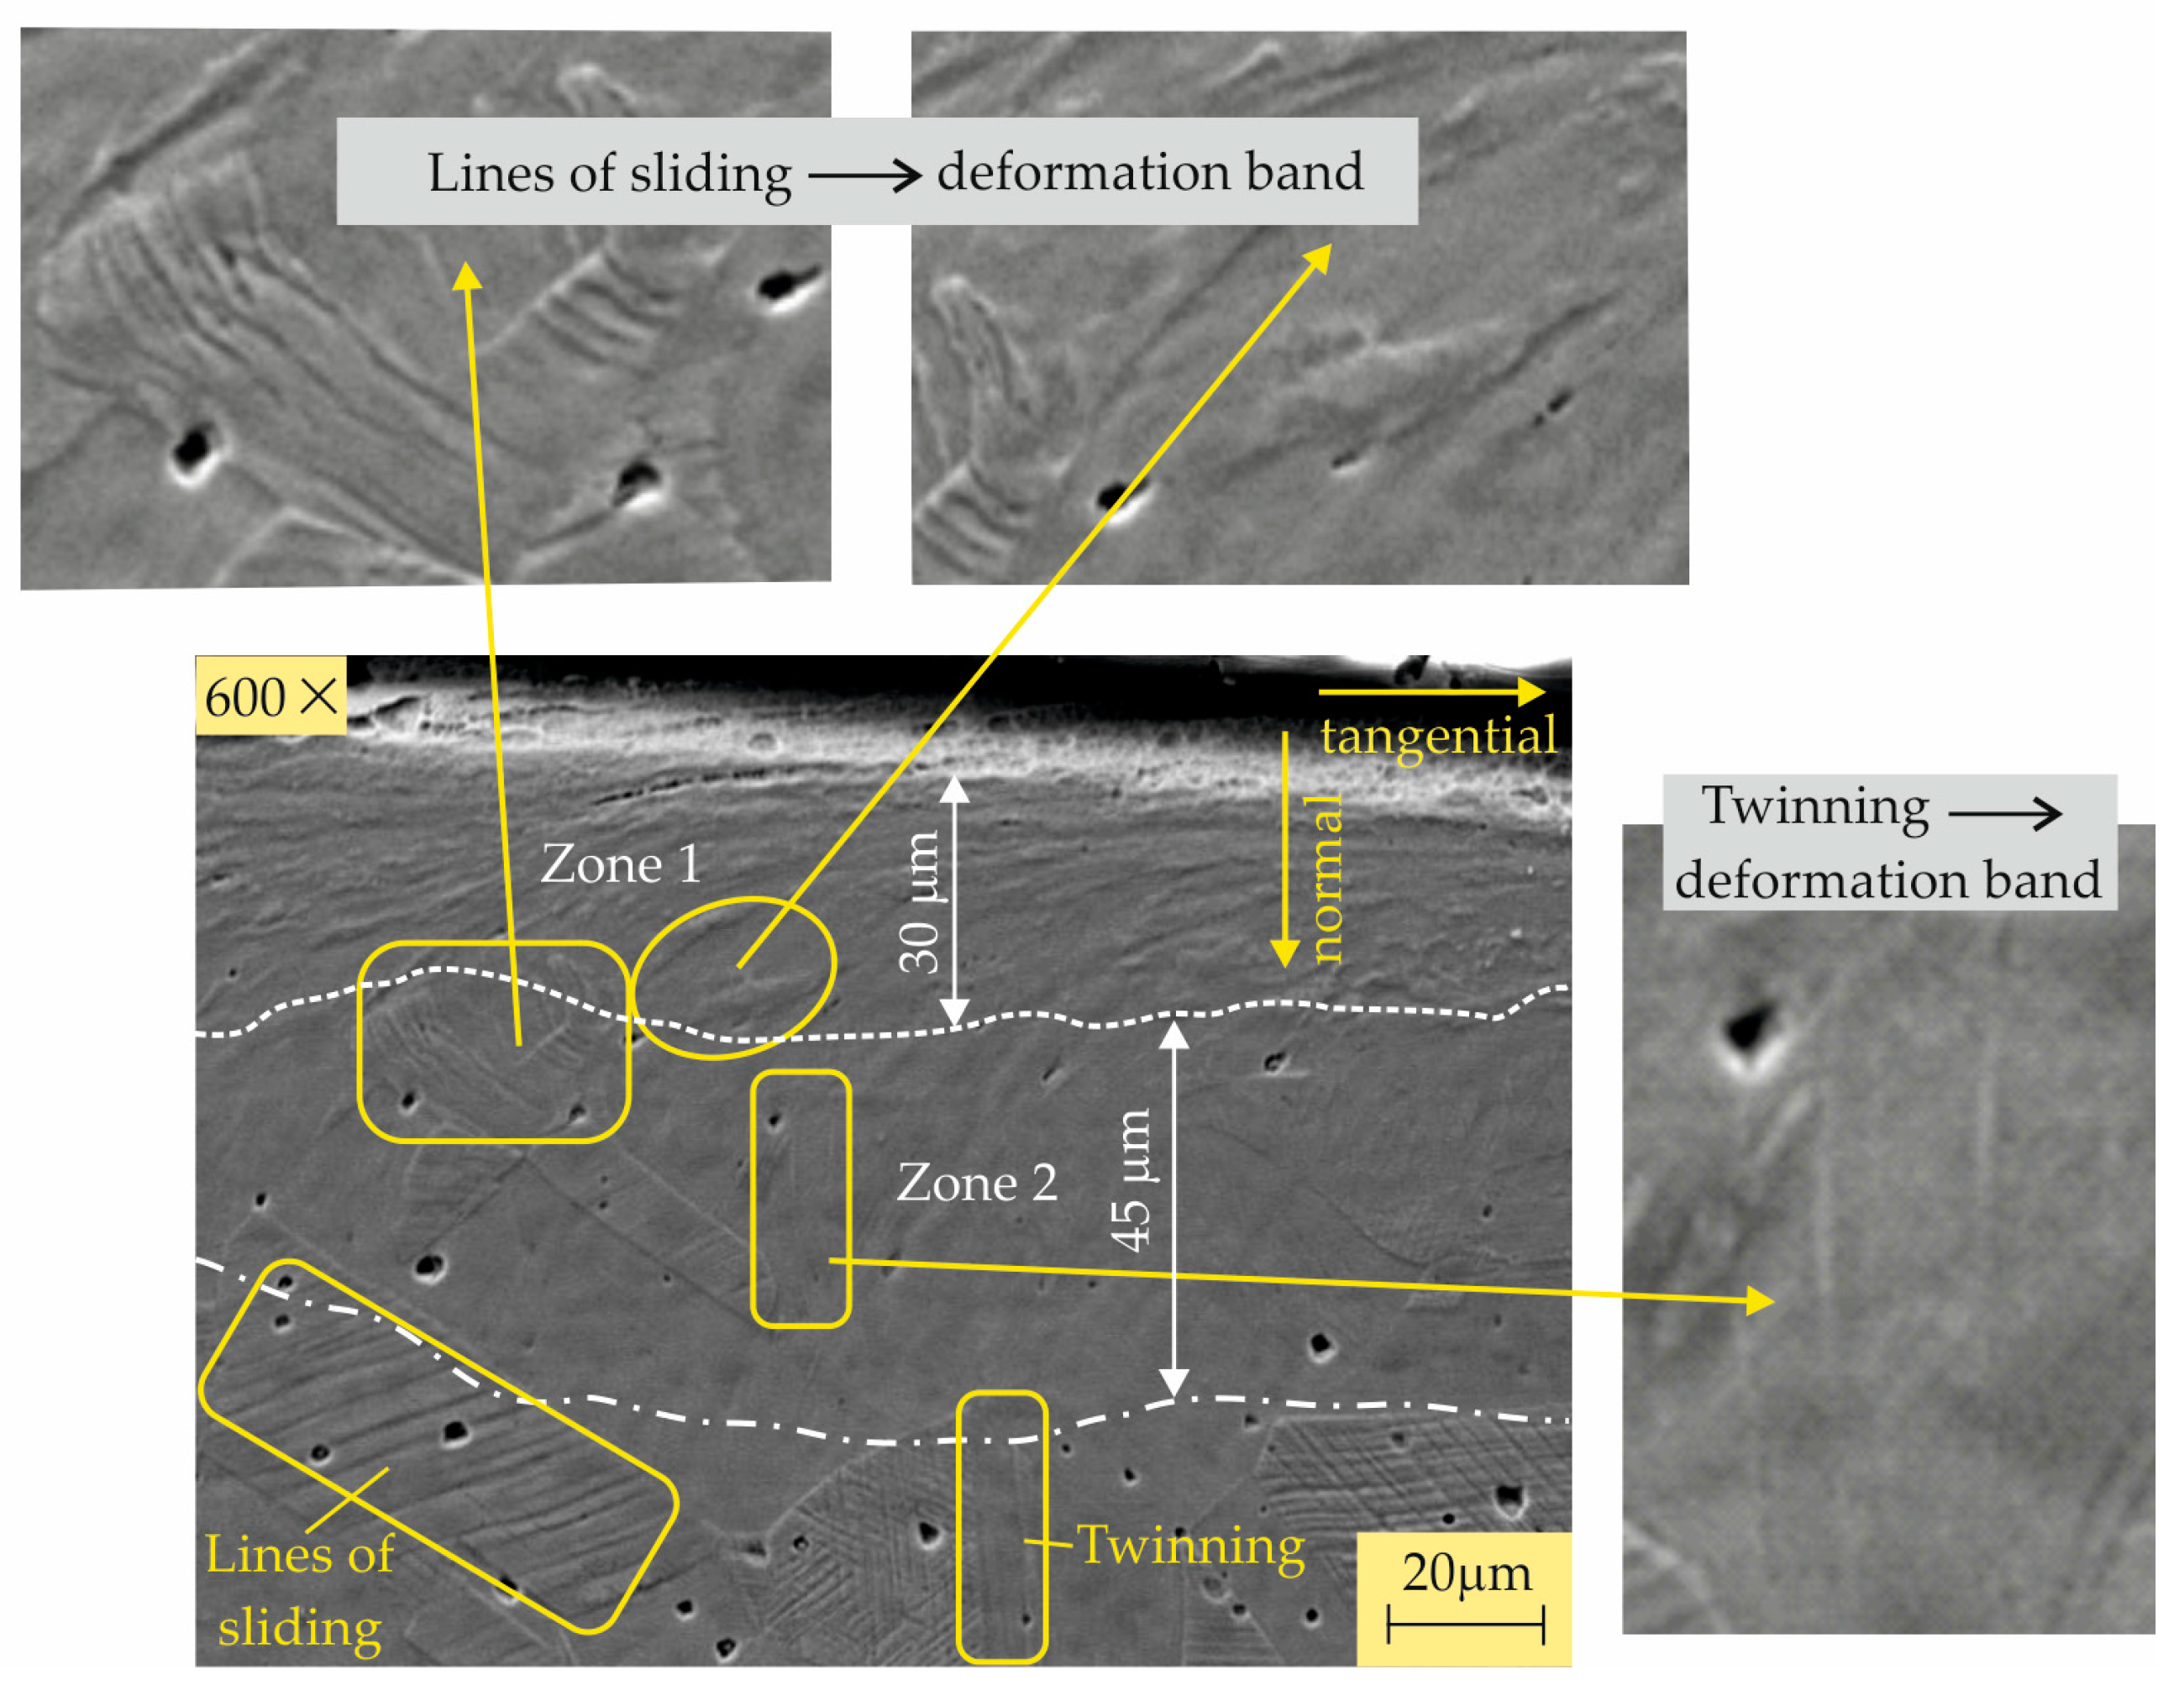
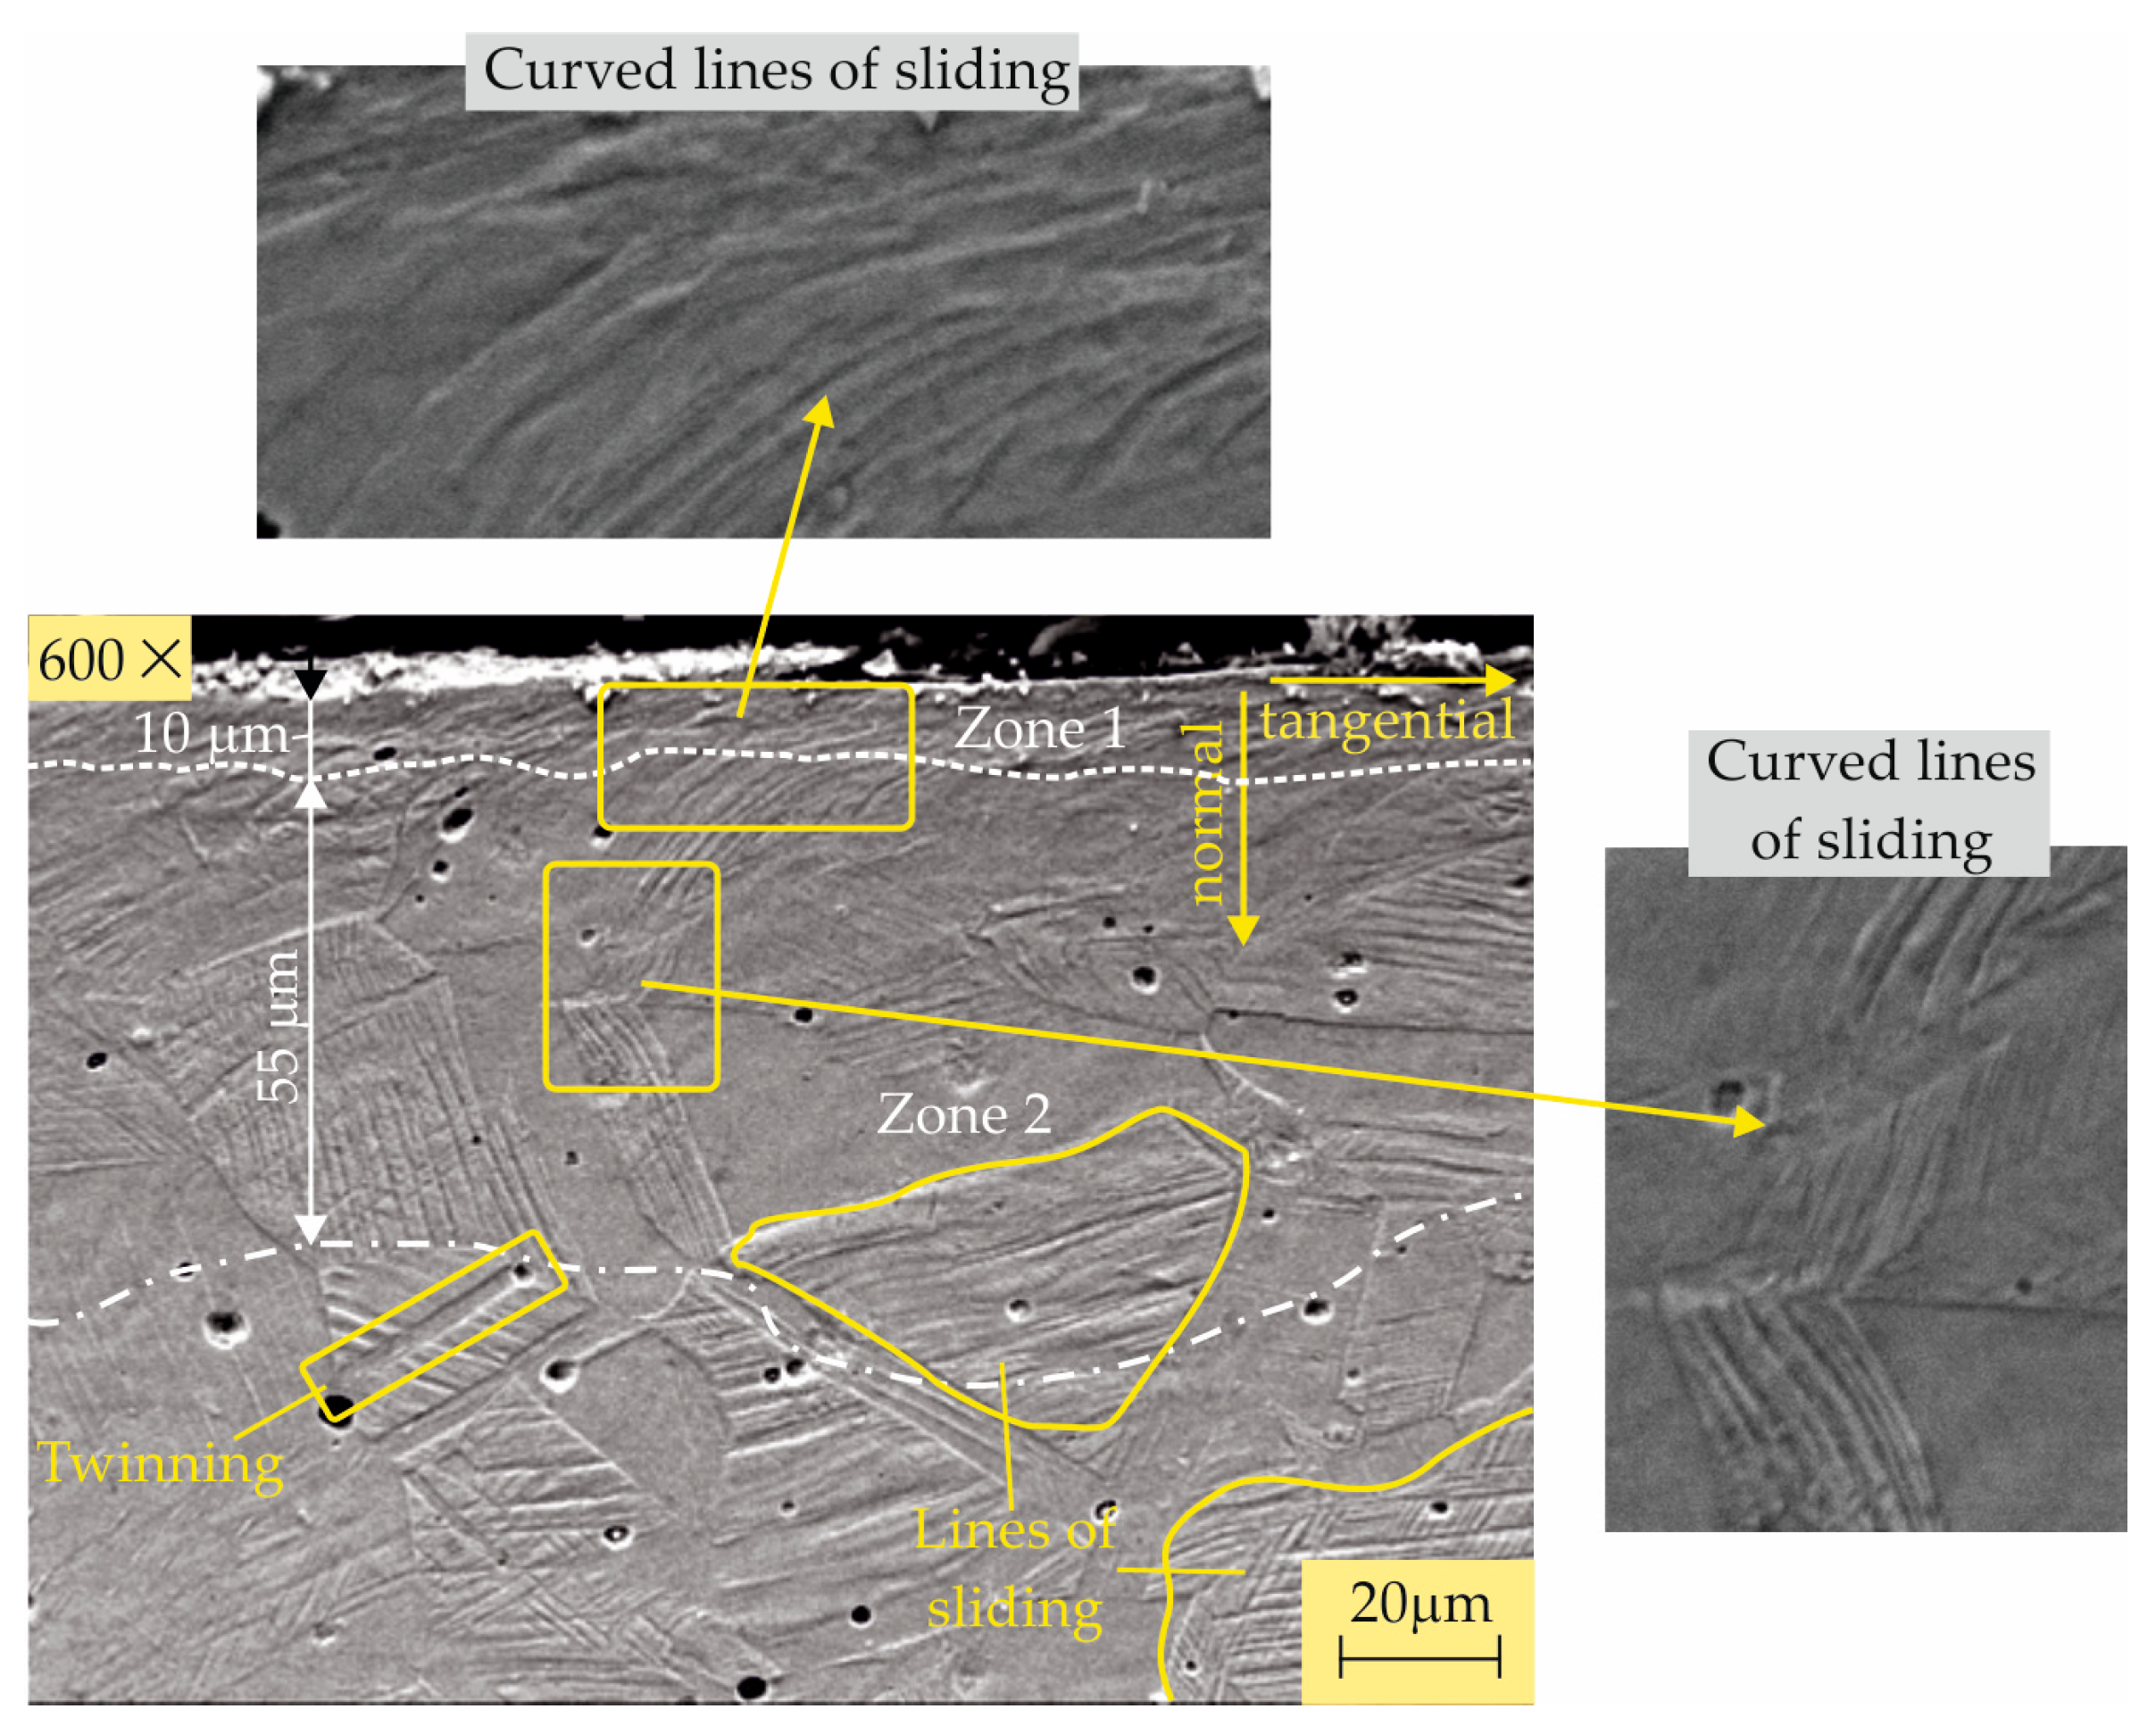
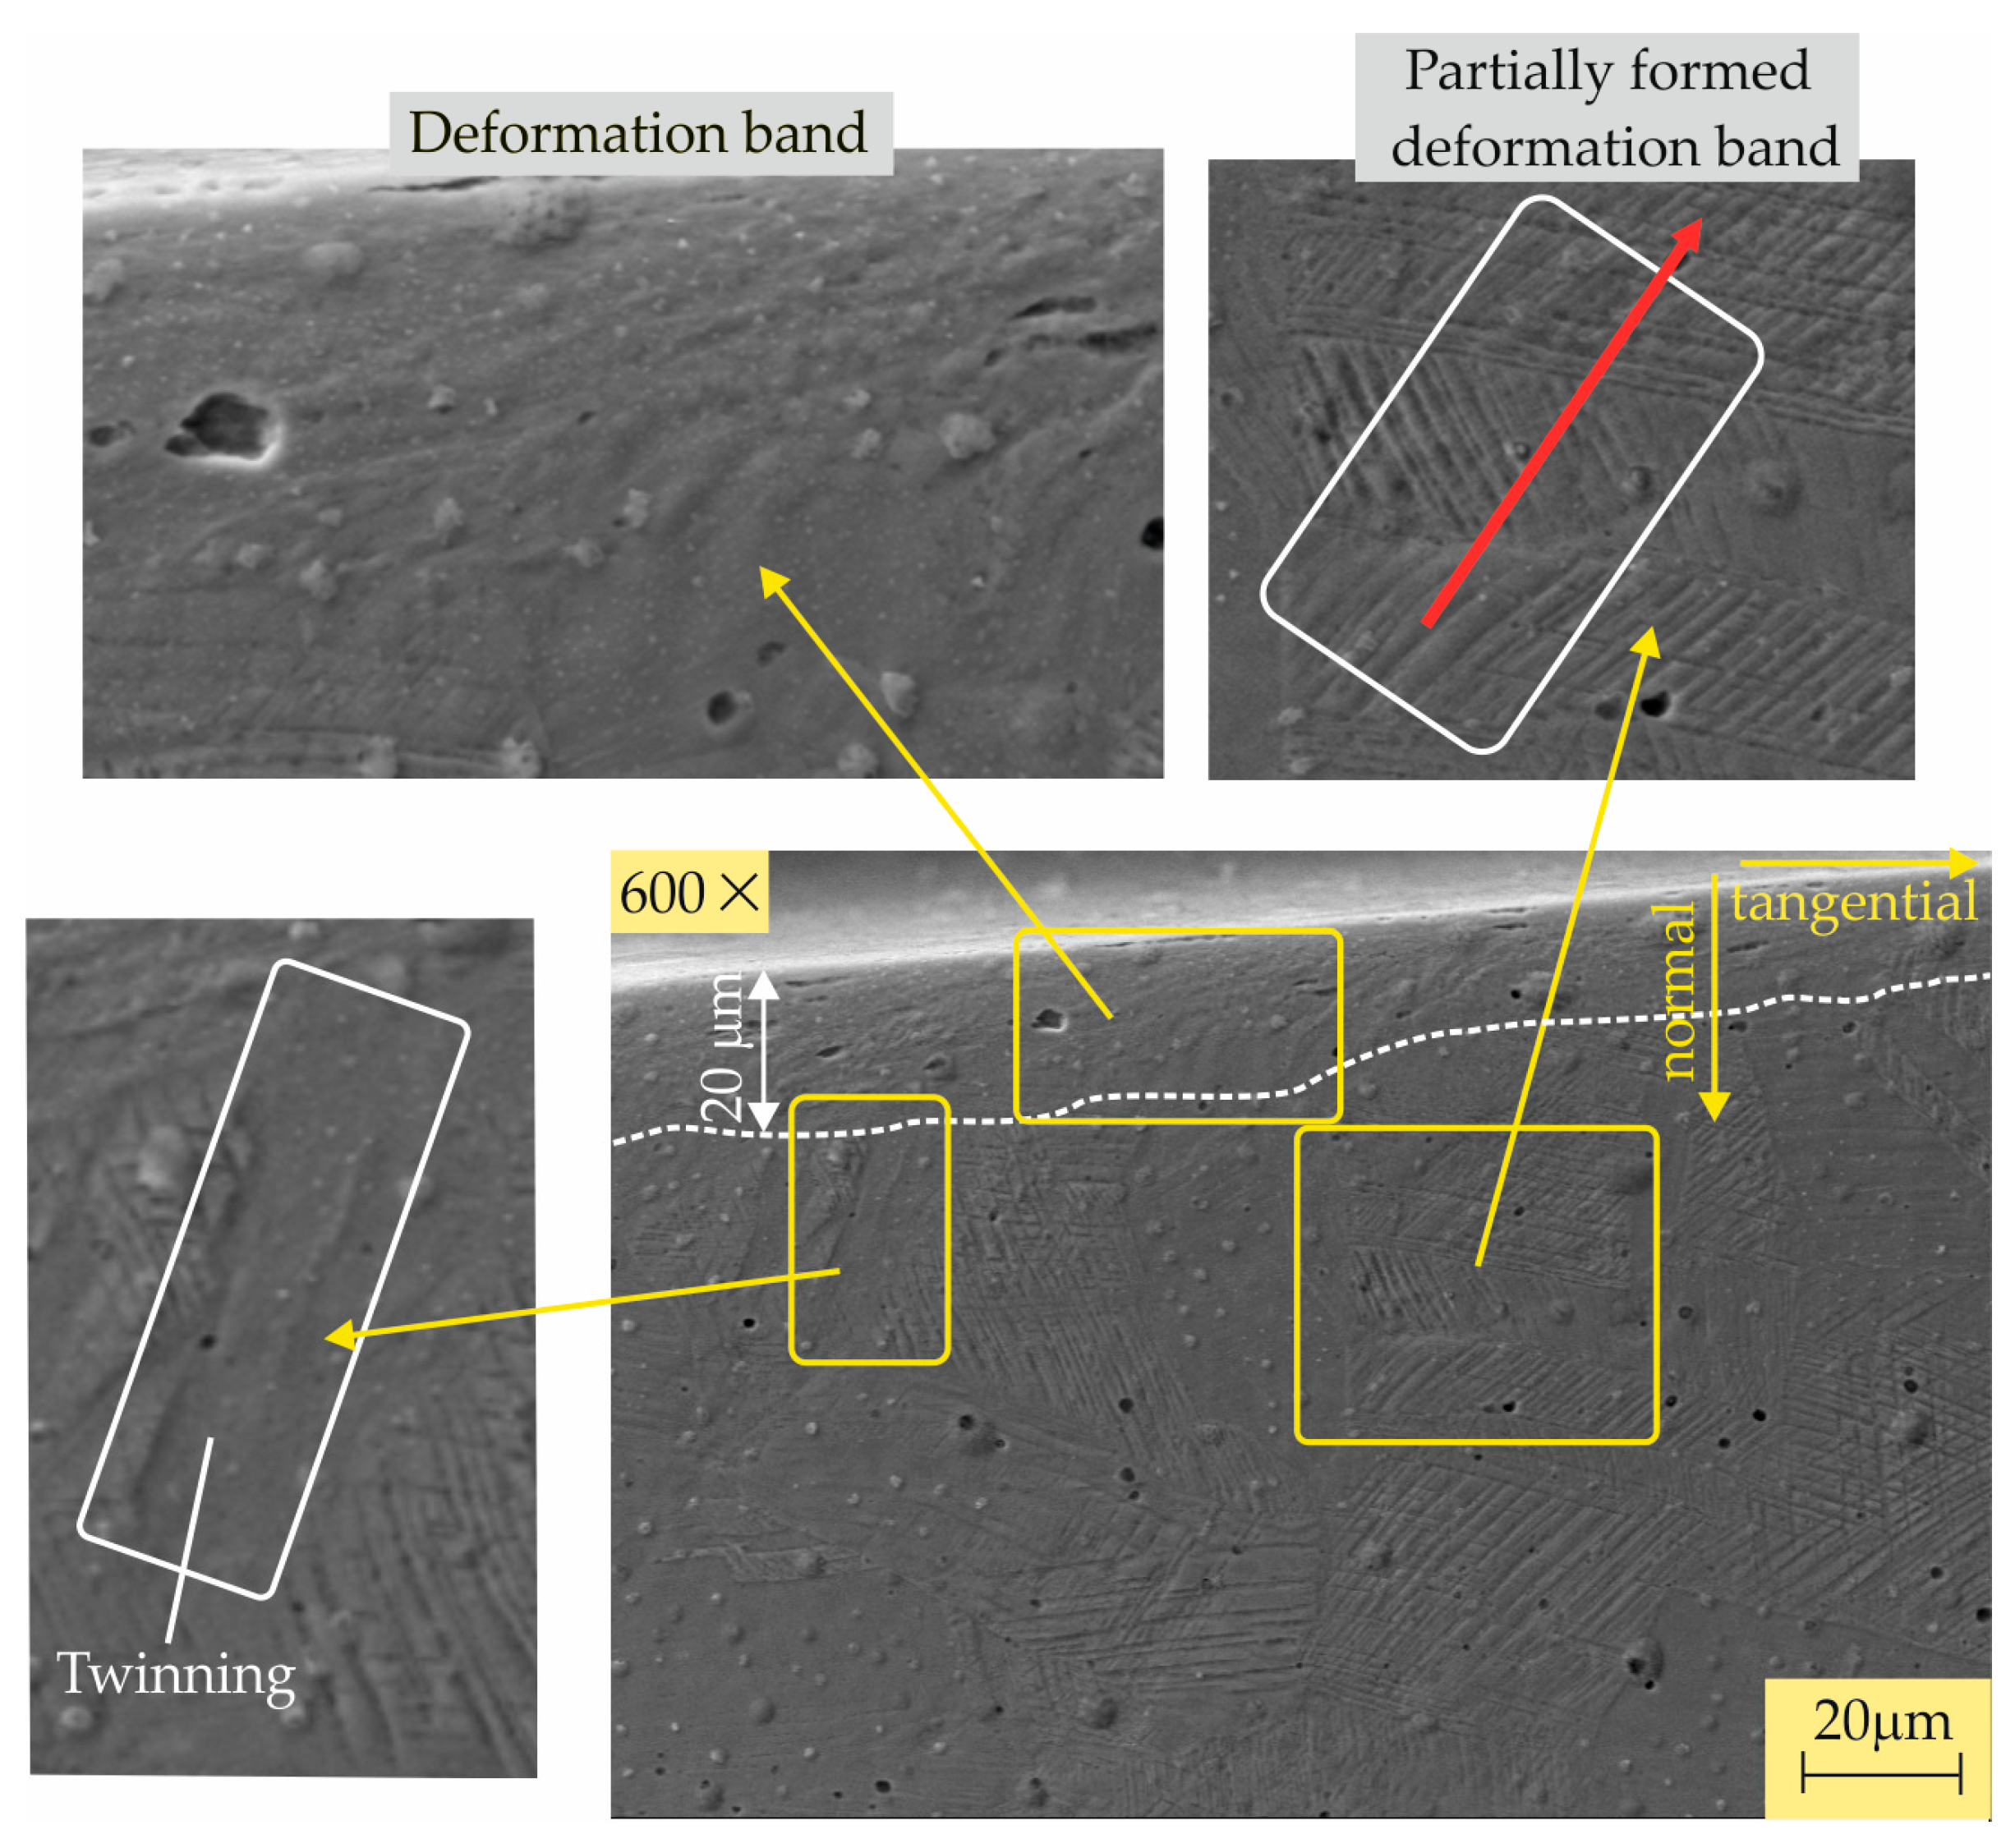
3.2.4. Microstructures

Figure 9 shows the microstructure of the surface and subsurface layers at a cross-section of a specimen processed using the RB-A process. More significant structural changes are observed at a depth of up to 30 μm from the surface (zone 1). In this zone, the sliding lines are oriented in the direction of the relative movement of the deforming roller in relation to the sample, being locally transformed into deformation bands with distinct boundaries. In zone 2, with a depth of about 45 μm, we see a transformation of the twin boundaries to the construction of strain lines across these boundaries. Below zone 2, sliding lines typical of the structure are present, which are formed depending on the crystallographic orientation of the grains and twins.
Figure 10 shows the microstructure of the surface and subsurface layers after SRB-A. A refined layer with a thickness of about 10 μm (zone 1) can be observed under the surface. This modified layer consists of refined grains that are elongated in a hoop direction. Under this layer, at a depth of up to 60 μm, the warped sliding lines are due to the tangential deforming force with which the deforming roller acts on the surface layer, owing to sliding friction. Below zone 2, sliding lines are observed to be dependent on the crystallographic orientation of the grains and twins.
Figure 11 shows the microstructure due to the RB-B process. The more significant structural changes are at a depth of up to 30 μm, whereby the warping of the sliding lines in the direction of the deforming roller motion relative to the treated surface can be observed. Below this zone, the sliding lines are straight and oriented according to the respective crystallographic planes.
The formed microstructure due to the SRB-B process is shown in Figure 12. At a depth of about 20 μm, a refined layer with fiber grains has formed, as a consequence of sliding friction contact between the deforming roller and the surface being treated. The greater burnishing force (550 N), in combination with sliding friction, increases the temperature in a thin surface layer (10–15 μm) because of this steel’s low thermal conductivity. This favors the polygonization of this layer. The diffractogram (Figure 7) shows that the X-ray lines (200) in the SRB-B specimen are narrower at the base than those of the RB-B specimen, which is a criterion for a lower dislocation density, which, in turn, is confirmed by the measured smaller surface microhardness. Underneath the refined layer, a partially constructed deformation band passing through a twin is present. The direction of the strip is indicated by a red arrow.

3.3. Fatigue Behavior

3.3.1. S-N Diagrams

Figure 13 shows the S-N diagrams and illustrates the actual experimental results, i.e., these are not statistical results, obtained on the basis of multiple repetitions in several experimental points. It should be noted that the purpose of the study is not to obtain absolute statistical results, but to compare the effect of different states of surface integrity (obtained through different finishing processes) on the fatigue behavior. The following is observed:
  • All four burnishing processes significantly improve the fatigue strength (the fatigue life, respectively) more so than turning and polishing, i.e., RC, with the improvement increasing closer to the boundary ( 10 6 cycles) between high- and mega-cycle fatigue fields. The following results are due to the significant improvement of SI: (1) a substantial reduction in the height and functional roughness parameters; (2) an increase in the microhardness on the surface and below; (3) introduced compressive residual stresses; and (4) grain refinement in the surface and subsurface layers. The observed tendency to increase the fatigue life when the stress amplitude decreases is in accordance with the results obtained by Ben Moussa et al. [24] for the fatigue behavior of 304 steel (yield limit 320 MPa and tensile strength 615 MPa) specimens processed using single-pass RB with a toroidal deforming roller. These authors found that at 188,509 cycles of RC, the improvement was 250%, while in the low-cycle fatigue field at 7650 cycles, the improvement was only 14%.
  • The RB-B process is more efficient than the RB-A process when the stress amplitude is over 540 MPa. Assuming that the bending yield limit is equal to the yield limit determined using the tensile test (see Table 4), the RB-B process is more effective in both low-cycle fatigue (where plastic deformations occurs) and at the beginning of the high-cycle fatigue field, where the strains are elastic. When the stress amplitude is below 540 MPa, the RB-A process leads to a greater fatigue life. Therefore, at smaller bending stress amplitudes, greater surface cold work, resulting in maximum surface microhardness (Figure 5b) and maximum surface residual compressive stresses (Figure 8), maximizes the effect of RB on 10 6 -cycle fatigue strength.
  • Throughout the study area (from 10 3 to 10 6 cycles), the SRB-B process is significantly more efficient than the SRB-A process, and as the mega-cycle fatigue field (> 10 6 cycles) is approached, this efficiency increases. The dominant role of any SI characteristic is difficult to establish. The greater efficiency of the SRB-B process is due to the favorable combination of all the studied characteristics of SI—(1) mirror-like surface (Ra = 0.05 μm; more favorable skewness); (2) greatest subsurface microhardness (Figure 6); and (3) deepest compressive zone (Figure 8).
  • When the stress amplitude is above 520 MPa, the RB-A and SRB-A processes practically show the same efficiency regarding improvement in fatigue behavior compared to RC. As the stress amplitude decreases below 520 MPa, the performance of RB-A significantly increases. At smaller stress amplitudes, the residual stress relaxation is less. Thus, the larger surface compressive residual stresses and surface microhardness due to the RB-A process explain the higher fatigue strength.
  • The situation is similar for the RB-B and SRB-B processes, but when the stress amplitude is below 540 MPa, the efficiency of SRB-B is markedly higher than that of RB-B.
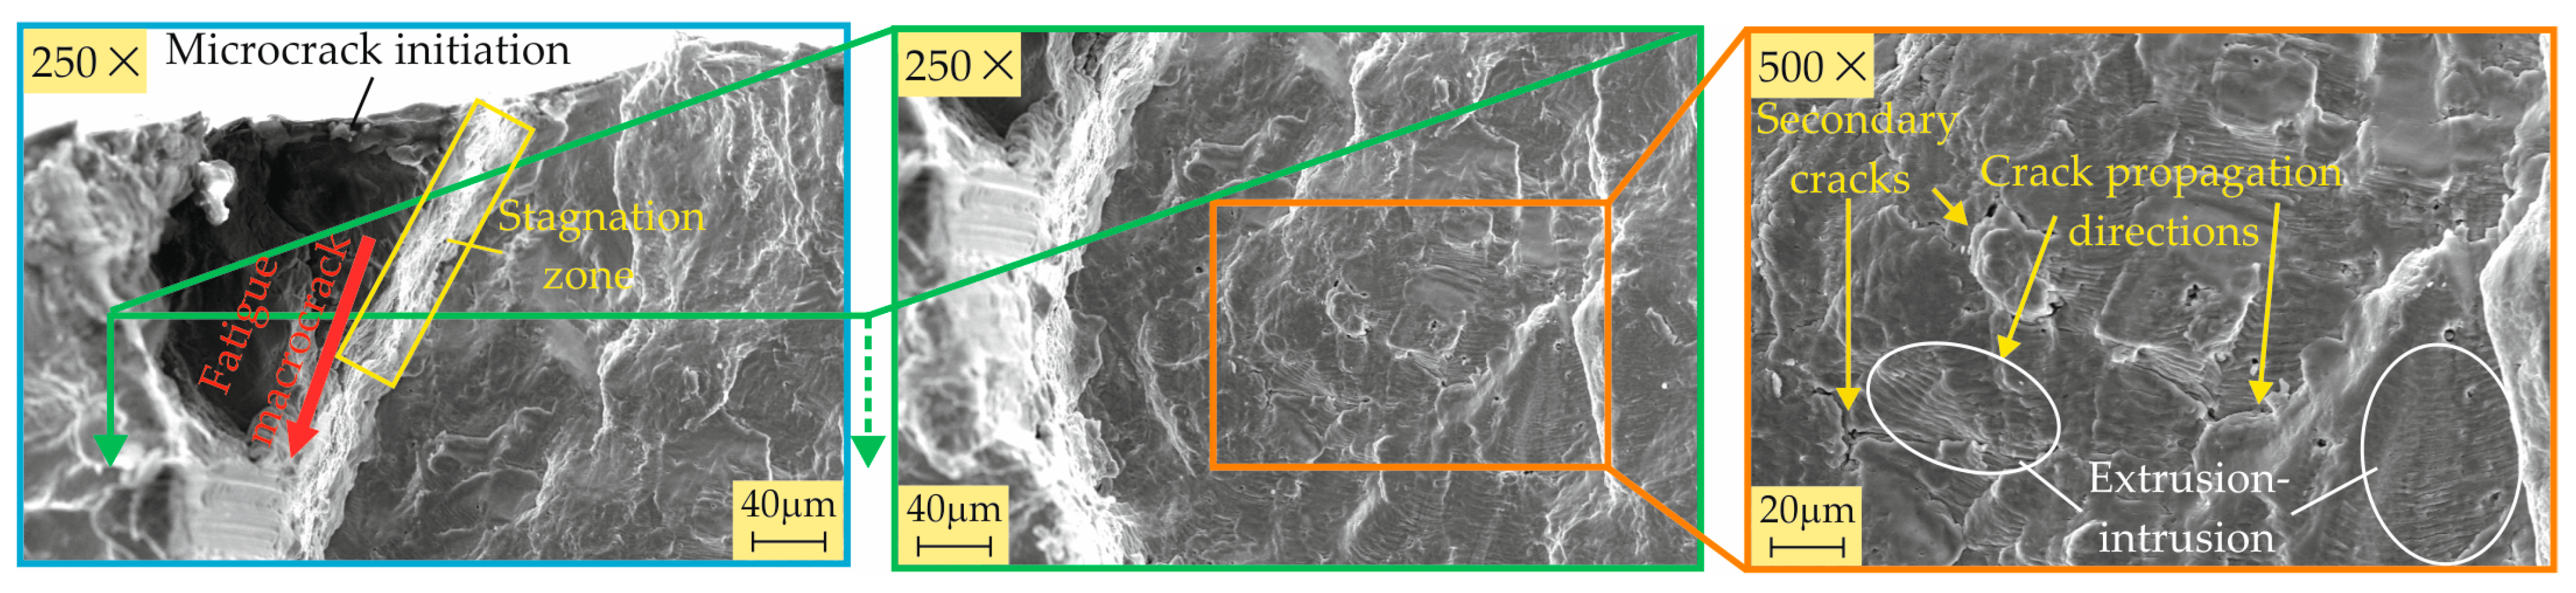
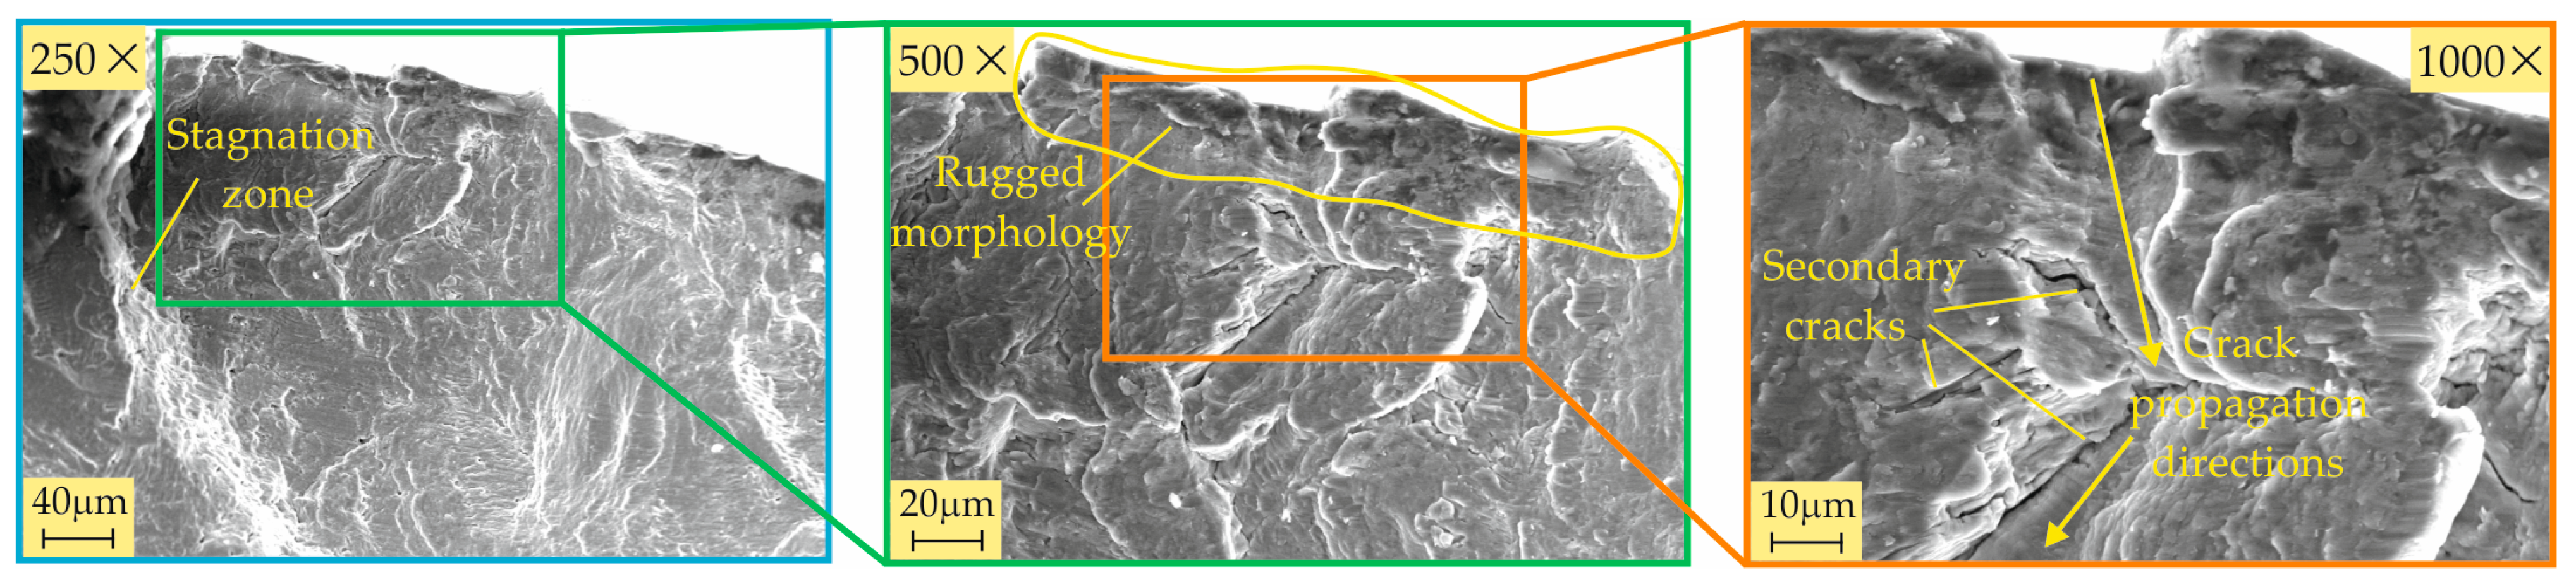
3.3.2. Fractography

The observed fracture surfaces belong to samples destroyed at a stress amplitude of 580 MPa.
Figure 14. Fracture surface of the fatigue specimen treated via turning and polishing (stress amplitude of 580 MPa; number of cycles to failure: 5700).
Metals 14 00710 g014
A modified surface layer is not noticeable after turning and polishing. The fatigue fracture starts at the surface as a direct consequence of the surface residual tensile macro-stresses. The observed micro-relief shows the presence of an extrusion/intrusion very close to the surface, suggesting that the fatigue fracture is initiated from the surface.
b.
RB-A process (Figure 15)
A modified surface layer with a thickness of approximately 10 μm is clearly present after the RB-A process. Fatigue macro-cracks have formed at the interface between the modified layer and the remaining material. This implies that the process of the nucleation of the fatigue micro-cracks and their fusion into a fatigue macro-crack started under the modified layer. We can see local destructions of the modified layer due to secondary cracks, and the destruction mechanism is intergranular. The surface layer of the modified layer is relatively smooth, which is characteristic of a brittle fracture that occurs after the main macro-crack grows to its critical size (corresponding to a critical size of the net section). The surface residual compressive stresses and the surface microhardness, which assume maximum values for the RB-A process, play a decisive role in the described destruction mechanism.
c.
SRB-A process (Figure 16)
Unlike the RB-A process, the thin modified layer is less pronounced with the SRB-A process. Its fracture surface is characterized by a significantly rougher morphology, which does not differ significantly from that of the lower layers. This picture indicates that the fatigue failure started from the surface layer. This failure mechanism is evident from the smaller compressive residual stresses in the surface and subsurface layers, the smaller surface microhardness, and the larger negative skewness (a prerequisite for surface micro-stress concentrators) compared to the RB-A process.
d.
RB-B process (Figure 17)
Similar to the effect of the RB-A process, a modified surface layer with a thickness of about 10 μm is also observed after the RB-B process. The morphology of the fracture surface confirms the formation of a major fatigue macro-crack between this layer and the remaining material. The relief of the fracture surface shows that the main macro-crack develops toward the center, repeatedly changing its direction. Local damage to the modified surface layer integrity is the result of secondary cracks developing toward the surface. In addition, secondary cracks in the radial direction are evident, the development of which toward the surface is blocked by the modified layer, which proves its effectiveness.
e.
SRB-B process (Figure 18)
Of the four burnishing processes, SRB-B provides a modified surface layer with the greatest thickness (more than 20 μm). The fracture surface shows that the main macro-crack here, too, is formed immediately below the modified layer. The development of fatigue cracks in the radial direction to the surface is blocked by the modified layer, which indicates its effectiveness in increasing the fatigue life of the specimen.

4. Conclusions

The present study evaluates the new SRB method to improve the fatigue behavior of AISI 304 based on a comparison with the conventional RB method, using the main correlation in surface engineering, namely, finishing–SI–operating behavior. To obtain a more representative picture of the comparison, we implemented each method with two combinations of governing factors defining processes A (RB-A and SRB-A) and processes B (RB-B and SRB-B), respectively. The following new findings were established:
  • Compared to RB, both SRB processes lead to the following: (1) significantly lower amplitude and functional roughness parameters (mirror-finish surfaces); (2) lower surface microhardness, but higher subsurface microhardness; and (3) a deeper zone of residual compressive stresses. These SI characteristics are a direct consequence of the larger contact area and relative sliding velocity in the SRB, owing to the crossing axes of the deforming roller and the workpiece.
  • We found that the surface microhardness is affected to a greater extent by the feed rate than by the burnishing force, because of the so-called overlapping effect, which causes cyclic hardening. Conversely, the microhardness beneath the surface is more sensitive to the burnishing force than the feed rate, because of the depth-attenuating overlapping effect.
  • All four burnishing processes create a modified surface layer with thicknesses of about 10 μm from the RB-A, SRB-A, and RB-B processes, and over 20 μm from the SRB-B process. This layer has the greatest crack resistance when created using SRB-B. The main fatigue macro-crack is formed at the interface between the modified layer and the remaining material for all specimens except the one treated using SRB-A. The reason for this is that SRB-A creates a surface with a large negative skewness (leading to micro-stress concentrators), which, in combination with smaller compressive residual stresses, is a prerequisite for the formation of a fatigue macro-crack from the surface.
  • The technological possibilities of the SRB method for achieving the desired SI characteristics according to the functional purpose of the burnished component have been experimentally shown, achieving a mirror-finish surface (Ra = 0.055 μm) but a fatigue strength lower than that of the conventional RB-A process. The SRB-B process achieves low height and functional roughness parameters (Ra = 0.073 μm) and the greatest fatigue strength compared to other burnishing processes.

Author Contributions

Conceptualization, J.M. and G.D.; methodology, J.M. and G.D.; software, J.M., G.D., A.A. and V.D.; validation, J.M. and G.D.; formal analysis, J.M., G.D. and Y.A.; investigation, A.A., V.D., Y.A., K.A., G.D. and J.M.; resources, J.M., G.D. and K.A.; data curation, J.M., G.D. and Y.A.; writing—original draft preparation, J.M. and G.D.; writing—review and editing, J.M. and G.D.; visualization, J.M., G.D., A.A., V.D. and Y.A.; supervision, J.M. and G.D.; project administration, J.M. and G.D.; funding acquisition, J.M. and G.D. All authors have read and agreed to the published version of the manuscript.

Funding

This research was funded by the European Regional Development Fund within the OP “Science and Education for Smart Growth 2014–2020”, Project CoC “Smart Mechatronics, Eco- and Energy Saving Systems and Technologies”, No. BG05M2OP001-1.002-0023.

Data Availability Statement

The original contributions presented in the study are included in the article; further inquiries can be directed to the corresponding authors.

Conflicts of Interest

The authors declare no conflicts of interest.

Abbreviations

RBRoller burnishing
RB-ARoller burnishing process A
RB-BRoller burnishing process B
RCReference condition
SBSlide burnishing
SCWSurface cold working
SESurface engineering
SISurface integrity
SLSurface layers
SRBSlide roller burnishing
SRB-ASlide roller burnishing process A
SRB-BSlide roller burnishing process B

References

  1. Miranda, R.M.; Gandra, J.P.; Vilaca, P.; Quintino, L.; Santos, T.G. Surface Modification by Solid State Processing; Elsevier: Amsterdam, The Netherlands; Woodhead Publishing Limited: Sawston, UK, 2014; ISBN 978-0-85709-469-8. [Google Scholar]
  2. Dwivedi, D.K. Surface Engineering. In Enhancing Life of Tribological Components; Korzynski, M., Ed.; Springer: New Delhi, India, 2018; ISBN 978-81-322-3779-2. [Google Scholar]
  3. Butz, G.A.; Lyst, J.O. Improvement in Fatigue Resistance of Aluminum Alloys by Surface Cold-Working. Mater. Res. Stand. 1961, 951–956. [Google Scholar]
  4. Semenchenko, I.V.; Grinchenko, I.G. Fatigue of the surface cold worked AK-4 alloy at elevated temperatures. Met. Sci. Heat Treat. 1970, 12, 959–960. [Google Scholar] [CrossRef]
  5. Saud, H.M.; Abdulrazzaq, M.A. Study the effect of cold working on the mechanical properties of aluminum alloy 2024 T4. IOP Conf. Ser. Mater. Sci. Eng. 2020, 928, 022125. [Google Scholar] [CrossRef]
  6. Maximov, J.T.; Duncheva, G.V.; Anchev, A.P.; Ichkova, M.D. Slide burnishing—Review and prospects. Int. J. Adv. Manuf. Technol. 2019, 104, 785–801. [Google Scholar] [CrossRef]
  7. Kuznetsov, V.P.; Tarasov, S.Y.; Dmitriev, A.I. Nanostructuring burnishing and subsurface shear instability. J. Mater. Process. Technol. 2015, 217, 327–335. [Google Scholar] [CrossRef]
  8. Korzynski, M. Modeling and experimental validation of force – surface roughness relation for smoothing burnishing with a spherical tool. Int. J. Mach. Tools Manuf. 2007, 47, 1956–1964. [Google Scholar] [CrossRef]
  9. Tobola, D.; Kania, B. Phase composition and stress state in the surface layers of burnished and gas nitrided Sverker 21 and Vanadis 6 tool steels. Surf. Coat. Technol. 2018, 353, 105–115. [Google Scholar] [CrossRef]
  10. Skoczylas, A.; Zaleski, K.; Matuszak, J.; Ciecielag, K.; Zaleski, R.; Gorgol, M. Influence of Slide Burnishing Parameters on the Surface Layer Properties of Stainless Steel and Mean Positron Lifetime. Materials 2022, 15, 8131. [Google Scholar] [CrossRef] [PubMed]
  11. Tanaka, H.; Nishinaka, K.; Yanagi, K. Development of hydraulic burnishing tool for discontinuous surface finishing—Machining characteristics of hydrostatic burnishing tool with single crystal diamond tip. J. Jpn. Soc. Technol. Plast. 2012, 53, 924–928. (In Japanese) [Google Scholar]
  12. Nestler, A.; Schubert, A. Effect of machining parameters on surface properties in slide diamond burnishing of aluminium matrix composites. Mater. Today Proc. 2015, 2S, S156–S161. [Google Scholar] [CrossRef]
  13. Kuznetsov, V.; Makarov, A.; Skorobogatov, A.; Skorinina, P.; Luchko, S.; Sirosh, V.; Chekan, N. Influence of normal force on smoothing and hardening of the surface layer of steel 03X16N15M3T1 during dry diamond smoothing with a spherical indenter. Met. Process. 2022, 24, 6–22. [Google Scholar]
  14. Dzierwa, A.; Gałda, L.; Tupaj, M.; Dudek, K. Investigation of wear resistance of selected materials after slide burnishing process. Eksploat. Niezawodn. 2020, 22, 432–439. [Google Scholar] [CrossRef]
  15. Shi, Y.-L.; Shen, X.-H.; Xu, G.-F.; Xu, C.-H.; Wang, B.-L.; Su, G.-S. Surface integrity enhancement of austenitic stainless steel treated by ultrasonic burnishing with two burnishing tips. Arch. Civ. Mech. Eng. 2020, 20, 79. [Google Scholar] [CrossRef]
  16. Kluz, R.; Antosz, K.; Trzepiecinski, T.; Bucior, M. Modelling the influence of slide burnishing parameters on the surface roughness of shafts made of 42CrMo4 heat-treatable steel. Materials 2021, 14, 1175. [Google Scholar] [CrossRef] [PubMed]
  17. Kato, H.; Hirokawa, W.; Todaka, Y.; Yasunaga, K. Improvement in surface roughness and hardness for carbon steel by slide burnishing process. Mater. Sci. Appl. 2021, 12, 171–181. [Google Scholar] [CrossRef]
  18. Bobrovskij, I.; Bobrovskij, N.; Khaimovich, A.; Travieso-Rodriguez, J.A. Impacts of surface texture and nature of friction on energy-force efficiency of surface plastic deformation during burnishing. Metals 2022, 12, 1568. [Google Scholar] [CrossRef]
  19. Dy, T.; Wijata, M.; Kusmierska-Matyszczak, W. The slide broaching burnishing and the influence of deformation on roughness of 314L stainless steel sleeves. Sci. J. Gdyn. Marit. Univ. 2020, 116, 15–28. [Google Scholar]
  20. Cagan, S.C.; Tasci, U.; Pruncu, C.I.; Bostan, B. Investigation of the effects of eco-friendly MQL system to improve the mechanical performance of WE43 magnesium alloys by the burnishing process. J. Braz. Soc. Mech. Sci. Eng. 2022, 45, 22. [Google Scholar] [CrossRef]
  21. Maximov, J.T.; Duncheva, G.V. The Correlation between Surface Integrity and Operating Behaviour of Slide Burnished Components—A Review and Prospects. Appl. Sci. 2023, 13, 3313. [Google Scholar] [CrossRef]
  22. Maximov, J.T.; Duncheva, G.V.; Anchev, A.P.; Dunchev, V.P.; Anastasov, K.; Daskalova, P.H. Effect of Roller Burnishing and Slide Roller Burnishing on Surface Integrity of AISI 316 Steel: Theoretical and Experimental Comparative Analysis. Machines 2024, 12, 51. [Google Scholar] [CrossRef]
  23. Juijerm, P.; Altenberger, I. Fatigue performance enhancement of steels using mechanical surface treatments. J. Met. Mater. Miner. 2007, 17, 59–65. [Google Scholar]
  24. Moussa, N.B.; Gharbi, K.; Chaieb, I.; Fredj, N.B. Improvement of AISI 304 austenitic stainless steel low-cycle fatigue life by initial and intermitten deep rolling. Int. J. Adv. Manuf. Technol. 2019, 101, 435–449. [Google Scholar] [CrossRef]
  25. Sedlacek, M.; Podgornik, B.; Vizintin, J. Correlation between standard roughness parameters skewness and kurtosis and tribological behaviour of contact surface. Tribol. Int. 2012, 48, 102–112. [Google Scholar] [CrossRef]
  26. Korzynski, M.; Dudek, K.; Kruczek, B.; Kocurek, P. Equilibrium surface texture of valve stems and burnishingmethod to obtain it. Tribol. Int. 2018, 124, 195–199. [Google Scholar] [CrossRef]
  27. Zabala, A.; Blunt, L.; Tato, W.; Aginagalde, A.; Gomez, X.; Llavori, I. The use of areal surface topography characterisation in relation to fatigue performance. MATEC Web Conf. 2018, 165, 14013. [Google Scholar] [CrossRef]
  28. ISO 6892-1:2019; Metallic Materials. Tensile Testing Part1: Method of Test at Room Temperature. Standards Press of China: Beijing, China, 2019.
  29. Ecoroll Catalogue. Tools and Solutions for Metal Surface Improvement; Ecoroll Corporation Tool Technology: Milford, OH, USA, 2006. [Google Scholar]
  30. DIFFRAC.DQUANT, Quantitative Analysis from Calibration to Reporting; Bruker AXS GmbH: Karlsrue, Germany, 2018.
  31. Bulgarian National Standard 5297:1983 Metals; Fatigue Test Methods. Standards Press of Bulgaria: Sofia, Bulgaria, 1983. (In Bulgarian)
  32. Pawlus, P.; Reizer, R.; Wieczorowski, M. Functional Importance of Surface Texture Parameters. Materials 2021, 14, 5326. [Google Scholar] [CrossRef] [PubMed]
  33. Zhang, J.; Pei, Z.J. Characterization Methods for Surface Integrity; Surface Integrity in Mashining; Paulo, J., Ed.; Springer: London, UK, 2010; ISBN 978-1-84-882-974-2. [Google Scholar]
  34. de Oliveira, D.A.; Martins, A.M.; de Castro, M.F.; Abrao, A.M. Characterization of the topography generated by low plasticity burnishing using advanced techniques. Surf. Coat. Technol. 2022, 448, 128891. [Google Scholar] [CrossRef]
  35. Maximov, J.T.; Duncheva, G.V.; Anchev, A.P.; Dunchev, V.P.; Argirov, Y.B.; Nikolova, M.P. Effects of heat treatment and diamond burnishing on fatigue behaviour and corrosion resistance of AISI 304 austenitic stainless steel. Appl. Sci. 2023, 13, 2570. [Google Scholar] [CrossRef]
  36. Maximov, J.T.; Duncheva, G.V.; Anchev, A.P.; Ganev, N.; Amudjev, I.M.; Dunchev, V.P. Effect of slide burnishing method on the surface integrity of AISI 316Ti chromium-nickel steel. J. Braz. Soc. Mech. Sci. Eng. 2018, 40, 194. [Google Scholar] [CrossRef]
  37. Maximov, J.T.; Duncheva, G.V.; Anchev, A.P.; Ganev, N.; Dunchev, V.P. Effect of cyclic hardening on fatigue performance of slide burnishing components made of low-alloy medium carbon steel. Fatigue Fract. Eng. Mater. Struct. 2019, 42, 1414–1425. [Google Scholar] [CrossRef]
Figure 1. Specimen geometry: (a) tensile test; (b) rotating bending fatigue test.
Metals 14 00710 g001
Figure 2. Kinematic scheme of RB (a), SRB (b), and burnishing device (c).
Metals 14 00710 g002
Figure 3. Kinematics of the methods (feed motion is turned off): (a) RB—absolute motion; (b) SRB: (b.1) absolute motion; (b.2) relative motion of the deforming roller to the workpiece.
Metals 14 00710 g003
Figure 4. Roughness profiles due to: (a) RB-A; (b) SRB-A; (c) RB-B; and (d) SRB-B.
Metals 14 00710 g004
Figure 5. Comparison of different processes under criterion: (a) roughness parameter, Ra; (b) microhardness, HV0.01.
Metals 14 00710 g005
Figure 6. Microhardness distribution along the depth from the surface.
Metals 14 00710 g006
Figure 7. Phase analysis results.
Metals 14 00710 g007
Figure 8. Residual stress distribution: (a) axial; (b) hoop.
Metals 14 00710 g008
Figure 9. Microstructure of a specimen processed using the RB-A process.
Metals 14 00710 g009
Figure 10. Microstructure of a specimen processed using the SRB-A process.
Metals 14 00710 g010
Figure 11. Microstructure of a specimen processed using the RB-B process.
Metals 14 00710 g011
Figure 12. Microstructure of a specimen processed using the SRB-B process.
Metals 14 00710 g012
Figure 13. S-N diagrams.
Metals 14 00710 g013
Figure 15. Fracture surface of the fatigue specimen treated via RB-A process (stress amplitude of 580 MPa; number of cycles to failure: 6600).
Metals 14 00710 g015
Figure 16. Fracture surface of the fatigue specimen treated via SRB-A process (stress amplitude of 580 MPa; number of cycles to failure: 7500).
Metals 14 00710 g016
Figure 17. Fracture surface of the fatigue specimen treated via RB-B process (stress amplitude of 580 MPa; number of cycles to failure: 13,300).
Metals 14 00710 g017
Figure 18. Fracture surface of the fatigue specimen treated via SRB-B process (stress amplitude of 580 MPa; number of cycles to failure: 13,500).
Metals 14 00710 g018
Table 1. Magnitudes of the governing factors used in this study.
Burnishing Processesr, mmFb, Nf, mm/revv, m/min
RB-A, SRB-A32500.0560
RB-B, SRB-B45500.1160
Table 2. Characteristics of the residual stress X-ray measurement.
Measuring deviceBruker D8 Advance diffractometer
X-ray tubeLong focus Cr—Kα
Crystallographic planeFe(γ) - (220)
Diffraction angle (2θ)128.78° (124°–133°)
Measuring methodOffset coupled TwoTheta/Theta (sin2ψ method)
Scan modeContinuous PSD fast
X-ray detectorSSD160-2 (1D scanning)
Collimator spot sizeStandard Φ1.0 mm
Measurement time for single scanApprox. 35 s
Elastic constant s1 1.352 × 10 6
Elastic constant 1/2s2 6.182 × 10 6
Voltage30 kV
Current40 mA
Step size0.5°
Time for step1 s
Table 3. Chemical composition (in wt%) of the used AISI 304 steel.
FeCSiMnPSCrNiNbTiMoCuCoWV
68.70.03830.1081.720.02990.031520.77.630.03560.00490.3180.380.0960.090.09
Table 4. Main mechanical characteristics of the tested AISI 304 steel.
Yield Limit, MPaTensile Strength, MPaElongation, %Hardness, HB
586 + 3 4 705 + 2 4 38.5 ± 0.5 255 ± 2
Table 5. Two-dimensional roughness parameters obtained via turning, RB, and SRB.
Processes2D Roughness Parameters
R a
μm
R q
μm
R p
μm
R v
μm
R s k R k u R k
μm
R p k
μm
R v k
μm
Turning0.4820.5761.2241.402−0.0462.1951.7460.2760.408
RB-A0.1860.2370.4700.885−0.7913.7030.5450.1420.378
SRB-A0.0730.0980.2290.526−1.0727.1170.2190.0930.166
RB-B0.1050.1310.3050.456−0.3173.0670.3290.0990.160
SRB-B0.0550.0760.2150.388−0.6756.5840.1670.0740.133
Table 6. Errors in residual stress measurement.
TurningRB-ASRB-ARB-BSRB-B
Depth
mm
Error, MPaDepth
mm
Error, MPaDepth
mm
Error, MPaDepth
mm
Error, MPaDepth
mm
Error, MPa
AxialHoopAxialHoopAxialHoopAxialHoopAxialHoop
05059012638084.762.1047.741.5050.325.7
0.0328.834.30.024855.60.0218.935.50.0152.820.00.0158.831.7
0.0834.733.50.0657.133.80.0541.933.80.0451.475.70.0554.846.5
0.1732.335.60.1132.928.80.0923.839.50.1063.642.10.1125.866.7
0.2466.435.90.1531.931.50.1523.329.70.1627.447.90.2131.149.1
0.338.431.90.244133.20.1913.745.30.2437.030.50.2672.721.2
---0.3241.932.30.2652.831.40.3227.223.90.3170.423.6
---0.433.322.90.3931.839.40.3732.337.00.3546.149.6
------0.4567.718.70.4442.855.10.4065.156.8
---------0.5118.437.40.4562.549.2
------------0.559.351.0
Disclaimer/Publisher’s Note: The statements, opinions and data contained in all publications are solely those of the individual author(s) and contributor(s) and not of MDPI and/or the editor(s). MDPI and/or the editor(s) disclaim responsibility for any injury to people or property resulting from any ideas, methods, instructions or products referred to in the content.

