Article

Slip Statistics for a Bulk Metallic Glass Treated by Cryogenic Thermal Cycling Reflect Its Optimized Plasticity

1
Shanxi Provincial Key Laboratory for Advanced Manufacturing Technology, North University of China, Taiyuan 030051, China
2
National Key Laboratory of Special Vehicle Design and Manufacturing of Integration Technology, Baotou 014000, China
3
College of Mechanical and Vehicle Engineering, Taiyuan University of Technology, Taiyuan 030024, China
*
Authors to whom correspondence should be addressed.
Metals 2024, 14(6), 731; https://doi.org/10.3390/met14060731
Submission received: 10 May 2024 / Revised: 12 June 2024 / Accepted: 17 June 2024 / Published: 20 June 2024

Abstract

:
Enhanced plasticity is obtained in a structurally rejuvenated Zr-based bulk metallic glass (BMG) that has been treated via cryogenic thermal cycling (CTC) for one hundred cycles. More than one primary shear band is activated due to the structural rejuvenation, which can inhibit the jerky and system-spanning propagation of shear bands to generate sluggish shear-dynamics. These are mapped to the slip statistics, including the decreased critical avalanche size, the much longer avalanche duration of large (system-spanning) slips, and a great number of small avalanches. Moreover, the universal scaling of slip avalanches for three applied stress ranges is addressed to predict the applied stress at which the failure avalanche appears most. These results indicate that slip statistics can be the fingerprints to show how much the BMG is rejuvenated, and the failure avalanche provides a good opportunity to intervene in the failure of BMGs in advance.

1. Introduction

Bulk metallic glasses (BMGs), by virtue of their long-range disorder structure [1,2], possess many superior mechanical properties [3,4], making BMGs as potential high-performance metallic materials widely used in structural engineering [4]. However, the poor room-temperature plasticity is in urgent need of resolution [4,5]. Shear bands are commonly accepted, as the plastic deformation carriers for BMGs served at temperatures far below their glass transition temperature [6,7]. Shear bands are initiated in localized regions with plentiful “defects” such as free volumes [8], shear transition zones (STZs) [9,10], flow units [11], loosely packed regions [12], etc. For most BMGs compressed at room temperature, the rapid propagation of the primary shear band over shear-band formation contributes to only a limited amount of plastic strain preceding fracture [13,14]. Suffering from physical aging even weakens the plastic deformation capability of BMGs [15].
Contrary to physical aging, rejuvenation aiming at exciting a higher energy state with the more disordered structure [16] to endow BMGs with enhanced plasticity [17,18] has captured increasing attention for its scientific and engineering significance. Cryogenic thermal cycling (CTC) treatment [12,19,20,21,22,23], by comparison with other rejuvenation experimental methods, like heavy plastic deformation, ion irradiation, high-pressure torsion, etc. [15,18], not only can be applied to BMG samples of any shape and size [20], but also is essentially a procedure with no destruction to thermal stability [22]. For rejuvenated BMGs via CTC treatment, the degree of rejuvenation usually can be quantified by an increase in relaxation enthalpy upon heating in differential scanning calorimetry (DSC) measurement [22,24,25]. Less-dense structures upon CTC treatments have been reported in molecular dynamics simulations of CuZr MGs at different species contents [18] and in the calculation of Zr55Cu30Al10Ni5 BMGs [24]. The increased defect density [22] and larger volumes of STZs [20,22,26] have been revealed via representative nanoindentation experiments on CTC-treated ZrCu-based BMGs. All these efforts reveal that CTC treatments contribute to structural rejuvenation through activating more defects of larger sizes to a less-dense structure for ZrCu-based BMGs. Zr52.5Cu17.9Ni14.6Al10Ti5 BMGs (Vit105) belong to a ZrCu-based MG alloy system. The good glass formation ability of Vit105 makes it easy to prepare MG samples with a thickness of up to centimeters by copper mold casting [1]. Many physical parameters of Vit105 have been addressed, like Poisson’s ratio, Young’s modulus, heat capacity, thermal diffusivity, etc. [7,27,28,29]. These parameters are helpful in understanding the plastic deformation mechanisms of Vit105. While CTC treatments can endow Vit105 with rejuvenated structure [20], it is still unclear how shear bands operate to optimize the plasticity of the rejuvenated BMGs.
Slip avalanches are the results of the initiation, propagation, and arrest of shear bands for slowly compressed BMGs [6]. Slip avalanches are recognized as the sudden stress drops on compressive stress–strain or stress–time curves [10,30,31]. Being in line with the macroscopic plasticity of BMGs, slip statistics show dependence on the dynamics of shear banding [32,33]. A simple mean-field theory predicts that small avalanches are of self-similarity characterized by the power-law size distribution and relate to the progressive propagation of shear bands [10,34,35]. The larger jerky avalanches are likely to evolve into catastrophic slips like cracks [10,36].
In this study, the critical avalanche size manifests as the upper bound of the power-law size distribution, which yields a great number of small avalanches and the smaller critical avalanche for rejuvenated BMGs upon CTC treatment. Moreover, the much longer duration of large avalanches of CTC-treated BMGs show that the catastrophic slips are hindered, which is consistent with the scenario of depressed shear-dynamics due to multiple primary shear bands. These endeavors answer the questions why and how slip avalanches dynamics reflect optimized plasticity by shear banding of CTC-treated BMGs. A good opportunity to intervene in the failure of CTC-treated BMGs in advance is further proposed based on slip avalanches tuned by the applied stress during the slow compression at room temperature.

2. Materials and Methods

Alloy ingots with a nominal atomic composition of Zr52.5Cu17.9Ni14.6Al10Ti5 (Vit105, each element with the purity over 99.9% atomic percent) were manufactured in the vacuum arc-melting furnace under an argon atmosphere. Each alloy ingot was melted at least 4 times to ensure the chemical composition homogeneity. A 30 mm-length rectangular parallelepiped rod with a cross-sectional area of 2 by 2 mm was prepared by sucking the ingots into the copper mold. Specimens with a length of around 4 mm were then cut off via a low-speed precision-cutting machine. Sandpapers with increasing grades (from 240, 400, 600, 800, 1000, to 1200 grades) were used to carefully grind both ends of specimen to obtain samples with an aspect ratio of 2:1 and of parallel end surfaces.
The CTC treatment was to place samples in the liquid nitrogen (77 K) for 1 min, followed by immersing them in boiling water (373 ± 0.02 K) for 1 min, producing one CTC cycle [20,23], as shown in the insert of Figure 1. The samples treated for 0 and 100 cycles were, respectively, denoted as AC and CTC100. The structures of both AC and CTC100 samples were characterized by the X-ray diffraction (XRD) with Co-Kα radiation. Only broad diffraction maxima and nondetectable peaks off crystalline phases confirmed that they were BMG samples with fully amorphous structures.
For each kind of BMG (AC or CTC100), uniaxial quasi-static compression experiments were conducted at room temperature using an Instron 5969 materials testing machine (see the Figure S1 of Supplementary Materials for the results of more deformation tests of CTC100 BMG samples). The room-temperature plasticity depends on imposed strain rates [7]. Extensive literature [7,20,28,30,32] has showed that slip avalanches appear when the shear-band velocity exceeds the resolved cross-head velocity of the testing machine. At a strain rate of 1 × 10⁻⁴ s−1, the plastic strains preceding failure for ZrCu-based BMGs are usually larger than 5% accompanied by a great number of slip avalanches [30,32], contributing to the investigation of slip statics. As a result, the compressive strain rate is 1 × 10⁻⁴ s−1 in this study. A 50 kN piezoelectric load cell embedded in the loading header of Instron 5969 materials testing machine was used to obtain the load data at a frequency of 500 Hz. After compression, all the BMG samples were directly cleaned in ultrasonic cleaning machine, and the surface morphologies were characterized by scanning electron microscopy (SEM).

3. Results

The engineering stress–strain curves, for both AC and CTC100 BMG samples compressed at a slow strain rate of 1 × 10⁻⁴ s−1, are shown in Figure 1. The first system-spanning large avalanche appears at the macroscopic yielding point (MYP), suggesting the onset of steady plastic deformation [7,37]. The plastic strain ε p is thus defined as the difference in strain from MPY to failure. For the CTC100 sample, the plastic strain is 26%, which nearly doubles that of 14% for the AC sample (see Table 1). The reinforced plasticity is caused by the rejuvenation from CTC treatment.
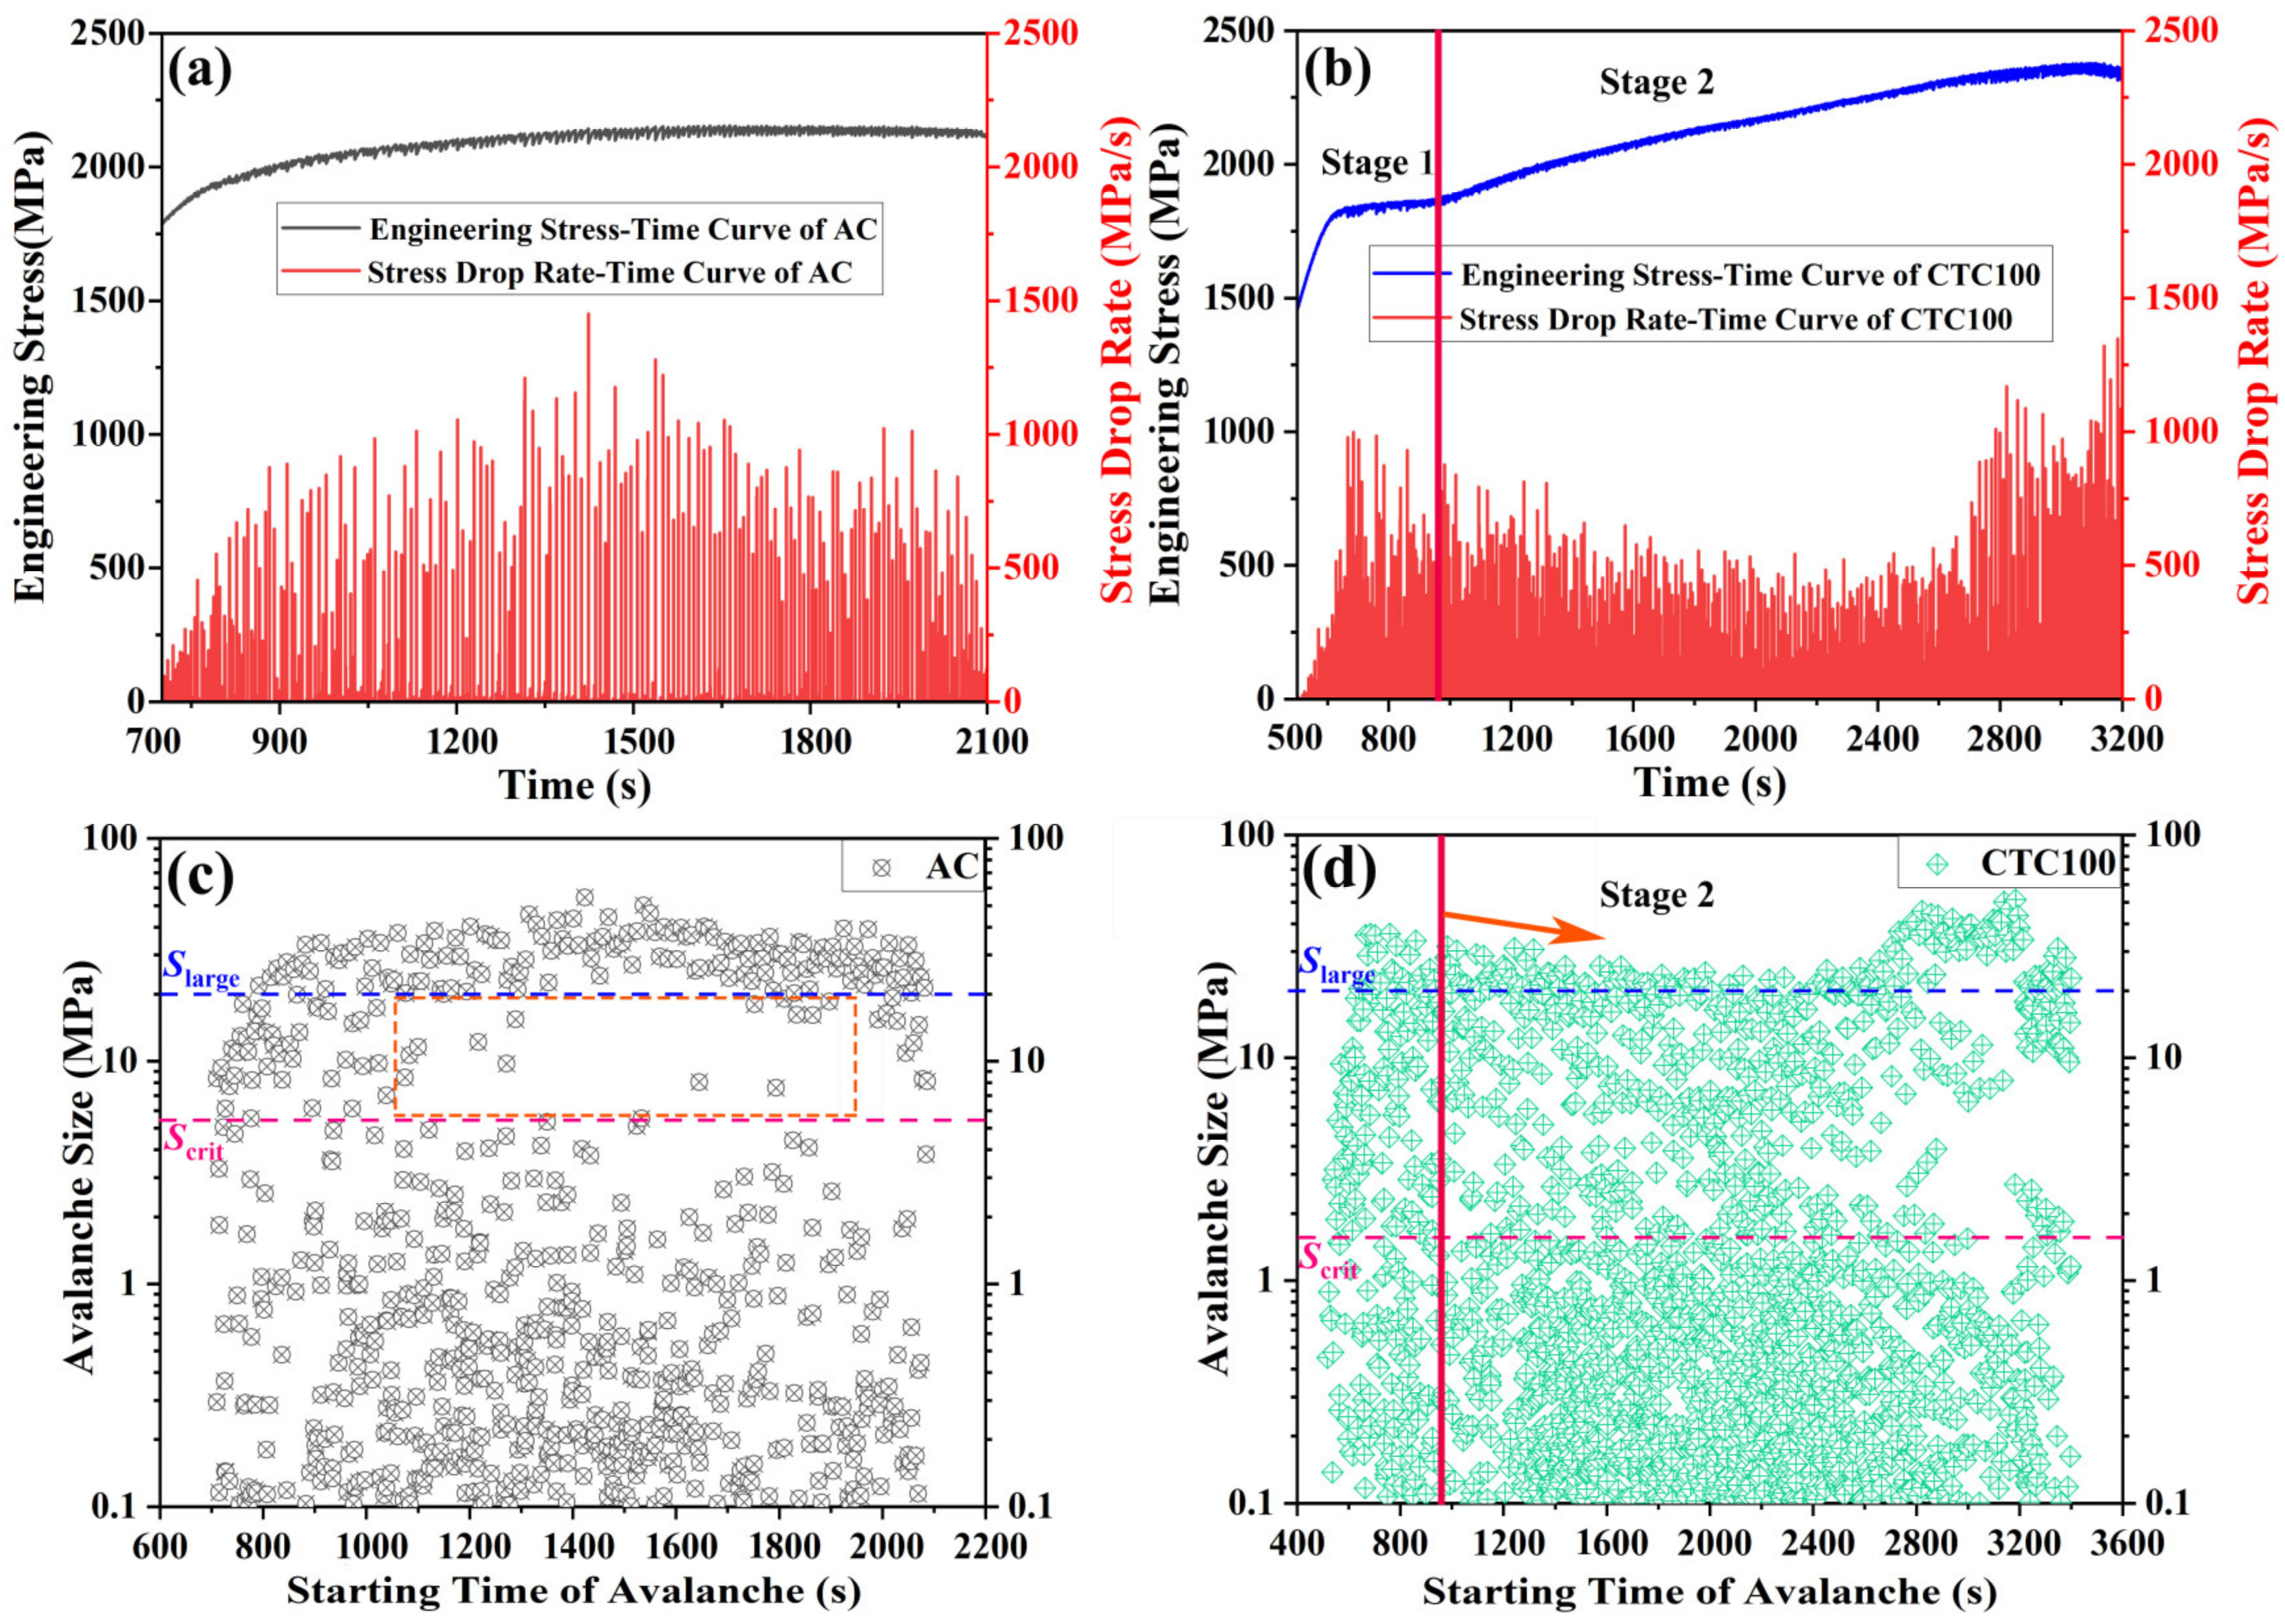
It is noted that the steady plastic deformation of the CTC100 BMG sample displays a two-stage mode (see Figure 1 and Figure 2b), i.e., a smooth regime characterized by the nearly constant average stress with strain and/or time (the average stress is the mean stress of the peak and valley stresses of each avalanche [7]), and an apparent “work-hardening” regime [37] featured by the gradually increased average stress with strain and/or time, which are denoted as stage 1 and stage 2 (see Figure 2b), respectively, in this study (the details will be discussed in Section 4.2 and Section 4.3).
The parameters of slip avalanches carry information about shear banding. The avalanche size is measured by the magnitude of the stress drop, relating to the slip step of shear banding. The minimum avalanche size is 0.1 MPa in this study (see studies [7,38] for the details). The duration of the slip avalanche, manifested as the elaplsed time of the stress drop, can figure the operation time of shear banding. The stress drop rate is the derivative of stress versus time (see the bottom half of Figure 2a,b), which reflects the shear-banding velocity. The interevent time, defined as the difference in starting time between temporally neighboring avalanches (see study [39] for the details), can reflect the time interval between two shear events. As a result, the average interevent time is used to describe the operation frequency of shear banding. The average interevent time x ¯ i of the CTC100 BMG sample is 1.36 s, which is shorter than that of the AC BMG sample with x ¯ i = 1.96 s (see Table 1). The maximum stress drop rate v m a x for AC and CTC100 BMG samples is, respectively, 1155 and 1000 MPa/s (see Figure 2 and Table 1).
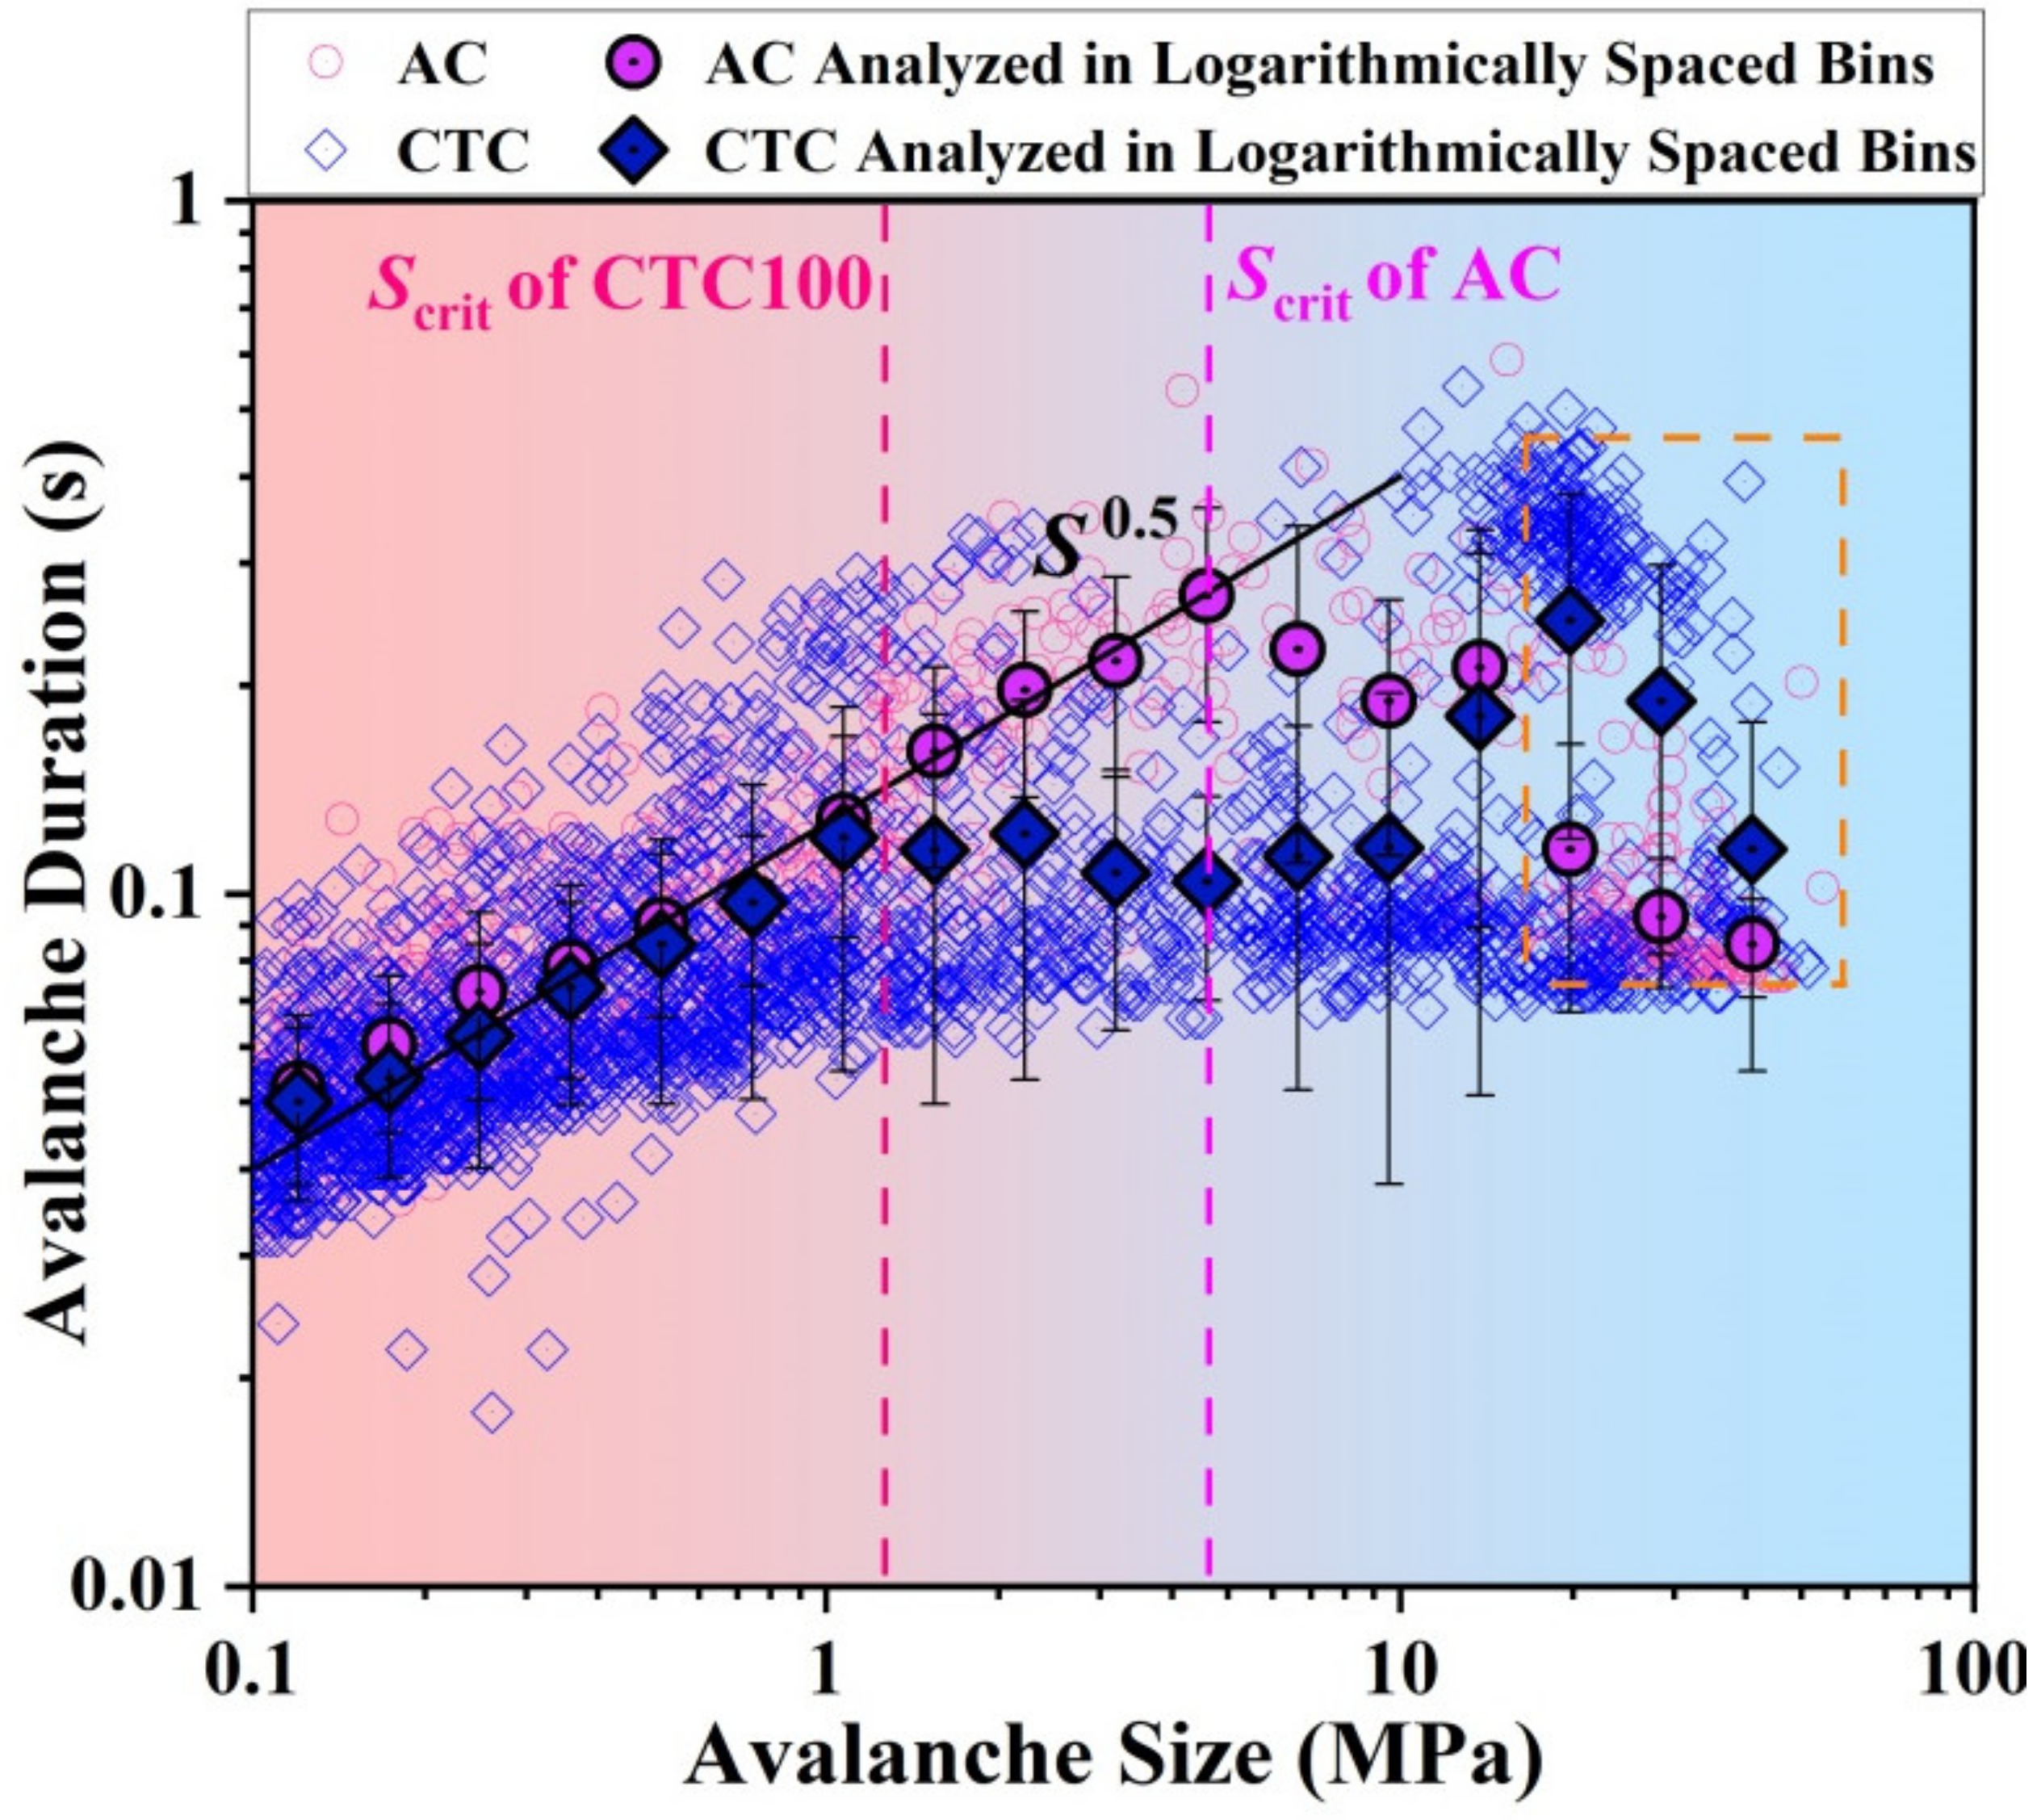
The hollow symbols in Figure 3 display a plot of the avalanche duration as a function of the avalanche size for both AC and CTC100 BMG samples. To show the distinct between AC and CTC100 BMG samples, the data indicated by hollow symbols are analyzed in logarithmically spaced bins. To be specific, for each type of BMG, avalanches are arranged in a chronological order according to avalanche sizes. The avalanche size axis is then divided into logarithmically spaced bins. For each avalanche size bin, the average avalanche duration is calculated, which are represented by full symbols in Figure 3. It is seen that the avalanche duration, T , increases as a power law with the avalanche size, S , for small avalanches, which can be expressed by the following [30,40],
T ~ S σ v z
where σ v z is the power-law exponent in mean-field theory [40,41]. The fitted power-law exponents for AC and CTC100 BMG samples are both of 0.5 [30], which is consistent with the prediction of the mean-field theory for brittle materials [10,30,42]. The mean-field theory further demonstrates that the power-law scaling is limited in extend by a cutoff avalanche size [30] defined as the critical avalanche size S c r i t as well. The critical avalanche size S c r i t of the CTC100 BMG sample is around 1.5 MPa, being smaller than that of about 4.6 MPa for AC BMG sample. Small avalanches are figured out based on S c r i t [30,31]. This yields around 70% and 64% small avalanches of the total number of slip avalanches for AC and CTC100 BMG samples, respectively. For the CTC100 BMG sample, the maximum avalanche S m a x with the value of 51.3 MPa is smaller compared with that of 54.3 MPa for the AC BMG sample (see Table 1).

4. Discussion

4.1. Slip Avalanches Statistics Depending on Thermal Rejuvenation

The structural weakening parameter is developed in mean-field theory to distinguish the intrinsic brittle or ductile solid materials. In mean-field theory, the solid material is assumed to consist of hard and soft spots [42]. The soft spots have lower failure stress compared to the hard ones. During slowly compressive deformation, the soft spot at the site, q , will first slip when its local shear stress is over the statistic threshold, τ q , s This slip continues until the local shear stress is reduced to the arrest stress, τ q , a . τ q , a is denoted as the “sticking” stress [41]. For brittle materials, like BMGs with shear transition zones (STZs) being their soft spots, the failure stress threshold of the soft spot at the site, q , will be weakened from τ q , s , to a lower value, τ q , l , after the first slip during an avalanche. This gives the structural-weakening factor, ε [30,41],
ε = τ q , s τ q , l τ q , s
with the relationship, τ q , a < τ q , l < τ q , s , and the setting, τ q , a = 0 [42]. The structural-weakening factor, ε , for brittle BMGs fluctuates from zero to one, i.e., 0 < ε < 1 [42]. In contrast, the failure stress threshold is strengthened by an amount for the ductile materials, like 1- μ m-sized crystals and metallic glasses composites [30,43], producing a negative value of structural-weakening parameter, i.e., ε < 0 [41,42].
Slip avalanch statistics correlate with the structural weakening of brittle BMGs. The critical avalanche size, S c r i t , of the power-law scaling defined in Equation (1), depends on the extent of weakening during a slip and scales as [40],
S c r i t ~ 1 / ε 2
The smaller critical avalanche size of 1.5 MPa indicates the severe structural weakening for the CTC100 BMG sample [40,42]. Wright et al. have addressed a smaller critical avalanche size, S c r i t , of the metallic glass composites compared with that of a brittle BMG [34]. Song et al. have used a stochastic statistical model to investigate the origin of the enhanced plasticity of Zr46Cu46Al8 BMGs after CTC treatment [22]. The density of defects, ρ , is increased [22], providing more sites for the activation of shear slips. In this regard, the structural heterogeneity is activated after CTC100 treatment on brittle BMGs in this work, and the critical avalanche size, S c r i t , can be a fingerprint identifying how much the BMG sample is rejuvenated by CTC100 treatment.
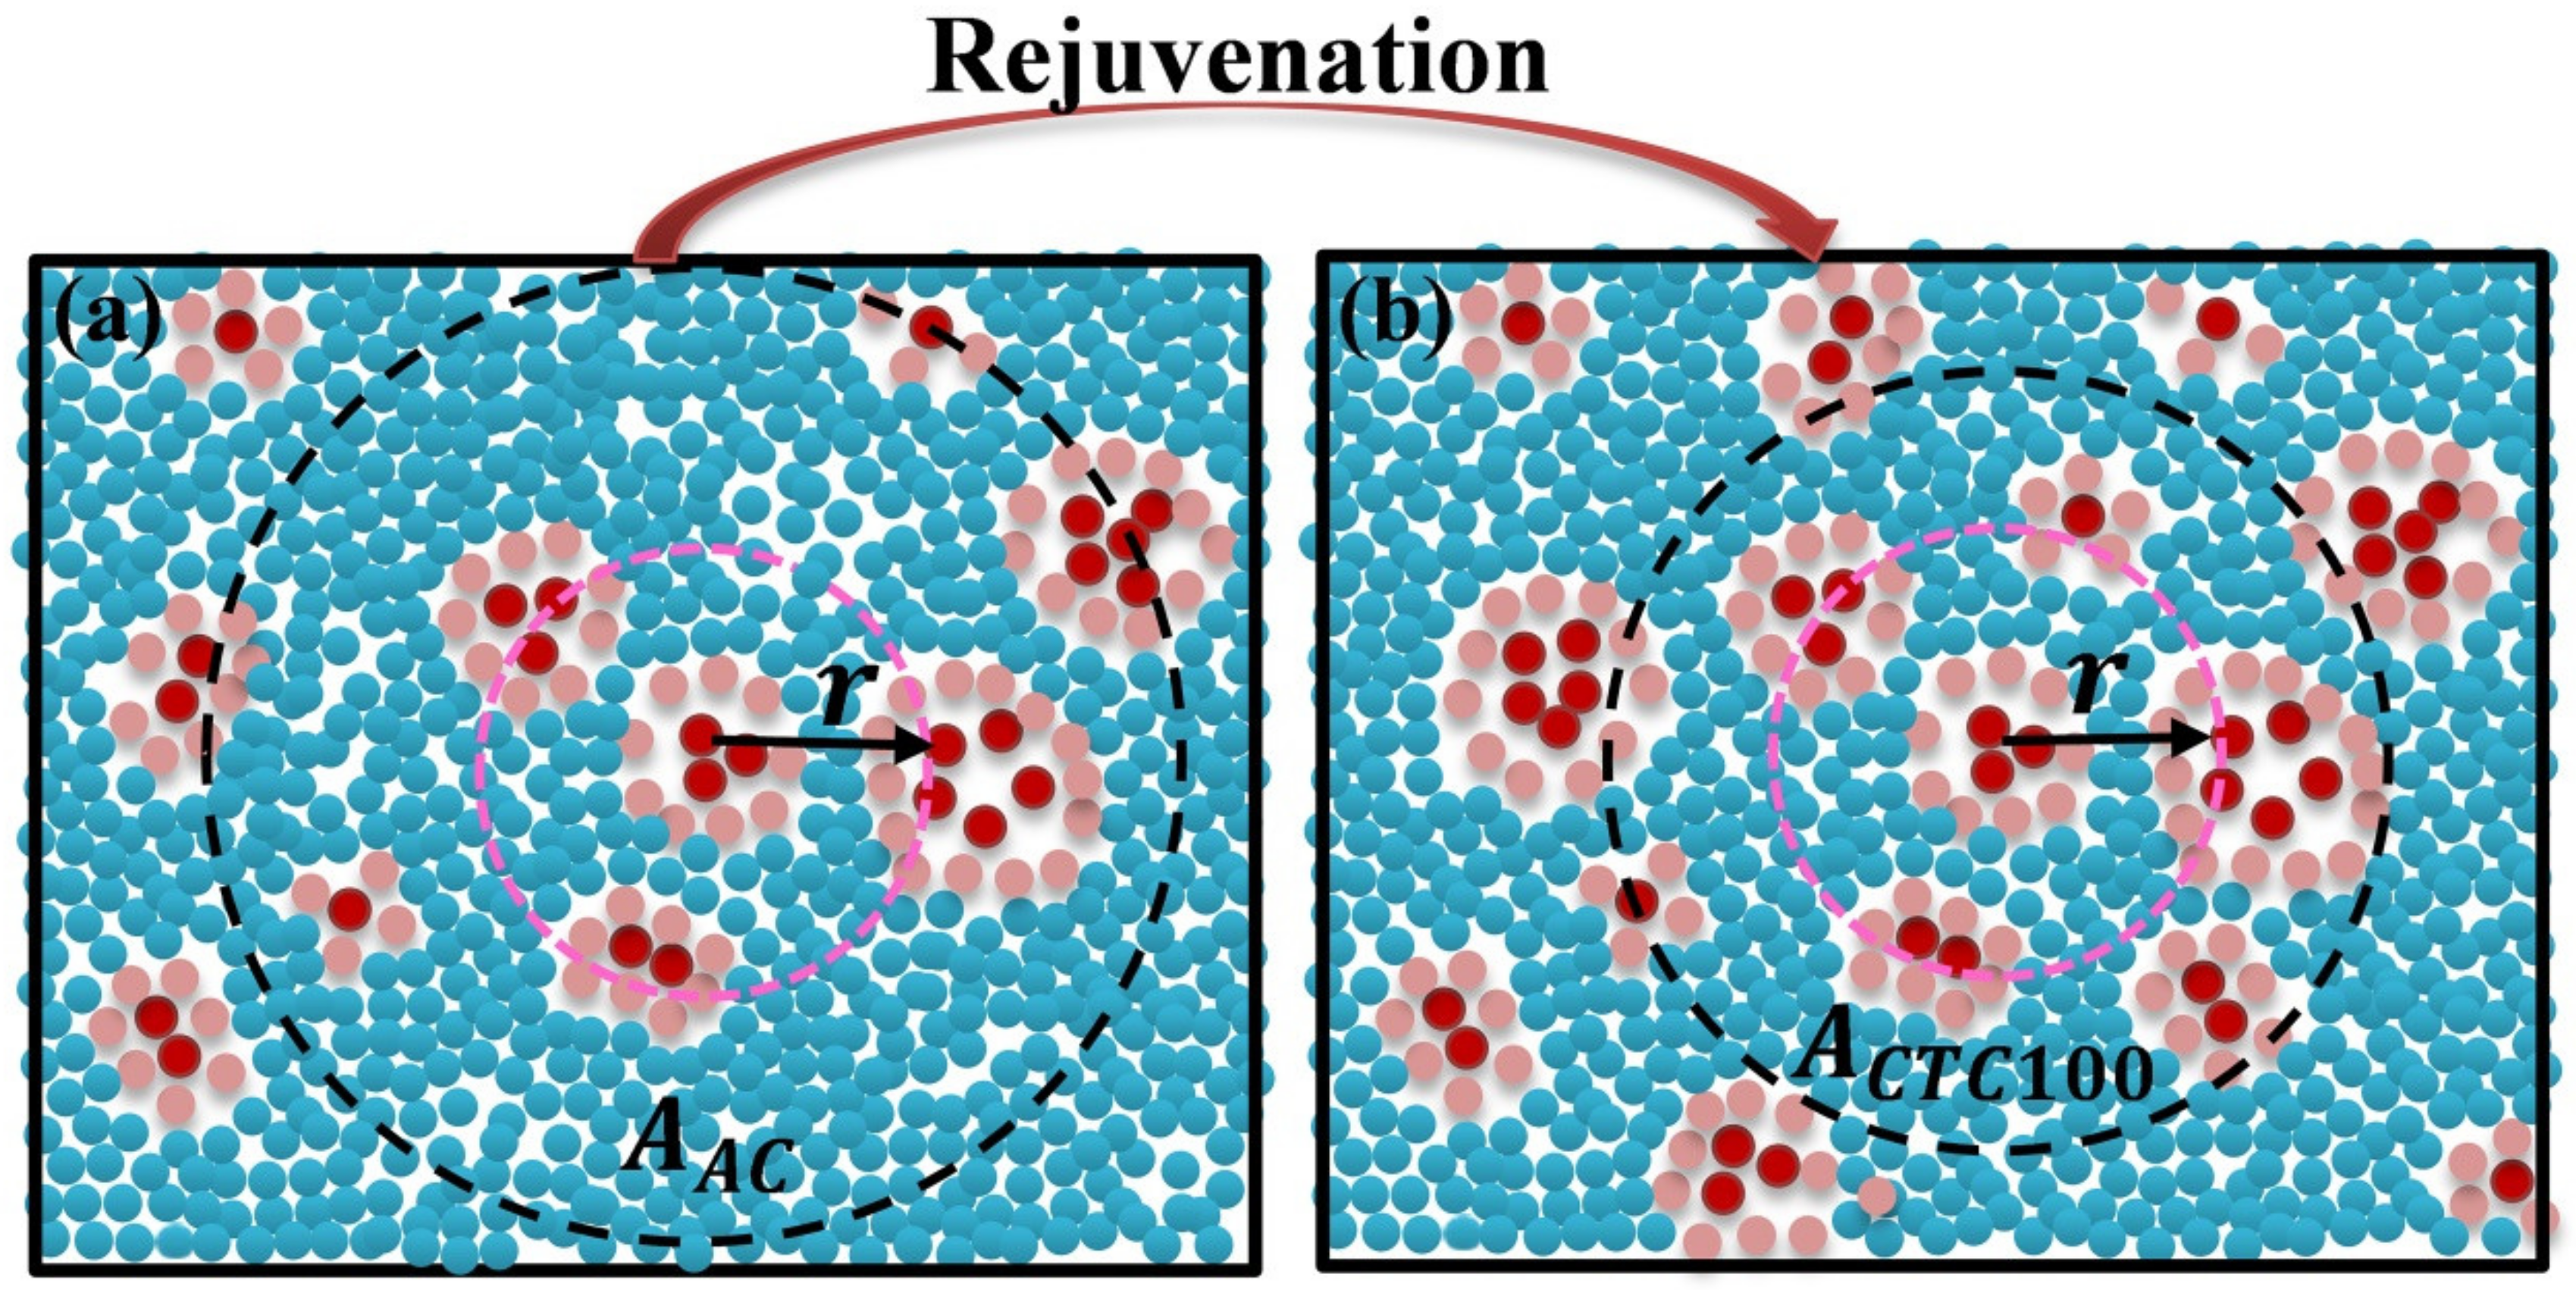
A schematic diagram of structural heterogeneity from AC to CTC100 BMGs, as shown in Figure 4, is drawn to understand the slip avalanches statistics, by taking the density of STZs into account. For small avalanches, with a size smaller than S c r i t , i.e., S < S c r i t , the pulse-like slips of STZs proceeds approximately the same displacement at every slipping region [40]. This generates the avalanche size, S , linearly increased with the slipping area, A , as the following [40],
S ~ A
In mean-field theory, the first failed STZ slips to release a certain amount of stress to its surrounding STZs, causing them to fail subsequently as well to generate an avalanche [41,42]. As shown in Figure 4, the STZ in the middle of the pink dashed line is the first one to fail. For both AC and CTC100 BMG samples, it is assumed that the amount of released stress of first failed STZ is the same, which is indicated by the pink dashed pink circle with the same radii of r in Figure 4a,b. For the CTC100 BMG sample with an increased density of STZs due to structural rejuvenation [22], more STZs are located in the dashed pink circle. That is to say, every STZ within this circle can gain the lower stress except the first failed STZ. As a result, the smaller-step slips involve a smaller slipping area, A , i.e., A C T C 100 < A A C (the slipping area are indicated by the area of black dashed circle in Figure 4a,b), which contributes to a smaller critical avalanche size, S c r i t , based on Equation (4). Meanwhile, an increased density of STZs can offer more sites for shear slips [22], which is consistent with the great number of avalanche events appearing in the CTC100 BMG sample. Despite a slightly smaller percentage of small avalanches, r s m a l l , presents in the CTC100 BMG sample (see Table 1), the great number of small avalanches, N s m a l l , and the shorter average interevent time, x ¯ i , give proof of rejuvenation by CTC100 treatment.

4.2. Slip Avalanches Decoding Shear Banding

Shear bands compete for the candidate of primary shear band. A system-spanning large slip avalanche appears at MYP [37], suggesting that the first shear band denoted as SB1 is basically activated [14]. The slip avalanches after MYP are the results of the alternate activation of multiple shear bands. To be specific, the embryo of a new shear band denoted as SB2 is activated afterwards at the sites of severe strain concentration of SB1 and develops along a path that is like a branch off SB1 [14]. The intersection of two shear bands manifests as the competition for the candidate of primary shear band. During this competition, SB1 propagates simultaneously, and SB2 propagates progressively, which are featured by the alternating appearance of small and large avalanches [44]. A so-called dominant path that is the potential shear-band evolution path relating to the primary shear band [14], starts to generate as well. The subsequent shear bands are prone to be activated from the dominant path and then branch off previous shear bands, which is similar to the scenario of SB2 [14].
The primary shear band developed along the path of SB1 is likely to stand out from the competition, which dominates the plastic deformation for the AC BMG sample. The yellow arrows in Figure 5a are the guides to show the path of SB1. The red dashed line is the guide to represent the dominant path. The orange arrows are the guides to show SB2. Figure 5b is the enlarged view of the part indicated by the green box in Figure 5a, which clearly shows that SB2 branched off the dominant path and interacted with SB1. The obvious shear step indicates that the primary shear band propagates simultaneously along the path of SB1 [34] (see the part indicated by a green box Figure 5a). In this case, the energy stored in the system is prone to be accumulated, and will be released by the slipping of the system-spanning large avalanche [34,36] (with the size approximately over 20 MPa here), which is consistent with the slip avalanches statistics with longer interevent time of x ¯ i = 1.96 s and bigger maximum stress drop rate of v m a x = 1155 MPa/s. The increased number of large avalanches and the very few medium-sized avalanches (with the size ranging from 4.6 to 20 MPa here) in Figure 2c are the complementary proofs that SB1 dominates the plastic deformation for the AC BMG sample. There are, of course, some fine shear bands activated (see the part indicated by a dashed circle Figure 5a), producing small avalanches [34] (see Figure 2c).
More than one primary shear band regulates the plastic deformation of the CTC100 BMG sample. The yellow arrows in Figure 5c are the guides to represent the path of SB1 as well, which is similar to the primary shear band shown in Figure 5a and thus denoted as the first primary shear band of the CTC100 BMG sample. The dominant path is indicated by the red dashed line. The blue arrows are the guides to represent the shear band that is activated and develop into the primary shear band dominating the plastic deformation of stage 2, which is called the newly activated primary shear band in Figure 5c. Figure 5d is the enlarged view of the part indicated by the purple box in Figure 5c, which shows obvious cracks along the newly activated primary shear path [45]. These show us that the newly activated primary shear band dominates the deformation of stage 2.
As mentioned in the Results section and shown in Figure 1 and Figure 2, the plastic deformation of the CTC100 BMG sample displays a two-stage deformation mode. Stage 1 reflects the competition for the candidate of primary shear band, during which slip avalanches of different sizes are uniformly distributed (see Figure 2c). It is interesting that SB2 is developed into the primary shear band dominating the plastic deformation of stage 2, manifesting as the apparent “work-hardening” in stage 2 of Figure 2. The more STZs are activated in the CTC100 BMG sample. In this case, the more slipping sites contribute to the more strain–concentration zones [5,46,47,48], turning into the nucleus of a new shear band. Moreover, Luo et al. have investigated the volume of STZs of CTC100-treated BMGs with the same composition as this work [20], using a rate-jump nanoindentation method proposed by Pan et al. in [49]. It is shown that the STZ volumes are increased after CTC100 treatment due to the high disorder degree caused by rejuvenation [20]. Zhu et al. have reported that the number and the size of loosely packed regions are both increased in a series of Zr-based BMGs after treatment via CTC [12]. To assess the atomic scale changes of CuZr MGs, molecular dynamics simulations have been used by Amigo [18] and showed that all metallic-glass samples have higher potential energy and less-dense structures upon CTC treatment [18]. From the perspective that shear-band volume is proportional to the volume of defects, the larger volume of STZs for the CTC100 BMG sample can offer the condition for a new shear band to develop into the primary shear band that dominates the plastic deformation of stage 2. These imply that the shear banding is modified by the newly primary shear band due to the support of the abundant defects with larger volumes for CTC100 treatment.
For the rejuvenated BMG sample, more primary shear bands are prone to arrest the system-spanning slips. The large or system-spanning slip avalanches (with the size over 20 MPa in this study) are difficult to control because they are the cause of jerky deformation. From the large avalanches marked by the orange dashed box in Figure 3, it is found that, avalanche sizes being the same, the longer avalanche durations are presented in the rejuvenated BMG sample to the AC BMG sample when they are analyzed in logarithmically spaced bins. The longer avalanche durations can be the signal of more sluggish shear-dynamics.
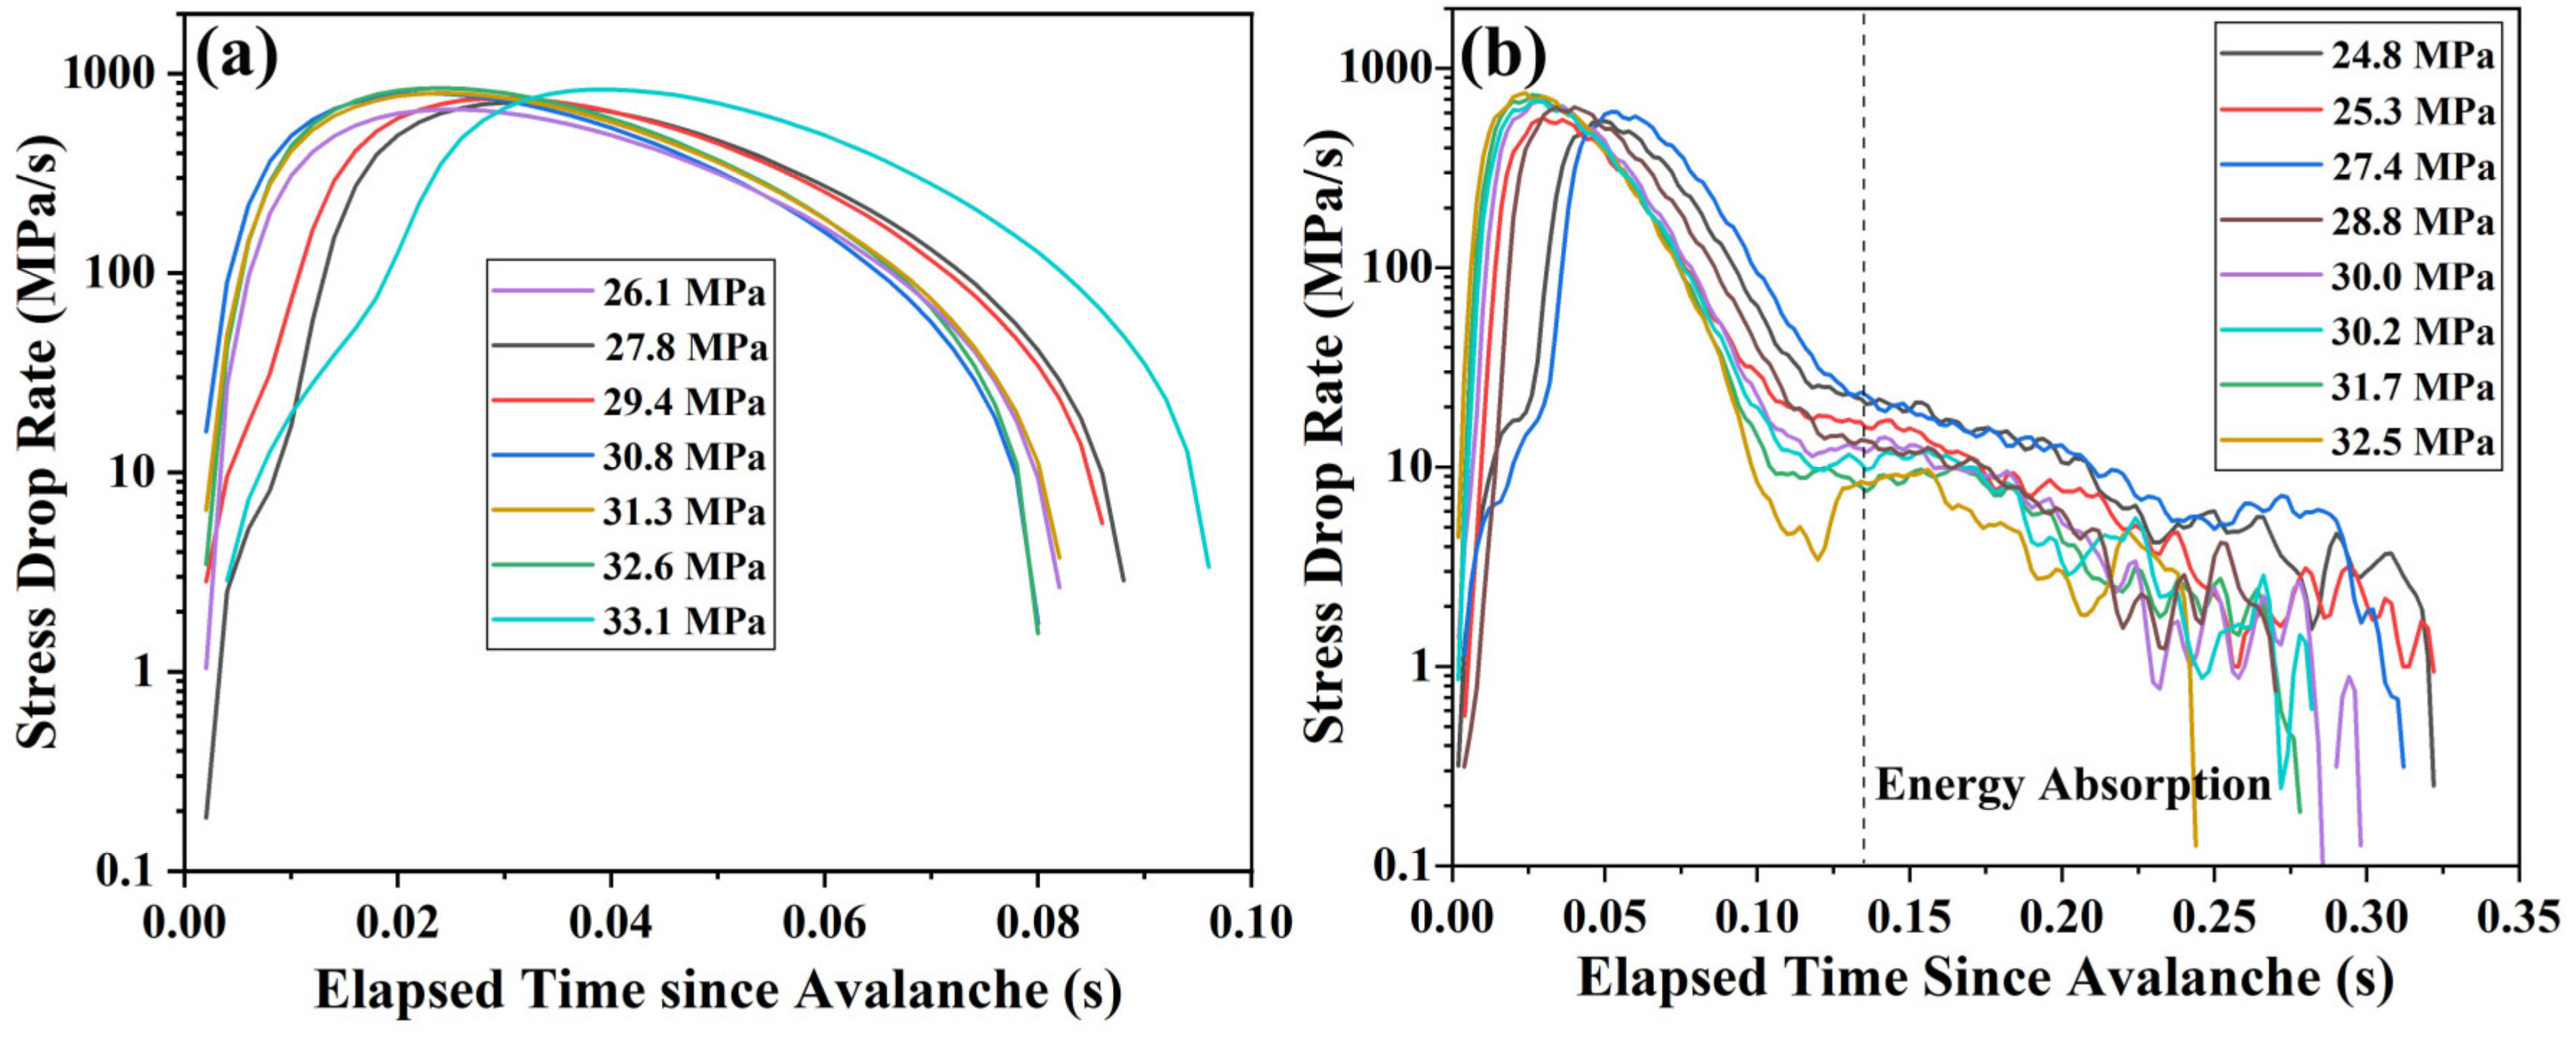
To elucidate this, the temporal profiles of large avalanches with the sizes located in a logarithmically spaced bin (from 23 MPa to 34 MPa) are addressed in Figure 6. It is seen that the maximum stress drop rates are almost equal for both AC and CTC100 BMG samples. The avalanche durations for the CTC100 BMG samples are nearly 0.32 s, being much longer compared to that for the AC BMG sample. Careful investigation shows that the tail manifests as the fluctuation with a lower level of stress drop rates in Figure 6b, which is the main reason of longer duration of large avalanches for the CTC100 BMG sample. This tail takes a certain time of around 0.2 s before the next round of stress increase. It is actually a process of energy absorption of the first primary shear band. That is to say, the interaction or the assistance of the first primary shear band can be a cushion of jerky propagation [10,36], improving the plastic deformation capability.
The large avalanches in Figure 6b are from stage 2. We also checked the large avalanches form stage 1 in the same logarithmically spaced bin, which shows similar profiles to Figure 6a. This further explains the importance of multiple primary shear bands in modifying plasticity. The sizes of avalanches at the beginning of stage 2 are decreased (indicated by the orange arrow in Figure 2d), supporting the scenario of depressed shear-dynamics by multiple primary shear bands. The multiple primary shear bands can effectively inhibit their further propagation as well [14], which is characterized by the less obvious shear offset shown in the compressed CTC100 BMG sample in Figure 5c. The temporal profiles of large avalanches from stage 2 with the sizes located in the other two logarithmically spaced bins are checked as well, showing a gradually decreased duration of absorption energy with the increase in avalanche sizes. This finding is consistent with the statistical results circled by the orange dashed box in Figure 3, and further suggests that a failure will eventually break out accompanied by the large jerky slipping [7,50]. The large jerky slip avalanches are distinct from small avalanches, which are predicted by the mean-field theory to have the avalanche sizes, S , growing with the slipping area, A , to the 3/2 power as the following [40],
S ~ A 3 / 2

4.3. Slip Avalanches Tuned by Applied Stress for the CTC100 BMG

From the aforementioned discussion, it is concluded that a new primary shear band activated after SB1 can modify and dominate the plasticity of CTC100-treated BMGs, which can be reflected by the slip avalanches. That is to say, we have answered the question why and how slip avalanches reflect the enhanced plasticity mediated by shear banding for CTC100 BMG samples. Here, we aim to answer an enlightening question on how to predict a good opportunity to intervene in the failure of CTC100 BMGs in advance via tracing the dynamics of slip avalanches.
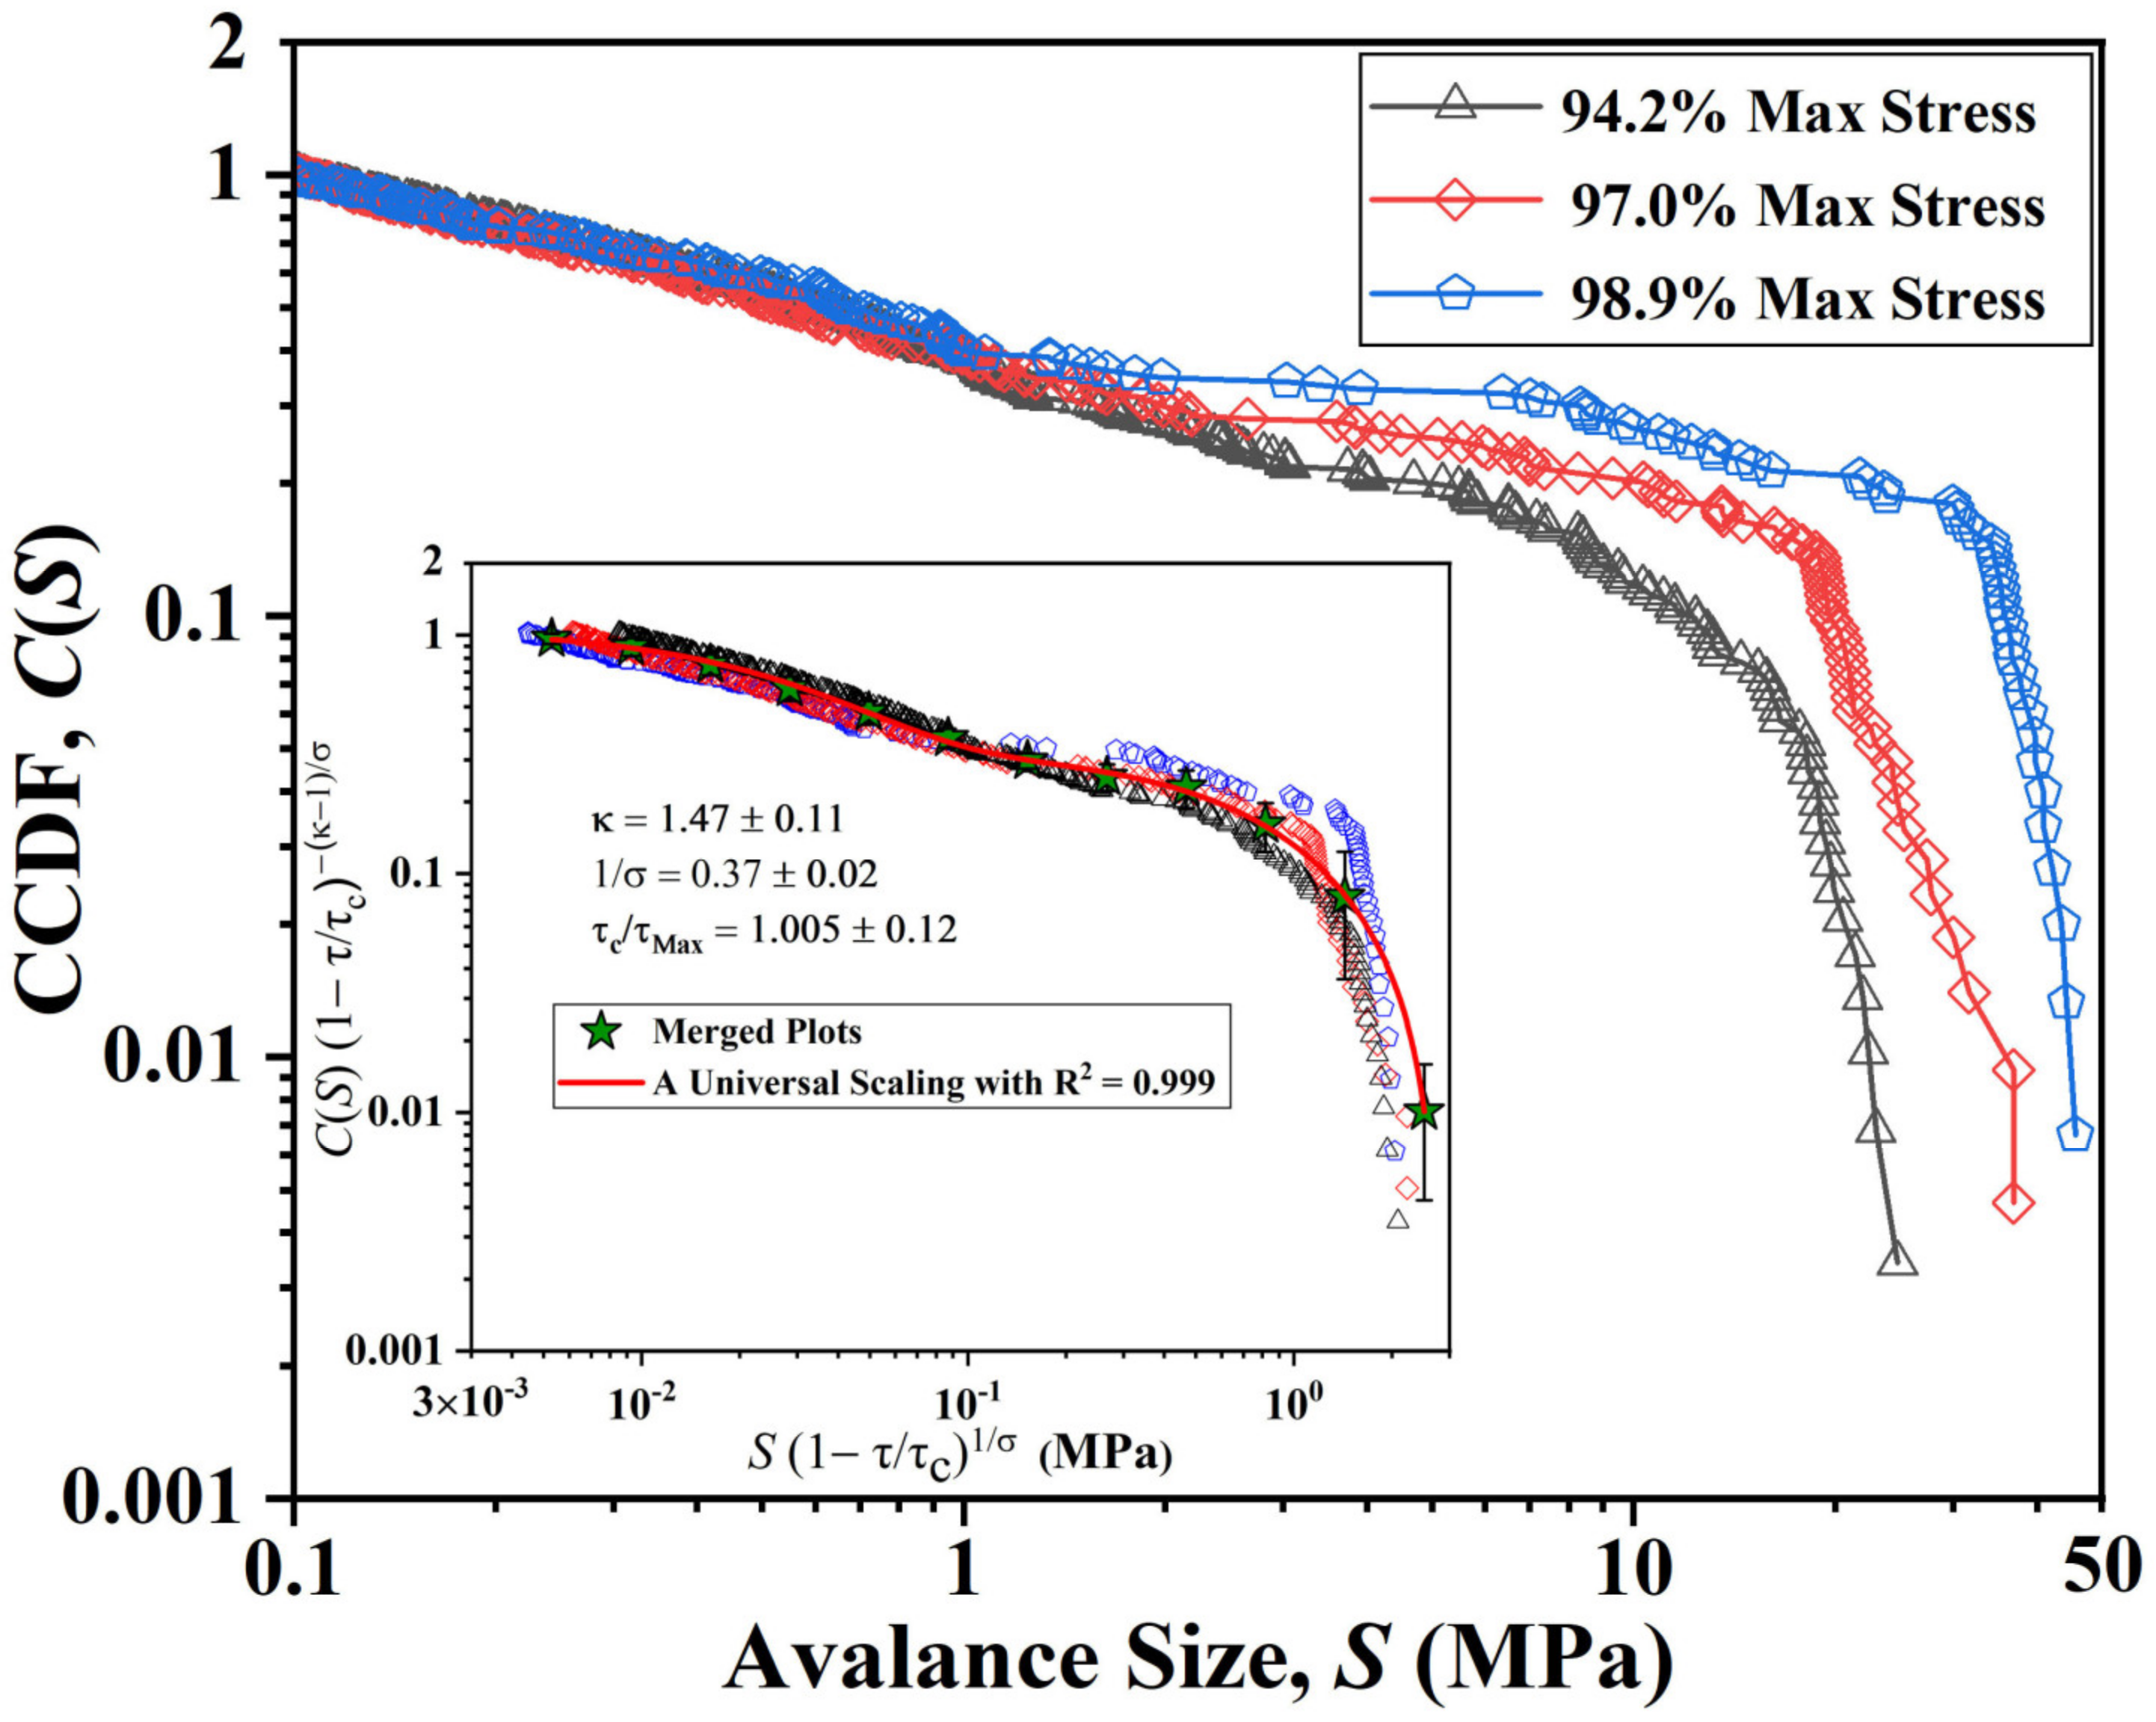
For AC and CTC BMG samples, the sizes of the largest jerky slip avalanche are both slightly more than 50 MPa. For a slowly compressed BMG with given composition, the largest avalanche size actually depends on the area of the maximum shear plane. The avalanche with the size of 50 MPa is considered as the failure avalanche for the current CTC100-treated BMGs. The complementary cumulative distribution function (CCDF), C ( S ) , gives the probability of observing an avalanche of the size exceeding S, which is useful for systems with hundreds of avalanche events [31], and therefore is suitable for the current work. In order to avoid the appearance of failure avalanche in advance, three partitions of applied stresses of stage 2 are selected, and the complementary cumulative distribution functions (CCDFs) of avalanche sizes for each of the three partitions [31] are investigated and can be expressed as the following [30,31] (see the main diagram of Figure 7):
C S ~ f 1 σ κ 1 C S f 1 σ
The applied stress, τ and critical stress, τ C give a normalized parameter, f 1 τ / τ C . C is a universal scaling function [30,42]. S is the avalanche size, and C S is the CCDFs of avalanche sizes. The critical stress, τ C , is given by the maximum stress, τ m a x , multiplied by a fitting parameter of 1.005, i.e., τ C = 1.005 τ m a x . The value of τ m a x is equal to the maximum stress in failure stresses achieved during the three slowly compressed CTC100 BMG samples [31], which is 2378 MPa in this work.
In the inset of Figure 7, the plots of C S 1 τ / τ C κ 1 / σ versus S 1 τ / τ C 1 / σ are shown. A wisdom universal scaling of experimental avalanche size distribution yields, as fitted by the red solid curve, until the plots lie on the top of each other by tuning the critical exponents [30,31], 1 / σ = 0.37 ± 0.02 and κ = 1.47 ± 0.11. (The tuned plots are merged and further analyzed in logarithmically spaced bins in size (see the green stars).) The three applied stress ranges are near but not too close to the critical failure stress [31]. Nearly all of the avalanches start to slip at the applied stress above 92% of the maximum stress. Three partitions of applied stress were chosen as 92.6–95.8%, 95.8–98.2.0%, and 98.2–99.6%, giving the average applied stress, τ of 94.2% maximum stress (see the black dots), 97.0% maximum stress (see the red dots), and 98.9% maximum stress (see the blue dots). The CCDFs for three partitions of applied stress collapse onto a simple scaling function, C defined in Equation (6). This indicates that the scaling behavior of avalanche sizes and the failure avalanche can be predicted for other applied stress windows of the CTC100 BMG sample as well.
The tuned critical exponents to obtain such a collapse are 1 / σ = 0.37 ± 0.04 and κ = 1.47 ± 0.11. The mean-field theory predicts that the critical exponents, κ for solid materials that span from nanometers to several meters in length should be universal and with the value of 1.5 [10]. The values of κ = 1.47 ± 0.11 agree with the prediction of mean-field theory within error bars. The experimental critical exponent, 1 / σ = 0.37 ± 0.02, slightly deviates from the value of 0.5 predicted by the mean-field theory for steady state [30,31]. The reason for the deviation from model prediction is the longer-span applied stresses chosen in this work compared to those in references [30,31].
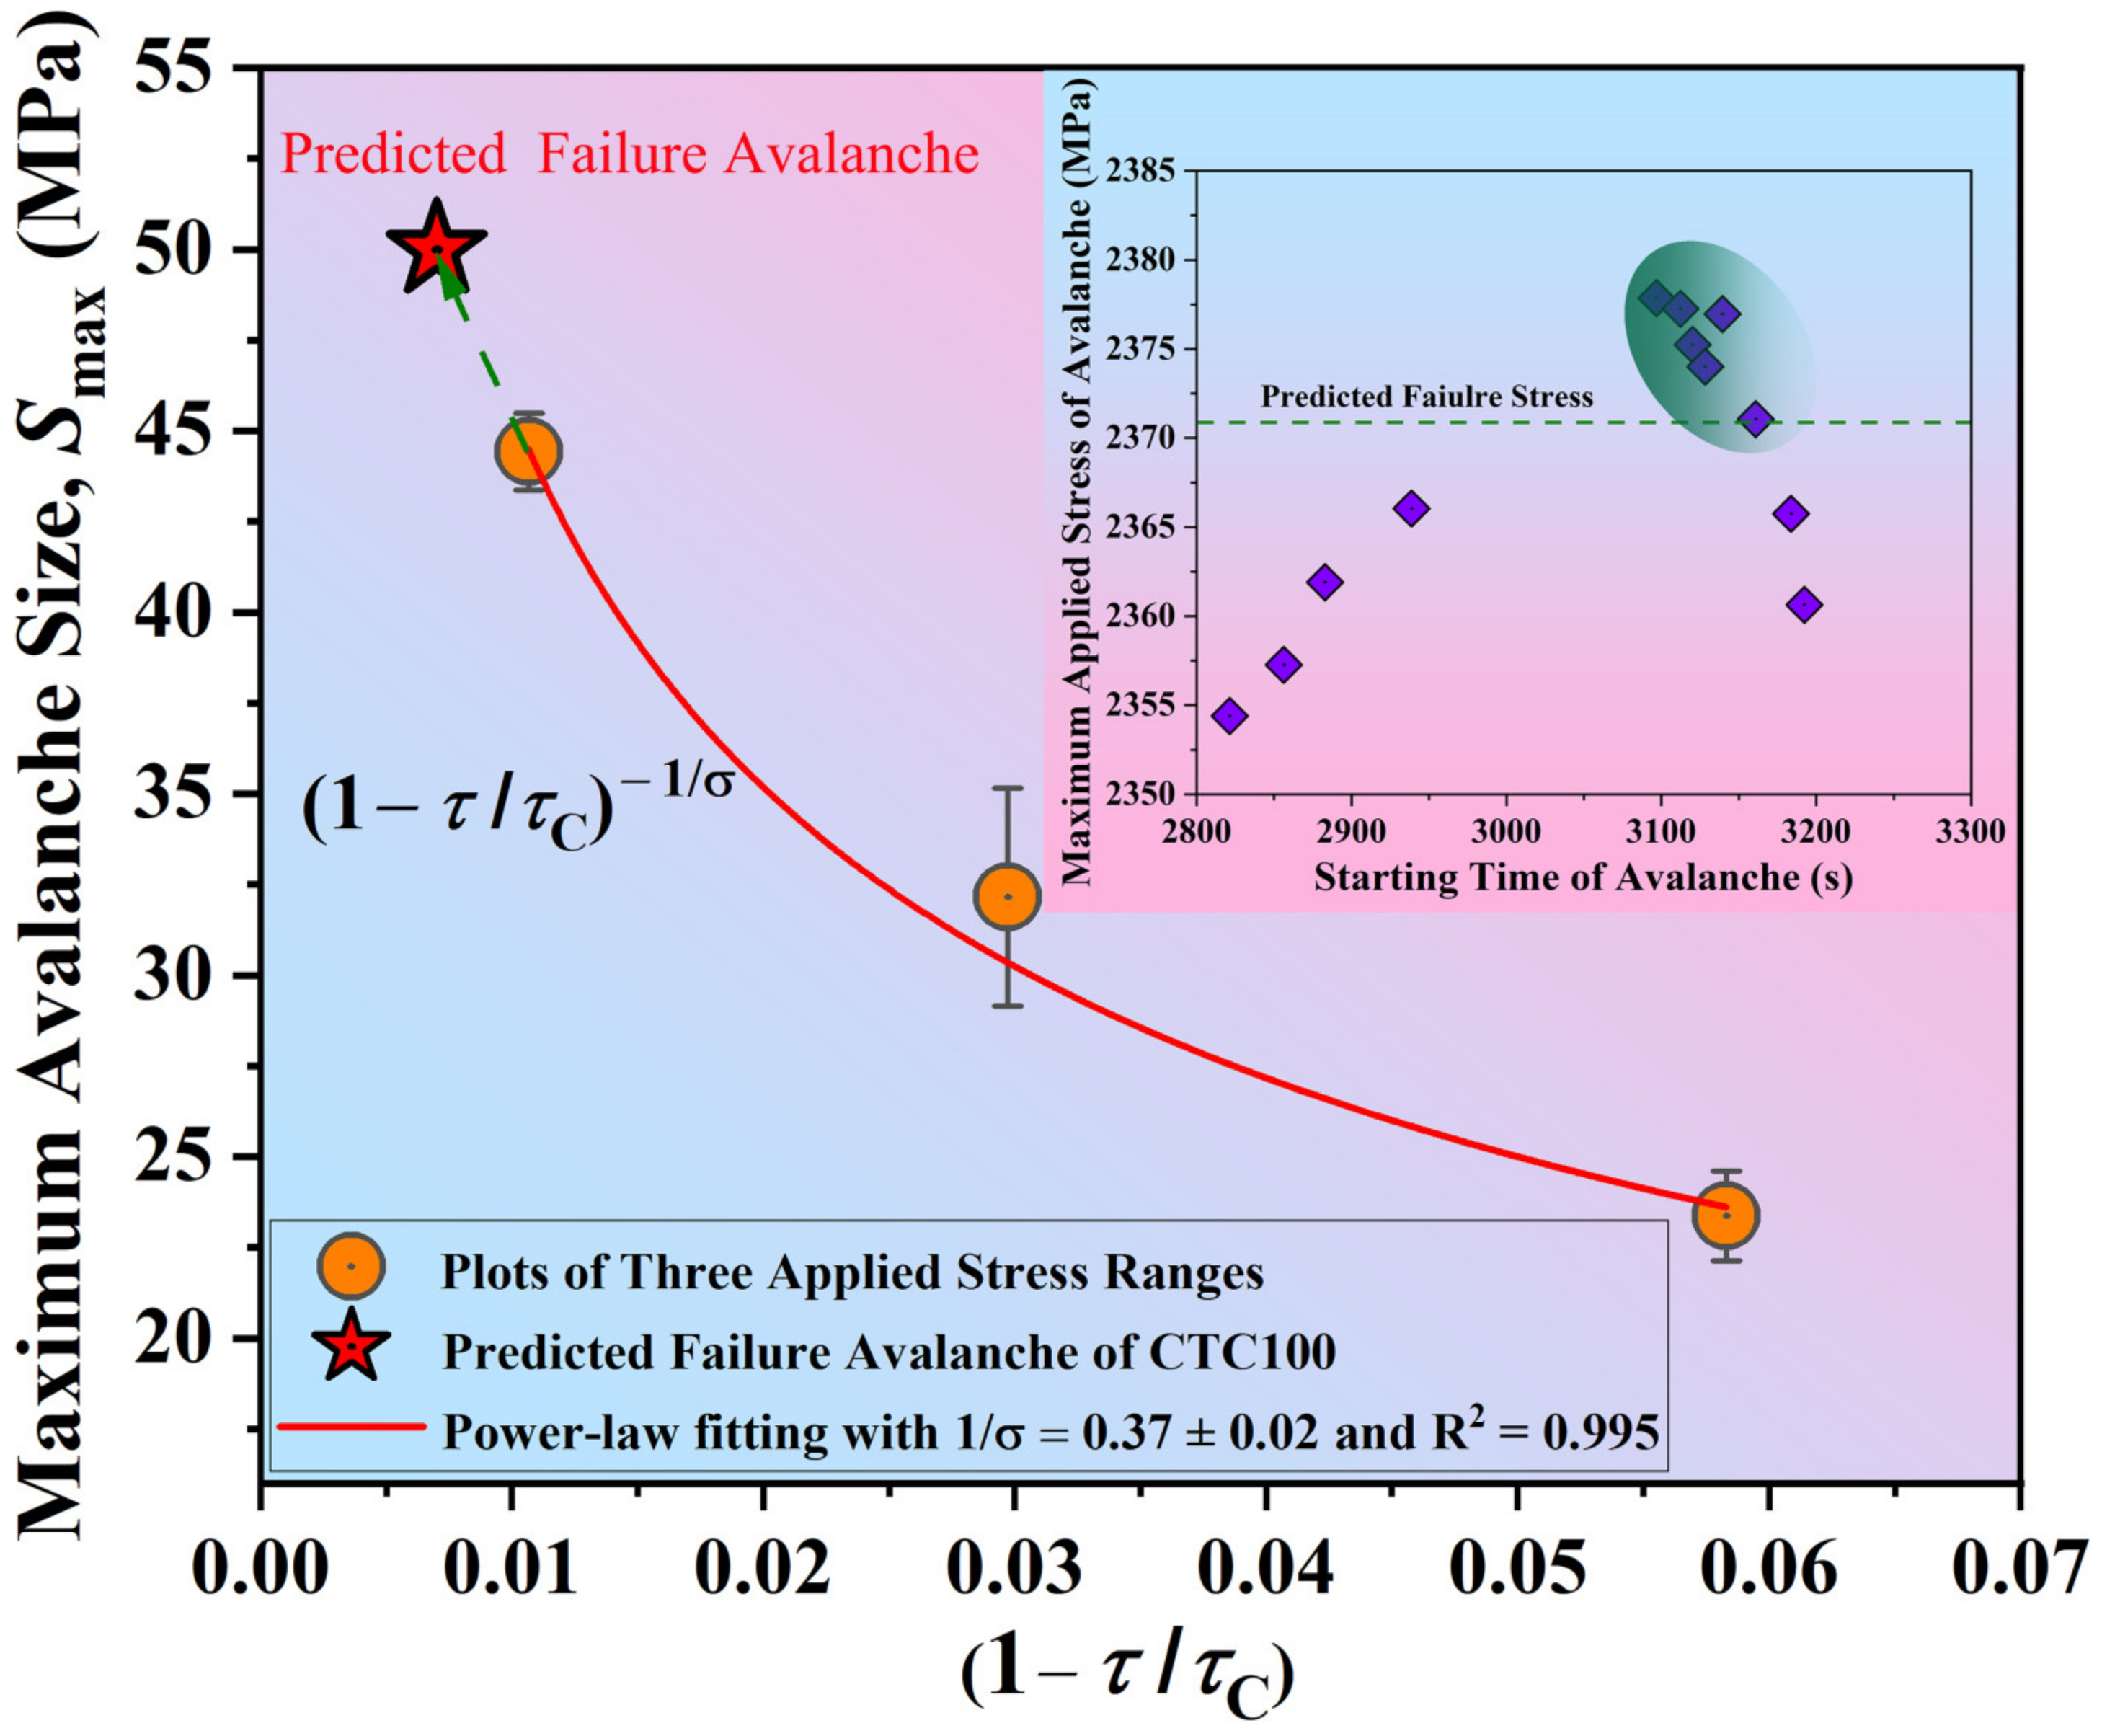
Nevertheless, the maximum avalanche size, S m a x , for other applied stress windows can be predicted by using the critical exponent, 1 / σ using the following [30]:
S m a x ~ 1 S / S C 1 / σ
Figure 8 is the plot of maximum avalanche size, S m a x , versus the quantity, 1 τ / τ C for three investigated applied stress ranges. It is seen that the fitted critical exponent, 1 / σ , is of the value of 0.37 ± 0.02 with a coefficient of determination as high as 0.995. This tells us that the failure avalanche, S f a i l u r e , with the size of 50 MPa would take place at the average applied stress, τ of the value of around 2371 MPa according to the relationship defined in Equation (7), which is consistent with the experimental results circled in the green ellipse as shown in inset of Figure 8. This further tells us that the appearance of applied stress with the size fluctuating around the predicted failure stress is a good opportunity to intervene in the failure of the CTC100 BMG sample in advance.

5. Conclusions

In summary, the plastic deformation and slip avalanches for slowly compressed AC and CTC100 BMG samples with the composition of Zr52.5Cu17.9Ni14.6Al10Ti5 are investigated. The improvement of compressive plasticity of CTC100 BMG samples suggests a rejuvenated structure via CTC treatment. The avalanche duration grows with the avalanche size to the 1/2 power for both AC and CTC100 BMG samples, which is consistent with the prediction of mean-field theory for brittle materials. The cutoff avalanche of this power-law scaling is defined as the critical avalanche. The critical avalanche size of the CTC100 BMG sample is smaller than that of the AC BMG sample, which is explained by the larger structural-weakening factor. Being assisted by first primary shear band, a shear band is newly activated and developed into the primary shear band that dominates the plastic deformation of stage 2, contributing to a two-stage mode of plastic deformation for the CTC100 BMG sample. More than one primary shear band can inhibit the jerky simultaneous propagation, and such bands are prone to arrest the system-spanning slips, generating sluggish shear-dynamics that are characterized by a tail of the temporal profile for large avalanches. Moreover, the complementary cumulative distribution functions of avalanche sizes for each of the three partitions of applied stresses collapse onto a universal scaling. This universal collapse can predict the range of applied stress at which the failure avalanche appears most, providing a good opportunity to intervene in the failure of the CTC100 BMG sample in advance.

Supplementary Materials

The following are available online at https://www.mdpi.com/article/10.3390/met14060731/s1, Figure S1: Compressive stress-strain curves for three CTC100-treated BMG samples. Table S1. The parameters of serrations and mechanical properties of both AC and CTC100 specimens. Sall: all of serrations; Ssmall: the number of small serrations; Smax: maximum stress drop; εp: plastic strain; σy: yielding stress; ΩSTZ: STZ volume. Figure S2: Morphologies of compressed sample 2. Figure S3. A picture of sample 1 under compression.

Author Contributions

Conceptualization, data curation, formal analysis, funding acquisition, methodology, software, writing—original draft, and visualization: J.L. Data discussion and writing review: Y.L. (Yao Liu), W.Z., H.Z., Y.Z., H.L., Z.W. and Y.L. (Yong Liu). All authors have read and agreed to the published version of the manuscript.

Funding

The present work was financially supported by the Fundamental Research Program of Shanxi Province, China (Grant No. 20210302124098, No. 202203021212148, No. 202303021222115, No. 202303021211155, No. 202303021211146), the Opening Projects of National Key Laboratory of Special Vehicle Design and Manufacturing Integration Technology (Grant No. GZ2023KF013), the Opening Project of Shanxi Provincial Key Laboratory for Advanced Manufacturing Technology (Grant No. XJZZ202204, No. XJZZ202308, No. XJZZ202312), and the Higher Education Reform and Innovation Project of North University of China (Grant No. 2022279, No. 2022286).

Data Availability Statement

The original contributions presented in the study are included in the article/Supplementary Materials, further inquiries can be directed to the corresponding author/s.

Conflicts of Interest

Authors Jiaojiao Li and Yong Liu were employed by the company National Key Laboratory of Special Vehicle Design and Manufacturing of Integration Technology. The remaining authors declare that the research was conducted in the absence of any commercial or financial relationships that could be construed as a potential conflict of interest.

References

  1. Wang, W.H.; Dong, C.; Shek, C.H. Bulk metallic glasses. Mater. Sci. Eng. R Rep. 2004, 44, 45–89. [Google Scholar] [CrossRef]
  2. Ge, J.C.; Gu, Y.; Yao, Z.Z.; Liu, S.N.; Ying, H.Q.; Lu, C.Y.; Wu, Z.D.; Ren, Y.; Suzuki, J.; Xie, Z.H.; et al. Evolution of medium-range order and its correlation with magnetic nanodomains in Fe-Dy-B-Nb bulk metallic glasses. J. Mater. Sci. Technol. 2024, 176, 224–235. [Google Scholar] [CrossRef]
  3. Bordeenithikasem, P.; Carpenter, K.C.; Hofmann, D.C.; White, V.E.; Yee, K.Y.; Rizzardi, Q.; Maa, R. Miniaturized bulk metallic glass gripping structures for robotic mobility platforms. Acta Astronaut. 2024, 219, 399–407. [Google Scholar] [CrossRef]
  4. Gao, K.; Zhu, X.G.; Chen, L.; Li, W.H.; Xu, X.; Pan, B.T.; Li, W.R.; Zhou, W.H.; Li, L.; Huang, W.; et al. Recent development in the application of bulk metallic glasses. J. Mater. Sci. Technol. 2022, 11, 115–121. [Google Scholar] [CrossRef]
  5. Gu, Y.C.; Cappola, J.; Wang, J.; Li, L. A Hall-Petch-like relationship linking nanoscale heterogeneity to yield stress of heterogeneous metallic glasses. Int. J. Plast. 2023, 170, 103759. [Google Scholar] [CrossRef]
  6. Thurnheer, P.; Maaß, R.; Laws, K.J.; Pogatscher, S.; Löffler, J.F. Dynamic properties of major shear bands in Zr–Cu–Al bulk metallic glasses. Acta Mater. 2015, 96, 428–436. [Google Scholar] [CrossRef]
  7. Li, J.J.; Fan, J.F.; Wang, Z.; Wu, Y.C.; Dahmen, K.A.; Qiao, J.W. Temperature rises during strain-rate dependent avalanches in bulk metallic glasses. Intermetallics 2020, 116, 106637. [Google Scholar] [CrossRef]
  8. Spaepen, F. A microscopic mechanism for steady state inhomogeneous flow in metallic glasses. Acta Metall. 1977, 25, 407–415. [Google Scholar] [CrossRef]
  9. Li, L.; Homer, E.R.; Schuh, C.A. Shear transformation zone dynamics model for metallic glasses incorporating free volume as a state variable. Acta Mater. 2013, 61, 3347–3359. [Google Scholar] [CrossRef]
  10. Antonaglia, J.; Wright, W.J.; Gu, X.; Byer, R.R.; Hufnagel, T.C.; LeBlanc, M.; Uhl, J.T.; Dahmen, K.A. Bulk metallic glasses deform via slip avalanches. Phys. Rev. Lett. 2014, 112, 155501. [Google Scholar] [CrossRef]
  11. Wang, Z.; Wang, W.H. Flow units as dynamic defects in metallic glassy materials. Natl. Sci. Rev. 2019, 6, 304–323. [Google Scholar] [CrossRef] [PubMed]
  12. Zhu, Y.B.; Xu, M.Q.; Yang, G.J.; Wu, B.Q.; Lu, W.Q.; Gharbi, A.; Sun, Q.J.; Yi, J.J. Cryogenic thermal cycling effects on serration behavior in wide glass transition temperature Zr-based bulk metallic glasses. J. Non. Cryst. Solids 2024, 627, 122838. [Google Scholar] [CrossRef]
  13. Zhou, H.B.; Shen, L.Q.; Sun, B.A.; Wang, W.H. Research progress on the shear band of metallic glasses. J. Alloys Compd. 2023, 995, 170164. [Google Scholar] [CrossRef]
  14. Mo, Y.H.; Tang, X.C.; Meng, L.Y.; Qiao, J.W.; Yao, X.H. Spatial–Temporal evolution of shear banding in bulk metallic glasses. Mater. Sci. Eng. A 2021, 800, 140286. [Google Scholar] [CrossRef]
  15. Ding, G.; Li, C.; Zaccone, A.; Wang, W.H.; Lei, H.C.; Jiang, F.; Ling, Z.; Jiang, M.Q. Ultrafast extreme rejuvenation of metallic glasses by shock compression. Sci. Adv. 2019, 5, eaaw6249. [Google Scholar] [CrossRef]
  16. Ma, E. Tuning order in disorder. Nat. Mater. 2015, 14, 547–552. [Google Scholar] [CrossRef] [PubMed]
  17. Wu, J.P.; Lin, Y.; Duan, F.H.; Chen, Q.; Wang, H.T.; Li, N.; Wen, J.L.; Pan, J.; Liu, L. Unexpected creep behavior in a rejuvenated metallic glass. J. Mater. Sci. Technol. 2023, 163, 140–149. [Google Scholar] [CrossRef]
  18. Amigo, N. Cryogenic thermal cycling rejuvenation in metallic glasses: Structural and mechanical assessment. J. Non. Cryst. Solids 2022, 596, 121850. [Google Scholar] [CrossRef]
  19. Ketov, S.V.; Sun, Y.H.; Nachum, S.; Lu, Z.; Checchi, A.; Beraldin, A.R.; Bai, H.Y.; Wang, W.H.; Louzguine-Luzgin, D.V.; Carpenter, M.A.; et al. Rejuvenation of metallic glasses by non-affine thermal strain. Nature 2015, 524, 200–203. [Google Scholar] [CrossRef]
  20. Luo, Y.S.; Wang, Z.; Qiao, J.W. Flow serrations of rejuvenation behavior through cryogenic thermal cycling for Zr-based bulk metallic glass. Philos. Mag. 2021, 101, 2261–2272. [Google Scholar] [CrossRef]
  21. Das, A.; Dufresne, E.M.; Maaß, R. Structural dynamics and rejuvenation during cryogenic cycling in a Zr-based metallic glass. Acta Mater. 2020, 196, 723–732. [Google Scholar] [CrossRef]
  22. Song, W.L.; Meng, X.H.; Wu, Y.; Cao, D.; Wang, H.; Liu, X.J.; Wang, X.Z.; Lu, Z.P. Improving plasticity of the Zr46Cu46Al8 bulk metallic glass via thermal rejuvenation. Sci. Bull. 2018, 63, 840–844. [Google Scholar] [CrossRef] [PubMed]
  23. Wang, Z.Z.; Huang, P.; Fan, X.L.; Wang, F. Heterogeneity dependent cryogenic thermal cycling behavior of metallic glasses: A potential energy landscape perspective. Intermetallics 2023, 159, 107935. [Google Scholar] [CrossRef]
  24. Guo, W.; Yu, S.; Ding, J.; Liu, S.L.; Zhao, M. Tailoring rejuvenation behavior of Zr-based metallic glass upon deep cryogenic cycling treatment. Trans. Nonferrous Met. Soc. China 2024, 34, 582–591. [Google Scholar] [CrossRef]
  25. Ketov, S.V.; Trifonov, A.S.; Ivanov, Y.P.; Churyumov, A.Y.; Lubenchenko, A.V.; Batrakov, A.A.; Jiang, J.; Louzguine-Luzgin, D.V.; Eckert, J.; Orava, J.; et al. On cryothermal cycling as a method for inducing structural changes in metallic glasses. NPG Asia Mater. 2018, 10, 137. [Google Scholar] [CrossRef]
  26. Zhu, Q.Y.; Jin, X.; Yang, H.J.; Jia, L.; Qiao, J.W. Effect of deep cryogenic cycling treatment on shear transformation zone volume and size of Zr-based metallic glass. J. Mater. Res. 2021, 36, 2047–2055. [Google Scholar] [CrossRef]
  27. Meng, Y.H.; Zhang, S.Y.; Zhou, W.H.; Yao, J.H.; Liu, S.N.; Li, Y. Rejuvenation by enthalpy relaxation in metallic glasses. Acta Mater. 2022, 241, 118376. [Google Scholar] [CrossRef]
  28. Gao, T.; Yang, C.; Ding, G.; Dai, L.H.; Jiang, M.Q. Structural rejuvenation of a well-aged metallic glass. Fundam. Res. 2023, 14, 57. [Google Scholar] [CrossRef]
  29. Das, A.; Ott, C.; Pechimuthu, D.; Moosavi, R.; Stoica, M.; Derlet, P.M.; Maa, R. Shear-band cavitation determines the shape of the stress-strain curve of metallic glasses. Phys. Rev. Lett. 2023, 7, 023602. [Google Scholar] [CrossRef]
  30. Wang, Z.; Li, J.J.; Zhang, W.; Qiao, J.W.; Wang, B.C. The self-organized critical behavior in Pd-based bulk metallic glass. Metals 2015, 5, 1188–1196. [Google Scholar] [CrossRef]
  31. Antonaglia, J.; Xie, X.; Schwarz, G.; Wraith, M.; Qiao, J.; Zhang, Y.; Liaw, P.K.; Uhl, J.T.; Dahmen, K.A. Tuned critical avalanche scaling in bulk metallic glasses. Sci. Rep. 2014, 4, 4382. [Google Scholar] [CrossRef]
  32. Du, Y.; Zhou, Q.; Jia, Q.; Shi, Y.; Wang, H.; Wang, J. Imparities of shear avalanches dynamic evolution in a metallic glass. Mater. Res. Lett. 2020, 8, 357–363. [Google Scholar] [CrossRef]
  33. Sun, B.A.; Yu, H.B.; Jiao, W.; Bai, H.Y.; Zhao, D.Q.; Wang, W.H. Plasticity of ductile metallic glasses: A self-organized critical state. Phys. Rev. Lett. 2010, 105, 035501. [Google Scholar] [CrossRef]
  34. Wright, W.J.; Liu, Y.; Gu, X.; Van Ness, K.D.; Robare, S.L.; Liu, X.; Antonaglia, J.; LeBlanc, M.; Uhl, J.T.; Hufnagel, T.C.; et al. Experimental evidence for both progressive and simultaneous shear during quasistatic compression of a bulk metallic glass. J. Appl. Phys. 2016, 119, 084908. [Google Scholar] [CrossRef]
  35. Maaß, R. Beyond Serrated Flow in Bulk Metallic Glasses: What Comes Next? Metall. Mater. Trans. A 2020, 51, 5597–5605. [Google Scholar] [CrossRef]
  36. Long, A.A.; Wright, W.J.; Gu, X.J.; Thackray, A.; Nakib, M.; Uhl, J.T.; Dahmen, K.A. Experimental evidence that shear bands in metallic glasses nucleate like cracks. Sci. Rep. 2022, 12, 8499. [Google Scholar] [CrossRef] [PubMed]
  37. Qu, R.T.; Liu, Z.Q.; Wang, G.; Zhang, Z.F. Progressive shear band propagation in metallic glasses under compression. Acta Mater. 2015, 91, 19–33. [Google Scholar] [CrossRef]
  38. Li, J.J.; Qiao, J.W.; Wu, Y.C. Seismic-like size dynamics of slip avalanches in bulk metallic glasses. J. Alloys Compd. 2020, 819, 152941. [Google Scholar] [CrossRef]
  39. McFaul, L.W.; Wright, W.J.; Gu, X.; Uhl, J.T.; Dahmen, K.A. Aftershocks in slowly compressed bulk metallic glasses: Experiments and theory. Phys. Rev. E 2018, 97, 063005. [Google Scholar] [CrossRef]
  40. Long, A.A.; Denisov, D.V.; Schall, P.; Hufnagel, T.C.; Gu, X.; Wright, W.J.; Dahmen, K.A. From critical behavior to catastrophic runaways: Comparing sheared granular materials with bulk metallic glasses. Granul. Matter 2019, 21, 99. [Google Scholar] [CrossRef]
  41. Salje, E.K.; Saxena, A.; Planes, A. (Eds.) Avalanches in Functional Materials and Geophysics; Springer: Cham, Switzerland, 2017. [Google Scholar]
  42. Dahmen, K.A.; Ben-Zion, Y.; Uhl, J.T. Micromechanical model for deformation in solids with universal predictions for stress-strain curves and slip avalanches. Phys. Rev. Lett. 2009, 102, 175501. [Google Scholar] [CrossRef] [PubMed]
  43. Maaß, R.; Wraith, M.; Uhl, J.T.; Greer, J.R.; Dahmen, K.A. Slip statistics of dislocation avalanches under different loading modes. Phys. Rev. E 2015, 91, 042403. [Google Scholar] [CrossRef] [PubMed]
  44. Cao, P.H.; Dahmen, K.A.; Kushima, A.; Wright, W.J.; Park, H.S.; Short, M.P.; Yip, S. Nanomechanics of slip avalanches in amorphous plasticity. J. Mech. Phys. Solids 2018, 114, 158–171. [Google Scholar] [CrossRef]
  45. Derlet, P.M.; Maaß, R. Thermally-activated stress relaxation in a model amorphous solid and the formation of a system-spanning shear event. Acta Mater. 2018, 143, 205–213. [Google Scholar] [CrossRef]
  46. Zhao, P.; Li, J.; Hwang, J.; Wang, Y. Influence of nanoscale structural heterogeneity on shear banding in metallic glasses. Acta Mater. 2017, 134, 104–115. [Google Scholar] [CrossRef]
  47. Liu, C.; Ikeda, Y.; Maaß, R. Strain-dependent shear-band structure in a Zr-based bulk metallic glass. Scr. Mater. 2021, 190, 75–79. [Google Scholar] [CrossRef]
  48. Şopu, D.; Scudino, S.; Bian, X.L.; Gammer, C. Atomic-scale origin of shear band multiplication in heterogeneous metallic glasses. J. Eckert Scr. Mater. 2020, 178, 57–61. [Google Scholar] [CrossRef]
  49. Pan, D.; Inoue, A.; Sakurai, T.; Chen, M.W. Experimental characterization of shear transformation zones for plastic flow of bulk metallic glasses, Proc. Natl. Acad. Sci. USA 2008, 105, 14769–14772. [Google Scholar] [CrossRef]
  50. Qu, R.T.; Wu, S.J.; Wang, S.G.; Wang, X.D.; Zhang, Z.F. Shear banding stability and fracture of metallic glass: Effect of external confinement, J. Mech. Phys. Solids 2020, 138, 103922. [Google Scholar] [CrossRef]
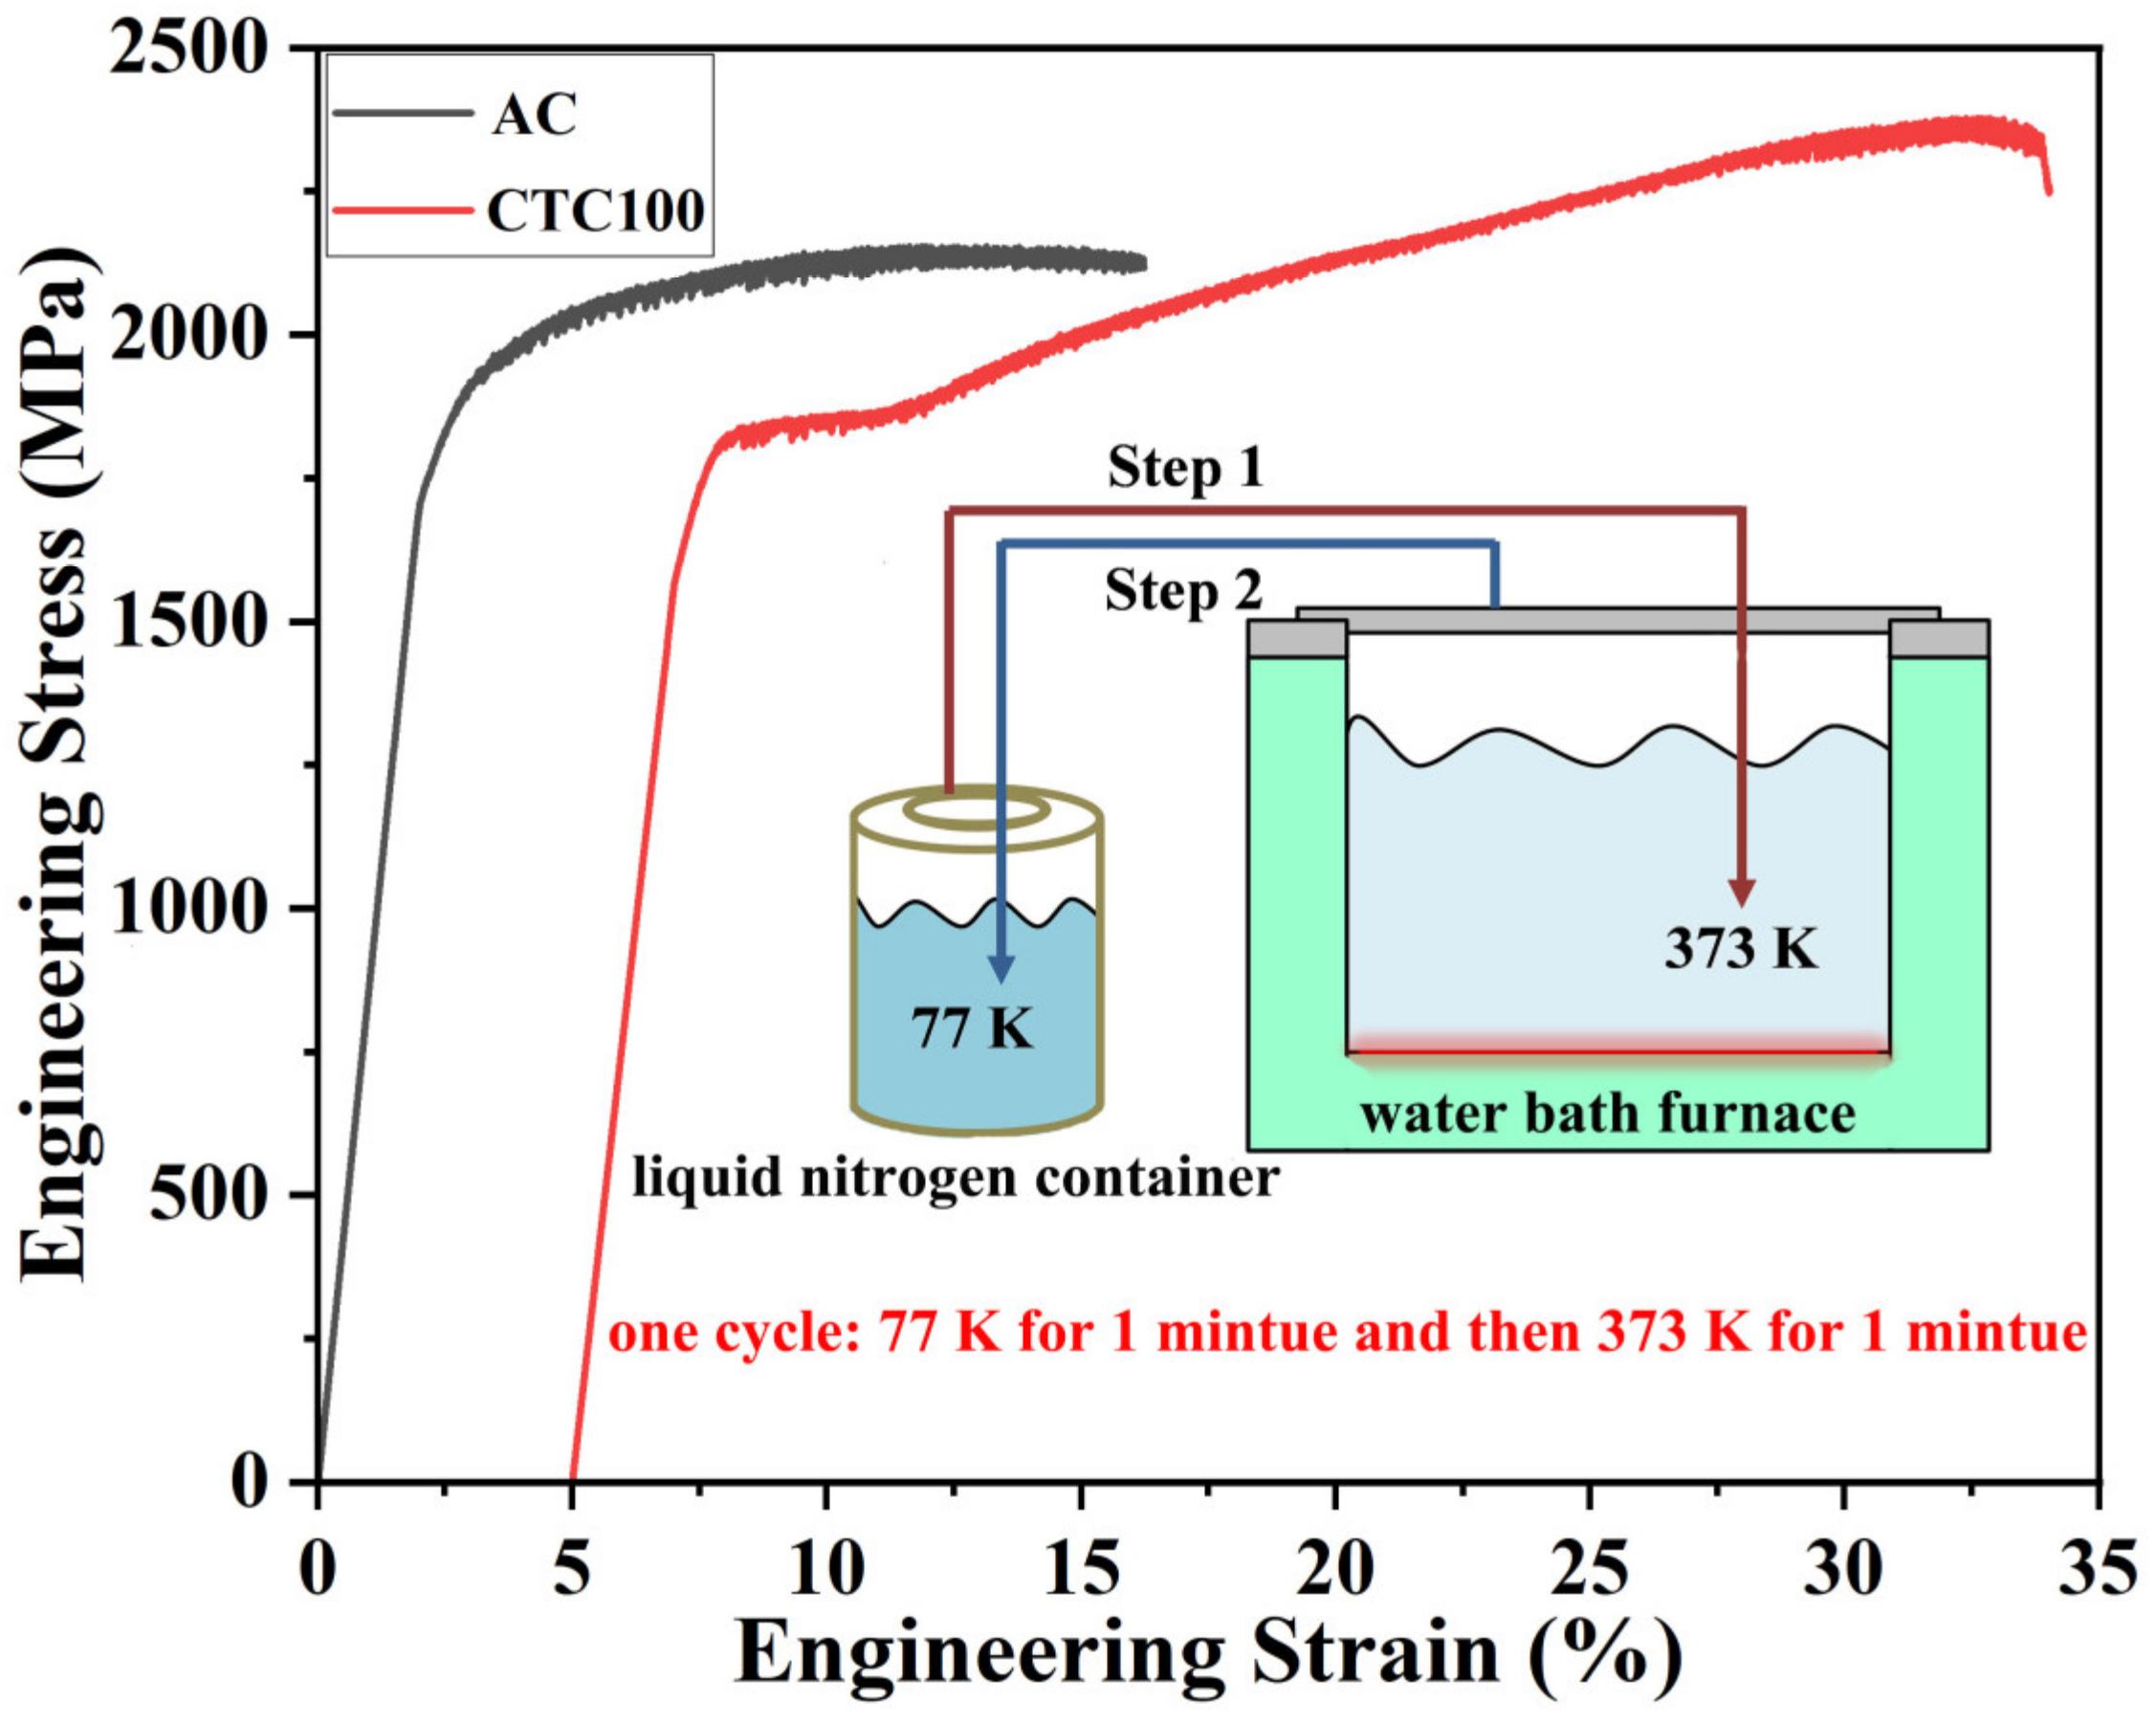
Figure 1. Engineering stress–strain curves for slowly compressed AC and CTC100 BMG samples at the strain rate of 1 × 10⁻⁴ s−1. The composition of BMG samples is Zr52.5Cu17.9Ni14.6Al10Ti5.
Metals 14 00731 g001
Figure 2. (a) Engineering stress–time curve and stress drop rate–time curve for AC. (b) Engineering stress–time curve and stress drop rate–time curve for CTC00. A two-stage mode of steady plastic deformation. An approximate boundary between stage 1 and stage 2 is guided by the red solid line that is perpendicular to the time axis. (c) Plots of avalanche size versus starting time of avalanche for AC. The orange dashed box shows the very few medium-sized avalanches (with the size larger than the avalanche size of S c r i t and smaller than the avalanche size of 20 MPa). (d) Plots of avalanche size versus starting time of avalanche for CTC100. Stage 2 starts from about the time that is guided by the red solid line as well. The orange arrow shows a slight decrease in avalanche sizes at the beginning of Stage 2. The pink and blue dashed lines in both (c,d), respectively, show the critical avalanche size, S c r i t , and the large avalanche size, S l a r g e .
Metals 14 00731 g002
Figure 3. Hollow symbols: Plot of avalanche duration versus avalanche size for slowly compressed AC and CTC100 BMG samples. Full symbols: Plot of avalanche duration versus size analyzed in logarithmically spaced bins for slowly compressed AC and CTC100 BMGs. Full symbols inside the dashed orange box indicate large slip avalanches analyzed in logarithmically spaced bins.
Metals 14 00731 g003
Figure 4. The schematic diagram of structural heterogeneity and shear slips of STZs from (a) AC to (b) CTC100 BMG samples. The cluster of loosely packed atoms is denoted as the STZ. More STZs are activated for the CTC100-treated BMG sample in (b) compared to the AC BMG sample in (a).
Metals 14 00731 g004
Figure 5. (a) Side-surface morphologies of the compressed AC BMG sample. (b) Enlarged figure of the part indicated by a green box in (a). (c) Surface morphologies of the compressed CTC100 BMG sample. (d) Enlarged figure of the part indicated by a purple box in (c).
Metals 14 00731 g005
Figure 6. Temporal avalanch profiles. Stress drop rate as a function of the elapsed time since avalanches with various sizes located in the range of 23 to 34 MPa for (a) AC BMG sample and (b) CTC100 BMG sample.
Metals 14 00731 g006
Figure 7. Main: Complementary cumulative distribution functions (CCDFs) C S of the avalanche size S in slowly compressed CTC100 sample at three partitions of applied stresses. The applied stresslocated in the 92.6–95.8%, 95.8–98.2%, and 98.2–99.6% of the maximum stress τ m a x , respectively, give the average applied stress τ of 94.2% maximum stress (black dots), 97.0% maximum stress (red dots), and 98.9% maximum stress (blue dots). The inset shows the plots of C S 1 τ / τ C κ 1 / σ versus S 1 τ / τ C 1 / σ . The universal scaling was quantitatively verified with the exponent values of κ = 1.47 ± 0.11 and 1 / σ = 0.37 ± 0.02.
Metals 14 00731 g007
Figure 8. Main: Plot of the maximum avalanche size, S m a x , with normalized applied stress parameter, 1 τ / τ C . Here, τ C is the critical applied stress. The maximum avalanche size, S m a x , shows a power law function as the normalized applied stress parameter, 1 τ / τ C and scales as S m a x ~ 1 S / S C 1 / σ with the fitted power-law exponent 1 / σ = 0.37 ± 0.02 (blue dashed line). The red star represents the failure avalanche with the size of 50 MPa. Inset: Plots of experimental maximum applied stress of avalanche versus starting time of the responding avalanche, which is actually the enlarged figure of the data before but very close to failure of CTC100 BMG sample. The green dashed line is the guide to represent the predicted failure applied stress that is predicted further by the quantity, 1 τ / τ C . The appearance of experimental applied stresses inside the green ellipse shows the good opportunity to intervene in the failure of BMGs in advance.
Metals 14 00731 g008
Table 1. Mechanical properties and parameters of slip avalanches for both AC and CTC100 BMG samples. ε p is the plastic strain. x ¯ i , S m a x , v m a x , and S c r i t are, respectively, the average interevent time, maximum size, maximum stress drop rate, and critical size of slip avalanches. N s m a l l , N t o t a l , and r s m a l l are, respectively, the number of small avalanches, the total number of slip avalanches, and the percentage of small avalanches of total slip avalanches.
BMG ε p (%) x ¯ i (s) S m a x
(MPa)
v m a x
(MPa/s)
S c r i t
(MPa)
r s m a l l
(%)
N s m a l l N t o t a l
AC141.9654.311554.670492703
CTC100261.3851.310001.56412051885
Disclaimer/Publisher’s Note: The statements, opinions and data contained in all publications are solely those of the individual author(s) and contributor(s) and not of MDPI and/or the editor(s). MDPI and/or the editor(s) disclaim responsibility for any injury to people or property resulting from any ideas, methods, instructions or products referred to in the content.