Article

Quantitative Study on Hydrogen Concentration–Hydrogen Embrittlement Sensitivity of X80 Pipeline Steel Based on Hydrogen Permeation Kinetics

1
Laboratory of Materials and Metallurgy, College of Materials Science and Engineering, Chongqing University, Chongqing 400044, China
2
National Key Laboratory of Advanced Casting Technologies, Chongqing University, Chongqing 400044, China
*
Author to whom correspondence should be addressed.
Metals 2024, 14(7), 763; https://doi.org/10.3390/met14070763
Submission received: 30 May 2024 / Revised: 23 June 2024 / Accepted: 26 June 2024 / Published: 27 June 2024
(This article belongs to the Special Issue State-of-Art: Metals Failure Analysis)

Abstract

:
The hydrogen concentration in steel is directly related to the hydrogen embrittlement (HE) sensitivity of the steel. This study combined electrochemical hydrogen charging, the slow strain rate test (SSRT), and hydrogen permeation experiments to investigate the variation in the hydrogen concentration in pipeline steel with the electrochemical hydrogen-charging time. The influence of the hydrogen concentration in steel on the mechanical properties of X80 pipeline steel was obtained, and ultimately, a quantitative relationship between the hydrogen concentration in steel and the hydrogen embrittlement sensitivity was established. The results show that the hydrogen concentration in the steel gradually increased with the time of hydrogen charging, and the quantitative relationship formula can be given as CH = 5.35 − 4.2 exp (−0.26t); the HE index of X80 steel increased with the hydrogen concentration. Additionally, once the hydrogen concentration in steel reaches 5.08 × 10⁻⁶ mol/cm3, even the slightest alteration in the hydrogen content will precipitate a dramatic decrease in plasticity. The quantitative relationship formula between the hydrogen concentration and the HE index (FH) in X80 steel can be given as F H = 0 . 029   exp   ( 1 . 5 C H )     0 . 029 . When the hydrogen concentration in steel is at a maximum, the FH of X80 steel reaches 88.6%. This study provides a reference for analyzing the quantitative relationship between the hydrogen concentration and the HE index in steel after electrochemical hydrogen charging.

1. Introduction

Hydrogen energy represents a pivotal direction in the energy transformation due to its outstanding advantages, such as the high calorific value and environmental friendliness [1]. Thus, hydrogen is becoming an integral component of the energy strategies in many countries. Hydrogen transportation is a necessary step to connect hydrogen production and energy terminals [2,3,4,5]. Utilizing pipelines enables low-cost, large-scale, and efficient hydrogen transportation. However, during the hydrogen transportation process through pipelines, the issue of HE can lead to steel failure and pipeline explosions. According to the hydrogen embrittlement mechanisms of metals such as the HP (hydrogen pressure) [6], HELP (hydrogen-enhanced local plasticity model) [7], and HEDE (hydrogen-enhanced decohesion mechanism) [8], the enrichment and diffusion of hydrogen in pipeline steel are the primary causes of HE.
Existing research results indicate a direct correlation between the hydrogen concentration and the HE sensitivity of the steel [9,10,11]. Currently, scholars mainly study the relationship between the hydrogen concentration and the HE index (the HE index is a parameter used to quantitatively assess the resistance of materials to hydrogen embrittlement) in steel indirectly by controlling the hydrogen-charging time [12,13,14]. Zhou et al. [15] found that when the electrochemical hydrogen-charging time was 12 h and the current density was 5 mA/cm2, the HE index of X80 steel was 64.4%. Meanwhile, Cheng et al. [16] suggested that under the same electrochemical hydrogen-charging conditions, the HE index of X80 steel was 59%. Additionally, Wu et al. [17] discovered that under a current density of 50 mA/cm2 for 4 h, the HE index of X80 steel was 11%, while Jiang et al. [18] found that under the same conditions, the HE index of X80 steel was only 5.12%. Different scholars have studied the hydrogen embrittlement susceptibility of X80 pipeline steels at the same hydrogen-charging time, strain rate and temperature, with very different HE indices. This is due to the difference in the hydrogen concentration penetrating into similar pipeline steels. Therefore, the HE susceptibility of pipeline steels can only be studied qualitatively by different scholars, resulting in poor comparability between the final results.
Based on the above problem, some scholars have used gas chromatography, secondary ion mass spectrometry and vacuum extraction to obtain the hydrogen concentration in steel to study the quantitative relationship between the hydrogen concentration and the HE susceptibility in pipeline steel [19,20]. However, due to hydrogen atoms escaping from the steel during the waiting period for testing, these methods have certain drawbacks, including delayed hydrogen concentration measurement and controversy regarding the accuracy of the test methods [21]. Additionally, the operating process of these methods is cumbersome and costly. Therefore, this study adopted an electrochemical method to measure the hydrogen concentration in steel. This method allows for hydrogen concentration testing immediately after the end of electrochemical hydrogen charging, reducing the number of hydrogen atoms escaping from the steel while waiting for the test. It also has the advantages of simplicity of operation and high feasibility.
Based on the problems of low accuracy and high cost in relation to the existing methods for studying the relationship between the hydrogen concentration and the HE sensitivity, this study proposed the use of electrochemical methods for measuring the hydrogen concentration in steel. It established the relationship between the electrochemical hydrogen-charging time and the current density of hydrogen evolution, and it derived the fitting equation for the electrochemical hydrogen-charging time and hydrogen concentration in steel. On that basis, this study investigated the variation in the HE sensitivity of X80 steel with the hydrogen concentration in steel. This study provides a reference for analyzing the quantitative relationship between the hydrogen concentration in steel and the steel HE sensitivity after electrochemical hydrogen charging.

2. Materials and Methods

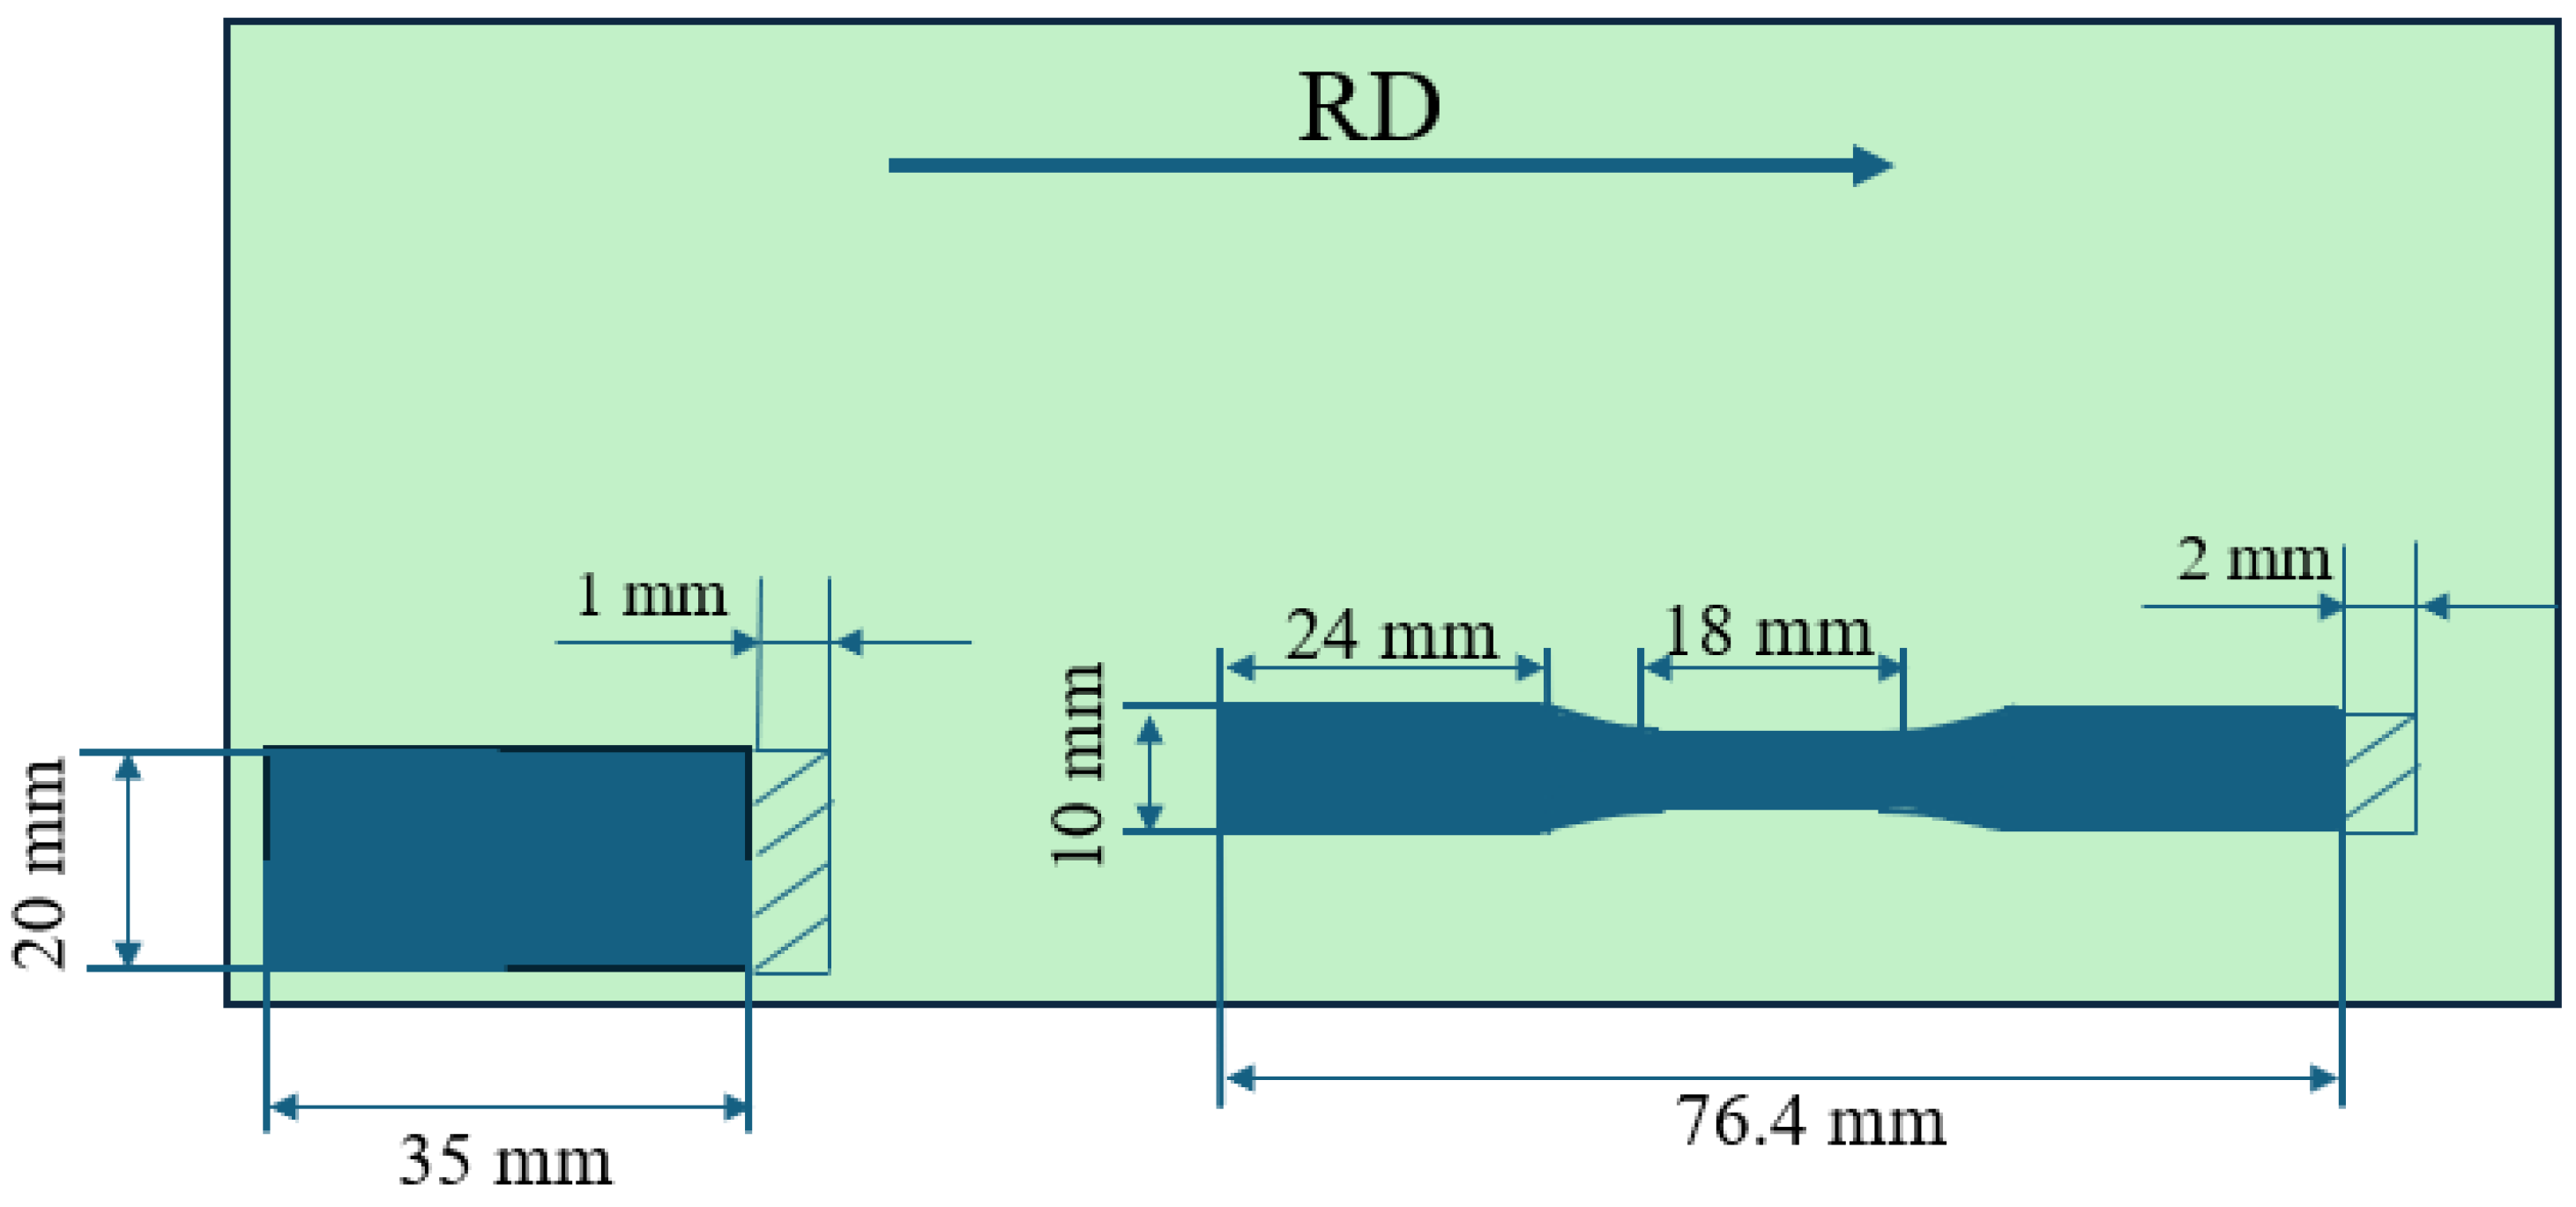
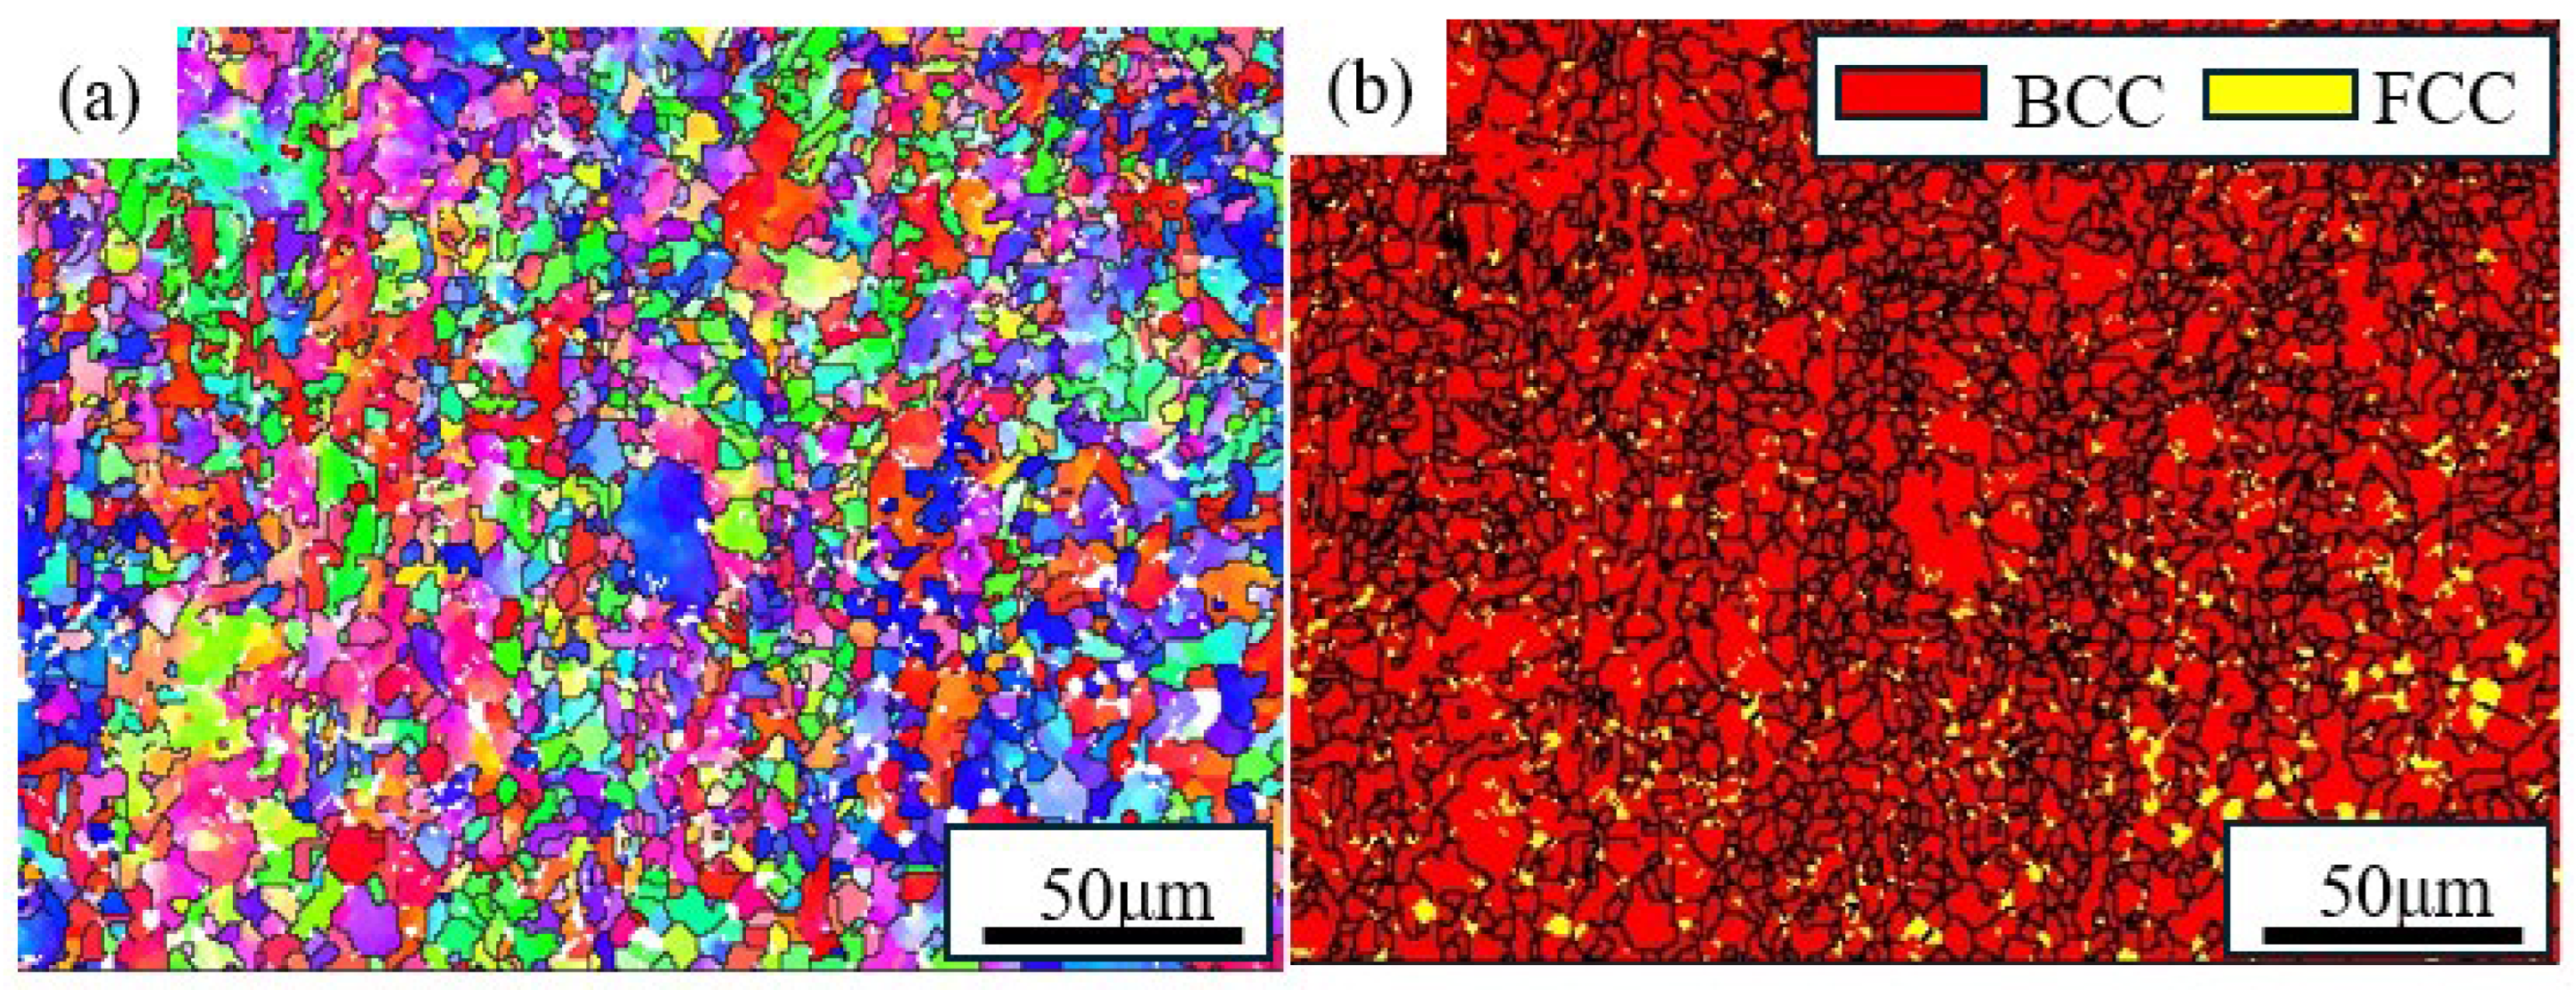
2.1. Materials and Samples Preparation

The material used in the experiment was commercial X80 steel plate, and its chemical composition is shown in Table 1. The dimensions and cutting method of the hydrogen permeation, hydrogen concentration surveying, and SSRT samples are illustrated in Figure 1. In this study, all the samples were cut along the rolling direction.

2.2. Hydrogen Permeation Experiments

To determine the electrochemical-charging time required to reach the maximum hydrogen concentration in X80 steel, a hydrogen permeation test was conducted on the samples. The samples were characterized by EBSD in order to obtain the X80 steel crystallographic types for the calculation of the hydrogen permeation kinetic parameters. The standard metallographic sample preparation methods were employed for polishing and grinding the samples. Subsequently, electrolytic polishing was carried out using a 15% perchloric acid solution for 30 s with a current of 0.2 A. The microstructures of the samples were observed using SEM, and the results were processed using Channel 5 (2019) software to identify the crystallographic types of the samples.
Using the Devanathan–Stachurski dual-cell setup, electrochemical hydrogen permeation tests were conducted on the samples [22]. Prior to the experiment, one side of the sample was nickel-plated to prevent surface oxidation of the sample in the hydrogen measurement chamber from affecting the accuracy of the hydrogen permeation kinetics calculations. The nickel plating time was 30 min, and the nickel plating current density was 20 mA/cm2.
After the nickel-plating process, the samples were placed in the middle position of the D-S dual-cell setup, with the nickel-plated side facing the hydrogen measurement chamber. Then, 0.2 mol/L NaOH was injected into the hydrogen measurement chamber. In order to obtain stable and reliable hydrogen permeation curves, cathodic polarization curve tests of X80 steel were produced, and the hydrogen oxidation potential was determined based on the inflection point of the cathodic polarization curve. The results are shown in Figure 2. The voltametric curve in the stable state ranged from 0 to 0.4 V. Combined with the actual situation, a voltage of 0.25 VHg/HgO was ultimately selected for the hydrogen permeation test.
Hydrogen permeation curve tests were conducted on the samples. In the initial stage of the test, the background current was reduced to less than 1 μA/cm2. Next, 0.5 mol/L H2SO4 solution (with a thiourea content of 4 g/L) was added to the hydrogen-charging chamber, and a constant current of 5 mA/cm2 was applied by the power supply to obtain the current density–time curve.

2.3. Quantitative Testing for Hydrogen Concentration

To obtain the hydrogen concentration in X80 steel under the corresponding hydrogen-charging times, electrochemical hydrogen concentration testing was conducted on the samples. Prior to the experiment, the samples were polished to ensure the accuracy of the test data. They were charged with hydrogen at a current density of 5 mA/cm2 (for 0, 3, 6, 9, 12 h), with the electrolyte being a mixture solution of 0.5 mol/L H2SO4 and 4 g/L thiourea. The samples were placed in a D-S dual-cell setup, and electrochemical hydrogen concentration measurements were conducted using a three-electrode system to obtain the current density–time curve.

2.4. SSRT Experiments

The SSRT is a commonly used method to assess HE. According to the SSRT standard, the strain rate of the samples should range from 10−4 to 10−7 s−1. In this study, considering practical considerations, a strain rate of 6.7 × 10⁻⁵ s−1 was selected [23,24,25]. The samples were polished to remove the surface oxidation layers and ensure there were no noticeable scratches on the surface. Before conducting the mechanical property tests, the samples were subjected to electrochemical hydrogen charging using the method described in Section 2.3. Subsequently, SSRTs were carried out at room temperature and in an air environment to obtain the stress–strain curve of the samples, and the fracture morphologies of the samples was observed using SEM.

3. Results and Discussion

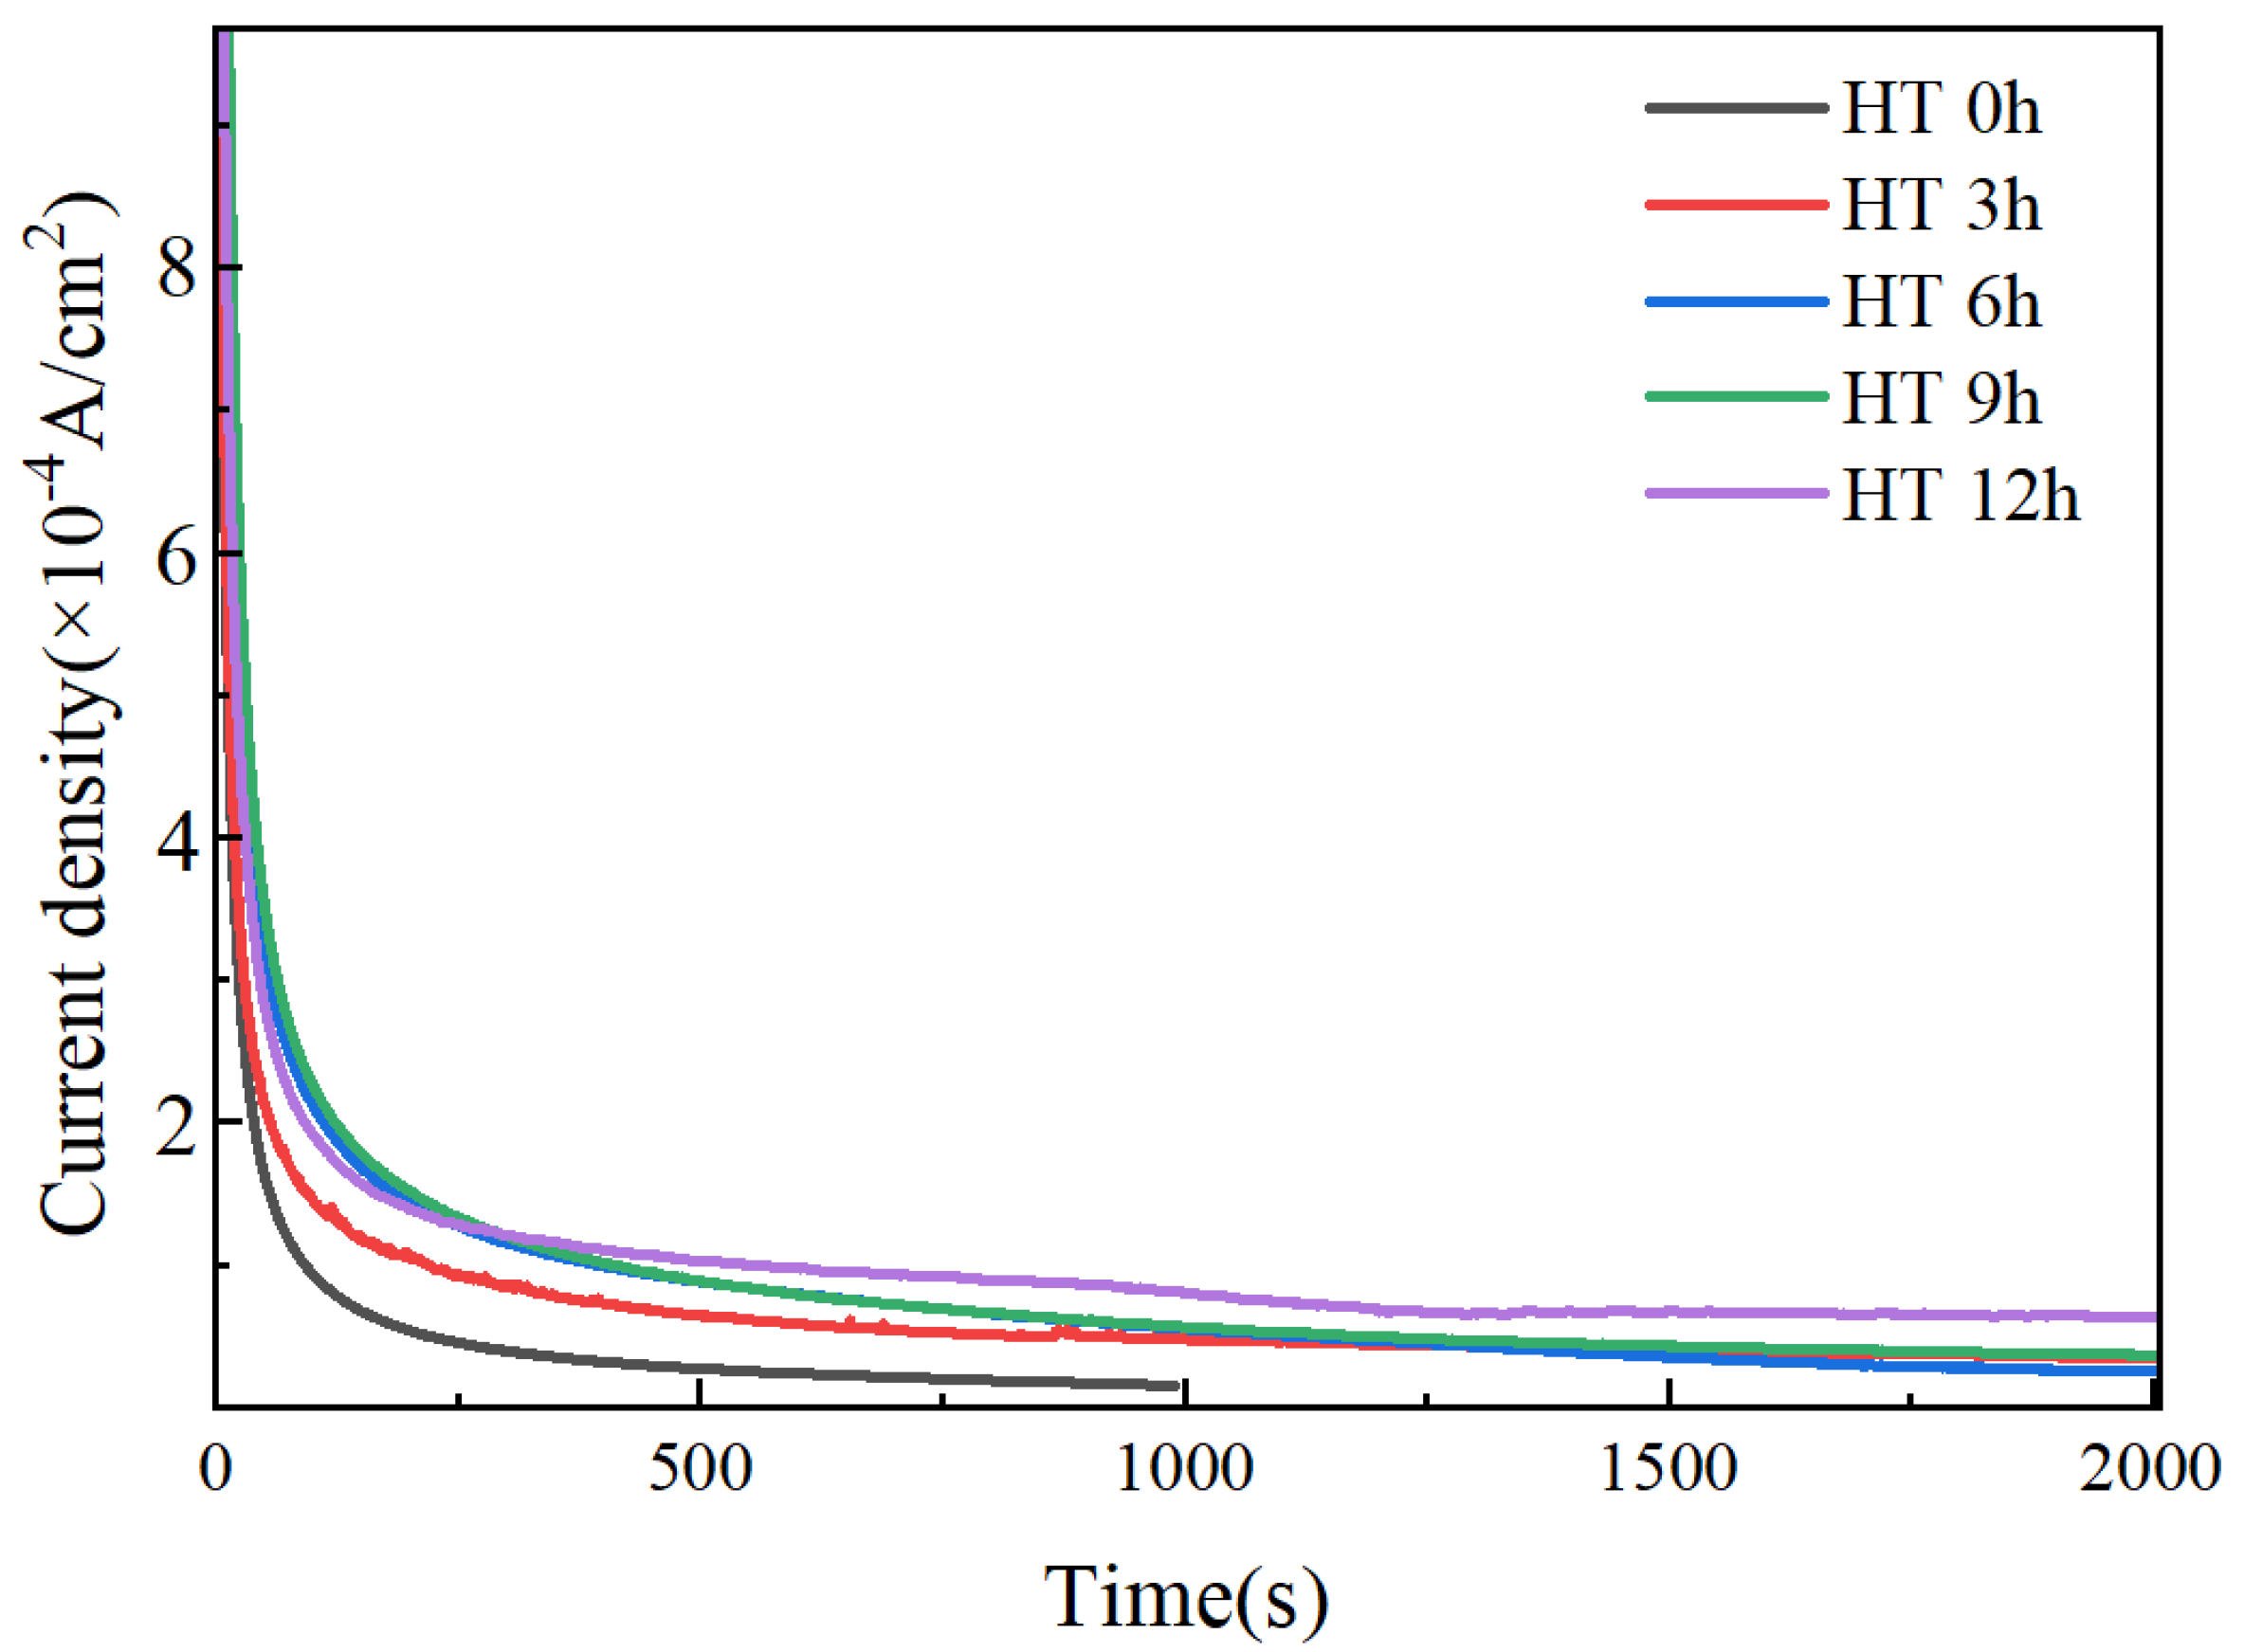
3.1. Hydrogen Permeation Kinetics of X80 Pipeline Steel

Figure 3 displays the hydrogen permeation curve of X80 steel after subtracting the corresponding background current density. Due to the consistent pattern observed in the hydrogen permeation curves, one set is illustrated here for explanation purposes. The hydrogen permeation process involves hydrogen dissociating and adsorbing onto the outer surface of the steel, adsorption of hydrogen atoms onto the subsurface of the steel, and diffusion of hydrogen atoms within the steel [26]. In the curve, t = 0 s represents the moment when hydrogen charging begins in the charging chamber. The hydrogen permeation current was detected on the hydrogen oxidation side with a permeation time of 168 s. When the hydrogen entering the steel reached dynamic equilibrium with the hydrogen escaping from the steel, the hydrogen permeation curve reached a stable state. The maximum steady-state current density was 1.52 × 10⁻⁴ cm2/s [27].
To provide a more intuitive representation of the hydrogen atom diffusion behavior within the steel, further processing of the hydrogen permeation curve data was conducted to obtain the hydrogen permeation kinetics parameters of X80 steel. Before performing the calculations, the crystal structure of the sample was determined through microstructural characterization to ascertain the lattice diffusion coefficient DL. Figure 4 shows the EBSD map of X80 pipeline steel, indicating that the sample consists of 93.3% BCC iron and 6.7% FCC iron. Therefore, DL was selected as D L = 1 . 28   ×   10 4   cm 2 / s [28].
Using the constant concentration model, the hydrogen diffusion kinetics parameters were calculated. The apparent hydrogen diffusion coefficient D(cm2/s) of the pipeline steel was determined using the time-lag method, with the formula as follows [28]:
D = d 2 6 t 0 . 63
where t 0 . 63 is the time when the instantaneous hydrogen permeation current reaches 0.63 times the value of the steady-state hydrogen permeation current, s; and d is the thickness of the specimen, cm.
The steady-state hydrogen diffusion flux J is calculated from the steady-state current density I , with the formula as follows:
J =   I FA
where A is the area of the sample, cm2; and F is the Faraday constant (96,487 C/mol).
The hydrogen concentration C0 (mol/cm3) in the surface lattice is calculated using the steady-state hydrogen diffusion flux and the apparent hydrogen diffusion coefficient, with the formula as follows:
C 0 = J d D
where J is the steady-state hydrogen diffusion flux, mol/(cm2·s).
The hydrogen trap density N T (cm−3) in the sample is calculated using the hydrogen concentration in the surface lattice and the apparent hydrogen diffusion coefficient, with the formula as follows:
N T = C 0 3 D L D     1
The calculated results of the hydrogen permeation kinetics parameters for three sets of replicate experiments are shown in Table 2. In existing studies, the range of apparent hydrogen diffusion coefficients for X80 steel was reported to be between 1.93 and 9.1 cm2/s [15,22,29,30,31]. In this study, the average hydrogen diffusion coefficient calculated was 5.75 × 10⁻⁶ cm2/s. Due to hydrogen trap density and maximum steady-state hydrogen diffusion flux in X80 steel being constant values, there exists a maximum hydrogen concentration within the material. The results indicate that the maximum hydrogen concentration in X80 steel ranges from 4.52 × 10⁻⁵ to 5.42 × 10⁻⁵ mol/cm3.
When the hydrogen permeation test reached the steady state, the hydrogen atoms reached the theoretical saturation state in the steel, and the hydrogen content per unit volume in the steel at the steady state could be obtained according to Equation (3). During the hydrogen permeation process, the hydrogen diffusion flux was increased to the maximum value in a very short period of time at the start of the electrochemical hydrogen-charging process, and therefore, we approximated the steady-state hydrogen diffusion flux as the hydrogen diffusion flux during the whole electrochemical hydrogen-charging process. The calculation is performed as:
t c h = C 0 × d J
where t c h represents the electrochemical hydrogen charging time, s.
After calculating each of the three sets of experiments separately, it was found that when the electrochemical hydrogen-charging time ranged from 8.7 to 12.24 h, the hydrogen content in the steel reached the saturation state. In view of the fact that it was difficult to saturate the steel with the maximum hydrogen concentration during only electrochemical hydrogen charging, the charging time should be less than or equal to the time required for the maximum hydrogen content obtained from the above calculations. Therefore, the hydrogen-charging time calculated from the hydrogen penetration test data could be used as a reference for the selection of the maximum electrochemical hydrogen-charging time.

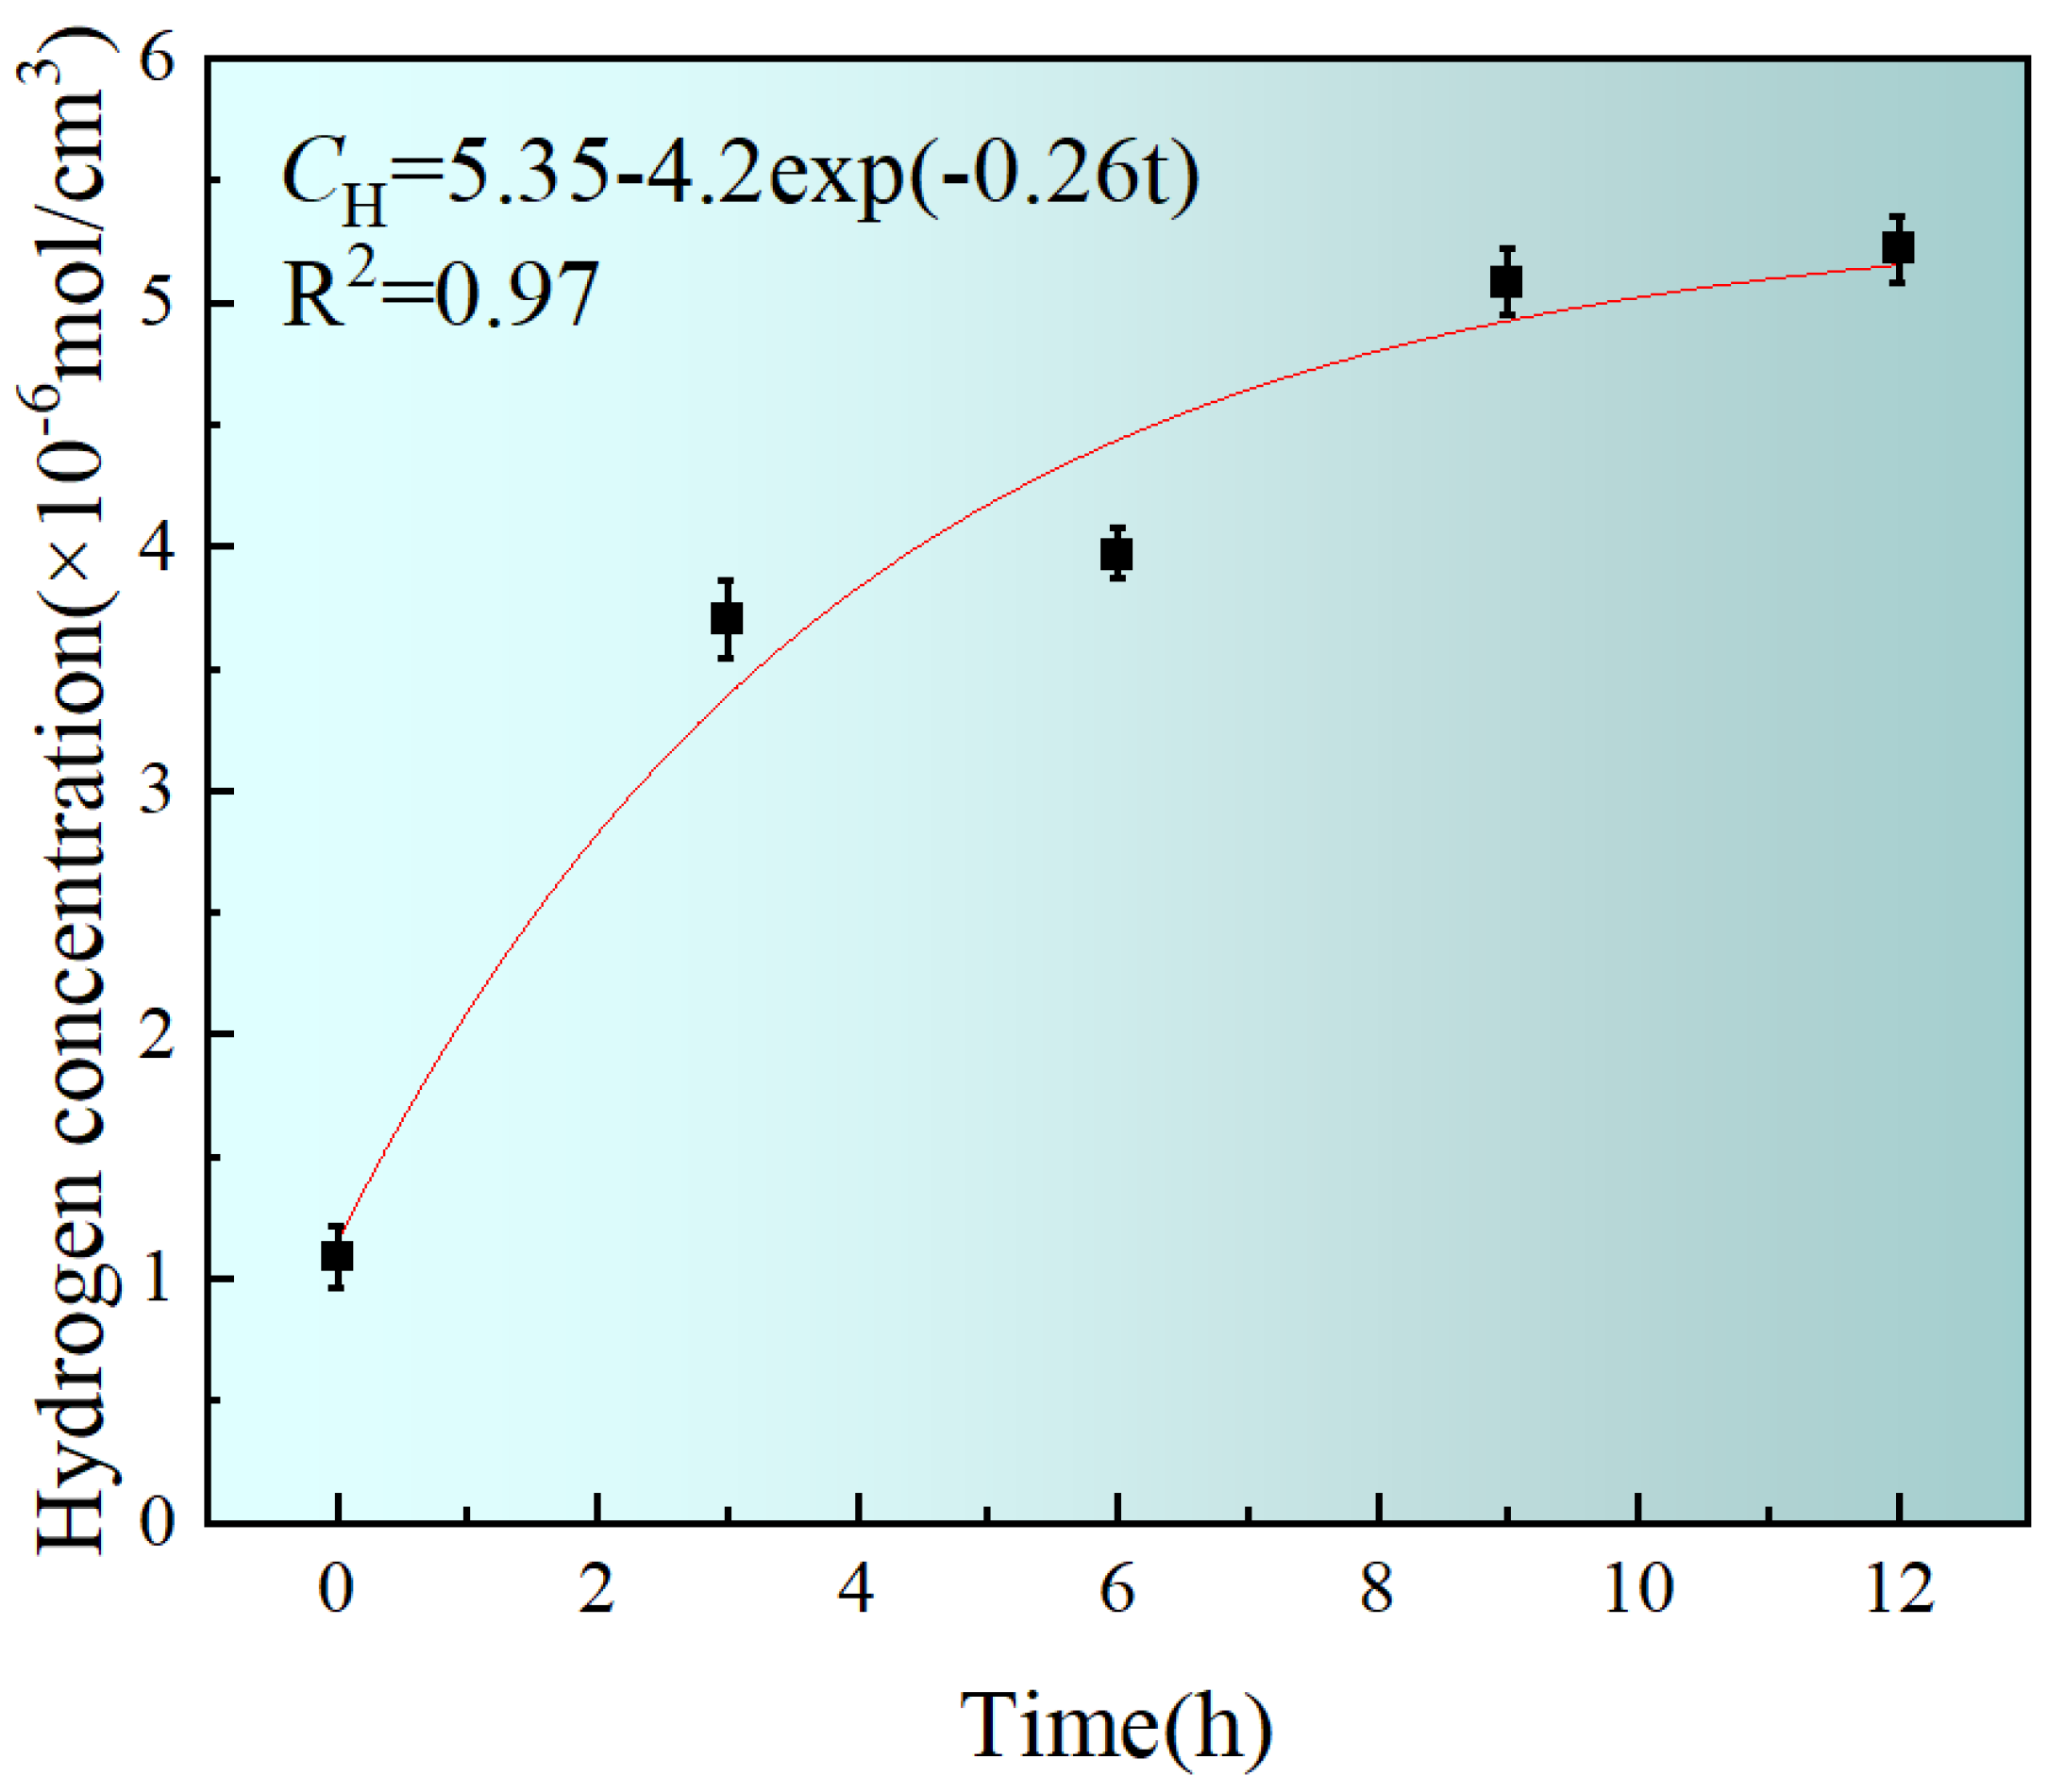
3.2. Calculation of Hydrogen Concentration in X80 Steel

Based on the calculated electrochemical hydrogen-charging time required for the steel to reach the saturation hydrogen concentration, as determined in Section 3.1, 12 h was selected as the maximum pre-charging time. Figure 5 shows the anode current density–time curves for X80 steel at different hydrogen-charging times.
The process of electrochemical hydrogen concentration testing can be divided into the electrochemical hydrogen-charging stage and the anode hydrogen precipitation stage. During the electrochemical hydrogen-charging process, the generation and diffusion behavior of hydrogen atoms were as follows [32].
Hydrogen atoms were generated on the steel surface through the electrochemical reduction of hydrogen ions:
H + + e H ads
Subsequently, some of the generated hydrogen atoms were absorbed by the steel:
H ads H abs
Other hydrogen atoms combined to form hydrogen molecules:
H ads H 2
H ads + H 2 O + e H 2 + OH
During chemical hydrogen charging, some hydrogen atoms will recombine into hydrogen molecules. As a result, hydrogen atoms cannot fully diffuse into the steel, and the hydrogen concentration in the steel cannot be determined solely based on the current density during the charging stage.
As shown in Figure 6, after hydrogen atoms diffused into the steel, they diffused and enriched at dislocations, grain boundaries, precipitation phases, and other hydrogen traps, and eventually, the hydrogen atoms that entered the irreversible hydrogen traps were fixed in the steel, while the hydrogen atoms in the reversible hydrogen traps escaped and diffused out of the steel [26].
During the anode hydrogen precipitation stage, the diffusion and oxidation behavior of hydrogen atoms were as follows [33]:
The hydrogen atoms entering the steel escaped under the influence of the NaOH solution and a positive electric field, oxidizing rapidly on the steel surface and generating corresponding oxidation currents. The reaction can be represented as:
H abs H + + e
The magnitude of the oxidation current is directly proportional to the density of the hydrogen atoms on the metal surface. The charge generated during the oxidation process of hydrogen atoms is equal to the number of hydrogen atoms diffusing out of the steel.
According to existing research and the derivation process described above, the total amount of hydrogen absorbed by the metal under anodic polarization conditions can be defined as follows [32]:
Q H = 0 t I d t
where Q H is the total charge, C; t is the test time, s; and I is the current, A.
According to the area enclosed by the curve in Figure 5, the hydrogen concentration of the material under the set parameters can be calculated using the following formula [26]:
C H = Q H z F v
where C H is the hydrogen concentration in the sample, mol/cm3, z is the number of electrodes (1), and v is the effective volume of the sample.
The hydrogen concentration measurement results of X80 pipeline steel under different hydrogen-charging times are shown in Figure 7. A small amount of hydrogen atoms is present in the sample without hydrogen charging, and the concentration of hydrogen atoms gradually increases with the duration of hydrogen charging. To establish the relationship between the hydrogen concentration in X80 steel and the hydrogen-charging time, existing data were subjected to fitting analysis.
In a logarithmic coordinate system, there exists a linear relationship between the hydrogen-charging time and the hydrogen atoms in the steel [34]. After fitting the hydrogen concentration with the charging time, it was found that under a constant hydrogen-charging current density, the diffusional hydrogen concentration in the sample satisfies the following ExpDec1 type exponential function relationship:
C H = a   ×   exp ( b t ) + c
After fitting, the parameters are approximately: a ≈ −4.2, b ≈ −0.26, c ≈ 5.35, where c represents the maximum hydrogen content in mol/cm3 that can be held in steel under electrochemical hydrogen-charging conditions. Both a and b are constants, and considering the actual physical model, a represents the sensitivity coefficient of the material to hydrogen and b represents the density of hydrogen traps in the material as well as the ability of hydrogen traps to capture hydrogen. When the hydrogen-charging time tended to infinity, the hydrogen concentration in the steel reached its maximum value of 5.35 × 10⁻⁶ mol/cm3. When the electrochemical hydrogen-charging current density was constant, due to the small diffusion coefficient of hydrogen in the steel, the hydrogen generated on the sample surface tended to saturate with an increasing charging time, leading to the generation of hydrogen molecules and reducing the number of hydrogen atoms entering the steel. In addition, the hydrogen concentration in the sample increased gradually with the charging time, thus reducing the hydrogen concentration gradient inside and outside the steel. This resulted in a decrease in the number of hydrogen atoms entering the steel per unit time. The combined effects ultimately led to a gradual decline in the growth rate of the hydrogen concentration in the sample over time [33].

3.3. Quantitative Relationship between Hydrogen Concentration and Mechanical Properties

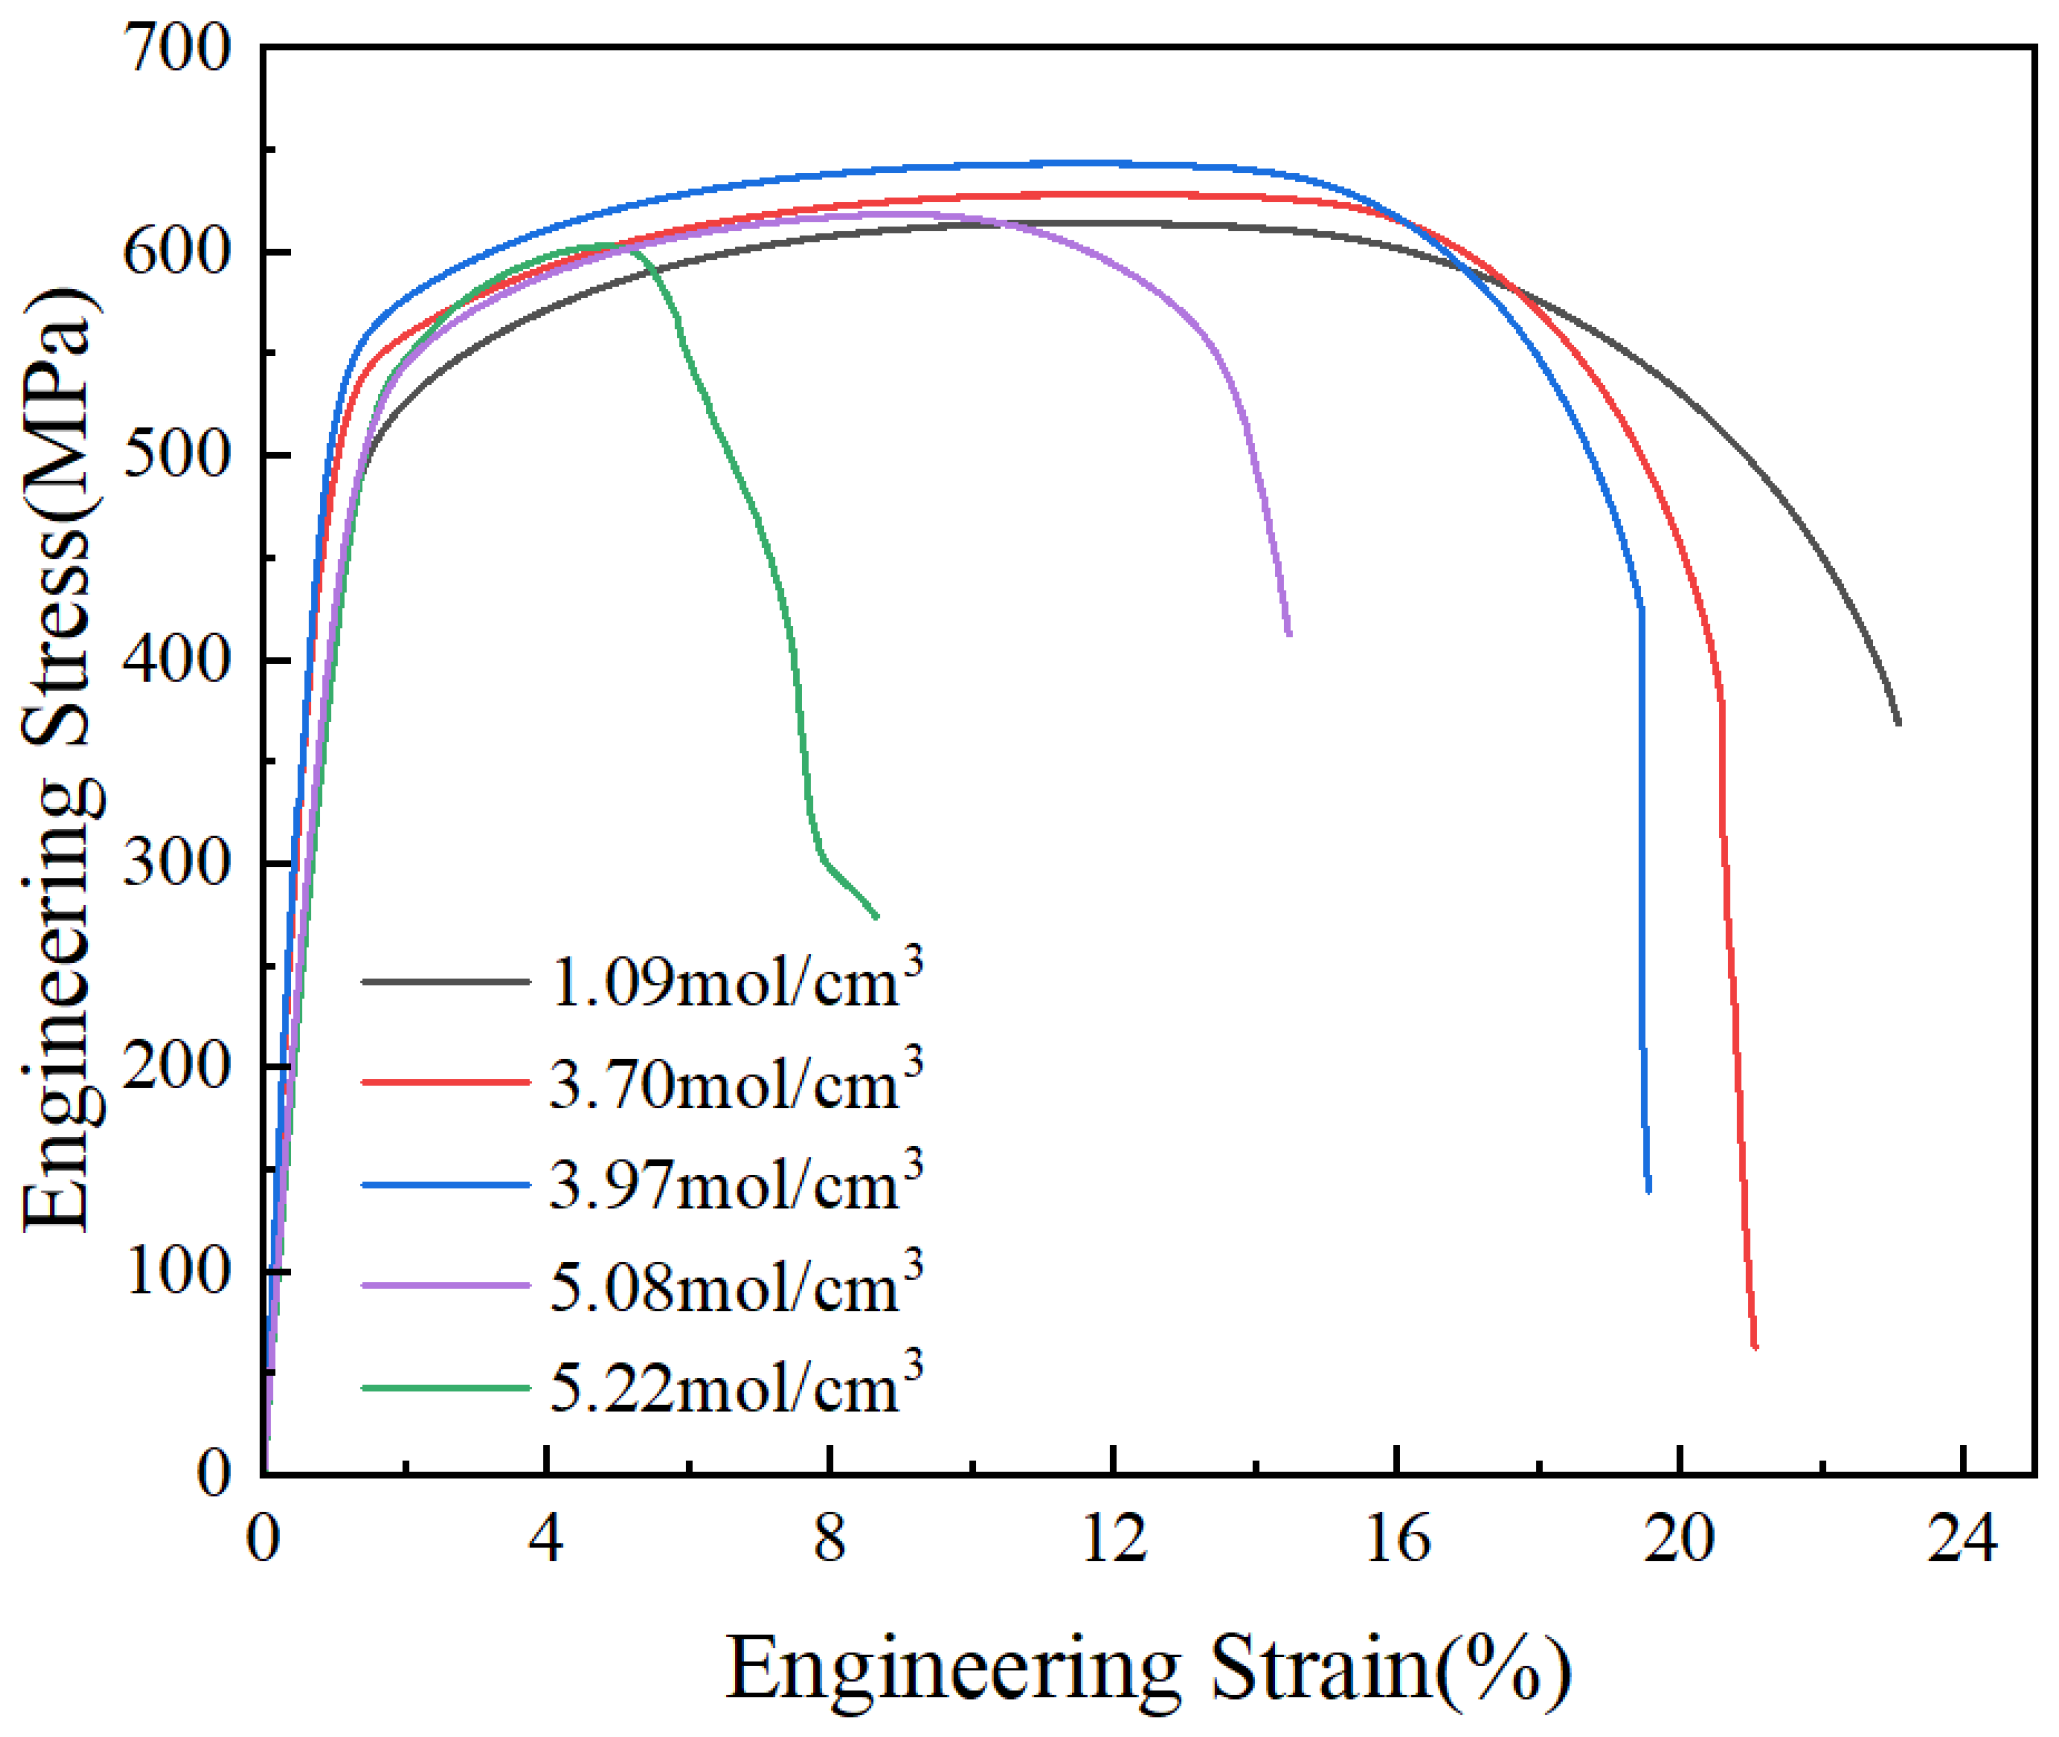
3.3.1. Stress–Strain Curve and Analysis of Mechanical Properties

Figure 8 illustrates the stress–strain curves of X80 pipeline steel under different hydrogen concentrations. The stress–strain curve can be divided into two stages: elastic deformation and plastic deformation. In the elastic deformation stage, the curves generally coincide. However, as the plastic deformation stage is reached, noticeable differences emerge in the curves, with the strain decreasing as the hydrogen concentration in the steel gradually increases. As the hydrogen concentration in the steel increases, the ductility of X80 steel gradually decreases.
At present, there are three methods to calculate the HE index [35,36,37]: based on the elongation at break, based on the shrinkage at break, and based on the size of hydrogen crack extension. In order to improve the efficiency of the test, we chose the plate-mounted tensile samples, which made it easy to cause the fracture shrinkage of the statistics that the error was large. Through the hydrogen crack extension test, it was difficult to study the effect of hydrogen atoms on the mechanical properties of steel. Therefore, in this study, we chose to calculate the hydrogen embrittlement index through the elongation at break. The formula is as follows [38]:
U E = 100 %   ×     L 0     L 1 L 0
F H = 100 %   ×   U E uncharged     U E charged U E uncharged
where U E uncharged represents the elongation after break of the uncharged samples, %; U E charged represents the elongation after break of the charged samples, %; and F H represents the HE index of the sample, %.
Figure 9 shows the tensile strength, yield strength, elongation after break, and HE index of samples under different hydrogen concentrations. With an increasing hydrogen concentration in the steel, the strength of X80 steel remains almost unchanged. At lower hydrogen concentrations (1.09–3.97 mol/cm3), the elongation after break of the samples decreases from 23.0% to 19.5%, while the HE index increases from 0% to 15.2%. At higher hydrogen concentrations (5.08–5.22 mol/cm3), the elongation after break of the samples decreases from 19.5% to 5.9%, while the HE index increases from 15.2% to 74.3%. The plastic degradation caused by hydrogen is more significant at higher hydrogen concentrations, indicating a higher risk of failure for the samples. The reason for this phenomenon is that once the concentration of hydrogen atoms in pipeline steel reaches a certain level, the plasticity decreases dramatically [39]. After fitting the relationship between the hydrogen concentration and the HE index, the relationship was found to be as shown in the following formula:
F H = 0 . 029   exp ( 1 . 5 C H )     0 . 029
According to the formula, when the hydrogen concentration in the sample reaches the saturation value of 5.35 mol/cm3, the steel’s HE index reaches its maximum value of 88.6%. The hydrogen embrittlement index of X80 steel increases gradually with the increase in the hydrogen concentration in the steel, which is the same as the results of existing studies on the hydrogen embrittlement index of pipeline steels [40,41].

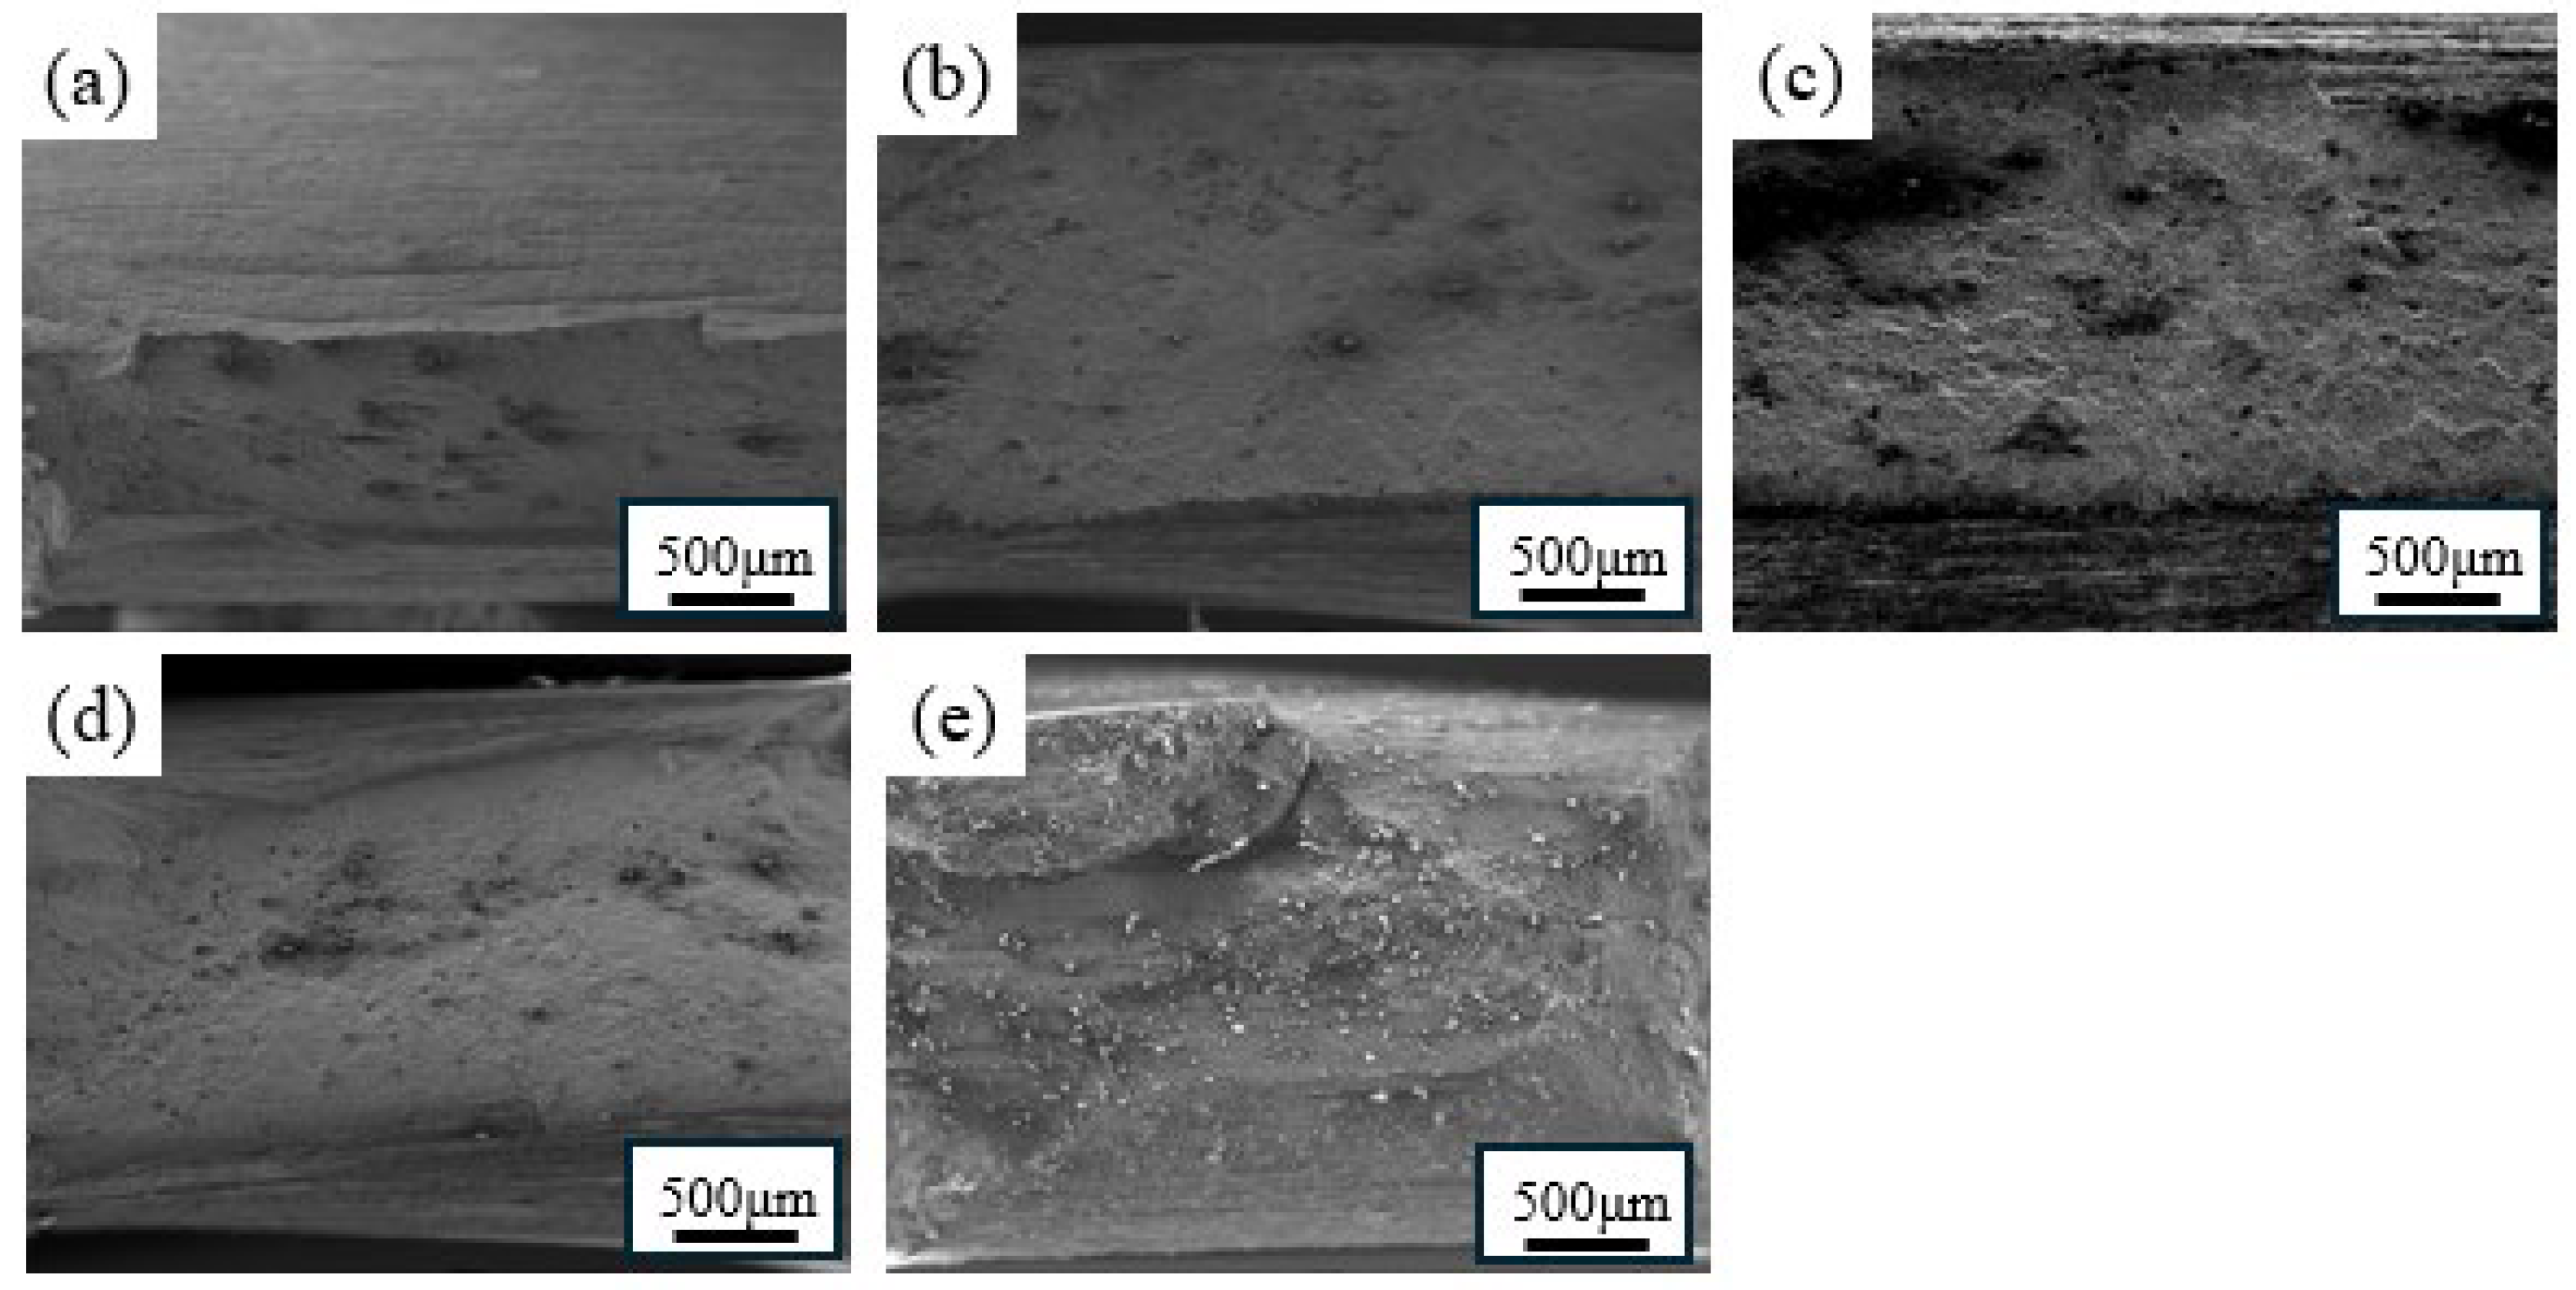
3.3.2. Fracture Morphologies

Figure 10 illustrates the fracture morphologies of X80 steel samples at different hydrogen concentrations. With the gradual increase in the hydrogen concentration in the steel, the proportion of shear lip decreases while the fracture area grows. This is due to the fact that the concentration at the inner surface of the steel is greater than the hydrogen concentration in the central part of the steel [15], indicating that the samples have clearly transitioned from ductile fracture to brittle fracture. When the hydrogen concentration in the steel is 1.09 mol/cm3, the sample exhibits noticeable dimples on the break surface, whereas when the hydrogen concentration is 5.22 mol/cm3, the sample displays typical brittle break characteristics. With the gradual increase in the hydrogen concentration in the steel, the break surface morphology of the samples undergoes a transition from ductile break to quasi-cleavage break to brittle break, indicating that the gradual enrichment of hydrogen atoms in the steel promotes a gradual decrease in ductility and an increase in brittleness.
Figure 11 showed the fracture morphology of X80 steel samples at different hydrogen concentrations. When the hydrogen concentration is low, a large number of microporous holes are formed inside the specimen during the stretching process, and with the extension of the stretching time, the microporous holes gather to form cracks and expand outward, which ultimately leads to the toughness fracture failure of the material. With the gradual increase in the hydrogen concentration in the specimen, the depth of the toughness nest in the fracture morphology of the specimen is significantly reduced and the average diameter decreases. When the hydrogen concentration in the specimen reaches a high level, the fracture morphology of the specimen is mainly manifested as a river-like quasi-dissolution pattern, and the longer hydrogen-charging time makes the hydrogen atoms enriched in the steel, which leads to the fracture mode by the aggregation of microporous toughness fracture to quasi-dissolution fracture mode, and ultimately, it is transformed into a dissolution fracture mode. The change in the break surface morphology characteristics corroborates the phenomenon of the increased HE sensitivity of the steel with the gradual increased in the hydrogen concentration, as observed in this study.

4. Conclusions

During actual hydrogen pipeline transport, pipeline steels are susceptible to hydrogen embrittlement failure, which seriously reduces the safety of the transport process. In order to quantitatively assess the effect of hydrogen on X80 pipeline steel, this study used an electrochemical approach to obtain a quantitative relationship between the hydrogen embrittlement susceptibility of X80 steel and the hydrogen concentration in the steel. The results of the study provided a reference for the selection of materials and the modulation of hydrogen embrittlement susceptibility for subsequent hydrogen transmission pipelines.
(1)
The saturation hydrogen concentration of X80 steel is 5.42 × 10⁻⁵ mol/cm3. Assuming that the steady-state maximum hydrogen diffusion flux approximates the hydrogen diffusion flux during electrochemical hydrogen charging, the hydrogen concentration in the steel reaches saturation after 12.24 h of electrochemical hydrogen charging.
(2)
By conducting electrochemical hydrogen concentration tests, the variation in the hydrogen concentration in X80 pipeline steel with the charging time is obtained. The variation follows the equation: CH = 5.35 − 4.2 exp (−0.26t). When the charging time approaches infinity, the maximum hydrogen concentration in X80 steel is 5.35 mol/cm3.
(3)
The influence of the hydrogen concentration on the strength of X80 steel is minimal, but the plasticity decreases sharply with an increasing hydrogen concentration. The relationship between the hydrogen concentration and the HE index in X80 pipeline steel follows the formula F H = 0 . 029   exp   ( 1 . 5 C H )     0 . 029 . According to the formula, when the hydrogen concentration in the steel reaches saturation, the hydrogen embrittlement index of the sample is 88.6%.
(4)
The concentration of hydrogen atoms has little effect on the strength of steel, but it has a significant effect on the plasticity of steel. The elongation at break of steel decreases sharply with a gradual increase in the hydrogen concentration in the steel.

Author Contributions

R.Z.: Writing—original draft, investigation, methodology. M.L.: Resources, supervision, writing − review and editing. S.A.: Writing—original draft, formal analysis. L.W.: Writing—original draft, investigation. Y.L.: Writing—original draft, investigation. D.J.: Writing—review and editing, validation, conceptualization. H.D.: Writing—review and editing, validation, conceptualization. D.C.: Writing—review and editing, validation, conceptualization. All authors have read and agreed to the published version of the manuscript.

Funding

The present work was funded by the Natural Science Foundation of Chongqing Municipality (CSTB2024NS CQ-LZX0035).

Data Availability Statement

The raw data supporting the conclusions of this article will be made available by the authors on request.

Conflicts of Interest

The authors declare no conflicts of interest.

References

  1. Veziroglu, T.N.; Sahin, S. 21st Century’s energy: Hydrogen energy system. Energy Convers. Manag. 2008, 49, 1820–1831. [Google Scholar] [CrossRef]
  2. Witkowski, A.; Rusin, A.; Majkut, M.; Stolecka, K. Analysis of compression and transport of the methane/hydrogen mixture in existing natural gas pipelines. Int. J. Press. Vessel. Pip. 2018, 166, 24–34. [Google Scholar]
  3. Edwards, R.L.; Font-Palma, C.; Howe, J. The status of hydrogen technologies in the UK: A multi-disciplinary review. Sustain. Energy Technol. 2021, 43, 100901. [Google Scholar] [CrossRef]
  4. Isaac, T. HyDeploy: The UK’s First Hydrogen Blending Deployment Project. Clean Energy 2019, 3, 114–125. [Google Scholar] [CrossRef]
  5. Cristello, J.B.; Yang, J.M.; Hugo, R.; Lee, Y.S.; Park, S.S. Feasibility analysis of blending hydrogen into natural gas networks. Int. J. Hydrogen Energy 2023, 48, 17605–17629. [Google Scholar] [CrossRef]
  6. Zapffe, C.A.; Sims, C.E. Hydrogen embrittlement, internal stress and defects in steel. Trans. Metall. Soc. AIME 1941, 145, 225–261. [Google Scholar]
  7. Dwivedi, S.K.; Vishwakarma, M. Effect of hydrogen in advanced high strength steel materials. Int. J. Hydrogen Energy 2019, 44, 28007–28030. [Google Scholar] [CrossRef]
  8. Oriani, R. Mechanistic Theory of Hydrogen Embrittlement of Steels. Berichte Bunsen-Gesellscjaft Phys. Chenue 1972, 76, 848. [Google Scholar] [CrossRef]
  9. Wan, L.; Geng, W.T.; Ishii, A.; Du, J.P.; Mei, Q.S.; Ishikawa, N.; Kimizuka, H.; Qgata, S. Hydrogen embrittlement controlled by reaction of dislocation with grain boundary in alpha-iron. Int. J. Plast. 2019, 112, 206–219. [Google Scholar] [CrossRef]
  10. He, J.; Chen, L.; Tao, X.; Antonov, S.; Zhong, Y.; Su, Y.J. Hydrogen embrittlement behavior of 13Cr-5Ni-2Mo supermartensitic stainless steel. Corrosion. Sci. 2020, 176, 109046. [Google Scholar] [CrossRef]
  11. Wang, C.; Zhang, J.; Liu, C.; Hu, Q.; Zhang, R.; Xu, X.; Yang, H.; Ning, Y.; Li, Y. Study on hydrogen embrittlement susceptibility of X80 steel through in-situ gaseous hydrogen permeation and slow strain rate tensile tests. Int. J. Hydrogen Energy 2023, 48, 243–256. [Google Scholar] [CrossRef]
  12. Bae, D.-S.; Baek, U.-B.; Nahm, S.-H.; Jo, I. Effect of Electrochemical Hydrogen Charging Time on Hydrogen Embrittlement of the Hot-Rolled and Accelerated Cooling Treated API X70 Steel. Met. Mater. Int. 2022, 28, 466–474. [Google Scholar] [CrossRef]
  13. Chen, Y.; Xu, Z.; Zhang, X.; Zhang, T.; Tang, J.; Sun, Z.; Sui, Y.; Han, X. Irreversible hydrogen embrittlement study of B1500HS high strength boron steel. Mater. Design 2021, 199, 109404. [Google Scholar] [CrossRef]
  14. Hu, S.; Tian, Z.; Wang, Y.; Hu, H.; Li, X.; Liu, Q.; Liu, D.; Li, Y.; Cheng, G. Combined impact of elastic stress, prestrain and electrochemical charging on the hydrogen-induced cracking of high-strength steel. Int. J. Hydrogen Energy 2023, 48, 14923–14929. [Google Scholar] [CrossRef]
  15. Zhou, C.; Ye, B.; Song, Y.; Cui, T.; Xu, P.; Zhang, L. Effects of internal hydrogen and surface-absorbed hydrogen on the hydrogen embrittlement of X80 pipeline steel. Int. J. Hydrogen Energy 2019, 44, 22547–22558. [Google Scholar] [CrossRef]
  16. Cheng, W.; Song, B.; Mao, J. Effect of Ce content on the hydrogen induced cracking of X80 pipeline steel. Int. J. Hydrogen Energy 2023, 48, 15303–15316. [Google Scholar] [CrossRef]
  17. Wu, C.; Yan, C.; Zhang, S.; Zhou, L.; Shen, M.; Tian, Z. Research on Hydrogen-Induced Induced Cracking Sensitivity of X80 Pipeline Steel under Different Heat Treatments. Materials 2024, 17, 1953. [Google Scholar] [CrossRef] [PubMed]
  18. Jiang, Y.; Li, C.; Wang, D.; Di, X. Effect of cyclic plastic deformation on hydrogen diffusion behavior and embrittlement susceptibility of reeling-pipeline steel weldments. Int. J. Hydrogen Energy 2021, 46, 30158–30172. [Google Scholar] [CrossRef]
  19. Yin, C.; Chen, J.; Ye, D.; Xu, Z.; Zhou, H. Hydrogen Concentration Distribution in 2.25Cr-1Mo-0.25V Steel under the Electrochemical Hydrogen Charging and Its Influence on the Mechanical Properties. Materials 2020, 13, 2263. [Google Scholar] [CrossRef]
  20. Bellemare, J.; Laliberte-Riverin, S.; Menard, D.; Brochu, M.; Sirois, F. Subtleties Behind Hydrogen Embrittlement of Cadmium-Plated 4340 Steel Revealed by Thermal Desorption Spectroscopy and Sustained-Load Tests. Metall. Mater Trans. A 2020, 51, 3054–3065. [Google Scholar] [CrossRef]
  21. Chen, Y.S.; Lu, H.; Liang, J.; Rosenthal, A.; Liu, H.; Sneddon, G.; McCarroll, I.; Zhao, Z.; Li, W.; Guo, A.M.; et al. Observation of hydrogen trapping at dislocations, grain boundaries, and precipitates. Science 2020, 367, 171–175. [Google Scholar] [CrossRef] [PubMed]
  22. Zhao, W.; Zhang, T.; Zhao, Y.; Sun, J.; Wang, Y. Hydrogen permeation and embrittlement susceptibility of X80 welded joint under high-pressure coal gas environment. Corrosion. Sci. 2016, 111, 84–97. [Google Scholar] [CrossRef]
  23. Konert, F.; Wieder, F.; Nietzke, J.; Meinel, D.; Bollinghaus, T.; Sobol, O. Evaluation of the impact of gaseous hydrogen on pipeline steels utilizing hollow sample technique and μCT. Int. J. Hydrogen Energy 2024, 59, 874–879. [Google Scholar] [CrossRef]
  24. Yadav, S.; Cabezas, J.F.A.; Davani, R.K.Z.; Szpunar, J.; Zhang, J.M. Synergistic effect of different testing environments on the hydrogen-induced mechanical degradation to establish the role of microstructural features on the failure of X70 pipeline steel. Int. J. Hydrogen Energy 2023, 48, 36866–36882. [Google Scholar] [CrossRef]
  25. Aiello, F.; Beghini, M.; Belardini, C.M.; Bertini, L.; Macoretta, G.; Monelli, B.D.; Valentini, R. Proposal of a hydrogen embrittlement index for a martensitic advanced high-strength steel. Corrosion. Sci. 2023, 222, 111357. [Google Scholar] [CrossRef]
  26. Zheng, S.; Qin, Y.; Li, W.; Huang, F.; Qiang, Y.; Yang, S.; Wen, L.; Jin, Y. Effect of hydrogen traps on hydrogen permeation in X80 pipeline steel—A joint experimental and modelling study. Int. J. Hydrogen Energy 2023, 48, 4773–4788. [Google Scholar] [CrossRef]
  27. Wang, A.; Deng, Y.; Li, K.; Li, W.; Yu, D.; Cui, G.; Liu, J.; Li, Z. Study on hydrogen permeation behavior of X80 steel under AC stray current interference. Anti-Corros. Method Mater. 2021, 68, 64–76. [Google Scholar] [CrossRef]
  28. Thomas, A.; Szpunar, J.A. Hydrogen diffusion and trapping in X70 pipeline steel. Int. J. Hydrogen Energy 2020, 45, 2390–2404. [Google Scholar] [CrossRef]
  29. Zhang, T.; Zhao, W.; Li, T.; Zhao, Y.; Deng, Q.; Wang, Y.; Jiang, W. Comparison of hydrogen embrittlement susceptibility of three cathodic protected subsea pipeline steels from a point of view of hydrogen permeation. Corrosion. Sci. 2018, 131, 104–115. [Google Scholar] [CrossRef]
  30. Li, L.; Song, B.; Cheng, J.; Yang, Z.; Cai, Z. Effects of vanadium precipitates on hydrogen trapping efficiency and hydrogen induced cracking resistance in X80 pipeline steel. Int. J. Hydrogen Energy 2018, 43, 17353–17363. [Google Scholar] [CrossRef]
  31. Zhao, W.; Du, T.; Li, X.; Sun, H.; Li, B.; Yuan, S. Effects of multiple welding thermal cycles on hydrogen permeation parameters of X80 steel. Corrosion Sci. 2021, 192, 109797. [Google Scholar] [CrossRef]
  32. Capelle, J.; Dmytrakh, I.; Pluvinage, G. Comparative assessment of electrochemical hydrogen absorption by pipeline steels with different strength. Corrosion Sci. 2010, 52, 1554–1559. [Google Scholar] [CrossRef]
  33. Yan, M.; Weng, Y. Study on hydrogen absorption of pipeline steel under cathodic charging. Corrosion Sci. 2006, 48, 432–444. [Google Scholar] [CrossRef]
  34. Momotani, Y.; Shibata, A.; Tsuji, N. Hydrogen embrittlement behaviors at different deformation temperatures in as-quenched low-carbon martensitic steel. Int. J. Hydrogen Energy 2022, 47, 3131–3140. [Google Scholar] [CrossRef]
  35. Shen, L.; Su, Y.; He, J.; Chu, W.; Qiao, L. Hydrogen-induced cracking and hydrogen embrittlement of Ni2MnGa FSMAs. J. Phys. D Appl. Phys. 2010, 43, 055001. [Google Scholar] [CrossRef]
  36. Yang, H.; Zhang, H.; Liu, C.; Wang, C.; Fan, X.; Cheng, F.; Li, Y. Effects of defect on the hydrogen embrittlement behavior of X80 pipeline steel in hydrogen-blended natural gas environments. Int. J. Hydrogen Energy 2024, 58, 158–173. [Google Scholar] [CrossRef]
  37. Zhao, X.; Wang, H.; Liu, G.; Liu, Y.; Xu, D. Research on the hydrogen assisted fatigue damage in X80 pipeline steel welded joint. Mater. Today Commun. 2022, 31, 103524. [Google Scholar] [CrossRef]
  38. Park, C.; Kang, N.; Liu, S.; Lee, J.; Chun, E.; Yoo, S.J. Effect of Prestrain on Hydrogen Embrittlement Susceptibility of EH 36 Steels Using In Situ Slow-Strain-Rate Testing. Met. Mater. Int. 2019, 25, 584–593. [Google Scholar] [CrossRef]
  39. Fangnon, E.; Yagodzinskyy, Y.; Malictki, E.; Mehtonen, S.; Virolainen, E.; Vilacam, P. Determination of Critical Hydrogen Concentration and Its Effect on Mechanical Performance of 2200 MPa and 600 HBW Martensitic Ultra-High-Strength Steel. Metals 2021, 11, 984. [Google Scholar] [CrossRef]
  40. Bai, P.; Zhou, J.; Luo, B.; Zheng, S.; Wang, P.; Tian, Y. Hydrogen embrittlement of X80 pipeline steel in H2S environment: Effect of hydrogen charging time, hydrogen-trapped state and hydrogen charging-releasing-recharging cycles. Int. J. Min. Met. Mater. 2020, 27, 63–73. [Google Scholar] [CrossRef]
  41. Zhao, L.; Chen, H.; Zhang, C.; Wang, G.; Lu, S.; Chen, Z.; Zhao, A. Effect of hydrogen charging intensities and times on hydrogen embrittlement of Q&P980 steel. Mater. Res. Express 2024, 11, 016504. [Google Scholar]
Figure 1. Schematic diagram of sample cutting.
Metals 14 00763 g001
Figure 2. The voltametric curve of X80 steel.
Metals 14 00763 g002
Figure 3. Hydrogen permeation curve of X80 steel.
Metals 14 00763 g003
Figure 4. The EBSD microstructure of X80 steel: (a) IPF; and (b) phase distribution.
Metals 14 00763 g004
Figure 5. Current density–time test curve.
Metals 14 00763 g005
Figure 6. Schematic diagram of an electrochemical reaction, including the process of hydrogen sourcing, diffusion and capture.
Metals 14 00763 g006
Figure 7. Relationship between hydrogen-charging time and hydrogen concentration in steel.
Metals 14 00763 g007
Figure 8. Stress–strain curve of X80 steel.
Metals 14 00763 g008
Figure 9. Evolution of mechanical properties of X80 steel with hydrogen concentration in steel: (a) mechanical properties; (b) HE index.
Metals 14 00763 g009
Figure 10. Fracture morphologies of X80 steel with hydrogen concentration in steel 50X: (a) 1.09 mol/cm3; (b) 3.7 mol/cm3; (c) 3.97 mol/cm3; (d) 5.08 mol/cm3; and (e) 5.22 mol/cm3.
Metals 14 00763 g010
Figure 11. Fracture morphologies of X80 steel with hydrogen concentration in steel 1000X: (a) 1.09 mol/cm3; (b) 3.7 mol/cm3; (c) 3.97 mol/cm3; (d) 5.08 mol/cm3; and (e) 5.22 mol/cm3.
Metals 14 00763 g011
Table 1. Chemical composition of X80 pipeline steel (wt.%).
ElementCSiMnPSNiCrTiFe
Content0.050.251.680.010.0010.110.170.013Balance
Table 2. Hydrogen permeation kinetics parameters of X80 steel.
Group J   (mol/(cm2·s))D (cm2/s)C0 (mol/cm3)NT (cm−3)
Exp 12.88 × 10−96.61 × 10−64.52 × 10−51.66 × 1020
Exp 22.65 × 10−95.29 × 10−65.30 × 10−52.47 × 1020
Exp 32.46 × 10−95.35 × 10−65.42 × 10−52.49 × 1020
Average2.66 × 10−95.75 × 10−65.08 × 10−52.66 × 10²⁰
Disclaimer/Publisher’s Note: The statements, opinions and data contained in all publications are solely those of the individual author(s) and contributor(s) and not of MDPI and/or the editor(s). MDPI and/or the editor(s) disclaim responsibility for any injury to people or property resulting from any ideas, methods, instructions or products referred to in the content.

