Article

Effect of Intermediate Annealing on Microstructure and Cold Rolling Hardness of AlFeMn Alloy

1
College of Materials Science and Technology, Nanjing University of Aeronautics and Astronautics, Nanjing 211106, China
2
Research Institute, Baoshan Iron & Steel Co., LTD., Shanghai 201999, China
*
Author to whom correspondence should be addressed.
Metals 2024, 14(7), 785; https://doi.org/10.3390/met14070785
Submission received: 28 May 2024 / Revised: 22 June 2024 / Accepted: 4 July 2024 / Published: 4 July 2024

Abstract

:
The microstructure and texture of an AlFeMn alloy were studied under different intermediate annealing processes, and the changes in microhardness during cold rolling were analyzed. After annealing at 420 °C with a slow heating rate, the alloy showed a high number of small dispersed particles and recrystallization textures dominated by R texture, with deformation textures of 23.5%. Annealing at 610 °C with a rapid heating rate resulted in a significant decrease in the number of small-sized particles and an increase in recrystallization texture contents, with CubeND being the majority. The deformation texture contents decreased to 14.9%. The electrical conductivity of the 420 °C annealed sheet was higher than before annealing, whereas the sheet annealed at 610 °C showed a decrease in electrical conductivity after annealing. This indicated that annealing at 610 °C led to a higher degree of recrystallization and the development of Cube/CubeND due to the dissolution of dispersed particles. During the subsequent cold rolling process, the microhardness of both annealed sheets initially increased and then decreased. However, the microhardness of the 420 °C annealed sheet with varying cold rolling reductions consistently remained lower than that of the 610 °C annealed sheet, as was the cold rolling reduction corresponding to the peak microhardness. The results showed that the precipitation at 420 °C facilitated work softening, while the dissolution at 610 °C promoted work hardening.

1. Introduction

Due to their excellent tensile properties, formability, and corrosion resistance, AlFe(Mn) aluminum alloys have been widely used in food packaging and heat exchanger fins [1,2,3]. In recent years, AlFe(Mn) alloys have also been applied as explosion-proof plates for lithium-ion prismatic cells and aluminum–plastic films for lithium-ion pouch cells [4,5,6,7].
Tohma’s research [8] found that the cold rolling hardness of Al-1wt%Fe alloy sheets increased with the increase in cold rolling reduction after being subjected to a 600 °C solid solution for 2 h, followed by cold rolling. However, without the heat treatment, the hardness initially increased and then decreased during cold rolling. This was due to the recovery process during or immediately after cold rolling, while the solid solution of impurity atoms in the matrix hindered the work softening.
Tsumuraya [9] studied the effect of the heat treatment of ingot on the cold rolling of Al-1.9wt%Fe alloy. When the ingot was directly cold rolled without any prior heat treatment, the microhardness of the cold-rolled sheet increased with the increase in cold rolling reduction. However, when the ingot was heated at 540 °C before cold rolling, the microhardness first increased and then decreased. This was attributed to the precipitation during the heating process.
Jin [10] proved the work softening of Al-2wt%Fe alloy which had undergone uniformization at 573~873 K, followed by hot rolling, intermediate annealing, and cold rolling. The work softening was further improved by uniformization at 673 K and 773 K, while no softening occurred without uniformization. This was due to the precipitation process during uniformization of the ingot.
Roy [11] studied the evolution of the annealed microstructure and tensile properties of a cold-rolled 8011 (AlFe) alloy. After complete recrystallization, due to the presence of a large amount of rolling and random textures, the strength of the alloy with varying annealing temperatures remained almost unchanged.
Chen [2] investigated the effect of homogenization on the microstructure and texture of the twin-roll cast (TRC) 8006 (AlFeMn) alloy. Slamova [12] investigated the effects of cold rolling reduction and heating rate on the kinetics and temperature of structural transformation during annealing of the TRC 8006 (AlFeMn) alloy. And the redistribution of solute elements was analyzed in combination with the resistivity. Katsas [13] studied the effect of recrystallization during annealing on the formability of the TRC 8006 (AlFeMn) alloy. Engler [14] investigated the effects of homogenization on the microstructure and annealing temperature on the tensile properties of an AlFeMn alloy.
Birol [15,16] analyzed the change in electrical conductivity with final annealing temperature of AlFeSi sheets processed with and without interannealing, and the change in electrical conductivity with annealing temperature of AlFeSi sheet samples deformed by cold rolling to the indicated strain levels. The change in electrical conductivity with annealing temperature of the AlFeMnSi sheets annealed in the as-cast state and after a cold rolling pass was also studied [17].
The AlFeMn alloy is currently the primary material used for explosion-proof plates in lithium-ion prismatic cells. After being processed into explosion-proof plates, the microhardness of the AlFeMn alloy increases. In order to maintain the desired explosion pressure of the explosion-proof valve, annealing is necessary for the explosion-proof plates. The size of the explosion-proof plate varies, and the pre-annealing hardness differs at different processing rates, thereby impacting the determination of annealing parameters.
However, there is a lack of research on the changes in microhardness of AlFeMn alloys during cold rolling. The microstructure and cold rolling behavior of AlFeMn alloys with different alloying element contents have been studied [7,18]. In this present study, the effect of intermediate annealing on the microstructure of the AlFeMn alloy is investigated, and the change in microhardness of cold-rolled AlFeMn alloy sheets with cold rolling reduction is analyzed, so as to provide valuable guidance for the process design of AlFeMn alloy and its application in explosion-proof plates.

2. Materials and Methods

A certain proportion of 99.7% pure electrolytic aluminum ingots, Al-20Fe, Al-10Mn, and Al-20Si master alloys, were melted and cast through direct chill casting. The ingots were homogenized, hot rolled, and cold rolled to a thickness of 2 mm. After intermediate annealing at 420 °C for 4 h and 610 °C for 1.5 h, respectively, the annealed sheets were subjected to secondary cold rolling in multiple passes to obtain samples with varying cold rolling reductions (0~96%). When annealing at 420 °C, the sheets were heated from room temperature to 420 °C at a heating rate of 30 °C/h. When annealing at 610 °C, the heat treatment furnace was preheated to 610 °C and held for 1 h, and then the sheets were put into the furnace to wait for the furnace temperature to return to 610 °C to start holding.
The chemical composition of the alloy is listed in Table 1.
The microstructures of sheets before and after annealing were observed on longitudinal sections using an Apreo C Hivac scanning electron microscope (SEM) (Thermo Fisher Scientific Inc., Brno, Czech Republic), and the microstructures of the cold-rolled sheets were observed on the rolled plane by a Tecnai G2 20 transmission electron microscopy (TEM) (FEI Inc., Hillsboro, NH, USA). The grain and texture were analyzed on longitudinal sections using an electron backscattered diffraction (EBSD) device (EDAX Inc., Pleasanton, CA, USA).
The equilibrium phase diagram of the AlFeMn alloy as a function of temperature was calculated by the JMatPro 7.0 software.
After grinding, the electrical conductivity of the sheet before and after annealing was examined at 25 °C by a SIGMATEST 2.069 eddy current conductivity meter (Foerster Instruments Incorporated, Pittsburgh, PA, USA).
The microhardness was measured on longitudinal sections by a HVS-1000 Vickers hardness tester (Shanghai Wanheng Precision Instruments Co., Ltd, Shanghai, China) after grinding and mechanical polishing and the average value of six test points was taken as the final result. For samples with a thickness of 0.4 mm and above, the test loading force was 0.49 N for 15 s, and for samples with a thickness of less than 0.4 mm, the test loading force was 0.098 N for 15 s.

3. Results and Discussion

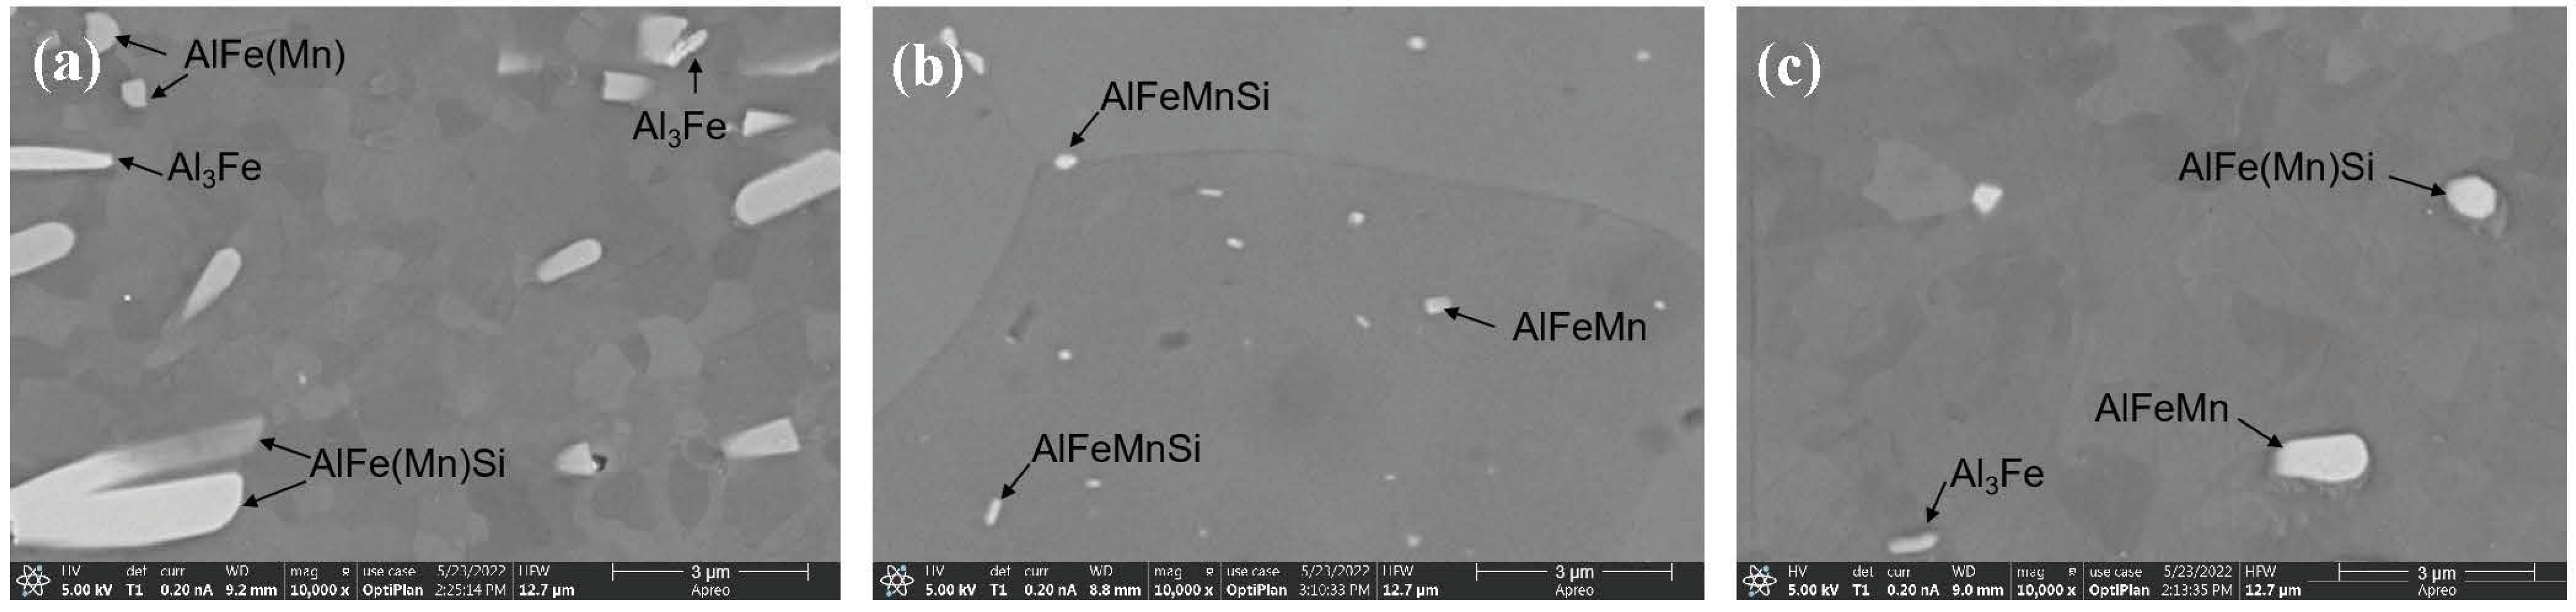
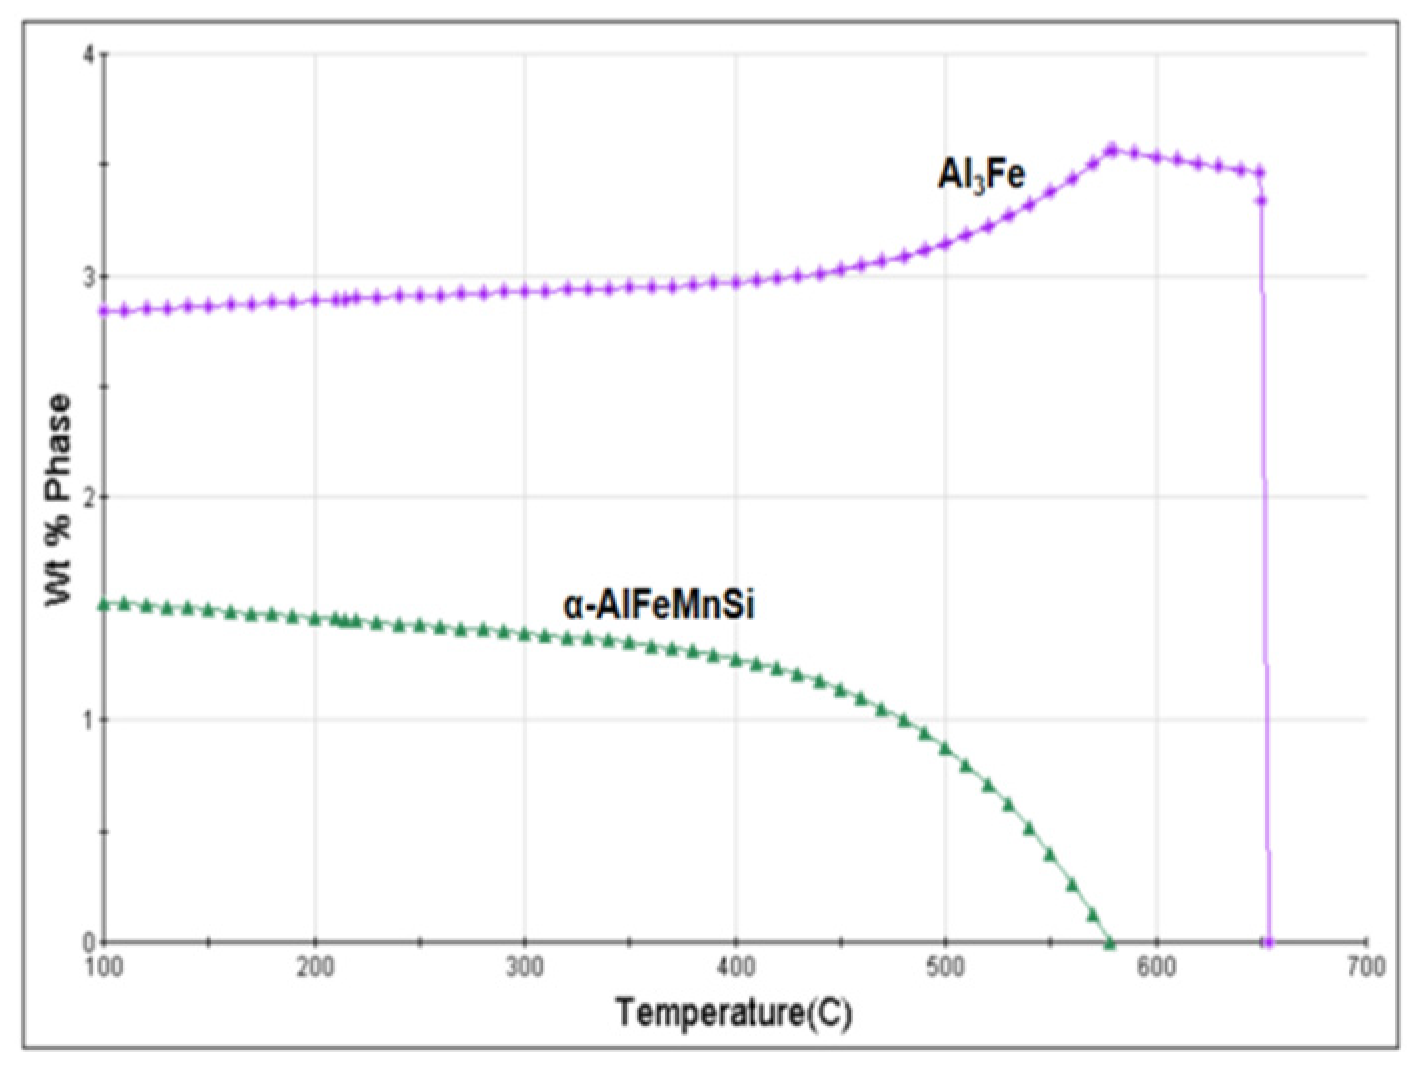
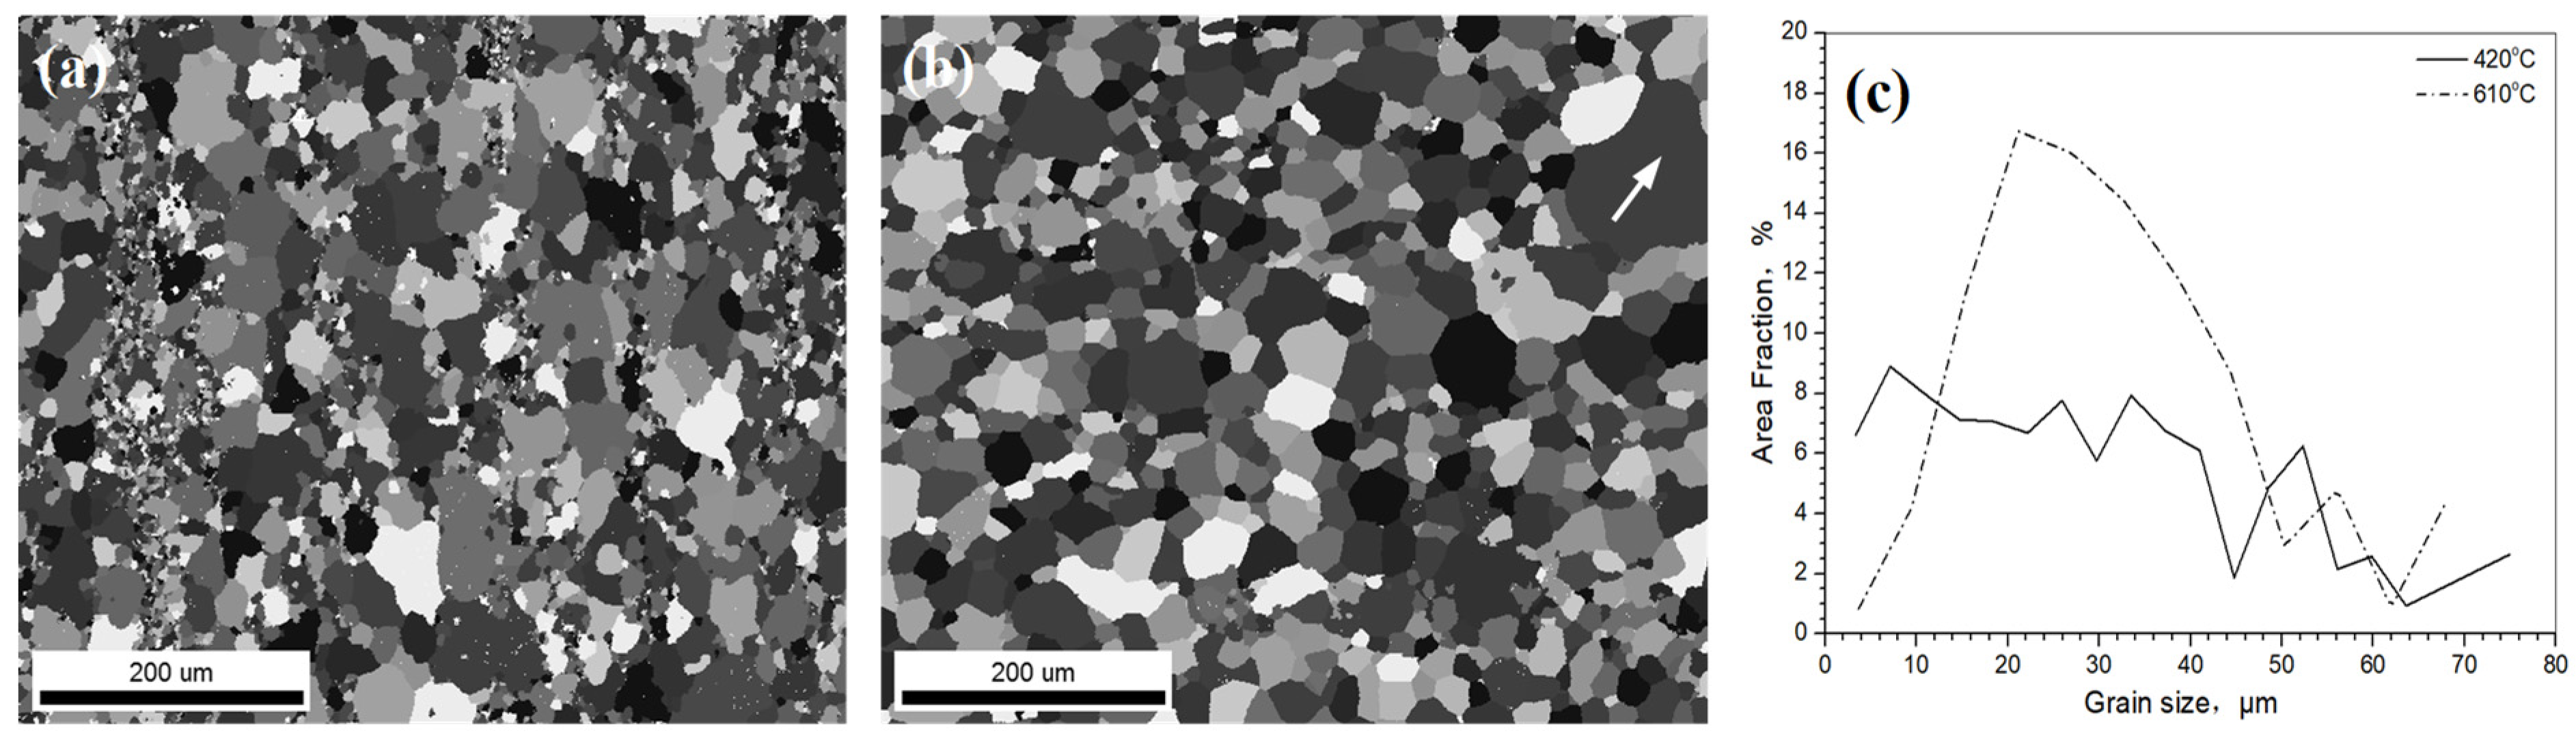
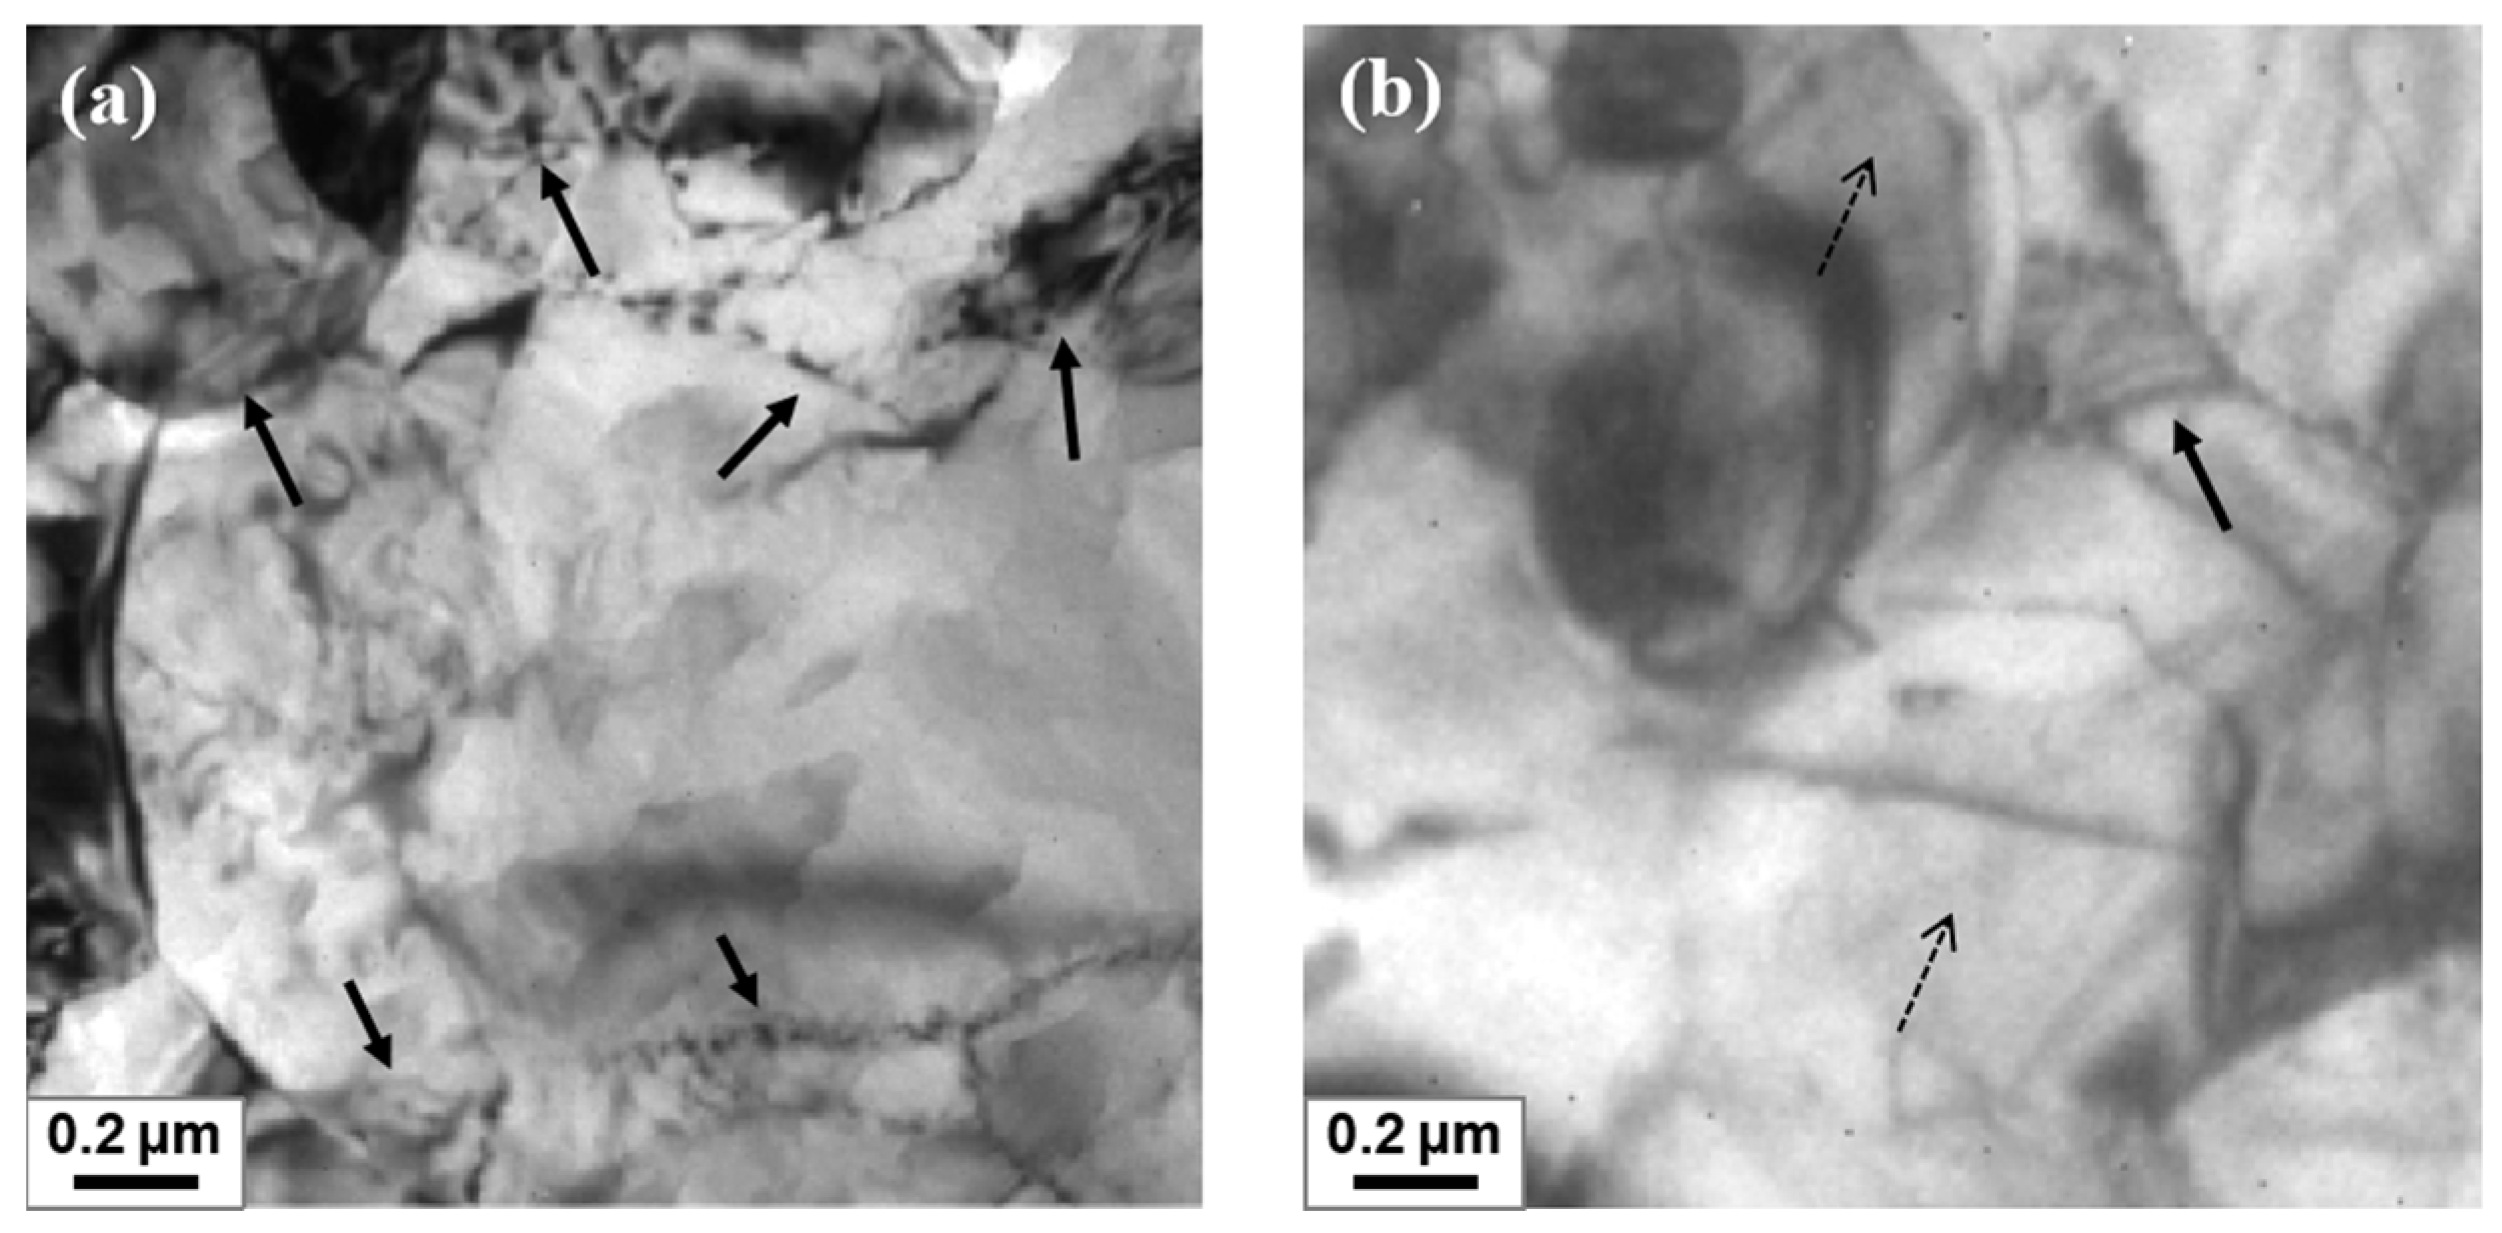
3.1. Microstructure and Texture of Intermediate Annealed Sheets

Figure 1a shows the microstructure of a 2 mm thick cold-rolled sheet. The alloy contains large-sized compounds, mainly rod-shaped Al3Fe, block-like AlFe(Mn), and rod-shaped β-AlFe(Mn)Si, as well as small-sized particles distributed in some areas. Cold rolling with medium strain (approximately 70% reduction in the present) causes the grains to divide, resulting in a cellular structure [19].
After annealing at 420 °C (as shown in Figure 1b), the number of large-sized compounds decreases, while there is an increase in the presence of small particle-like and short rod-shaped compounds (0.1~0.5 μm), primarily distributed within the crystal. As a result of recrystallization, the cellular structure formed by cold rolling disappears and the recrystallized grain boundaries become more visible. Annealing at 610 °C (Figure 1c) reduces the number of small-sized compounds and results in a cleaner interior of the crystal with almost no small-sized particles.
According to the phase diagram calculation (Figure 2), a large amount of α-AlFeMnSi and Al3Fe precipitate during annealing at 420 °C, while only Al3Fe continues to precipitate at 610 °C, with α-AlFeMnSi dissolving.
Figure 3 shows the electrical conductivity results of the alloy before and after annealing. It is evident that annealing at 420 °C significantly increases the electrical conductivity, while annealing at 610 °C decreases it. This indicates that the two annealing processes have different effects on the electrical conductivity of the alloy.
It is worth noting that work hardening has little effect on the electrical conductivity of aluminum, while the solid solubility of alloying elements has a greater impact [20]. During annealing, the decrease in electrical resistivity caused by the disappearance of lattice defects is much smaller than that caused by the precipitation of solute atoms from the matrix [21]. As shown in Figure 2, a large amount of α-AlFeMnSi precipitates during annealing at 420 °C, which improves the electrical conductivity. However, during annealing at 610 °C, the dissolution of α-AlFeMnSi increases the number of solution elements in the matrix, resulting in a decrease in electrical conductivity.
The grain morphology characteristics after annealing at 420 °C and 610 °C are shown in Figure 4a,b, respectively. After annealing at 420 °C, recrystallization occurs, but the grain size is uneven, with a wide size distribution range and a mean grain size of 29 μm (Figure 4c). On the other hand, at 610 °C, recrystallization is more complete and the grain size is relatively uniform, mainly concentrated in the range of 10~50 μm (Figure 4c), with a mean size of 34 μm.
This can be attributed to the significantly higher temperature of 610 °C, which exceeds the recrystallization temperature of the alloy, and a longer holding time. As a result, the recrystallized grains grow, leading to a larger overall grain size and even abnormal growth of individual grains (as indicated by the arrow in Figure 4b), with a size of 114 μm. During the annealing process at 610 °C, dispersed particles continuously dissolve back into the matrix, reducing the Zener drag effect on the grain boundary. This results in a higher effective mobility of the grain boundary, leading to the growth of abnormal grains [11].
Table 2 displays the texture components and content results of the two annealed sheets. After annealing at 420 °C, the volume fraction of recrystallization textures is 38.25%, mainly consisting of R texture with small amounts of Q, CubeND, CubeRD, and Cube texture. The annealed sheet also retains a significant amount of deformation textures, including S, copper, and brass, with a content of 23.5%. Upon annealing at 610 °C, the overall content of recrystallization textures increases significantly to 47.5%, with the highest content being CubeND texture, followed by R texture. The residual deformation textures are greatly reduced, with a total content of 14.9%.
The presence of alloying elements has minimal impact on the deformation textures, but strongly affects the recrystallization textures. The solid solution or precipitation of Mn in alloy hinders the development of Cube texture [22]. Fe in solid solution tends to segregate at grain boundaries, impeding the growth of Cube texture and promoting the formation of R texture [23,24]. The large number of large-sized particle compounds in the sheet causes particle-stimulated nucleation, resulting in random nucleation and distribution of grain orientation during the recrystallization process [25,26]. This inhibits or weakens the growth of Cube texture, making it not the dominant texture in the two annealed sheets.
The precipitation of fine particles during annealing hinders the migration and merging of grain/sub-grain boundaries during the recrystallization process, hindering the nucleation and growth of Cube texture and allowing some deformation textures to be preserved [11,27,28]. Therefore, in addition to recrystallization textures, there is also a certain amount of deformation textures in the two annealed sheets.
When annealing at 420 °C with a slow heating rate, precipitation occurs preferentially during the heating process, adversely affecting subsequent recrystallization and resulting in a lower content of Cube texture and a higher amount of residual deformation textures. Conversely, when annealing at 610 °C with a rapid heating rate, recrystallization occurs preferentially, and the dissolution of dispersed particles reduces the hindrance to the growth of Cube texture (including CubeND and CubeRD), resulting in a higher content of Cube texture compared to annealing at 420 °C.
These EBSD results indicate that the degree of recrystallization is lower after annealing at 420 °C compared to 610 °C. This can be attributed to the fast heating rate and high annealing temperature of 610 °C, which inhibits the recovery process and improves the driving force for recrystallization. Therefore, there is a higher nucleation rate in Cube texture and a greater degree of recrystallization. As a result, the recrystallization fraction after annealing at 420 °C is 52.9%, while the recrystallization fraction after annealing at 610 °C is 81.8%.

3.2. Changes in Microhardness during the Cold Rolling Process

Figure 5 shows the microhardness results of two annealed sheets with varying cold rolling reductions.
It is clear that the initial microhardness of both sheets is similar, at approximately 33 HV. During the subsequent cold rolling process, the microhardness of both sheets increases significantly with increasing cold rolling reduction. The microhardness of the sheet annealed at 420 °C reaches its peak (52.4 HV) at a cold rolling reduction of 82%, but then decreases noticeably as the cold rolling continues. Similarly, the microhardness of the sheet annealed at 610 °C increases significantly, reaching a peak of 58.7 HV at a cold rolling reduction of 86%, but then decreases with further cold rolling.
This can be attributed to the fact that both sheets have undergone complete recrystallization after annealing at 420 °C and 610 °C, and their hardness is primarily determined by the alloy composition [29]. As a result, the microhardness values for both sheets are very similar.
However, during the cold rolling process, the sheet annealed at 610 °C consistently exhibits higher microhardness values than the sheet annealed at 420 °C, particularly at higher cold rolling reductions where the difference in microhardness is more pronounced.
This can be explained by the increased lattice distortion of crystals caused by the dissolution of elements after annealing at 610 °C. This not only negatively affects electrical conductivity, but also hinders dislocation movement. As a result, dislocation movement becomes more difficult during cold working, leading to a significant increase in microhardness of the sheet annealed at 610 °C. While the dispersion particles formed during annealing at 420 °C can also hinder dislocation movement, their larger size limits their effectiveness due to the bypass mechanism. This suggests that for the AlFeMn alloy studied, the impact of solute solution on work hardening is greater than that of dispersed particles.
Figure 6 shows TEM photos of the 420 °C annealed sheets with 82% and 96% cold rolling reduction. It is evident that at the 82% cold rolling reduction, which corresponds to the peak microhardness of the cold-rolled sheet, there are more dislocations present, as shown by the solid black arrow in Figure 6a. However, at 96% cold rolling reduction, the dislocations significantly decrease and a polygonal structure is observed, as shown by the black dotted arrow in Figure 6b.
Figure 7 displays TEM photos of the 610 °C annealed sheets with 86% and 96% cold rolling reduction. At 86% cold rolling reduction, which also corresponds to the peak microhardness, the sheet has a high dislocation density, as shown by the solid black arrow in Figure 7a. At 96% cold rolling reduction, the dislocation density decreases slightly, as shown by the solid black arrow in Figure 7b, but is still higher than that of the 420 °C annealed sheet.
These results indicate that the recovery phenomenon occurs during the cold rolling process when the cold rolling reduction exceeds the value corresponding to the peak microhardness. This decrease in dislocation number leads to a decrease in microhardness, resulting in work softening. The degree of work softening is more pronounced in the 420 °C annealed sheet compared to the 610 °C annealed sheet.
This can be ascribed to the fact that when annealed at 420 °C, the elements of Mn and Fe, which are solid dissolved in the matrix, can be further precipitated. This helps to improve the purity of the alloy matrix and the stacking fault energy of the alloy sheet, thereby facilitating the occurrence of work softening [7,8,9,10,18]. As a result, the cold rolling reduction corresponding to the peak microhardness of the sheet annealed at 420 °C is lower than that of the 610 °C annealed sheet.

4. Conclusions

(1) After slow heating and annealing at 420 °C, it was observed that the alloy contained numerous small dispersed particles and the recrystallization grains were uneven, with a mean size of 29 μm. However, after rapid heating and annealing at 610 °C, the number of small-sized compounds decreased significantly, resulting in a cleaner matrix. And the recrystallization grains were also more uniform, with an average size of 34 μm.
(2) The volume fraction of recrystallization textures after annealing at 420 °C was 38.25%, mainly consisting of R texture with a small amount of Q, CubeND, CubeRD, and Cube texture. Additionally, a significant amount of deformation textures, including S, copper, and brass, were retained in the annealed sheet, with a total content of 23.5%. On the other hand, the degree of recrystallization was higher after annealing at 610 °C, resulting in a total content of 47.5% recrystallization textures, with CubeND texture being the most dominant, followed by R texture. The residual deformation textures decreased to 14.9%.
(3) After annealing at 420 °C, the electrical conductivity of the sheet was higher than that of the cold-rolled sheet, indicating the occurrence of precipitation. However, after being annealed at 610 °C, the electrical conductivity of the sheet was lower than that of the cold-rolled sheet, suggesting the occurrence of solid solution of elements.
(4) The initial microhardness of the two annealed sheets was similar. However, during the subsequent cold rolling process, the microhardness initially increased and then decreased, with the 420 °C annealed sheet experiencing a more significant decrease. Furthermore, the cold rolling microhardness and the cold rolling reduction corresponding to peak microhardness of the 420 °C annealed sheet were lower than those of the 610 °C annealed sheet.
(5) Annealing at 240 °C for 4 h was found to be a more acceptable intermediate annealing parameter for the studied AlFeMn alloy.

Author Contributions

Conceptualization, Y.P.; methodology, Y.P., Y.S. and L.C.; data curation, Y.P.; writing—original draft preparation, Y.P.; writing—review and editing, Y.P., Y.S. and L.C; visualization, Y.P.; supervision, Y.S. All authors have read and agreed to the published version of the manuscript.

Funding

This research received no external funding.

Data Availability Statement

Data are contained within the article.

Conflicts of Interest

Yanfeng Pan and Lingyong Cao are employees of the company Research Institute, Baoshan Iron & Steel Co., LTD. The remaining author declares that the research was conducted in the absence of any commercial or financial relationships that could be construed as a potential conflict of interest.

References

  1. Karlik, M.; Siegl, J.; Slamova, M.; Birol, Y. Study of the damage of AA 8006 twin-roll cast thin sheets during forming of heat exchanger fins. Mater. Sci. Forum 2000, 331–337, 619–624. [Google Scholar] [CrossRef]
  2. Chen, Z.W.; Li, S.S.; Zhao, J. Homogenization of twin-roll cast A8006 alloy. Trans. Nonferrous Met. Soc. China 2012, 22, 1280–1285. [Google Scholar] [CrossRef]
  3. Andreatta, F.; Lanzutti, A.; Fedrizzi, L. Corrosion behaviour of AA8xxx aluminium fins in heat exchangers. Surf. Interface Anal. 2016, 48, 789–797. [Google Scholar] [CrossRef]
  4. Zhao, P.Z.; Pan, Y.F.; Jiang, T.; Shi, X.J.; Zhang, Q. Effect of intermetallic compound content on the laser welding performance of Al-Fe alloy sheets. Mater. Sci. Forum 2014, 794–796, 401–406. [Google Scholar] [CrossRef]
  5. Xia, X.F.; Gu, Y.Y.; Xu, S.A. Titanium conversion coatings on the aluminum foil AA 8021 used for lithium-ion battery package. Appl. Surf. Sci. 2017, 419, 447–453. [Google Scholar] [CrossRef]
  6. Zhang, R.; Ding, D.Y.; Zhang, W.L.; Gao, Y.J.; Wu, Z.L.; Chen, G.Z.; Chen, R.Z.; Huang, Y.W.; Tang, J.S. Al-1.5Fe-xLa alloys for lithium-ion battery package. Metals 2018, 8, 890. [Google Scholar] [CrossRef]
  7. Pan, Y.F.; Shen, Y.F.; Zhao, P.Z. The microstructure and deformation behavior of Al-Fe-Mn alloys with different Fe contents during cold rolling. Metals 2018, 8, 753. [Google Scholar] [CrossRef]
  8. Tohma, K.; Takeuchi, Y. Work softening phenomenon in aluminum alloys. J. Jpn. Inst. Light Met. 1976, 26, 510–518. (In Japanese) [Google Scholar] [CrossRef]
  9. Tsumuraya, K.; Honma, K.; Watanabe, S. Work softening phenomenon in cold rolled Al-Fe alloys. J. Jpn. Inst. Light Met. 1977, 27, 599–604. (In Japanese) [Google Scholar] [CrossRef]
  10. Jin, Q.; Li, F.Z.; Yu, Z.M.; Liu, Z.J. Influence of uniformization on work softening of aluminium-ferro alloy. J. Harbin Univ. Sci. Technol. 1996, 1, 26–28. (In Chinese) [Google Scholar]
  11. Roy, R.K.; Kar, S.; Das, S. Evolution of microstructure and mechanical properties during annealing of cold-rolled AA8011 alloy. J. Alloys Compd. 2009, 468, 122–129. [Google Scholar] [CrossRef]
  12. Slamova, M.; KarliK, M.; Cieslar, M.; Chalupa, B.; Merle, P. Structure transformations during annealing of twin-roll cast Al-Fe-Mn-Si (AA 8006) alloy sheets. I. Effect of cold rolling and heating rate. Kov. Mater. 2002, 40, 389–400. [Google Scholar]
  13. Katsas, S.; Gras, C. The effect of recrystallization phenomena during annealing on the final forming properties of TRC AA8006. TMS Light Metals 2009, 1231–1234. Available online: https://www.researchgate.net/publication/269929364_The_effect_of_recrystallization_phenomena_during_annealing_on_the_final_forming_properties_of_TRC_AA8006 (accessed on 3 July 2024).
  14. Engler, O.; Laptyeva, G.; Wang, N. Impact of homogenization on microchemistry and recrystallization of the Al-Fe-Mn alloy AA 8006. Mater. Charact. 2013, 79, 60–75. [Google Scholar] [CrossRef]
  15. Birol, Y. Impact of interannealing on recrystallization during final annealing in twin-belt cast Al-Fe-Si sheet. Int. J. Mat. Res. 2012, 103, 992–997. [Google Scholar] [CrossRef]
  16. Birol, Y. Recrystallization of twin-roll cast Al-Fe-Si foil stock processed without homogenization. J. Alloys Compd. 2009, 488, 112–116. [Google Scholar] [CrossRef]
  17. Birol, Y. Response to annealing treatment of a twin-roll cast thin AlFeMnSi strip. J. Mater. Process. Technol. 2009, 209, 506–510. [Google Scholar] [CrossRef]
  18. Pan, Y.F.; Zhao, P.Z.; Shen, Y.F.; Shi, X.J.; Jiang, T. A study on the deformation dehaviours of Al-1.4Fe-0.2Mn alloy sheets. Mater. Sci. Forum 2016, 877, 380–386. [Google Scholar] [CrossRef]
  19. Yao, Z.Y.; Liu, Q.; Godfrey, A.; Liu, W. Microstructure and texture evolutions of AA1050 aluminum alloy cold rolled to high strains. Acta Metall. Sin. 2009, 45, 647–651. (In Chinese) [Google Scholar]
  20. Wang, Z.T.; Tian, R.Z. Aluminum Alloy and Its Processing Handbook, 2nd ed.; Central South University Press: Changsha, China, 2000. (In Chinese) [Google Scholar]
  21. Zhang, X.M.; Wu, W.X.; Liu, S.D.; Jian, X.; Tang, J.G. Precipitation and recrystallization of AA3003 aluminium alloy during annealing. J. Cent. South Univ. (Sci. Technol.) 2006, 37, 1–5. (In Chinese) [Google Scholar]
  22. Zhang, D.F. Investigation on Textures and Microstructures of 3l04 Aluminium Alloy during Processes of Deformation and Recrystallization; Northeastern University: Shenyang, China, 2004. (In Chinese) [Google Scholar]
  23. Merchant, H.D.; Morris, J.G. Annealing response of 3000 and 5000 series aluminum alloys. Metall. Trans. A 1990, 21A, 2643–2654. [Google Scholar] [CrossRef]
  24. Engler, O. On the origin of the R orientation in the recrystallization textures of aluminum alloys. Metall. Mater. Trans. A 1999, 30, 1517–1527. [Google Scholar] [CrossRef]
  25. Engler, O. On the influence of dispersoids on the particle stimulated nucleation of recrystallization in an Al-Fe-Si model alloy. Mater. Sci. Forum 1998, 273–275, 483–488. [Google Scholar] [CrossRef]
  26. Kumar, R.; Gupta, A.; Kumar, A.; Chouhan, R.N.; Khatirkar, R.K. Microstructure and texture development during deformation and recrystallisation in strip cast AA8011 aluminum alloy. J. Alloys Compd. 2018, 742, 369–382. [Google Scholar] [CrossRef]
  27. Hirsch, J.R.; Lücke, K. The application of quantitative texture analysis for investigating continuous and discontinuous recrystallization processes of Al-0.01Fe. Acta Metall. 1985, 33, 1927–1938. [Google Scholar] [CrossRef]
  28. Engler, O.; Lücke, K. Mechanisms of recrystallization texture formation in aluminium alloys. Scripta Metall. Mater. 1992, 27, 1527–1532. [Google Scholar] [CrossRef]
  29. Muggerud, A.M.F.; Mortsell, E.A.; Li, Y.J.; Holmestad, R. Dispersoid strengthening in AA3xxx alloys with varying Mn and Si content during annealing at low temperatures. Mater. Sci. Eng. A 2013, 567, 21–28. [Google Scholar] [CrossRef]
Figure 1. Microstructure of sheets with different annealing states: (a) cold-rolled; (b) annealed at 420 °C; (c) annealed at 610 °C.
Metals 14 00785 g001
Figure 2. Equilibrium phase diagram of AlFeMn alloy.
Metals 14 00785 g002
Figure 3. Results of electrical conductivity tests.
Metals 14 00785 g003
Figure 4. Grain characteristics and size distribution results of annealed sheets: (a,b) grain morphology annealed at 420 °C and 610 °C, respectively; (c) result of grain size distribution.
Metals 14 00785 g004
Figure 5. Changes in microhardness of the two annealed sheets during the cold rolling process.
Metals 14 00785 g005
Figure 6. TEM results of 420 °C annealed sheet at different cold rolling reductions: (a) 82% cold rolling reductions; (b) 96% cold rolling reductions.
Metals 14 00785 g006
Figure 7. TEM results of 610 °C annealed sheet at different cold rolling reductions: (a) 86% cold rolling reductions; (b) 96% cold rolling reductions.
Metals 14 00785 g007
Table 1. Chemical compositions of the alloy used in this present study (mass%).
FeSiMnTiAl
1.40.090.210.015Bal.
Table 2. The volume fraction of textures of two annealed sheets (%).
TextureMiller IndexTexture ContentTextureMiller IndexTexture Content
420 °C610 °C420 °C610 °C
R{124}<211>16.1510Brass{011}<211>6.53.3
Q{013}<231>7.96.1S{123}<634>9.557.8
Cube{001}<100>2.58.9Copper{112}<111>7.453.8
CubeND{001}<310>6.3514.2Goss{011}<100>2.13.9
CubeRD{013}<100>5.358.3
Disclaimer/Publisher’s Note: The statements, opinions and data contained in all publications are solely those of the individual author(s) and contributor(s) and not of MDPI and/or the editor(s). MDPI and/or the editor(s) disclaim responsibility for any injury to people or property resulting from any ideas, methods, instructions or products referred to in the content.

