Abstract
Driven by the rising demand for glass, metals, and plastics in industrial and household sectors, there was a substantial increase in waste and by-products generated. This study presents a method for repurposing waste glass, mill scale, and plastics as raw materials for ferrosilicon alloy production. This process entails reducing SiO2 and Fe2O3 using carbon derived from polystyrene/polypropylene mixtures. The glass, scale, and carbon powders were blended to achieve a C/O molar ratio of 1 (Blends A to F). The thoroughly mixed samples were then shaped into pellets and subsequently heated at 1550 °C in a tube furnace for 60 min. Ferrosilicon was successfully synthesized, with the reaction generating numerous metal droplets along with a slag layer in the crucible. The metallic yield for Blends A to F ranged from 16.65 wt% to 21.39 wt%, with the highest yield observed in Blend D. The bulk metal primarily consists of the FeSi phase, with Blend D exhibiting the highest Si concentration of 13.51 wt% and the highest hardness of 649.55 HV. Mechanism steps for ferrosilicon formation may vary with carbon dissolution rates. This work supports fossil fuel reduction and carbon neutrality, benefiting zero wastes practice and promoting sustainable material processing.
1. Introduction
Ferrosilicon (FeSi) is an alloy of iron and silicon with a silicon content varying between 10% and 90%. According to the Fe-Si phase diagram, the alloy can exist in the forms of FeSi, FeSi2, and Fe2Si5, with the major phase being FeSi [1]. Ferrosilicon is used as an alloy in steel production, added in small amounts to adjust the properties of the melt, the cooling process, deoxidizing process [2,3], and the finished product. It is also widely used in many applications, such as silicon steel for electromotors, transformer cores, and thermoelectric materials [4]. Due to its stability at high operating temperatures, cost effectiveness, and non-toxicity, ꞵ-FeSi2 is a promising thermoelectric material [4,5,6,7]. By the melting method, FeSi2 is prepared with an ε-FeSi phase within the matrix of the α-Fe2Si5 phase [5]. Different Fe-Si alloys can also be formed via mechanical alloying for 72 h at 750 °C, yielding paramagnetic FeSi and Fe5Si3 [8]. In 2023, the global ferrosilicon market was estimated to be valued at USD 11.50 billion. It is expected to grow at a CAGR of 2.5% from 2024 to 2030. The market growth is anticipated to be driven by the rising use of ferrosilicon as a deoxidizer in the steel industry and as an inoculant in cast iron [9].
Several research studies show interest in the production of ferrosilicon alloy [10,11,12,13,14,15,16,17,18,19,20,21,22,23,24,25,26]. For the formation of ferrosilicon alloy via carbothermic reduction reaction, the raw materials for producing ferrosilicon include sources of silica, iron, and carbon [10,11]. The process involves heating these materials in the presence of carbon at temperatures between 1550 °C and 1750 °C using blast furnace, electric arc, or submerged smelting furnaces [12,13,14,15,16,17]. The sources of silica can include quartz (SiO2), silica stone, sand, and high silica-based biomass such as rice husk [13,14]. Iron sources could be iron chips or scrap, iron ore, and by-products such as mill scale. Carbon sources might include fossil fuels such as coal, coke, and graphite.
Aligning with the principles of the circular economy, it becomes imperative to develop suitable techniques for handling diverse waste materials. Numerous research efforts were undertaken to minimize the consumption of natural resources, fossil fuels, and other virgin materials in ferrosilicon alloy production. Farzanz et al. [15] reported a method for synthesizing ferrosilicon alloy at 1550 °C. Waste glass, Fe2O3, and bakelite were used as sources of iron, silica, and carbon, respectively. Bakelite, a thermoset polymer containing CaO as a filler, was converted into carbon and used instead of coke. They reported a maximum silicon recovery of 16 wt% in the synthesized ferrosilicon [15]. However, the specific role of CaO in bakelite in the formation of ferrosilicon alloy was not clearly explained. Ikram et al. [17] examined ferroalloy formation in Fe2O3-SiO2-C and Fe2O3-SiO2-Al2O3-C systems at 1550 °C under argon for up to 60 min. Commercial high-purity silica, iron oxide, alumina, and synthetic graphite were employed as raw material resources. In Fe2O3-SiO2-C, they observed FeSi alloy formation with SiC and slag phases adhering to metal droplets. Fe3Si phase formed in Fe2O3-SiO2-Al2O3-C, with alumina, mullite, SiC, and slag phases. The metal droplets could not separate clearly from the slag phases. Silicon concentration in produced metal droplets was not provided using ICP-OES [17]. Chen et al. [18] studied the production of Fe-Si alloys and alumina extraction from coal fly ash using vacuum thermal reduction and alkaline leaching. They explored how different Fe/Si ratios affected the reduction in silica-containing phases in coal fly ash and the magnetic separation of Fe-Si alloys. The magnetic separation efficiency of Fe-Si alloys increased from 79.68% to 89.03% as the Fe/Si ratio rose from 1.0 to 1.4 [18]. Wang et al. [19] investigated the carbothermal reduction process of coal gasification fine slag (CGFS) in an electric arc furnace to prepare a Si-Fe-Al-Ca alloy. This approach presents a new possibility for recovering and utilizing CGFS solid waste in metallurgy. The study successfully produced a Si-Fe-Al-Ca alloy with a composition of 63.83 wt% Si, 19.73 wt% Fe, 7.09 wt% Al, 6.32 wt% Ca, and other elements at temperatures above 2000 °C [19]. However, the extremely high temperature makes this process cost prohibitive for practical production. Hu et al. [20] reported the synthesis of calcium aluminate and Fe-Si alloys using red mud and aluminate dross as the main raw materials in a lab-scale experiment.
Grudinsky et al. [21] reported the technological feasibility of reduction smelting of Waelz slag from EAF dust processing. Their approach involved the preliminary flotation of carbon and reduction smelting at 1650 °C with the addition of a SiO2 flux. This process resulted in the production of low-silicon ferrosilicon with high copper content, as well as slag suitable for use in the construction industry.
Vast amounts of waste and by-products were generated globally, leading to negative environmental effects. In the context of a circular economy, appropriate techniques need to be developed to manage a wide range of waste. Waste glass, a post-consumer product, contains SiO2 as a main component, while mill scale, a by-product from the steel industry, has Fe2O3 as the major component. These wastes can be valuable resources for producing ferrosilicon alloy. In this process, waste plastics can be used as reductants to reduce fossil fuel consumption in metallurgical processes.
Among plastic wastes, polystyrene (PS) and polypropylene (PP) received less attention compared to other types. They are commonly found in packaging boxes, plastic forks, spoons, and coffee cup lids. The generation of PS/PP waste increased gradually over the past five years, particularly due to the rise of the food delivery business during the COVID-19 pandemic.
The present study aims to develop management technology for a wide range of wastes by investigating the formation of ferrosilicon alloy through carbothermic reduction reactions at 1550 °C. It utilizes post-consumer glass and mill scale as silica and iron sources, respectively. In an effort to reduce the use of fossil fuels, carbon derived from waste PS/PP will be employed as a reductant. The study will emphasize the effect of carbon derived from PS/PP mixtures in the glass–scale–plastic system. This approach holds the potential to decrease the consumption of natural resources and virgin materials, as well as reduce energy consumption. Additionally, it could significantly lower the negative impact on the environment by reducing fossil fuel consumption and thus greenhouse gas emissions.
2. Materials and Methods
2.1. Materials
Glass powder was supplied by Glass Bridge Company Limited, the post-consumer glass recycling company located in Bangkok, Thailand. It was sieved into powder with a particle size of <180 µm. Mill scale was provided by UMC Metal Co., Ltd., EAF steel mill located in Chonburi, Thailand. It was ground and sieved to a powder with particle sizes of <180 µm. XRF chemical analysis (Model ZSX Primus, Rigaku, Japan) of the glass powder and mill scale is detailed in Table 1, wherein SiO2 and Fe2O3 constitutes the predominant component, accounting for approximately 73.6 and 93.7 wt%, respectively.

Table 1.
XRF chemical analysis of raw materials.
Carbon derived from waste plastics was used as a reducing agent in the experiments. Polymeric food packaging wastes, polystyrene (PS) and polypropylene (PP), were used in the present study. PS and PP were collected from a plastics recycler in the Samut Sakhon province of Thailand. It was cleaned and air dried before being used in the experiments. It was crushed into a size of <5 mm. PS was mixed with PP into 5 different ratios in order to reveal the mixture of the plastics in the waste stream and named mixtures P2–P6 as shown in Table 2. PS alone was used in the present study for comparison, and named P1. The mixtures were put in an alumina crucible along with an iron catalyst, and then pyrolyzed in a horizontal tube furnace for 15 min at 1550 °C under an inert argon atmosphere. The iron catalyst is a small iron chip used for enhancing the decomposition of polymers and the formation of graphitic carbon. The derived carbons were ground using a ring mill and sieved into a powder of <180 µm for the ferrosilicon synthesis experiment. The chemical composition of the carbons was analyzed using a LECO CHN628 analyzer, and is given in Table 2. LECO is the commercial company for the chemical analyzer, LECO Corporation, St. Joseph, MI, USA. Carbon content of the derived carbons ranges between 85.97 and 90.57 wt%.
Table 2.
Ultimate analysis of carbon derived from polystyrene and polypropylene mixed.
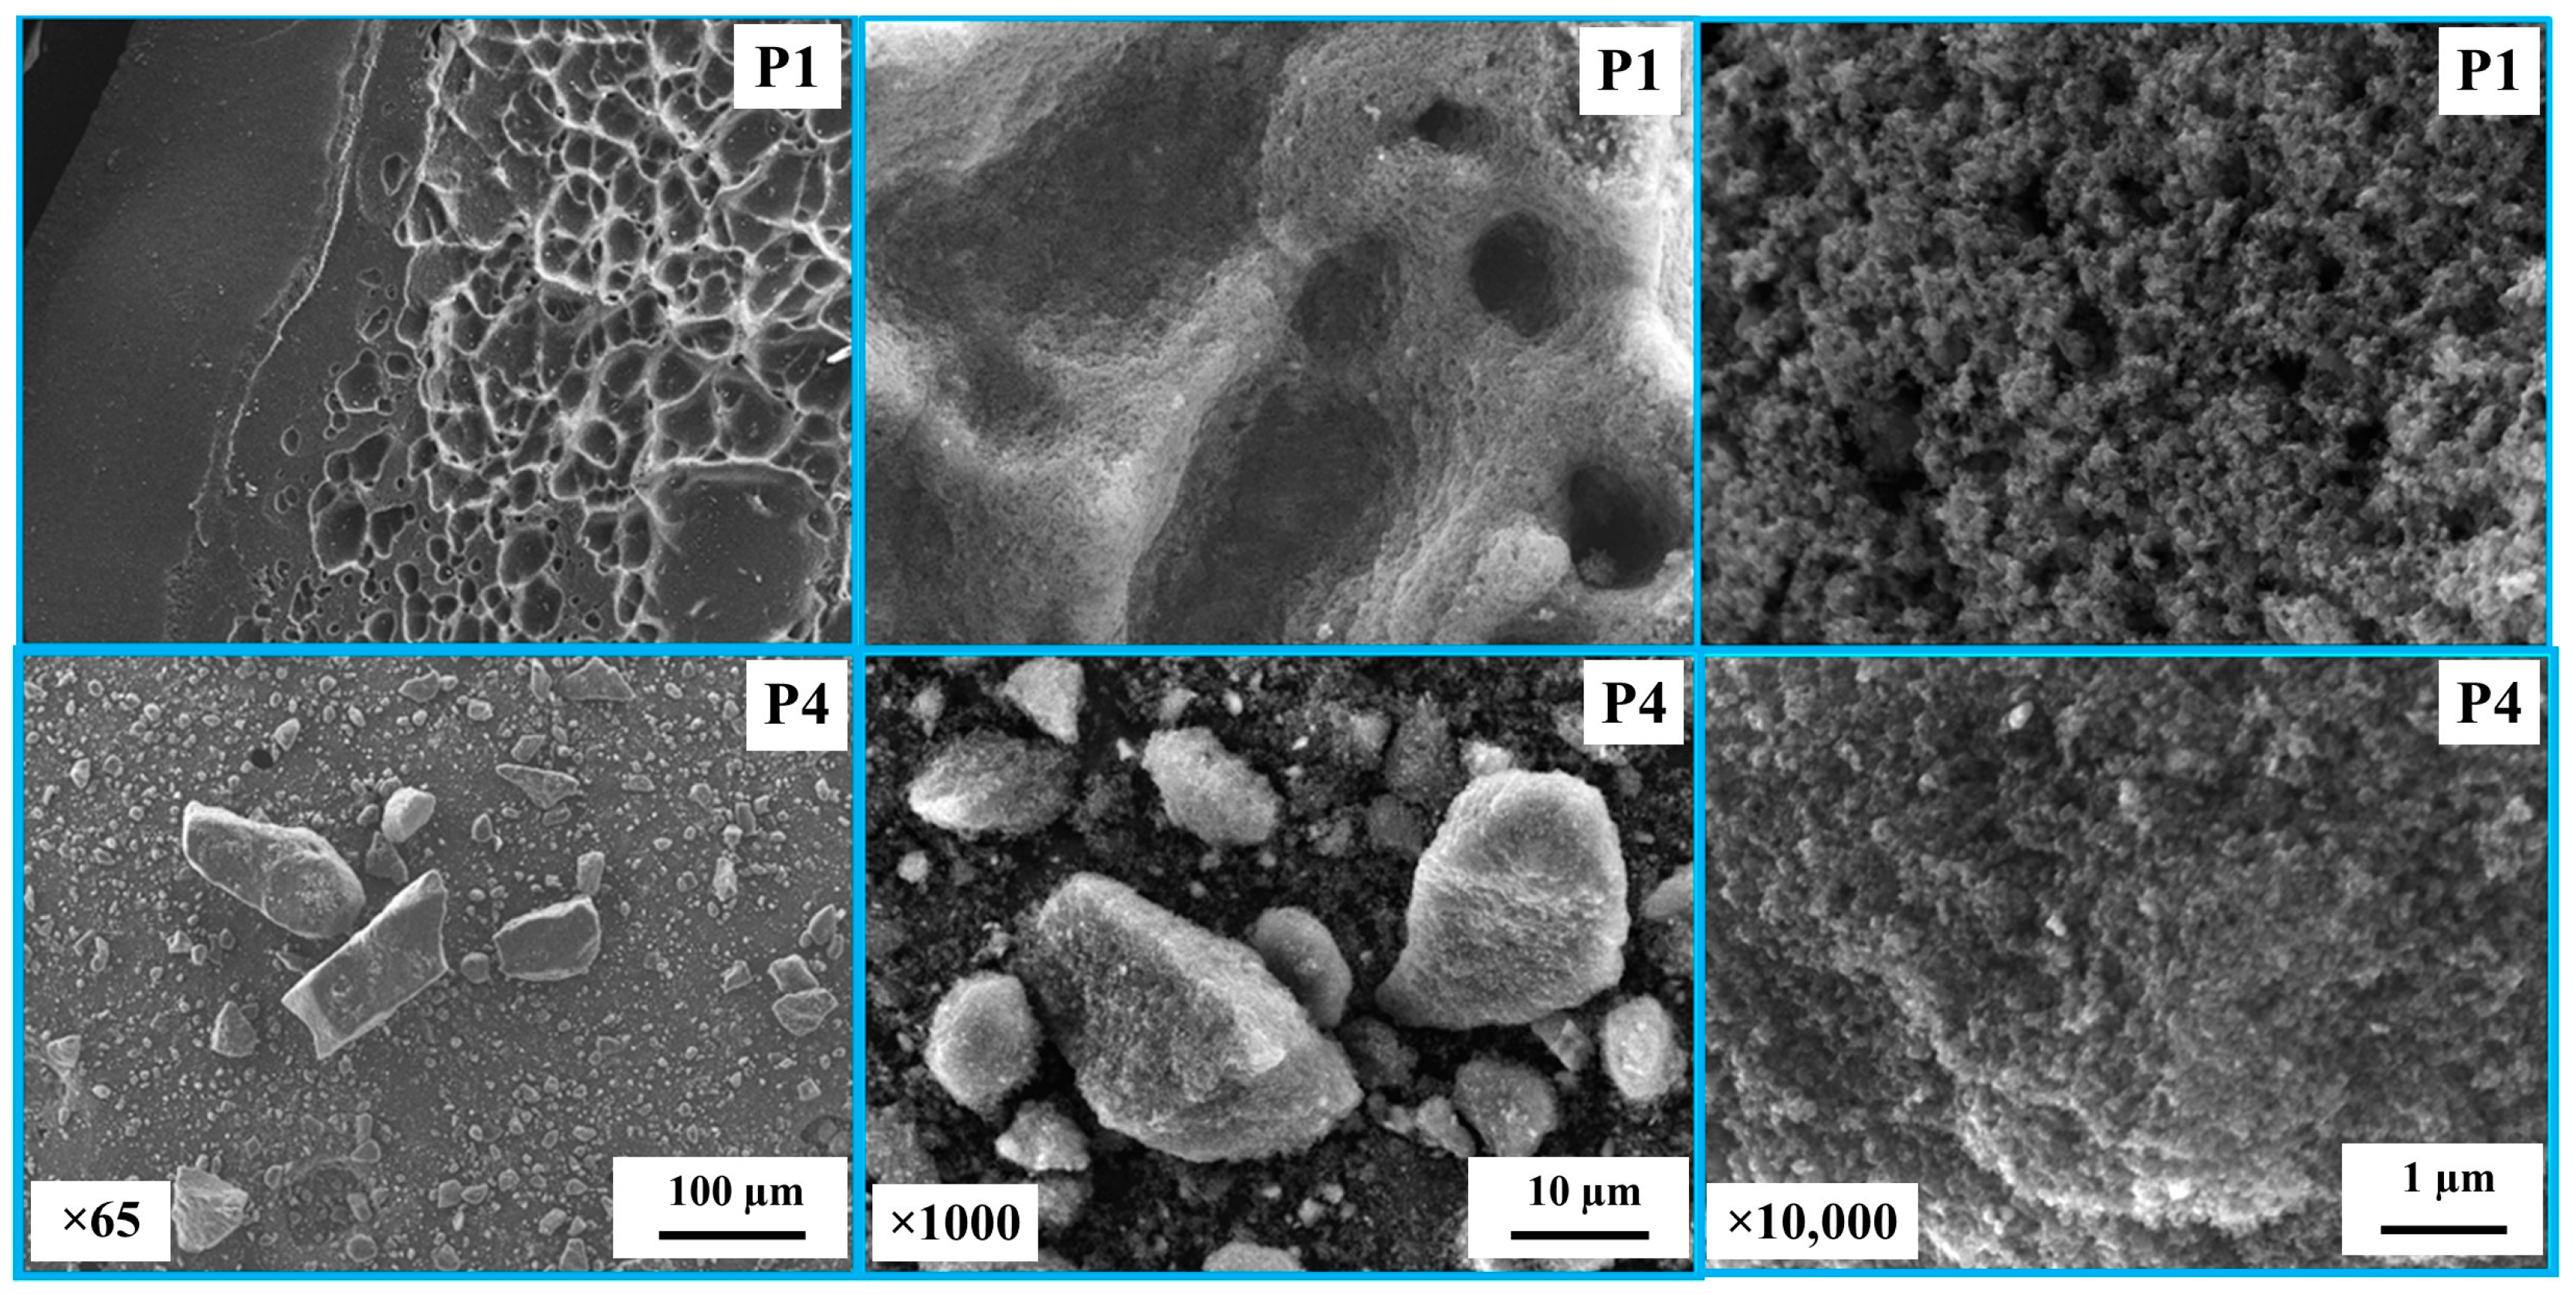
Figure 1 shows SEM images of the carbon derived from PS and PP mixtures in the cases of P1 and P4. It was observed that the char for P1 is in the form of carbon plates/flakes with a rough surface and pores, indicating a high surface area. In contrast, the char for P4 consists of smaller and finer particles. Figure 2 shows the surface area and crystallite size of the derived carbon. The carbon derived displays a semi-crystalline structure with crystallite sizes (LC) ranging between 0.27 and 2.45 nm. The crystallite size decreases with decreasing PS concentration in the blends. Furthermore, the surface area of the derived carbon ranges between 68.49 and 29.97 m2/g, also decreasing with decreasing PS concentration in the blends.
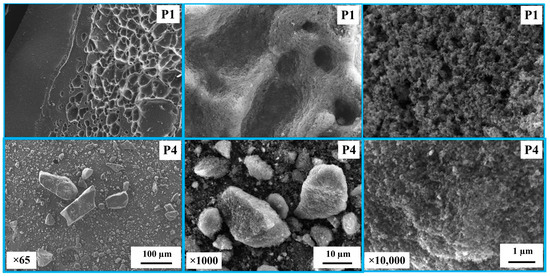
Figure 1.
SEM images of the carbon derived from polystyrene and polypropylene mixed in the case of P1 and P4.
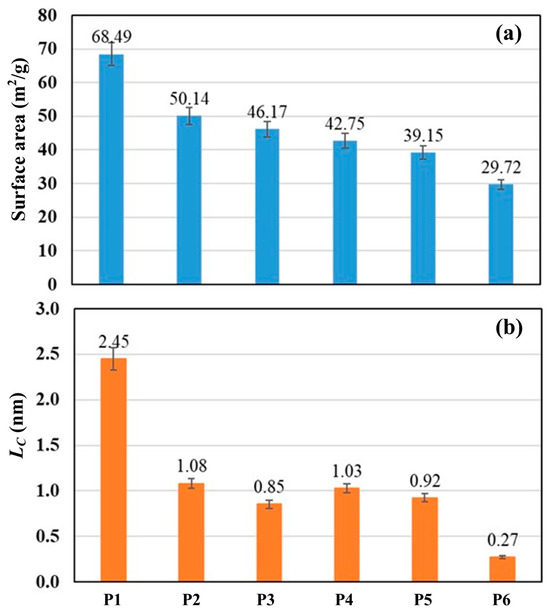
Figure 2.
(a) Surface area and (b) crystallite size (Lc) of the carbon derived from polystyrene and polypropylene mixed.
Glass, mill scale, and the derived carbons (P1–P6) were blended in a rolling mill for 30 min according to the C/O molar ratio of 1, and named Blends A–F. Components of the blends used in the experiments are shown in Table 3. The molar of C is the total moles of carbon in the derived carbons. The molar of O is the total moles of oxygen from SiO2 and Fe2O3 in the glass powder and mill scale, respectively.
Table 3.
Components of the blends used in the experiments.
2.2. Experimental
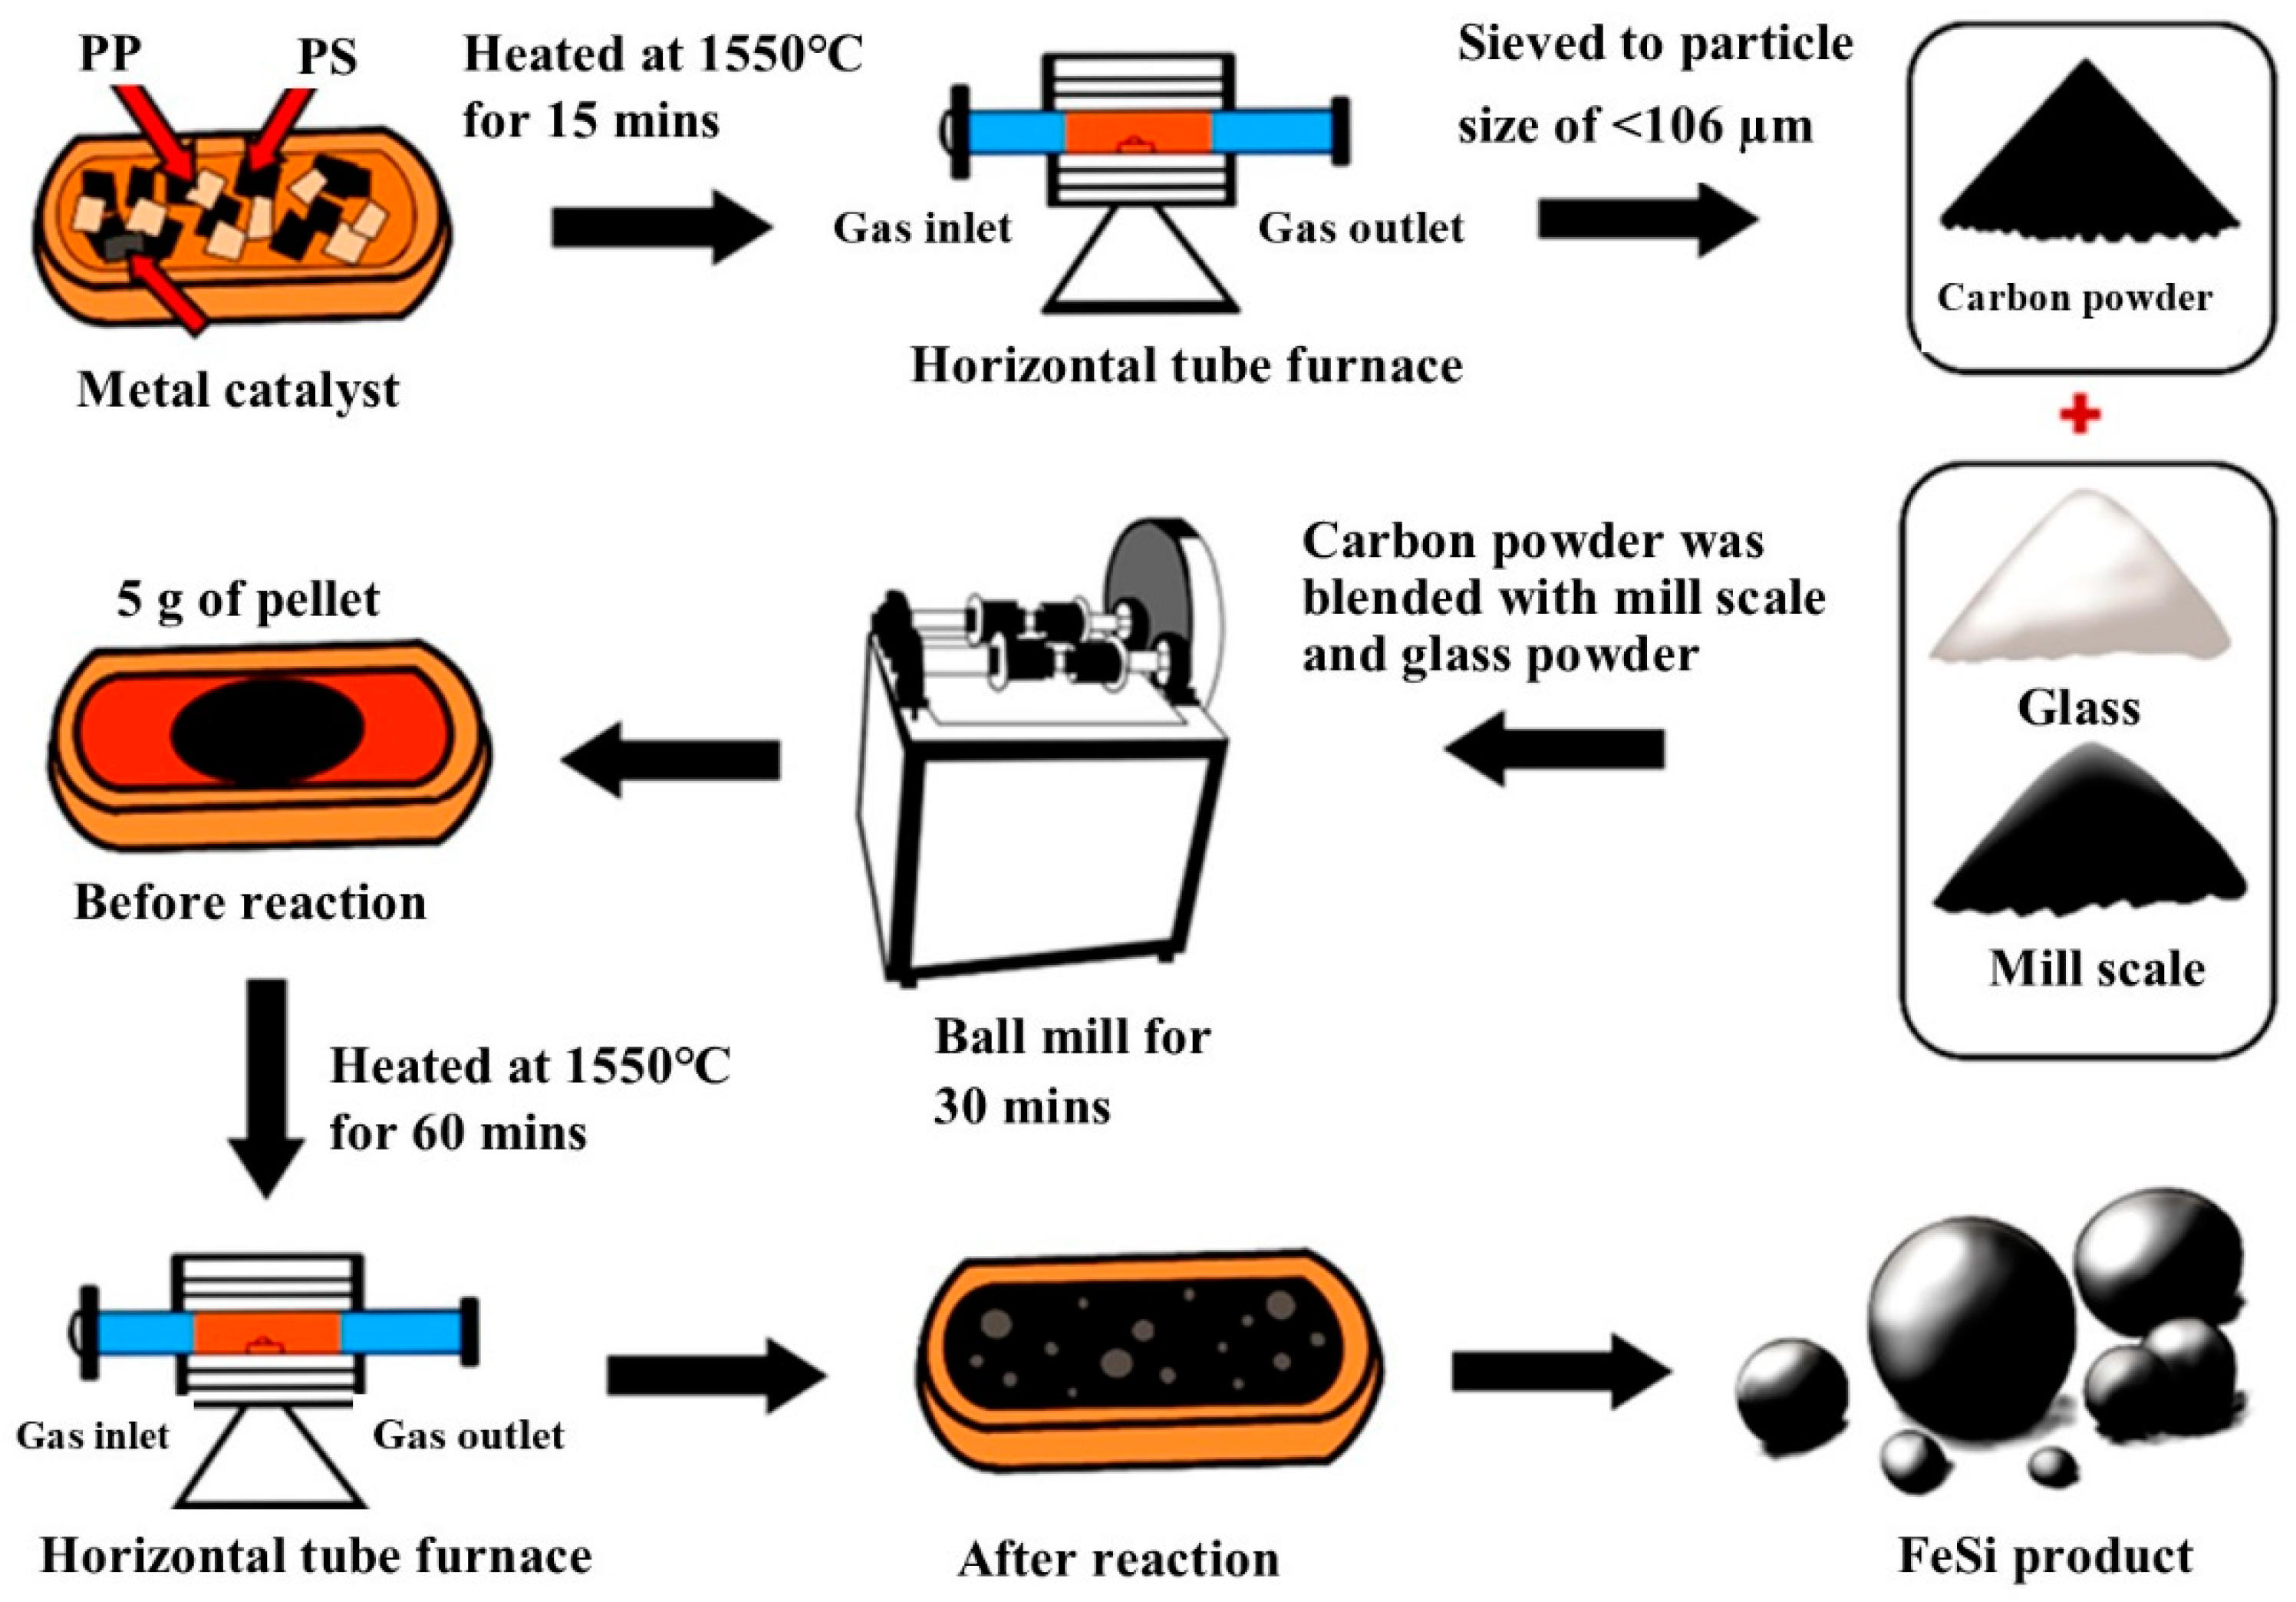
Five gram of the Blends A–F were formed into a spherical pellet by hand rolling with the addition of some water. The pellets were dried in the oven at 90 °C for 48 h. The pellet was placed in a refractory crucible and heated in a horizontal tube furnace where the high purity (99.998%) argon gas flowed at a rate of 1 L/min. The crucible used in the experiment is a commercial refractory crucible from LECO instrument, USA, primarily made of zirconia as the main component. Firstly, the crucible was placed in the cold zone of the furnace for 5 min to prevent thermal shock. Then, it was pushed into the hot zone where the temperature was 1550 °C for 1 h, and then pulled back to the cold zone to terminate high temperature reactions. The produced metal droplets will be collected for further analyses. XRD technique (Bruker, Billerica, MA, USA, D8 Advance) was used for phase characterization of the produced metal. SEM and EDS techniques (JEOL, Akishima, Japan, JSM 7800F) were employed to investigate the morphology and elemental analysis of the bulk metal. Samples preparation and an experimental overview of the present study are shown in Figure 3.
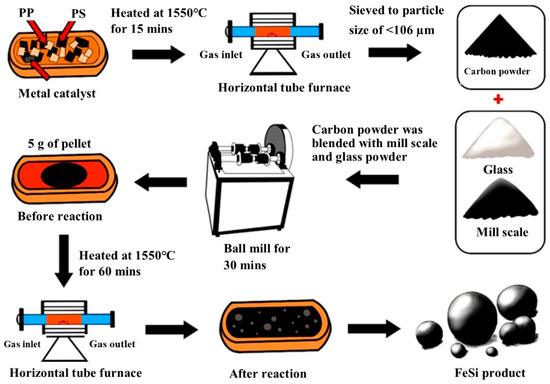
Figure 3.
Samples preparation and experimental overview.
In these systems, the formation of the ferrosilicon alloy can occur via the reduction in Fe2O3 in mill scale and SiO2 in glass powder. Fe2O3 can be reduced by solid carbon atoms, as shown in Equations (1)–(3), producing CO in the system. The produced CO gas can further participate in the reduction in Fe2O3, as shown in Equations (4)–(6), resulting in the production of CO2. The produced CO2 can also oxidize solid carbon in the pellet to regenerate CO in the system, as shown in Equation (7). These cyclic reactions further facilitate the reduction in Fe2O3. The standard Gibbs free energy (ΔG°) at 1550 °C for Equations (3), (6) and (7) is −124.46 kJ, −276.71 kJ, and −145.63 kJ, respectively, indicating a strong driving force for the reduction reactions [27,28,29].
3Fe2O3(l) + C(s) = 2Fe3O4(l) + CO(g)
Fe3O4(l) + C(s) = 3FeO(l) + CO(g)
FeO(l) + C(s) = Fe(l) + CO(g)
3Fe2O3(l) + CO(g) = 2Fe3O4(l)+ CO2(g)
Fe3O4(l) + CO(g) = 3FeO(l) + CO2(g)
FeO(l) + CO(g) = Fe(l) + CO2(g)
C(s) + CO2(g) = 2CO(g)
The carbothermic reaction of SiO2 can occur at the experimental temperature of 1550 °C, as it proceeds at temperatures above 1400 °C [30]. The possible reaction pathways for SiO2 reduction are shown in Equations (8)–(14), producing CO in the system. SiO2 can be reduced by solid carbon to produce SiO, Si, SiC, and CO, as shown in Equations (8)–(10). SiO gas can also be reduced by solid carbon to produce Si, SiC, and CO, as shown in Equations (11) and (12). The produced SiC can further reduce SiO2 and SiO to produce solute Si atoms, SiO, and CO in the system, as shown in Equations (13) and (14). The formation of FeSi can occur directly via the diffusion/dissolution of solute Si atoms from the reaction zone into the liquid Fe matrix and through the interaction between SiC and liquid Fe, as shown in Equation (15). Moreover, SiO2 can directly react with Fe2O3 and solid carbon to produce FeSi and CO as the overall reaction. The produced SiO gas is expected to react with CO to reproduce SiO2 [13,28]. As shown in the EDS results, the detected carbon in the produced metal could be attributed to the dissolution of carbon atoms derived from waste plastics through the contact between liquid iron and solid carbon.
SiO2(s) + C(s) = SiO(g) + CO(g)
SiO2(s) + 2C(s) = Si(l) + 2CO(g)
SiO2(s) + 3C(s) = SiC(s) + 2CO(g)
SiO(g) + C(s) = Si(l) + CO(g)
SiO(g) + 2C(s) = SiC(s) + CO(g)
SiO2(s) + SiC(s) = Si + SiO(g) + CO(g)
SiO(g) + SiC(s) = 2Si + CO(g)
SiC(s) + Fe(l) = FeSi(l) + C
2SiO2(s) + Fe2O3(l) + 7C(s) = 2FeSi(l) + 7CO(g)
3. Results and Discussion
3.1. The Produced Metal
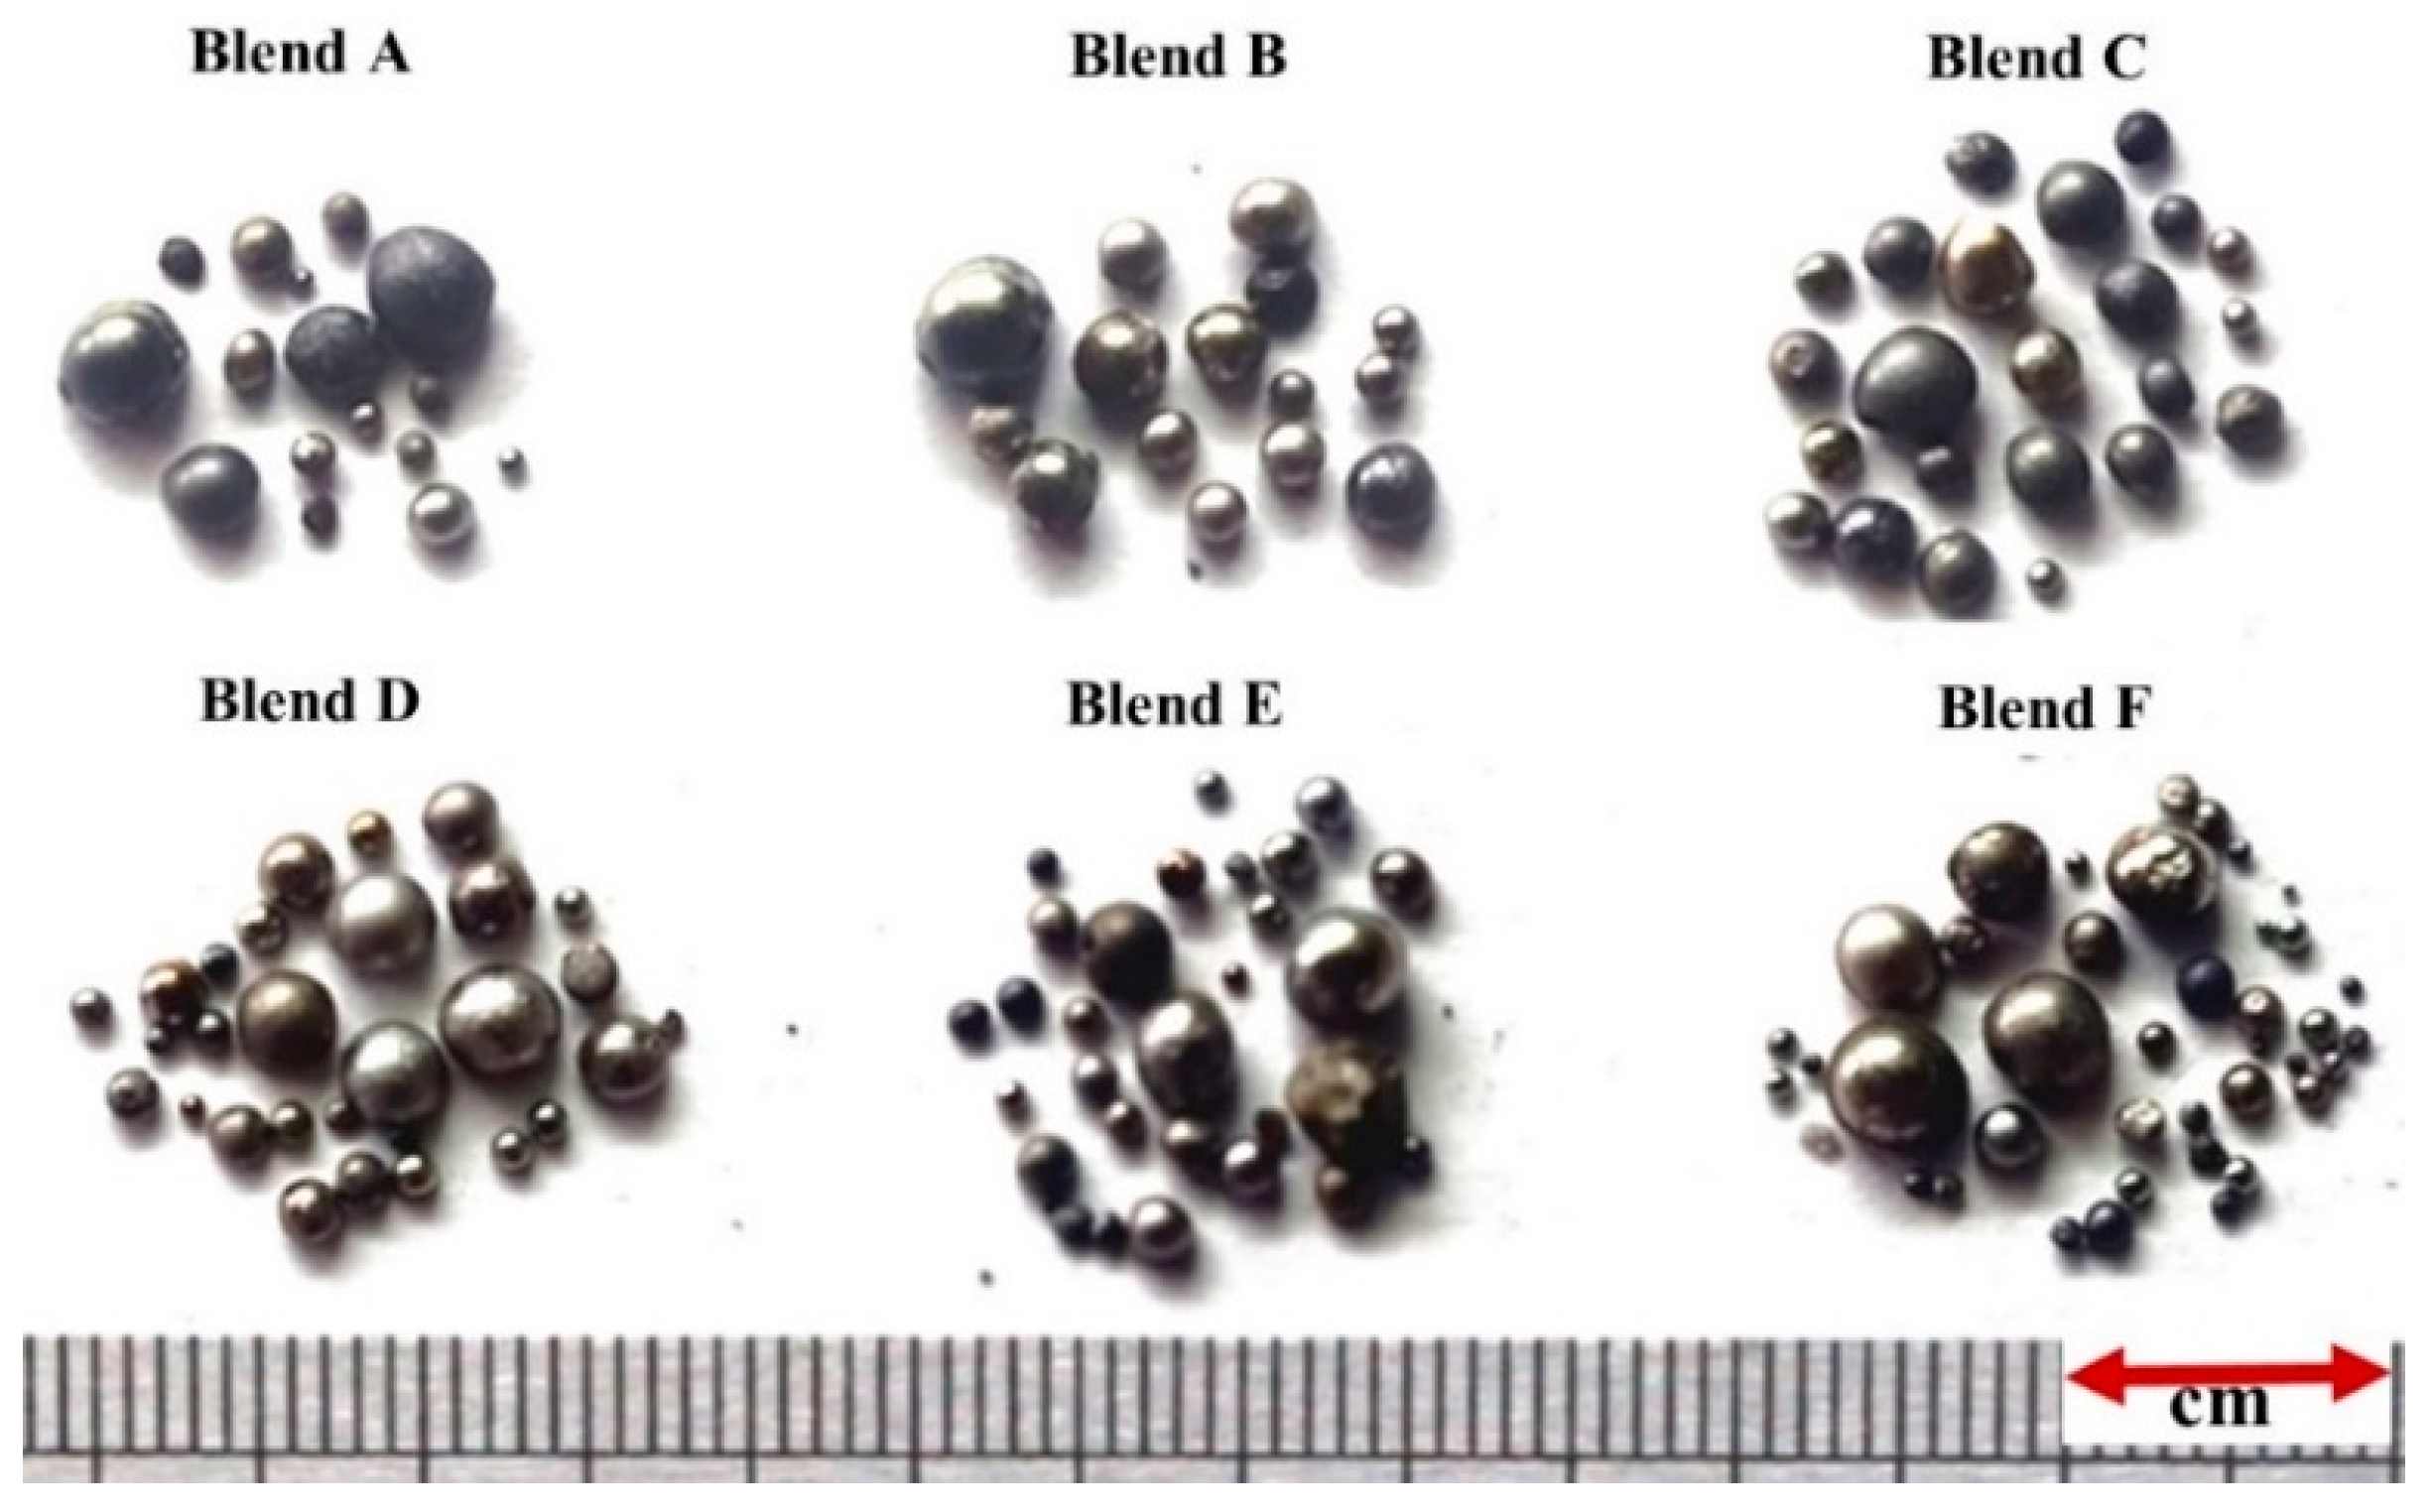
In Figure 4, the pellets of Blends A to F are depicted after undergoing heating at 1550 °C for 1 h. Within the crucible, numerous shiny metal droplets were observed alongside a slag layer covering the crucible surface. These observations suggest the carbothermic reduction of glass and mill scale within the blends by all reducing agents (P1 to P6). Following this, the produced metal droplets were separated from the slag phase and subsequently washed in ethanol to remove any debris from the outer surface, as depicted in Figure 5. Phase, morphology, yield, and chemical/physical properties of the produced metals were conducted to characterize the produced metal.
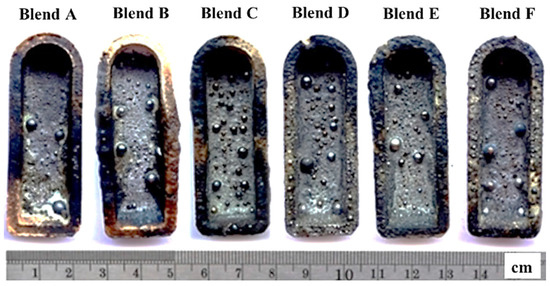
Figure 4.
The pellets after heating at 1550 °C for 1 h.

Figure 5.
The produced metal droplets obtained after heating the pellets of Blends A to F at 1550 °C for 1 h.
3.2. Phase Analysis of the Produced Metals
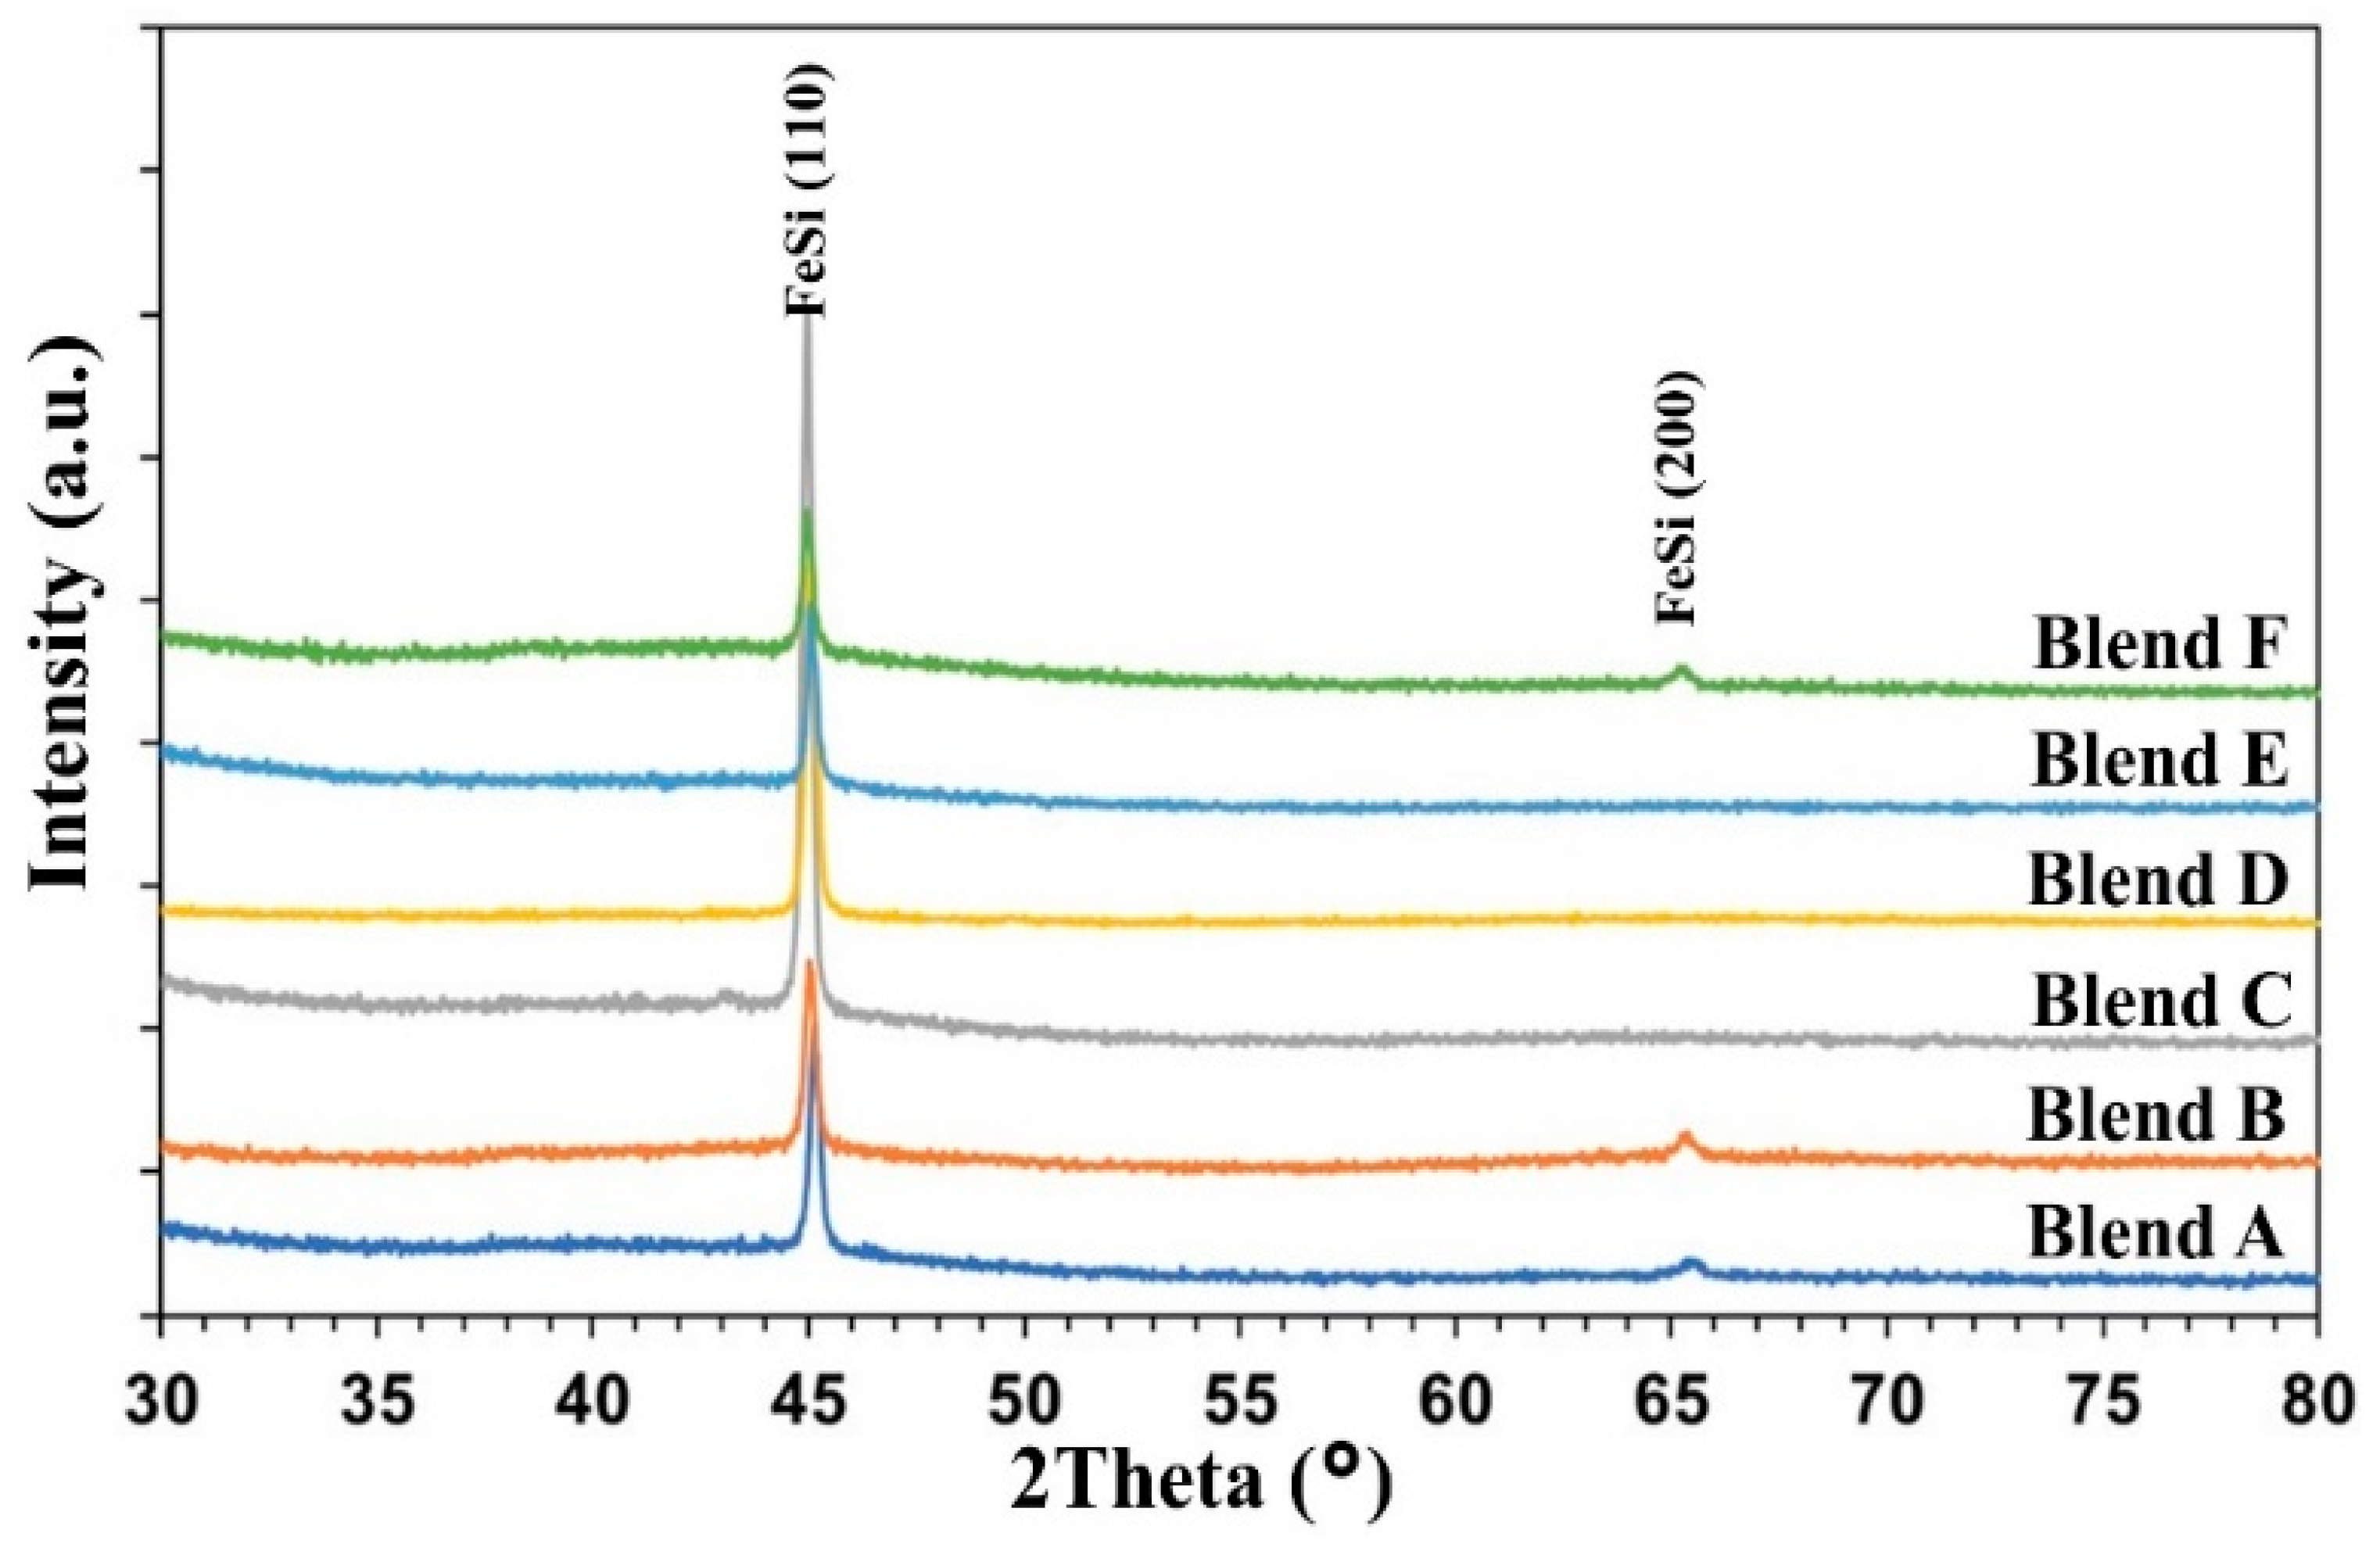
Figure 6 displays the XRD patterns of the metal droplets obtained after heating the pellets of Blends A to F at 1550 °C for 1 h. Analysis reveals that the produced metals consist of a ferrosilicon intermetallic compound, specifically the phase of iron monosilicide (FeSi), across all cases. The primary FeSi peak, observed at approximately 45.03° (2theta), corresponds to the Miller Indices (hkl) of (110), while the secondary peak, at around 65.5° (2theta), corresponds to (200) [31,32]. Notably, SiC and other slag phases were not detected in the XRD patterns, indicating effective separation between the metal and slag phases. The strongest FeSi peaks were observed in the case of Blend D, with Blends C and E exhibiting slightly weaker peaks.
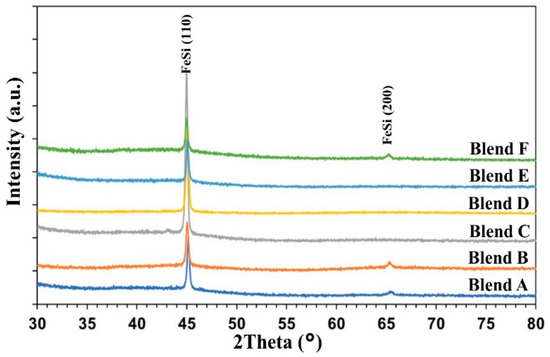
Figure 6.
XRD patterns of the metal droplets after heating the pellets at 1550 °C for 1 h.
3.3. Morphology of the Produced Metals
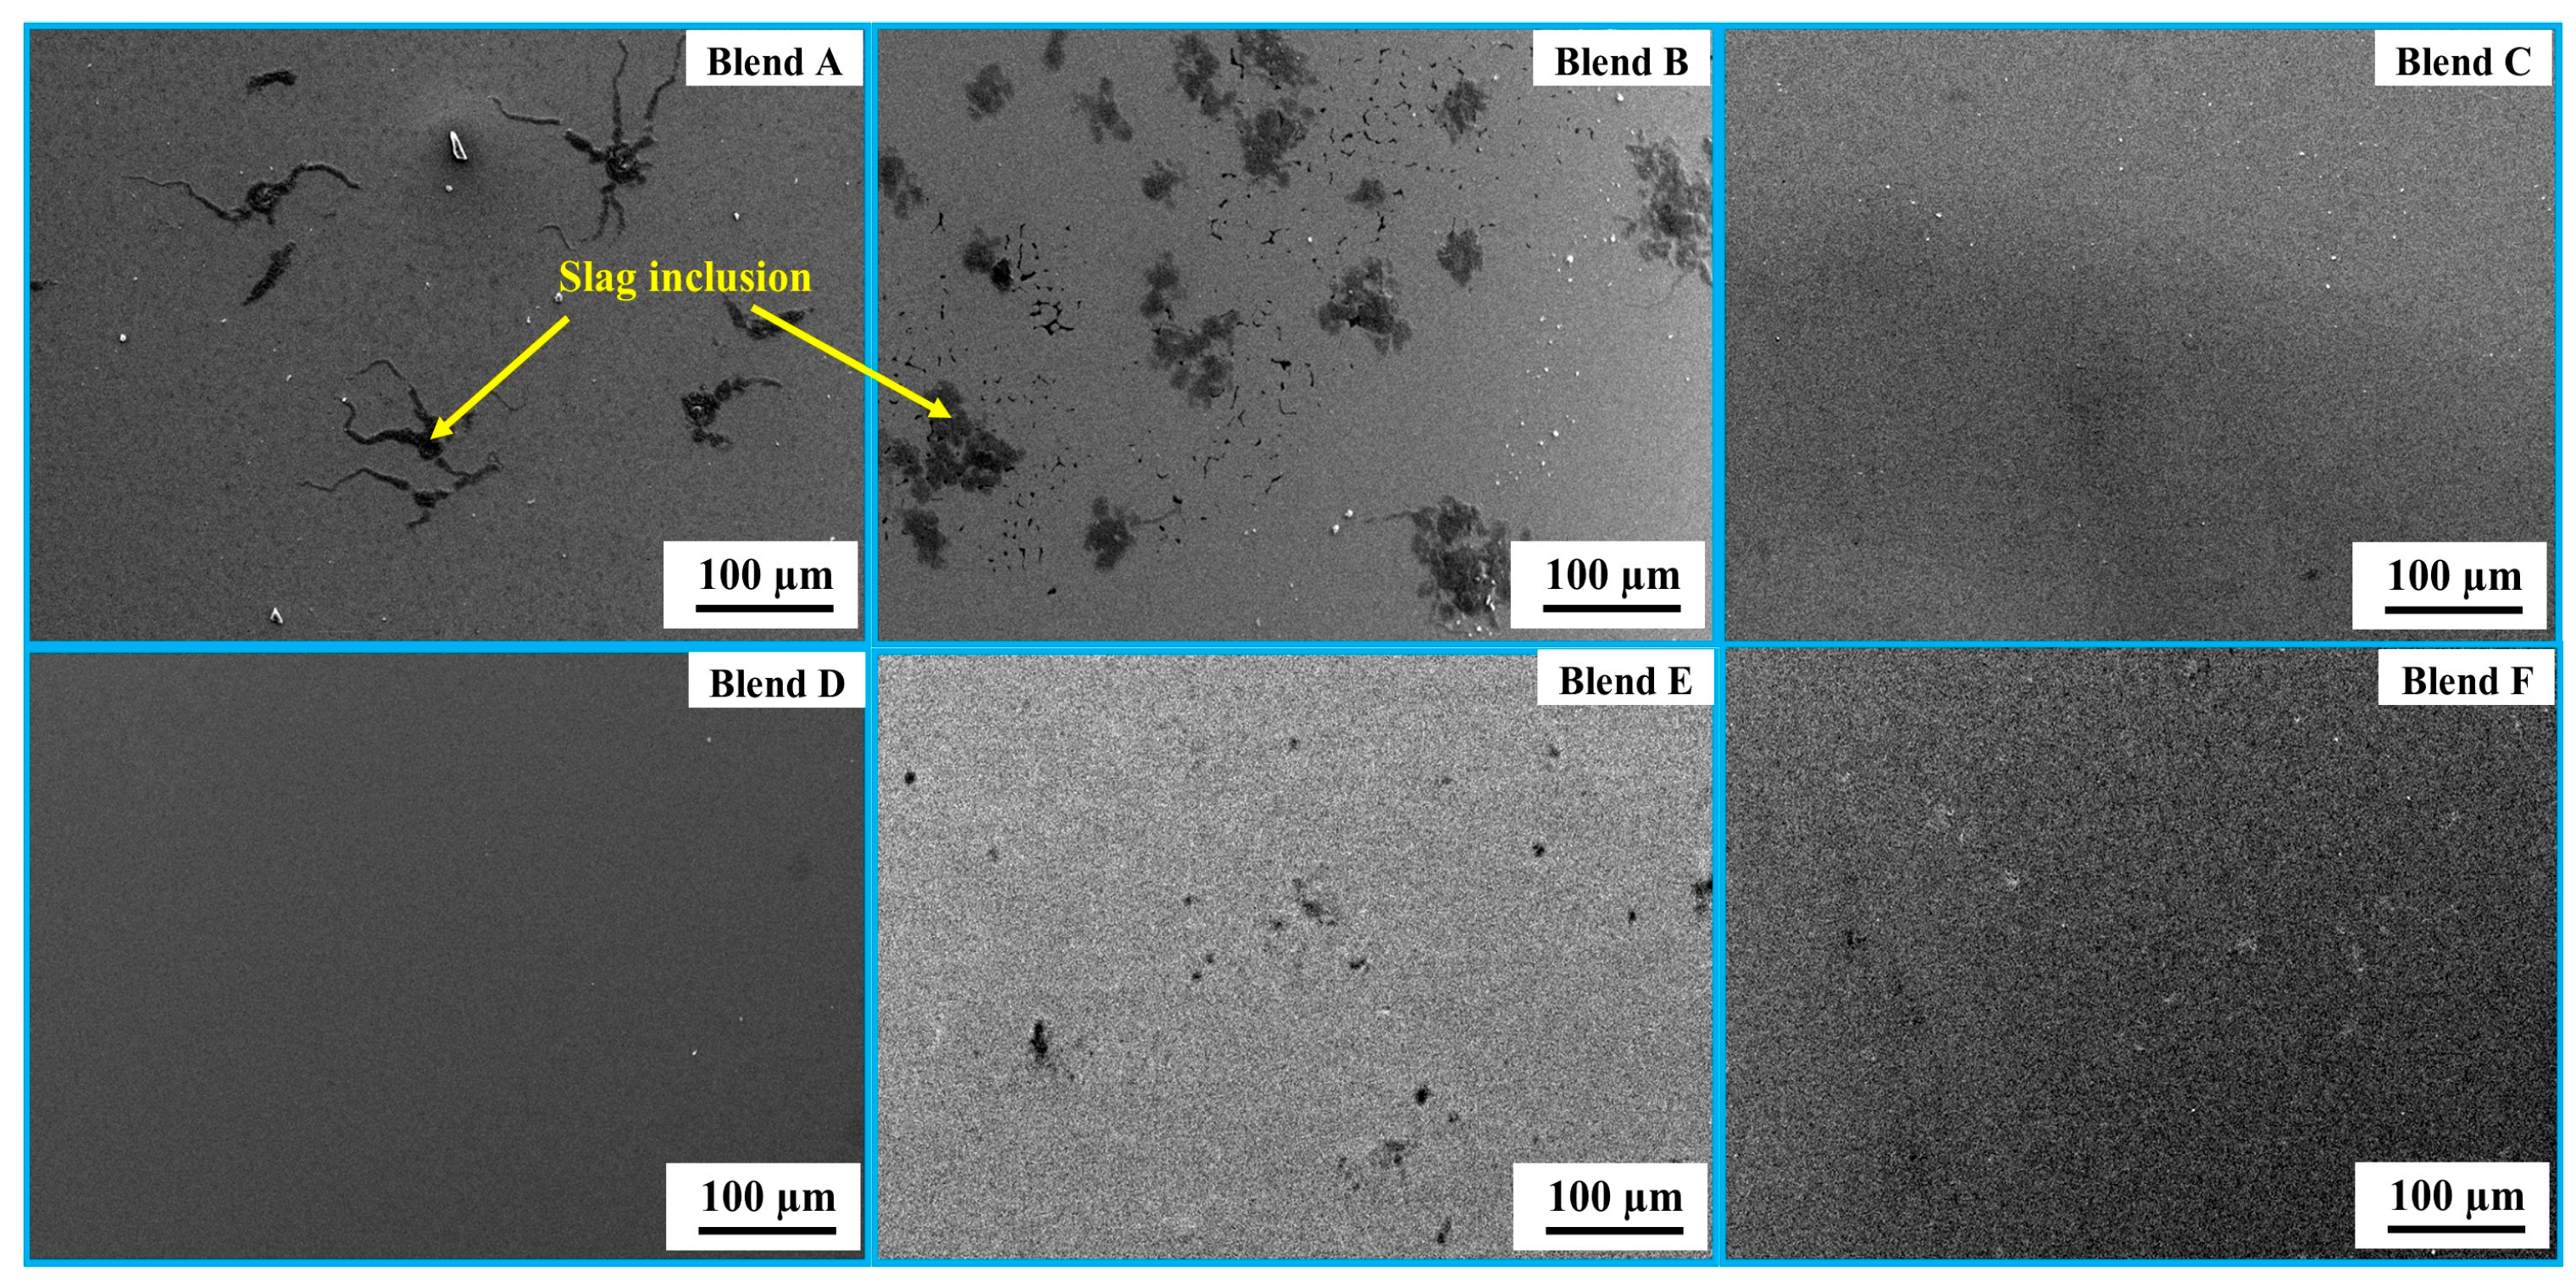
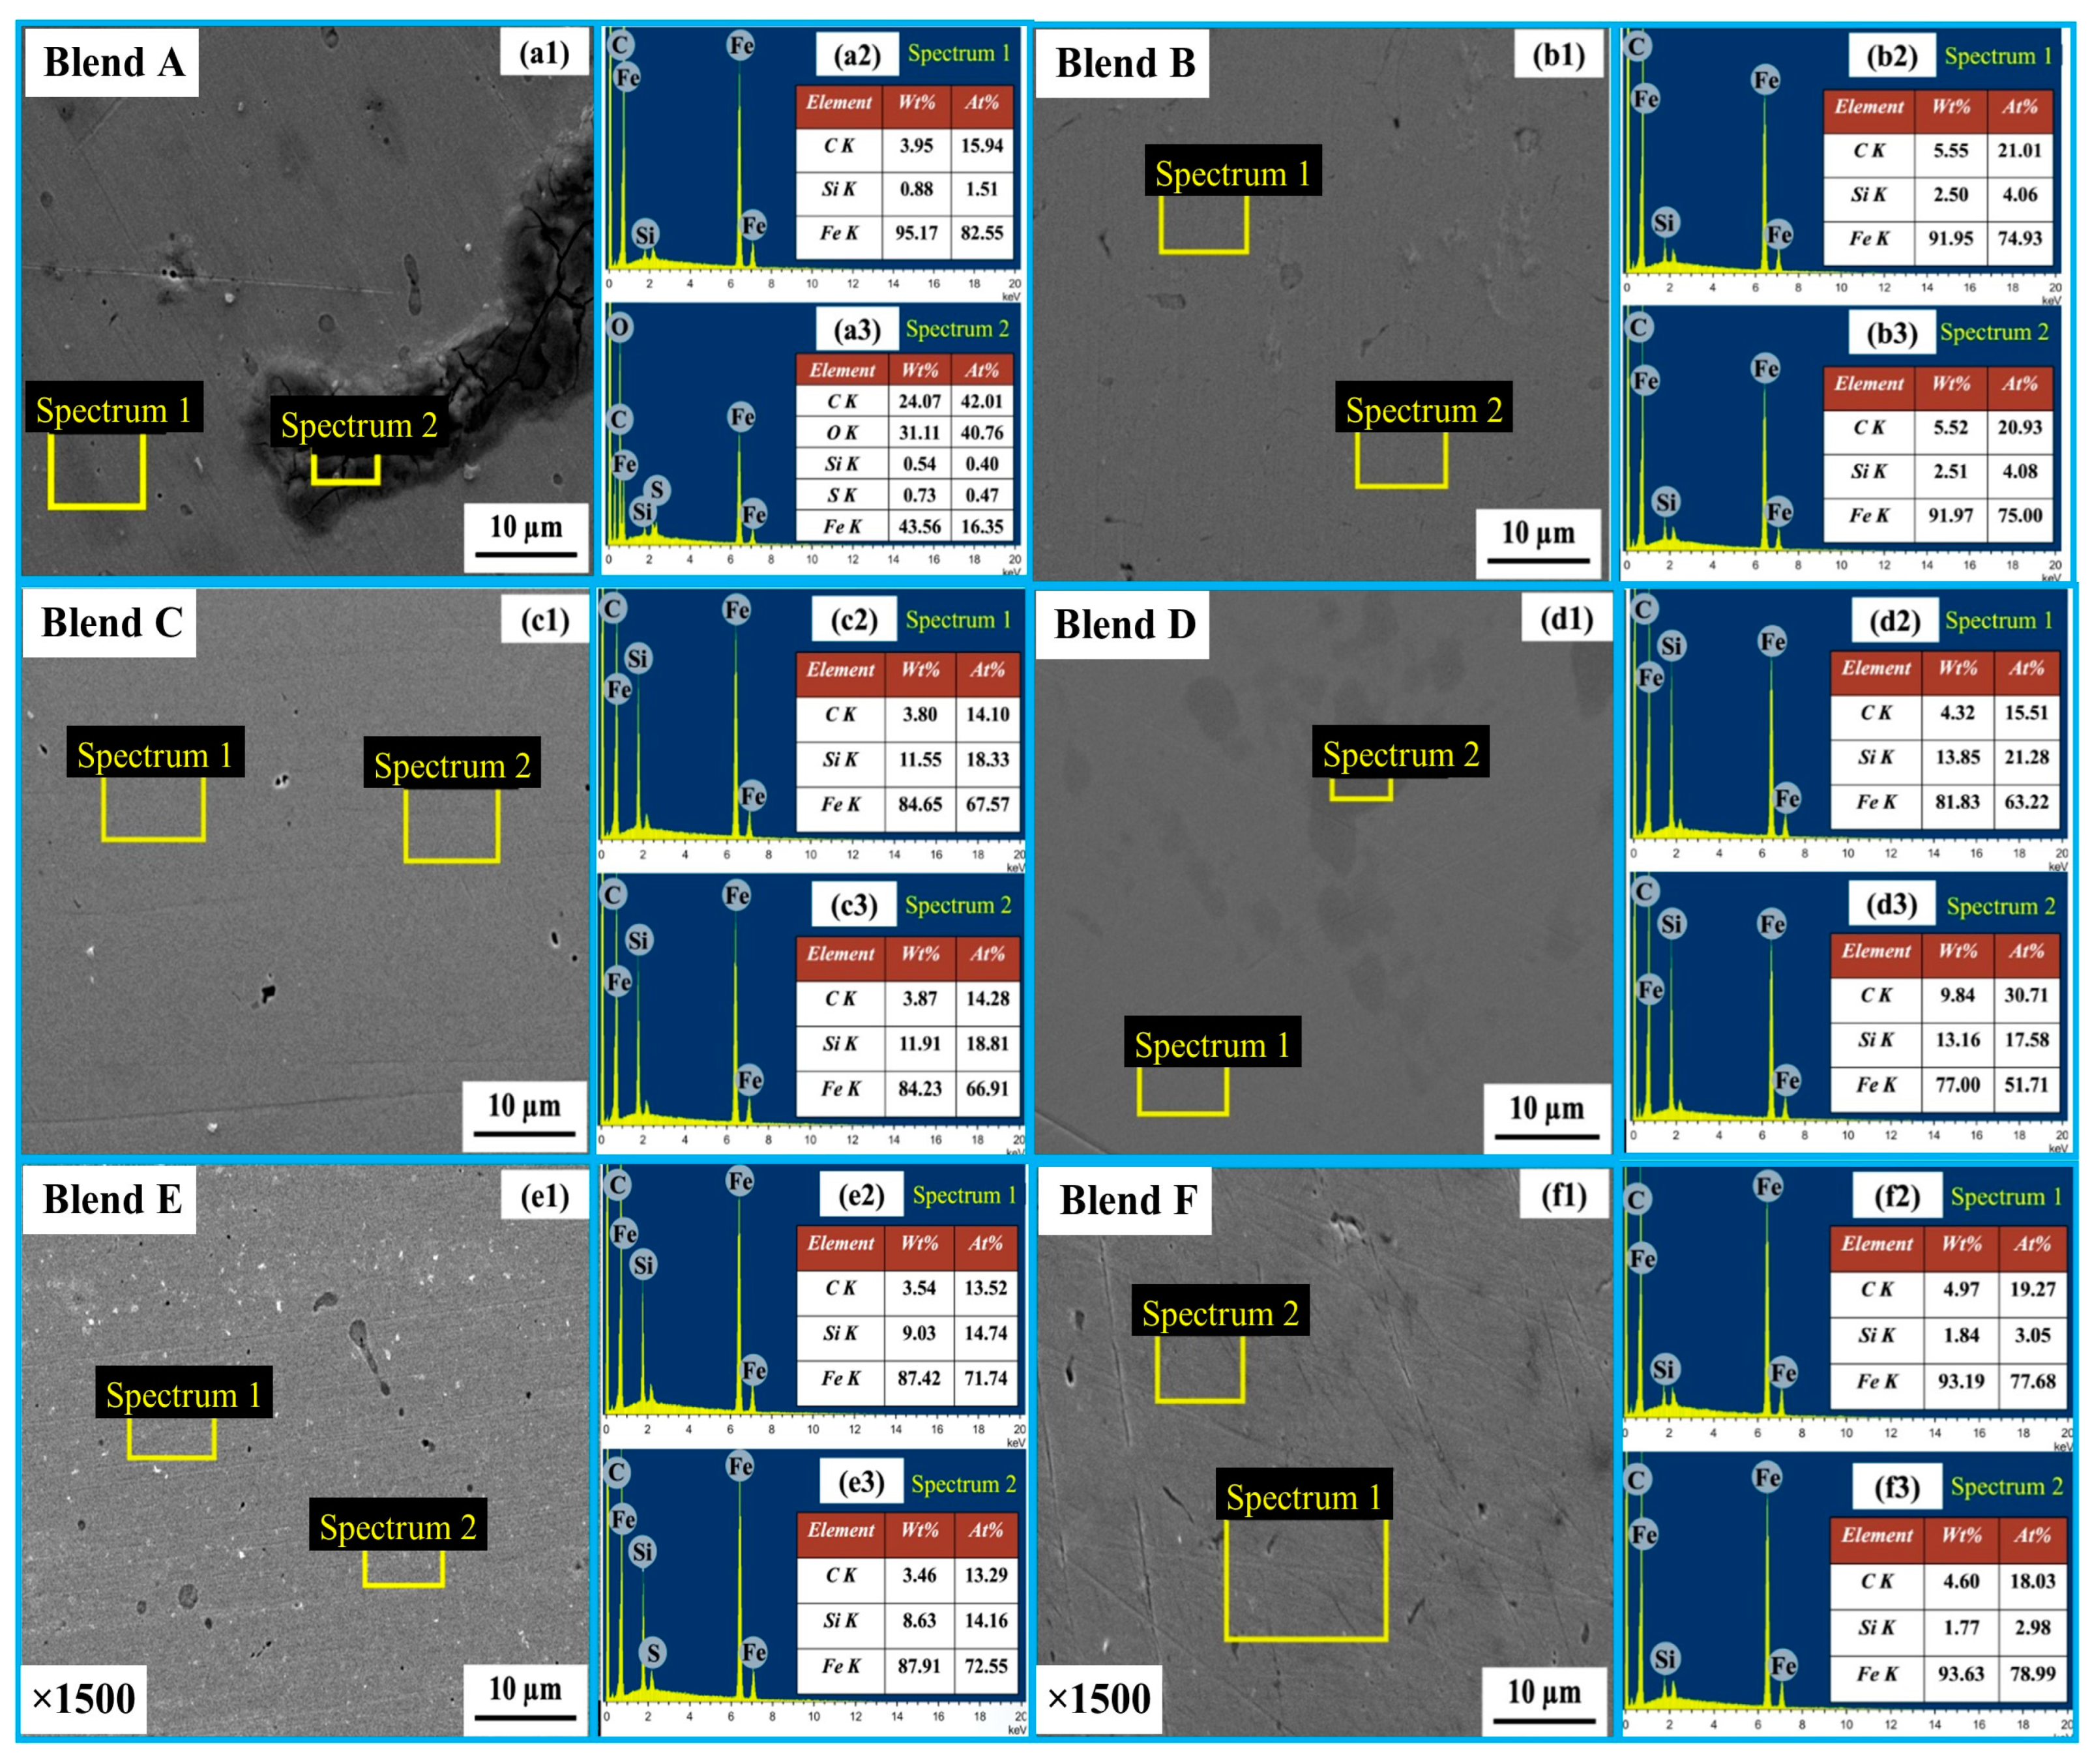
In Figure 7, SEM micrographs of the bulk metal for Blends A through F are presented at ×100 magnification. The morphology of the produced metal exhibited similarities among Blends C through F. However, it was noted that slag inclusions were present within the bulk metal in the cases of Blends A and B. Figure 8 provides magnified SEM images (×1500) of the bulk metal for Blends A through F, accompanied by EDS area analysis of the bulk metals. Observations reveal that the bulk metals primarily consist of Fe-Si-C, with no detected oxygen peaks in either case. According to the EDS analysis, the highest Si concentration in the bulk metal, reaching 13.51 wt%, was observed in Blend D. This was followed by concentrations of 11.76 wt% and 8.46 wt% for Blends C and E, respectively. SEM and EDS findings align well with results obtained from XRD analysis. The predominant component of the bulk metals is the FeSi phase, with carbon potentially existing in the form of an interstitial solid solution and SiC/Fe3C. The inclusion embraced within the bulk metal for Blends A and B is unreacted slag, which comprises a combination of Fe2O3-SiO2-S-C.

Figure 7.
SEM (×100) images of the bulk metal for Blends A–F.
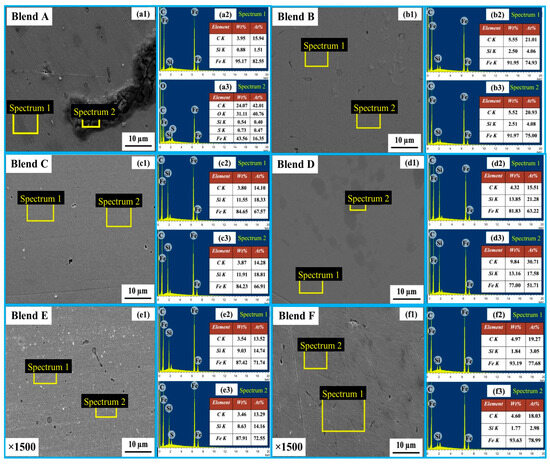
Figure 8.
SEM images (a1–f1) of the bulk metal for Blends A–F, and their corresponding EDS spectra 1 (a2–f2) and spectra 2 (a3–f3).
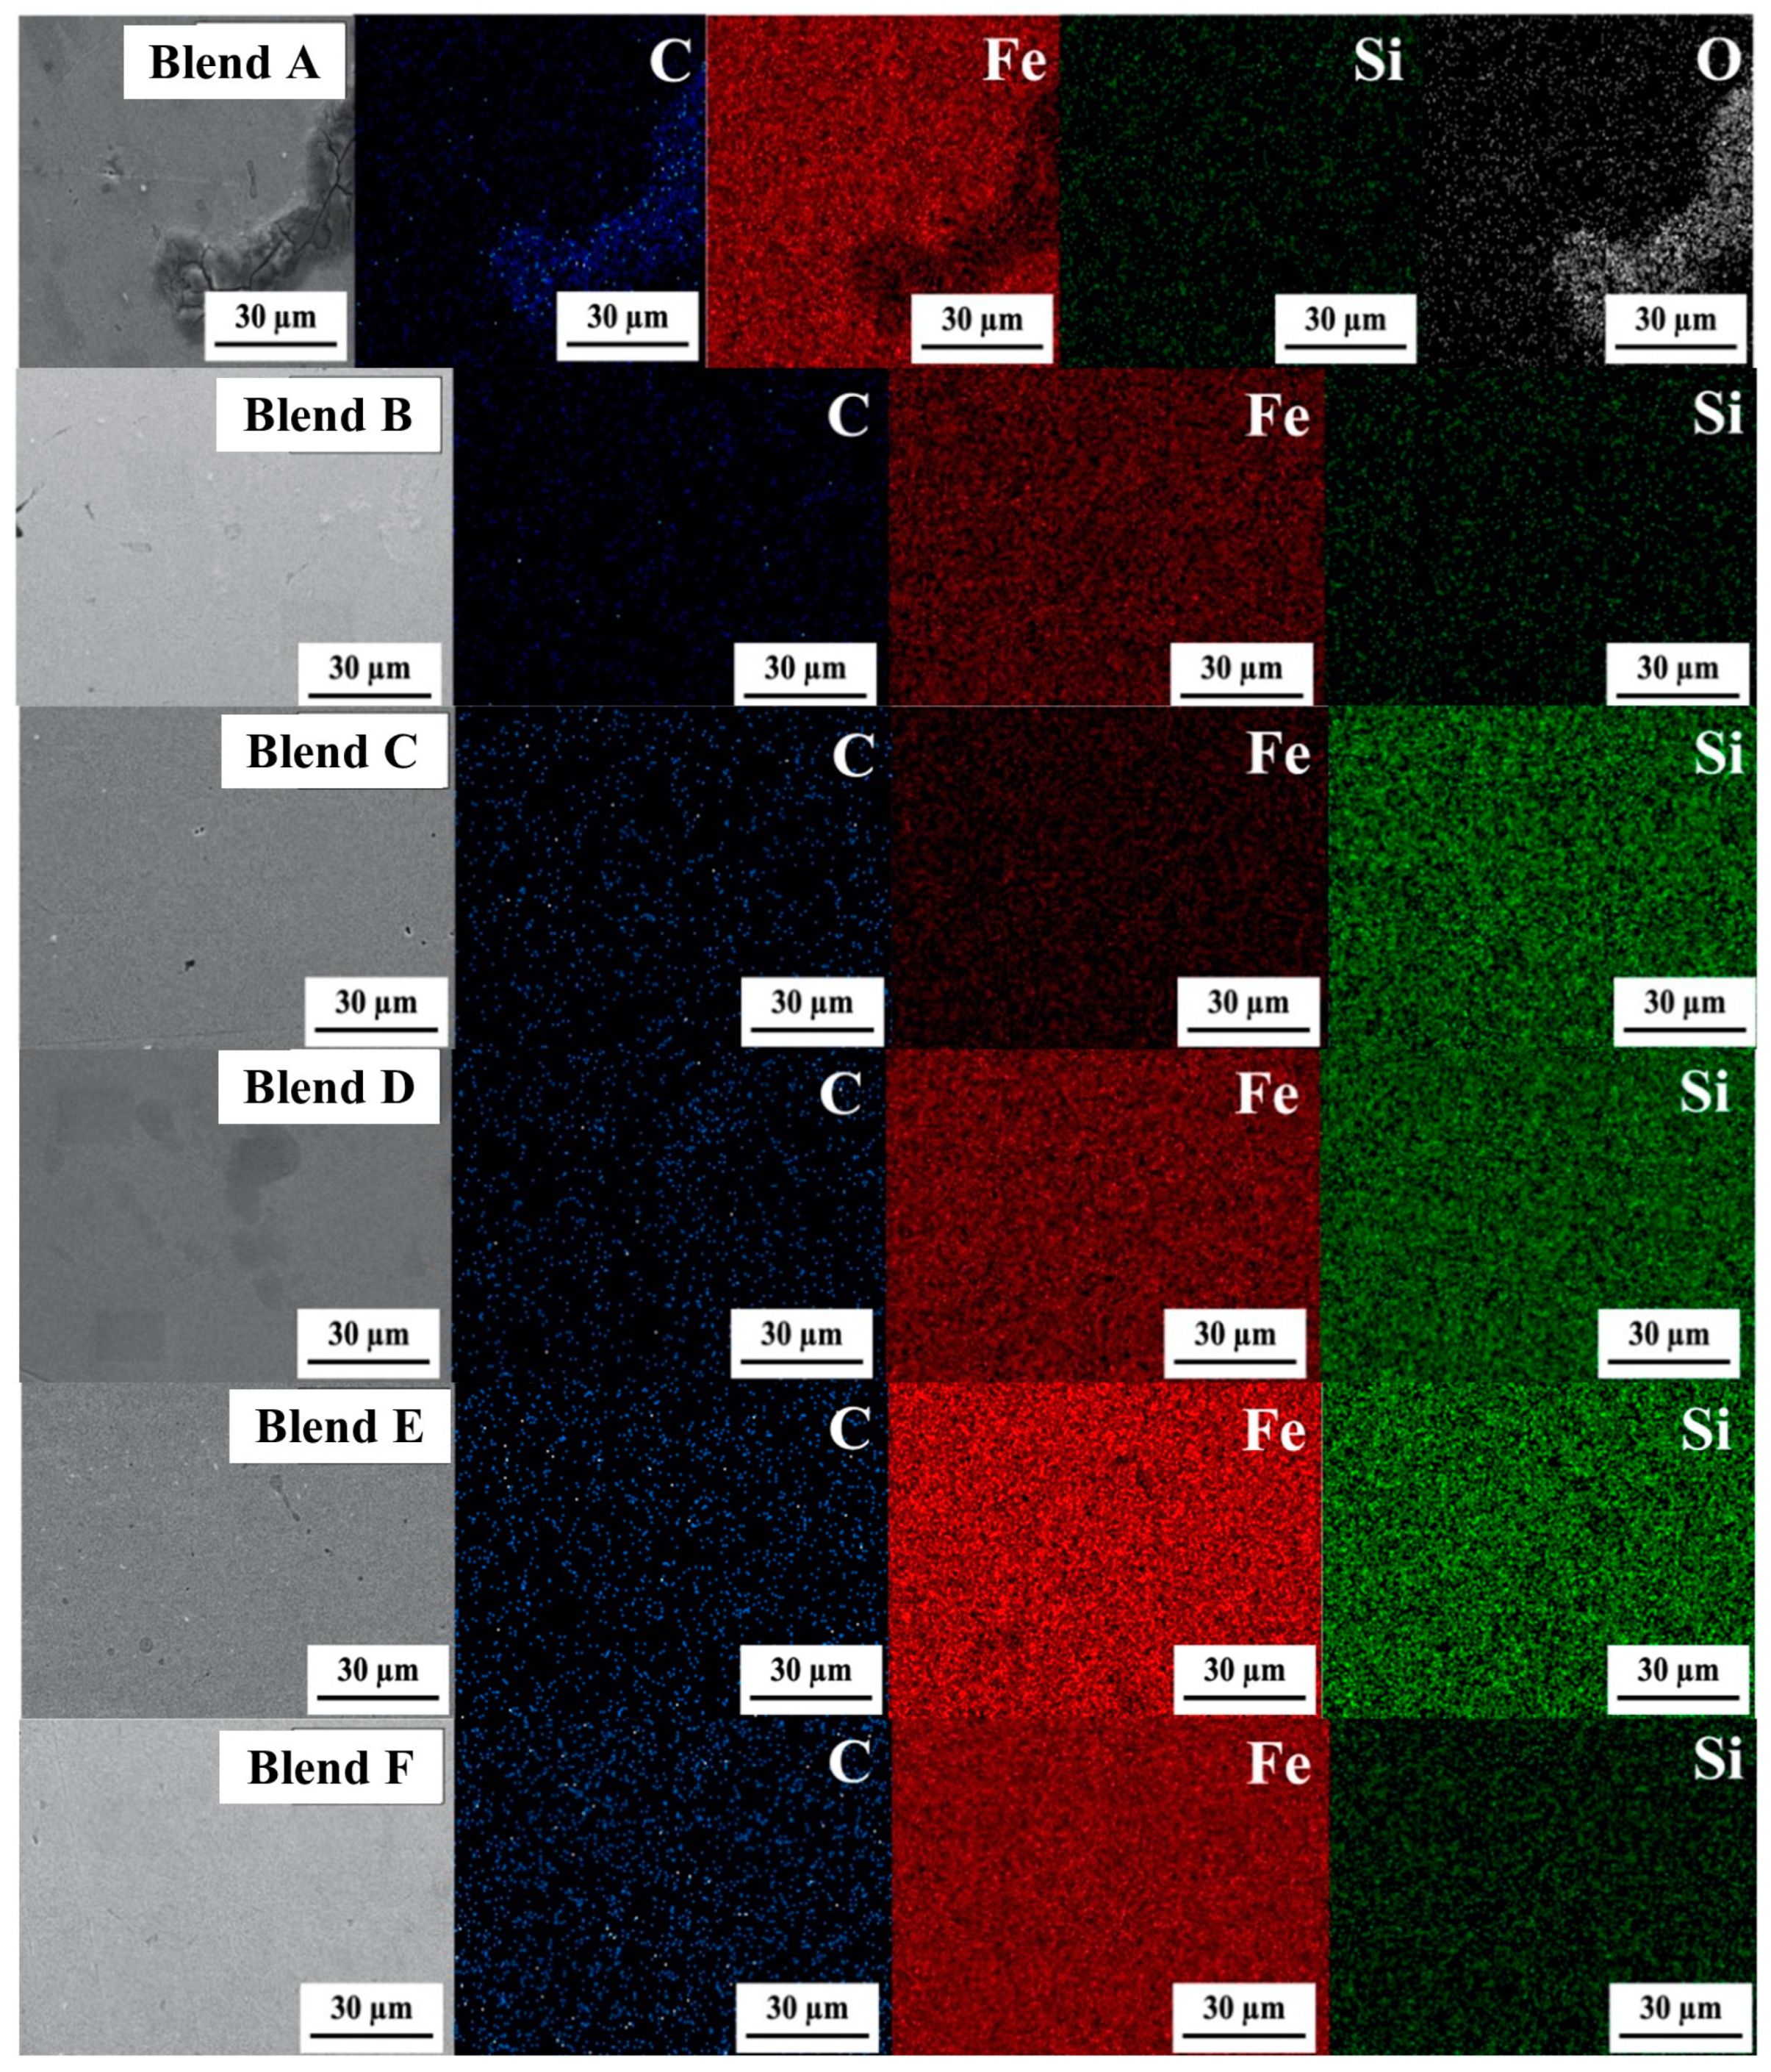
Figure 9 displays the elemental distribution in the bulk metal via SEM images and EDS elemental contour for Blends A through F. In these images, green, red, blue, and white dots represent Si, Fe, C, and O, respectively. It was observed that Si-C had distributed throughout the bulk metal alongside the Fe matrix. Particularly strong concentrations of Si were evident in the cases of Blends C through E, suggesting a more robust formation of the FeSi phase compared to the other blends.
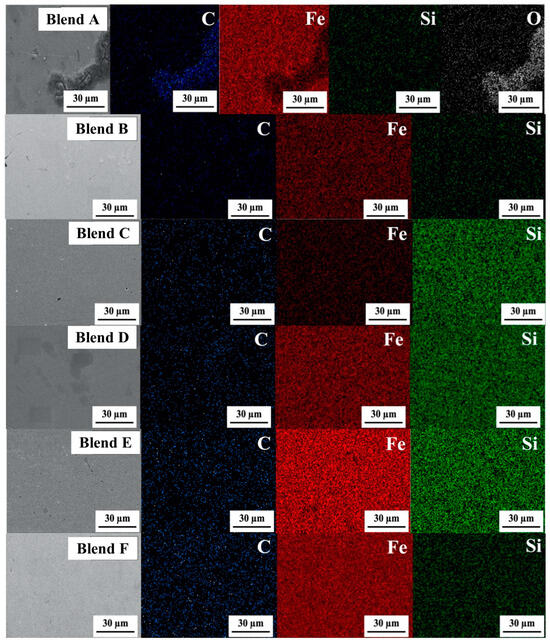
Figure 9.
SEM images (×1500) and EDS elemental contour of the bulk metal for Blends A–F.
3.4. Formation of the Produced Metals
Table 4 presents the metallic yield of the pellets following heating at 1550 °C for 1 h in an inert argon atmosphere, covering Blends A through F. The mass of raw pellets for all blends was approximately 5 g. After heating, the pellet mass ranged between 2.098 and 2.706 g, representing a mass loss of around 46.2% to 58.2% by weight. The post-heating pellet mass was determined by subtracting the mass of the empty crucible from the mass of the crucible containing the pellet. Post-heating, the pellets comprised metallic droplets and a slag layer covering the crucible surface. The metallic droplets were separated from the slag phase and subsequently cleaned in ethanol to remove any debris from the outer surface, with mass ranging from 0.836 to 1.074 g. The metallic yield was calculated based on the mass of the produced metal relative to the mass of the raw pellet input. The metal was collected manually, which could result in some errors due to human handling.
Table 4.
Mass balance of the pellets following heating at 1550 °C for 1 h in an inert argon atmosphere for Blends A–F.
Figure 10 compares the metallic yield, Si concentration, and Vickers hardness of the produced metals obtained for Blends A through F. It was observed that the metallic yield for all blends falls within the range of 16.65 wt% to 21.39 wt%, with Blends C to E exhibiting notably high metallic yields exceeding 20 wt%, and the maximum was seen in Blend D. A similar trend was observed for the Si concentration and the hardness of the produced metals. Blend D shows the highest Si concentration at 13.51 wt% (19.43 at%), followed by Blends C and E with Si concentrations of 11.76 at% (18.57 at%) and 8.46 at% (14.45 at%), respectively. For the Vickers hardness of the produced metals, Blend D also shows the maximum hardness at 649.55 HV, followed by Blends C and E with hardness values of 500.5 HV and 479.84 HV, respectively. The higher hardness of the metal from Blend D is attributed to the high silicon and carbon content in the alloy.
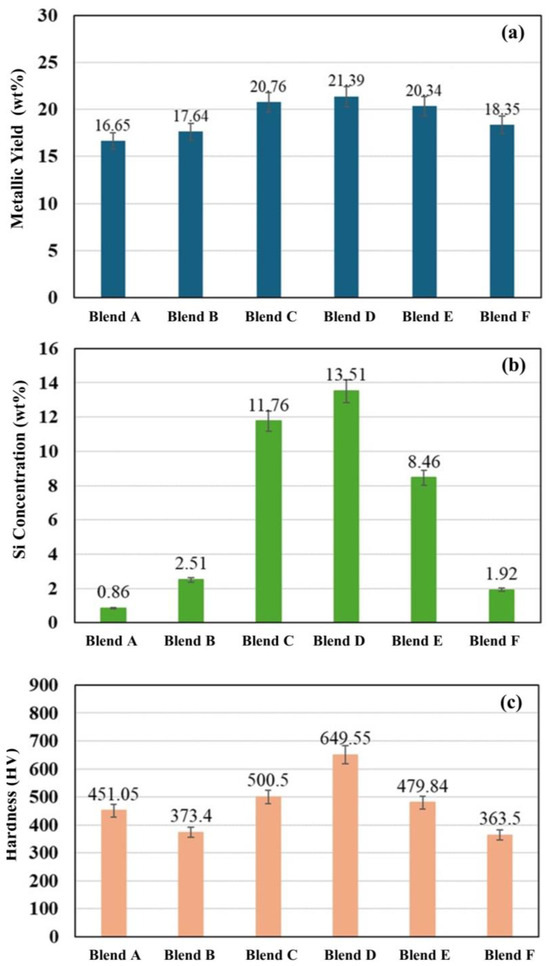
Figure 10.
(a) Metallic yield, (b) Si concentration, and (c) Vickers hardness of the produced metals for Blends A–F.
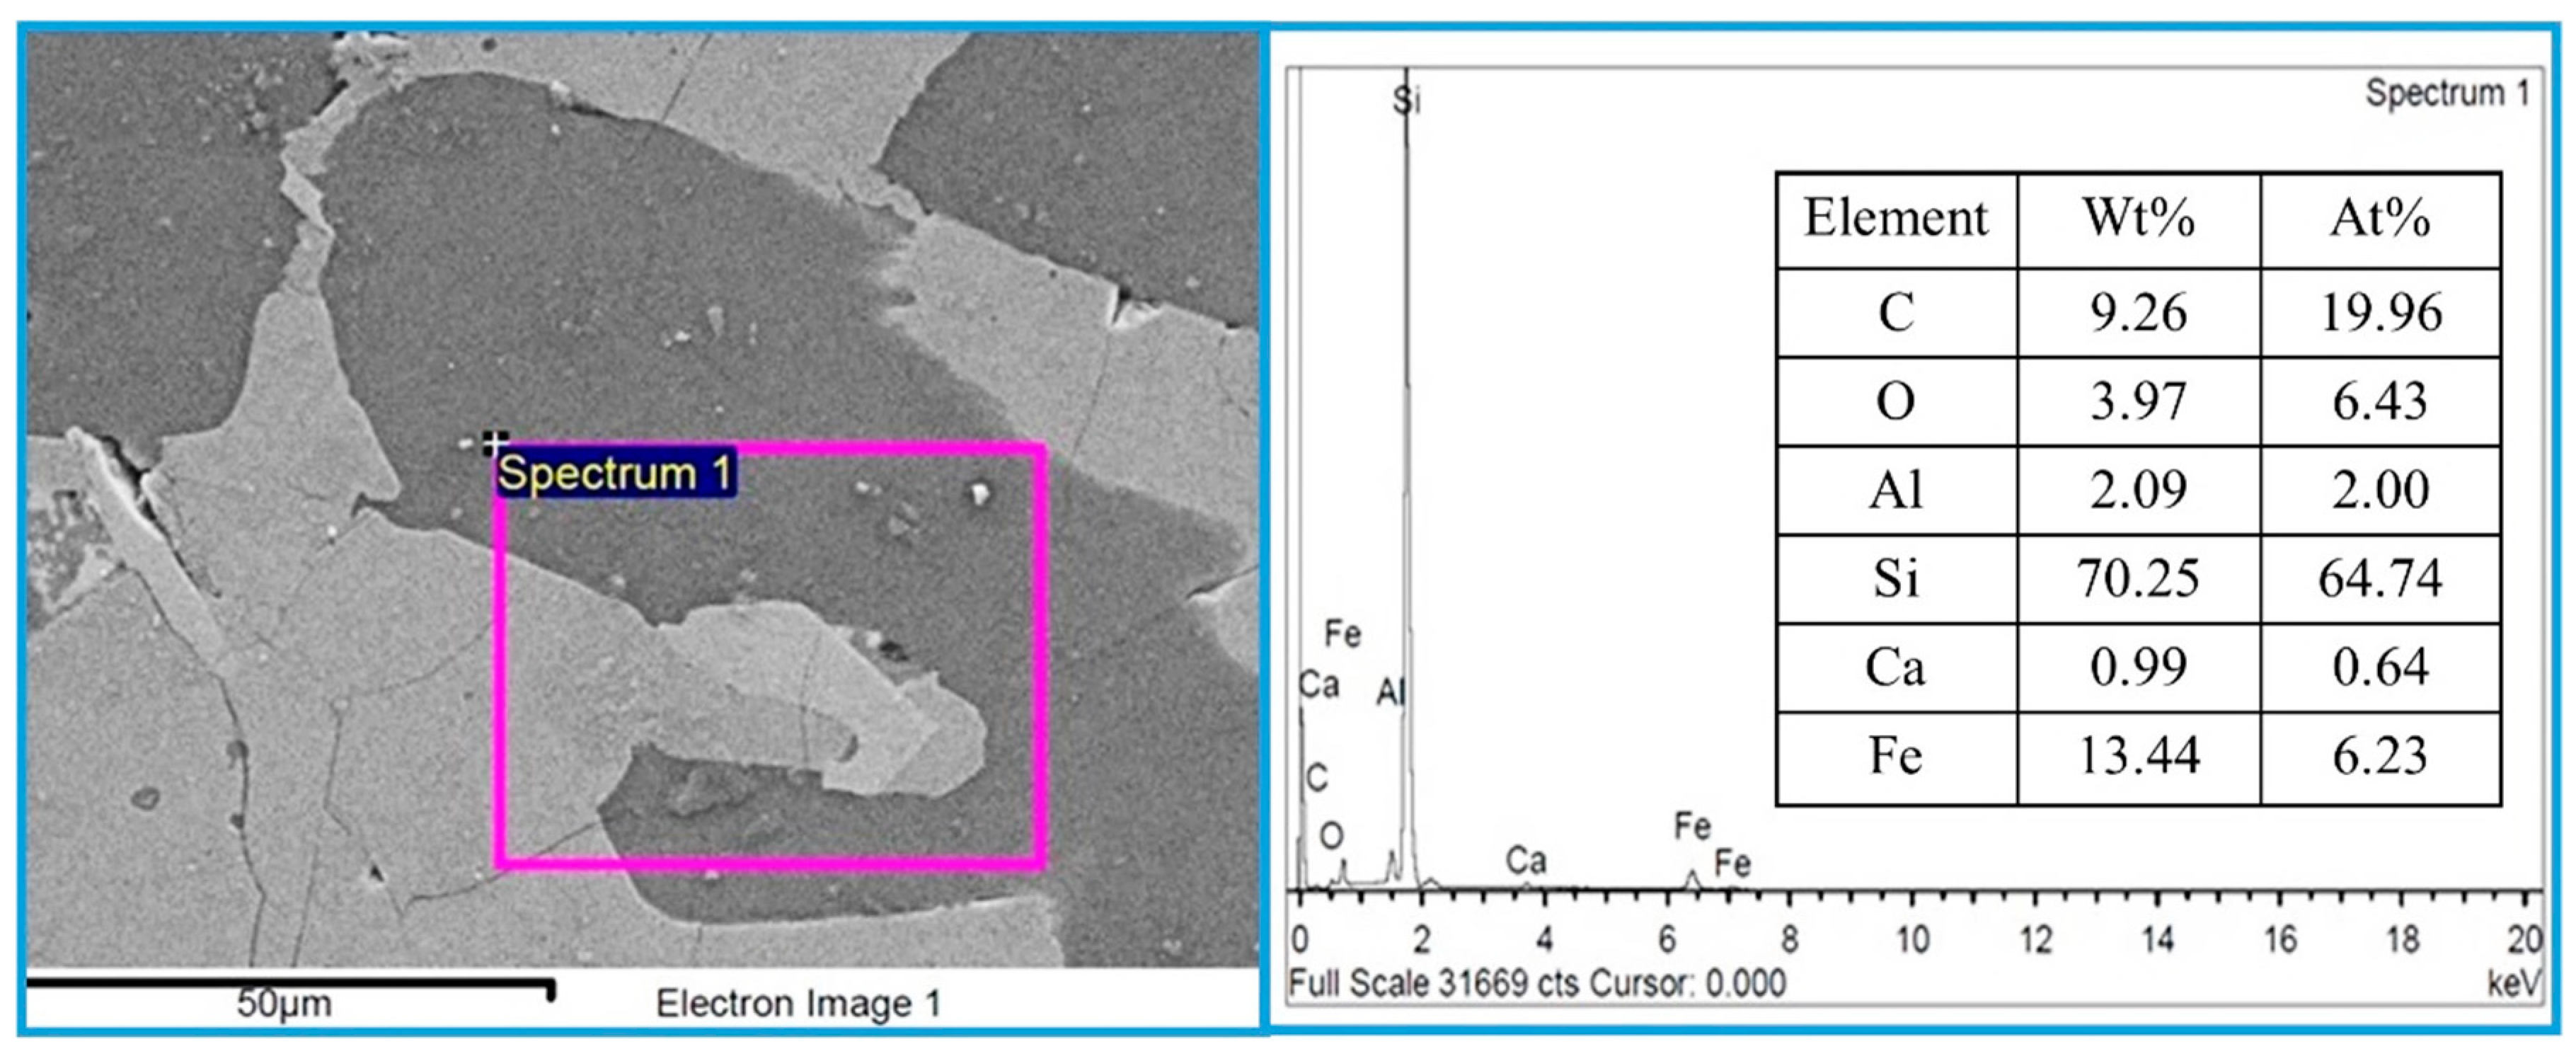
Figure 11 shows SEM and EDS analysis of the bulk metal for commercial FeSi75, which has a Si content of approximately 74–77 wt%. The commercial ferrosilicon was obtained from UMC Metal Co., Ltd., a steel mill located in Chonburi Province, Thailand. The dark gray area represents the silicon metal phase, while the light gray area indicates the FeSi/FeSi2 phases. EDS elemental analysis shows that the major component of the alloy is silicon, with a high concentration of 70.25 wt% or 64.74 at%, along with 13.44 wt% Fe. Small amounts of other elements were also detected, such as C, O, Al, and Ca. The Si concentration from the EDS results differs by about 6% from the material data sheet provided by UMC. However, the EDS results can be used to preliminarily determine the Si content in the metal. For precise determination of the Si content, the induced coupled plasma (ICP) technique is required. Unfortunately, due to the limitations of our laboratory, the ICP technique could not be conducted for the metal droplets produced in the present study.
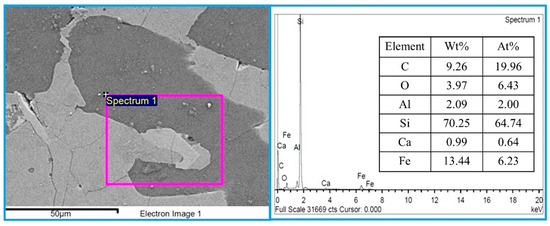
Figure 11.
SEM images and EDS analysis of the bulk metal for commercial FeSi75.
Typical ferrosilicon contains about 15–90 wt% of Si, with market grades commonly at 15, 45, 75, and 90 wt% of Si. In the present study, only Blend D contains a high Si content, falling within the range of FeSi15. The other blends contain lower Si content, indicating they consist of a mixture of FeSi and Fe phases rather than being pure FeSi. Due to its low silicon concentration, FeSi15 can be used in the manufacturing of steel and other metals, as well as in various other industrial applications. It can be utilized in the form of atomized FeSi15 powder and milled FeSi15 powder for applications in the mining sector and metal recycling [33]. The low silicon content steel can be used for electromotors, and thermoelectric materials [4,5].
3.5. Possible Factors Affecting the Formation of Ferrosilicon Alloy
The mechanism for the formation of ferrosilicon alloy involves two key steps: first, the reduction in Fe2O3 and SiO2 by solid carbon atoms to form Fe and Si phases in situ; and second, the atomic diffusion and mass transfer between the Fe and Si phases [13]. In the system of glass, mill scale, and carbon, only the carbon undergoes changes, while the glass powder and mill scale remain unchanged. Therefore, the mechanism steps for the formation of ferrosilicon alloy may be affected by properties of the carbon, such as chemical composition, degree of crystallinity, surface area, rate of gas generation, and rate of carbon dissolution into liquid metal.
The chemical composition of the carbon derived from PS/PP mixed materials is presented in Table 2, while the surface area and degree of crystallinity are shown in Figure 10. The carbon derived from PS/PP mixtures exhibits carbon contents ranging between 86 and 89.2 wt%, with small amounts of hydrogen, nitrogen, and sulfur (<1 wt%), which are not significantly different. Therefore, it was not expected to affect the mechanism steps.
From Figure 1 and Figure 2, while a high degree of crystallinity and surface area might suggest better interaction between carbon and Fe2O3 and SiO2, these trends did not correspond to the formation of ferrosilicon alloy in the present study. Interestingly, the pellets of Blends C (P3), D (P4), and E (P5) showed better performance, exhibiting higher metallic yields and Si concentration in the produced metals. Therefore, it is not expected that these factors significantly affect the mechanism steps.
The amount of CO gas produced in the system is crucial as it signifies the extent of the carbothermic reduction in SiO2 and Fe2O3, and the consequent formation of FeSi alloy. In addition, CO gas can function as an auxiliary reductant, complementing the reduction process facilitated by the derived carbon from waste PS/PP. The influence of metallurgical coke and graphite characteristics on Fe2O3 reduction, gas generation, and slag foaming was examined [34]. It was reported that coke displayed swift iron oxide reduction and high gas generation rates but exhibited poor foaming behavior. Conversely, graphite showed effective slag foaming capabilities but had a slower rate of iron oxide reduction [34]. This difference was attributed to the slower gas generation rate associated with graphite, which facilitated the entrapment of gases within the slag phase. In this study, the carbon derived from PS/PP mixtures could potentially exhibit varying CO generation behavior due to differences in reduction reactions. However, measuring the CO gas produced is not feasible in our laboratory due to limitations. PS (P1) contains ash impurities from the plastics filler, which may hinder P1 from reducing Fe2O3 and SiO2, potentially resulting in lower reduction kinetics compared to P4 [35].
The use of PS/PP as a liquid steel recarburizer in the ladle refining process was previously studied, focusing on the dissolution of carbon into liquid steel at 1550 °C from PS/PP mixtures (P1–P6) [35]. It was found that the overall carbon dissolution rates (K) for the chars ranged from 1.46 × 10⁻³ to 8.4 × 10⁻³ s−1, occurring within the first 4 to 10 min and reaching a maximum carbon content of 4.08 to 4.97 wt%. Among the PS/PP mixtures, Blend P4 (70% PS/30% PP) exhibited the optimum carbon dissolution behavior with the fastest dissolution rate (K) of 4.42 × 10⁻³ s−1 [35]. Therefore, the dissolution rate of carbon into liquid steel from the derived carbon sources (P1–P6) likely influences the formation steps of the ferrosilicon alloy. The higher rate of carbon atoms dissociating from their host lattice and transferring into the reaction zone may lead to an increased rate of ferrosilicon formation, resulting in the highest silicon concentration. This occurs because carbon atoms are capable of transferring into the liquid iron. Subsequently, solute carbon atoms have the potential to react with silicon, resulting in the formation of silicon carbide (SiC) within the bulk metal. The produced SiC could further contribute to the formation of ferrosilicon alloy. In the present study, the highest carbon dissolution rate observed for the derived carbon source P4 corresponds to the high silicon concentration and the formation of ferrosilicon from the pellet of Blend D (P4).
4. Conclusions
To reduce the consumption of natural resources and virgin materials, waste glass, mill scale, and waste plastics were utilized as sources of SiO2, Fe2O3, and carbon, respectively. The investigation focused on the formation of ferrosilicon alloy through the carbothermic reduction of the SiO2-Fe2O3-C system at 1550 °C in 1 h. The results are summarized below.
- The carbothermic reduction of glass–mill scale pellets (Blends A to F), using carbon derived from waste PS/PP (P1 to P6) as the reducing agent, can proceed at 1550 °C. The reaction produced numerous shiny metal droplets and a slag phase. The metallic yield for Blends A to F ranged from 16.65 wt% to 21.39 wt%, with Blends C to E showing notably high yields exceeding 20 wt%. The highest yield was observed in Blend D.
- XRD analysis revealed that the metal droplets consist of a ferrosilicon intermetallic compound, specifically the iron monosilicide (FeSi) phase, in all cases. The primary FeSi peak (110) was observed at a 2θ angle of approximately 45.03°, while the secondary peak (200) was observed at around 65.5°.
- SEM and EDS analysis revealed that the bulk metals primarily consist of Fe-Si-C, with no detected oxygen peaks. The highest Si concentration in the bulk metal was observed in Blend D, reaching 13.51 wt%. This was followed by concentrations of 11.76 wt% in Blend C and 8.46 wt% in Blend E.
- EDS elemental contour images confirmed that Si and C were distributed throughout the bulk metal alongside the Fe matrix. Particularly strong concentrations of Si were evident in Blends C through E, suggesting a more robust formation of the FeSi phase compared to the other blends.
- The maximum hardness of the produced metals, observed at 649.55 HV, was exhibited by Blend D, followed by Blends C and E with values of 500.5 HV and 479.84 HV, respectively. This trend reflects the higher silicon and carbon content in the alloy from Blend D, contributing to its increased hardness.
- In the system involving glass, mill scale, and carbon, the formation of FeSi can proceed directly through the diffusion/dissolution of solute Si atoms from the reaction zone into the liquid Fe matrix, facilitated by the interaction between SiC and liquid Fe. The mechanism steps for the formation of ferrosilicon alloy may be influenced by the rate of carbon dissolution into the liquid metal.
- In the present study, the optimal condition for producing ferrosilicon alloy using waste glass, mill scale, and plastics is achieved with Blend D, which uses a PS/PP mixture at a 70/30 weight ratio (P4) as the reducing agent. Waste PS/PP can completely replace fossil fuels as a reductant in this process. Higher purity of the final product can be obtained by using derived carbon as the reductant instead of fossil fuels.
Author Contributions
Conceptualization, methodology, investigation, writing—original draft, S.K.; investigation, methodology, S.A.; investigation, methodology, P.W. All authors have read and agreed to the published version of the manuscript.
Funding
The funding for this project was provided by Thammasat University Research Fund, Contract No. TUFT 10/2565.
Data Availability Statement
The original contributions presented in the study are included in the article, further inquiries can be directed to the corresponding author.
Acknowledgments
This study was supported by Thammasat University Research Fund, Contract No. TUFT 10/2565.
Conflicts of Interest
The authors declare no conflict of interest.
References
- Okamoto, H. (Ed.) Desk Handbook Phase Diagrams for Binary Alloys, 2nd ed.; ASM International: Materials Park, OH, USA, 2010; p. 389. [Google Scholar]
- Gouttebroze, S.; Marthinsen, A.; Kroka, B.; Götz, A.; Ott, E. Modelling of major phases formation during solidification of Ferro Silicon-Magnesium. IOP Conf. Ser. Mater. Sci. Eng. 2023, 1281, 012052. [Google Scholar] [CrossRef]
- Gasik, M. Handbook of Ferroalloys Theory and Technology; Elsevier: Amsterdam, The Netherlands, 2013; pp. 3–4. ISBN 978-0-08-097753-9. [Google Scholar]
- Yoshisato, K.; Masashi, Y.; Yaw, W.C. Thermoelectric properties of nearly single-phase ꞵ-FeSi2 alloys fabricated by gas-atomized powder sintering. Mat. Trans. 2019, 60, 652–661. [Google Scholar]
- Kiatgamolchai, S.; Sakulkalavek, A. Distribution of elements in a Cu-Added FeSi2 alloy under peritectoid and eutectoid reactions. J. Electron. Mater. 2011, 40, 1029–1034. [Google Scholar] [CrossRef]
- Yamadaa, H.; Katsumata, H.; Yuasa, D.; Uekusa, S.; Ishiyama, M.; Souma, H.; Azumaya, I. Structural and electrical properties of ȕ-FeSi2 bulk materials for thermoelectric applications. Phys. Procedia 2012, 23, 13–16. [Google Scholar] [CrossRef]
- Cherigui, M.; Guessasma, S.; Fenineche, N.; Hamzaoui, R.; El-Kedimb, O.; Coddet, C. Studies of magnetic properties of iron-based coatings produced by a high-velocity oxy-fuel process. Mater. Chem. Phys. 2005, 92, 419–423. [Google Scholar] [CrossRef]
- Piamba, J.F.; Ortega, C.; Hernández-Bravo, R.; González Carmona, J.M.; Tabares, J.A.; Pérez Alcázar, G.A.; Alvarado-Orozco, J.M. Theoretical and experimental study of FeSi on magnetic and phase properties. Appl. Phys. A 2020, 126, 849. [Google Scholar] [CrossRef]
- Available online: https://www.grandviewresearch.com/industry-analysis/ferrosilicon-market# (accessed on 16 June 2024).
- Kopeć, G.; Przeliorz, R. Usefulness of Quartzites for the Production of Ferrosilicon. Solid State Phenom. 2015, 226, 111–114. [Google Scholar]
- Buo, T.V.; Gray, R.J.; Patalsky, R.M. Reactivity and petrography of cokes for ferrosilicon and silicon production. Int. J. Coal Geol. 2000, 43, 243–256. [Google Scholar]
- Available online: https://patents.google.com/patent/CN102517446A/en (accessed on 15 May 2024).
- Kongkarat, S.; Boonyaratchinda, M.; Chobtham, C. Formation of ferrosilicon alloy at 1550 °C via carbothermic reduction of SiO2 by coal and graphite: Implication for rice husk ash utilization. Solid State Phenom. 2021, 315, 16–24. [Google Scholar]
- Boonyaratchinda, M.; Kongkarat, S. Fundamental investigation of ferrosilicon production using rice husk and rubber tree bark at 1550 °C: Implication for utilization of agricultural waste in steelmaking industry. Mater. Sci. Forum. 2020, 977, 171–177. [Google Scholar]
- Farzana, R.; Rajarao, R.; Sahajwalla, V. Characteristics of waste automotive glasses as silica resource in ferrosilicon synthesis. Waste Manag. Res. 2016, 34, 113–121. [Google Scholar] [CrossRef] [PubMed]
- Farzanz, R.; Rajarao, R.; Sahajwalla, V. Synthesis of ferrosilicon alloy using waste glass and Plastic. Mat. Lett. 2014, 116, 101–103. [Google Scholar] [CrossRef]
- Ikram-Ul-Haq, M.; Mukherjee, P.S.; Khanna, R. Formation of light-weight ferroalloys in the Fe2O3-Al2O3-C system at 1550 °C: Influence of silica impurities. Metals 2017, 7, 391. [Google Scholar] [CrossRef]
- Chen, H.; Yu, W.; Jiang, W.; Jiang, W.; Wei, P.; Nyarko-Appiah, J.E. Fe-Si alloys production and alumina extraction from coal fly ash via the vacuum thermal reduction and alkaline leaching. Fuel Process. Technol. 2023, 224, 107702. [Google Scholar] [CrossRef]
- Wang, Y.; Zhang, Z.; Li, L.; Guo, Z.; Wei, D.; Kong, J.; Du, H.; Wang, H.; Zhuang, Y.; Xing, P. A novel process to recycle coal gasification fine slag by preparing Si-Fe-Al-Ca alloy. J. Environ. Manag. 2023, 337, 117681. [Google Scholar] [CrossRef] [PubMed]
- Hu, J.B.; Li, Y.B.; Wu, K.D.; Liu, F.; Zhu, Q.; Li, Y.W. The Exploration on Synthesis of Calcium Aluminate and Fe-Si Alloys Using Red Mud and Aluminum Dross. Adv. Mater. Res. 2010, 97, 1104–1108. [Google Scholar]
- Grudinsky, P.; Zinoveev, D.; Kondratiev, A.; Delitsyn, L.; Kulumbegov, R.; Lysenkov, A.; Kozlov, P.; Dyubanov, V. Reduction Smelting of the Waelz Slag from Electric Arc Furnace Dust Processing: An Experimental Study. Crystals 2023, 13, 318. [Google Scholar] [CrossRef]
- Shevko, V.M.; Aitkulov, D.K.; Badikova, A.D.; Tuleyev, M.A. Ferroalloy production from ferrosilicon manganese dusts. Complex Use Miner. Resour. 2024, 318, 43–50. [Google Scholar] [CrossRef]
- Etemadi, A.; Koohestani, H.; Tajally, M. The effect of different carbon reductants on the production of ferrosilicon 75% on an industrial scale in an electric arc furnace. Heliyon 2023, 9, e13956. [Google Scholar] [CrossRef]
- Nurpeisova, A.; Shevko, V.; Aitkulov, D.; Kushakova, L. Optimization of the electrothermal production of ferrosilicon from the leaching tailings of the oxidized copper ore of Almaly. Eng. J. Satbayev. Univ. 2023, 145, 19–24. [Google Scholar] [CrossRef]
- Grigorova, D. Ferrosilicon production method using sintered iron silicate—Fayalite. Metalurgija 2023, 62, 15–18. [Google Scholar]
- Blaesing, L.; Walnsch, A.; Hippmann, S.; Modrzynski, C.; Weidlich, C.; Pavón, S.; Bertau, M. Ferrosilicon Production from Silicon. Wafer Breakage and Red Mud. ACS Sustain. Resour. Manag. 2024, 1, 404–416. [Google Scholar] [CrossRef]
- Dankwah, J.R.; Koshy, P.; Saha-Chaudhury, N.; O’Kane, P.; Skidmore, C.; Knights, D.; Sahajwalla, V. Reduction of FeO in EAF steelmaking slag by metallurgical coke and waste plastics blends. ISIJ Int. 2011, 51, 498–507. [Google Scholar] [CrossRef]
- Dankwah, J.R.; Koshy, P.; O’Kane, P.; Sahajwalla, V. Reduction of FeO in EAF steelmaking slag by blends of metallurgical coke and end-of-life tyre. Steel Res. Int. 2012, 83, 766–774. [Google Scholar] [CrossRef]
- Sheshukov, O.; Mikheenkov, M.; Vedmid’, L.; Nekrasov, I.; Egiazaryan, D. Mechanism of Ion-Diffusion Solid-Phase Reduction of Iron Oxides of Technogenic Origin in the Presence of the Liquid Phase and without it. Metals 2020, 10, 1564. [Google Scholar] [CrossRef]
- Khanna, R.; Konyukhov, Y.V.; Ikram-ul-hag, M.; Burmistrov, I.; Cayumil, R.; Belov, V.A.; Rogachev, O.; Leybo, D.V.; Mukherjee, P.S. An innovative route for velarizing iron and aluminium oxide rich industrial wastes: Recovery of multiple metals. J. Environ. Manag. 2021, 295, 113035. [Google Scholar] [CrossRef]
- Liu, C.; Yuan, Y.; Jiang, J.T.; Gong, Y.X.; Zhen, L. Microwave absorption properties of FeSi flaky particles prepared via a ball-milling process. J. Magn. Magn. Mater. 2015, 395, 152–158. [Google Scholar] [CrossRef]
- Banerjee, P.; Kumar, N.S.; Franco, A.; Swain, A.K.; Naidu, K.C.D. Insights into the dielectric loss mechanism of bianisotropic FeSi/SiC composite materials. ACS Omega. 2020, 5, 25968–25972. [Google Scholar] [CrossRef]
- Available online: https://dataintelo.com/report/global-fesi15-market/ (accessed on 15 May 2024).
- Rahman, M.; Khanna, R.; Sahajwalla, V.; O’Kane, P. The Influence of Ash Impurities on Interfacial Reactions between Carbonaceous Materials and EAF Slag at 1550 °C. ISIJ Int. 2009, 49, 329–336. [Google Scholar] [CrossRef]
- Singsai, S.; Kongkarat, S. Utilization of polymeric wastes in steel refining process: Carbon Dissolution into liquid steel at high temperature. Heliyon. 2023, 9, E13328. [Google Scholar] [CrossRef]


Disclaimer/Publisher’s Note: The statements, opinions and data contained in all publications are solely those of the individual author(s) and contributor(s) and not of MDPI and/or the editor(s). MDPI and/or the editor(s) disclaim responsibility for any injury to people or property resulting from any ideas, methods, instructions or products referred to in the content. |
© 2024 by the authors. Licensee MDPI, Basel, Switzerland. This article is an open access article distributed under the terms and conditions of the Creative Commons Attribution (CC BY) license (https://creativecommons.org/licenses/by/4.0/).