Abstract
Vanadium–aluminum alloy is an important intermediate alloy for preparing aviation grade titanium alloys, and its product quality directly affects the finished product quality of titanium alloys. In this study, focusing on the problems of high powder content (19.8%) and low product yield in AlV55 alloy products, we conduct research on alloy quality control technology and implement a vanadium–aluminum alloy cooling crystallization control process. The research results indicate that there are three phases in AlV55 alloy, namely Al8V5, AlV, and Al2V3 phases. As the temperature decreases, the AlV phase gradually decomposes into Al8V5 phase and Al2V3 phase, and the proportion of Al8V5 phase is positively correlated with the fineness. Rapid cooling can reduce the formation of Al8V5 phase. The experimental results show that high-temperature water quenching can increase the proportion of vanadium–aluminum solid solution phase in the alloy from 19.03% to 31.76%, and reduce the fine powder rate to 13.2%, providing important product quality control means and technical support for the production of vanadium–aluminum alloys.
1. Introduction
Titanium alloys possess excellent chemical, physical, and mechanical properties, and are widely used in chemical, medical, automotive, aircraft, and other fields. The vanadium-containing titanium alloys Ti-6Al-4V [1,2,3,4] and Ti-8Al-1Mo-1V [5,6,7] are primarily used in the construction materials for aircraft frames and engines, and account for about half of the titanium alloy market. In the preparation process of vanadium-containing titanium alloys, vanadium source, i.e., vanadium–aluminum alloy, is added into the titanium metal by melting vanadium–aluminum alloy and titanium metal together. The quality of vanadium–aluminum alloy directly affects the properties of vanadium-containing titanium alloys. Excellent purity and uniform composition are key factors for a vanadium-aluminum master alloy to prepare vanadium-containing titanium alloys which have optimized properties and application performance.
Vanadium–aluminum alloys have a number of compositions, including AlV55, AlV65, and AlV85 alloys (representing the mass fraction of vanadium in vanadium–aluminum master alloy are 50~60%, 60~70%, and 80~90%, respectively). In China, AlV55 alloy (with vanadium mass fraction of 57.5~59.5%) is usually used to prepare Ti-6Al-4V [8,9,10]. The production methods of AlV55 alloy include the aluminothermic method, two-step method, electric heating method (electro-aluminothermic method), etc. [11]. The aluminothermic method has low equipment requirements and is easy to operate, but the products produced with this method may have relatively lower quality because defects can form due to the impurities and oxidation [12,13,14,15]. In the two-step method [16,17], AlV65 alloy is prepared first by using the aluminothermic method, and then AlV55 alloy is produced by adding Al to AlV65 alloy in an induction vacuum furnace [18,19]. The electro-aluminothermic method is based on the one-step aluminothermic method with heating electrodes to control the temperature of the smelting system. This has certain advantages in alloy quality and yield.
AlV65 and AlV55 alloys both have Al8V5 phase and Al2V3 phase [20,21,22,23,24]. The Al2V3 is a hard phase and Al8V5 is a brittle phase. During the cooling process, micro-cracks appear easily in large areas of Al8V5 phase due to the influence of stress. In AlV65 alloy, Al2V3 forms the continuous matrix phase, and Al8V5 exists as dispersed point phase in the matrix. Such phase structure makes AlV65 alloy have few microscopic cracks and fractures, and therefore, the alloy produced during processing is much less in the form of fine powder. However, in AlV55 alloy, Al8V5 phase exists as the matrix phase, Al2V3 phase is the dispersed point phase in the matrix. Previous studies have shown that there exist large a number of microscopic cracks in the Al8V5 phase matrix, making the AlV55 alloy prone to form a large amount of fine powder unqualified products (the normal particle size of AlV55 alloy products is 1–6 mm, and products with a particle size less than 1 mm or greater than 6 mm are considered unqualified) during crushing processing, which seriously affects the yield of AlV55 alloy. It is known that AlV55 alloy itself has a variety of phases with different vanadium contents [25,26,27]. It is believed that a reduction of the proportion of Al8V5 phase in AlV55 alloy is beneficial to the overall performance of the alloy, but there have been few reports on the corresponding research [28,29,30]. The aim of this work is to investigate the favorable phase transformation conditions of AlV55 alloy to minimize Al8V5 phase in AlV55 alloy.
2. Experimental
2.1. Raw Materials
The vanadium–aluminum alloy AlV55 (Pangang Group Vanadium & Titanium Resources Co., Ltd., Panzhihua, China) was provided by an industrial source. The alloy samples were crushed into particles with sizes in the range of 1–6 mm. The chemical composition of the alloy is shown in Table 1.

Table 1.
The chemical composition of AlV55 (wt%).
The SEM image (Figure 1) shows that this alloy sample is the original alloy from the production site, composed of two phases regions: (1) micro regions (labeled as 1 and 4) are the matrix of the observation area, with vanadium content ranging from 55% to 56%, belonging to the Al8V5 phase; (2) micro regions (labeled as 2 and 3) are the precipitates of the observation area, with vanadium content ranging from 66% to 68%, belonging to the vanadium–aluminum solid solution phase.
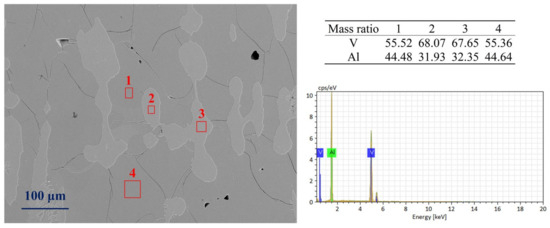
Figure 1.
A SEM image of the AlV55 alloy sample.
2.2. Experimental
A high-temperature water quenching experimental system was applied to study the phase transformation of AlV55 alloys, as shown in Figure 2. In a typical experiment, 40 g AlV55 alloy particles were weighed into a corundum crucible (Ø35 mm × h45 mm), and the corundum crucible (4) was then hung on the manual trigger (6) at the top of the quenching furnace through the molybdenum wire (3). The high-purity argon was used as the protective gas, with a flow rate of 0.1 L/min, the pressure inside the furnace was slightly higher than atmospheric pressure, and the exhaust gas was discharged into the air through water filtration.
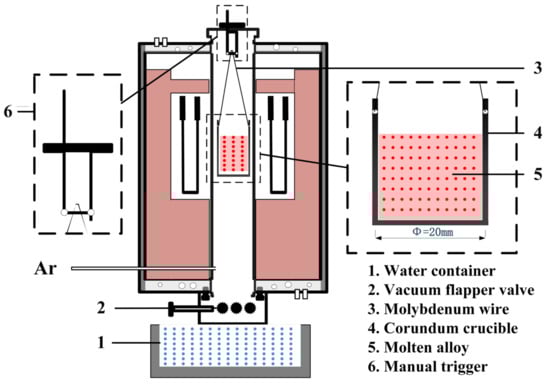
Figure 2.
High-temperature water quenching experimental system.
A pre-experiment was performed first to obtain a condition for complete melting of the vanadium–aluminum alloy. The melting conditions were initially set at 1650 °C for 20 min, followed by water quenching. It was found that part of the alloy could not be melted. Then, the melting condition was adjusted to 1680 °C for 30 min. It was found that the particles on the surface of the sample were basically melted, and the bottom of the sample was completely melted, which met the requirements for subsequent cooling to control phase precipitation. So, holding at 1680 °C for 30 min was selected as the melting condition for all experiments.
The temperature of furnace was increased from 25 °C to 1680 °C with a heating rate of 10 °C/min and kept for 30 min to melt the alloy samples. Then, the samples were cooled to a target temperature (1400 °C, 1200 °C, 1000 °C, 800 °C, 600 °C, 400 °C, and 200 °C) in the furnace and held for 2 min. After that, the vacuum flapper valve (2) was opened, and the push-down suspension trigger was pushed to allow the corundum crucible to drop into the water container (1) for water quenching.
After water quenching, an AlV55 alloy sample (Ø30 mm × h10 mm) was made, and its surface on the bottom side was smoothly polished by using a chamfer. The cross section of the sample was created by breaking part of the sample. After mounted into a resin, the cross section of the sample was analyzed.
The phases of the quenched AlV55 alloy samples were determined by using an X-ray Diffractometer (XRD, ZSX Primus II, Akishima City, Tokyo, Japan). The morphology and compositions of the samples were characterized by using a Scanning Electron Microscopy (SEM, Sigma 500, Zeiss, Oberkochen, Germany). The polished surfaces of the samples were also analyzed by SEM in conjunction with Energy-Dispersive Spectrometry (EDS, Sigma 500 and OXFORD INCA Energy 350, Zeiss, Oberkochen, Germany).
3. Results and Discussion
3.1. Phase Transformation
Figure 3 shows the SEM images of AlV55 alloy samples. It can be seen from Figure 3 that there are precipitated phases (2 and 3) in both untreated and treated AlV55 samples. The vanadium content in these phases is about 68%, which is in line with the mass ratio of V/Al of AlV phase. The area of the precipitated phases accounts for approximately 20% of the total image area. The vanadium content of the matrix phase (1 and 4) is about 56%, which is consistent with the mass ratio of V/Al of the Al8V5 phase. There are shrinkage cavities and a large number of micro-cracks in the matrix phase. The more quantified mass percentages of Al and V are listed in Table 2.
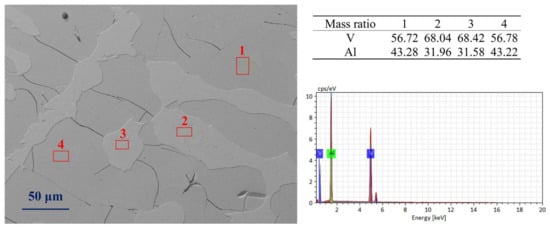
Figure 3.
The SEM images of treated AlV55 alloy sample (holding at 1680 °C for 30 min followed by colling in the furnace).
Table 2.
Mass percentages of V/Al in AlV and Al8V5 phases.
From the SEM image, it can be seen that the proportion of vanadium–aluminum solid solution phase and micro-cracks in the samples cooled with the furnace and from the vanadium plant are very similar. Furnace cooling can be used to simulate the production cooling of AlV55 alloy.
Figure 4 shows the SEM ration crystalline phase (Al8V5 phase) of AlV55 alloy with temperature variation. All samples were initially held at 1680 °C for 30 min, and then cooled to a target temperature in the furnace. After holding for 2 min at the target temperature, the alloy sample was water-quenched. It can be seen from Figure 4 that as the target temperature for quenching decreases, the proportion of Al8V5 phase gradually increases. For example, at the target temperature of 1400 °C, the proportion of Al8V5phase is 68.24%, and at the target temperature of 200 °C, the proportion of vanadium–aluminum solid solution phase is decreased to 80.53%. It also can be seen that water–quenched samples at target temperatures below 600 °C have micro-cracks, and the lower the water quenching temperature, the more micro-cracks there are. Water quenched samples at temperatures above 800 °C have almost no micro-cracks.
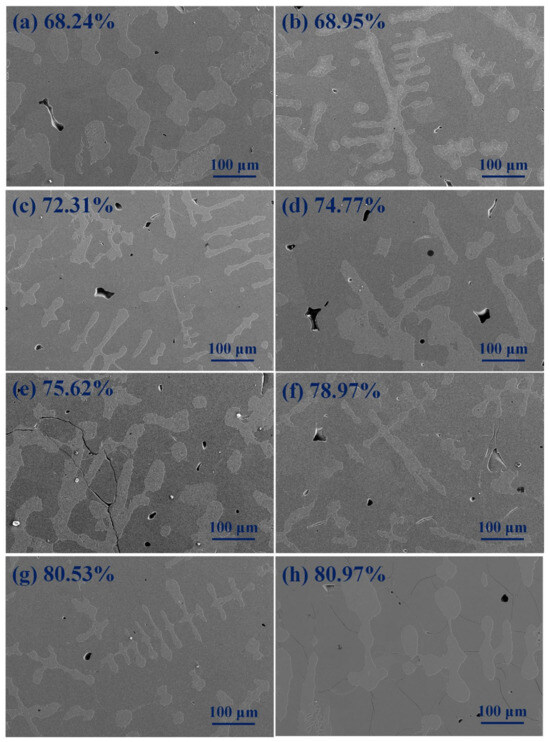
Figure 4.
The SEM ration crystalline phase of AlV55 alloy with temperature variation. (a) Quenched at 1400 °C, (b) quenched at 1200 °C, (c) quenched at 1000 °C, (d) quenched at 800 °C, (e) quenched at 600 °C, (f) quenched at 400 °C, (g) quenched at 200 °C, (h) cooled to ambient temperature.
Figure 5 shows XRD phase analysis of AlV55 alloys quenched at different temperatures. XRD analysis reveals that AlV55 alloy is composed of Al8V5, AlV, and Al2V3 phases. Because the morphology of AlV phase and Al2V3 phase in SEM images cannot be distinguished from each other, resulting in only two phases appearing at the observation interface of the entire AlV55 alloy. These two phases are the Al8V5 phase and the solid solution phase of vanadium–aluminum (a combination of AlV phase and Al2V3 phase). Through XRD phase semi-quantitative analysis [31], the proportion of vanadium–aluminum solid solution phase in AlV55 alloy is 35.8%, 32.9%, 29.3%, and 25.5% at 1400 °C, 1000 °C, 600 °C, and 200 °C. XRD analysis also confirms that, as the temperature decreases, the Al8V5 phase gradually increases.
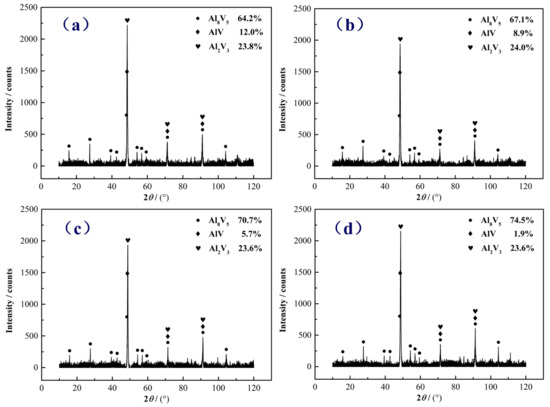
Figure 5.
XRD phase patterns of AlV55 alloy quenched at (a) 1400 °C, (b) 1000 °C, (c) 600 °C, and (d) 200 °C.
The water quenching process is used for industrial testing, with an alloy weight of 150 kg per furnace. First, use a jaw crusher to crush metal blocks with a particle size less than 100 mm, then use a rubbing type crusher to crush them to the target particle size, and use a vibrating screen to separate the fine powder into unqualified products. The production fine powder rate of AlV55 alloy was collected on-site for five heats, with an average value of 19.8%. Then, five rounds of water quenching tests at temperatures ranging from 850 to 950 °C (currently the highest temperature that can be adapted to on-site operations) were collected, with an average fine powder rate of 13.2%.
3.2. Calculation of Vanadium–Aluminum Solid Solution
Figure 6 shows the metallographic diagram of the vanadium–aluminum alloy. The diagram is produced by FactSage 6.4. Based on the vanadium mass fraction of 58% of the vanadium–aluminum alloy, it is in the O1O2 position in Figure 6. The complete solidification temperature of the alloy is approximately 1650 °C. During the entire solidification process of the alloy, when the temperature is higher than 1650 °C, the liquid phase precipitates vanadium–aluminum BBC_A2 phase (the solid solution phase of vanadium–aluminum). When the temperature is lower than 1650 °C, there are two phases, the solid solution phase of vanadium–aluminum and Al8V5 phase. When each temperature reaches equilibrium, as the temperature decreases, the ratio of Al8V5 phase gradually increases, while the mass fraction of vanadium–aluminum solid solution phase gradually increases, and the proportion of vanadium–aluminum solid solution phase gradually decreases.
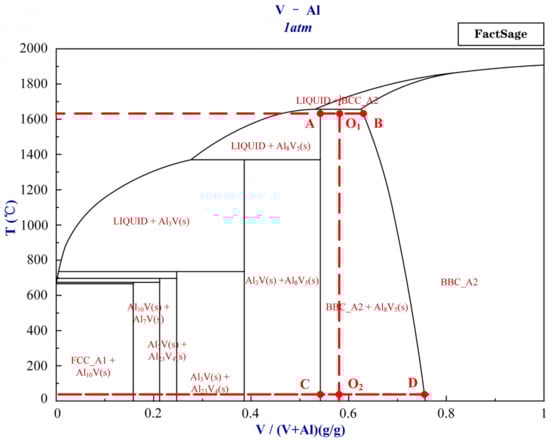
Figure 6.
The metallographic diagram of vanadium–aluminum alloy.
The mass fraction of vanadium–aluminum solid solution phase is not a fixed ratio. It can be concluded that at 1650 °C near the freezing point, the mass fraction of precipitated BBC_A2 is 65%, which is consistent with AlV. When the temperature is close to 25 °C, the mass fraction of precipitated BBC_A2 is 75%, which is consistent with Al2V3. When approaching the complete solidification point at 1650 °C, the mass ratio of the two phases is BBC_A2:Al8V5 = 1:1.2. At a temperature close to 25 °C, the mass ratio of the two phases is BBC_A2:Al8V5 = 1:4.6. To obtain their volume ratio, the mass ratio is taken into the following equation:
where , , and represent the vanadium content of AlV55 alloy, Al8V5 phase, and vanadium–aluminum solid solution phase, respectively. is the mass of AlV55 alloy, and and are the mass of Al8V5 phase and the mass of vanadium–aluminum solid solution phase, respectively. is the density of i, is the mass of i, is the volume of i, i is the Al8V5 phase and the vanadium–aluminum solid solution phase, is the volume fraction of the vanadium–aluminum solid solution phase, and and are the volume of the vanadium–aluminum solid solution phase and the volume of Al8V5 phase, respectively.
By using the above formula, it can be calculated that when the complete solidification temperature reaches equilibrium at 1655 °C, the mass fraction of the vanadium–aluminum solid solution phase is 62.53%. At this temperature, the maximum volume fraction of vanadium–aluminum solid solution phase is 44.26%. When the cooling rate is small enough, the time is long enough, and the temperature drops to room temperature of 25 °C, the mass fraction of the vanadium–aluminum solid solution phase will approach 75.49%. At this temperature, when reaching equilibrium, the minimum volume fraction of vanadium–aluminum solid solution phase is 16.23%.
Using the same method, the mass fraction of vanadium–aluminum solid solution phase corresponds to temperatures of 1400 °C, 1200 °C, 1000 °C, 800 °C, 600 °C, 400 °C, and 200 °C is 65.98%, 68.05%, 69.68%, 71.06%, 72.38%, 73.58%, and 74.66%, respectively. The corresponding proportions of Al8V5 phase are calculated to be 68.93%, 73.81%, 76.77%, 78.84%, 80.54%, 81.89%, and 82.98%, respectively. The results from this theoretical calculation are consistent with the experimental results.
3.3. Solid Solution Formation Mechanism
Figure 7 shows SEM images’ microscopic details of the vanadium–aluminum solid solution phase in the vanadium–aluminum alloy, which is water-quenched at 600 °C. The scanning point (1, 2, 3, 4) in the image on the left is the precipitated vanadium–aluminum solid solution phase, and the scanning point 5 is the matrix Al8V5 phase. It can be observed from green zone in the image that the vanadium–aluminum solid solution phase precipitated at scanning point 2 is micro-spotted, which appears to be quite different from the rest. A further magnified green zone (the image on the bottom of Figure 7) shows two phases with light and dark colors. The dark colored phase is dotted in the light-colored phase. SEM-EDX shows that the mass fractions of vanadium at scanning points 6, 7, 8, 9 are 60.85%, 65.34%, 67.90%, and 67.33%, respectively. At scanning point 10 of the light-colored matrix phase, the mass fraction of vanadium is determined to be 67.58%. Therefore, the color depth of the phase here cannot reflect the change in vanadium mass fraction. It belongs to the vanadium–aluminum solid solution phase as a whole and is in the process of phase transformation.
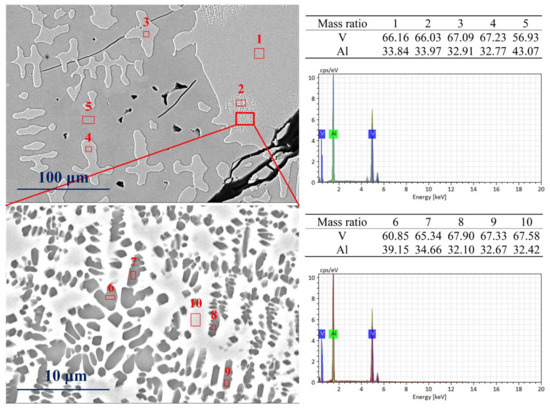
Figure 7.
The SEM phase transition patterns of water-quenched sample at 600 °C.
The crystallographic parameters of Al8V5 phase, AlV phase, and Al2V3 phase were obtained through XRD detection analysis. The crystal type of Al8V5 phase is a cubic crystal system, and the lattice constant of Al8V5 phase is a = b = c = 9.2340 Å. The crystal type of AlV phase is a cubic crystal system, and the lattice constant of AlV phase is a = b = c = 3.0740 Å. The crystal type of Al2V3 phase is a cubic crystal system, and the lattice constant of Al2V3 phase is a = b = c = 3.0690 Å.
As the temperature decreases, the AlV phase in vanadium–aluminum alloy gradually transforms into Al8V5 phase and Al2V3 phase. From a crystallographic perspective, 3/14 of the vanadium atoms in AlV phase crystals migrated, forming Al8V5 and Al2V3 crystals, as shown in Figure 8, resulting in crystal transformation.
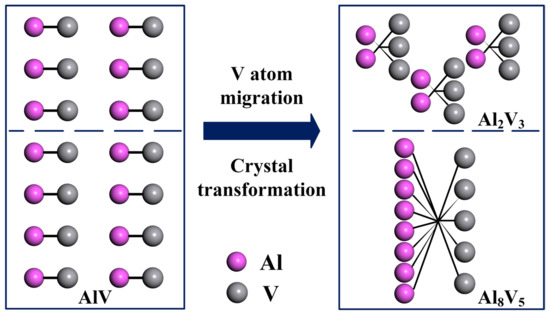
Figure 8.
The crystal transformation process of vanadium–aluminum alloy.
According to Figure 6 and Equations (1)–(4), it can be obtained that when the vanadium mass fraction of vanadium–aluminum alloy is 58%, the mass fraction of the vanadium–aluminum solid solution phase in the alloy is exactly 65.37% (AlV phase) and 73.90% (Al2V3 phase), and the corresponding volume fractions of the vanadium–aluminum solid solution phase are 32.80% and 17.56%, respectively. According to the migration and transformation law of crystal atoms, the AlV phase with a volume fraction of 32.80% can obtain 17.57% of Al2V3 phase and 15.23% of Al8V5 phase. The volume fraction of vanadium–aluminum solid solution phase (Al2V3 phase) calculated from the phase diagram of vanadium–aluminum alloy is 17.56%, and the corresponding AlV phase undergoes crystal atom migration and transformation into a volume fraction is 17.57%. The volume fraction of Al2V3 phase obtained by the two methods is basically consistent.
Based on the above analysis, it can be concluded that during the temperature reduction process of vanadium–aluminum alloy, the AlV phase will decompose into Al8V5 phase and Al2V3 phase. Therefore, the AlV phase obtained in the high-temperature stage can be stored in a rapid cooling manner to avoid the transformation into Al8V5 phase and affect the quality of vanadium–aluminum alloy.
4. Conclusions
- (1)
- Through XRD analysis, it was found that AlV55 alloy mainly presents three phases, including Al8V5, AlV, and Al2V3 phases. Meanwhile, during the process of analyzing high-temperature water-quenched samples, the transformation process from AlV phase to Al8V5 phase was discovered using SEM and EDX.
- (2)
- Based on the Al-V phase diagram, numerical simulation analysis showed that at 1400 °C, the proportion of Al8V5 phase in vanadium–aluminum alloy with a mass fraction of 58% was 68.93%, while at 200 °C, the proportion of Al8V5 phase was 82.98%, with a significant increase in proportion.
- (3)
- By using high-temperature water quenching technology, the proportion of Al8V5 phase in AlV55 alloy was reduced from 80.97% to 68.24%, and the fine powder rate of alloy products was reduced from 19.8% to 13.2%, providing important technical support for improving the yield of vanadium–aluminum alloy.
The research results obtained from this study can be directly promoted and applied in the vanadium–aluminum alloy industry. At the same time, they can provide a reference for quality improvement of other metallurgical products in the non-ferrous metal industry, and also provide a reference for improving metal yield and operational efficiency in the smelting process of metallurgical industry.
Author Contributions
Conceptualization, L.G., H.C., D.Y. and N.W.; Methodology, L.G., H.C., N.W. and X.W.; Software, L.G., B.Y. and M.Y.; Validation, H.C., D.Y., N.W. and J.W.; Formal analysis, H.C., D.Y. and J.W.; Investigation, B.Y., M.Y., X.W. and L.Z.; Resources, B.Y., M.Y. and J.W.; Data curation, B.Y. and M.Y.; Writing—original draft, L.G. and L.Z.; Writing—review and editing, X.W. and L.Z.; Visualization, N.W. and L.Z. All authors have read and agreed to the published version of the manuscript.
Funding
This research was funded by the National Defense KGJ Project (No. GJ2023A1F01Z); by Sichuan Science and Technology Project (No. 2023ZDZX0004).
Data Availability Statement
The original contributions presented in the study are included in the article, further inquiries can be directed to the corresponding author.
Conflicts of Interest
Authors Leizhang Gao, Haijun Chen, Danfeng Yin, Ning Wang, Bin Yu, Mingfeng Ye, Xiaoping Wu, Lei Zhang and Jinshu Wu were employed by the company Pangang Group Research Institute Co., Ltd.
References
- Sujata, M.; Madan, M.; Raghavendra, K.; Bhaumik, S.K. Fretting Fatigue in Aircraft Components Made of Ti-Al-V Alloys. Procedia Eng. 2013, 55, 481–486. [Google Scholar] [CrossRef]
- MacLeod, S.G.; Errandonea, D.; Cox, G.A.; Cynn, H.; Daisenberger, D.; Finnegan, S.E.; McMahon, M.I.; Munro, K.A.; Popescu, C.; Storm, C.V. The phase diagram of Ti-6Al-4V at high-pressures and high-temperatures. J. Phys. Condens. Matter 2021, 33, 154001. [Google Scholar] [CrossRef]
- Kang, L.M.; Cai, Y.J.; Luo, X.C.; Li, Z.J.; Liu, X.B.; Wang, Z.; Li, Y.Y.; Yang, C. Bimorphic microstructure in Ti-6Al-4V alloy manipulated by spark plasma sintering and in-situ press forging. Scr. Mater. 2021, 193, 43–48. [Google Scholar] [CrossRef]
- Jo, P.S.; Lee, J.G.; Lee, D.G. Changes in High Temperature Deformation Behavior by Differences in Energy Dissipation Efficiency of Ti-6Al-4V Alloy. Mater. Trans. 2022, 63, 1310–1316. [Google Scholar] [CrossRef]
- Shi, X.H.; Cao, Z.H.; Fan, Z.Y.; Eckert, J.; Qiao, J.W. Static coarsening behavior of equiaxed α phase in Ti-8Al-1Mo-1V alloy. Trans. Nonferrous Met. Soc. China 2021, 31, 1628–1640. [Google Scholar] [CrossRef]
- Gao, T.; Xue, H.Q.; Sun, Z.D.; Retraint, D.; He, Y.L. Micromechanisms of crack initiation of a Ti-8Al-1Mo-1V alloy in the very high cycle fatigue regime. Int. J. Fatigue 2021, 150, 106314. [Google Scholar] [CrossRef]
- Yao, Y.; Zhou, J.; Zhao, H. A study on the variation of mechanical properties of Ti-8Al-1Mo-1V titanium alloy after electro-shocking treatment. J. Phys. Conf. Ser. 2023, 2566, 012024. [Google Scholar] [CrossRef]
- Hosseini, S.M.; Vaghefi, E.; Mirkoohi, E. The role of defect structure and residual stress on fatigue failure mechanisms of Ti-6Al-4V manufactured via laser powder bed fusion: Effect of process parameters and geometrical factors. J. Manuf. Process. 2023, 102, 549–563. [Google Scholar] [CrossRef]
- Wang, T.; Wang, Y. Preparation of Ti-6Al-4V Alloy Powder by Aluminothermic Reduction. The Minerals, Metals & Materials Series. In Proceedings of the TMS 2020 149th Annual Meeting & Exhibition Supplemental Proceedings, San Diego, CA, USA, 23–27 February 2020; pp. 1681–1689. [Google Scholar]
- Song, Y.; Dou, Z.H.; Cheng, C.; Zhang, T. Novel Insight into the Preparation of Ti-6Al-4V Alloy Through Thermite Reduction Based on the Mass Action Concentration. J. Wuhan Univ. Technol. -Mater. Sci. Ed. 2023, 38, 652–658. [Google Scholar] [CrossRef]
- Li, J.B. Summary on the process of producing vanadium-aluminum alloy. Ferro-Alloys 2017, 6, 13–15. [Google Scholar]
- Samson, O.J.; Mxolisi, B.S. Wear and oxidation behavior of Ti-7Al-1Mo/TiN composites fabricated via spark plasma sintering. Int. J. Adv. Manuf. Technol. 2024, 133, 559–569. [Google Scholar]
- Li, G.; Guo, Y.; Rui, S.S.; Sun, C. High-temperature fatigue behavior of TC17 titanium alloy and influence of surface oxidation. Int. J. Fatigue 2023, 176, 107896. [Google Scholar] [CrossRef]
- Popov, N.A.; Skachkov, V.S.; Akashev, L.A.; Eselevich, D.A.; Baklanova, I.V. A study of oxide layer growth on the surface of aluminium alloys with Ti, Zr, Hf during heating in air. Thin Solid Films. 2021, 738, 138961. [Google Scholar] [CrossRef]
- Chen, J.; Guo, Q.; Yang, Z.; Li, J.; Guo, Y.; Yang, W.; Xu, D. Effects of Micro-arc Oxidation/Multi-arc Ion Plating Composite Treatment on Microstructure and Properties of TC4 Titanium Alloy. J. Mater. Eng. Perform. 2024, 33, 1391–1400. [Google Scholar] [CrossRef]
- Chen, H.J. Experimental Study on Two-step Synthesis of Vanadium-aluminum Alloy, Iron Steel Vanadium Titanium. Iron Steel Vanadium Titan. 2012, 6, 11–15. [Google Scholar]
- Chen, H.J.; Zhou, F.; Sun, Z.H.; Wang, Y.G.; Yin, D.F.; Li, H.F. Vacuum Refining Experiment of Vanadium Aluminum Alloy. Trans. Nonferrous Met. Soc. China 2014, 8, 48–50. [Google Scholar]
- Wan, H.L.; Xu, B.Q.; Li, L.J.; Yang, B.; Dai, Y.N. Electrode heating effects on preparation of Al-65V alloy. J. Cent. South Univ. 2020, 27, 1–9. [Google Scholar] [CrossRef]
- Wan, H.L.; Xu, B.Q.; Wang, L.; Li, L.; Yang, B.; Li, L.J.; Ding, Z.; Dai, Y.N.; Li, D.M. A novel method of AlV55 alloy production by utilizing AlV65 alloy scrap. Vacuum 2018, 155, 127–133. [Google Scholar] [CrossRef]
- Mikhailov, O.V.; Chachkov, D.V. Molecular Structure Models of Al2Ti3 and Al2V3 Clusters According to DFT Quantum-Chemical Calculation. Eur. Chem. Bull. 2020, 9, 62–68. [Google Scholar] [CrossRef]
- Mizutani, U.; Asahi, R.; Sato, H.; Takeuchi, T. Mediated resonance effect of the vanadium 3d states on phase stability in the Al8V5 γ-brass studied by first-principles FLAPW and LMTO-ASA electronic structure calculations. Phys. Rev. B. 2006, 7, 23. [Google Scholar]
- Wang, J.; Feng, Q.; Wang, S.; Lu, X.; Li, C. Thermodynamic modeling of Al-Fe-V ternary system. Mater. Res. Express. 2019, 6, 126539. [Google Scholar] [CrossRef]
- Mo, H.; Zhan, Y.; Yang, Z.; Du, Y. Interactions of the components in the Al-V-Nd system at 773 K. J. Alloys Compd. 2010, 506, 589–592. [Google Scholar] [CrossRef]
- Witharamage, C.S.; Christudasjustus, J.; Walunj, G.; Borkar, T.; Gupta, R.K. Effect of V Content on Corrosion Behavior of Al-V Alloys Produced by Mechanical Alloying and Subsequent Spark Plasma Sintering. J. Electrochem. Soc. 2024, 171, 031501. [Google Scholar] [CrossRef]
- Wang, L.; Wan, H.L.; Xiong, H.; Liu, J.Y.; Wang, H.X.; Yang, B.; Li, L.; Dai, Y.N. Investigation and study on the novel method of preparing Al-V alloy by electrode assisted heating. J. Mater. Res. Technol. 2020, 9, 10576–10584. [Google Scholar] [CrossRef]
- Wan, H.L.; Xu, W.; Li, L.J.; Yang, B. A novel method of fabricating Al-V intermetallic alloy through electrode heating. Metals 2019, 9, 558. [Google Scholar] [CrossRef]
- Filatov, A.; Suzdaltsev, A.; Zaikov, Y. Production of Al-Zr Master Alloy by Electrolysis of the KF-NaF-AlF3-ZrO2 Melt: Modifying Ability of the Master Alloy. Metall. Mater. Trans. B 2021, 52, 4206–4214. [Google Scholar] [CrossRef]
- Sun, J.; Zhong, H.G.; Zhai, Q.J.; Xian, Y.; Sun, Z.H. The Study on Vacuum Degassing Process of AlV55 Alloy. Eng. J. 2015, 84, 659–665. [Google Scholar]
- Yin, D.F.; Sun, Z.H.; Chen, H.J.; Wang, Y.G.; Du, G.C. Preparation of AlV55 alloy by aluminothermic reduction. Iron Steel Vanadium Titan. 2017, 38, 42–45. [Google Scholar]
- Babic, E.; Krsnik, R.; Ocko, M. The low-temperature resistivity of AlV and AlTi alloys. J. Phys. F Met. Phys. 1976, 6, 73–83. [Google Scholar] [CrossRef]
- Huang, J.W. MDI Jade User Manual; Central South University: Changsha, China, 2006; pp. 24–26. [Google Scholar]


Disclaimer/Publisher’s Note: The statements, opinions and data contained in all publications are solely those of the individual author(s) and contributor(s) and not of MDPI and/or the editor(s). MDPI and/or the editor(s) disclaim responsibility for any injury to people or property resulting from any ideas, methods, instructions or products referred to in the content. |
© 2024 by the authors. Licensee MDPI, Basel, Switzerland. This article is an open access article distributed under the terms and conditions of the Creative Commons Attribution (CC BY) license (https://creativecommons.org/licenses/by/4.0/).