Article

Effect of Bi on the Tensile and Viscoplastic Behavior of Sn-Ag-Cu-Bi Alloys Used for Microelectronics Applications

1
Department of Materials Science and Engineering, Advanced Materials Processing and Analysis Center, University of Central Florida, Orlando, FL 32816, USA
2
Juniper Networks, Sunnyvale, CA 94089, USA
3
Department of Mechanical and Aerospace Engineering, University of Central Florida, Orlando, FL 32816, USA
*
Author to whom correspondence should be addressed.
Metals 2024, 14(7), 803; https://doi.org/10.3390/met14070803
Submission received: 13 May 2024 / Revised: 3 July 2024 / Accepted: 6 July 2024 / Published: 9 July 2024

Abstract

:
Sn-Ag-Cu-Bi (SAC-Bi) alloys are gaining popularity as a potential replacement for current lead-free solder alloys in microelectronic packages. In this study, the tensile and viscoplastic behaviors of eight SAC-Bi alloys with 0, 1 wt.%, 2 wt.%, and 3 wt.% Bi content were investigated. The samples of these eight alloys were cast, aged at room temperature, 75 °C and 125 °C, and tensile-tested at rates of 0.1/s, 0.01/s, and 0.001/s in ambient and elevated temperature environments to facilitate the quantification of viscoplasticity using the Anand viscoplastic model. The Anand parameters of all eight alloys in the as-cast and aged conditions were determined. Tensile strength was found to increase with the addition of Bi. Additionally, alloys containing 2 and 3 wt.% Bi showed a 5 to 10% increase in tensile strength after isothermal aging of 90 days at 125 °C. On the contrary, the tensile strength of alloys with up to 1 wt.% Bi decreased by 22 to 48% after such aging. Using a Scanning Electron Microscope (SEM) and energy dispersive spectroscopy (EDS), the microstructure of the alloys was characterized. The aging-induced property changes in the samples were correlated to strengthening by Bi solute atoms for alloys with 1 wt.% Bi and the formation of Bi precipitation for alloys with 2 wt.% and 3 wt.% Bi.

1. Introduction

Lead-free alloys such as Sn-3.0Ag-0.5Cu (SAC305) and Sn-4.0Ag-0.5Cu (SAC405) are widely used as solder materials because of their adequate properties and reliability [1,2,3,4,5,6,7]. However, with applications such as 5G and high-performance computing (HPC) imposing increased thermomechanical loading on solder joints, there is a pressing need to develop alloys with better mechanical properties and reliability. Bi-doped SAC alloys offer enhanced properties, making them an attractive alternative to SAC305 and SAC405. Jian et al. investigated Bi-doped alloys such as SAC-Q (Sn-4.0Ag-0.5Cu-3.0Bi) and SAC-R (Sn-0.5Cu-3.0Bi), revealing that while SAC305 exhibited significantly reduced fatigue life after 1000 h of aging, Bi-doped SAC alloys showed less change in fatigue life [8]. A comparative investigation of the fatigue reliability of SAC305 and eutectic Sn-Bi alloys by Cai et al. showed a superior fatigue strength of the eutectic Sn-Bi alloy [9]. Haq et al. showed that for the same number of cycles, the stress level for fatigue failure is 50% higher in SAC405-Bi alloy with 3 wt.% Bi compared with SAC405 with 1 wt.% Bi [10]. Lall et al. reported a 5 to 15% higher tensile strength in SAC405-3.0Bi solder compared with SAC305 across a large spectrum of strain rates ranging from 1 to 75 s−1 and temperatures of −65 °C to 200 °C [11]. Belhadi et al. showed SAC 305 doped with 3 wt.% Bi has a shear strength 15 to 20% higher than SAC305 [12], and a 20 to 40% increase in tensile strength was reported on doping SAC405 with up to 3% Bi [13]. It was also reported that a doping of 3 wt.% Bi in SAC405 increases the hardness of the alloy by 37% and improves the creep strength significantly [14]. Various other material properties of SAC-Bi alloys have also been studied. Ahsan et al. reported that adding 1% and 2% Bi to SAC305 increased the modulus and ultimate tensile strength, but these properties decreased with aging and thermal exposure [15]. Maalekian et al. investigated Sn-0.6Ag-0.7Cu-Bi alloys with varying Bi content from 0 to 1, 1.5, 3, and 6 wt.% and reported a lowered melting temperature by 15 °C on the addition of 6 wt.% Bi, higher hardness and tensile strength, and improved wettability for alloys with higher Bi content [16]. Improvement in wettability on Cu pads was also reported by Yang et al. [17]. Hu et al. studied the effect of Bi addition in SAC305 on the microstructure and mechanical properties of SAC-Bi solder joints experiencing current stressing and reported that Bi addition increased nanoindentation hardness after current stressing for Bi concentrations of less than 3% [18].
As solder joints in packages are often deformed plastically under service conditions [19,20], examining properties pertaining to the plastic deformation of a solder alloy is important for assessing the reliability of these alloys. In particular, for SAC-Bi, which exhibits viscoplastic behavior when deformed [14,21,22], it is important to investigate how its mechanical behaviors vary with loading rate and quantify these viscoplastic properties using the Anand viscoplastic model to simulate their deformation behaviors in a package [23,24]. Since the microstructure and mechanical properties of solder change with time when an electronic package undergoes service conditions, it is necessary to find the Anand viscoplastic parameters not just in the unaged condition but also after high-temperature storage. Additionally, it is important to establish a structure–property correlation by identifying the microstructural causations of property changes. Various attempts have been made to determine the Anand parameters for a variety of commonly used microelectronic solder alloys. Motalab et al. reported the Anand parameters for SAC305 using uniaxial stress–strain data for various strain rates (1 × 10⁻³ s−1, 1 × 10⁻⁴ s−1, and 1 × 10⁻⁵ s−1) and temperatures (25 °C, 50 °C, 75 °C, 100 °C, and 125 °C) as well as from creep data measured at different stresses (10 MPa, 12 Mpa, and 15 MPa) and temperatures (25 °C, 50 °C, 75 °C, 100 °C, and 125 °C) [25]. Ahmed et al. found the Anand parameters of 2 to 3% Bi-doped SAC405 solders using tensile tests performed at temperatures of 25 to 125 °C and strain rates of 1 × 10⁻³ to 1 × 10⁻⁵ s−1 [21]. Basit et al. investigated the Anand parameters of various SAC solders with varying Ag content from 1 to 4 wt.% after extreme aging at 100 °C for 12 months [26]. Hassan et al. conducted uniaxial stress–strain tests at testing temperatures of 25 to 125 °C and strain rates of 1 × 10⁻³ to 1 × 10⁻⁵ for SAC405 doped with 1,2, and 3 wt.% Bi and for SAC305 and found the Anand parameters of the four alloys in unaged condition [27]. However, a comprehensive study on the viscoplastic properties and Anand parameters of SAC305 and SAC405 with varying Bi content subjected to a variety of aging conditions, including room temperature and near-service temperatures, is lacking.
In this study, the changes in tensile and viscoplastic properties over aging time were studied for the following eight solder alloys: SAC305, SAC305 + 1 wt.%Bi, SAC305 + 2 wt.%Bi, SAC305 + 3 wt.%Bi, SAC405, SAC405 + 1 wt.%Bi, SAC405 + 2 wt.%Bi, and SAC405 + 3 wt.%Bi. These alloys were subjected to tensile testing at three temperatures, with each temperature tested at three constant strain rates. From the obtained stress–strain behaviors, the Anand parameters of all eight alloys were found in their as-cast (unaged) condition as well as in the aged conditions. The variation in tensile and viscoplastic behavior with Bi doping was also studied, and the changes in microstructure caused by Bi were revealed.

2. Materials and Methods

2.1. Sample Preparation

Ingots of eight solder alloys, i.e., SAC305, SAC305 + 1 wt.%Bi, SAC305 + 2 wt.%Bi, SAC305 + 3 wt.%Bi, SAC405, SAC405 + 1 wt.%Bi, SAC405 + 2 wt.%Bi, SAC405 + 3 wt.%Bi (ACCURUS SCIENTIFIC Co., Ltd., Tainan City, East District, Taiwan), were cleaned and melted in their respective inert crucibles. Tensile testing samples of each alloy were prepared by vacuum casting, where a glass tube with an inner dimension of 1 mm × 2 mm was connected at one end to a vacuum pump and dipped in a crucible containing molten solder at the other end. The low pressure created by the vacuum pump pulled the molten solder into the tube [28], which was immediately removed from the crucible and quenched in a water bath. The solidified samples were then removed from the tube and polished to 1200 grit size to remove any stress concentrator. The samples of 50 mm length and cross-sectional dimensions of 1 mm × 2 mm were then ready for the aging experiment and subsequent testing. In total, 300 samples were casted for each alloy. Non-standard sample geometry was chosen in this study to mimic the dimensions and microstructures of solder joints used in a real package.

2.2. Aging Experiment

The casted specimens of all alloys were subjected to isothermal aging in ambient atmosphere in convectional thermal chambers. The aging experiment was conducted at room temperature (25 °C) as well as elevated temperatures of 75 °C and 125 °C. These three temperatures were chosen as they cover a wide range of typical service temperatures for solders in commercial-, industrial-, and military-grade packages [29]. There were three aging durations for each aging temperature, i.e., 30, 60, and 90 days. This choice of aging duration facilitated the comparison of the calculated Anand parameters for 90 days of aging with other investigations [22] and helped find Anand parameters for intermediate aging durations. The aging matrix is shown in Table 1.

2.3. Tensile Testing

The specimens in the as-cast and aged conditions were tensile-tested at three different temperatures, i.e., 25 °C, 90 °C, and 145 °C, using a Shimadzu AGS-X tensile tester (Kyoto, Japan) with an attached environmental chamber. As there is no specific ASTM or JEDEC standard for determining Anand parameters, the measurement followed procedures reported in the literature [28]. Specifically, for each of these temperatures, constant strain rate tests were conducted at 0.1/s, 0.01/s, and 0.001/s. The testing matrix used for the tensile testing is shown in Table 2. For each of the nine testing temperature and strain rate combinations, three repeatable stress–strain plots were obtained.

2.4. Calculation of Anand Parameters

The Anand viscoplastic constitutive model is described by a stress equation, a flow equation, and an evolution equation [22]. Equations (1)–(9) were derived by Motalab et al. to calculate Anand parameters [25].
For uniaxial loading, the stress equation is expressed as:
σ = c s ; c < 1
where s is an internal variable while c ( ε p ˙ ,   T ) is a function of the plastic strain rate ( ε p ˙ ) and absolute temperature. c is given by:
c = c ε p ˙ , T = 1 ξ sinh 1 ε p ˙ A e Q R T m
where ξ is the multiplier of stress, A is the pre-exponential factor, Q is the activation energy, R is the universal gas constant, and m is the strain rate sensitivity. Using Equations (1) and (2), the stress equation is written as:
σ = s ξ sinh 1 ε p ˙ A e Q R T m
Rearranging the stress equation gives the flow equation:
ε ˙ p = A e Q R T sinh ξ σ s 1 m
The internal variable s(h, ε p ) can be expressed as a function of h( σ ,   s ,   T ) and ε p .
s = h σ ,   s ,   T . ε p
where h is a term for the dynamic hardening and recovery process and ε p is plastic strain. S can be differentiated to obtain evolution equation as follows:
s ˙ = h 0 1 s s a sin 1 s s ε ˙ p ; a > 1
where h0 is an Anand parameter called the hardening constant, a is called the strain rate sensitivity parameter of hardening, and s* is:
s = s ^ ε ˙ p A e Q R T n
where s ^ is a parameter and a coefficient and n is a parameter for the strain rate sensitivity of the saturation value of deformation resistance. Using Equation (7) in Equation (6) and integrating yields the final evolution equation for s as:
s = s ^ ε ˙ p A e Q R T n s ^ ε ˙ p A e Q R T n s 0 1 a + a 1 h 0 s ^ ε ˙ p A e Q R T n a ε p 1 1 a
Substitution of the integrated evolution Equation (8) into the flow Equation (4) results in an expression relating the strain rate to the strain, stress, and temperature:
ε ˙ p = A e Q R T sinh ξ σ s ^ ε ˙ p A e Q R T n s ^ ε ˙ p A e Q R T n s 0 1 a + a 1 h 0 s ^ ε ˙ p A e Q R T n a ε p 1 1 a 1 1 m
Equation (9) includes the following nine Anand parameters: ξ, m, Q/R, A, a, h0, s0, s ^ , and n. These Anand parameters were calculated using Equation (9) as it has nine unknown parameters along with four items that can be determined experimentally, i.e., strain, stress, strain rate, and testing temperature. The stress–strain data from the elevated temperature tensile tests conducted using the testing matrix discussed in Section 2.3 was fitted [30] in Equation (9) to determine the values of the nine Anand parameters, i.e., A, ξ, Q/R, m, h0, a, s0, s ^ , and n.

2.5. Microstructural Investigation

Selected samples were sectioned and mounted in epoxy. The mounted samples were then polished using SiC papers, followed by diamond suspensions on napping cloth down to 1 μm particle size, and then finished with 40 nm colloidal silica to obtain a scratch-free surface. The polished samples were examined under the backscattered mode of a ZEISS Ultra 55 Field Emission Scanning Electron Microscope (SEM) equipped (Jena, Germany) with energy dispersive spectroscopy (EDS) to reveal and identify the various phases present. The size and distribution of phases were correlated with the effect of aging, Bi content, and observed property changes in order to establish the structure–property relationship.

3. Results

3.1. Tensile and Viscoplastic Behavior

In Figure 1, three repeatable stress–strain curves, labeled 1, 2, and 3, are plotted for each of the nine temperature–strain rate combinations for the as-cast SAC305 alloy. Three sets of Anand parameters were calculated based on these overlapping stress–strain curves, as shown in Table 3. The averages of the parameters, along with their corresponding standard deviations (Ss) and relative standard deviations (RSDs), are also provided in the table, demonstrating the repeatability of the measurement. Similar levels of deviations, i.e., less than 3% for m and n and less than 1% for all the other parameters, were found for all the other alloys across all aging conditions.
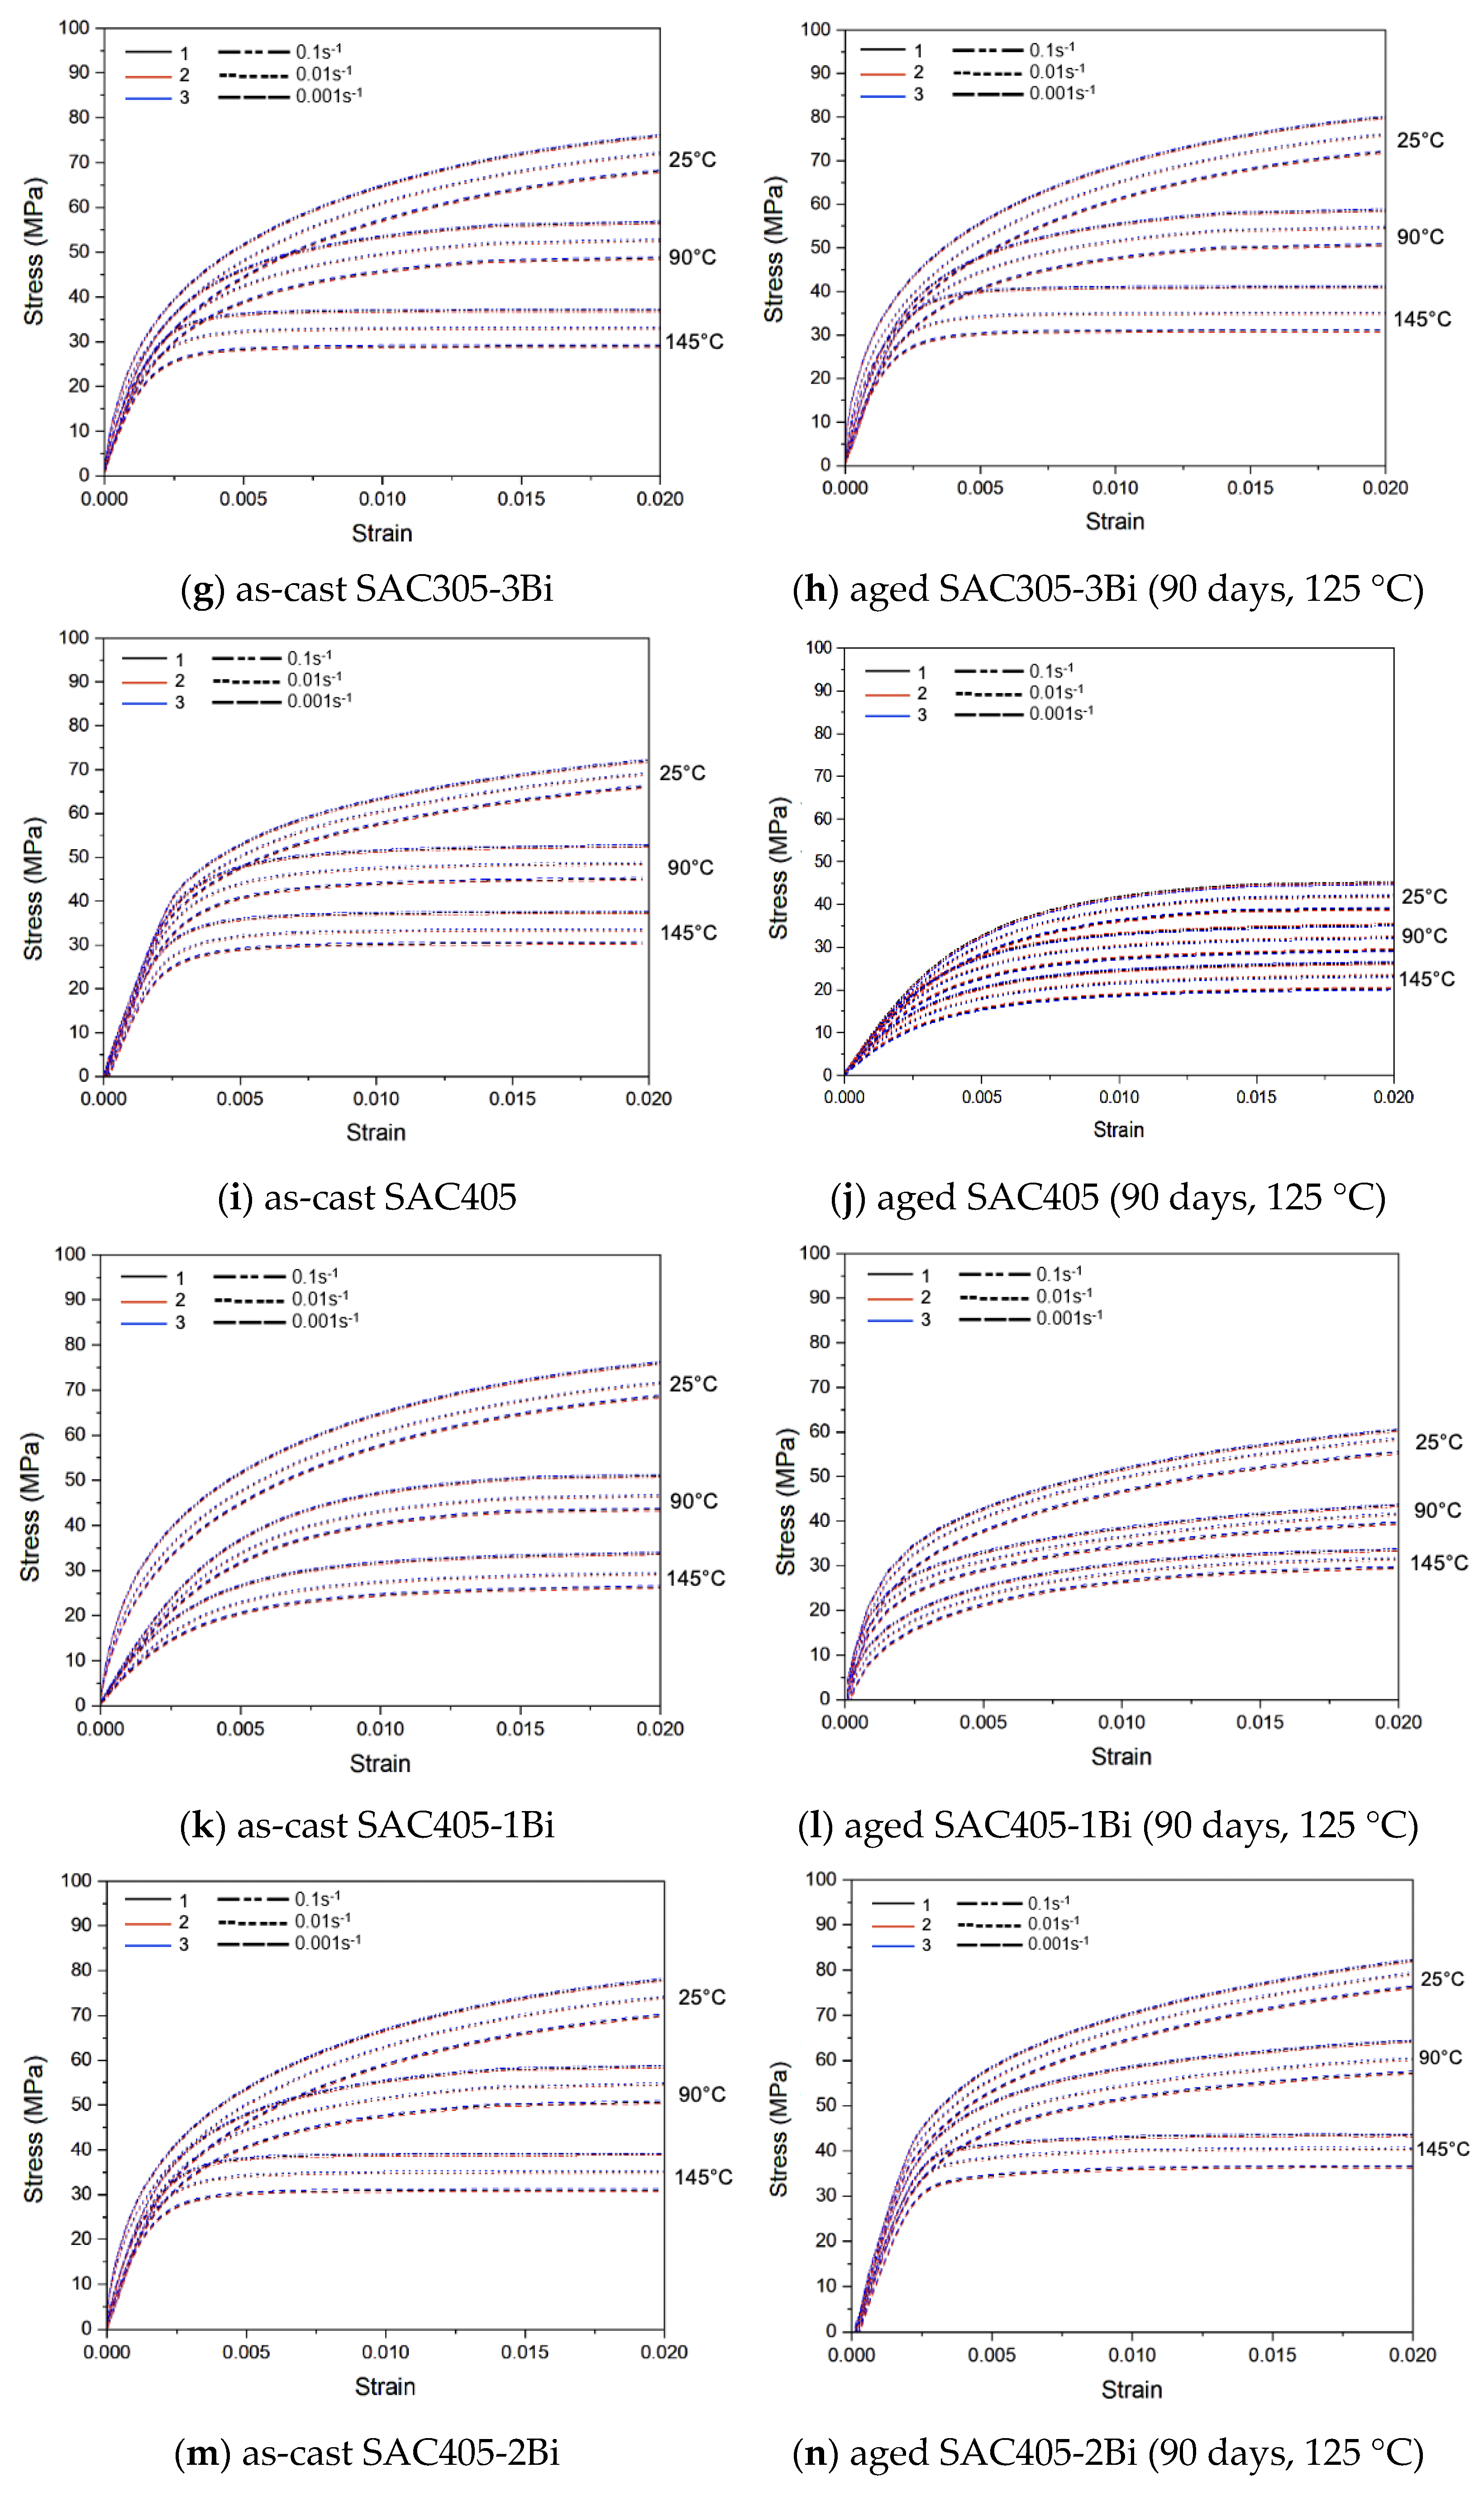
For all alloys in their as-cast conditions and after an isothermal aging of 90 days at 125 °C, three overlapping stress–strain plots are plotted in Figure 2 for each aging and testing condition. As evident from the plots, all solder alloys show loading rate-dependent deformation behavior or viscoplasticity. When deformed at higher strain rates, all alloys show higher strength than deformation at slower strain rates. As expected, a higher testing temperature results in lower strength. Moreover, the SAC305, SAC305 + 1 wt.%Bi, SAC405, and SAC405 + 1 wt.%Bi alloys show significantly reduced tensile strength after aging. On the contrary, alloys containing more than 2 wt.% Bi, i.e., SAC305 + 2 wt.%Bi, SAC305 + 3 wt.%Bi, SAC405 + 2 wt.%Bi, and SAC405 + 3 wt.%Bi, show increased strengths after aging. This indicates that doping SAC305 and SAC405 alloys with 2 to 3 wt.% Bi could lead to improved mechanical performance in these alloys, particularly after high-temperature storage.

3.2. Anand Parameters

The Anand parameters of all the alloys in the nine aging conditions and the as-cast condition were calculated using the methodology discussed in Section 2.4. The values of the parameters are listed in Table 4, Table 5, Table 6, Table 7, Table 8, Table 9, Table 10 and Table 11, where the parameters for SAC305 and SAC405 with no Bi addition are shown in Table 4 and Table 8, respectively.

3.3. Microstructure

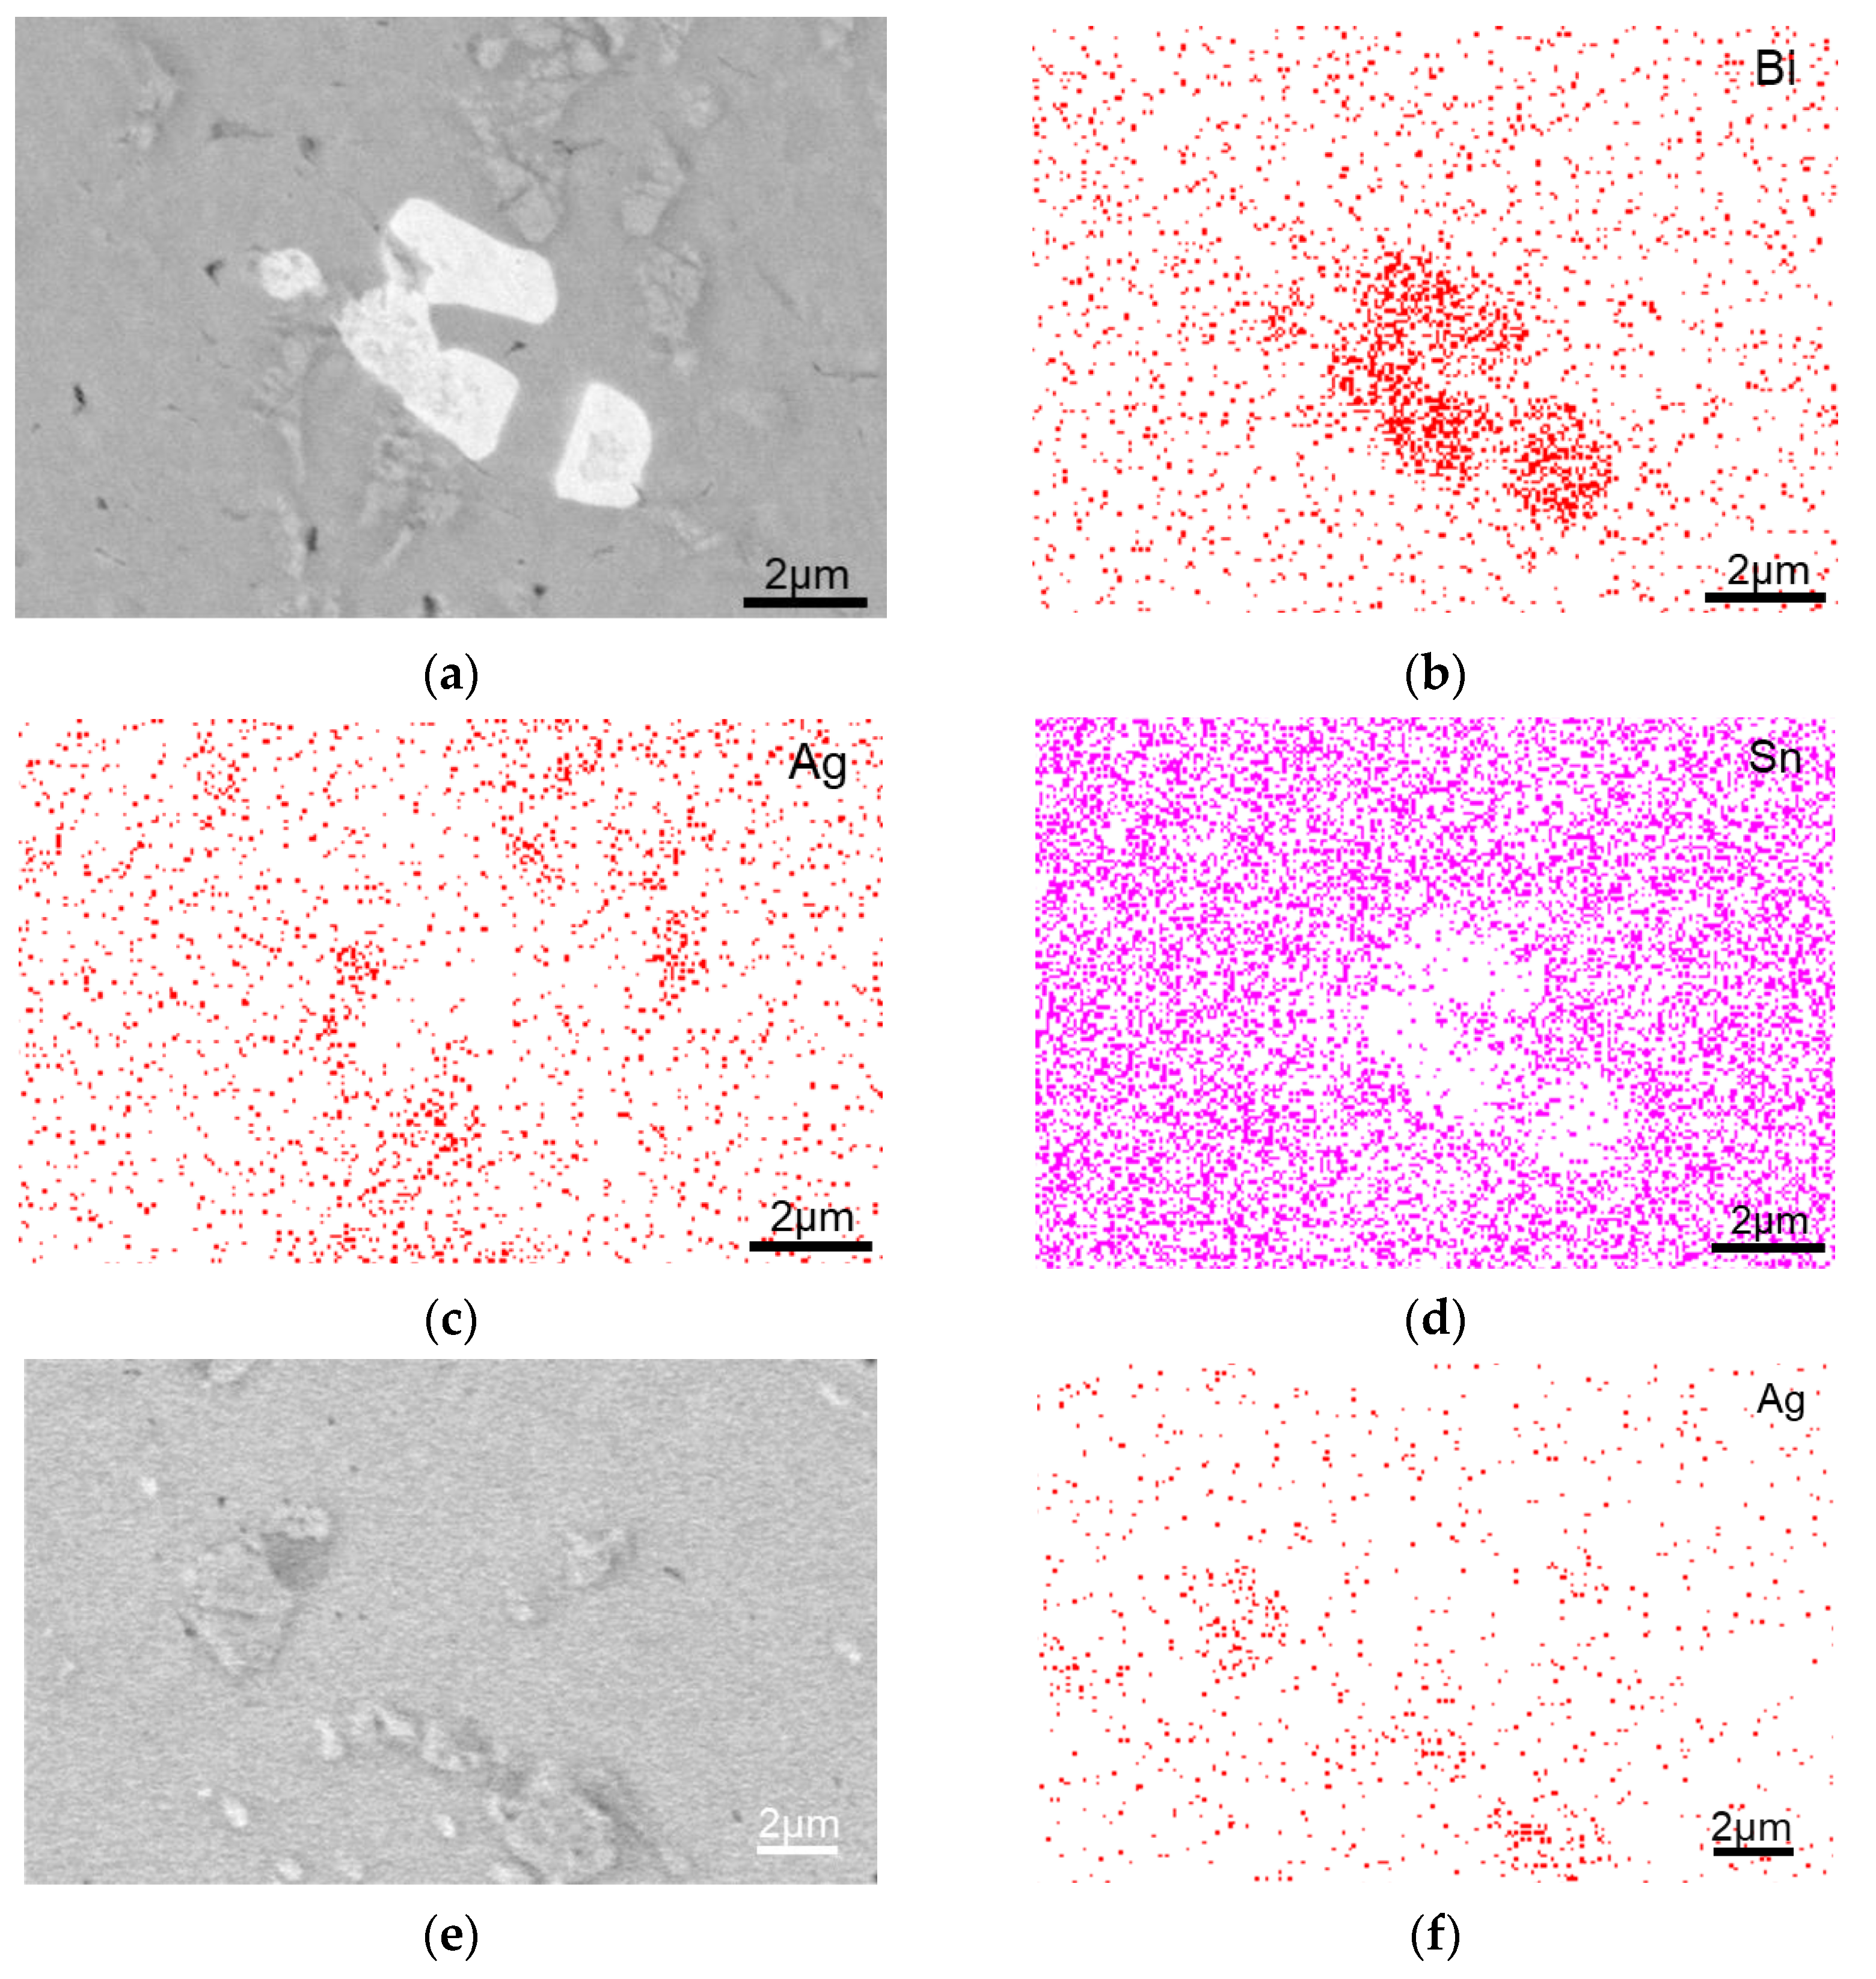
Several phases were observed in backscattered electron (BSE) SEM images, and EDS was used for phase identification [31]. In Figure 3, for the SAC305 + 3 wt.%Bi sample aged for 90 days at 125 °C, the backscattered electron micrograph of a region within the sample (Figure 3a) is shown along with the EDS mapping of Bi (Figure 3b), Ag (Figure 3c), and Sn (Figure 3d) for the same region. The bright phase was rich in Bi, the grey particles were rich in Ag, and the matrix was Sn-rich. Figure 3e,f show the BSE image and EDS Ag mapping of another region, where gray particles that are rich in Ag were seen scattered in the Sn-rich matrix. Correlating these results to the phase diagrams of Sn-Ag and Sn-Bi [32,33], the Ag-rich particles were identified as Ag3Sn, the Bi-rich phase was identified as Bi precipitate, and the matrix was identified as elemental β-Sn. The phases determined from the SEM/EDS studies were consistent with literature reports of similar SAC + Bi alloys [8,34].
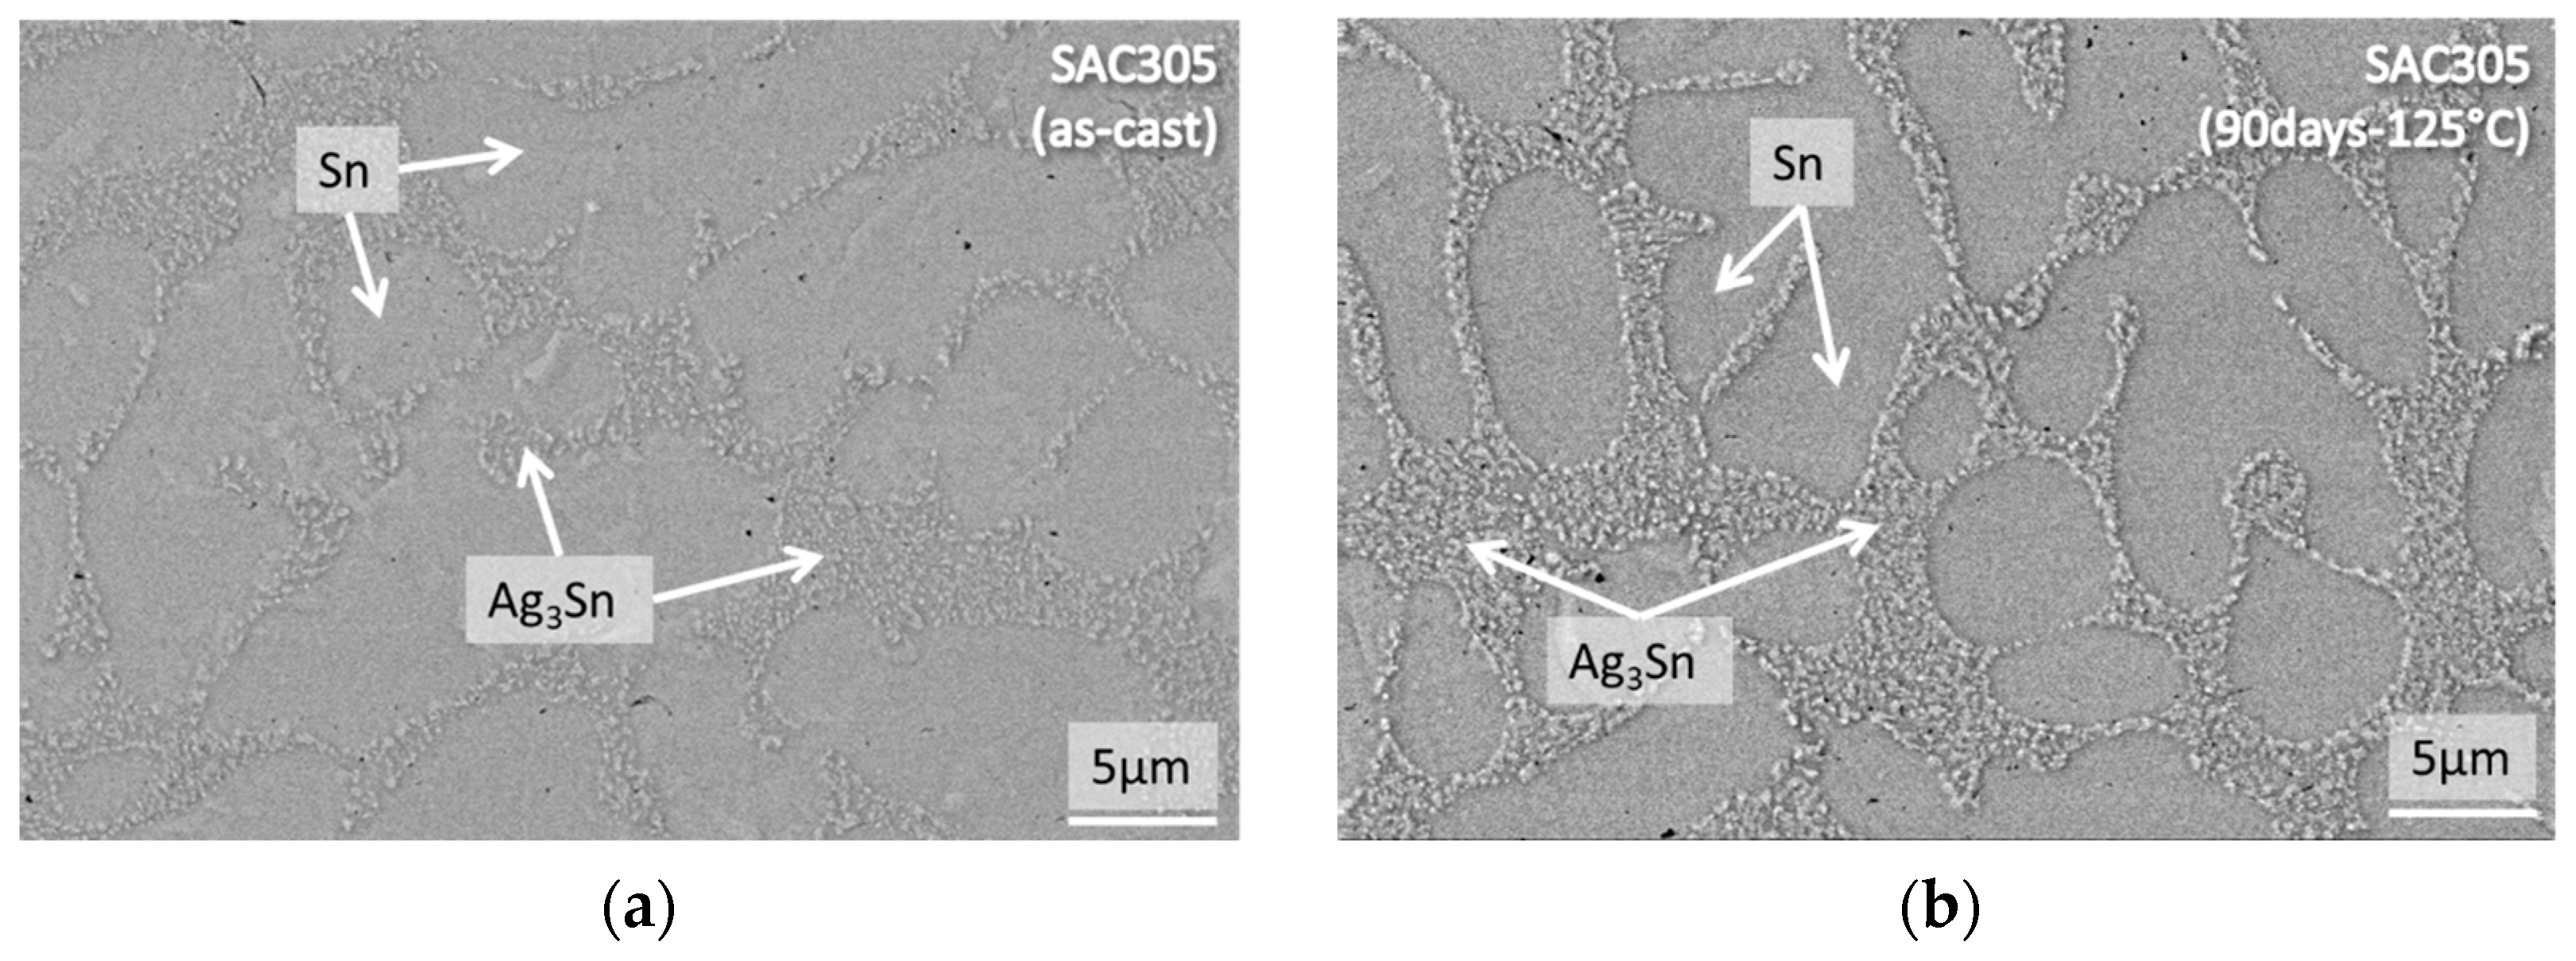
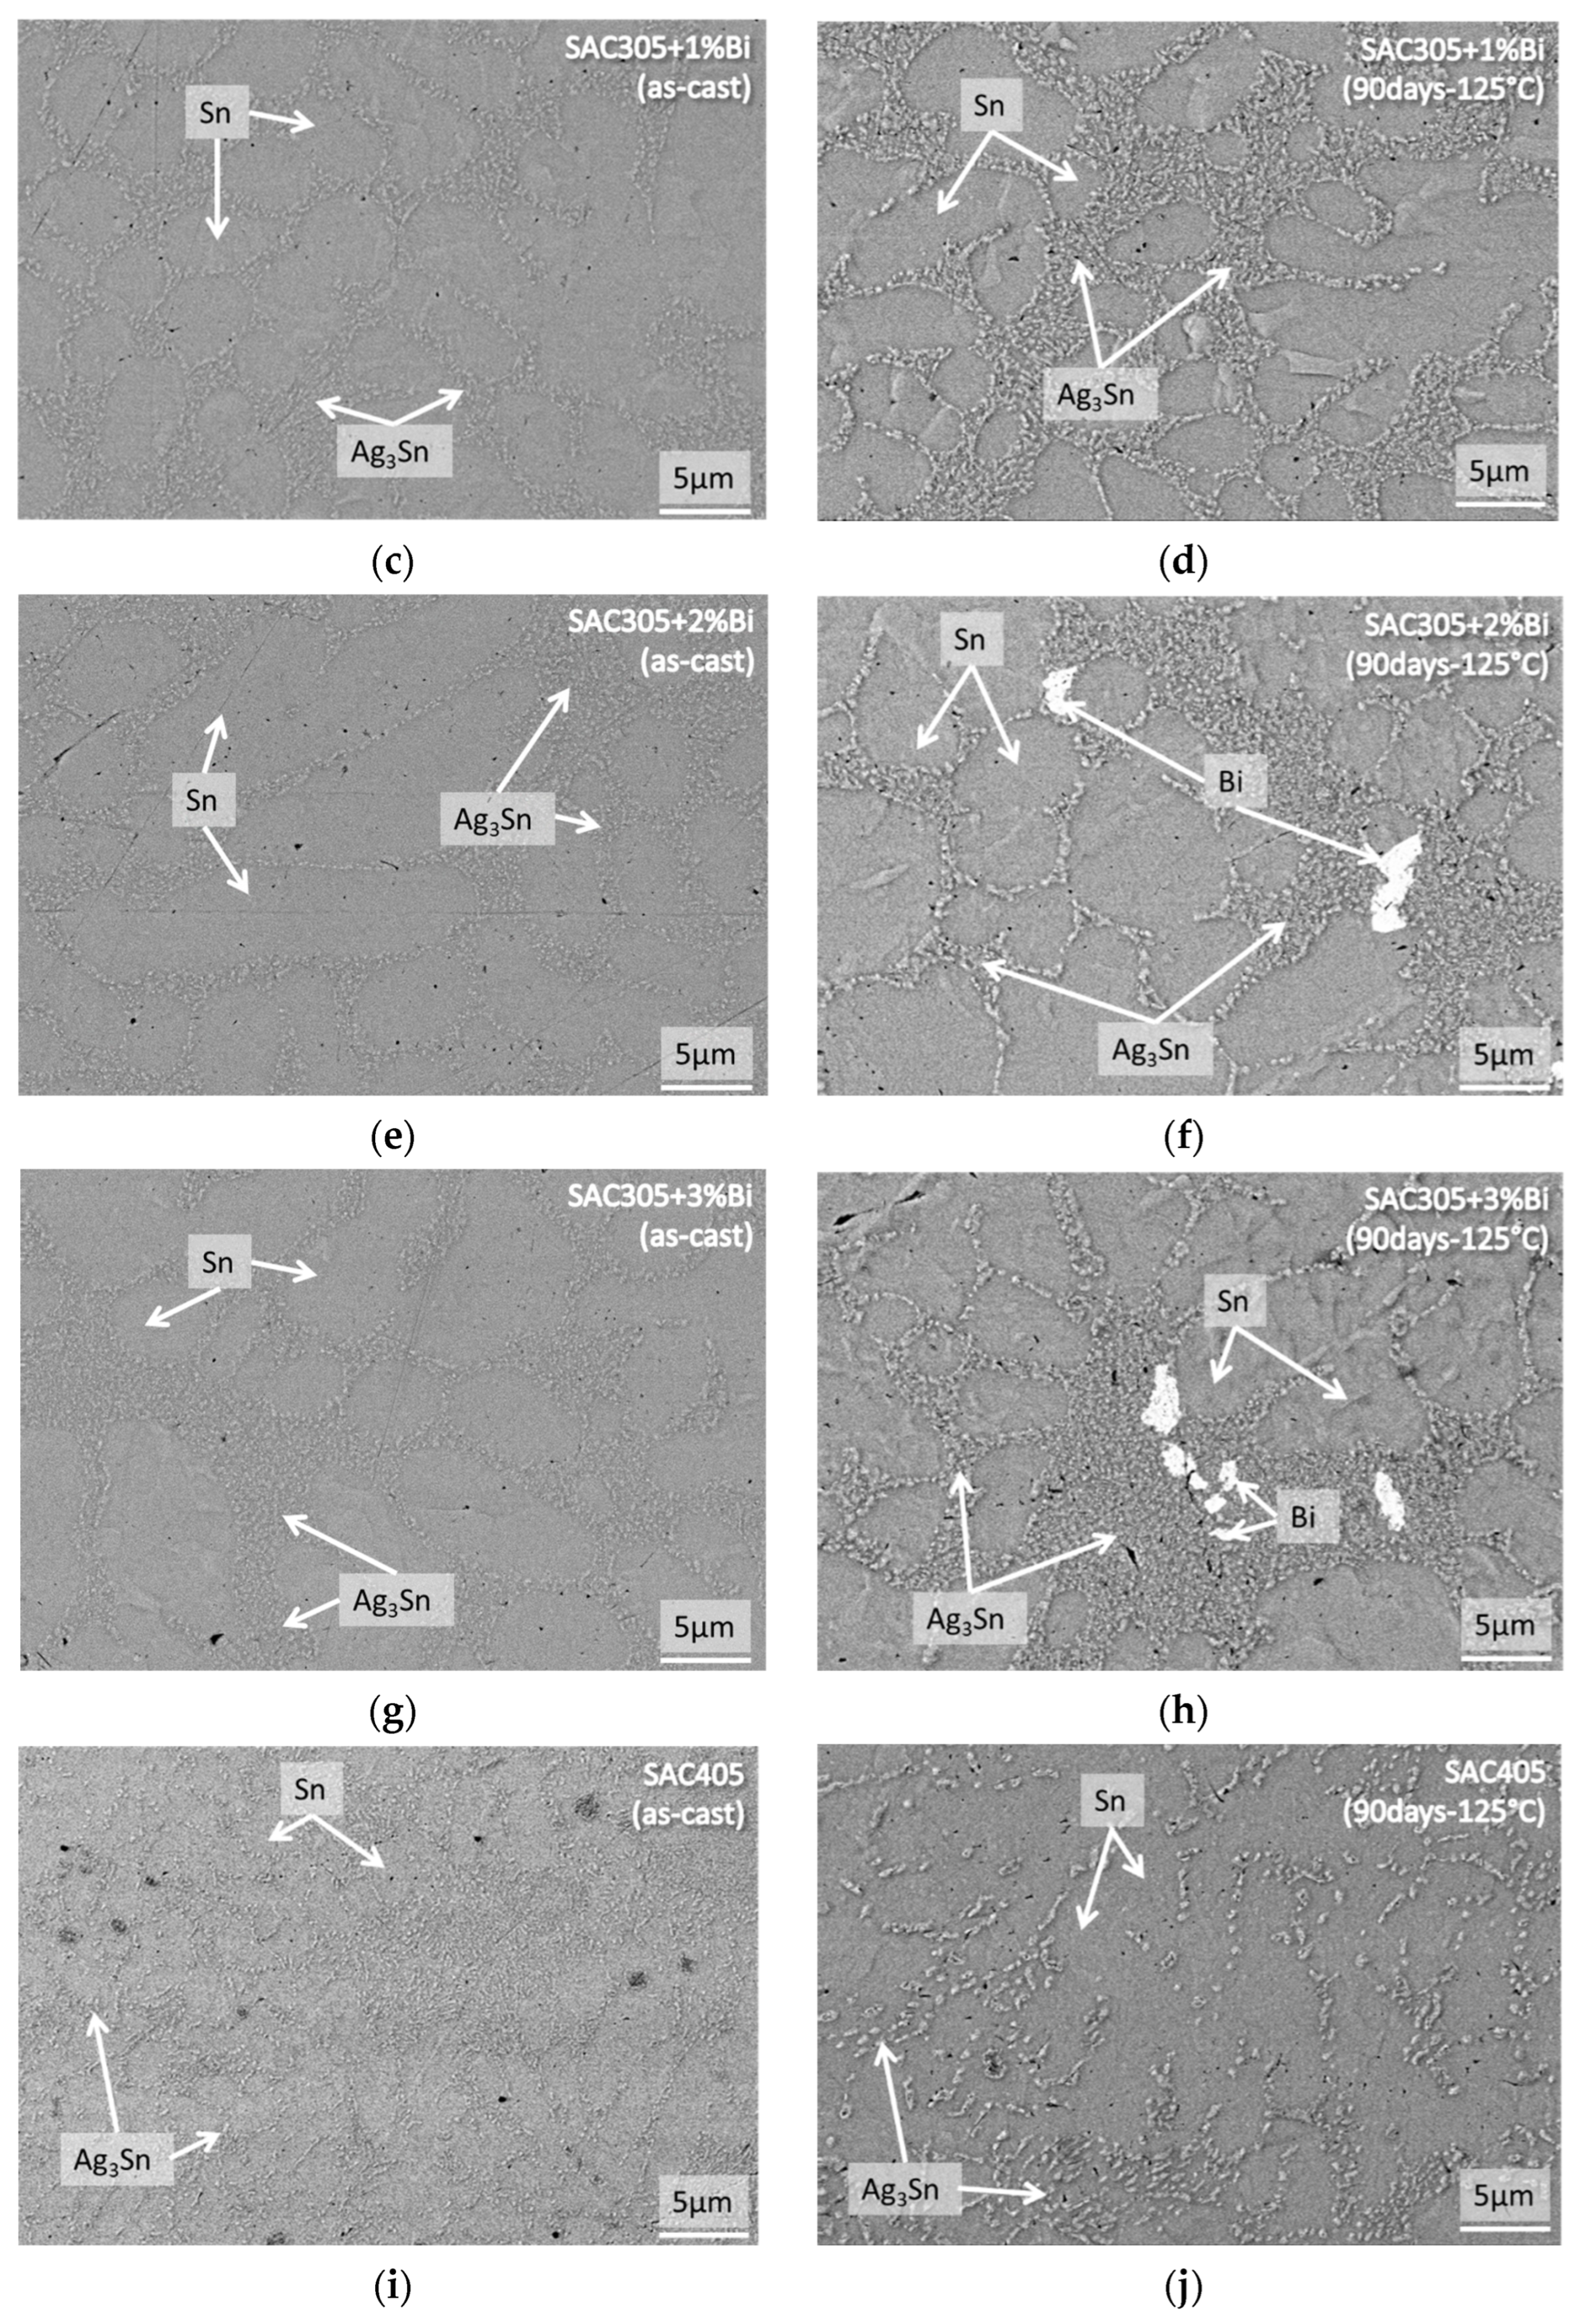
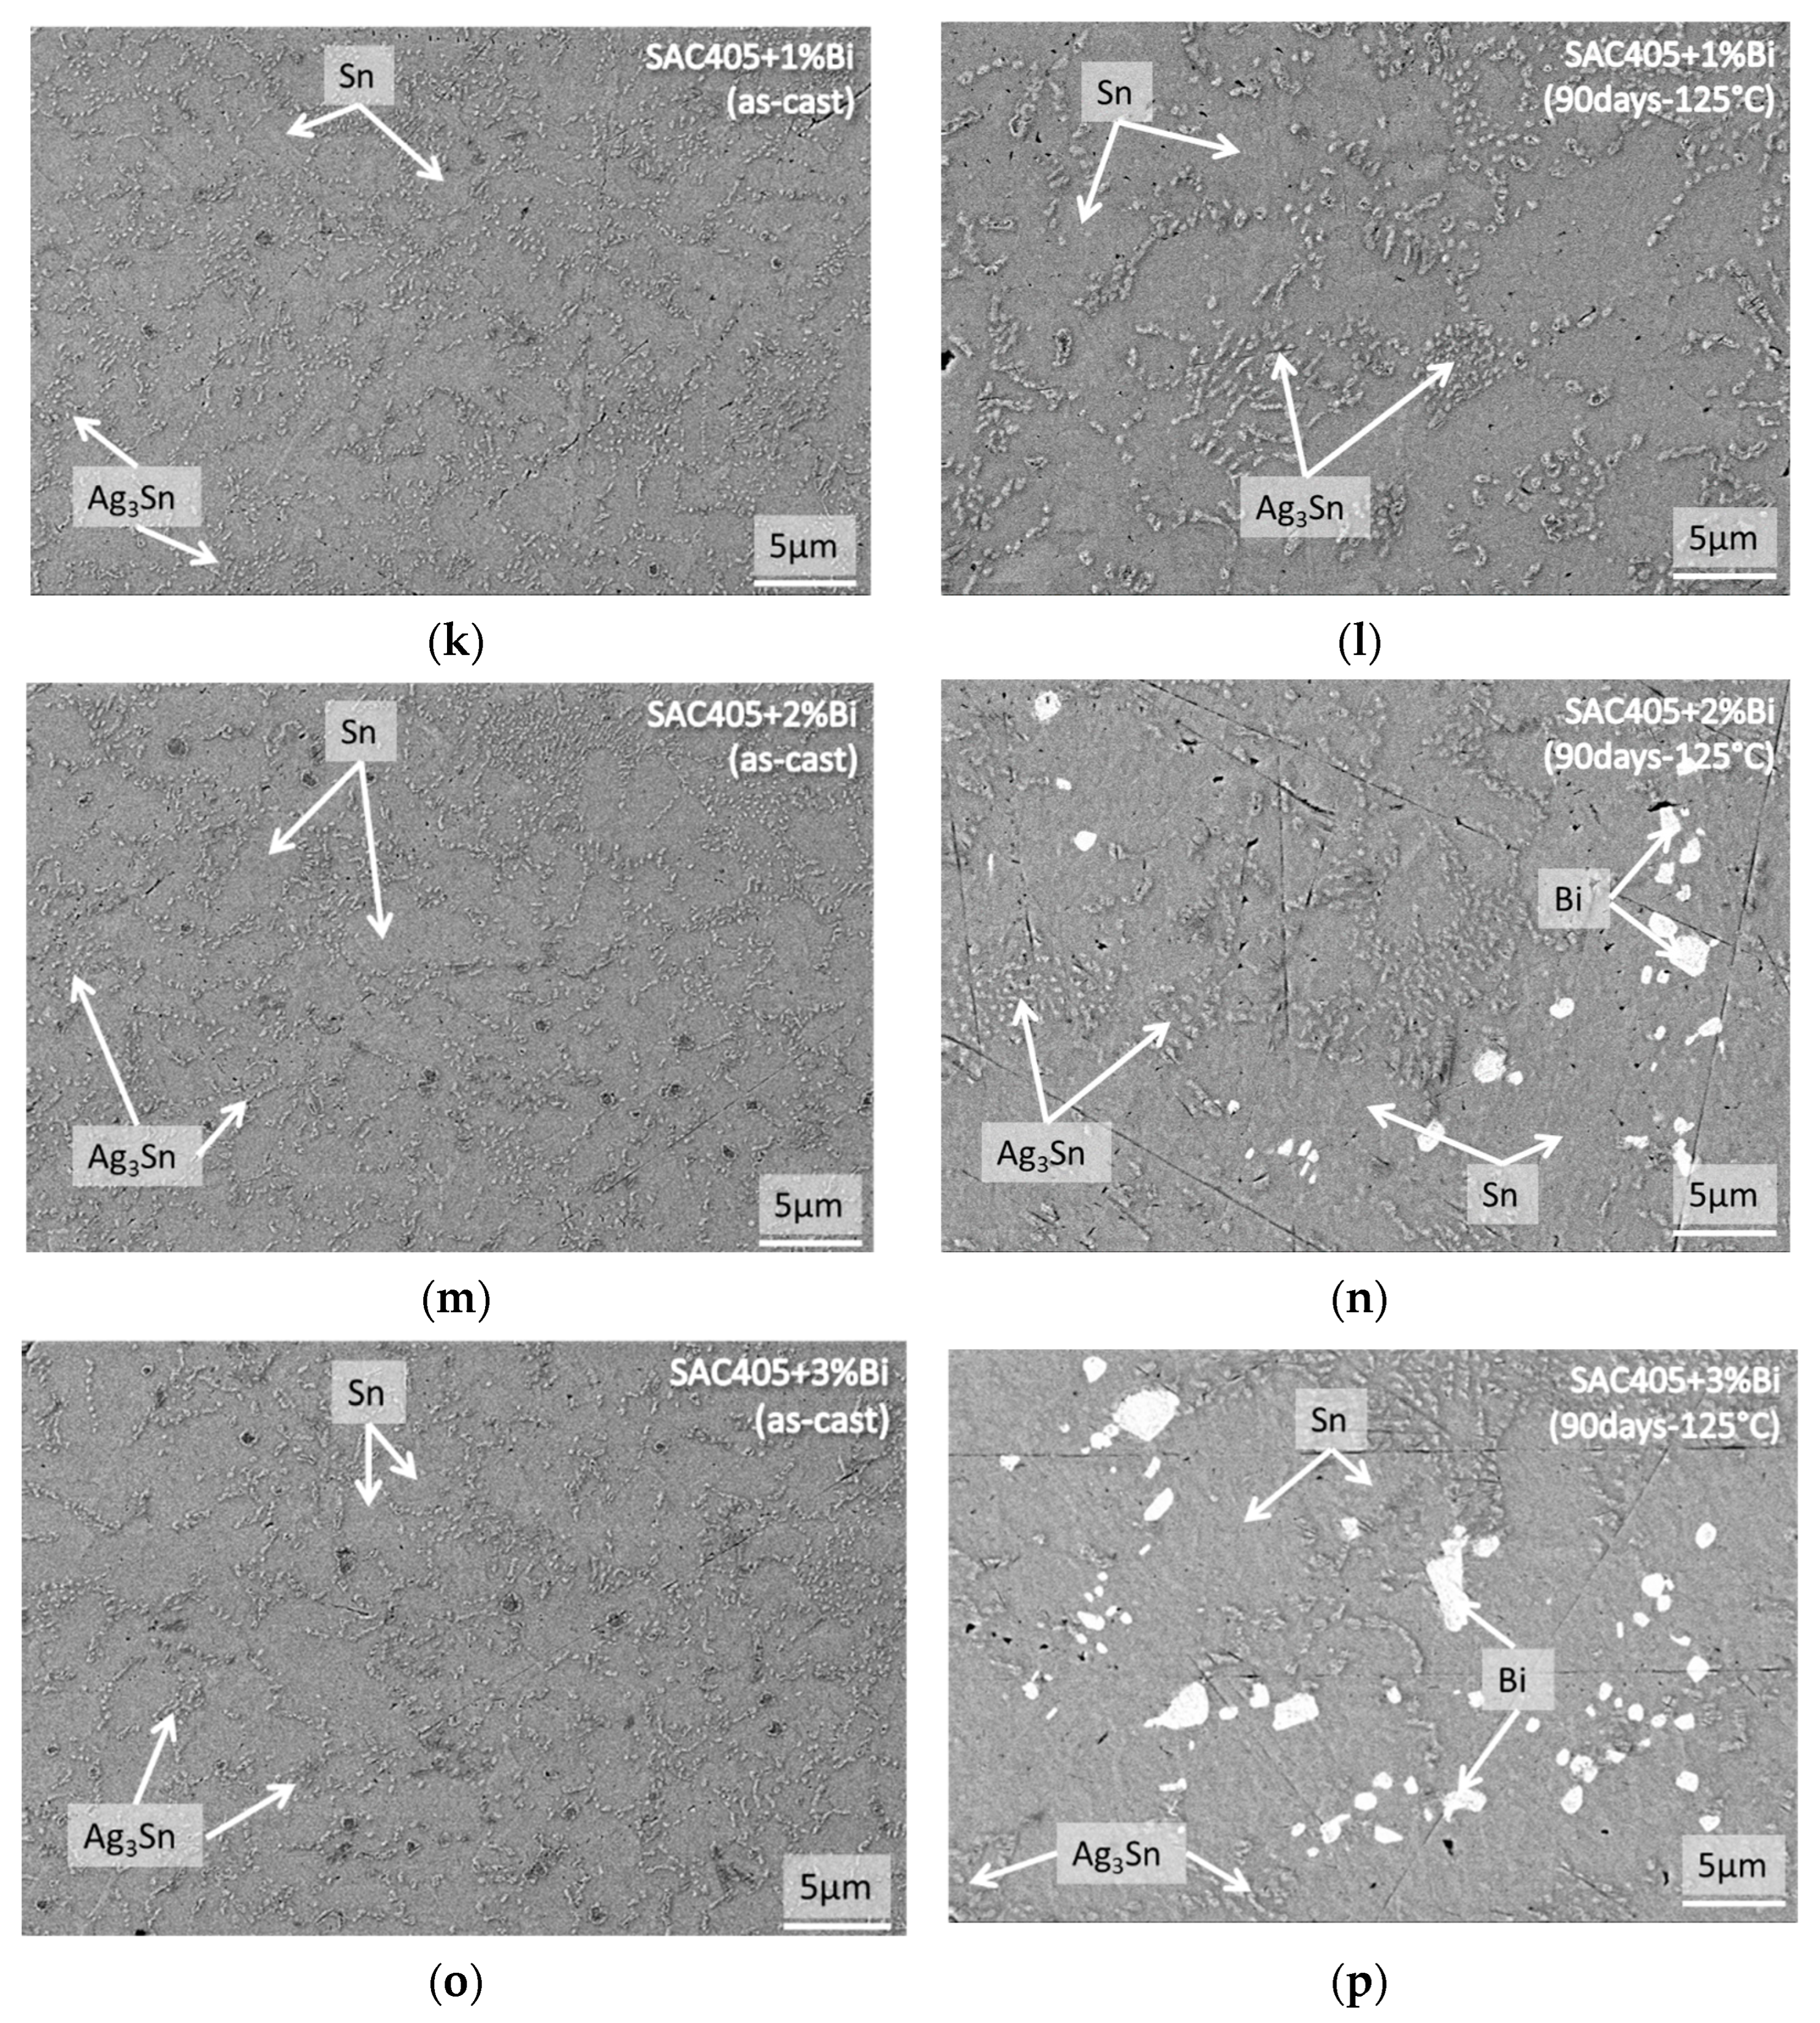
Figure 4 shows backscattered electron images of representative samples. In the as-cast condition, SAC305 + x wt.%Bi microstructures were found to be pseudo-eutectic [35], as shown in Figure 4a,c,e,g with primary β-Sn dendrites and Ag3Sn intermetallic compounds (IMCs) in the interdendritic regions, while SAC405 + x wt.%Bi in the as-cast condition showed microstructures with Ag3Sn IMC dispersed in the β-Sn matrix, as shown in Figure 4i,k,m,o. After subjecting the alloys to isothermal aging for 90 days at 125 °C, it was observed that IMCs coarsen in all alloys, but the coarsening is suppressed in 2 to 3 wt.% Bi-containing alloys, as shown in Figure 4b,d,f,h,j,l,n,p. Suppressed IMC kinetics is attributed to the ability of Bi to retard IMC growth kinetics [35]. The coarsening of IMCs is expected to reduce the strength of the alloys as the ability of IMC particles to strengthen the matrix is inversely proportional to the spacing between particles [36,37]. On the other hand, for the SAC305 + 2 wt.%Bi, SAC305 + 3 wt.%Bi, SAC405 + 2 wt.%Bi, and SAC405 + 3 wt.%Bi alloys, the matrix showed the presence of Bi precipitates after aging, as shown in Figure 4f,h,n,p, which is expected to significantly increase tensile strength because of precipitation strengthening.

4. Discussion

To obtain a sample with a microstructure resembling that of a reflowed solder joint, it is important to attain a cooling rate comparable to that of reflow soldering during the casting of the samples, particularly in the beginning of the solidification process. The JEDEC standard J-STD-020F recommends a cooling rate of less than 6 °C/s for the beginning of temperature ramp-down for reflow soldering [38]. To verify that the cooling rate of the solder sample cast using the method outlined in Section 2.1 resembles that in reflow soldering, an analysis of the heat transfer problem was conducted. For simplification, the glass tube was modeled as a cylinder with an inner radius of ri and an outer radius of ro (Figure 5). The solder sample, with length l, was initially assumed to be at a uniform temperature equal to the melting temperature, Tm, while the temperature of the surrounding water bath was constantly maintained at Tw. As the sample was cooled by water, assuming the temperature in the solder remains uniform, a simple lumped system analysis was applied to model the temperature change of the solder over time, T(t). Heat transfer through the tube can be modeled as one dimensional, with the temperature of the tube depending only on the radial direction (r). In the heat transfer analysis, the temperatures on the inner and outer surfaces of the cylinder were assumed to match those of the solder and the water bath, i.e., T(t) and Tw, respectively. This assumption neglects the thermal resistance between the solder and the inner surface of the cylinder, as well as between the outer surface and the water.
The molten solder and glass assembly was quenched in water immediately after it was introduced into the glass tube and began to solidify. An energy balance on the solder was established for a differential time interval dt. The energy lost by the solder during this interval dt is described by Equation (10) [39]:
d Q = m . c . d T
where m represents the mass of the solder, c is the specific heat capacity of the solder, and dT is the differential temperature drop in the solder during dt. The energy loss by the solder is equivalent to the heat transferred through the glass tube. The heat transferred by a cylindrical tube over time dt is given by Equation (11) [40]:
d Q = T ( t ) T w ln ( r 0 / r i ) 2 π k l d t
where k is the thermal conductivity of the glass tube, l is the length of the cast solder sample, ri and r0 are the inner and outer radii of the glass tube, Tw is the temperature of water bath, and T(t) represents the temperature of the solder at any time t. Utilizing Equations (10) and (11), Equation (12) is derived as:
m . c . d T = T T w l n ( r 0 / r i ) 2 π k l d t
Equation (12) can be rearranged to obtain Equation (13) as follows:
d T T T w = d t m   c   l n ( r 0 / r i ) 2 π k l
By integrating from t = 0, at which T = Tm, to any time t, at which T = T(t), the following equations can be obtained:
T m T d T T T w = 0 t d t m   c   l n ( r 0 / r i ) 2 π k l
ln T t T w T m T w = 2 π k l m   c   l n ( r 0 / r i ) t
Equation (15) can be re-written as follows to describe the normalized temperature change in the solder over time:
T t T w T m T w = e b t
where b is defined as:
b = 2 π k l m   c   l n ( r 0 / r i )
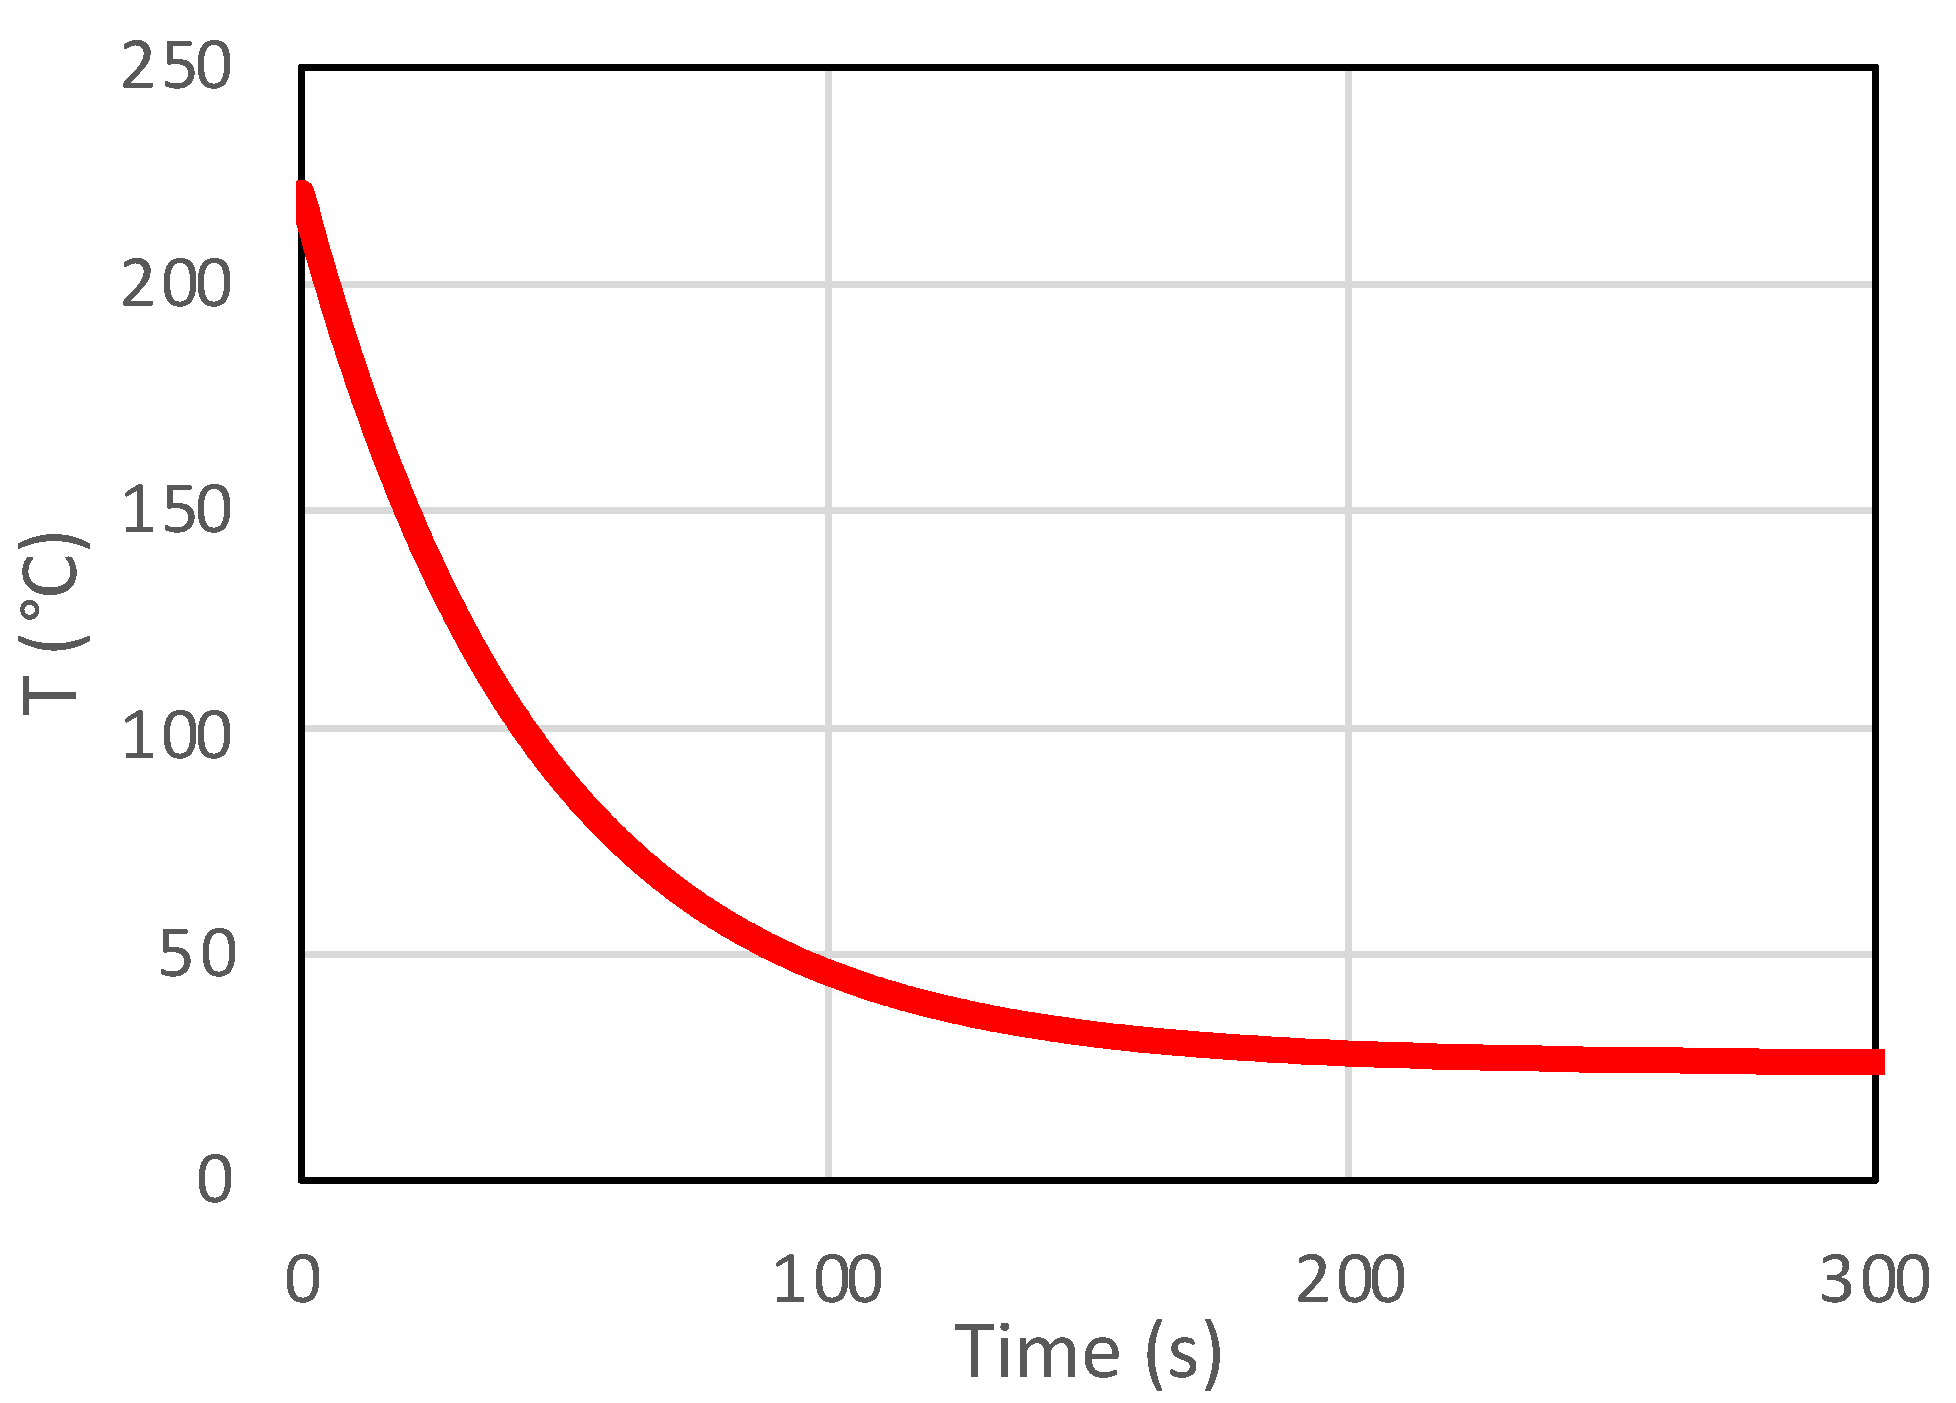
Values of the constants used in Equation (16) for calculating the solder temperature are as follows: sample length (l) of 50 mm, inner radius (ri) of 1.5 mm, outer radius (ro) of 7.5 mm, thermal conductivity of glass (k) of 1.15 W/mK, density of solder of 7.49 g/cm3 (for calculating m), specific heat capacity of solder (c) of 0.232 J/gK, and water bath temperature of 25 °C, and the melting temperatures of solder (Tm) used in this study are between 220 °C and 230 °C. The temperature versus time plot is shown in Figure 6 for Tm = 220 °C. For all solders, the cooling rate in the beginning 20 s of ramp-down was found to be between 3.5 °C/s and 3.7 °C/s, which is comparable to the cooling rate used in the solder reflow process. This analysis confirms that the cooling rate experienced by the samples is comparable to the cooling rate in a typical solder reflow process, ensuring that the microstructures and thus the properties of the samples are similar to the solder joints used in applications.
Tensile tests conducted at both ambient and elevated temperatures on the eight alloys for all aging conditions demonstrate the consistent viscoplastic behavior of SAC-Bi alloys. A tensile test conducted at higher strain rates results in increased tensile strength across all alloy compositions and at all three testing temperatures, consistent with the observations by Hassan et al. [27]. In their as-cast conditions, all eight alloys exhibit similar tensile strength across all combinations of strain rates and testing temperatures, as shown in Figure 2a,c,e,g,i,k,m,o. As aging progresses, the effect of Bi doping in SAC305 and SAC405 becomes evident. Ninety days of isothermal aging at 125 °C significantly reduced the tensile strength of SAC305 and SAC405 alloys, as shown in Figure 2b,j. This reduction in the strength of SAC305 and SAC405 with aging is attributed to the coarsening of IMCs, resulting in increased interparticle spacing and less impedance of dislocation movement [41]. A similar, though less pronounced, reduction in tensile strength after aging is observed in the SAC305 + 1 wt.%Bi and SAC405 + 1 wt.%Bi alloys, as shown in Figure 2d,l. This can be attributed to solid solution strengthening [42] by Bi solute atoms, which lessens the decrease in tensile strength compared with that observed in the SAC305 and SAC405 alloys. Adding 2 wt.% Bi and 3 wt.%Bi to either SAC305 or SAC405 results in retained or slightly increased tensile strength after aging, as shown in Figure 2f,h,n,p. Since Bi has limited solubility in SAC305 and SAC405 [43], precipitates of Bi are expected to form in the alloy matrix for any composition that has 2 wt.% or more Bi. Bi precipitates develop progressively with aging because of the non-equilibrium solidification in reflowed solder joints [43]. The observed improvement in tensile strength with high-temperature storage is thus attributed to precipitation strengthening by Bi. The Anand parameters of SAC-Bi alloys containing 1, 2, and 3% Bi in the as-cast condition revealed in this study have the same order of magnitude as those found by Hassan et al. [27]. The viscoplastic behaviors of the SAC-Bi alloys and their change due to aging must be considered when simulating the behaviors of solder joints. The Anand parameters calculated for SAC-Bi alloys in aged conditions are a novel contribution of this study that provides essential inputs for these models. Apart from components made using conventional techniques such as reflow, additively manufactured components are gaining increasing importance in the semiconductor industry because of advantages such as their free form factor and shape, easier handling, less material wastage, and sequential approach for multilayer packages [44] for various important applications [45]. Therefore, future studies could also investigate the viscoplasticity of materials for additively manufactured components.

5. Conclusions

A detailed study was conducted to investigate the effect of Bi doping on the tensile and viscoplastic behaviors of SAC305 and SAC405 solder alloys. Eight alloys including SAC305, SAC305 + 1 wt.%Bi, SAC305 + 2 wt.%Bi, SAC305 + 3 wt.%Bi, SAC405, SAC405 + 1 wt.%Bi, SAC405 + 2 wt.%Bi, and SAC405 + 3 wt.%Bi were cast, aged at three different temperatures for up to 90 days, and tensile-tested at ambient and elevated temperatures at three different constant strain rates. Heat transfer analysis was performed to confirm that the cooling rate experienced by the samples is similar to that of a typical solder reflow process, ensuring that the microstructures of the samples closely resemble those of solder joints used in practical applications. Microstructural analyses were carried out to discuss microstructural causations of these property changes. The following conclusions are drawn from the results:
  • When up to 1 wt.% Bi was added to SAC alloys, it existed as solute atoms in the alloy matrix. As aging progressed, SAC305, SAC305 + 1 wt.%Bi, SAC405, and SAC405 + 1 wt.%Bi alloys experienced a reduction in strength. The reduction was less pronounced in SAC305 + 1 wt.%Bi and SAC405 + 1 wt.%Bi because of solution strengthening by Bi solutes. However, the effect from solid solution strengthening was not sufficient to counteract the reduction in strength by 21 to 43% due to aging-induced coarsening of the IMCs.
  • When 2 to 3 wt.% Bi was added to SAC alloys, the Bi exceeded the alloy’s solubility, and precipitates formed progressively with aging. The strength of SAC305 + 2 wt.%Bi, SAC305 + 3 wt.%Bi, SAC405 + 2 wt.%Bi, and SAC405 + 3 wt.%Bi increased after aging by around 6 to 10%, attributed to the formation of Bi precipitates.
  • Anand viscoplastic parameters for all eight alloys in both the as-cast and nine aging conditions were obtained, which will enable the modeling of these SAC-Bi alloys as solder joints for advanced packaging applications.
  • The results reveal the important role of Bi in aging-induced changes in microstructure and mechanical properties. The new findings of this study include revealing the evolution of SAC-Bi microstructures, particularly the precipitation of Bi with aging in SAC doped with 2 to 3% Bi, and the calculation of Anand parameters of SAC-Bi alloys in various aging durations.
Future work will entail applying the obtained Anand parameters in finite element analysis (FEA) to investigate stress and reliability at the packaging level. Parametric studies by FEA will also be carried out to investigate the Anand model efficiency with statistical outputs. Additional aging conditions will be studied. Future studies could also investigate the viscoplasticity of materials for additively manufactured components.

Author Contributions

Conceptualization, V.S., P.S., O.A., and T.J.; methodology, V.S.; validation, V.S.; formal analysis, V.S. and T.T.; investigation, V.S., resources, T.J., P.S., and O.A.; data curation, V.S.; writing—original draft preparation, V.S.; writing—review and editing, T.J., P.S., O.A., and T.T.; supervision, T.J.; project administration, T.J.; funding acquisition, P.S. and T.J. All authors have read and agreed to the published version of the manuscript.

Funding

This research was funded by Juniper Networks, grant number GR104454.

Institutional Review Board Statement

Not applicable.

Informed Consent Statement

Not applicable.

Data Availability Statement

The raw data supporting the conclusions of this article will be made available by the authors on request.

Acknowledgments

The authors acknowledge AMPAC for providing access to various materials characterization facilities. Article processing charges were provided in part by the UCF College of Graduate Studies Open Access Publishing Fund.

Conflicts of Interest

The authors declare that this study received funding from Juniper Networks. Authors O.A. and P.S., who are employed by Juniper Networks, were involved in the conceptualization of the work. The remaining authors declare that the research was conducted in the absence of any commercial or financial relationships that could be construed as a potential conflict of interest.

References

  1. Shnawah, D.; Sabri, M.; Badruddin, I. A review on thermal cycling and drop impact reliability of SAC solder joint in portable electronic products. Microelectron. Reliab. 2012, 52, 90–99. [Google Scholar] [CrossRef]
  2. Char, M.; Chakraborty, A.; Bhattacharya, A.; Kar, A. A Comparative Study on the Influence of SAC305 Lead-Free Solder Sandwiched by Sn on the Micromechanical and Electrical Properties of the Joints. Adv. Eng. Mater. 2022, 24, 2100679. [Google Scholar] [CrossRef]
  3. Chowdhury, M.M.R.; Hoque, M.A.; Fahim, A.; Suhling, J.C.; Hamasha, S.; Lall, P. Microstructural Evolution in SAC305 and SAC-Bi Solders Subjected to Mechanical Cycling. In Proceedings of the ASME 2018 International Technical Conference and Exhibition on Packaging and Integration of Electronic and Photonic Microsystems, San Francisco, CA, USA, 27–30 August 2018; p. V001T03A007. [Google Scholar] [CrossRef]
  4. Chauhan, P.; Mukherjee, S.; Osterman, M.; Dasgupta, A.; Pecht, M. Effect of Isothermal Aging on Microstructure and Creep Properties of SAC305 Solder: A Micromechanics Approach. In Proceedings of the ASME 2013 International Technical Conference and Exhibition on Packaging and Integration of Electronic and Photonic Microsystems, Burlingame, CA, USA, 16–18 July 2013; Volume 1, p. V001T07A009. [Google Scholar] [CrossRef]
  5. Abdullah, I.; Zulkifli, M.N.; Jalar, A.; Ismail, R.; Ambak, M.A. Relationship of Mechanical and Micromechanical Properties with Microstructural Evolution of Sn-3.0Ag-0.5Cu (SAC305) Solder Wire Under Varied Tensile Strain Rates and Temperatures. J. Electron. Mater. 2019, 48, 2826–2839. [Google Scholar] [CrossRef]
  6. Depiver, J.A.; Mallik, S.; Amalu, E. Comparing and Benchmarking Fatigue Behaviours of Various SAC Solders under Thermo-Mechanical Loading. In Proceedings of the 2020 IEEE 8th Electronics System-Integration Technology Conference (ESTC), Tønsberg, Norway, 15–18 September 2020; pp. 1–11. [Google Scholar] [CrossRef]
  7. Pal, M.K.; Gergely, G.; Horváth, D.K.; Gácsi, Z. Microstructural Investigations and Mechanical Properties of Pure Lead-Free (Sn-3.0Ag-0.5Cu and Sn-4.0Ag-0.5Cu) Solder Alloy. Metall. Mater. Eng. 2018, 24, 27–36. [Google Scholar] [CrossRef]
  8. Jian, M.; Hamasha, S.; Alahmer, A.; Hamasha, M.; Wei, X.; Belhadi, M.E.A.; Hamasha, K. Analysis and Modeling of Aged SAC-Bi Solder Joints Subjected to Varying Stress Cycling Conditions. Materials 2023, 16, 750. [Google Scholar] [CrossRef]
  9. Cai, C.; Xu, J.; Wang, H.; Park, S.B. A comparative study of thermal fatigue life of Eutectic Sn-Bi, Hybrid Sn-Bi/SAC and SAC solder alloy BGAs. Microelectron. Reliab. 2021, 119, 114065. [Google Scholar] [CrossRef]
  10. Haq, M.A.; Hoque, M.A.; Suhling, J.C.; Lall, P. Effect of Bismuth Content on the Mechanical Cyclic Properties of SAC+Bi Lead Free Solders. In Proceedings of the 2021 IEEE 71st Electronic Components and Technology Conference (ECTC), San Diego, CA, USA, 1 June–4 July 2021; 1797-1804. [Google Scholar] [CrossRef]
  11. Lall, P.; Mehta, V.; Suhling, J.; Blecker, K. Mechanical Properties of Doped Solder SAC-Q for High Strain Rate Testing at Extreme Surrounding Temperatures for 6 Months of Isothermal Aging. J. Electron. Packag. 2024, 146, 031006. [Google Scholar] [CrossRef]
  12. Belhadi, M.E.A.; Akkara, F.J.; Athamenh, R.; Abueed, M.; Hamasha, S.; Ali, H.; Suhling, J.; Lall, P. The Effect of Bi on the Mechanical Properties of Aged SAC Solder Joint. In Proceedings of the 2020 19th IEEE Intersociety Conference on Thermal and Thermomechanical Phenomena in Electronic Systems (ITherm), Orlando, FL, USA, 21–23 July 2020; pp. 1100–1105. [Google Scholar] [CrossRef]
  13. Shukla, V.; Ayers, N.; Moreno, A.; Crutchfield, N.; Lyons, D.; Ahmed, O.; Su, P.; Glasauer, B. The Effects of Bi Doping and Aging on Viscoplasticity of Sn-Ag-Cu-Bi alloys. In Proceedings of the 2022 IEEE 72nd Electronic Components and Technology Conference (ECTC), San Diego, CA, USA, 31 May–3 June 2022; pp. 1687–1694. [Google Scholar] [CrossRef]
  14. Shukla, V.; Ahmed, O.; Jalilvand, G.; Mehta, A.; Su, P.; Jiang, T. Effects of Aging on Microstructure and Mechanical Properties of Sn-Ag-Cu-Bi Solder Alloys. In Proceedings of the 2021 IEEE 71st Electronic Components and Technology Conference (ECTC), San Diego, CA, USA, 1 June–4 July 2021; pp. 667–672. [Google Scholar] [CrossRef]
  15. Ahsan, M.A.; Hasan, S.M.K.; Fahim, A.; Suhling, J.C.; Lall, P. Mechanical Property Evolution in SAC+Bi Lead Free Solders Subjected to Various Thermal Exposures. In Proceedings of the 2021 20th IEEE Intersociety Conference on Thermal and Thermomechanical Phenomena in Electronic Systems (iTherm), San Diego, CA, USA, 1–4 June 2021; pp. 700–7007. [Google Scholar] [CrossRef]
  16. Maalekian, M.; Xu, Y.; Seelig, K. Effect of Bi content on properties of low silver SAC solders. In Proceedings of the SMTA International, Rosemont, IL, USA, 27 September–1 October 2015; pp. 191–198. [Google Scholar]
  17. Yang, T.; Chen, Y.; You, K.; Dong, Z.; Jia, Y.; Wang, G.; Peng, J.; Cai, S.; Luo, X.; Liu, C.; et al. Effect of Bi, Sb, and Ti on Microstructure and Mechanical Properties of SAC105 Alloys. Materials 2022, 15, 4727. [Google Scholar] [CrossRef] [PubMed]
  18. Hu, S.; Lin, T.; Kao, C.; Huang, F.; Tsai, Y.; Hsiao, S.; Kuo, J. Effects of bismuth additions on mechanical property and microstructure of SAC-Bi solder joint under current stressing. Microelectron. Reliab. 2021, 117, 114041. [Google Scholar] [CrossRef]
  19. Syed, A.; Lin, W.; Sohn, E.; Cha, S. Plastic Deformation and Life Prediction of Solder Joints for Mechanical Shock and Drop/Impact Loading Conditions. In Proceedings of the 57th Electronic Components and Technology Conference, Sparks, NV, USA, 29 May–1 June 2007; pp. 507–514. [Google Scholar] [CrossRef]
  20. Nguyen, T.; Park, S. Characterization of elasto-plastic behavior of actual SAC solder joints for drop test modeling. Microelectron. Reliab. 2011, 51, 1385–1392. [Google Scholar] [CrossRef]
  21. Ahmed, S.; Basit, M.; Suhling, J.; Lall, P. Characterization of Doped SAC Solder Materials and Determination of Anand Parameters. In Proceedings of the ASME 2015 International Technical Conference and Exhibition on Packaging and Integration of Electronic and Photonic Microsystems collocated with the ASME 2015 13th International Conference on Nanochannels, Microchannels, and Minichannels, San Francisco, CA, USA, 6–9 July 2015; Volume 2, p. V002T01A003. [Google Scholar] [CrossRef]
  22. Ahmed, S.; Suhling, J.; Lall, P. The anand parameters of aging resistant doped solder alloys. In Proceedings of the 2017 16th IEEE Intersociety Conference on Thermal and Thermomechanical Phenomena in Electronic Systems (ITherm), Orlando, FL, USA, 30 May–2 June 2017; pp. 1416–1424. [Google Scholar] [CrossRef]
  23. Wang, G.Z.; Cheng, Z.N.; Becker, K.; Wilde, J. Applying Anand Model to Represent the Viscoplastic Deformation Behavior of Solder Alloys. ASME J. Electron. Packag. 2001, 123, 247–253. [Google Scholar] [CrossRef]
  24. Zhang, L.; Liu, Z.; Yu, J. Anand constitutive model of lead-free solder joints in 3D IC device. J. Phys. Conf. Ser. 2016, 738, 012050. [Google Scholar] [CrossRef]
  25. Motalab, M.; Cai, Z.; Suhling, J.; Lall, P. Determination of Anand constants for SAC solders using stress-strain or creep data. In Proceedings of the 13th InterSociety Conference on Thermal and Thermomechanical Phenomena in Electronic Systems, San Diego, CA, USA, 30 May–1 June 2012; pp. 910–922. [Google Scholar] [CrossRef]
  26. Basit, M.; Ahmed, S.; Motalab, M.; Roberts, J.; Suhling, J.; Lall, P. The Anand parameters for SAC solders after extreme aging. In Proceedings of the 2016 15th IEEE Intersociety Conference on Thermal and Thermomechanical Phenomena in Electronic Systems (ITherm), Las Vegas, NV, USA, 31 May–3 June 2016; pp. 440–447. [Google Scholar] [CrossRef]
  27. Hassan, K.; Wu, J.; Alam, M.; Suhling, J.; Lall, P. The Effect of Bismuth Content on Mechanical Properties of SAC+Bi Lead Free Solder Materials and Determination of Anand Parameters. In Proceedings of the 2021 20th IEEE Intersociety Conference on Thermal and Thermomechanical Phenomena in Electronic Systems (iTherm), San Diego, CA, USA, 1–4 June 2021; pp. 933–940. [Google Scholar] [CrossRef]
  28. Motalab, M.; Mustafa, M.; Suhling, J.; Lall, P. Improved predictions of cyclic stress-strain curves for lead free solders using the Anand viscoplastic constitutive model. In Proceedings of the 2016 15th IEEE Intersociety Conference on Thermal and Thermomechanical Phenomena in Electronic Systems (ITherm), Las Vegas, NV, USA, 31 May–3 June 2016; pp. 471–480. [Google Scholar]
  29. Yule, L.; Harris, N.; Hill, M.; Zaghari, B.; Grundy, J. Temperature Hotspot Detection on Printed Circuit Boards (PCBs) Using Ultrasonic Guided Waves—A Machine Learning Approach. Sensors 2024, 24, 1081. [Google Scholar] [CrossRef] [PubMed]
  30. Cheng, Z.N.; Wang, G.Z.; Chen, L.; Wilde, J.; Becker, K. Viscoplastic Anand model for solder alloys and its application. Solder. Surf. Mt. Technol. 2000, 12, 31–36. [Google Scholar] [CrossRef]
  31. Gain, A.; Zhang, L. Temperature and humidity effects on microstructure and mechanical properties of an environmentally friendly Sn–Ag–Cu material. J. Mater. Sci. 2019, 54, 12863–12874. [Google Scholar] [CrossRef]
  32. Karakaya, I.; Thompson, W.T. The Ag-Sn (Silver-Tin) system. Bull. Alloy Phase Diagr. 1987, 8, 340–347. [Google Scholar] [CrossRef]
  33. Wang, F.; Huang, Y.; Zhang, Z.; Yan, C. Interfacial Reaction and Mechanical Properties of Sn-Bi Solder joints. Materials 2017, 10, 920. [Google Scholar] [CrossRef] [PubMed]
  34. Kaushik, R.K.; Batra, U.; Sharma, J.D. Structural, Thermal and Wetting Characteristics of Novel Low Bi-Low Ag Containing Sn–x.Ag–0.7Cu–1.0Bi (x = 0.5 to 1.5) Alloys for Electronic Application. Met. Mater. Int 2021, 27, 4550–4563. [Google Scholar] [CrossRef]
  35. Wang, S.; Yao, Y.; Long, X. Critical Review of Size Effects on Microstructure and Mechanical Properties of Solder Joints for Electronic Packaging. Appl. Sci. 2019, 9, 227. [Google Scholar] [CrossRef]
  36. Belhadi, M.; Hamasha, S.; Alahmer, A.; Zhao, R.; Prorok, B.; Soroosh, A. The Impact of Bi Content on the Coarsening Kinetics of IMC Particles and Creep Deformation Under Thermal Cycling. J. Electron. Mater. 2024, 53, 380–393. [Google Scholar] [CrossRef]
  37. Shnawah, D.; Sabri, M.; Badruddin, I.; Said, S.; Ariga, T.; Che, F. Effect of Ag Content and the Minor Alloying Element Fe on the Mechanical Properties and Microstructural Stability of Sn-Ag-Cu Solder Alloy Under High-Temperature Annealing. J. Electron. Mater. 2013, 42, 470–484. [Google Scholar] [CrossRef]
  38. JEDEC Solid State Technology Association. Moisture/Reflow Sensitivity Classification for Non-Hermitic Surface Mount Devices (SMDS) 2022, J-STD-020F. Available online: https://www.jedec.org/standards-documents/docs/j-std-020e (accessed on 12 May 2024).
  39. Çengel, Y.A.; Ghajar, A.J. Heat and Mass Transfer: Fundamentals & Applications; McGraw Hill Education: Singapore, 2015. [Google Scholar]
  40. Jorge, K.; Muneer, T.; Thomas, G. Heat Transfer: A Problem Solving Approach; CRC Press: London, UK, 2012. [Google Scholar]
  41. Li, Y.; Long, W.; Hu, X.; Fu, Y. Interfacial Reaction and IMC Growth of an Ultrasonically Soldered Cu/SAC305/Cu Structure during Isothermal Aging. Materials 2018, 11, 84. [Google Scholar] [CrossRef] [PubMed]
  42. Wu, Z.; Troparevsky, M.; Gao, Y.; Morris, J.; Stocks, G.; Bei, H. Phase stability, physical properties and strengthening mechanisms of concentrated solid solution alloys. Curr. Opin. Solid State Mater. Sci. 2017, 21, 267–284. [Google Scholar] [CrossRef]
  43. Belyakov, S.A.; Xian, J.; Zeng, G.; Sweatman, K.; Nishimura, T.; Akaiwa, T.; Gourlay, C.M. Precipitation and coarsening of bismuth plates in Sn–Ag–Cu–Bi and Sn–Cu–Ni–Bi solder joints. J. Mater. Sci. Mater. Electron. 2019, 30, 378–390. [Google Scholar] [CrossRef]
  44. Lungen, S.; Tiedje, T.; Meier, K.; Nieweglowski, K.; Bock, K. Reliability of 3D additive manufactured packages. In Proceedings of the 2018 7th Electronic System-Integration Technology Conference (ESTC), Dresden, Germany, 18–21 September 2018; pp. 1–5. [Google Scholar] [CrossRef]
  45. Zhang, Z.; Yuan, X. Applications and Future of Automated and Additive Manufacturing for Power Electronics Components and Converters. IEEE J. Emerg. Sel. Top. Power Electron. 2022, 10, 4509–4525. [Google Scholar] [CrossRef]
Figure 1. Stress–strain plots of as-cast SAC305 tested at 25, 90, and 145 °C for each strain rate of 0.1, 0.01, and 0.001/s.
Metals 14 00803 g001
Figure 2. Stress–strain plots of (a) as-cast SAC305, (b) aged SAC305 (90 days, 125 °C), (c) as-cast SAC305 + 1 wt.%Bi, (d) aged SAC305 + 1 wt.%Bi (90 days, 125 °C), (e) SAC305 + 2 wt.%Bi, (f) aged SAC305 + 2 wt.%Bi (90 days, 125 °C), (g) as-cast SAC305 + 3 wt.%Bi, (h) aged SAC305 + 3 wt.%Bi (90 days, 125 °C), (i) as-cast SAC405, (j) aged SAC405 (90 days, 125 °C), (k) as-cast SAC405 + 1 wt.%Bi, (l) aged SAC405 + 1 wt.%Bi (90 days, 125 °C), (m) as-cast SAC405 + 2 wt.%Bi, (n) aged SAC405 + 2 wt.%Bi (90 days, 125 °C), (o) as-cast SAC405 + 3 wt.%Bi, and (p) aged SAC405 + 3 wt.%Bi (90 days, 125 °C).
Metals 14 00803 g002aMetals 14 00803 g002bMetals 14 00803 g002c
Figure 3. (a) SEM backscattered electron micrograph of SAC305 aged for 90 days at 125 °C, (b) EDS Bi mapping of the region shown in (a), (c) EDS Ag mapping of the region shown in (a), (d) EDS Sn mapping of the region shown in (a), (e) SEM backscattered electron micrograph of a region in SAC305 aged for 90 days at 125 °C, and (f) EDS Ag mapping of region shown in (e).
Metals 14 00803 g003
Figure 4. SEM backscattered electron micrographs of (a) as-cast SAC305, (b) aged SAC305 (90 days, 125 °C), (c) as-cast SAC305 + 1 wt.%Bi, (d) aged SAC305 + 1 wt.%Bi (90 days, 125 °C), (e) as-cast SAC305 + 2 wt.%Bi, (f) aged SAC305 + 2 wt.%Bi (90 days, 125 °C), (g) as-cast SAC305 + 3 wt.%Bi, (h) aged SAC305 + 3 wt.%Bi (90 days, 125 °C), (i) as-cast SAC405, (j) aged SAC405 (90 days, 125 °C), (k) as-cast SAC405 + 1 wt.%Bi, (l) aged SAC405 + 1 wt.%Bi (90 days, 125 °C), (m) as-cast SAC405 + 2 wt.%Bi, (n) aged SAC405 + 2 wt.%Bi (90 days, 125 °C), (o) as-cast SAC405 + 3 wt.%Bi, and (p) aged SAC405 + 3 wt.%Bi (90 days, 125 °C).
Metals 14 00803 g004aMetals 14 00803 g004bMetals 14 00803 g004c
Figure 5. Schematic of glass tube mold with solder inside being quenched in water bath.
Metals 14 00803 g005
Figure 6. A plot of solder temperature with time during temperature ramp-down.
Metals 14 00803 g006
Table 1. Aging matrix.
Temp./Time0 Day (As-Cast)30 Days60 Days90 Days
25 °CXXXX
75 °CXXX
125 °CXXX
“X” as a check mark to indicate these are the conditions of the experiment.
Table 2. Testing matrix.
Temp./Strain Rate0.1/s0.01/s0.001/s
25 °CXXX
90 °CXXX
145 °CXXX
Table 3. Anand parameters of as-cast SAC305 calculated using each of the three overlapping curves.
SAC305Sample 1Sample 2Sample 3AverageSRSD
s032.8532.6932.7832.770.080.24
Q/R9068.009050.009046.009054.6711.720.13
A2995.102947.002965.302969.1324.280.82
ξ4.004.004.004.000.000.00
m0.290.290.280.290.012.01
h0183,010.00183,010.00182,980.00183,000.0017.320.01
s ^ 40.8040.2041.0040.670.421.02
n0.010.010.010.010.002.14
a1.751.751.741.750.010.33
Table 4. Anand parameters of SAC305 in all aging conditions.
SAC305As-Cast30 d, 25 °C30 d, 75 °C30 d, 125 °C60 d, 25 °C60 d, 75 °C60 d, 125 °C90 d, 25 °C90 d, 75 °C90 d, 125 °C
s032.7730.1127.3524.2224.8723.2119.7821.1218.1814.56
Q/R9055901790429030905090229028907290159030
A2969.13055.13274.53502.33287.43465.73847.33596.53943.64175.2
ξ4444444444
m0.290.280.250.240.210.200.180.160.150.12
h0183,000181,150180,000173,000163,100179,200145,100100,05080,00071,100
s ^ 40.739.338.937.633.532.128.226.423.421.3
n0.010.010.00850.00810.0070.00590.00480.00190.00140.0009
a1.751.761.791.821.831.871.911.921.941.97
Table 5. Anand parameters of SAC305 + 1 wt.%Bi in all aging conditions.
SAC305 + 1 wt.%BiAs-Cast30 d, 25 °C30 d, 75 °C30 d, 125 °C60 d, 25 °C60 d, 75 °C60 d, 125 °C90 d, 25 °C90 d, 75 °C90 d, 125 °C
s022.8122.7422.7022.6722.6322.4822.3222.2022.1022.0
Q/R9640964496579648965096499663964896549650
A3851.23864.13871.03873.73886.23896.43911.03942.53976.13997.8
ξ6666666666
m0.340.340.340.340.330.320.320.320.310.30
h0155,100154,450154,375154,360152,910152,050151,275148,750148,000147,760
s ^ 38.138.037.837.737.237.136.836.336.236.0
n0.00850.00850.00830.00830.00810.0080.0080.00750.00740.0073
a1.821.831.831.841.831.841.841.851.851.85
Table 6. Anand parameters of SAC305 + 2 wt.%Bi in all aging conditions.
SAC305 + 2 wt.%BiAs-Cast30 d, 25 °C30 d, 75 °C30 d, 125 °C60 d, 25 °C60 d, 75 °C60 d, 125 °C90 d, 25 °C90 d, 75 °C90 d, 125 °C
s027.3127.3327.6628.128.128.228.628.728.929.1
Q/R10,45010,45210,46310,46610,48110,48710,45710,45910,45510,450
A5021.65008.75010.54989.54985.14967.24957.54934.54928.54914.6
ξ6666666666
m0.380.410.420.440.450.470.470.480.490.5
h0110,000112,15011,325114,520114,750115,000116,400117,100117,900120,000
s ^ 32.532.732.833.233.333.533.734.034.435.0
n0.0070.0080.0080.0090.010.0110.0120.0130.0140.015
a1.881.871.861.851.861.851.831.821.811.80
Table 7. Anand parameters of SAC305 + 3 wt.%Bi in all aging conditions.
SAC305 + 3 wt.%BiAs-Cast30 d, 25 °C30 d, 75 °C30 d, 125 °C60 d, 25 °C60 d, 75 °C60 d, 125 °C90 d, 25 °C90 d, 75 °C90 d, 125 °C
s018.3318.5518.4518.7118.6218.8118.8818.9119.1019.15
Q/R11,52011,52011,52011,54811,56511,53811,54411,53011,54811,540
A6521.46515.26512.36507.26500.26498.36488.36475.66466.76450.1
ξ6666666666
m0.400.410.420.430.430.470.480.490.530.55
h075,00076,12576,87577,65478,45079,35080,10080,76081,52082,525
s ^ 33.833.833.933.834.434.634.835.135.435.6
n0.0050.0060.0060.0060.0070.0070.0080.0090.0090.01
a21.981.971.961.961.951.941.931.921.91
Table 8. Anand parameters of SAC405 in all aging conditions.
SAC405As-Cast30 d, 25 °C30 d, 75 °C30 d, 125 °C60 d, 25 °C60 d, 75 °C60 d, 125 °C90 d, 25 °C90 d, 75 °C90 d, 125 °C
s034.4330.2028.4025.6025.2023.5920.1521.2018.8515.33
Q/R9265925892779282925992609268927292669263
A2879.12990.53210.43455.53215.53392.43789.13522.53886.64110.5
ξ4444444444
m0.30.280.260.250.230.20.190.180.160.14
h0190,150188,100186,000175,100164,000182,000150,200110,00082,00076,000
s ^ 41.940.139.838.234.533.629.427.724.422.2
n0.0120.0110.00940.00850.00750.00660.00540.00280.00190.001
a1.721.751.781.811.821.861.891.901.931.96
Table 9. Anand parameters of SAC405 + 1 wt.%Bi in all aging conditions.
SAC405 + 1 wt.%BiAs-Cast30 d, 25 °C30 d, 75 °C30 d, 125 °C60 d, 25 °C60 d, 75 °C60 d, 125 °C90 d, 25 °C90 d, 75 °C90 d, 125 °C
s024.2124.1824.1524.1024.0523.9523.8323.7823.6223.50
Q/R9750974397589746974597549756974997429746
A3746.33753.73768.43780.13797.23823.53842.33868.43883.53915.1
ξ6666666666
m0.360.360.350.350.340.330.320.320.310.31
h0165,050164,250164,110163,250160,000158,550157,300155,000154,000153,400
s ^ 39.639.539.339.339.339.138.838.638.438.3
n0.00950.00940.00930.00920.0090.00880.00850.00830.0080.0079
a1.781.81.811.821.821.831.851.851.871.89
Table 10. Anand parameters of SAC405 + 2 wt.%Bi in all aging conditions.
SAC405 + 2 wt.%BiAs-Cast30 d, 25 °C30 d, 75 °C30 d, 125 °C60 d, 25 °C60 d, 75 °C60 d, 125 °C90 d, 25 °C90 d, 75 °C90 d, 125 °C
s027.3027.3027.6028.0028.2028.4028.6028.7028.9029.00
Q/R10,42510,45010,46010,46010,47110,48510,45210,45810,45410,442
A4885.54865.54854.54842.54832.54825.54815.54812.24810.54800.5
ξ6666666666
m0.40.430.450.470.490.500.520.520.540.55
h0120,000122,120122,650122,770127,470128,100128,850131,450132,450133,100
s ^ 32.532.933.333.634.234.635.135.736.036.2
n0.0090.00920.00940.00960.00980.0110.0130.0150.0170.018
a1.81.791.781.761.751.741.731.721.711.70
Table 11. Anand parameters of SAC405 + 3 wt.%Bi in all aging conditions.
SAC405 + 3 wt.%BiAs-Cast30 d, 25 °C30 d, 75 °C30 d, 125 °C60 d, 25 °C60 d, 75 °C60 d, 125 °C90 d, 25 °C90 d, 75 °C90 d, 125 °C
s020.1520.5520.6820.9821.1621.3321.6421.8521.9522.05
Q/R11,90011,90011,89611,89911,86511,93611,95411,99711,98511,968
A6150.26147.56140.56133.66135.66125.66115.36087.96064.56050.3
ξ6666666666
m0.420.430.440.460.470.480.50.520.540.56
h080,00080,54180,78080,99081,45081,65081,95083,50083,65483,840
s ^ 35.5435.6535.7535.836.136.3336.4536.773737.4
n0.0060.0070.0070.0070.0080.0080.0090.010.0110.012
a1.981.961.951.941.941.921.911.911.91.88
Disclaimer/Publisher’s Note: The statements, opinions and data contained in all publications are solely those of the individual author(s) and contributor(s) and not of MDPI and/or the editor(s). MDPI and/or the editor(s) disclaim responsibility for any injury to people or property resulting from any ideas, methods, instructions or products referred to in the content.